Article

Characterization of the Aroma Profile of Food Smoke at Controllable Pyrolysis Temperatures

1
Department of Flavor Chemistry, University of Hohenheim, Fruwirthstraße 12, 70599 Stuttgart, Germany
2
Department of Food Material Science, University of Hohenheim, Garbenstraße 25, 70599 Stuttgart, Germany
*
Author to whom correspondence should be addressed.
These authors contributed equally to this work.
Separations 2023, 10(3), 176; https://doi.org/10.3390/separations10030176
Submission received: 1 February 2023 / Revised: 27 February 2023 / Accepted: 2 March 2023 / Published: 6 March 2023
(This article belongs to the Special Issue Application of Chromatography in Analytical Chemistry)

Abstract

:
Smoking is used to give food its typical aroma and to obtain the desired techno-functional properties of the product. To gain a deeper knowledge of the whole process of food smoking, a controllable smoking process was developed, and the influence of wood pyrolysis temperature (150–900 °C) on the volatile compounds in the smoking chamber atmosphere was investigated. The aroma profile of smoke was decoded by headspace solid-phase microextraction-gas chromatography-mass spectrometry (HS-SPME-GC-MS). Subsequently, the correlations in the most important substance classes, as well as in individual target components, were investigated by the Pearson test. Phenols and lactones showed an increase over the entire applied temperature range (rT = 0.94 and rT = 0.90), whereas furans and carbonyls showed no strict temperature dependence (rT < 0.6). Investigations on single aroma compounds showed that not all compounds of one substance class showed the same behavior, e.g., guaiacol showed no significant increase over the applied pyrolysis temperature, whereas syringol and hydoxyacetone showed a plateau after 450 °C, and phenol and cyclotene increased linear over the applied temperature range. These findings will help to better understand the production of aroma-active compounds during smoke generation in order to meet consumers preferences.

Graphical Abstract

1. Introduction

Food smoking is a very popular process in food production. In Germany, for example, 60% of all meat products produced are treated with food smoke [1]. Triggered by current developments in consumers behavior and demands for food (healthy, natural, clean label), as well as current world developments, the meat industry is currently questioning the standardized smoking processes and is looking for alternative processes with a low energy input, as well as individual product development for unique products. Therefore, it is mandatory to better understand the single and overall substance–process–function relationship while smoking. Wood smoke, used in food processing, is produced from the thermal decomposition of wood, which consists of cellulose (50%), hemicellulose (25%) and lignin (25%) [2]. Smoke represents a complex multi-phase system consisting of a gas phase, called the vapor phase, and a dispersed particle phase with liquid or solid particle droplets [3,4,5]. It includes air, water vapor, carbon dioxide, carbon monoxide and nitrogen oxide, and over 400 volatile compounds have been identified in food smoke, containing phenols, carbonyls, acids, furans, esters, alcohols, lactones and other compounds [5,6]. Phenols, carbonyls and furans are the main substance classes contributing to flavor formation, with phenols being mainly responsible for the food smoke flavor [2]. Carbonyls have an important role in color and texture development [6,7]. Due to the antimicrobial and antioxidant properties of some smoke compounds, food smoke has a preservative effect. Many compounds, such as phenols, carbonyls and acetic acid, have antimicrobial activity on their own and act synergistically when they coexist, as is the case in smoke [8,9]. The phenols are formed from the thermal pyrolysis of lignin, while carbonyls, furans, acids and other volatile compounds originate from the thermal degradation of hemicellulose and cellulose [6,10,11,12,13]. The degradation of hemicellulose, cellulose and lignin each takes place in a specific temperature range and thus the degradation products are formed characteristically for applied pyrolysis temperatures [6,13,14,15]. Consequently, the applied pyrolysis temperature can influence the compounds of smoke and thus the techno-functional properties of the generated smoke. These techno-functional properties include the typical color, texture, shelf-life, smell and taste for the smoked products [6,7,16]. Despite the vast number of technologically important characteristics that are generated by smoking food, at present, the controlled generation of smoke is not possible, as the smoke in the smoldering smoke generators currently used in industry is generated under constant plant parameters without further process control [17]. Thus, only the parameters in the smoke chamber where the product is located can be adjusted, but not the smoke generation parameters. Therefore, a newly designed smoldering smoke generator is used, in which pyrolysis temperature, supply airflow during smoke generation and moisture content of the wood can be varied. With this newly designed smoke generator, it is possible to generate smoke in a targeted process and thus to achieve the product-specific techno-functional and sensory properties. Headspace solid-phase microextraction (HS-SPME) offers the possibility to perform a solvent-free, simple, fast, sensitive and reproducible extraction of volatile analytes [18,19,20,21]. HS-SPME was shown to be suitable in the analysis of phenols in food smoke [22]. Among the various coating materials of fibers available, DVB/CAR/PDMS shows a high extraction efficiency for substances with high retention indices in smoked food [23]. To discuss the possibilities of an adjustable smoking process to produce food smoke, the influence of the pyrolysis temperature, being one of the adjustable parameters, on the composition in volatile compounds of the smoking chamber atmosphere was investigated in the temperature range from 150 to 900 °C throughout the smoking process of Frankfurter sausages. The substance classes of carbonyls, furans, lactones and phenols, which all cause important techno-functional effects on food, were investigated by means of HS-SPME-GC-MS.

2. Materials and Methods

2.1. Materials and Chemicals

Butyrolactone (99%), cyclotene (98%), 2-(5H)-furanone (96%), guaiacol (98%), hydroxyacetone (95%) and syringol (99%) were purchased from Alfa Aesar (Karlsruhe, Germany). Eugenol (99%) and vanillin (99%) were purchased from Carl Roth (Karlsruhe, Germany). o-Cresol (99%), 4-ethyl-guaiacol (98%), p-cresol (99%) and γ-nonalactone were purchased from J&K Scientific GmbH (Pforzheim, Germany). Creosol (98%), furfural (99%), phenol (99%) and trans-isoeugenol (99%) were purchased from Sigma-Aldrich (Steinheim, Germany). Ethanol (100%) was purchased from VWR Chemicals (Darmstadt, Germany). 2-Methyl-2-cyclopentenone (97%) was purchased from Acros Organics (Geel, Belgium).

2.2. Production and Sampling of Food Smoke

This research was conducted as part of the pilot plant production of Frankfurter sausages. Smoking chamber atmosphere samples were taken from the smoking chamber while sausages were smoked to picture the full smoking process. Frankfurters (around 1750 g in median per batch, standard recipe (Table S1 in the Supplementary Materials)) were produced in a 1800 L pilot plant one trolley smokehouse type “Airmaster UK 1800” connected with a smoldering smoke generator “Maxxsmoker GH 505 H” (REICH Thermoprozesstechnik GmbH, Schechingen, Germany) located in the Meat Technology Pilot Plant of the Department of Food Material Science, University of Hohenheim. Sausages were prepared on the day before smoking and stored at 4 °C to guarantee the same core temperature before smoking. Sausages were heated in the smoking chamber to a surface temperature of 48 °C before smoking (Table S2). During smoking, the chamber temperature was between 45 and 55 °C. As the smoking agent, beech wood chips (Räuchergold KL 2-16, Rettenmeier & Söhne, Rosenberg, Germany) were used. The smoke generator can be divided into 3 zones. The upper one is the storage container for wood chips; the smoldering zone at the bottom creates the ember bed temperature by smoldering airflow. The transport air is fed into the middle zone of the smoke generator and transports the resulting smoke through the pipes left and right into the product chamber [24]. The pyrolysis temperature was changed by adjusting the air volume flow as the oxygen provided allows the pyrolysis temperature to be adjusted over a wide range [6]. The air volume flow was adapted by varying the parameters of the total air supply from outside through the electric fan, as well as the ratio of transport air to smoldering air and adjusting the airflow of both streams using dampers in the feed pipes. By adjusting these parameters, the pyrolysis temperature could be varied in the range of 150–900 °C. Representative temperature curves of the wood pyrolysis temperature in the smoke generator are shown in Figure S1. For a detailed description of all parameters, see Table S3. Representative samples from the smoking chamber atmosphere were taken directly from the product chamber via a pipe, 10 min after pyrolysis started in this study. Samples were filled from the pipe directly into gas-tight vials (20 mL) while purging the vials for 10 sec with smoke from the pipe, and then subsequently analyzed by HS-SPME-GC-MS. Samples of six different wood pyrolysis temperatures, 150 °C, 300 °C, 450 °C, 600 °C, 750 °C and 900 °C, were analyzed. Each time, three independent samples were taken from the smoking process (n = 3). Samples were stored at 4 °C for maximum 3 days prior to analysis.

2.3. Headspace Solid-Phase Microextraction of Food Smoke

For HS-SPME, a CAR/PDMS/DVB fiber (carboxen/polydimethylsiloxane/divinylbenzene, 30/50 µm, 1 cm fiber length) from Supelco (Steinheim, Germany) was used. The samples were agitated for 15 min (250 rpm) at 55 °C. This was followed by headspace extraction at 55 °C for 10 min. Subsequently, the analytes were desorbed (1 min) in the inlet with a 25:1 split at 250 °C using the MPS robotic multipurpose sampler (GERSTEL GmbH & Co KG, Mülheim a. d. Ruhr, Germany). After desorption, the fiber was cleaned at 250 °C for 10 min [25].

2.4. Gas Chromatography-Mass Spectrometry

Gas chromatography (GC) was carried out using an Agilent 8890 GC gas chromatograph connected to a 5977B mass spectrometry detector (Agilent Technologies, Waldbronn, Germany). A J&W polar DB-WAX column (30 m × 0.25 mm ID × 0.25 μm film thickness) (Agilent Technologies, Waldbronn, Germany) was installed. Helium (Westfalen, Münster, Germany) served as carrier gas with a constant flow rate of 1.2 mL/min. The GC oven temperature was held at 40 °C (3 min) and then ramped at 5 °C/min to 220 °C (10 min). The following parameters were applied for analysis: MS mode, scan; scan range, m/z 33–350; electron ionization energy, 70 eV; source temperature, 230 °C; quadrupole temperature, 150 °C. The data were collected using the software Agilent Mass Hunter B07.06 combined with the control software Gerstel Maestro [25].

2.5. Compound Identification

The 18 target compounds were identified by their retention indices (RI) on polar column and the mass spectra (MS) were compared with those of authentic standards and data published in PubChem 2021 and the MS database (NIST17) [25]. RI values were analyzed using retention times of n-alkane standards (C7-C40, 1000 µL each, Sigma-Aldrich, Steinheim, Germany).

2.6. Data Evaluation and Determination of Relative Peak Areas

First, the individual peak areas of each target aroma compound were determined. The 18 different target compounds were classified into the four substance classes carbonyls, furans, lactones and phenols. The largest group consists of phenols: guaiacol, creosol, phenol, o-cresol, 4-ethyl-guaiacol, p-cresol, eugenol, syringol, trans-isoeugenol and vanillin were included. For the carbonyl group, diacetyl, hydroxyacetone, 2-methyl-2-cyclopenten-1-one and cyclotene were investigated. In the group of lactones, butyrolactone and 2-(5H)-furanone were investigated. The group of furans includes furfural and 5-methylfurfural. The absolute peak areas for each substance class were determined. In addition, the proportion of the peak area of each substance class in the total peak area, the sum of the peak areas of all 18 target substances, was determined. All absolute peak areas of individual substances were also examined, as well as the percentage distribution within their substance class.

2.7. Statistical Analysis

The statistical analysis was performed in SPSS statistical software (IBM, Armonk, NY, USA). Differences in absolute and relative peak areas between different pyrolysis temperatures were analyzed per substance class or individual substances to examine the effect of different pyrolysis temperatures on the food smoke profile. To test statistical assumptions of normality and homoscedasticity, Shapiro–Wilk and Levene’s tests were applied. A one-way ANOVA (pyrolysis temperature as a factor variable) was conducted and when F-values were statistically significant (p < 0.05), the Tukey method as a post hoc test was applied to determine differences between temperatures. If the data did not meet the assumption of homoscedasticity, Welch’s ANOVA and Games–Howell post hoc tests were used. A significance level of α = 0.05 was applied for all statistical analysis. Significant differences (p < 0.05) were labeled with different letters [26]. Pearson’s correlation test was applied to conduct a linear correlation analysis between two variables. The power of the correlation was assessed by the correlation coefficient r and the significance was assessed by the p-value. The correlation matrix was created with Python 3.7.6 using Matplotlib [27], NumPy [28], Pandas [29] and Seaborn [30] packages.

3. Results and Discussion

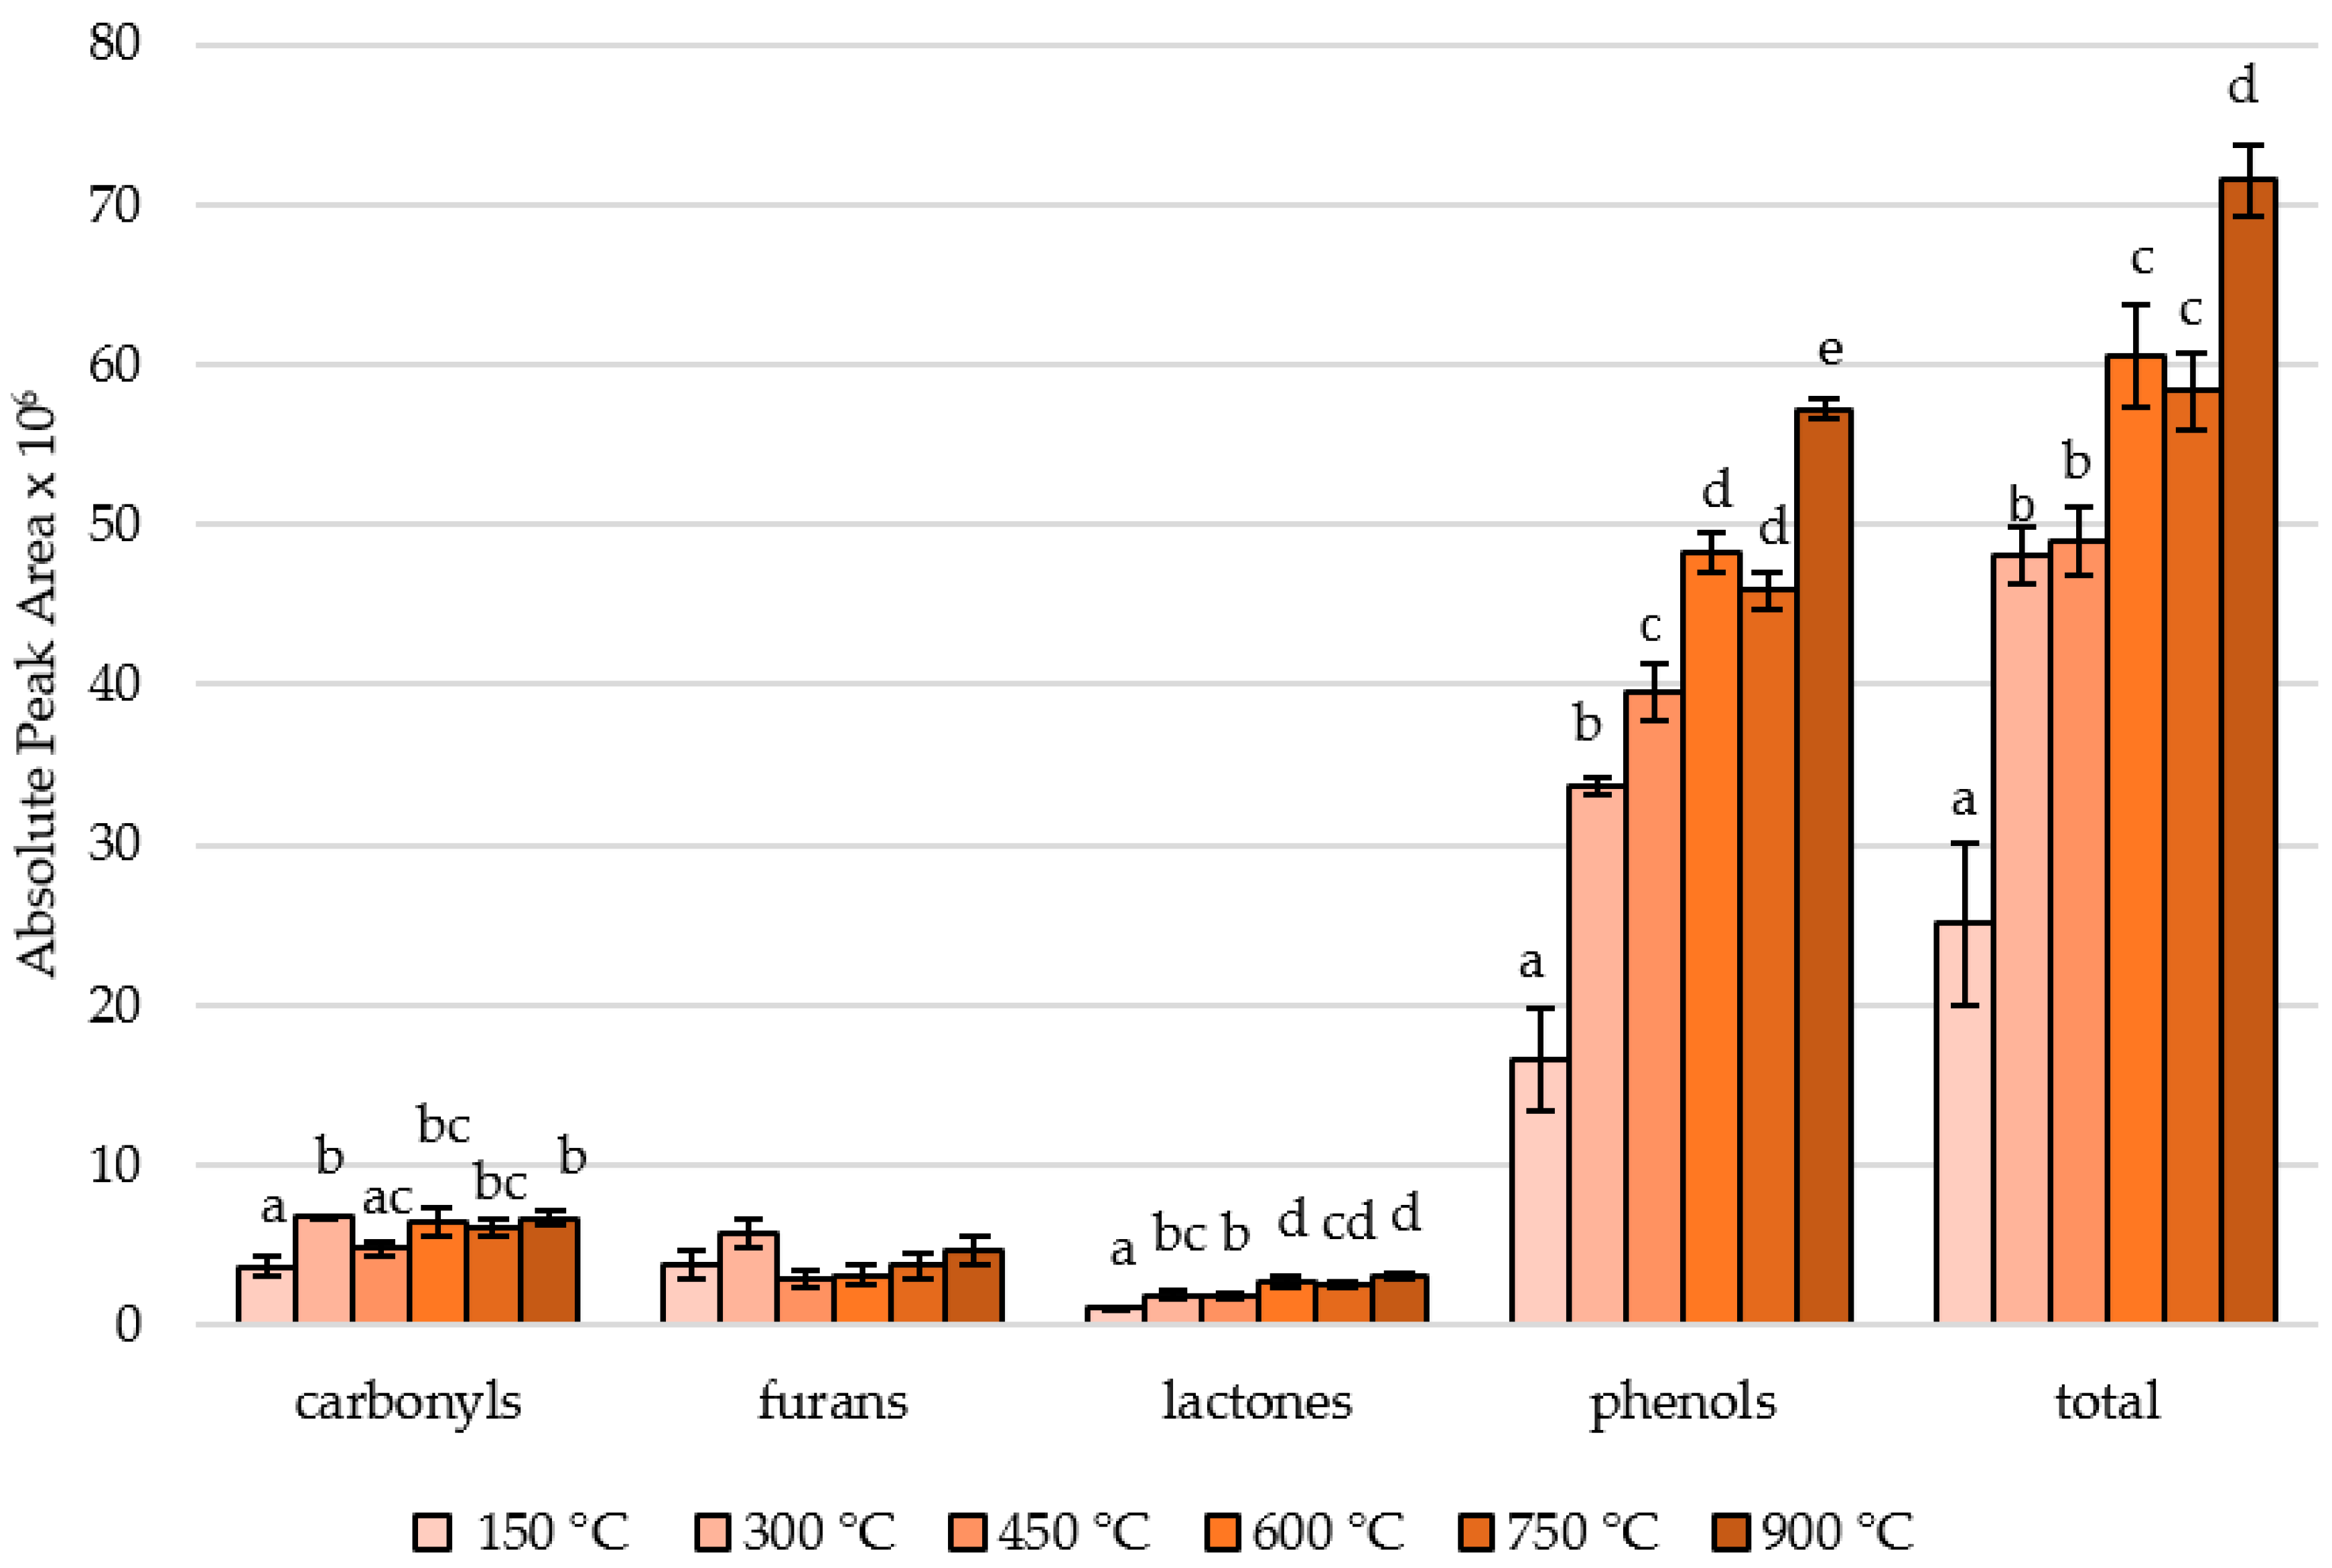
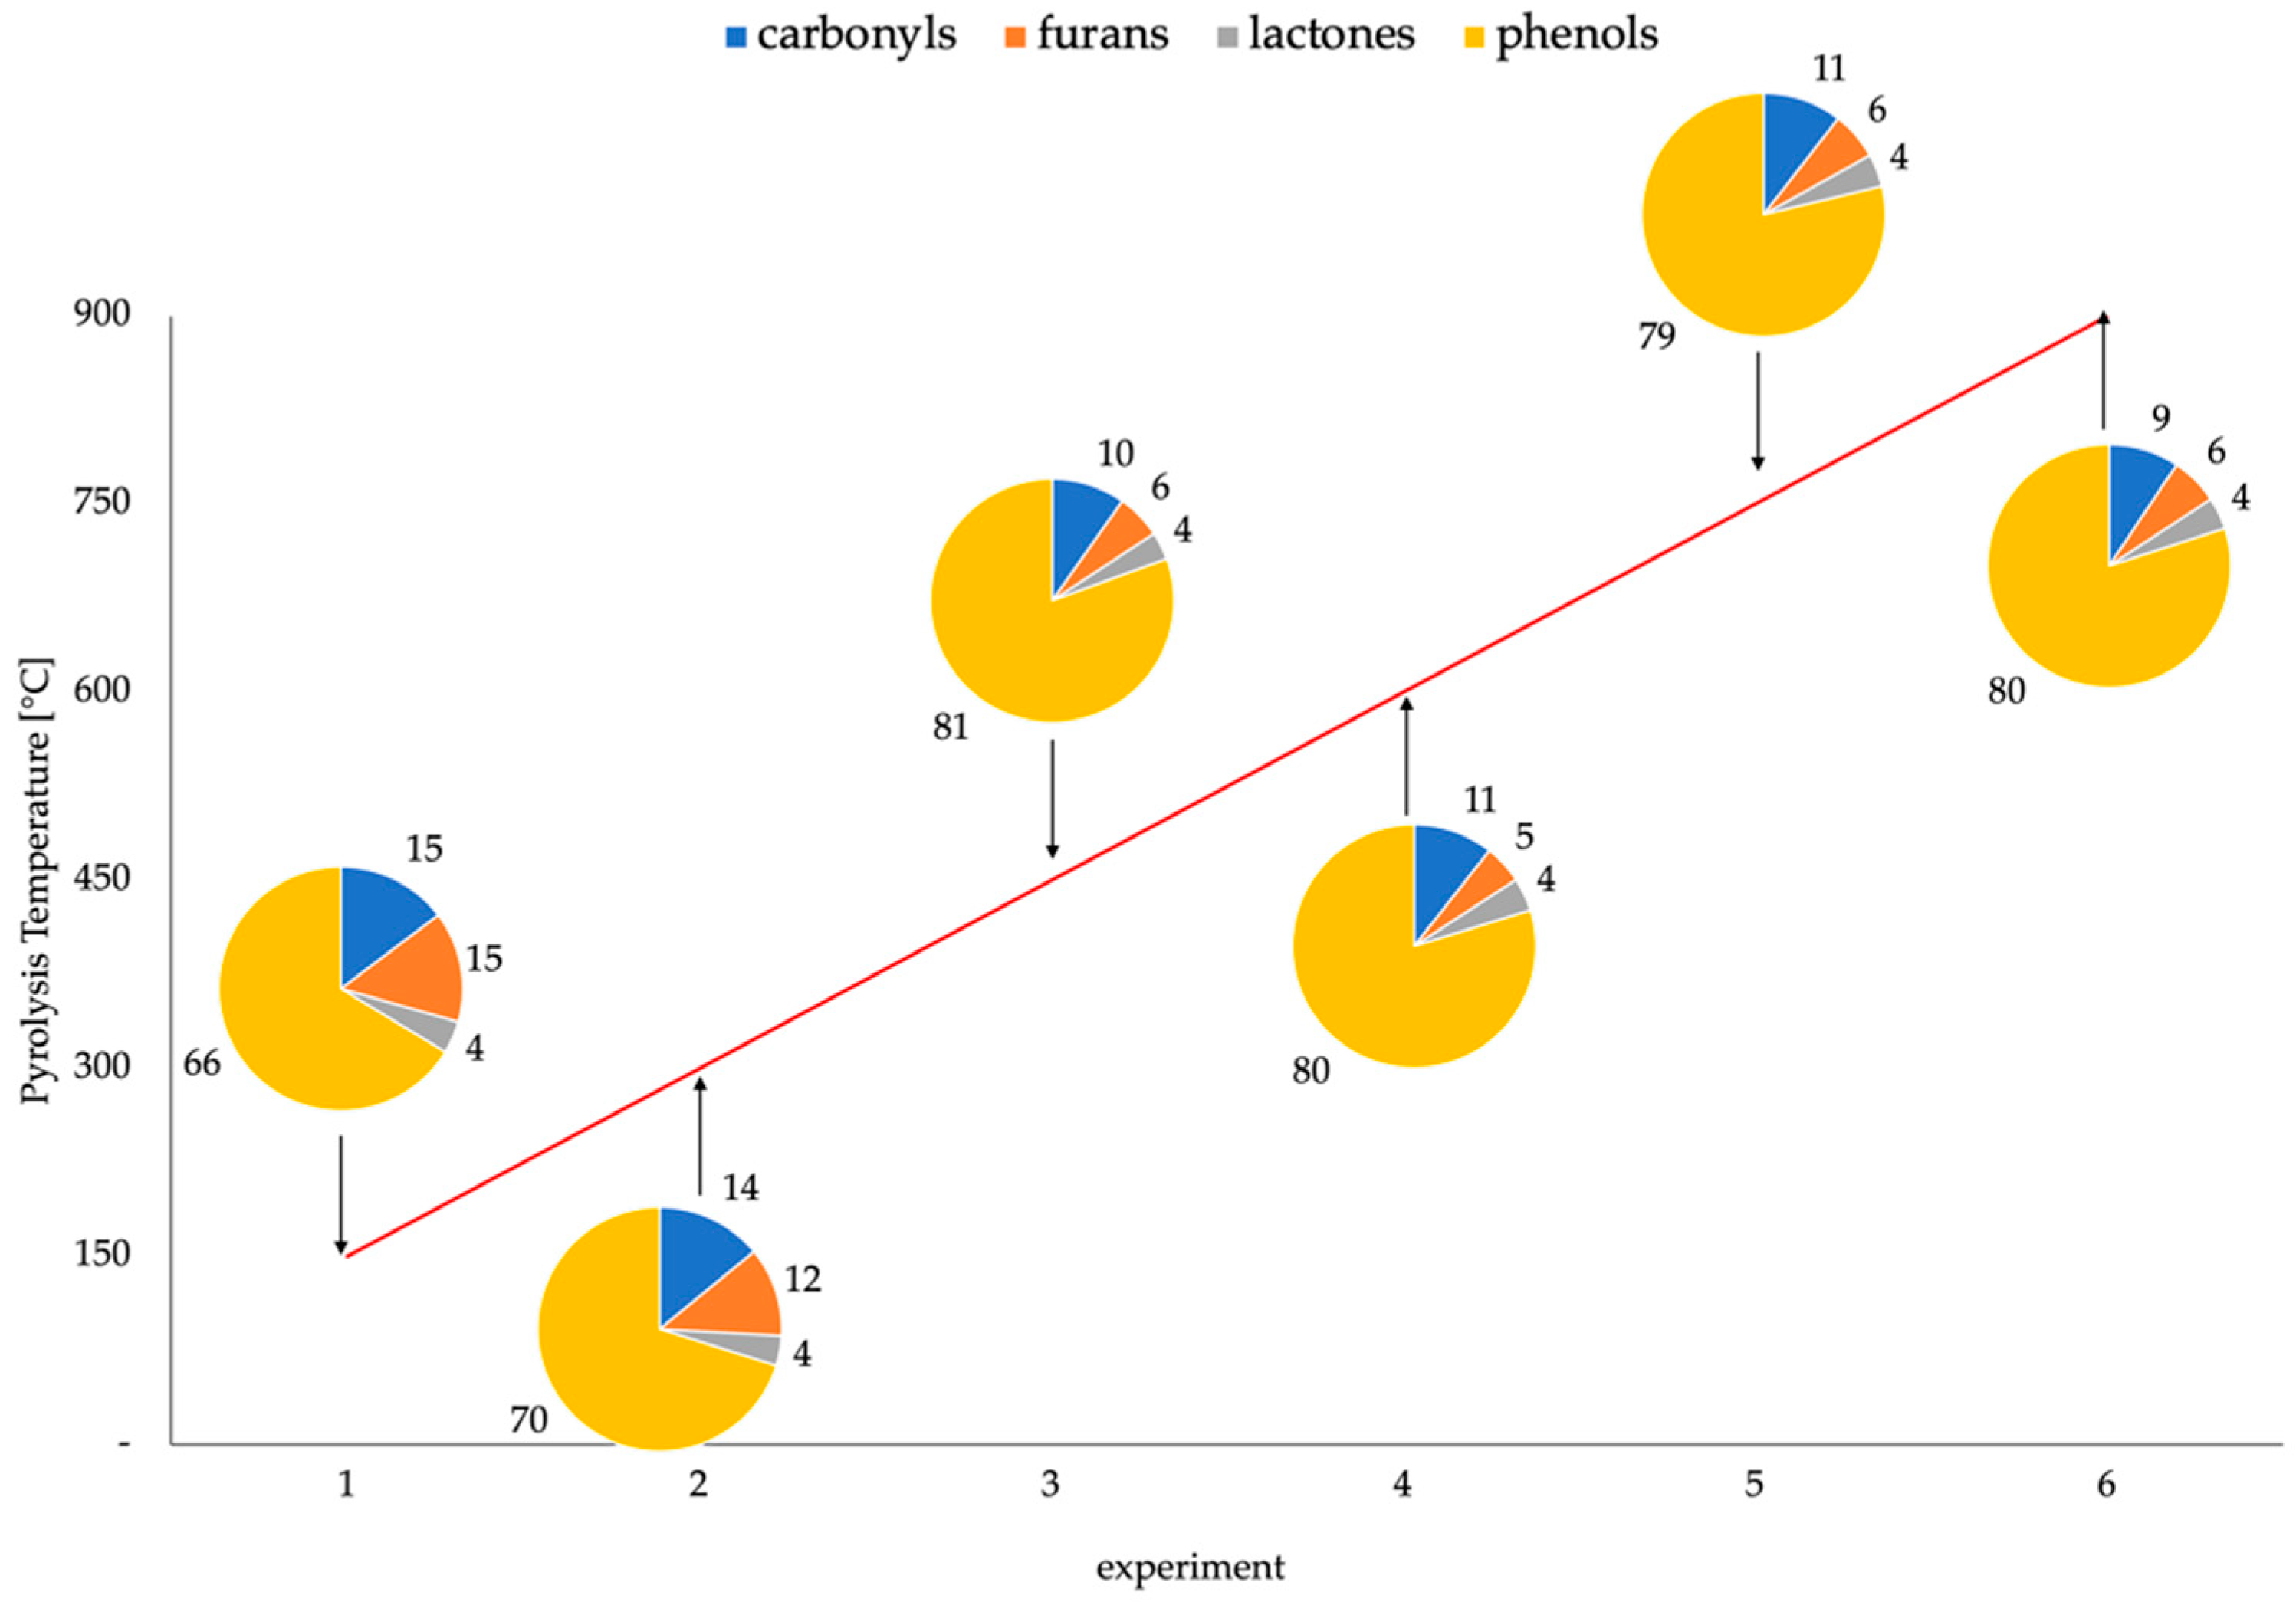
3.1. Effect of Controlled Pyrolysis Temperature on the Areas and Ratios of Different Substance Classes in Smoke

Eighteen characteristic target compounds (Table 1) were selected based on pre-results and literature [6,13,14,15]. While some of the compounds can definitely be derived from wood pyrolysis, e.g., phenols, some other compounds might also be derived from the sausage material as well. Lactones as degradation products of fats and furanones as products from the Maillard reaction are described in non-smoked but heated meat products [1]. However, they are also reported as characteristic smoke constituents and are expected to play important a role in the complex overall flavor of smoke and were therefore included from this research [6]. Nevertheless, it should be mentioned that the sausages produced while smoking might have influenced the aroma composition of the smoke at some point due to the outgassing of specific compounds from the sausage matrix into the smoking chamber. Therefore, subsequent research regarding this phenomenon should be undertaken.
The substance classes carbonyls, lactones and furans are formed by the degradation of hemicellulose and cellulose, which takes place at 200–260 °C and 280–320 °C, respectively [6,13,14,15]. An increase in carbonyl areas with increasing pyrolysis temperature was reported in observations up to 400 °C [6,31]. This temperature dependence in the formation of carbonyls, where the substances diacetyl, cyclotene, hydroxyacetone and 2-methyl-2-cyclopent-1-one were included, was shown (Figure 1). A sharp increase in peak area was found during pyrolysis at 150 °C and 300 °C, but at further elevated temperatures, there were no longer significant differences in peak area between successive temperature steps. The reaction of carbonyls contained in the smoke with proteins leads to the formation of brown dyes. This non-enzymatic carbonyl-amine reaction is an important process in the formation of the characteristic smoke color [6,7]. Furthermore, the resulting carbonyls contribute to the flavor. Diacetyl, hydroxyacetone and cyclotene contribute to the caramel-like and sweet smell [32]. Cyclopentanones are attributed a grassy, sweetish and bitter odor [2]. Although phenols are the main constituents of the typical smoky aroma [6], the phenolic fraction alone forms only a monotonous aroma [33]. A round odor profile is created by the additional presence of carbonyls, establishing caramel-like, maggi-like and sweetish odor sensations and therefore providing a fragrant and palatable flavor profile [33,34]. The substance class of lactones also showed a significant increase in peak area within the whole temperature range (Figure 1). The two lactones studied exhibit fatty and oily odor characteristics [32]. No temperature dependence was found for the substance class of furans. The pyrolysis reactions of hemicellulose and cellulose occurring at 275 °C and above were evident in the carbonyls and lactones, both of which increased when the temperature was raised from 150 °C to 300 °C. Contrary to expectations, this could not be shown for furans, which are formed during the dehydrogenation of monomeric structures released from hemicelluloses and celluloses during thermal degradation [35]. As part of the primary pyrolysis from cellulose and cellobiose, furans are formed already at low temperatures and are not expected to have higher transformation rates with increased temperatures [36]. Furfural and its homologs may also play an important role in the development of food smoke flavor and their odor is described as sweetish and caramel-like [2,32]. Phenols are released during thermal degradation of lignin, which shows its peak at about 350 °C [6,12,13,14,15]. Consequently, we expected an increased phenol content in our studies from the pyrolysis temperature of 450 °C. In our study the substance class phenols showed a very strong increase in peak area with increasing pyrolysis temperature over the entire temperature range (150–900 °C) observed (Figure 1). The peak area at a pyrolysis temperature of 900 °C was significantly higher than at 600 °C and 750 °C. No significant difference between 600 °C and 750 °C might be attributed to fluctuations in the smoking process. However, an increase trend could be obtained from the results of previous studies; a temperature dependence in phenol production in smoke can be deduced. The results of certain research show a proportional increase in phenol content in smoke when the temperature is increased up to 400 °C and 600 °C, respectively [31,37]. Investigations at a higher pyrolysis temperature range (400–1050 °C) reinforced this increase in phenol area in the lower temperature range and showed a peak at 600–700 °C [16]. The phenols form the most important group of substances regarding the formation of the typical smoke aroma, and primarily exhibit smoky, woody and spicy odor notes [6]. The substances guaiacol, p-cresol, syringol, isoeugenol, o-cresol and eugenol, which were also investigated here, were shown to be suitable marker substances for food smoke [38].
To obtain a clearer understanding of the dynamic change on the overall substance class, the relative distributions of the four substance classes were compared over the applied temperature range. It could clearly be shown that the phenols consistently had the largest proportion of the relative distribution, since this group also contains the highest number of compounds investigated. Nevertheless, the share of phenols in the total peak area increased significantly from about 70% to 80% when the pyrolysis temperature increased from 300–450 °C (Figure 2). At the same time, there was a significant decrease in the proportion of carbonyls from 14% to 10% and of furans from 11% to 6%. No change in the proportion of the total peak area observed for the lactones (4%) was found between the different pyrolysis temperatures. The relative peak areas of each substance class per applied pyrolysis temperature are shown in Figure 2 and a detailed overview is given in the Supplementary Materials Table S4.

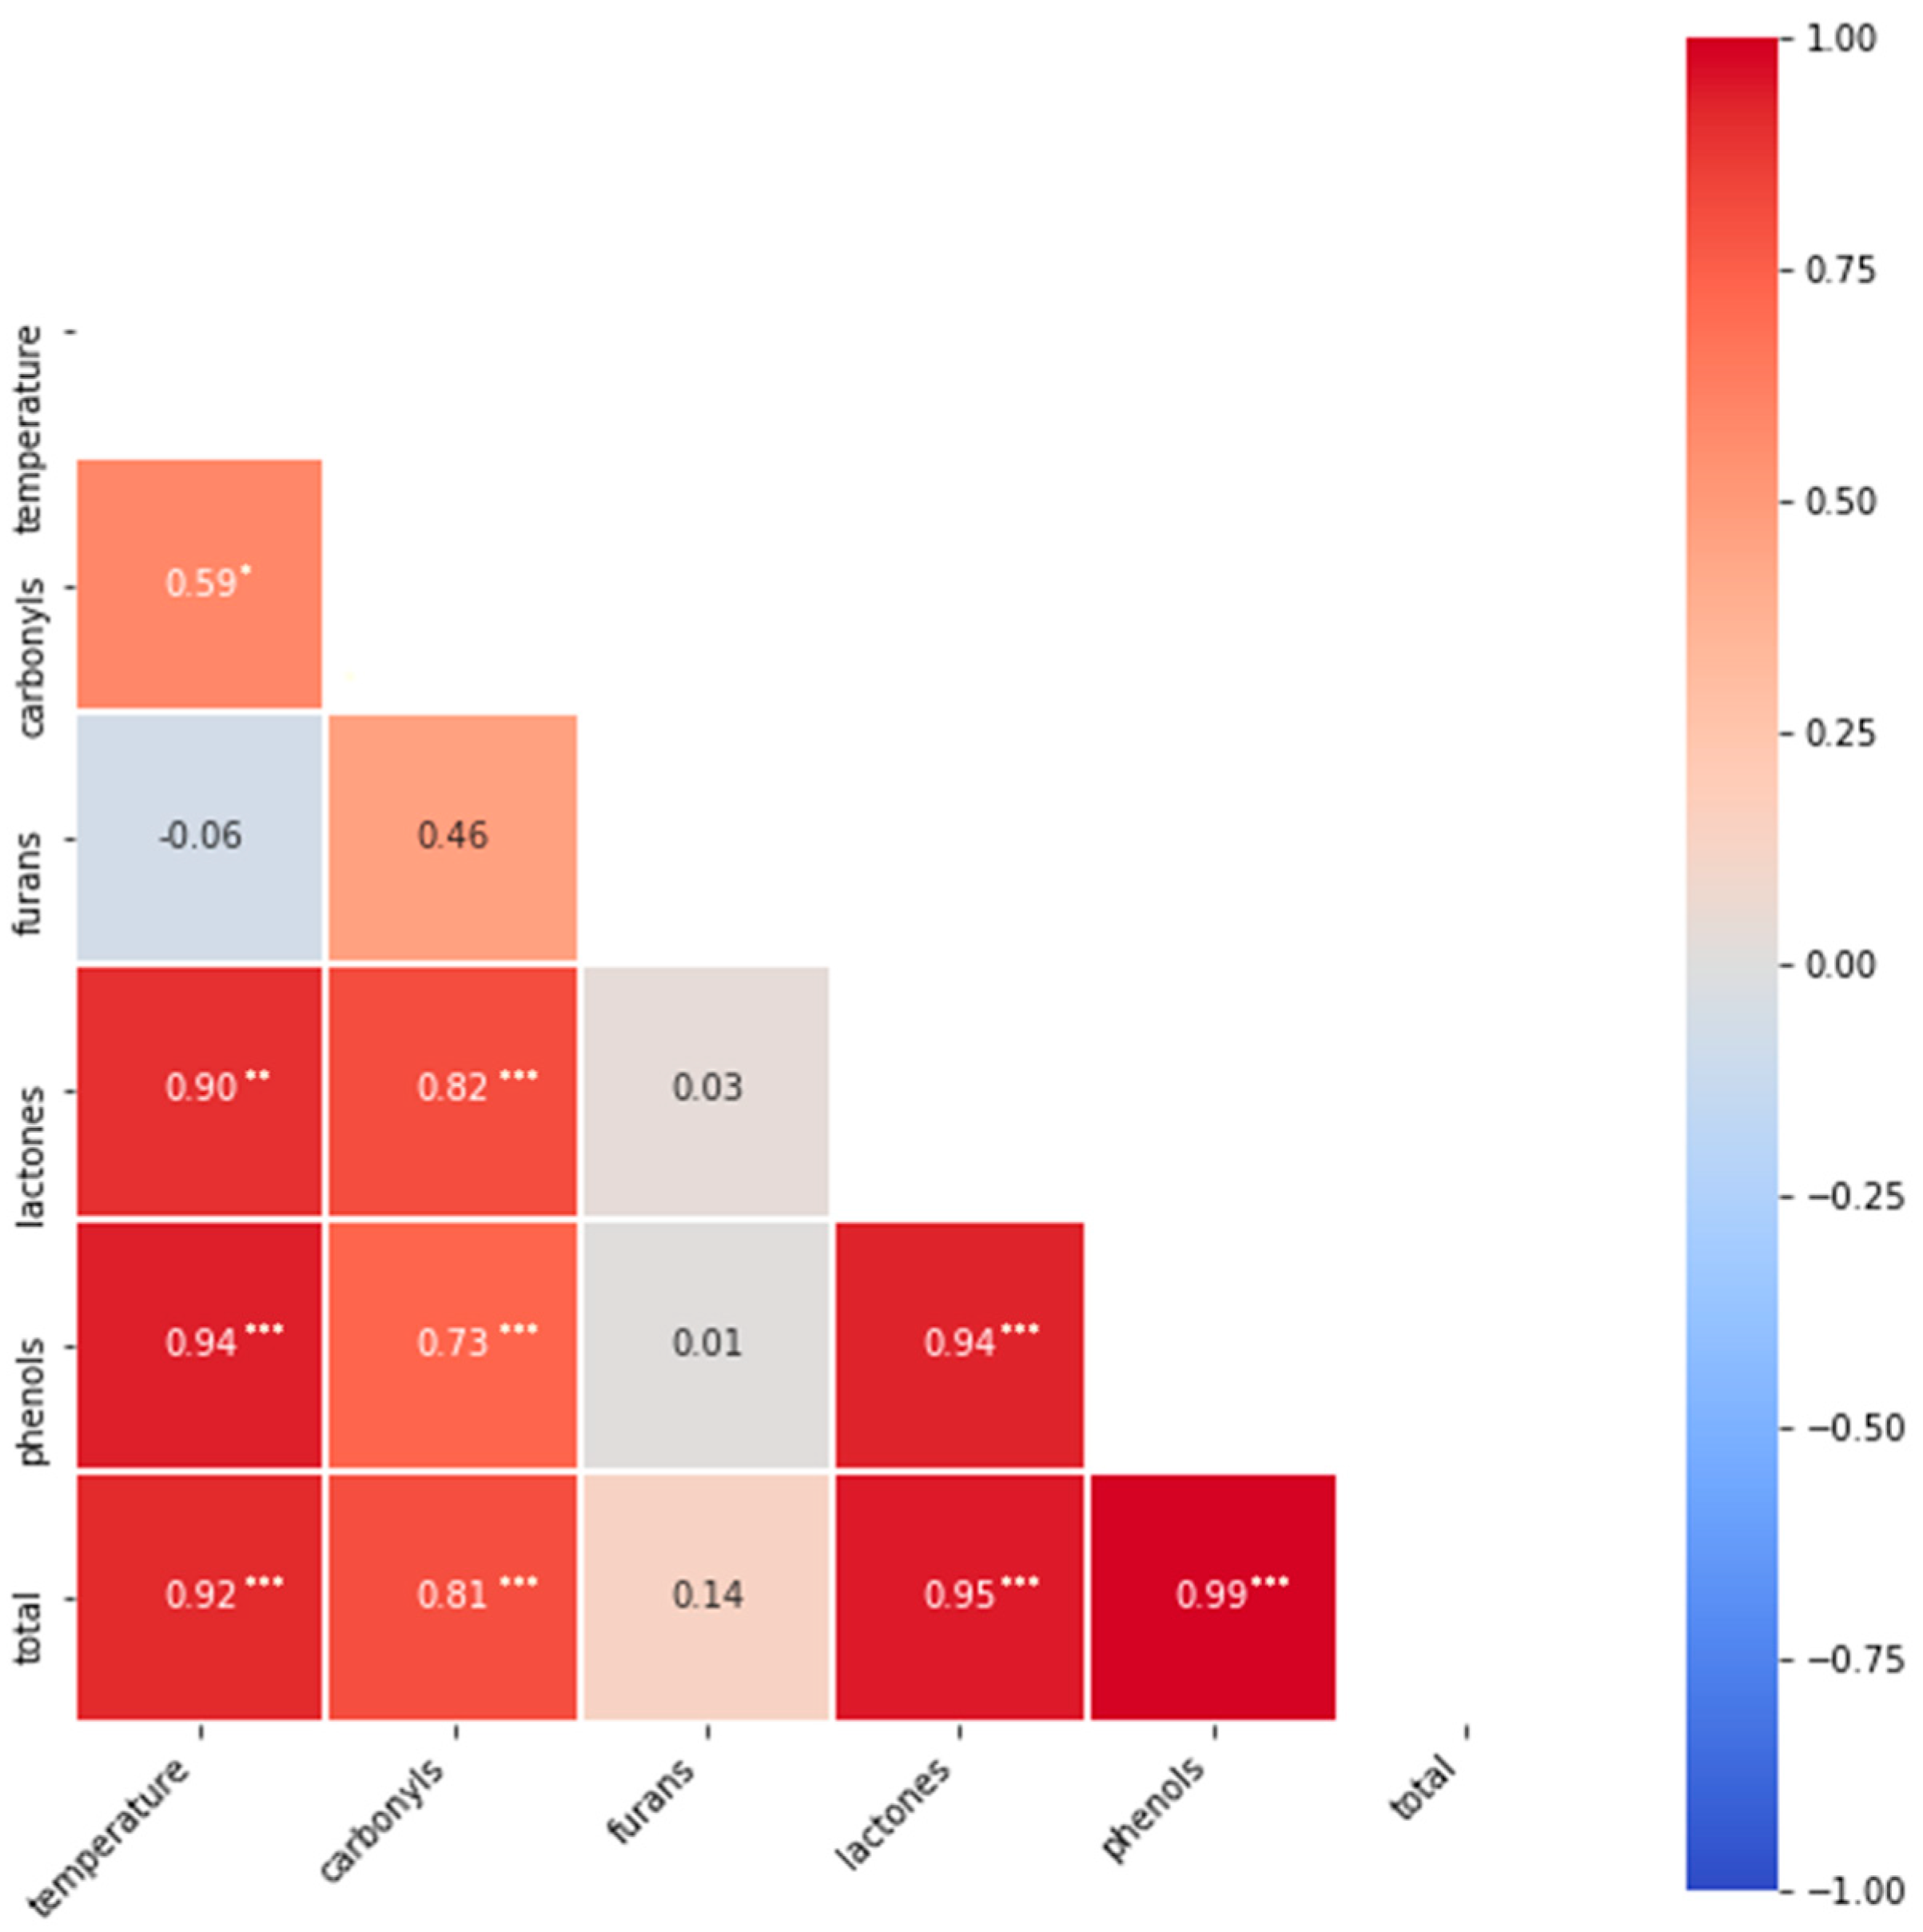
3.2. Correlations of Different Substance Classes with the Pyrolysis Temperature

In the next step, correlation analysis was performed after the Pearson test. To the best of our knowledge, there are no comparable studies in food smoke available so far. The results confirmed the observations of the previously performed one-way ANOVA with temperature as a factor variable. The peak areas of the substance classes lactones and phenols and the sum of all target aroma compounds increased significantly with increasing temperature, as indicated by a highly significant, positive linear Pearson correlation (rT-lactones = 0.90, rT-phenols = 0.94, rT-total = 0.92; p < 0.01 for all) (Figure 3). The substance class of carbonyls showed a medium positive, linear Pearson correlation with increasing temperature (rT-carbonyls = 0.59, p = 0.05). Only for the substance class of furans, no linear relationship with temperature was found. Observing the correlation of the individual substance classes with each other, a highly significant, positive linear correlation is found between all substance classes, apart from furans. These showed no linear correlation with any other substance class.
Knowing these temperature dependencies is helpful in developing products with desired flavors. Higher pyrolysis temperatures should be used for products with stronger smoky and spicy notes coming from increased phenol levels. Products with a strong smoky note should therefore be smoked at higher temperatures to obtain the desired smoky and spicy notes form the phenols. For samples in which an additional sweetish or even buttery/oily flavor note is present, it is better that they are smoked at lower temperatures to use the higher relative shares from lactones and carbonyl. However, the effect of the smoke on the aroma of the final product still needs to be evaluated.

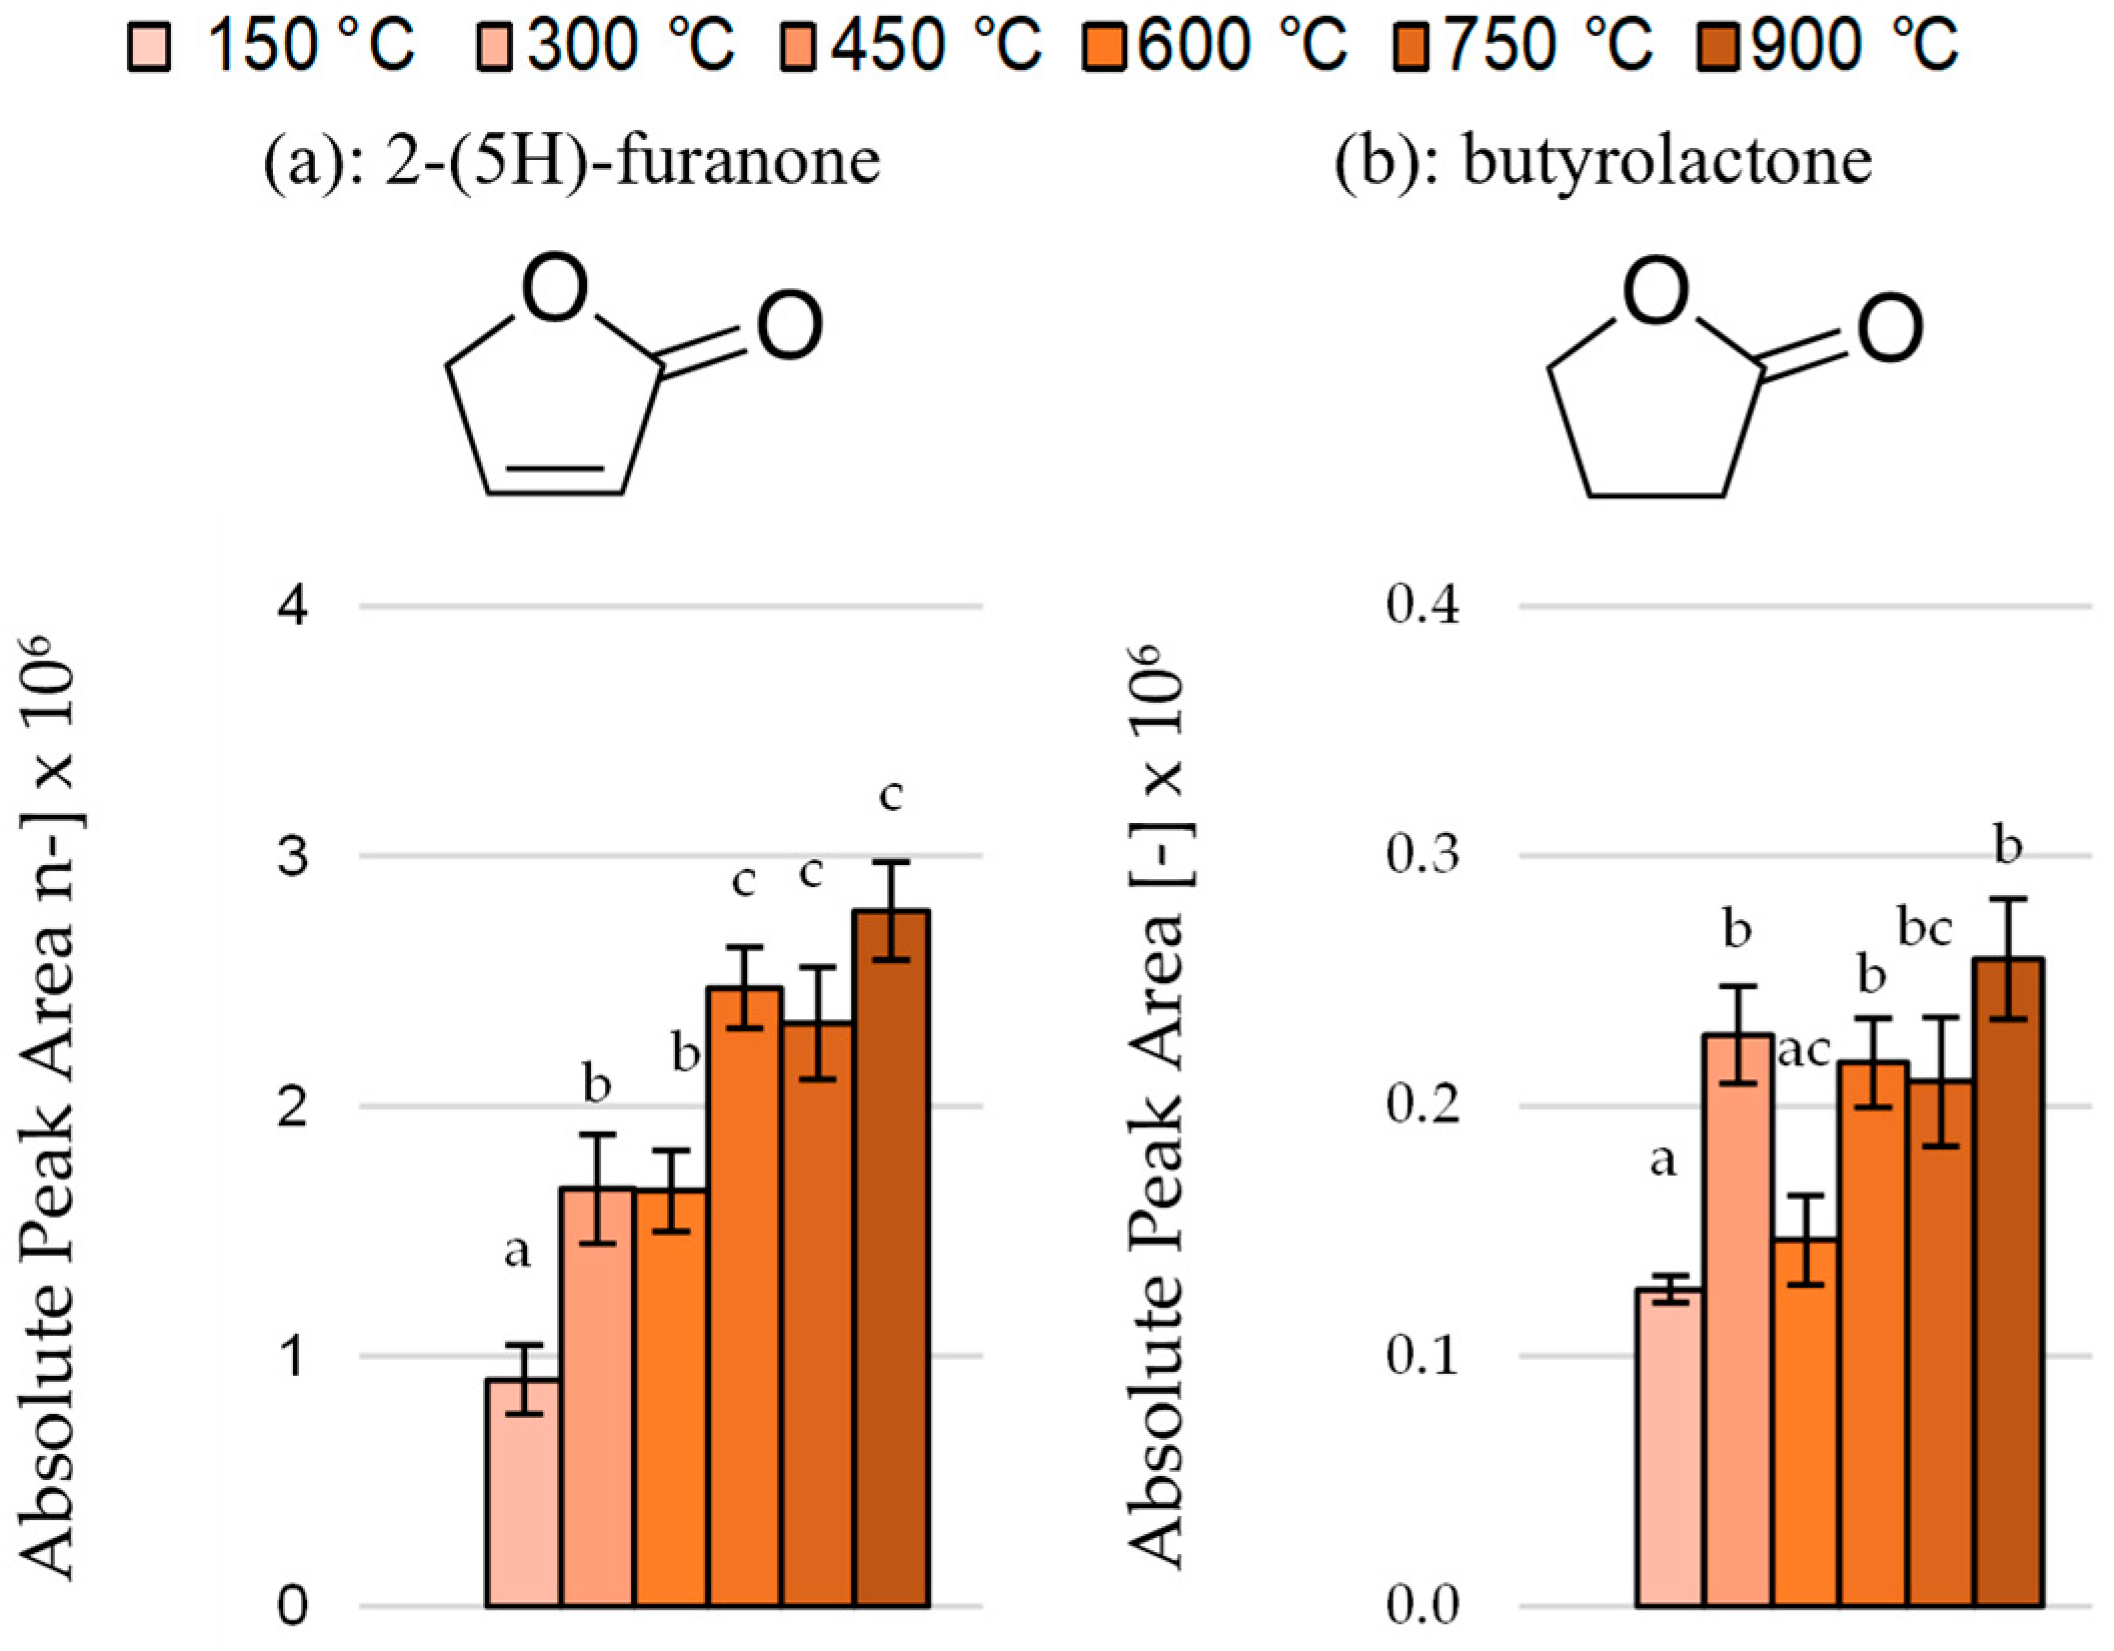
3.3. Effect of Pyrolysis Temperature on the Area and Ratios of Individual Phenols and Lactones

Phenols and lactones both showed a highly significant strong positive correlation with pyrolysis temperature.
Phenols, mainly the 4-substituted guaiacol and syringol derivatives, are formed in the primary reaction step of lignin pyrolysis at 350 °C. The side chains are mainly unsaturated alkyl chains. From 400–450 °C, secondary pyrolysis reactions take place, during which secondary products, such as catechols, pyrogallols, cresols, xylenols and phenols, are formed. In addition, the unsaturated side chains are increasingly transformed into saturated side chains. Above 550 °C, the catechols and pyrogallols degrade, whereas phenols and cresols are stable, even at higher temperatures. The formation of the unsubstituted phenols guaiacol, syringol and phenol can thus be hypothesized to start at 450 °C [13]. Tóth [16] determined the absolute area of these three substances with a step-wise increase in the pyrolysis temperature of beech wood and showed a peak in the area at 650 °C for all three compounds, as well as for the total phenol content. In our investigations, based on the evaluation of absolute peak areas, this temperature dependence could not be shown. For guaiacol, no difference was observed between any of the temperatures (Figure 4a), while syringol showed an increase at 450 °C, but no further changes at higher temperatures (Figure 4b). Phenol showed a fluctuating trend over an applied temperature up to 750 °C. It should be mentioned that the peak area between 450 °C and 600 °C increased significantly and the peak area at 900 °C is significantly higher compared to all other applied temperatures (Figure 4c). 4-Ethyl-guaiacol, p-cresol, o-cresol, eugenol and trans-isoeugenol showed a clear increase in peak area with increasing pyrolysis temperature, with the peak area at 900 °C being significantly higher than at all other temperatures. Cresol showed the same trend; however, there was no significant increase at 900 °C (Figure 4d–h,j). Thus, although the formation as secondary products are reflected for creosol, 4-ethyl-guaiacol, p-cresol and o-cresol, a significant increase is also seen above 450 °C. Vanillin showed fluctuating changes during the increase in temperature with significant differences between 450 °C and 900 °C (Figure 4i). From this, above all, a temperature stability of the mentioned substances can be deduced; however, smoking is also a very dynamic process and therefore a small fluctuation in the process itself will have an influence on the outcome. Syringol, trans-isoeugenol, creosol and guaiacol showed the largest contribution to total phenolics over all temperatures. Syringol is the main component of beech wood smoke and builds the major phenols together with guaiacol and creosol [16,39]. Furthermore, examination of the percentage of each phenol in the total area of phenols over the temperature increase showed no linear temperature dependence for most substances. Except for trans-isoeugenol, the relative proportion increased from 12% to 18% when the temperature was changed from 150 °C to 300 °C. The relative peak areas of each individual phenol per applied pyrolysis temperature are given in Table 2. Pöhlmann et al. [40] investigated the relative composition of the five phenols, guaiacol, creosol, syringol, eugenol and trans-isoeugenol, in Frankfurter-type sausages as a function of the smoke production temperature in the range of 350–750 °C, controlled by the moisture content of the wood used. Syringol and trans-isoeugenol also had a high proportion, but trans-isoeugenol had the highest one, contrary to our findings. Trans-isoeugenol showed a relative decrease during the temperature increase, while syringol increased. Looking at the same temperature range, these findings do not coincide with ours. However, pure smoke and smoked products are only comparable to a limited extent, since various factors influence the absorption of food smoke compounds into the product matrix, such as the moisture of the surface, the casing and the nature of the product matrix [5,41,42].
Lactones, such as carbonyls and furans, are also associated with hemicellulose and cellulose degradation, which take place from 200 to 260 °C and from 280 to 320 °C, respectively [6,13,14,15].
During the pyrolysis of hemicellulose, the glycosidic bonds and C–C bonds in the pyranose ring are dissolved first, releasing subunits. These are dehydrogenated at a temperature of 275–290 °C, resulting in the formation of furfural. These dehydration processes also produce compounds with keto groups and y-lactones, such as the 2-(5H)-furanone and butyrolactone studied here [12]. 2-(5H)-Furanone increased significantly during the increase in temperature (Table 3). These increases occurred in steps when the pyrolysis temperature was raised from 150 °C to 300 °C, and another increase occurred when the pyrolysis temperature was raised from 600 °C to 750 °C (Figure 5a). Butyrolactone is significantly higher at pyrolysis temperatures of 300 °C, 600 °C and 900 °C compared to temperatures of 150 °C and 450 °C (Figure 4b). A linear increase with increasing pyrolysis temperature cannot be deduced. Considering the relative peak areas to analyze the ratio of 2-(5H)-furanone and butyrolactone to each other of both lactones, only the temperatures 300 °C and 150 °C differed significantly.

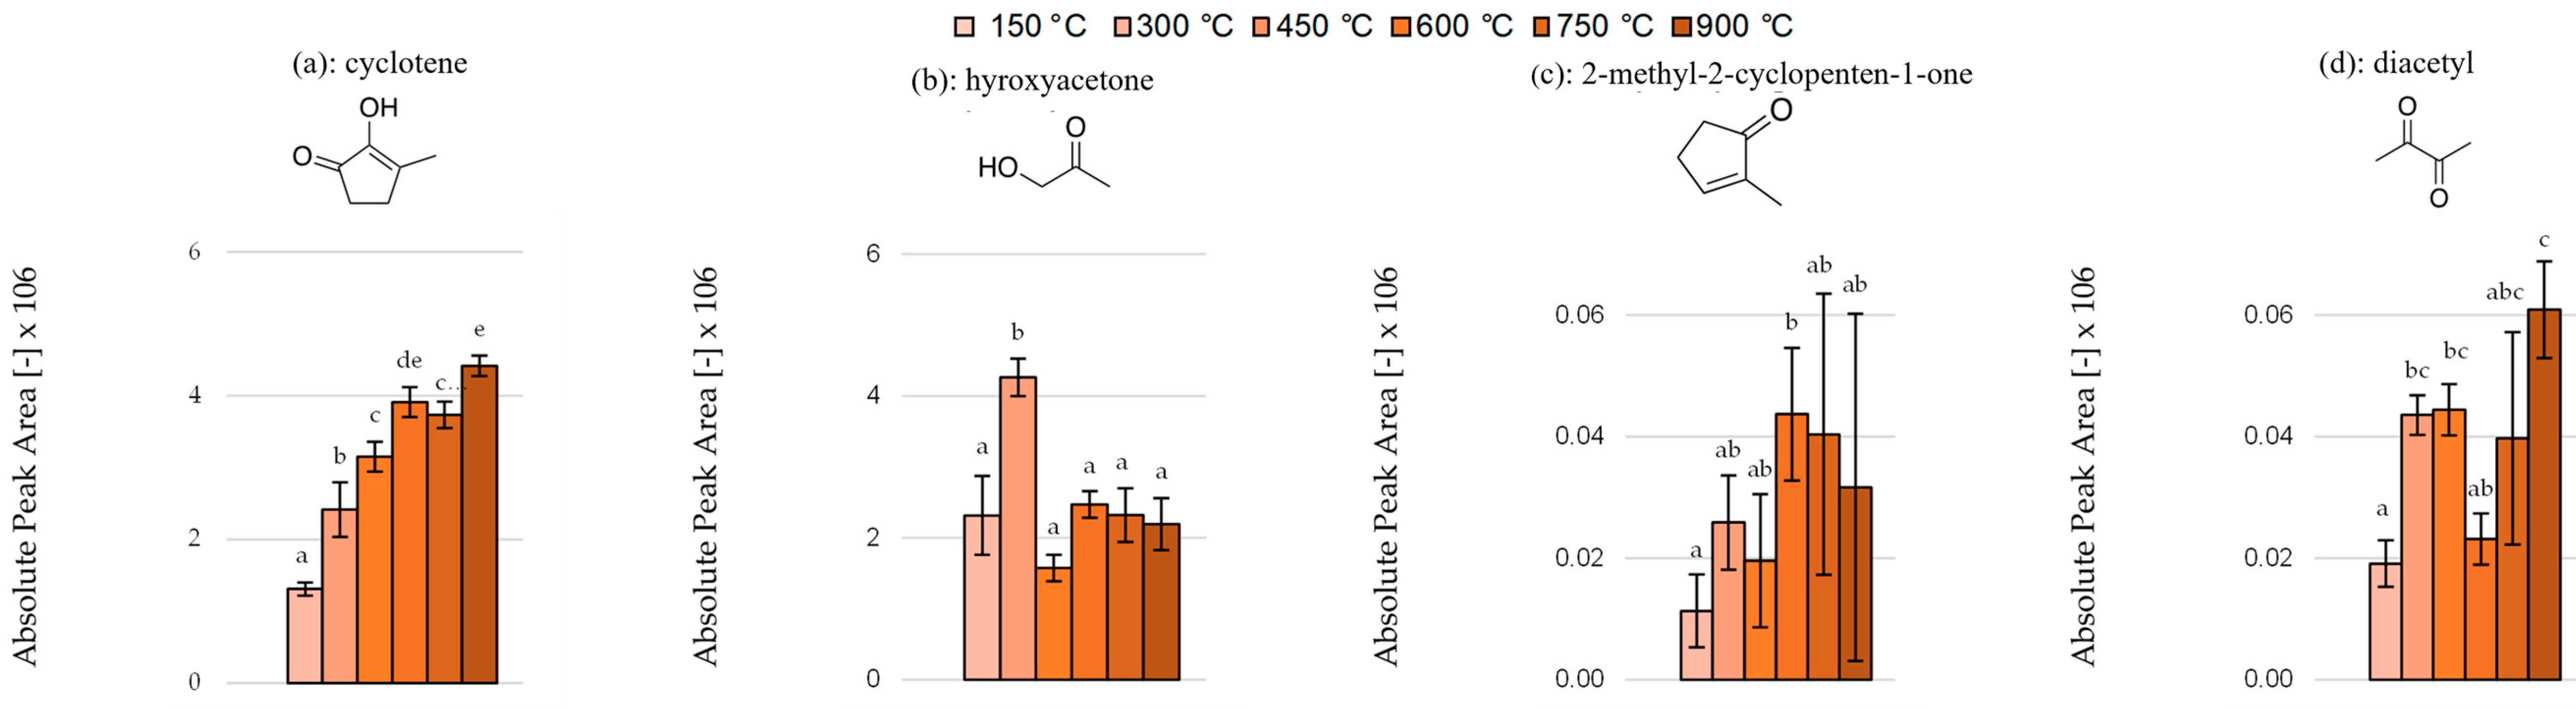
3.4. Effect of Pyrolysis Temperature on the Area and Ratios of Individual Carbonyls and Furans

In contrast to the phenols and lactones, the carbonyls and furans only showed a medium positive correlation (rT-carbonyls = 0.59, p = 0.01) and, respectively, no linear correlation with the applied pyrolysis temperature. For these two substance classes, the changes in the area of the individual compounds as a function of the pyrolysis temperature were also investigated with the aid of absolute and relative peak areas. The carbonyl cyclotene, which is an important contributor to food flavor formation, increased strongly as the temperature was elevated from 150 °C to 300 °C, and then showed a constant peak area (Figure 6a). This indicates heat stability, which may be provided by the ring structure. Hydroxyacetone showed a significantly higher peak area at a pyrolysis temperature of 300 °C compared to all other temperatures (Figure 6b). For 2-methyl-cyclopenten-1-one (Figure 6c), there was no inference of temperature dependence and diacetyl showed large variations across the temperature spectrum (Figure 6d). Below 450 °C, hydroxyacetone had the largest share of carbonyls, while above 450 °C, cyclotene had the largest share. The relative peak areas of each individual carbonyl per applied pyrolysis temperature are given in Table 4.
Substances belonging to the group of furans are formed by the degradation of hemicellulose and cellulose, which takes place at 200–260 °C and 280–320 °C, respectively [6,13,14,15]. During this degradation, monomeric structures are released which are converted to furans by dehydrogenation [35]. One potential formation of the furfural studied here is the degradation pathway of hemicellulose. Released subunits are dehydrogenated at 275–290 °C and furfural is formed [12]. The increase in the substance class of furans expected in our studies could not be shown as described above. An analysis of the individual substances furfural and 5-methylfurfural confirms this result. For both substances, no difference was found in the absolute and relative peak areas between the applied pyrolysis temperatures (Figure 7 and Table 5).
Because of the few substances included in the carbonyl and furan class, no conclusions can be drawn about possible reaction steps of hemicellulose and cellulose degradation. Further studies are needed to better understand the reactions at increasing temperature and a specific formation of carbonyls by adjusting the smoke generation. Cyclotene, which is important for flavor formation, shows a clear increase from a temperature of 450 °C and thus a dependence on temperature, as do the total phenolic content and the content of individual phenols, which are the characteristic flavoring substances of food smoke.

4. Conclusions

The pyrolysis temperature applied has a significant effect on the volatile compounds in the smoking chamber atmosphere and the relative distribution of aroma compounds studied. The phenols and lactones showed a steady increase over the entire applied temperature range, while the carbonyls showed an increase at 300 °C as well as a significant fluctuation with increasing pyrolysis temperature. No dependence on pyrolysis temperature was found for the substance class of furans. The share of phenols in the total peak area increased significantly when the pyrolysis temperature was increased from 300 °C to 450 °C, while the share of carbonyls and furans in the total peak area decreased. A highly significant, strong, positive linear correlation was found between all substance classes, apart from furans. These show no linear correlation with any other substance class. Most of the phenols (creosol, o-cresol, p-cresol, eugenol, 4-ethylguaiacolal and trans-isoeugenol) studied showed a linear increase over the entire temperature range. The carbonyls studied exhibited very different behaviors and no resemblance could be detected. Overall, these findings can help to understand aroma profiles in smoked products, as well as for the development of customized smoked products.

Supplementary Materials

The following supporting information can be downloaded at: https://www.mdpi.com/article/10.3390/separations10030176/s1, Table S1: Standard recipe for production of Frankfurter sausages; Table S2 System control for the process steps smoking and cooking of Frankfurter-type sausages. CA = Circulating air; TA = Transporting air; SA = Smoking air; 1Heating electrode: 132 s; Ignition suppression: 1s; wood chips transport: every 45 s for 3 s. tK represents the variable smoking time; Table S3: Settings and resulting air volume flow for smoldering air and mean pyrolysis temperature applied in investigations; Table S4: Relative peak areas [%] of the substance classes carbonyls, furans and lactones in food smoke depending on pyrolysis temperature; Figure S1: Temperature curves of the smoldering zone temperature sensor using different approaches.

Author Contributions

Conceptualization, M.R. and L.H.; methodology, M.R. and M.L.; investigation, L.H. and M.R.; data curation, L.H. and M.R.; writing—original draft preparation, L.H. and M.R.; writing—review and editing, Y.Z., M.L., M.G., K.H. and J.W.; project administration, M.R., M.L., Y.Z., M.G. and J.W. All authors have read and agreed to the published version of the manuscript.

Funding

This IGF Project of the FEI (Forschungskreis der Ernährungsindustrie e.V., Bonn) was supported via AiF [21343N] within the program for promoting the Industrial Collective Research (IGF) of the German Ministry of Economic Affairs and Energy (BMWi).

Data Availability Statement

The data presented in this study are available on request from the corresponding author. The data are not publicly available due to the large data set.

Conflicts of Interest

The authors declare no conflict of interest.

References

  1. Glatz, J. Fleisch und Erzeugnisse aus Fleisch. In Handbuch für Lebensmittelchemiker; Frede, W., Ed.; Springer: Berlin/Heidelberg, Germany, 2009; Volume 3, pp. 563–585. [Google Scholar]
  2. Toth, L.; Potthast, K. Chemical aspects of the smoking of meat and meat products. In Advances in Food Research; Elsevier: Amsterdam, The Netherlands, 1984; Volume 29, pp. 87–158. [Google Scholar]
  3. Foster, W.W.; Simpson, T.H. Studies of the smoking process for foods. I—The importance of vapours. J. Sci. Food Agric. 1961, 12, 363–374. [Google Scholar] [CrossRef]
  4. Foster, W.W.; Simpson, T.H.; Campbell, D. Studies of the smoking process for foods. II—The rǒle of smoke particles. J. Sci. Food Agric. 1961, 12, 635–644. [Google Scholar] [CrossRef]
  5. Sikorski, Z.; Sinkiewicz, I. Smoking: Traditional. In Encyclopedia of Meat Sciences, 2nd ed.; Elsevier: Amsterdam, The Netherlands, 2014. [Google Scholar]
  6. Maga, J.A. Smoke in Food Processing; CRC Press: Boca Raton, FL, USA, 1988; Volume 1. [Google Scholar]
  7. Tóth, L.; Wittkowski, R. Das Räuchern–aus der Sicht der Chemie. Chem. Unserer Zeit 1985, 19, 48–58. [Google Scholar] [CrossRef]
  8. Lingbeck, J.M.; Cordero, P.; O’Bryan, C.A.; Johnson, M.G.; Ricke, S.C.; Crandall, P.G. Functionality of liquid smoke as an all-natural antimicrobial in food preservation. Meat Sci. 2014, 97, 197–206. [Google Scholar] [CrossRef]
  9. Toledo, R.T. Wood smoke components and functional properties. Smoked Seaf. Saf. 2007, 55-61, 55–61. [Google Scholar]
  10. Fiddler, W.; Parker, W.E.; Wasserman, A.E.; Doerr, R.C. Thermal decomposition of ferulic acid. J. Agric. Food Chem. 1967, 15, 757–761. [Google Scholar] [CrossRef]
  11. Gilbert, J.; Knowles, M.E. The chemistry of smoked foods: A review. Int. J. Food Sci. Technol. 1975, 10, 245–261. [Google Scholar] [CrossRef]
  12. Fengel, D.; Wegener, G. Influence of Temperature. In Wood: Chemistry, Ultrastructure, Reactions; Fengel, D., Wegener, G., Eds.; De Gruyter, Inc.: Berlin Germany; Boston, MA, USA, 1983; pp. 319–344. [Google Scholar]
  13. Kawamoto, H. Lignin pyrolysis reactions. J. Wood Sci. 2017, 63, 117–132. [Google Scholar] [CrossRef] [Green Version]
  14. Fenner, R.A.; Lephardt, J.O. Examination of the thermal decomposition of kraft pine lignin by Fourier transform infrared evolved gas analysis. J. Agric. Food Chem. 1981, 29, 846–849. [Google Scholar] [CrossRef]
  15. Adler, E. Lignin chemistry—Past, present and future. Wood Sci. Technol. 1977, 11, 169–218. [Google Scholar] [CrossRef]
  16. Tóth, L. Chemie der Räucherung; Verlag Chemie: Weinheim, Germany, 1983; Volume 1. [Google Scholar]
  17. Weiss, J.; Gibis, M.; Zhang, Y. Project Proposal AiF 21343-N. 2019. Available online: http://www.fei-bonn.de/gefoerderte-projekte/projektdatenbank/aif-21343-n.projekt (accessed on 3 March 2023).
  18. Arthur, C.L.; Pawliszyn, J. Solid phase microextraction with thermal desorption using fused silica optical fibers. Anal. Chem. 1990, 62, 2145–2148. [Google Scholar] [CrossRef]
  19. Jeleń, H.H.; Majcher, M.; Dziadas, M. Microextraction techniques in the analysis of food flavor compounds: A review. Anal. Chim. Acta 2012, 738, 13–26. [Google Scholar] [CrossRef]
  20. Mahattanatawee, K.; Goodner, K.; Rouseff, R. Quantification of β-damascenone in orange juice using headspace standard addition SPME with selected ion GC-MS. Anal. Methods 2013, 5, 2630–2633. [Google Scholar] [CrossRef]
  21. Zhang, Y.; Fraatz, M.A.; Horlamus, F.; Quitmann, H.; Zorn, H. Identification of potent odorants in a novel nonalcoholic beverage produced by fermentation of wort with shiitake (Lentinula edodes). J. Agric. Food Chem. 2014, 62, 4195–4203. [Google Scholar] [CrossRef]
  22. Conde, F.J.; Afonso, A.M.; González, V.; Ayala, J.H. Optimization of an analytical methodology for the determination of alkyl-and methoxy-phenolic compounds by HS-SPME in biomass smoke. Anal. Bioanal. Chem. 2006, 385, 1162–1171. [Google Scholar] [CrossRef]
  23. Yu, A.-N.; Sun, B.-G.; Tian, D.-T.; Qu, W.-Y. Analysis of volatile compounds in traditional smoke-cured bacon (CSCB) with different fiber coatings using SPME. Food Chem. 2008, 110, 233–238. [Google Scholar] [CrossRef]
  24. Leible, M. The Effects of Variable Smoldering Temperatures and Flue Gas Compositions on Physical, Chemical, and Sensory Attributes of Frankfurters Who Are Similar in Their Casing Color. Master’s Thesis, University of Hohenheim, Stuttgart, Germany, October 2021. [Google Scholar]
  25. Rigling, M.; Heger, F.; Graule, M.; Liu, Z.; Zhang, C.; Ni, L.; Zhang, Y. A Robust Fermentation Process for Natural Chocolate-like Flavor Production with Mycetinis scorodonius. Molecules 2022, 27, 2503. [Google Scholar] [CrossRef] [PubMed]
  26. Ruedt, C.; Gibis, M.; Weiss, J. Effect of varying salt concentration on iridescence in precooked pork meat. Eur. Food Res. Technol. 2022, 248, 57–68. [Google Scholar] [CrossRef]
  27. Hunter, J.D. Matplotlib: A 2D graphics environment. Comput. Sci. Eng. 2007, 9, 90–95. [Google Scholar] [CrossRef]
  28. Harris, C.R.; Millman, K.J.; Van Der Walt, S.J.; Gommers, R.; Virtanen, P.; Cournapeau, D.; Wieser, E.; Taylor, J.; Berg, S.; Smith, N.J. Array programming with NumPy. Nature 2020, 585, 357–362. [Google Scholar] [CrossRef]
  29. McKinney, W. Data Structure for Statisticle Computing in Python. In Proceedings of the 9th Python in Science Conference, Austin, TX, USA, 28 June–3 July 2010. [Google Scholar]
  30. Waskom, M.L. seaborn: Statistical data visualization. J. Open Source Softw. 2021, 6, 3021. [Google Scholar] [CrossRef]
  31. Porter, R.W.; Bratzler, L.J.; Pearson, A.M. Fractionation and study of compounds in wood smoke. J. Food Sci. 1965, 30, 615–619. [Google Scholar] [CrossRef]
  32. TGS. TGSC Information System. Available online: http://www.thegoodscentscompany.com (accessed on 17 February 2023).
  33. Fujimaki, M.; Kim, K.; Kurata, T. Analysis and comparison of flavor constituents in aqueous smoke condensates from various woods. Agric. Biol. Chem. 1974, 38, 45–52. [Google Scholar] [CrossRef]
  34. Kostyra, E.; Baryłko-Pikielna, N. Volatiles composition and flavour profile identity of smoke flavourings. Food Qual. Prefer. 2006, 17, 85–95. [Google Scholar] [CrossRef]
  35. Fengel, D.; Wegener, G. Wood: Chemistry, Ultrastructure, Reactions; Walter de Gruyter: Berlin, Germany, 2011. [Google Scholar]
  36. Chen, L.; Liao, Y.; Guo, Z.; Cao, Y.; Ma, X. Products distribution and generation pathway of cellulose pyrolysis. J. Clean. Prod. 2019, 232, 1309–1320. [Google Scholar] [CrossRef]
  37. Daun, H.; Tilgner, D.J. The influence of generation parameters upon antioxidative properties of wood smoke. Acta Aliment. Pol. 1977, 3, 231–236. [Google Scholar]
  38. Cadwallader, K.R. Wood smoke flavor. In Handbook of Meat, Poultry and Seafood Quality; Blackwell Publishing: Ames, IA, USA, 2007; pp. 201–210. [Google Scholar]
  39. Kornreich, M.R.; Issenberg, P. Determination of phenolic wood smoke components as trimethylsilyl ethers. J. Agric. Food Chem. 1972, 20, 1109–1113. [Google Scholar] [CrossRef]
  40. Pöhlmann, M.; Hitzel, A.; Schwägele, F.; Speer, K.; Jira, W. Contents of polycyclic aromatic hydrocarbons (PAH) and phenolic substances in Frankfurter-type sausages depending on smoking conditions using glow smoke. Meat Sci. 2012, 90, 176–184. [Google Scholar] [CrossRef] [PubMed]
  41. Doerr, R.C.; Fiddler, W. Partition ratios of some wood smoke phenols in two oil: Water systems. J. Agric. Food Chem. 1970, 18, 937–939. [Google Scholar] [CrossRef]
  42. Pöhlmann, M.; Hitzel, A.; Schwägele, F.; Speer, K.; Jira, W. Polycyclic aromatic hydrocarbons (PAH) and phenolic substances in smoked Frankfurter-type sausages depending on type of casing and fat content. Food Control 2013, 31, 136–144. [Google Scholar] [CrossRef]
Figure 1. Absolute peak areas with standard deviation of the substance classes carbonyls, furans and lactones in food smoke depending on pyrolysis temperature. Different letters indicate a significant difference in absolute peak area of a substance class between different pyrolysis temperatures (p < 0.05, n = 3).
Separations 10 00176 g001
Figure 2. Food smoke composition at different wood pyrolysis temperatures (TP) represented as relative peak areas [%] from individual substance classes. (1) TP = 150 °C, (2) TP = 300 °C, (3) TP = 450 °C, (4) TP = 600 °C, (5) TP = 750 °C, (6) TP = 900 °C.
Separations 10 00176 g002
Figure 3. Correlation matrix between pyrolysis temperature and substance classes obtained via Pearson’s linear correlation analysis; total = sum of all target aroma compounds. Significance levels: * p < 0.05, ** p < 0.01, *** p < 0.001.
Separations 10 00176 g003
Figure 4. Absolute peak areas with standard deviation of individual phenols in food smoke depending on pyrolysis temperature. (a) Guaiacol, (b) syringol, (c) phenol, (d) creosol, (e) 4-ethyl-guaiacol, (f) p-cresol, (g) eugenol, (h) o-cresol, (i) vanillin and (j) trans-isoeugenol. Different letters indicate a significant difference in absolute peak area of a substance between different pyrolysis temperatures (p < 0.05, n = 3).
Separations 10 00176 g004
Figure 5. Absolute peak areas with standard deviation of individual lactones in food smoke depending on pyrolysis temperature. (a) 2-(5H)-furanone and (b) butyrolactone. Different letters indicate a significant difference in absolute peak area of a substance between different pyrolysis temperatures (p < 0.05, n = 3).
Separations 10 00176 g005
Figure 6. Absolute peak areas with standard deviation of individual carbonyls in food smoke depending on pyrolysis temperature. (a) cyclotene, (b) hydroxyacetone, (c) 2-methyl-2-cyclopenten-1-one and (d) diacetyl. Different letters indicate a significant difference in absolute peak area of a substance between different pyrolysis temperatures (p < 0.05, n = 3).
Separations 10 00176 g006
Figure 7. Absolute peak areas with standard deviation of individual furans in food smoke depending on pyrolysis temperature. (a) Furfural and (b) 5-methyl-furfural.
Separations 10 00176 g007
Table 1. Target compounds identified by means of GC-MS after HS-SPME in food smoke.
No.RICompoundOdor Description 1Quantifier Ion m/zIdentification
carbonyls
1<1000diacetylbutter-like, sweetish, creamy, pungent, caramel-like43RI, MS
21283hydroxyacetonepungent, sweetish, caramel-like, ethereal43RI, MS
313522-methyl-2-cyclopenten-1-onewarm, spicy, sweetish67RI, MS
41808cyclotenesweetish, caramel-like, maple-like, sugar-like, coffee-like, woody112RI, MS
furans
51445furfuralsweetish, woody, almond-like, bread-like, baked97RI, MS
615535-methyl-furfuralspicy, caramel-like, maple-like111RI, MS
lactones
71600butyrolactonecreamy, oily, fatty, caramel-like42RI, MS
817422-(5H)-furanonebutter-like55RI, MS
phenols
91838guaiacolspicy, clove-like, vanilla-like, phenolic, medicinal, leathery, woody, smoky109RI, MS
101933creosolspicy, clove-like, vanilla-like, phenolic, medicinal, leathery, woody, smoky, burnt138RI, MS
111982phenolmusty, phenolic, plastic-like, medicinal, herbal, leathery94RI, MS
121982o-cresolmusty, phenolic, plastic-like, medicinal, herbal, leathery108RI, MS
1320074-ethylguaiacolspicy, smoky, bacon-like, phenolic, clove-like137RI, MS
142058p-cresolphenolic, narcissus-like, animalic, mimosa-like107RI, MS
152143eugenolsweetish, spicy, clove-like, woody164RI, MS
162237syringolsmoky, phenolic, balsamic, bacon-like, powdery, woody154RI, MS
172317trans-isoeugenolsweetish, spicy, carnation-like, phenolic, floral164RI, MS
182522vanillinsweetish, vanilla-like, creamy, chocolate-like152RI, MS
1 Odor descriptions from The Good Scent Company (2021).
Table 2. Relative peak areas [%] with standard deviation of individual phenols in food smoke depending on pyrolysis temperature.
Pyrolysis temperature [°C]Relative Peak Area [%]
guaiacolsyringolphenolcreosol4-ethyl-guaiacol
15017.17 ± 6.3935.10 ± 12.10 ab3.79 ± 1.06 ab13.79 ± 4.2010.39 ± 1.88
30011.82 ± 3.9236.38 ± 10.59 ab2.96 ± 0.66 ab11.66 ± 3.0810.84 ± 2.18
4507.43 ± 0.8040.72 ± 1.38 b2.88 ± 0.23 a10.29 ± 0.6310.88 ± 0.37
6007.94 ± 0.6438.24 ± 1.04 b3.16 ± 0.21 a10.94 ± 0.4211.15 ± 0.24
7508.15 ± 0.7937.37 ± 0.97 b3.16 ± 0.21 a11.16 ± 0.4111.51 ± 0.12
9009.41 ± 0.7831.95 ± 1.05 a4.73 ± 0.21 b12.11 ± 0.4211.82 ± 0.21
Pyrolysis temperature [°C]Relative Peak Area [%]
p-cresoleugenolo-cresolvanillintrans-isoeugenol
1501.93 ± 0.35 a2.52 ± 0.09 a1.62 ± 0.49 ab2.18 ± 1.3811.5 ± 0.99 a
3002.04 ± 0.34 a3.55 ± 0.40 acde1.34 ± 0.37 b1.46 ± 0.5817.96 ± 0.78 b
4502.55 ± 0.12 a4.09 ± 0.04 c1.31 ± 0.11 b1.53 ± 0.1018.33 ± 0.81 b
6002.84 ± 0.08 a4.29 ± 0.04 d1.48 ± 0.08 b1.58 ± 0.0718.38 ± 0.52 b
7502.94 ± 0.05 a4.33 ± 0.10 cde1.60 ± 0.10 ab1.50 ± 0.0818.30 ± 0.46 b
9003.94 ± 0.06 b4.67 ± 0.09 e2.28 ± 0.12 a1.38 ± 0.0617.70 ± 0.60 b
Different letters indicate a significant difference in absolute peak area of a substance between different pyrolysis temperatures (p < 0.05, n = 3).
Table 3. Relative peak areas [%] with standard deviation of individual lactones in food smoke depending on pyrolysis temperature.
Pyrolysis Temperature [°C]Relative Peak Area [%]
2-(5H)-furanonebutyrolactone
150 87.73 ± 1.16 ab 12.27 ± 1.16 ab
300 87.95 ± 1.04 a 12.05 ± 1.04 a
450 91.89 ± 0.19 ab 8.11 ± 0.19 ab
600 91.92 ± 0.47 b 8.08 ± 0.47 b
750 91.74 ± 0.27 ab 8.26 ± 0.27 ab
900 91.49 ± 0.18 ab 8.51 ± 0.18 ab
Different letters indicate a significant difference in absolute peak area of a substance between different pyrolysis temperatures (p < 0.05, n = 3).
Table 4. Relative peak areas [%] with standard deviation of individual carbonyls in food smoke depending on pyrolysis temperature.
Pyrolysis Temperature [°C]Relative Peak Area [%]
diacetyl2-methyl-2-cyclopenten-1-onehydroxyacetonecyclotene
1500.52 ± 0.02 ac0.30 ± 0.1362.93 ± 4.71 a36.25 ± 4.85 a
3000.65 ± 0.06 ac0.38 ± 0.1163.25 ± 5.05 a35.72 ± 5.10 a
4500.93 ± 0.02 b0.41 ± 0.2232.79 ± 1.27 b65.87 ± 1.22 b
6000.36 ± 0.12 c0.68 ± 0.0737.67 ± 6.31 b61.29 ± 6.29 b
7500.64 ± 0.27 abc0.68 ± 0.4137.69 ± 2.98 b60.99 ± 2.77 b
9000.91 ± 0.09 ab0.49 ± 0.4732.60 ± 3.02 b66.00 ± 2.69 b
Different letters indicate a significant difference in absolute peak area of a substance between different pyrolysis temperatures (p < 0.05, n = 3).
Table 5. Relative peak areas [%] with standard deviation of individual furans in food smoke depending on pyrolysis temperature.
Pyrolysis Temperature [°C]Relative Peak Area [%]
furfural5-methyl-furfural
15098.35 ± 0.221.65 ± 0.22
30098.57 ± 0.171.43 ± 0.17
45098.66 ± 0.071.34 ± 0.07
60098.55 ± 0.121.45 ± 0.12
75098.68 ± 0.131.32 ± 0.13
90098.67 ± 0.041.33 ± 0.04
Disclaimer/Publisher’s Note: The statements, opinions and data contained in all publications are solely those of the individual author(s) and contributor(s) and not of MDPI and/or the editor(s). MDPI and/or the editor(s) disclaim responsibility for any injury to people or property resulting from any ideas, methods, instructions or products referred to in the content.

