Article

Physicochemical Characteristics of Vinegar from Banana Peels and Commercial Vinegars before and after In Vitro Digestion

by
Ancuța Elena Prisacaru
*,
Cristina Ghinea
*,
Laura Carmen Apostol
,
Sorina Ropciuc
and
Vasile Florin Ursachi
Faculty of Food Engineering, Stefan cel Mare University of Suceava, 13 Universitatii Street, 720229 Suceava, Romania
*
Authors to whom correspondence should be addressed.
Processes 2021, 9(7), 1193; https://doi.org/10.3390/pr9071193
Submission received: 11 May 2021 / Revised: 12 June 2021 / Accepted: 7 July 2021 / Published: 9 July 2021
(This article belongs to the Section Food Process Engineering)

Abstract

:
Vinegar is a fermented food with a diversity of uses seasoning, salad dressing and flavouring for foods. Since ancient times it is considered a remedy for health and today there are different types of vinegar on the market, and many others are under development. Determination of the physicochemical characteristics of the new types of vinegar is necessary in order to improve them. Therefore, the aim of this paper is to compare the physicochemical characteristics of vinegar obtained from banana peels (with or without boiling peels) at different ages, with those of commercial vinegars. The vinegar from banana peels was obtained and aged in our laboratory, while the commercial vinegars were purchased from a local market. The physicochemical characteristics of all the samples were investigated before and after gastric and intestinal digestion. Inductively coupled plasma mass spectrometry was used to determine the mineral content of the vinegars. Additionally, statistical analysis of the results was performed by applying a one-way analysis of variance. Results showed that vinegar obtained from banana peels is clearer and total dry extract values are lower than those of commercial vinegars. Banana peel vinegars have higher antioxidant activity and total polyphenol content similar to the commercial balsamic vinegars. This study advances the knowledge in the field of vinegar production by using raw agricultural by-products.

1. Introduction

Vinegar is a common food product, obtained during fermentation of raw materials such as grains, apples, grapes or sugarcane, which contain starch and/or sugars [1,2]. Nowadays, on the market, there are various types of vinegar such as wine vinegar (fabricated in Europe), cider and malt vinegars (in England and Wales), rice vinegars (in Asia), balsamic vinegar and others. Vinegar from fruits such as apple [3], orange [4], tomato [5], lemon [2], sour cherry [6] or fruit waste such as pineapple waste [7] or banana peel [8,9] were developed and produced. The biotechnological processes involved in vinegar production are: alcoholic fermentation (which implies the presence of yeasts such as Saccharomyces cerevisiae) and acetous fermentation (acetic acid bacteria such as Acetobacter transform the alcohol to acetic acid) [1,10]. The fermentation processes can be slow, involving the growth, on the surface of the liquid, of acetic acid bacteria for several weeks or months or fast when the liquid is oxygenized by agitation and the fermentation begins rapidly by submerging the bacteria culture. Usually used as a condiment, salad dressing and flavoring for various foods [1,11], vinegar provides health beneficial effects such as anti-infective properties, antitumor activity and control of blood glucose [10]. The global vinegar market reached 1.3 billion US dollar (USD) in 2019 [12]. In the European Union, the revenue from vinegar market amounted 1 billion USD in 2018 and the quantity of vinegar produced was around 1.2 billion l the same year [13].
The quality of fermented products such as vinegars is influenced by the raw material used, acidification system and aging method [14] and is dependent on the chemical composition and sensory characteristics of vinegars [15]. It contains vitamins, minerals, essential amino acids, organic acids and other polyphenols [11,16]. The main volatile compound in vinegar that gives its own unique taste and flavor is acetic acid. Other volatile compounds are alcohols, acids, esters, aldehydes and ketones [1].
Although the quality characteristics can vary a lot, some general guidelines about certain characteristics such as acidity content and presence of heavy metals in vinegars have been established on the national and international level [11]. Over the past years, there has been a growing interest in adding value to raw agricultural by-products. If these raw agricultural by-products are disposed as waste, it can be problematic to the environment due to their chemical composition and prone to microbial spoilage emitting toxic gaseous such as H2, CO2 and CH4 [17]. Recently, food waste is not only a problem related to food security but also an economic problem because of its impact on profitability. The production of vinegar involves low production cost related to raw materials as fruits waste and food surpluses [18]. Different types of vinegar has appeared on the marketplace made from different raw materials such as pineapple and onion waste and their properties were analyzed [19,20].
All over the world, most consumers of bananas discard the peels as waste parts after consumption, which contributes to pollution. Therefore, it is extremely important to assess the potential use of banana peels in vinegar production instead of considering them as waste materials.
The purpose of this study was to characterize the banana peel and balsamic commercial vinegars concerning their physicochemical (total dry extract, acidity, total gravity, brix, color), bioactive properties (antioxidant capacity, total phenolic content) and mineral composition. In addition, the changes of these parameters were investigated with in vitro methods.

2. Materials and Methods

2.1. Materials, Chemicals and Reagents

Banana peel vinegars were produced in faculty laboratory, while commercial balsamic vinegars were procured from the local supermarkets. All chemicals and reagents (Sodium chloride, S7653, purity 99%; Hydrochloric acid 37%, 320331; Dipotassium hydrogenphosphate, P3786, purity 98%; Nitric acid 70%, 225711; Methanol, 34860, purity 99%; Sodium carbonate, S7795, purity 99%; 2,2-Diphenyl-1-picrylhydrazyl, D9132; Folin-Ciocalteu, F9252) utilized in the analyses in the present study were procured from Sigma-Aldrich (Sigma-Aldrich Chemie GmbH, Taufkirchen, Germany). Pepsin from porcine gastric mucosa (P 7000; 250 U/mg of solid), porcine bile extract (B8631) and porcine pancreatin (P1750, 4 × USP) were purchased from Sigma-Aldrich Corp. Beer yeast was procured from Enzymes Derivates Romania (Enzymes Derivates SA, Piatra Neamț, Romania).

2.2. Production of Banana Peel Vinegars

Bananas were procured from the local supermarkets. Bananas were peeled and the peels were manually cut into small pieces and then chopped in an electric blender to obtained a homogenous mixture. Vinegar production involves two main processes, alcoholic and acetic fermentation. All these processes were performed in a traditional way. The alcoholic fermentation was done in a clay recipient (14 days, in dark at 24 °C) where the 2.4 Kg of chopped banana peels, 180 g of honey, 180 g of beer yeast (Saccharomyces cerevisiae) and 2.4 L of water were added. The acetic fermentation was done in another clay recipient (14 days, in dark at 28 °C) by the formation of acetic acid through the oxidation of ethylic alcohol. The recipient used for the acetic fermentation was left open so that acetic bacteria from the environment could inoculate the liquid. After 14 days the fermented liquid was filtered and bottled. In order to obtain 1 L of vinegar 0.68 Kg of banana peels were used.

2.3. Vinegar Samples

The analyzed samples were: banana peel vinegar aged for 1 year, produced without boiling the peels (V1), banana peel vinegar aged for 3 years, produced without boiling the peels (V2), banana peel vinegar aged for 2 years, produced with peels boiling (V3), commercial balsamic vinegar produced from concentrated apple juice and caramel aged in oak barrels for 1 year (V4) and Modena commercial vinegar obtained from concentrated grape must (V5). Commercial vinegars were obtained by the same procedure the differences being the raw materials used and the maturation period and recipient.

2.4. In Vitro Digestion

All samples were digested. The in vitro gastric digestion (gd) simulating the human model proposed by Gallier et al. [21] was used with some modification.
Simulated gastric digestion was done by mixing 100 mL of sample with 50 mL of simulated gastric fluid. The simulated gastric fluid was produced by dissolving 2.0 g of NaCl/L, 7 mL of 6 M HCl/L and 3.2 mg pepsin/L at pH 1.2 and acidifying to pH 1.5 with 6 M HCl at 37 °C in a shaking water bath at 95 rpm.
Simulated intestinal fluid was obtained with 6.8 g of K2HPO4 and 77 mL of 0.2 M NaOH/L and adjusted to pH 6.8.
After 2 h of gastric digestion of vinegar samples, in vitro intestinal digestion (id) under simulated intestinal conditions was performed at 37 °C in a water bath according to the procedure of Gallier et al. [21]. The digested vinegar samples were mixed with the simulated intestinal fluid (1:1), the pH was adjusted to 7.0 and bile extract (5 mg/mL of simulated intestinal fluid) was added. After that pancreatin was added (1.6 mg/mL of stimulated intestinal fluid). In vitro intestinal digestion was done for 2 h.

2.5. Physicochemical Properties

Color evaluation of the samples was conducted using a chromameter model CR 400 (Konica Minolta, Tokyo, Japan) based on the Hunter L* (whiteness/darkness), a* (redness/greenness) and b* (yellowness/blueness) systems. Color was evaluated only before the digestion of the samples [11].
Total dry extract (TDE) was analyzed by the evaporation at 100 °C and weighing of the resulted residue [22].
Total acidity was performed by acid base titration with a solution of 0.1 N sodium hydroxide in the presence of phenolphthalein and the results were expressed in acetic acid content [23].
The specific gravity (SG) was evaluated using a glass hydrometer at 20 °C [2].
Total soluble solids were analyzed using a refractometer and the results were expressed in degree Brix [11].
Antioxidant activity was determined for all the samples based on DPPH (2,2-diphenyl-1-hydrazyl-hydrate) inhibition. The absorbance was measured at 515 nm using a spectrophotometer and IC 50 was computed using a calibration curve with different quantities of DPPH. Inhibition percent of free radicals was computed as follows:
I% = (Astandard − Asample)/Astandard × 100,
where: I%—inhibition percent of free radicals; Astandard = absorbance of the standard sample; Asample = absorbance of the analysed sample.
Total polyphenols content (TPC) was determined by Folin–Ciocalteau method and the results were expressed as mg of gallic acid equivalents (mg GAE) [11].
Mineral composition was determined using a mass spectrometer with inductively coupled plasma mass spectrometry (ICP-MS) Agilent Technologies 7500 Series (Agilent, Santa Clara, CA, USA). Vinegar samples were prepared according to Ozturk et al. [11].

2.6. Statistical Analysis

The obtained results were investigated further by using Minitab software, version 17. One-way analysis of variance (ANOVA) was applied to determine if there are any statistically significant differences between the means of groups. α –level was set at 0.05 and the p-values obtained were calculated and compared with this value. Tukey Pairwise Comparisons method was also used. The values of S and R-sq, were calculated in order to find out how the model fits. The meaning of these indicators is explained by Ghinea et al. [24]. The outcomes are better if S has lower values and R-sq values are close to 100.

3. Results and Discussion

Color properties of the banana peels and commercial balsamic vinegars are shown in Figure 1. López et al. [25] explained that vinegar color is an influential factor regarding the sensorial characteristics of the product. L* values, indicating the luminosity level, ranged from 15.84 to 36.04. High values of L* indicates clearness, while low values indicate darkness. Banana peel vinegars had remarkably higher L* values except for one sample. Banana peel vinegars (V1 and V3) can be characterized as light colored due to the high level of L* compared to the commercial samples (Figure 1a). Different colors between vinegar types are related to the chemical composition and variety. a* and b* values of the samples were variable among the samples, indicating that color characteristics of vinegars were different from each other. In the case of a* the samples presented values situated in the negative region (Figure 1b), more towards green and in the case of b* they were situated in the positive region (Figure 1c), more towards blue (V1 and V3).
p-values are equal to 0.000, which means that the color parameters are statistically significant. Results obtained by applying Tukey pairwise comparisons method showed that V1 and V3 samples are significantly different than other samples when the mean values of L* were investigated, V2 and V5 are in the same category (C), as well V2 and V4 in the category D. Knowing that means which do not share a letter are significantly different, in the case of a* values only V1 and V5 were grouped in the same category. In the case of b* values, samples V3 and V1 are different from the rest of the samples, while samples V2, V4 and V5 were grouped in the same category. The model fits our data, since R-sq explain 99.71% of the variation in the response in the case of L*, 98.89% (for a*) and 99.97% (for b*).
Ozturk et al. [11] found that L* values of home-made vinegar samples obtained from grapes and apples ranged from 0.28 to 20.15, presenting a similar color with those of the present study with the exception of two samples (V1 and V3). The differences in color could be related to different raw materials and maturation time. Vinegar obtained from banana peel aged for 1 year (produced without boiling the peels) and vinegar from banana peel aged for 2 years (produced with boiling the peels) have high values of L*, which means they are clearer than the other types of vinegar. They are significantly different than other samples.
Table 1 shows physicochemical properties of banana peel and commercial balsamic vinegar samples before and after in vitro digestion. A large variability was observed in the data indicating differences regarding vinegar qualities.
Total dry extract (TDE) of the vinegars varied between 2.11 to 26.43 g/100 cm3. Commercial balsamic vinegars recorded values of 12.66 g/100 cm3 and 26.43 g/100 cm3 in the case of apple vinegar, respectively Modena vinegar, values above that of banana peel vinegars.
Grouping information was performed by using the Tukey method and 95% confidence.
The data regarding the values of total dry extract after gastric and intestinal digestion are reported in Table 1. After two hours of gastric digestion, the total dry extract values have decreased raging between 1.454 g/100 cm3 and 17.088 g/100 cm3, the highest values being recorded in the case of balsamic vinegars. Intestinal digestion was performed for two hours the values raging between 1.228 g/100 cm3 and 8.826 g/cm3. After performing in vitro digestion of the analyzed vinegar samples, we can conclude that the highest decrease in total dry extract values was observed in the case of balsamic vinegars compared with the banana peel vinegars. p-values are equal to 0.000, which means that in the case of TDE parameter the differences between some of the means are statistically significant, in all three cases. From Figure 2 it can be observed that the values obtained for all five samples have the same tendency. Samples V5 and V4 have the highest means for TDE in all three cases before and after gastric and intestinal digestion, while V1 the lowest means (Figure 2). Results obtained by applying Tukey pairwise comparisons method showed that all means are significantly different. The model fits our data since R-sq explains 99.98% of the variation in the response in the case of TDE, 99.77% (for TDE gd) and 99.78% (for TDE id). Total dry extract values are lower for the samples with vinegar obtained from banana peel compared with the samples with commercial vinegars and it was observed that TDE values decreased after gastric and intestinal digestion for all vinegar samples.
Acetic acid and other organic acids (citric acid, tartaric acid, malic acid, lactic acid and succinic acid) determine the acidity of the vinegars [26].
The acidity, aroma and quality of vinegar are affected by all volatile organic acids’ short chain, mainly acetic acids, propionic and butyric acids, that come from raw materials or are formed by fermentation [27]. Total acidity (TA) levels of the vinegar samples were not in conformity with the Codex Alimentarius Commission regulations which mention that the total acid content of vinegar should be a minimum of 50 g/L [28]. These findings are similar to other research where different types of food waste and traditional wine vinegars recorded an acidity below the limit mentioned by the Codex Alimentarius Commission [11,19]. The findings of this research suggest that banana peel vinegar can almost be classified as vinegar.
Modena commercial vinegar recorded the highest total acidity value (4.72 g/100 cm3) and banana peel vinegar produced with peels boiling aged for 2 years the smallest (0.91 g/100 cm3).
After two hours of gastric digestion, total acidity values decreased, ranging between 0.3 g/100 cm3 and 1.74 g/100 cm3. The intestinal digested samples had a total acidity between 0.26 g/cm3 and 1.62 g/100 cm3.
Commercial balsamic vinegars presented the highest acidity compared with banana peel vinegars before and after in vitro digestion.
In the study performed by Lopa et al. [29], the total acidity levels of 9 commercial vinegar samples were higher than 4% using conventional and automated analysis methods.
p-values are equal with 0.000, which means that in the case of TA parameter the differences between some of the means are statistically significant, before and after digestion. From Figure 3 it can be observed that samples V5 followed by V4 have the highest means for TA in all three cases before and after gastric and intestinal digestion, while the lowest means were observed for samples V3 before and after gastric digestion and V1 after intestinal digestion. Results showed that all means are significantly different for TA of the samples before digestion (Figure 3), the differences between means for TA of the samples V1 gd and V3 gd are not significantly significant (Figure 3). The same result was observed after investigation of TA values for samples V1 id, V2 id and V3 id, for which the differences between means not significantly significant (Figure 3). The model fits our data since R-sq explains 99.90% of the variation in the response in the case of TA, 99.68% (for TA gd) and 99.36% (for TA id). S values are lower 0.057, 0.039 and 0.054, which means that the model describes the response well. Total acidity values of vinegar samples are not in conformity with Codex Alimentarius Commission regulations, decreased in the following order V5 > V4 > V2 > V1 > V3 and the differences between some of the means are statistically significant, before and after digestion.
The data regarding specific gravity (SG) of analyzed samples are presented in Table 1. After in vitro digestion the values of this parameter recorded a slight growth from 0.8558 g/cm3 and 0.9412 g/cm3 and 1.0392 g/cm3 in the case of gastric digestion and 0.955 g/cm3 to 1.007 g/cm3 at intestinal digestion. It was observed that before and after digestion, for the SG parameter the differences between some of the means are statistically significant, based on the p-values equal to 0.000. Samples V5 followed by V1 have the highest means for SG, while V2 samples have the lowest mean according to the data presented in Figure 4. In this case, based on the SG means values obtained, the samples V1 and V5 were grouped in one category, while the other three in the other category, which means that samples V1 and V5 are not significantly different. Instead, regarding SG values the samples V1 and V5 are statistically different compared with the others samples (V2, V3 and V4). From Figure 4, it can be observed that after gastric digestion the SG of samples V1 g.d. slowly increased compared with the SG of the samples V5 gd. Results showed the means are significantly different for samples V1 gd and V5 gd, and they are no longer grouped in the same category. After intestinal digestion (Figure 4), the values of means for SG showed that samples V5 ig and V2 ig are not significantly different. The same aspect was observed also for samples V1 ig, V3 ig and V4 ig which can be grouped in one category. The model fits our data since R-sq explains 96.04% of the variation in the response in the case of SG, 96.16% (for SG gd) and 91.07% (for SG id). The model describes the response well since S values are lower by 0.008, 0.008 and 0.007, respectively. Vinegar obtained from banana peel aged for 1 year (produced without boiling the peels) and Modena commercial vinegar, based on the investigation of the data regarding specific gravity, before digestion is in the same category. After gastric digestion, the SG values of vinegar obtained from banana peel samples slowly increased compared with the SG values of the Modena commercial vinegar samples.
The levels of soluble solids including sugar, salts and proteins in an aqueous sample are indicated by Brix (%) parameter. In general, this parameter indicated sugar equivalents in samples omitting other soluble materials [30].
The Brix values of studied vinegars varied in a wide range, from 2.15 to 21.87 °Bx before digestion. The highest values were recorded in the case of balsamic commercial vinegars. These values are higher than the value 2.18 to 2.31 °Bx reported by Chalchisa and Derenje [31] for pineapple peels vinegar and 1.2 °Bx for persimmon peels vinegar detected by Bayram et al. [32]. After digestion of the samples, a decrease was observed in Brix values. This parameter is related to the level of sugars that decrease with the activity of fermentation by microorganisms [33].
Raw material is a factor that influences the variability of Brix values of vinegar samples. In a study conducted on wine and alcohol vinegars, Sáiz-Abajo et al. [30] found that Brix concentration varied between 3.80 to 5.00 and from 3.30 to 3.40, respectively. Masino et al. [33] found that Brix values of traditional balsamic vinegars were above 55.00. Total soluble solids of balsamic vinegars studied were below the values obtained by Lalou et al. [34] in a study conducted on 11 samples of balsamic vinegar in which the values varied between 23.8 and 72.50.
It was observed that for Brix parameter, in all three cases (before and after digestion), the differences between some of the means are statistically significant, based on the obtained p-values (0.000). Samples V5 has the highest mean followed by samples V4, while the lowest mean was observed for samples V1, V1 gd, and V2 id respectively (Figure 5).
Results obtained by applying Tukey pairwise comparisons method showed that all means are significantly different before and after gastric digestion, instead of after intestinal digestion samples V1 id, V2 id and V3 id can be grouped in one category which means that they are not significantly different when Brix parameter is evaluated. The model fits our data since R-sq explains 99.98% of the variation in the response in the case of Brix, 99.54% (for Brix gd) and 99.35% (for Brix id). Additionally, the model describes the response well since S values are lower 0.133, 0.320 and 0.197, respectively. Before digestion, the Brix values of vinegar samples decreased in the following order V5 > V4 > V2 > V3 > V1, after digestion as expected the level of sugar for all vinegar samples decreased.
Bioactive properties such as total phenolic content and DPPH radical scavenging activities of the analyzed samples are shown in Table 1. From the studied vinegar samples, the highest TPC and I% levels were observed in the banana peel vinegar produced without peels boiling aged for 3 years (V1), respectively banana peel vinegar produced with peels boiling aged for 2 years (V3) V2 sample had the lowest levels in term of total phenolic content and V5 sample the lowest I%. TPC of the vinegars varied from 4.03 mg gallic acid equivalent/ L to 5.72 mg GAE/L, while DPPH scavenging activities was in the range of levels from 5.42% to 60.92%. The total polyphenol content of the vinegars analyzed in this study was lower than those reported by other researchers. Lee et al. [35] showed that total polyphenol content of commercial onion, apple and pomegranate vinegar samples were 446.80, 780.47 and 37.43 µg/mL respectively. Na et al. [36] reported that total polyphenol content of commercial rice, fig, persimmon, apple and brewed vinegars were 83.86, 320.94, 485.13, 41.97 and 284.10 mg/kg, respectively.
Bioactive characteristics of vinegars can vary a lot depending on the type of raw material. The differences in the antioxidant activities were attributed to their different phenolic content and composition and to other non-phenolic antioxidants present in the samples [37].
After in vitro gastric digestion of the samples it was observed a decrease in total polyphenols content compared with the data obtained before digestion. The TPC values after intestinal digestion were lower than those obtained for the initial samples. These results are similar to those obtained by Bakir et al. [38]. For the TPC parameter, the p-values are equal with 0.000, in all cases (before, after gastric and intestinal digestion), which means that differences between some of the means are statistically significant. According to Figure 6, the highest means were registered for samples V1, V1 gd and V2 id, while the lowest means were obtained for samples V2, V5 gd and V3 id and V4 id.
Results obtained by applying Tukey pairwise comparisons method showed that all means are significantly different after gastric digestion, while before digestion samples V5 and V3 can be grouped in one category as the samples V4 and V2 (grouped in another category) which means that the means are not significantly different. Instead, after intestinal digestion only V4 id and V3 id can be grouped in one category. The model fits our data, since R-sq explains 99.73% of the variation in the response in the case of TPC, 99.95% (for TPC gd) and 99.43% (for TPC id).
DPPH radical scavenging activity of the vinegar samples studied are lower than the values obtained for onion (75.33%), pomegranate (92.13%) and higher than apple vinegar (2.91%) [39]. A higher DPPH radical scavenging activity than that of the analyzed samples was found at bokbunja (65%) [40] and omija vinegar (65.5%) [41].
Regarding the I% of the samples submerged to in vitro digestion, there was observed an increase in DPPH radical scavenging activities especially after intestinal digestion, ranging from 80.24% (V1) to 92.94% (V4). In the present study, bioactive properties of analysed vinegars were lower than those obtained by Ozturk et al. [11] and similar to those reported by Masino et al. [33]. DPPH radical scavenging activity of plum, apple and lemon fruit vinegars obtained only by acetic acid fermentation ranged between 16.7% and 35.7% according to the study performed by Kim et al. [39]. If apple and plum vinegars are produced by traditional two stages fermentation (alcohol and acetic) DPPH radical scavenging ability is higher (between 59.66% and 65.99%).
For I parameter, the p-values are equal with 0.000, in all cases (before, after gastric and intestinal digestion), which means that differences between some of the means are statistically significant. The highest means were registered for samples V3, V5 gd and V3 and V4 id, while the lowest means were obtained for samples V5, V4 gd and V1 id. All means are significantly different before digestion, while after digestion V1 gd and V3 gd can be grouped in one category as the samples V4 id, V3 id and V2 id (grouped in another category) which means that the means are not significantly different. The model fits our data since R-sq explains 99.96% of the variation in the response in the case of I parameter, 99.95% (for I gd) and 99.66% (for I id) and S values are lower. Banana peel vinegars have higher antioxidant activity and total polyphenol content quite similar to commercial balsamic vinegars.
Table 2 presents mineral contents of the analyzed vinegars. In general Na, Mg, and Ca were the most abundant minerals presented in the vinegars.
The sample coded as V3 was the richest one in terms of the amounts of a group of minerals, such as Mg, Na, Cr, Mn and Se. Quantities of Cu and Mg ranged from 0.05 mg/L to 3.11 mg/L and from 7.12 mg/L to 114.29 mg/L, respectively. Co and Ni of which quantities were always lower than 0.15 mg/L, were the minerals with the lowest amount among the other minerals analyzed. Banana peel vinegar is generally richer in Na, Mg, and Ca content than other commercial vinegars.
The major ions in the body fluids are sodium and potassium. In order to assure homeostasis, the regulation of proper concentration of these ions in the extra cellular and intra cellular fluids is essential [42]. Diets based on fruits and vegetables that are rich in potassium and magnesium are related to lower blood pressure [43].

4. Conclusions

In this study, we determined the mineral and physicochemical characteristics of five types of vinegars before and after in vitro digestion and applied the one-way ANOVA to compare the vinegar sample characteristics.
In conclusion, this study demonstrated that banana peels vinegar has a lower antimicrobial activity due to the fact that total acidity is low. Physicochemical characteristics of the banana peel vinegars were very diverse and different from those of the commercial banana vinegars. The production of banana peels vinegar should be foreword studied in order to produce vinegar that meets the standard requirements and that can lead to food waste minimization and diversified vinegar offer on the market.

Author Contributions

Conceptualization, A.E.P.; methodology, A.E.P., S.R. and L.C.A.; validation, A.E.P., S.R. and L.C.A.; formal analysis, A.E.P. and C.G.; investigation, A.E.P., L.C.A. and V.F.U.; resources, A.E.P. and V.F.U.; data curation, A.E.P.; writing—original draft preparation, A.E.P. and C.G.; writing—review and editing, A.E.P. and C.G.; visualization, C.G. and A.E.P.; supervision, A.E.P. and S.R.; project administration, A.E.P.; funding acquisition, A.E.P. All authors have read and agreed to the published version of the manuscript.

Funding

This research was funded by Stefan cel Mare University of Suceava, Romania.

Institutional Review Board Statement

Not applicable.

Informed Consent Statement

Not applicable.

Data Availability Statement

The data presented in this study are available on request from the corresponding author. The data are not publicly available.

Conflicts of Interest

The authors declare no conflict of interest.

References

  1. Ho, C.W.; Lazim, A.M.; Fazry, S.; Zaki, U.K.H.H.; Lim, S.J. Varieties, production, composition and health benefits of vinegars: A review. Food Chem. 2017, 221, 1621–1630. [Google Scholar] [CrossRef] [PubMed]
  2. Leonés, A.; Durán-Guerrero, E.; Carbú, M.; Cantoral, J.M.; Barroso, C.G.; Castro, R. Development of vinegar obtained from lemon juice: Optimization and chemical characterization of the process. LWT Food Sci. Technol. 2019, 100, 314–321. [Google Scholar] [CrossRef]
  3. Lima, M.J.A.; Reis, B.F. Fully automated photometric titration procedure employing a multicommuted flow analysis setup for acidity determination in fruit juice, vinegar, and wine. Microchem. J. 2017, 135, 207–212. [Google Scholar] [CrossRef]
  4. Cejudo-Bastante, C.; Castro-Mejías, R.; Natera-Marín, R.; García-Barroso, C.; Durán-Guerrero, E. Chemical and sensory characteristics of orange based vinegar. J. Food Sci. Technol. 2016, 53, 3147–3156. [Google Scholar] [CrossRef] [PubMed] [Green Version]
  5. Lee, J.Y.; Cho, H.D.; Jeong, J.H.; Lee, M.K.; Jeong, Y.K.; Shim, K.H.; Sheo, K.I. New vinegar produced by tomato suppresses adipocyte differentiation and fat accumulation in 3T3-L1cells and obese rat model. Food Chem. 2013, 141, 3241–3249. [Google Scholar] [CrossRef]
  6. Özen, M.; Özdemir, N.; Filiz, B.E.; Budak, N.H.; Kök-Taş, T. Sour cherry (Prunus cerasus L.) vinegars produced from fresh fruit or juice concentrate: Bioactive compounds, volatile aroma compounds and antioxidant capacities. Food Chem. 2020, 309, 125664. [Google Scholar] [CrossRef]
  7. Roda, A.; Faveri, D.M.; Giacosa, S.; Dordoni, R.; Lambri, M. Effect of pre-treatments on the saccharification of pineapple waste as a potential source for vinegar production. J. Clean. Prod. 2016, 112, 4477–4484. [Google Scholar] [CrossRef]
  8. Fatima, B.; Mishra, A.A. Optimization of process parameter for the production of vinegar from banana peel and coconut water. Int. J. Sci. Eng. Technol. 2015, 3, 817–823. [Google Scholar]
  9. Prisacaru, A.E.; Oroian, M. Quality evaluation of vinegar obtained from banana peel. In Proceedings of the International Multidisciplinary Scientific GeoConference: SGEM (Surveying Geology & Mining Ecology Management), Viena, Austria, 3–6 December 2018; Volume 18, pp. 259–264. [Google Scholar]
  10. Johnston, C.S.; Gaas, C.A. Vinegar: Medicinal uses and antiglycemic effect. Medscape Gen. Med. 2006, 8, 61. [Google Scholar]
  11. Ozturk, I.; Caliskan, O.; Tornuk, F.; Ozcan, N.; Yalcin, H.; Baslar, M.; Sagdic, O. Antioxidant, antimicrobial, mineral, volatile, physicochemical and microbiological characteristics of traditional home-made Turkish vinegars. LWT Food Sci. Technol. 2015, 63, 144–151. [Google Scholar] [CrossRef]
  12. Vinegar Market: Global Industry Trends, Share, Size, Growth, Opportunity and Forecast 2020–2025. Available online: https://www.imarcgroup.com/vinegar-manufacturing-plant (accessed on 20 February 2020).
  13. EU. Vinegar—Market Analysis, Forecast, Size, Trends and Insights. 2019. Available online: https://www.researchandmarkets.com/reports/4657911/eu-vinegar-market-analysis-forecast-size#pos-0 (accessed on 20 February 2020).
  14. Shahidi, F.; McDonald, J.; Chandrasekara, A.; Zhong, Y. Phytochemicals of foods, beverages and fruit vinegars: Chemistry and health effects. Asia Pac. J. Clin. Nutr. 2008, 17, 380–382. [Google Scholar] [PubMed]
  15. Cerezo, A.B.; Tesfaye, W.; Torija, M.J.; Mateo, E.; García-Parrilla, M.C.; Troncoso, A.M. The phenolic composition of red wine vinegar produced in barrels made from different woods. Food Chem. 2008, 109, 606–615. [Google Scholar] [CrossRef]
  16. Adams, M.R. Fermented weaning foods. In Microbiology of Fermented Foods; Wood, B.J.B., Ed.; Springer: Boston, MA, USA, 1998; pp. 790–811. [Google Scholar]
  17. Lun, O.K.; Wai, T.B.; Ling, L.S. Pineapple cannery waste as a potential substrate for microbial biotranformation to produce vanillic acid and vanillin. Int. Food Res. J. 2014, 21, 953–958. [Google Scholar]
  18. Solieri, L.; Giudici, P. (Eds.) Vinegars of the world. In Vinegars of the World; Springer: Milan, Italy, 2009. [Google Scholar]
  19. Roda, A.; Lucini, L.; Torchio, F.; Dordoni, R.; De Faveri, D.M.; Lambri, M. Metabolite profiling and volatiles of pineapple wine and vinegar obtained from pineapple waste. Food Chem. 2017, 229, 734–742. [Google Scholar] [CrossRef]
  20. Sharma, K.; Mahato, N.; Nile, S.H.; Lee, E.T.; Lee, Y.R. Economical and environmentally-friendly approaches for usage of onion (Allium cepa L.) waste. Food Funct. 2016, 7, 3354–3369. [Google Scholar] [CrossRef]
  21. Gallier, S.; Ye, A.; Singh, H. Structural changes of bovine milk fat globules during in vitro digestion. J. Dairy Sci. 2012, 95, 3579–3592. [Google Scholar] [CrossRef] [Green Version]
  22. Wine Vinegars—Determination of Total Dry Extract Content. Available online: https://www.oiv.int/public/medias/2702/oeno-57-2000.pdf (accessed on 11 May 2021).
  23. AOAC International. Acidity (Titratable) of Fruit Products, Titratable Acidity; AOAC Official Method 942.15; AOAC International: Rockville, MD, USA, 1990. [Google Scholar]
  24. Ghinea, C.; Apostol, L.C.; Prisacaru, A.E.; Leahu, A. Development of a model for food waste composting. Environ. Sci. Pollut. Res. 2019, 26, 4056–4069. [Google Scholar] [CrossRef]
  25. López, F.; Pescador, P.; Güell, C.; Morales, M.L.; García-Parrilla, M.C.; Troncoso, A.M. Industrial vinegar clarification by cross-flow microfiltration: Effect on colour and polyphenol content. J. Food Eng. 2005, 68, 133–136. [Google Scholar] [CrossRef]
  26. Walter, P. Determination of organic acids in food by means of ion exclusive chromatography. Mitt. Lebensm. Hyg. 2005, 96, 476–483. [Google Scholar]
  27. Montgomery, R.; Conway, T.W.; Spector, A.A.; Chappell, D. Nutrition. In Biochemistry: A Case-Oriented Approach, 6th ed.; Mosby-Year Book Inc.: St. Louis, MO, USA, 1996; p. 120. [Google Scholar]
  28. Codex Alimentarius Commission. Proposed Draft Revised Regional Standards for Vinegar. 2014. Available online: http://193.43.36.92/codex/Meetings/CCEURO/cceuro22/CLOO_18e.pdf (accessed on 20 February 2020).
  29. Lopa, R.A.S.; Lima, J.F.C.; Pérez-Olmas, R.; Ruiz, M.P. Simultaneous automatic potentiometric determination of acidity, chloride and fluoride in vinegar. Food Control 1995, 6, 155–159. [Google Scholar] [CrossRef]
  30. Sáiz-Abajo, M.-J.; Gonzales-Sáiz, J.M.; Pizarro, C. Classification of wine and alcohol vinegar samples based on near-infrared spectroscopy. Feasibility study on the detection of adulterated vinegars samples. J. Agric. Food Chem. 2004, 52, 7711–7719. [Google Scholar] [CrossRef]
  31. Chalchisa, T.; Dereje, B. From waste to food: Utilization of pineapple peels for vinegar production. MOJ Food Process Technols 2021, 9, 1–5. [Google Scholar]
  32. Bayram, Y.; Ozkan, K.; Sagdic, O. Bioactivity, physicochemical and antimicrobial properties of vinegar made from persimmon (Diospyros kaki) peels. Sigma J. Eng. Nat. Sci. 2020, 38, 1643–1652. [Google Scholar]
  33. Masino, F.; Chinnici, F.; Bendini, A.; Montevecchi, G.; Antonelli, A. A study on relationships among chemical, physical, and qualitative assessment in traditional balsamic vinegar. Food Chem. 2008, 106, 90–95. [Google Scholar] [CrossRef]
  34. Lalou, S.; Hatzidimitriou, E.; Papadopoulou, M.; Kontogianni, V.G.; Tsiafoulis, C.G.; Gerothanassis, I.P.; Tsimidou, M.Z. Beyond traditional balsamic vinegar: Compositional and sensorial characteristics of industrial balsamic vinegars and regulatory requirements. J. Food Compos. Anal. 2015, 43, 175–184. [Google Scholar] [CrossRef]
  35. Lee, S.; Lee, J.A.; Park, G.G.; Jang, J.K.; Park, Y.S. Semi-continuous fermentation of onion vinegar and its functional properties. Molecules 2017, 22, 1313. [Google Scholar] [CrossRef] [PubMed] [Green Version]
  36. Na, H.S.; Choi, G.C.; Yang, S.I.; Lee, J.H.; Cho, J.Y.; Ma, S.J.; Kim, J.Y. Comparison of characteristics in commercial fermented vinegars made with different ingredients. Korean J. Food Preserv. 2013, 20, 482–487. [Google Scholar] [CrossRef]
  37. Appel, L.J. Nonpharmacologic therapies that reduce blood pressure: A fresh perspective. Clin. Cardiol. 1999, 22, 1–5. [Google Scholar] [CrossRef]
  38. Bakir, S.; Toydemir, G.; Boyacioglu, D.; Beekwilder, J.; Capanoglu, E. Fruit antioxidants during vinegar processing: Changes in content and in vitro bio-accessibility. Int. J. Mol. Sci. 2016, 17, 1658. [Google Scholar] [CrossRef] [PubMed]
  39. Kim, K.-O.; Kim, S.-M.; Kim, S.-M.; Kim, D.-Y.; Jo, D.; Yeo, S.-H.; Jeong, Y.-J.; Kwon, J.-H. Physicochemical properties of commercial fruit vinegars with different fermentation methods. J. Korean Soc. Food Sci. Nutr. 2013, 42, 736–742. [Google Scholar] [CrossRef] [Green Version]
  40. Park, S.; Chae, K.S.; Son, R.H.; Jung, J.; Im, Y.R.; Kwon, J.W. Quality characteristics and antioxidant activity of bokbunja (black raspberry) vinegars. Food Eng. Prog. 2012, 16, 340–346. [Google Scholar]
  41. Mo, H.W.; Jung, Y.H.; Jeong, J.S.; Choi, K.H.; Choi, S.W.; Park, C.S.; Choi, M.A.; Kim, M.L.; Kim, M.S. Quality characteristics of vinegar fermented using omija (Schizandra chinensis Baillon). J. Korean Soc. Food Sci. Nutr. 2013, 42, 441–449. [Google Scholar] [CrossRef]
  42. Ubeda, C.; Hidalgo, C.; Torija, M.J.; Mas, A.; Troncoso, A.M.; Morales, M.L. Evaluation of antioxidant activity and total phenols index in persimmon vinegars produced by different processes. LWT Food Sci. Technol. 2011, 44, 1591–1596. [Google Scholar] [CrossRef]
  43. Abid, H.; Ali, J.; Hussain, A.; Afridi, S.R. Production and quality evaluation of sea buckthorn (Hippophae rhamnoides L.) vinegar using Accetobacter acceti. Pak. J. Biochem. Mol. Biol. 2010, 43, 185–188. [Google Scholar]
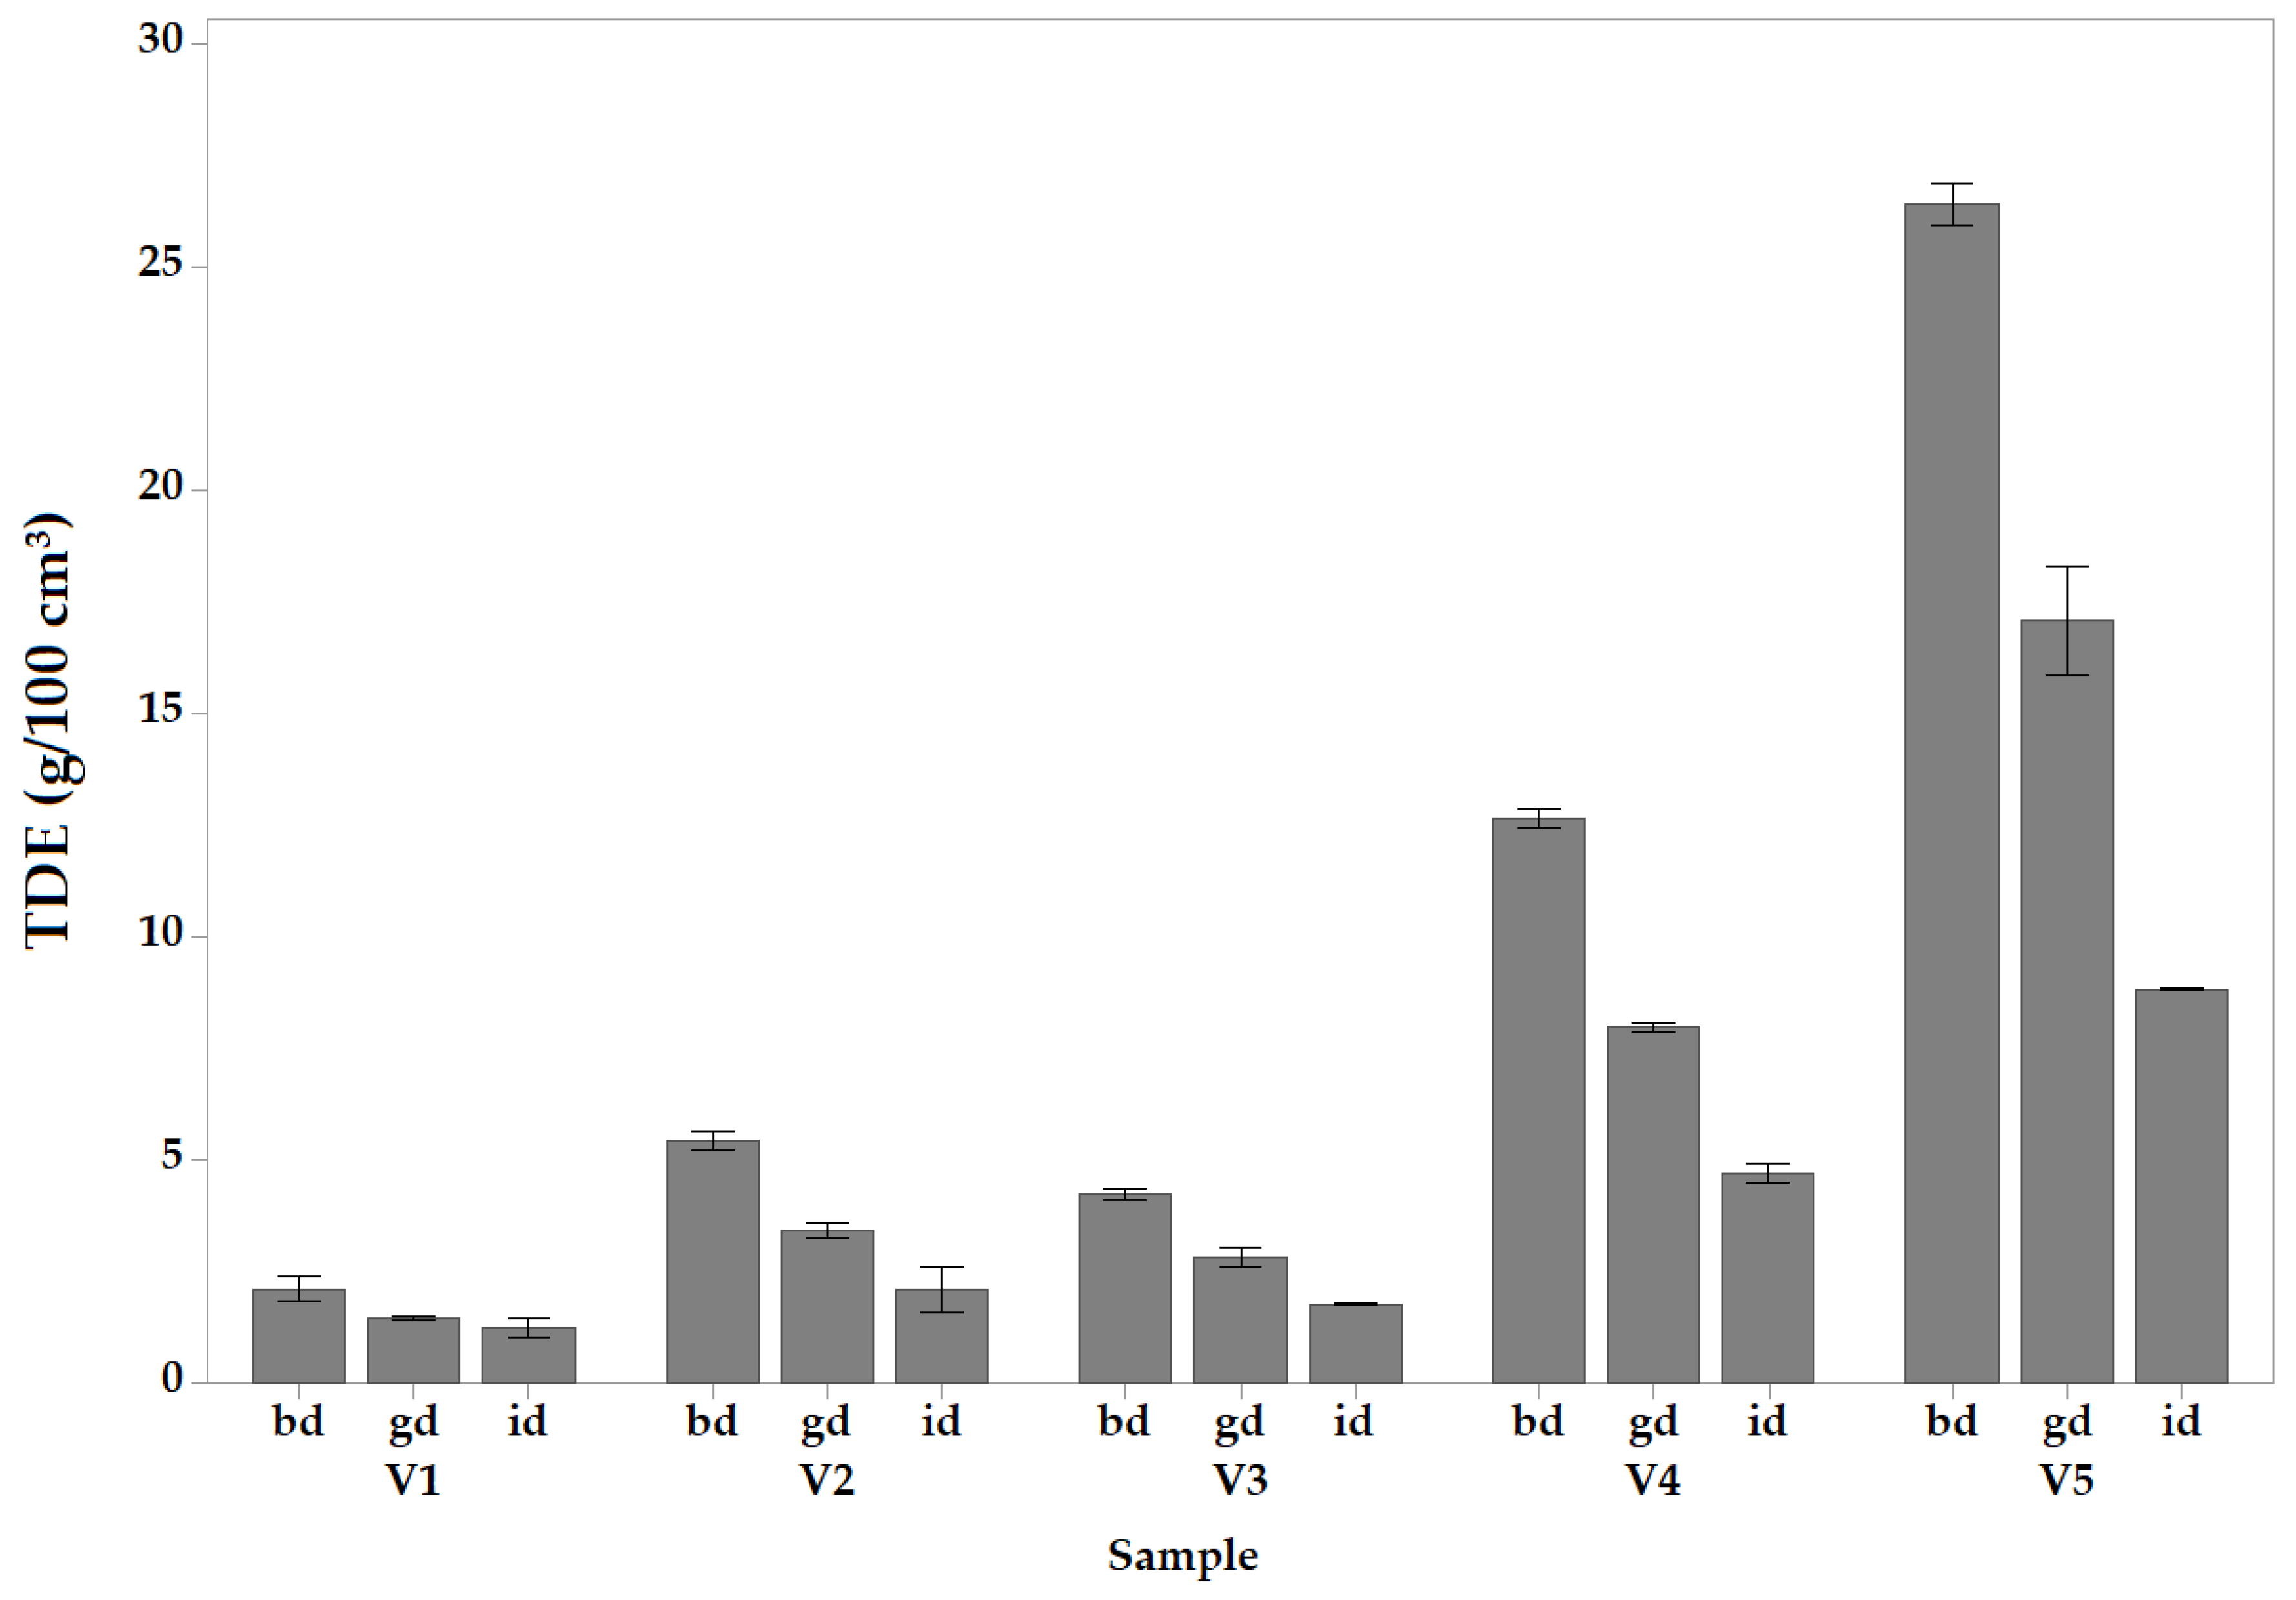
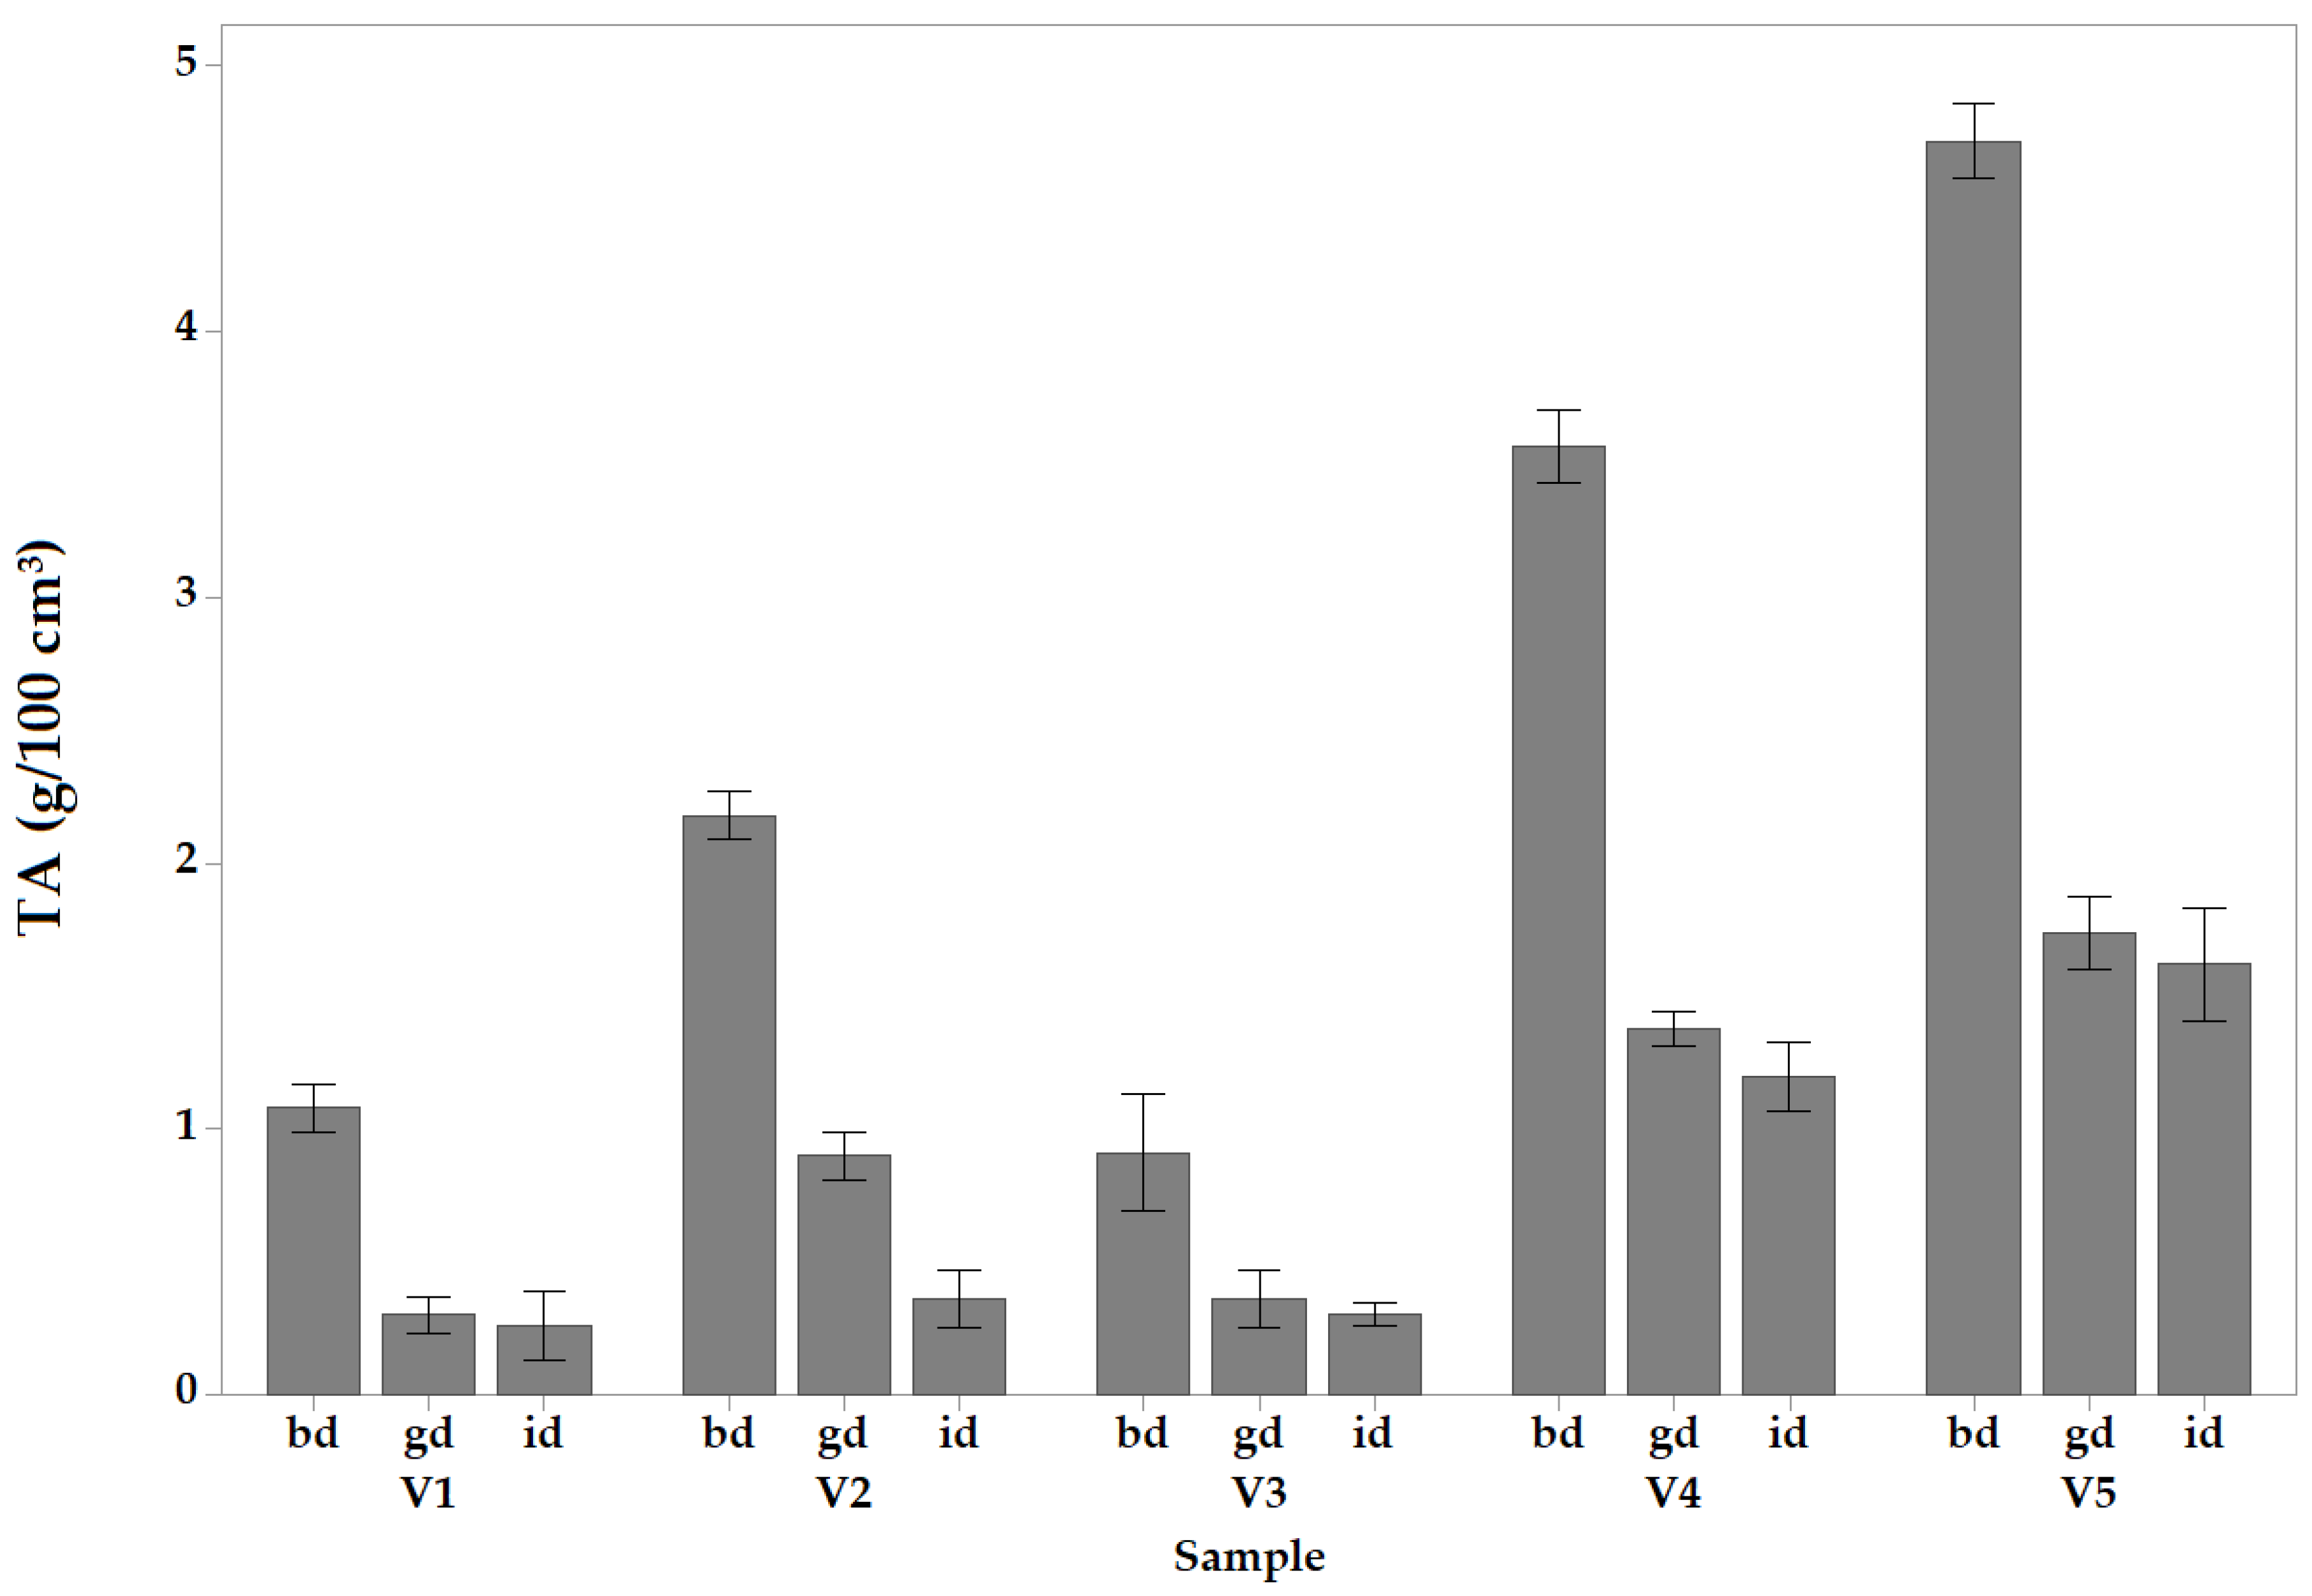
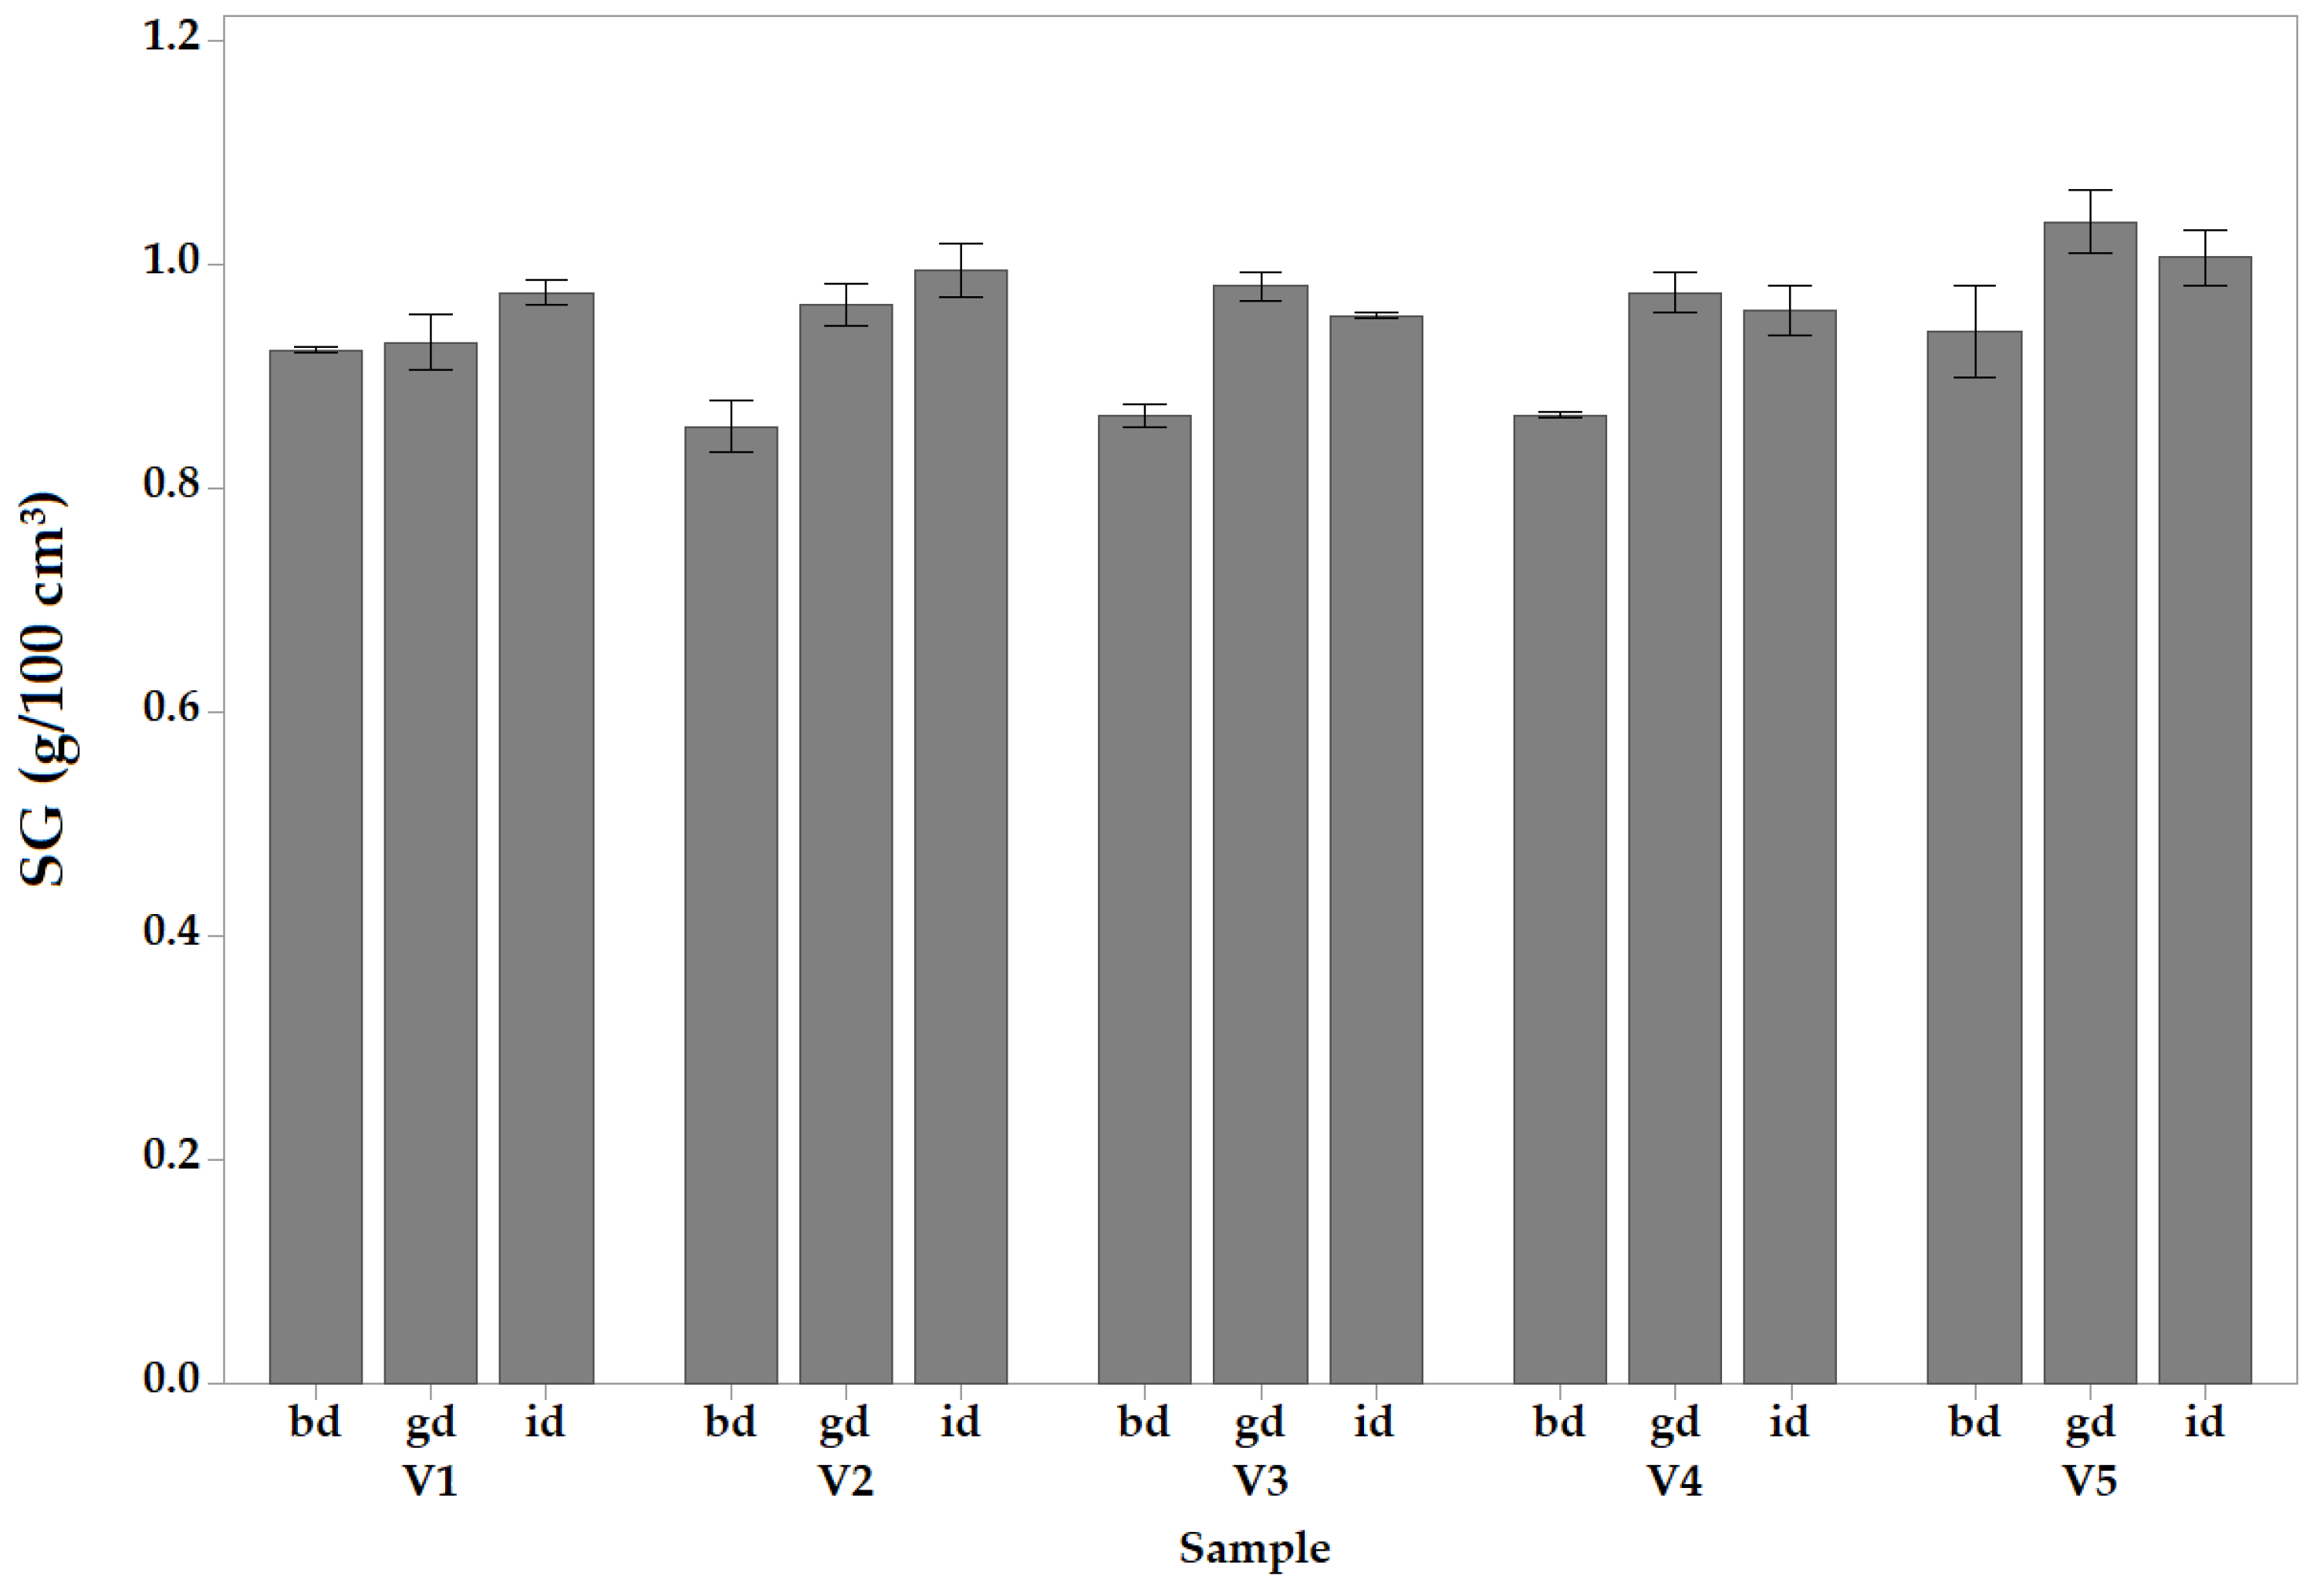
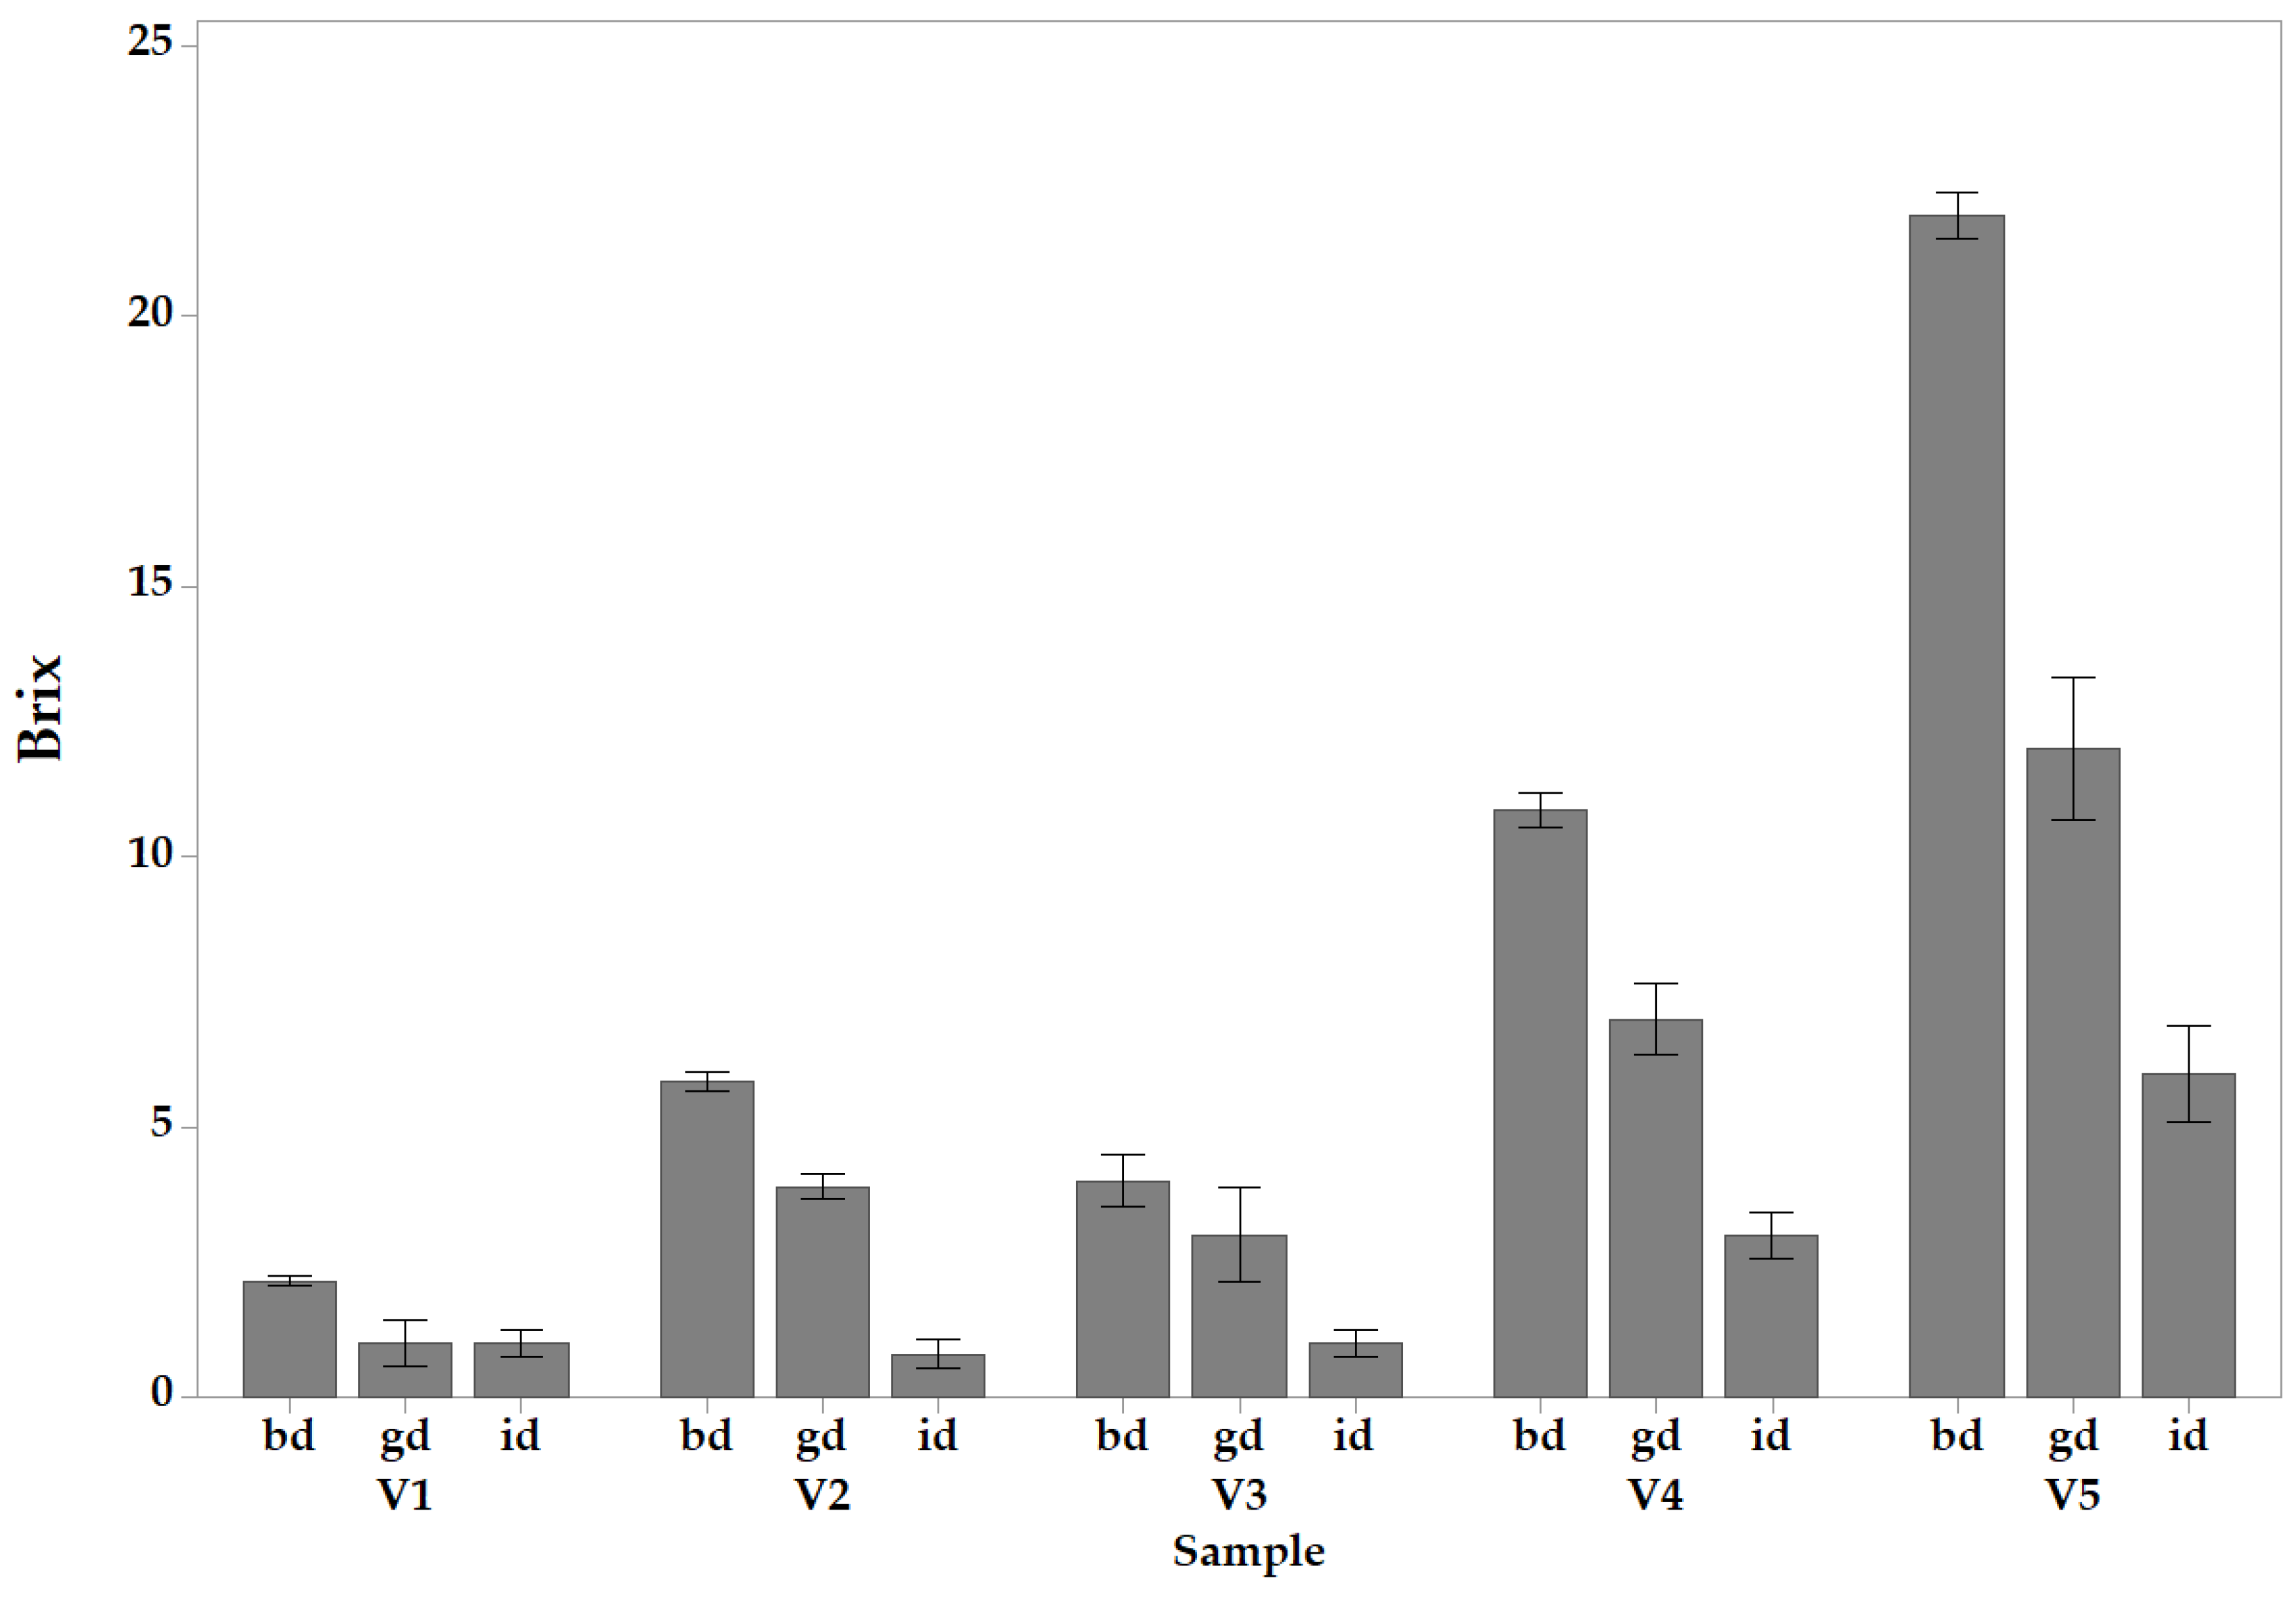
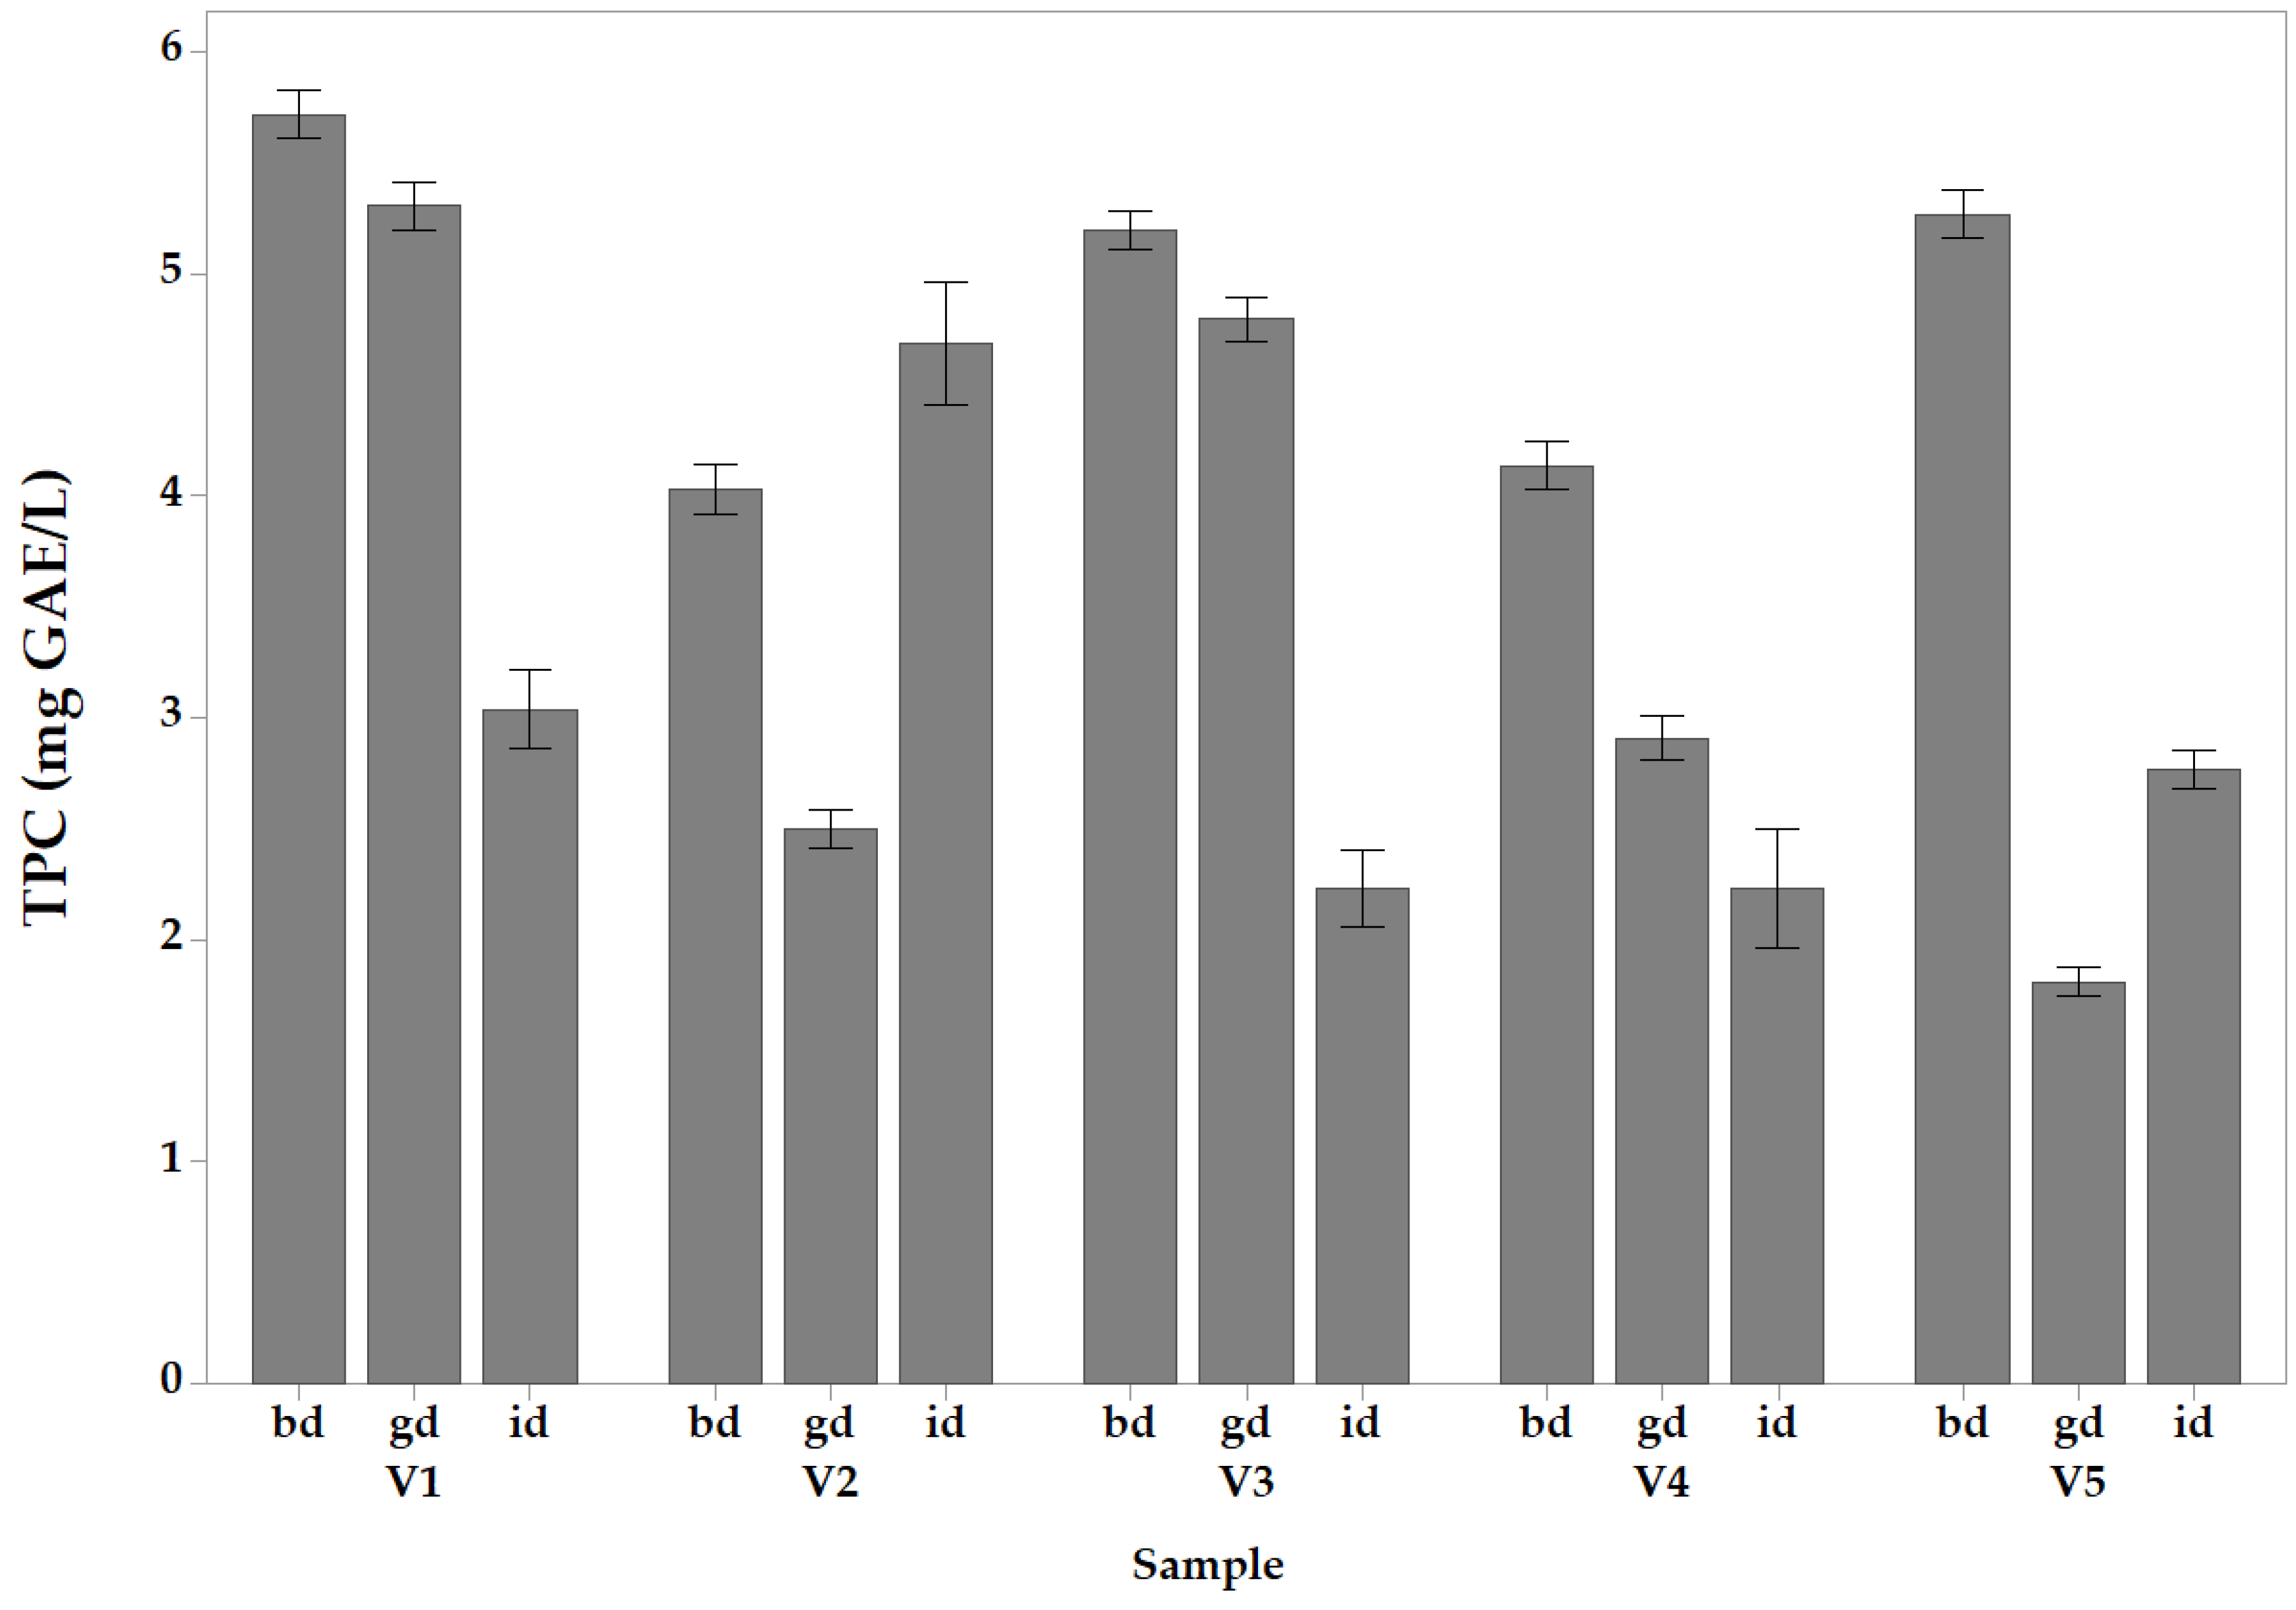
Figure 1. Color parameters of the banana peels and commercial balsamic vinegars: (a) L*; (b) a*; (c) b*.
Processes 09 01193 g001
Figure 2. Interval plots of total dry extract (TDE) vs. samples before digestion (bd); and after gastric digestion (gd); intestinal digestion (id). V1 = banana peel vinegar aged for 1 year, produced without boiling the peels boiling aged for 1 year, V2 = banana peel vinegar aged for 3 years, produced without boiling the peels boiling aged for 3 years, V3 = banana peel vinegar aged for 2 years, produced with peels boiling the peels aged for 2 years, V4 = commercial balsamic vinegar produced from concentrated apple juice and caramel aged in oak barrels for 1 year, V5 = Modena commercial vinegar obtained from concentrated grape must. The error bars represent a 95% confidence interval for the mean.
Processes 09 01193 g002
Figure 3. Interval plots of total acidity (TA) vs. samples before digestion (bd); and after gastric digestion (gd); intestinal digestion (id). V1 = banana peel vinegar aged for 1 year, produced without boiling the peels boiling aged for 1 year, V2 = banana peel vinegar aged for 3 years, produced without boiling the peels boiling aged for 3 years, V3 = banana peel vinegar aged for 2 years, produced with peels boiling the peels aged for 2 years, V4 = commercial balsamic vinegar produced from concentrated apple juice and caramel aged in oak barrels for 1 year, V5 = Modena commercial vinegar obtained from concentrated grape must. The error bars represent a 95% confidence interval for the mean.
Processes 09 01193 g003
Figure 4. Interval plots of specific gravity (SG) vs. samples before digestion (bd); and after gastric digestion (gd); intestinal digestion (id). V1 = banana peel vinegar aged for 1 year, produced without boiling the peels boiling aged for 1 year, V2 = banana peel vinegar aged for 3 years, produced without boiling the peels boiling aged for 3 years, V3 = banana peel vinegar aged for 2 years, produced with peels boiling the peels aged for 2 years, V4 = commercial balsamic vinegar produced from concentrated apple juice and caramel aged in oak barrels for 1 year, V5 = Modena commercial vinegar obtained from concentrated grape must. The error bars represent a 95% confidence interval for the mean.
Processes 09 01193 g004
Figure 5. Interval plots of Brix vs. samples before digestion (bd); and after gastric digestion (gd); intestinal digestion (id). V1 = banana peel vinegar aged for 1 year, produced without boiling the peels boiling aged for 1 year, V2 = banana peel vinegar aged for 3 years, produced without boiling the peels boiling aged for 3 years, V3 = banana peel vinegar aged for 2 years, produced with peels boiling the peels aged for 2 years, V4 = commercial balsamic vinegar produced from concentrated apple juice and caramel aged in oak barrels for 1 year, V5 = Modena commercial vinegar obtained from concentrated grape must. The error bars represent a 95% confidence interval for the mean.
Processes 09 01193 g005
Figure 6. Interval plots of total polyphenol content (TPC) vs. samples before digestion (bd); and after gastric digestion (gd); intestinal digestion (id). V1 = banana peel vinegar aged for 1 year, produced without boiling the peels boiling aged for 1 year, V2 = banana peel vinegar aged for 3 years, produced without boiling the peels boiling aged for 3 years, V3 = banana peel vinegar aged for 2 years, produced with peels boiling the peels aged for 2 years, V4 = commercial balsamic vinegar produced from concentrated apple juice and caramel aged in oak barrels for 1 year, V5 = Modena commercial vinegar obtained from concentrated grape must. The error bars represent a 95% confidence interval for the mean.
Processes 09 01193 g006
Table 1. Physic and biochemical properties of banana peel and commercial balsamic vinegar before and after in vitro digestion.
SampleTotal Dry Extract
(g/cm3)
Total Acidity
(g/cm3)
Specific Gravity
(g/cm3)
Total Soluble Solids
(° Brix)
TPC
(mg GAE/L)
I%
V12.11 e ± 0.1111.08 d ± 0.0360.9243 a ± 0.0012.15 e ± 0.0365.72 a ± 0.04414.69 d ± 0.118
V25.43 c ± 0.0852.18 c ± 0.0360.8558 b ± 0.0095.83 c ± 0.0724.03 c ± 0.04620.19 c ± 0.530
V34.23 d ± 0.0560.91 e ± 0.0890.8662 b ± 0.0044.0 d ± 0.1915.20 b ± 0.03560.92 a ± 0.098
V412.66 b ± 0.0823.57 b ± 0.0560.8853 b ± 0.00110.87 b ± 0.1314.14 c ± 0.04425.29 b ± 0.820
V526.43 a ± 0.1824.72 a ± 0.0560.9412 a ± 0.01721.87 a ± 0.1715.27 b ± 0.0445.42 e ± 0.046
Means that do not share a letter are significantly different.
V1g.d.1.454 e ± 0.0190.3 d ± 0.0260.9311 c ± 0.0101.0 e ± 0.1735.31 a ± 0.04431.59 b ± 0.380
V2g.d.3.426 c ± 0.0750.9 c ± 0.0360.9654 b ± 0.0083.9 c ± 0.0982.5 d ± 0.03525.63 c ± 0.161
V3g.d.2.81 d ± 0.0890.36 d ± 0.0440.9813 b ± 0.0053.0 d ± 0.3534.8 b ± 0.04031.40 b ± 0.053
V4g.d.7.98 b ± 0.0461.38 b ± 0.0260.9756 b ± 0.0077.0 b ± 0.2652.91 c ± 0.04013.92 d ± 0.911
V5g.d.17.088 a ± 0.4871.74 a ± 0.0561.0392 a ± 0.01212.0 a ± 0.5291.81 e ± 0.02674.96 a ± 0.262
Means that do not share a letter are significantly different.
V1i.d.1.228 e ± 0.0840.26 c ± 0.0530.9754 b,c ± 0.0051.0 c ± 0.1053.04 b ± 0.07280.24 c ± 0.062
V2i.d.2.1 c ± 0.2110.36 c ± 0.0440.995 a, b ± 0.0100.8 c ± 0.1064.69 a ± 0.11187.77 a ± 0.219
V3i.d.1.774 d ± 0.0120.3 c ± 0.0170.955 c ± 0.0011.0 c ± 0.1052.23 d ± 0.07088.26 a ± 0.348
V4i.d.4.694 b ± 0.0881.2 b ± 0.0520.9595 c ± 0.0093.0 b ± 0.1762.17 d ± 0.10892.94 a ± 0.250
V5i.d.8.826 a ± 0.0111.62 a ± 0.0851.007 a ± 0.0106.0 a ± 0.3612.77 c ± 0.03586.36 b ± 0.070
Means that do not share a letter are significantly different.
Different lowercase letters (a–e) in a row show significant differences between the groups (p < 0.05).
Table 2. Mineral content of banana peel and commercial balsamic vinegars studied.
Mineral Substance Sample
V1V2V3V4V5
Se2.82 e ± 0.0262.54 d,e ± 0.0302.89 e ± 0.0170.07 e ± 0.0100.14 d ± 0.017
Cr3.63 d,e ± 0.0203.26 d,e ± 0.0263.72 d,e ± 0.0170.04 e ± 0.0100.12 d ± 0.010
Cu3.01 d,e ± 0.0622.79 d,e ± 0.1253.11 e ± 0.1080.05 e ± 0.0090.33 d ± 0.035
Mg113.31 b ± 0.370105.06 b ± 0.986114.29 b ± 0.7197.12 c ± 0.123111.90 b ± 1.115
Co0.01 f ± 0.00020.02 e ± 0.0100.01 f ± 0.0050.00 e0.00 d
Zn0.764 f ± 0.0190.569 d,e ± 0.0160.812 f ± 0.0013.61 d ± 0.0452.38 d ± 0.096
Na186.06 a ± 1.107168.01 a ± 3.527187.54 b ± 0.79526.12 b ± 0.30414.69 c ± 0.856
Ca12.02 c ± 0.28811.89 c ± 0.29612.34 c ± 0.735104.21 a ± 0.593148.94 a ± 8.756
Ni0.14 f ± 0.0170.12 e ± 0.0100.15 f ± 0.0100.11 e ± 0.0170.07 d ± 0.016
Mn4.01 d ± 0.1873.78 d ± 0.1784.36 d ± 0.1610.09 e ± 0.0180.11 d ± 0.017
Different lowercase letters (a–f) in a row show significant differences between the groups (p < 0.05).
Publisher’s Note: MDPI stays neutral with regard to jurisdictional claims in published maps and institutional affiliations.

