
A Novel Evolutionary Arithmetic Optimization Algorithm for Multilevel Thresholding Segmentation of COVID-19 CT Images


Abstract
:1. Introduction
2. The Proposed Method
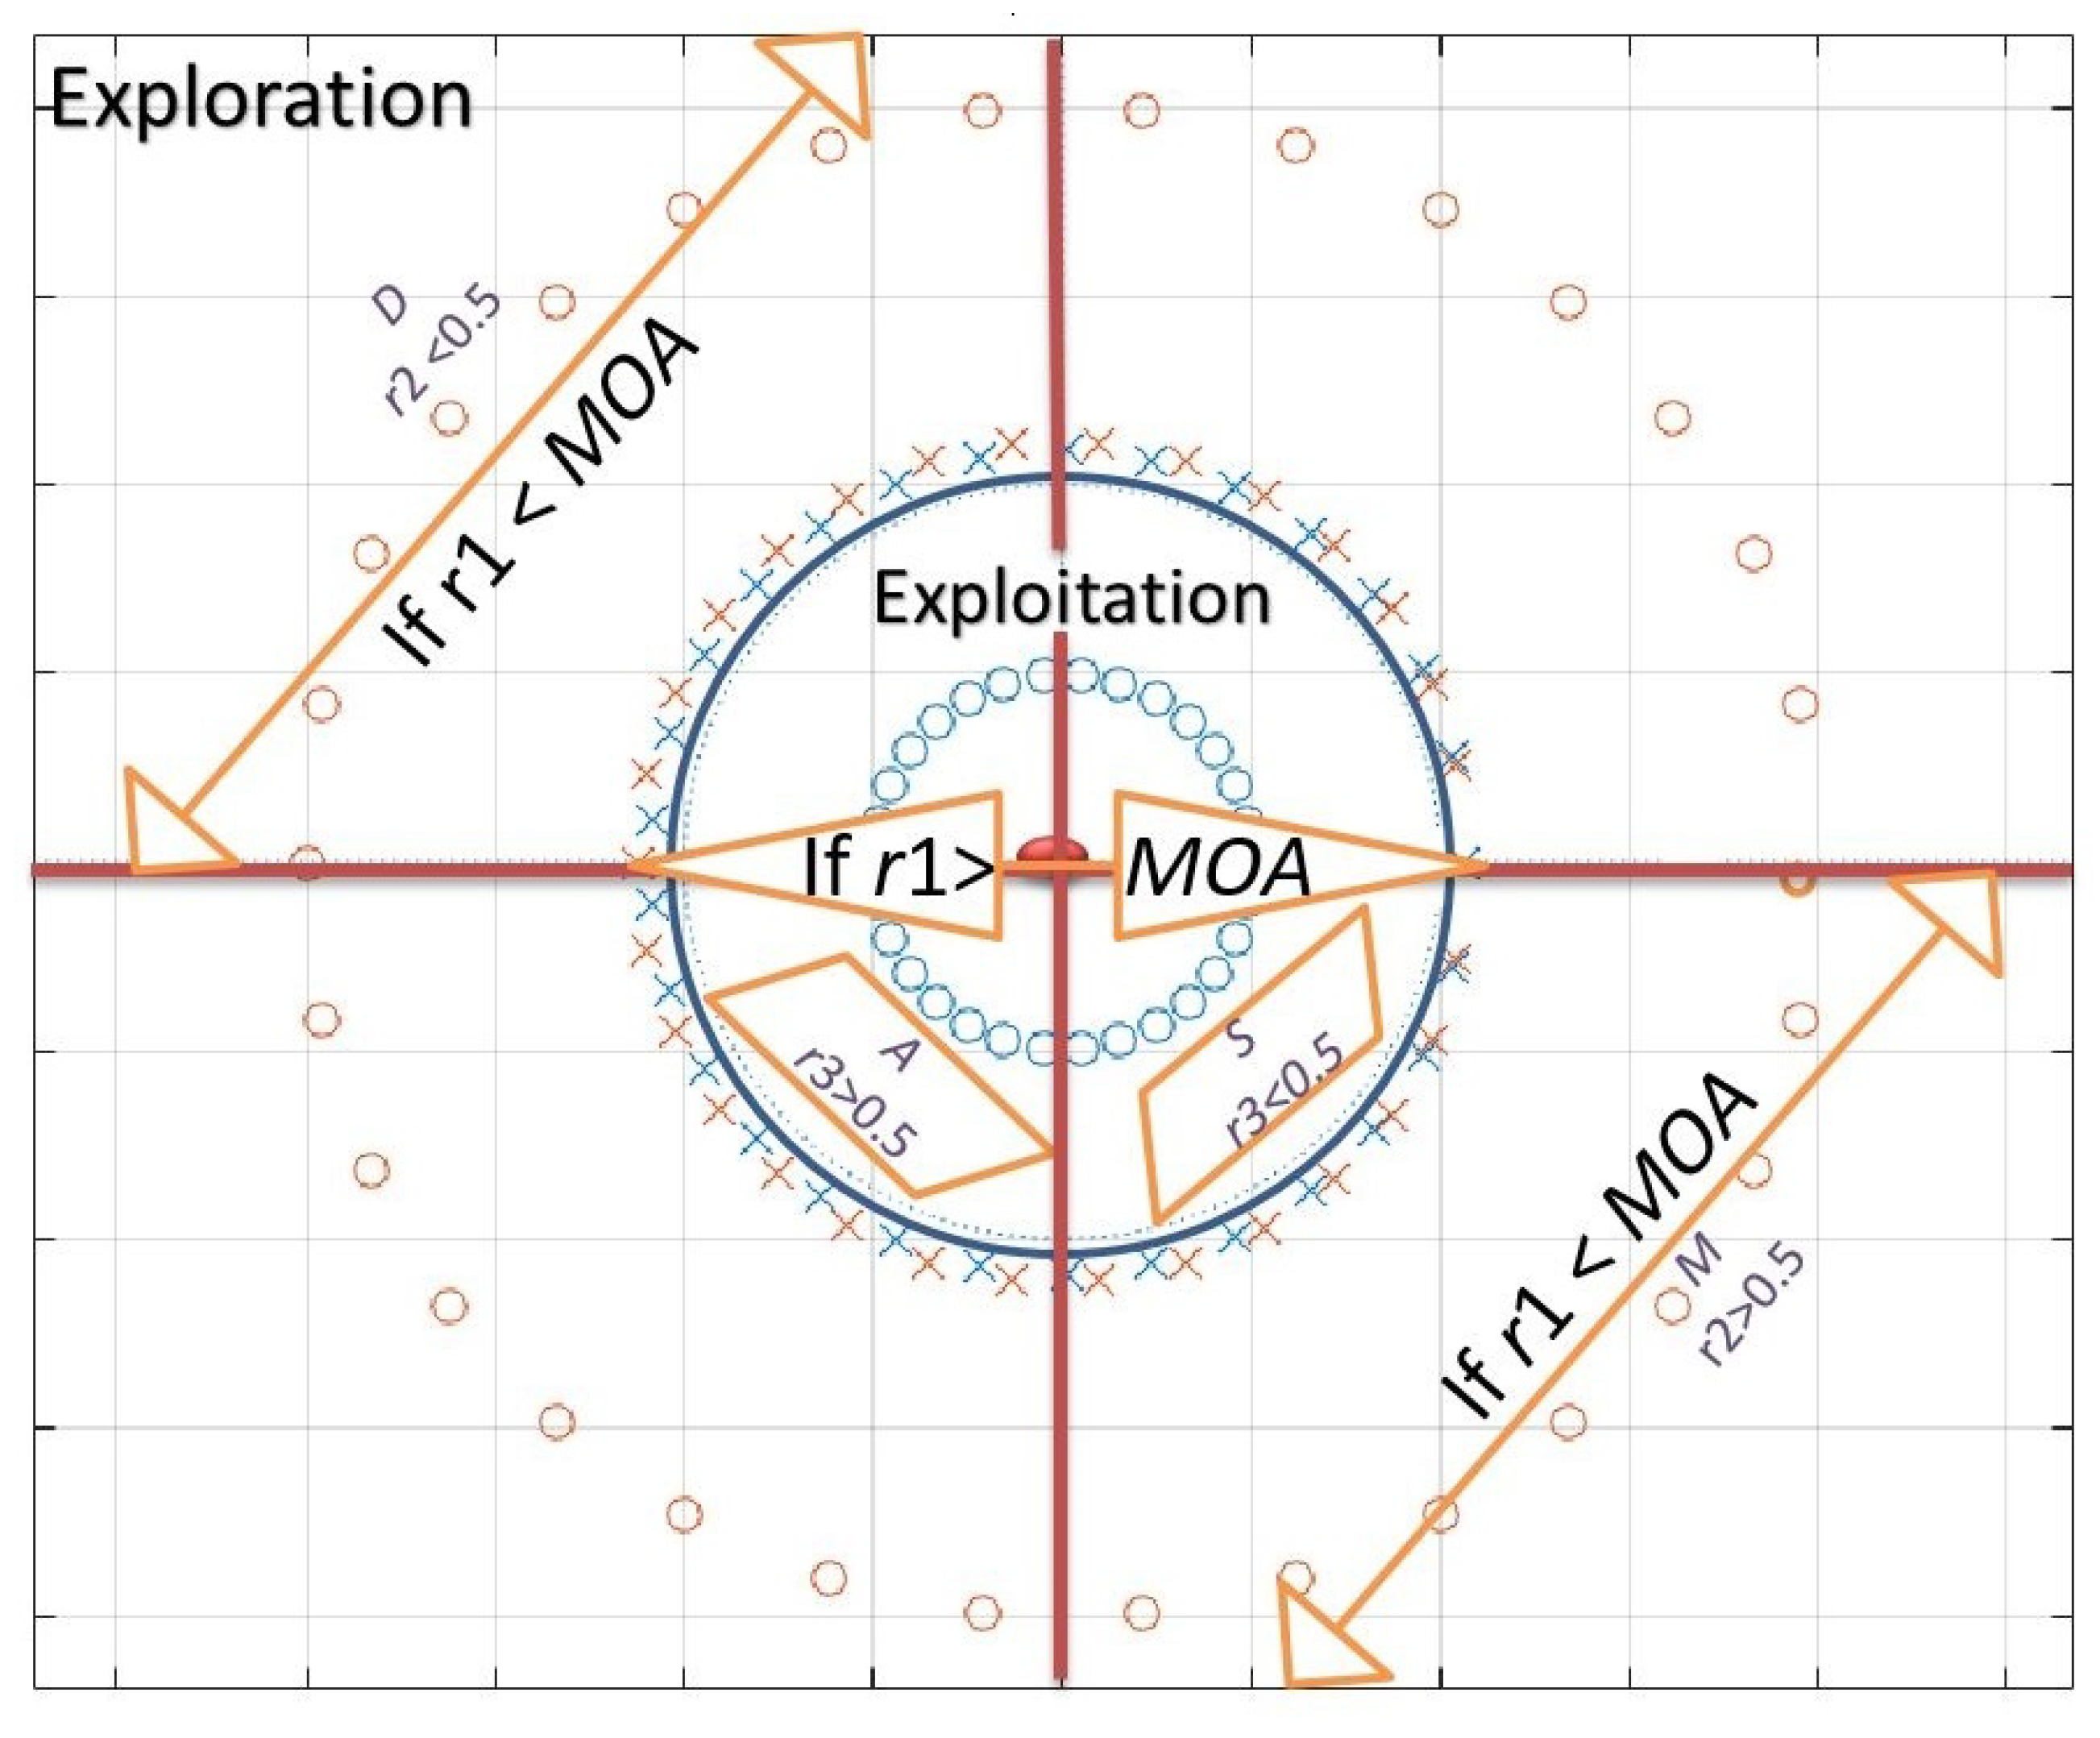
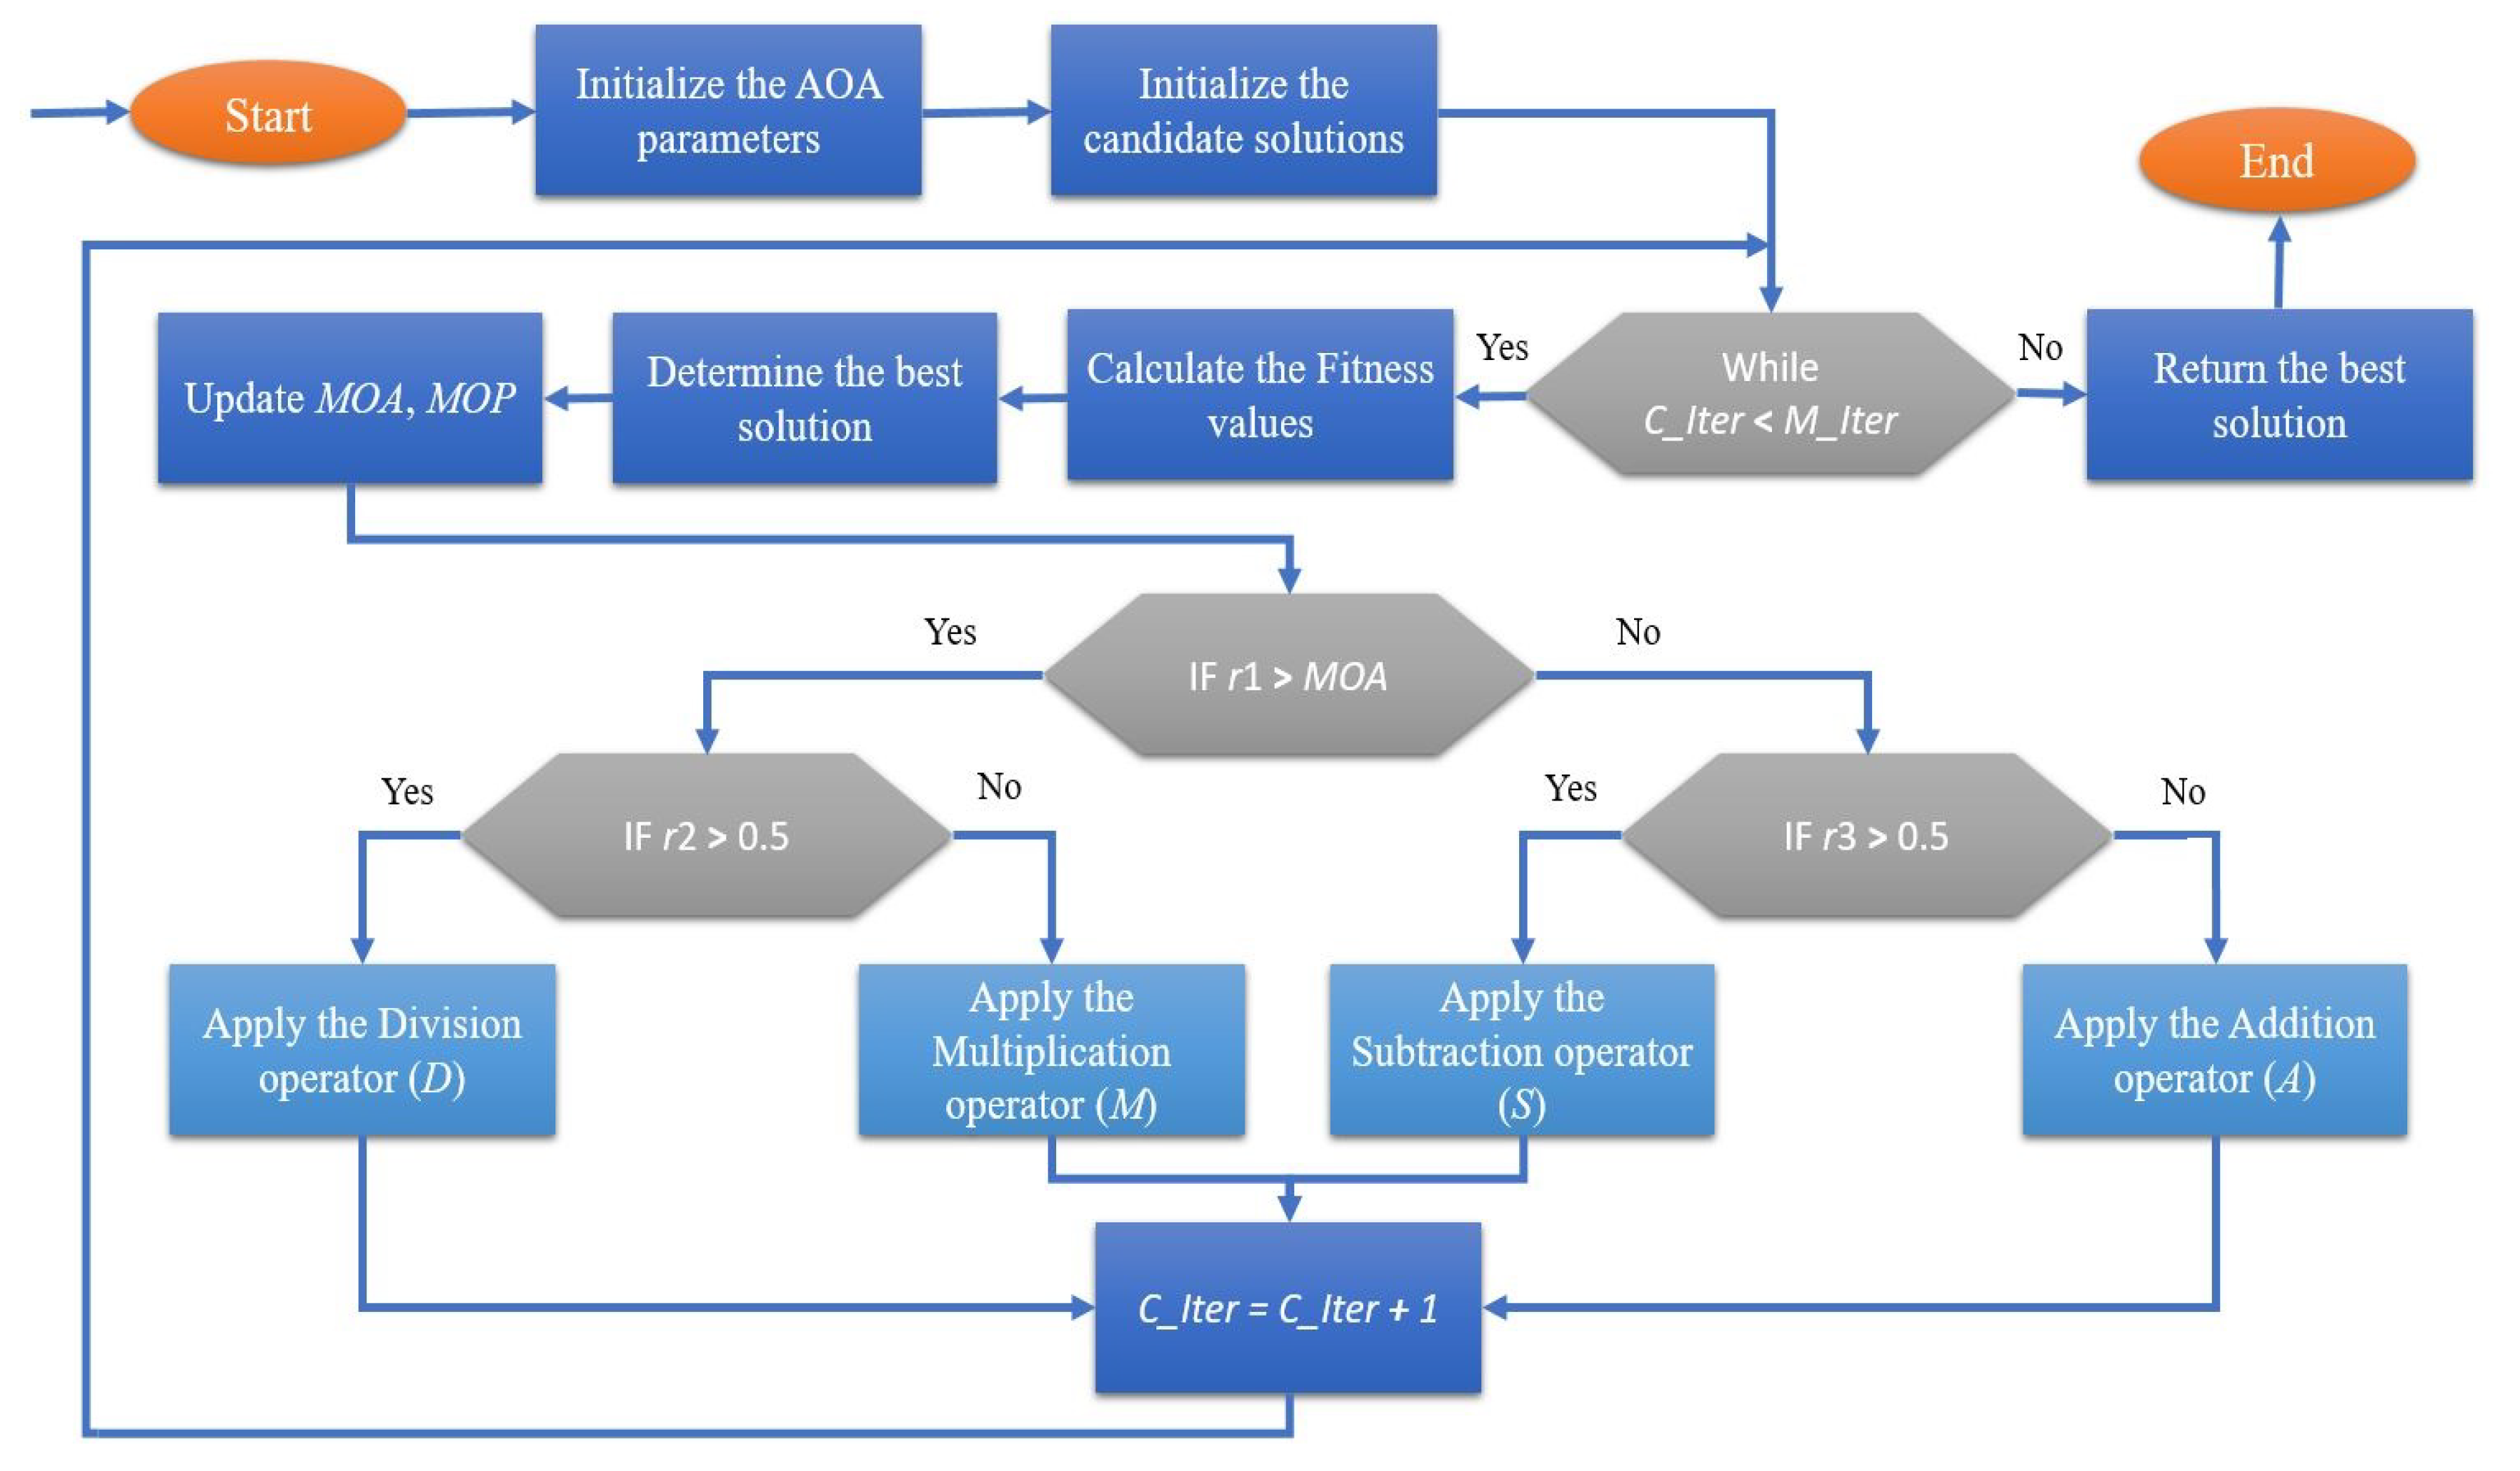
2.1. Arithmetic Optimization Algorithm (AOA)
2.1.1. Exploration Phase
2.1.2. Exploitation Phase
2.2. Differential Evolution (DE)
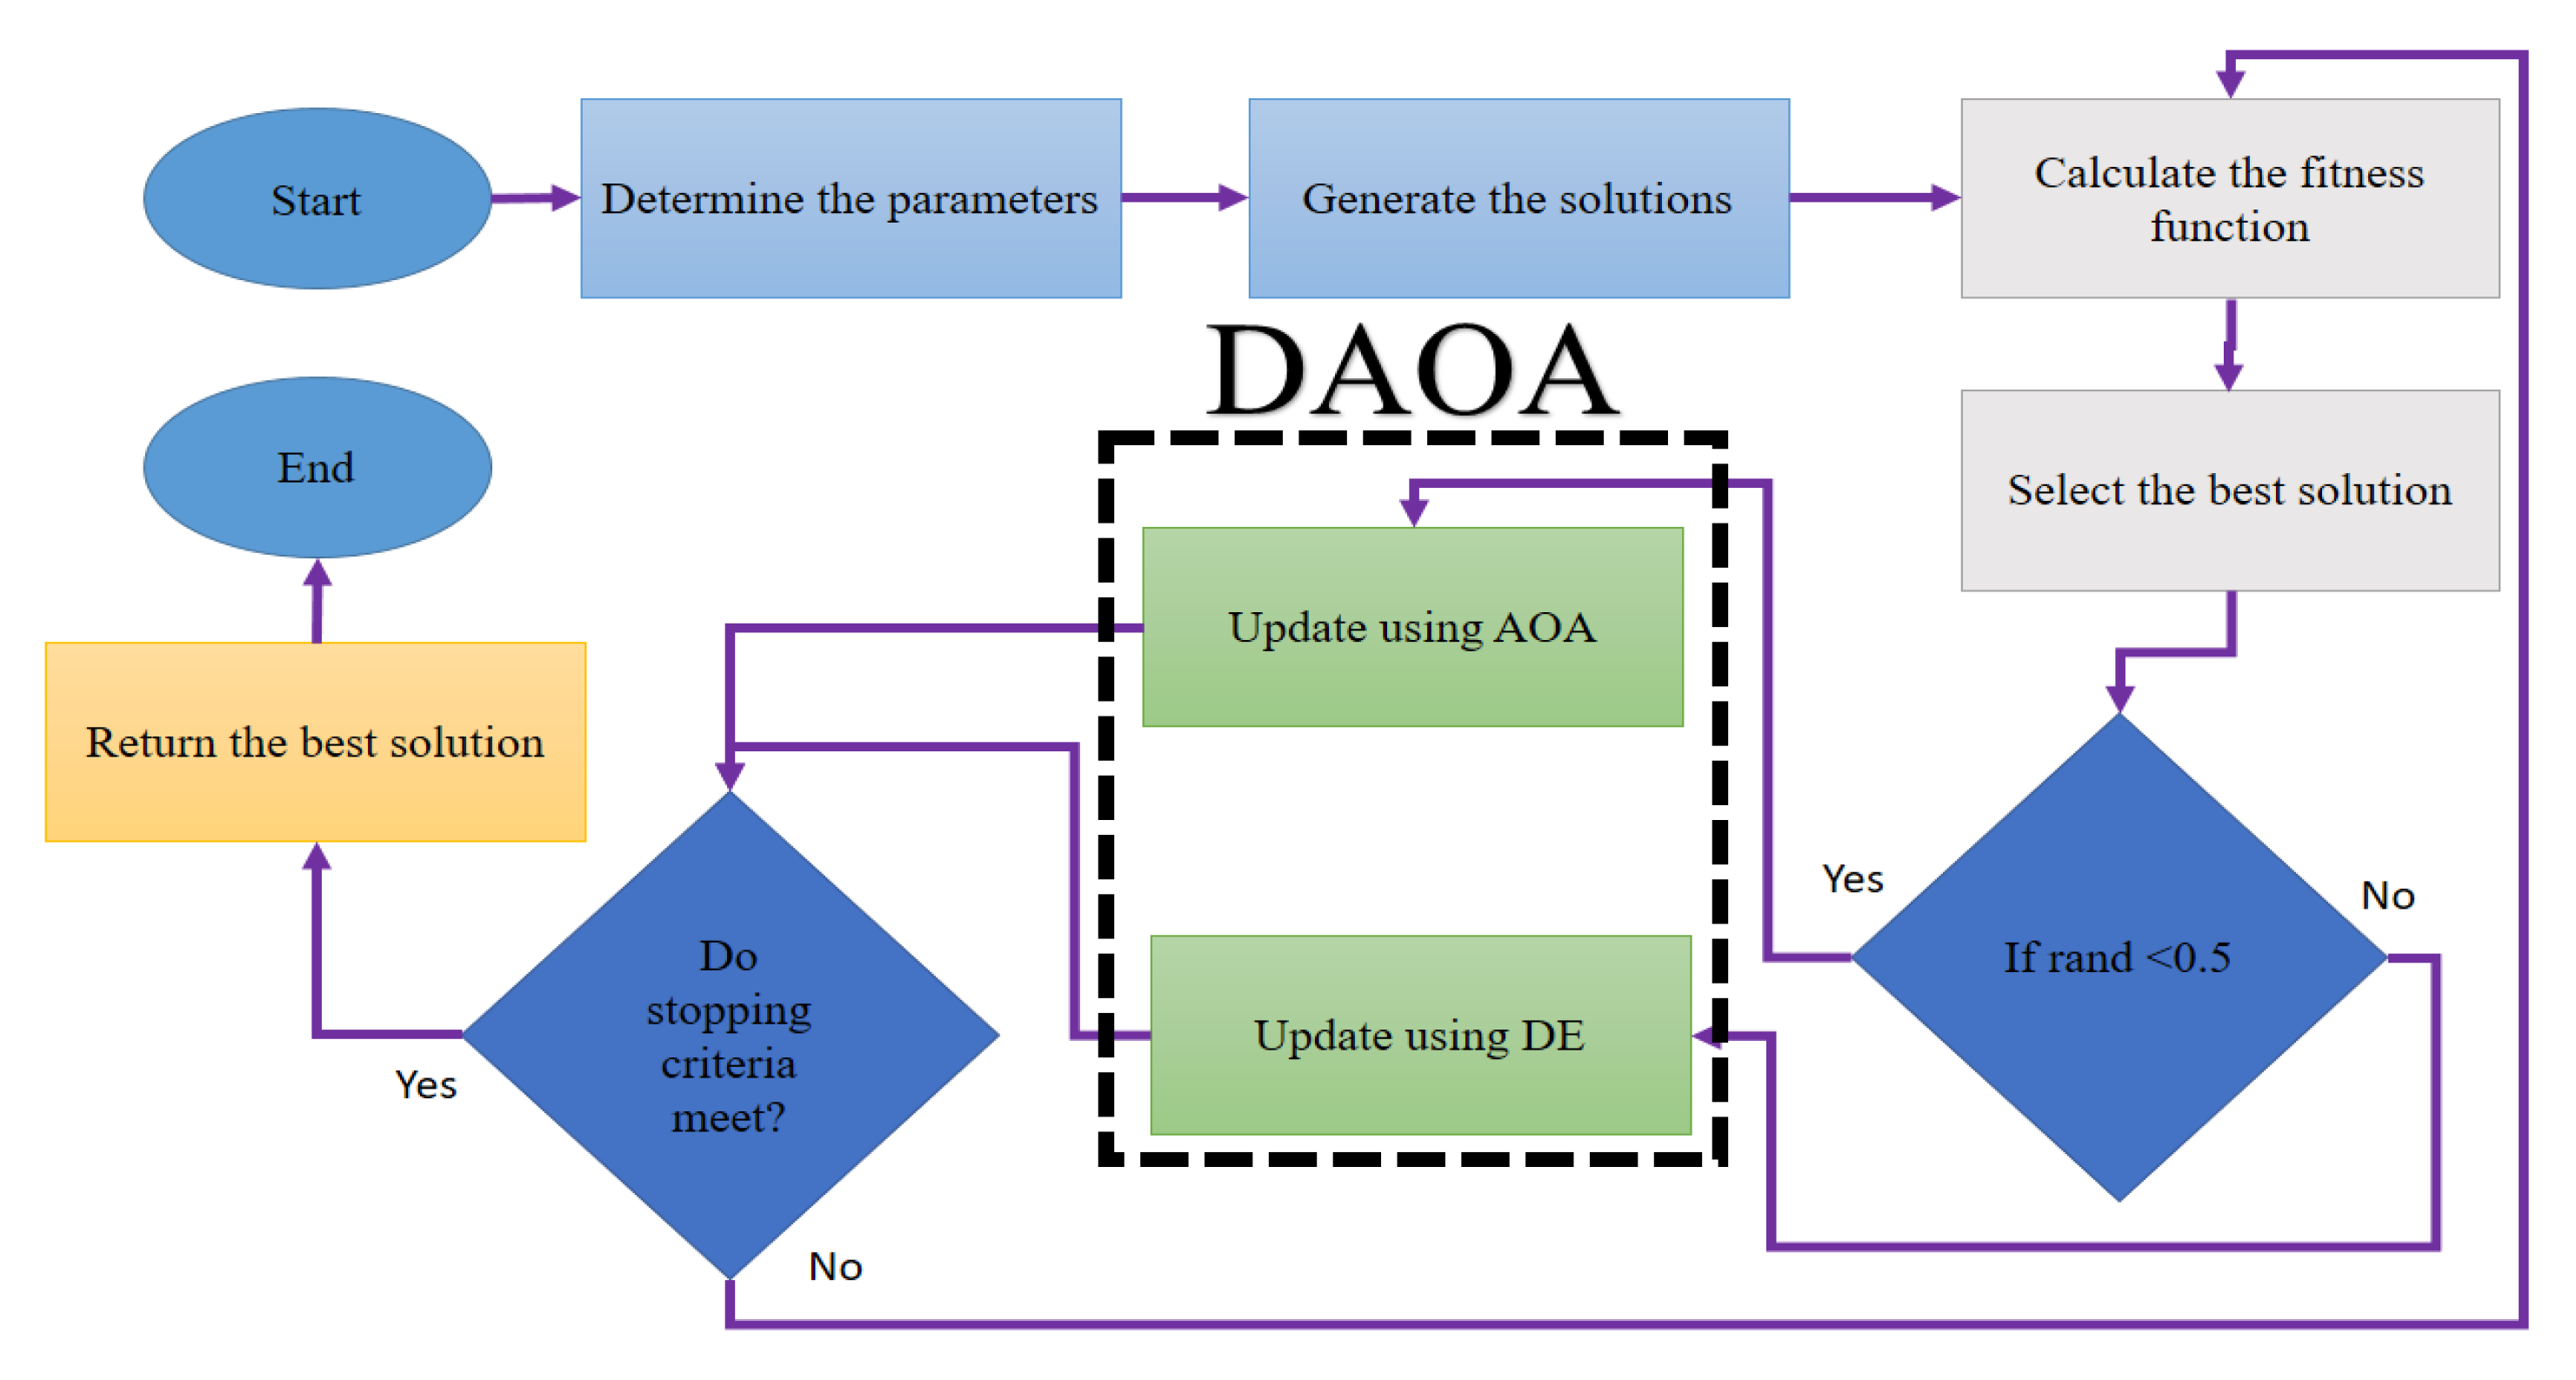
2.3. The Proposed DAOA
2.3.1. Initialization Phase
2.3.2. Phases of the Proposed DAOA
| Algorithm 1 Pseudo-code of the DAOA algorithm |
|
3. Definitions of the Multilevel Thresholding Image Segmentation Problems
3.1. Fitness Function (Kapur’s Entropy)
3.2. Performance Measures
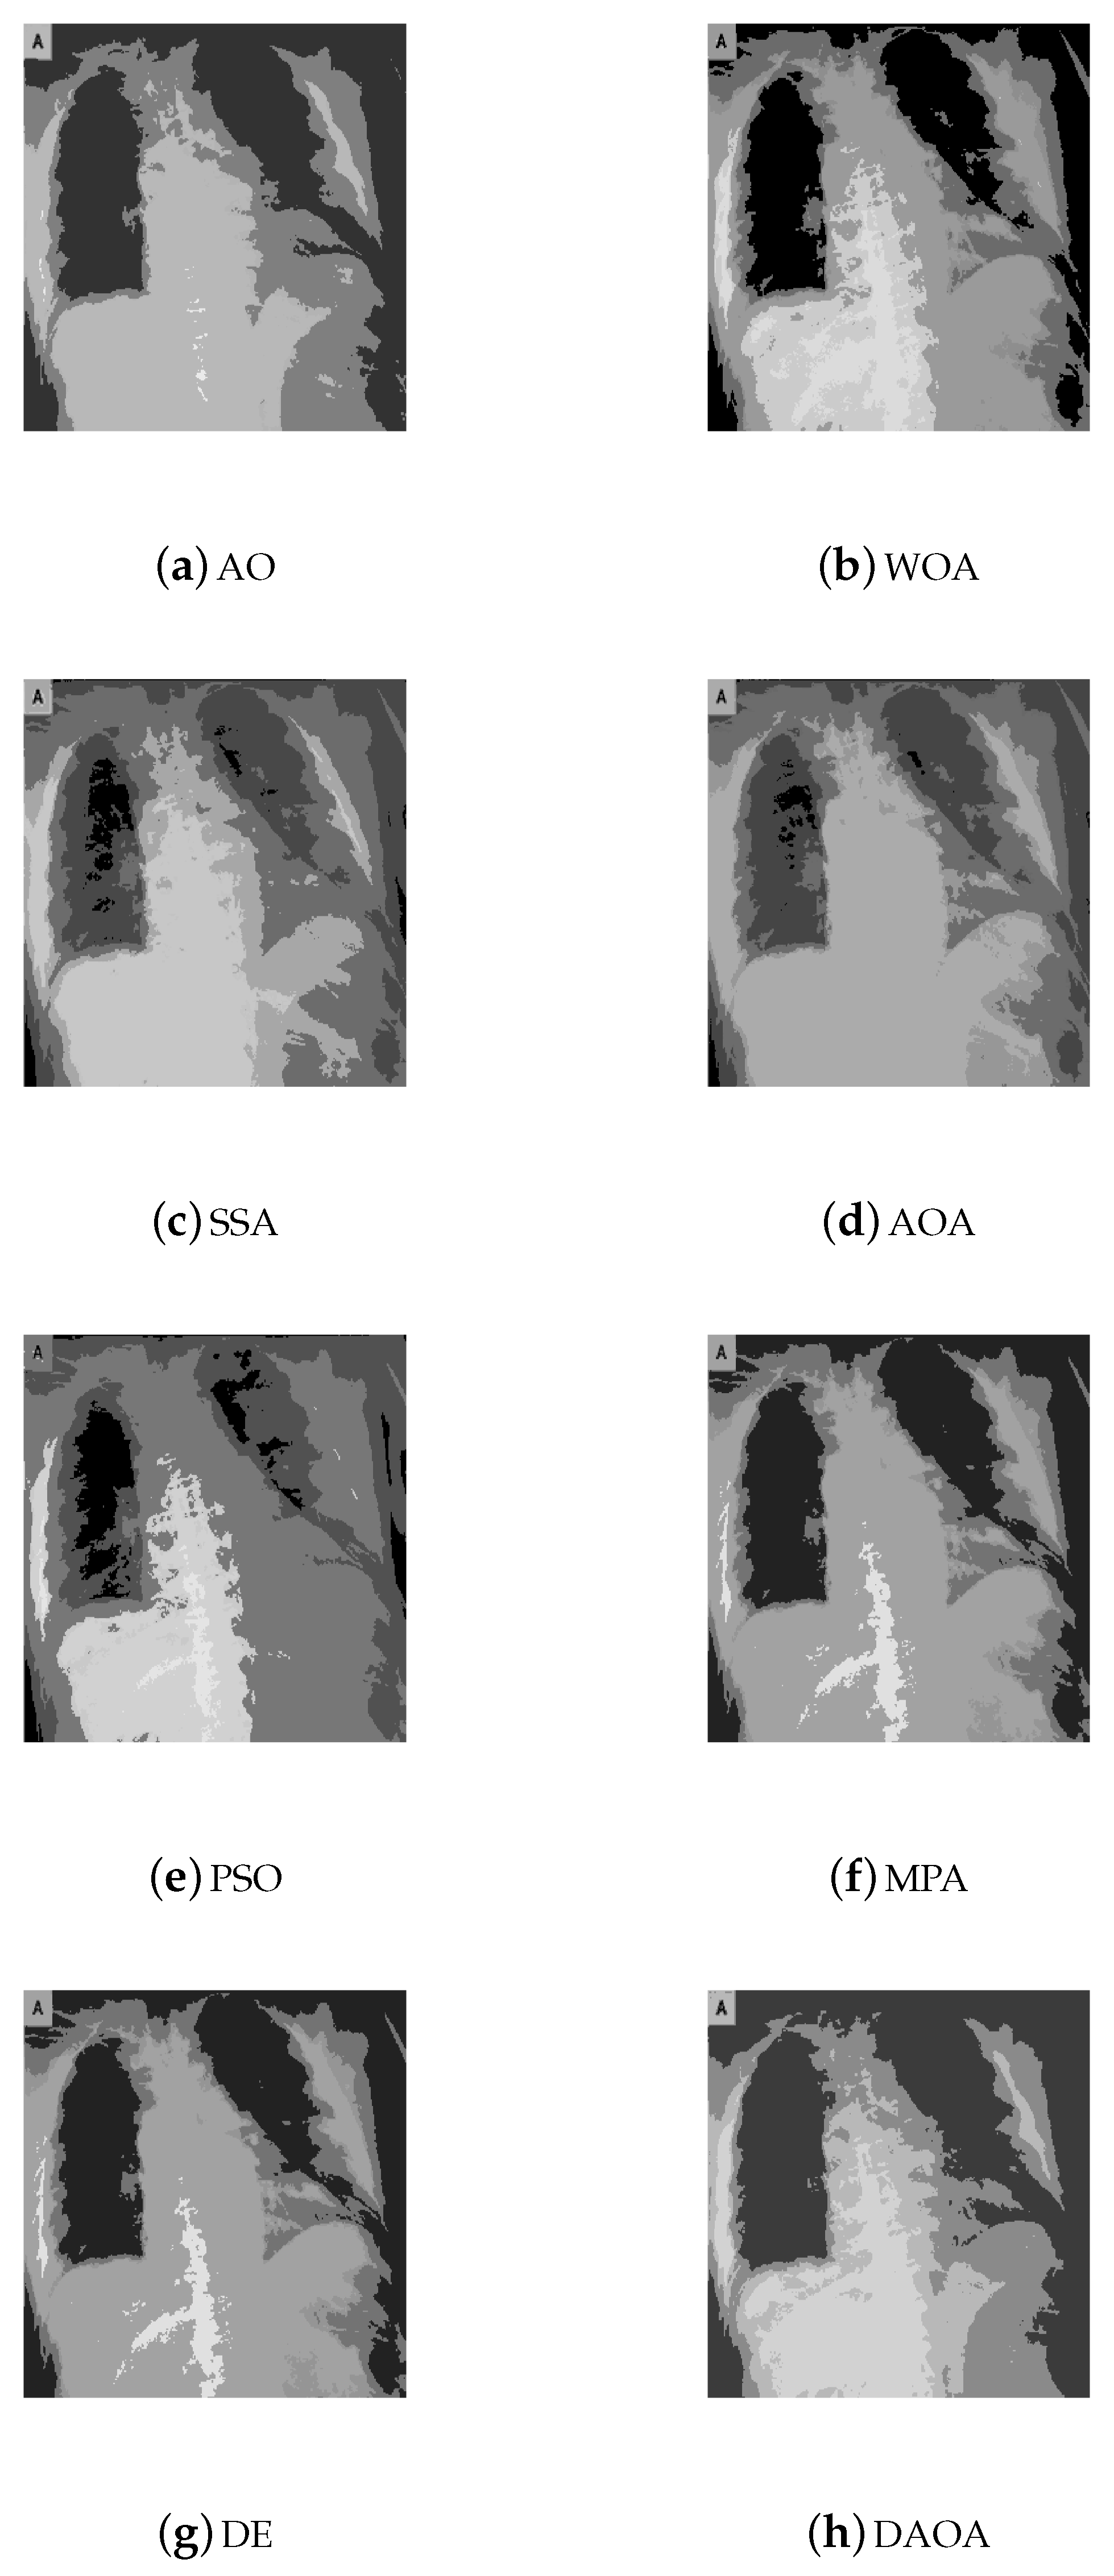
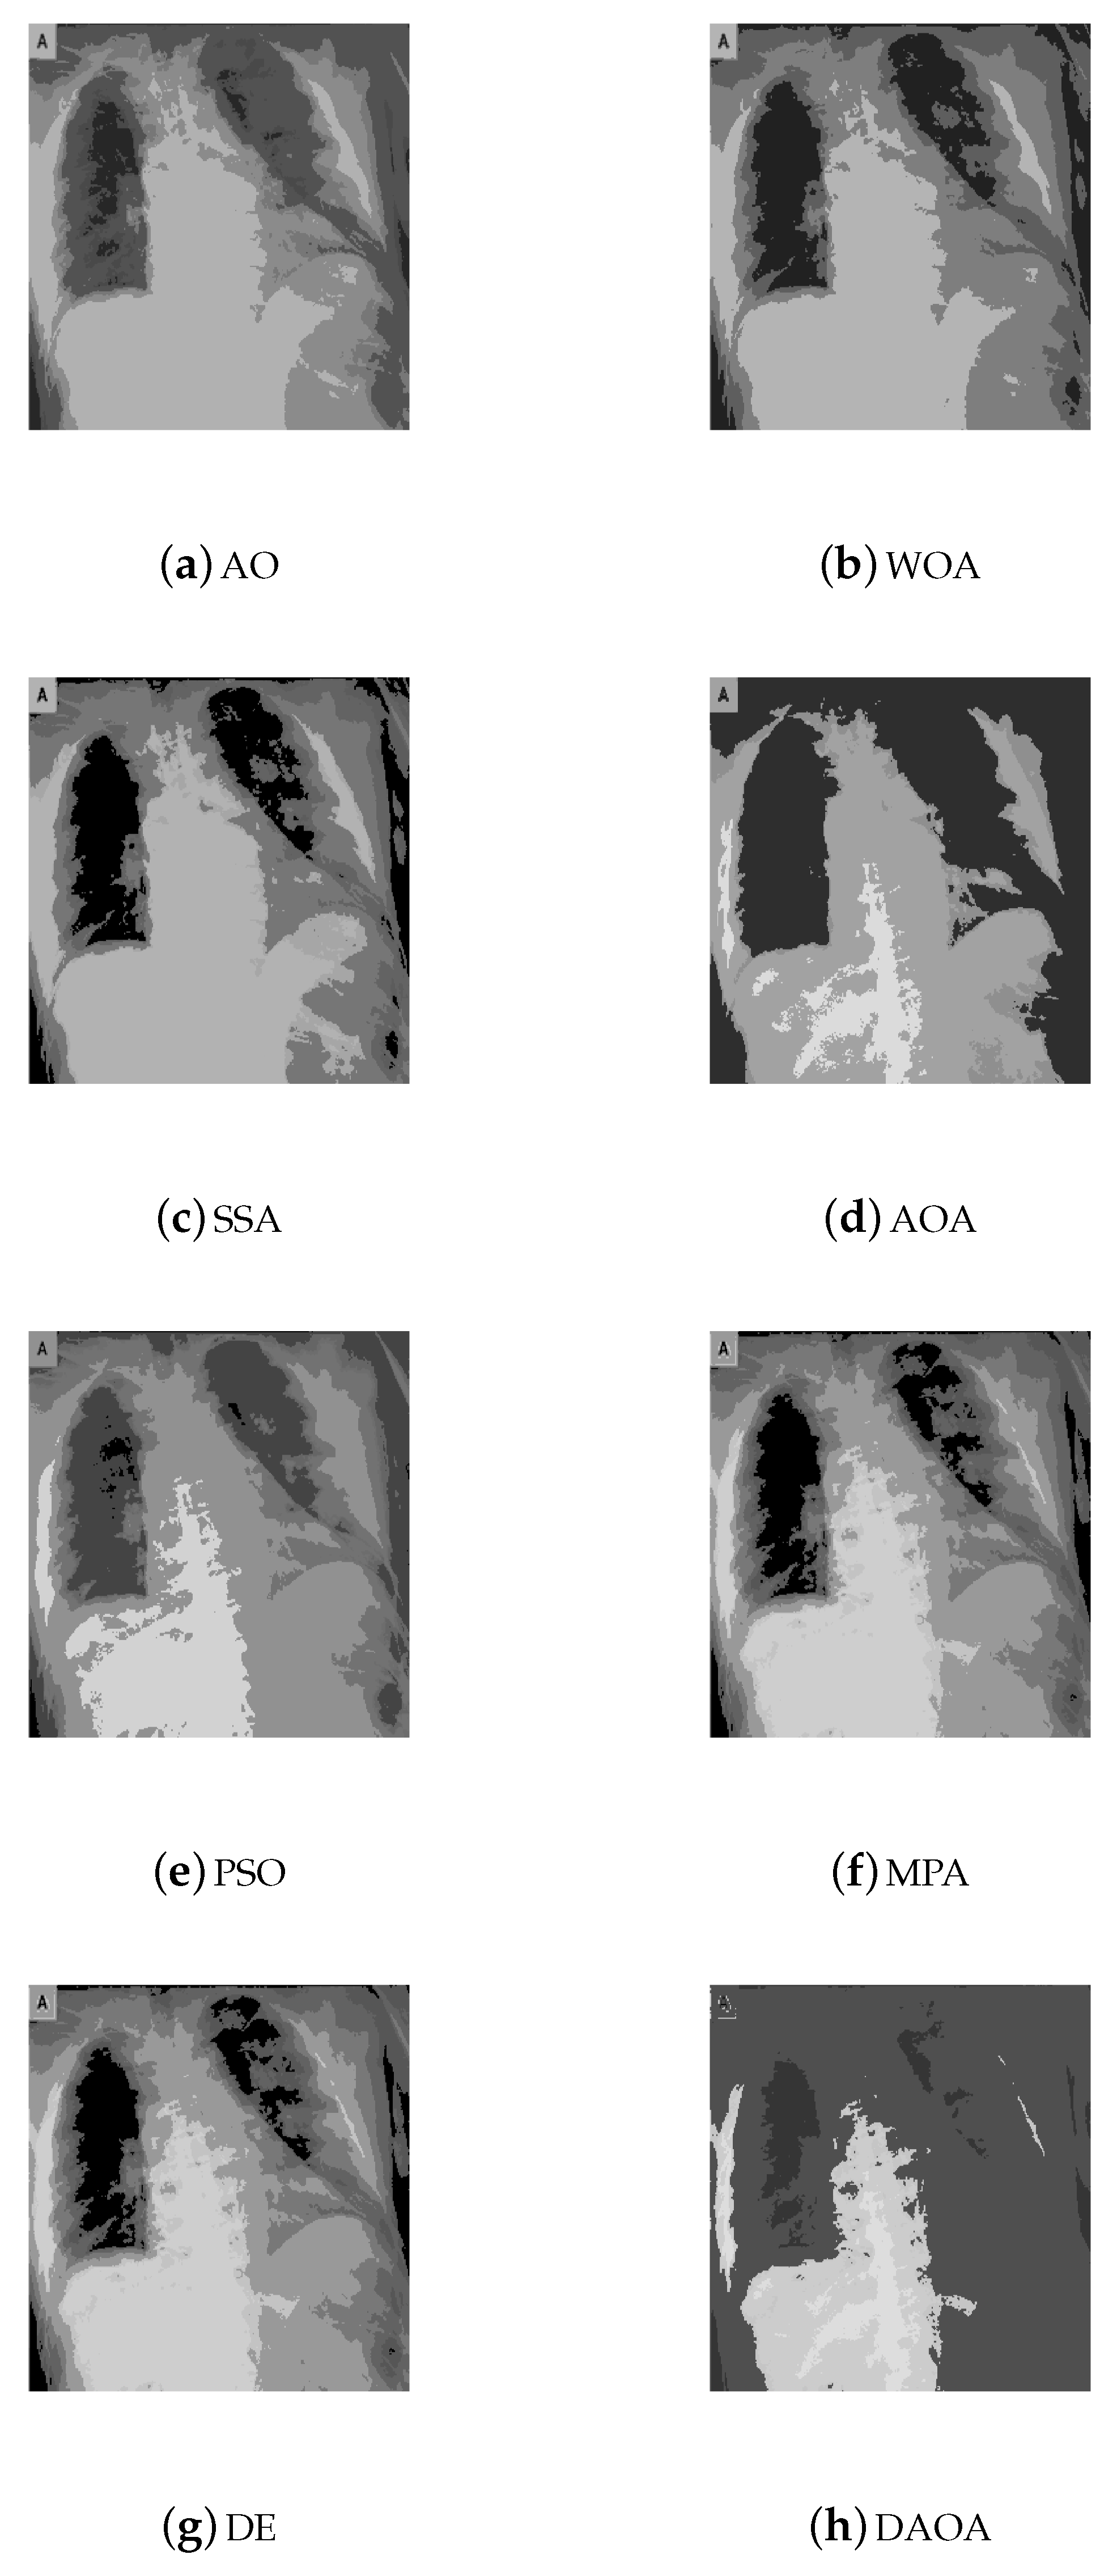
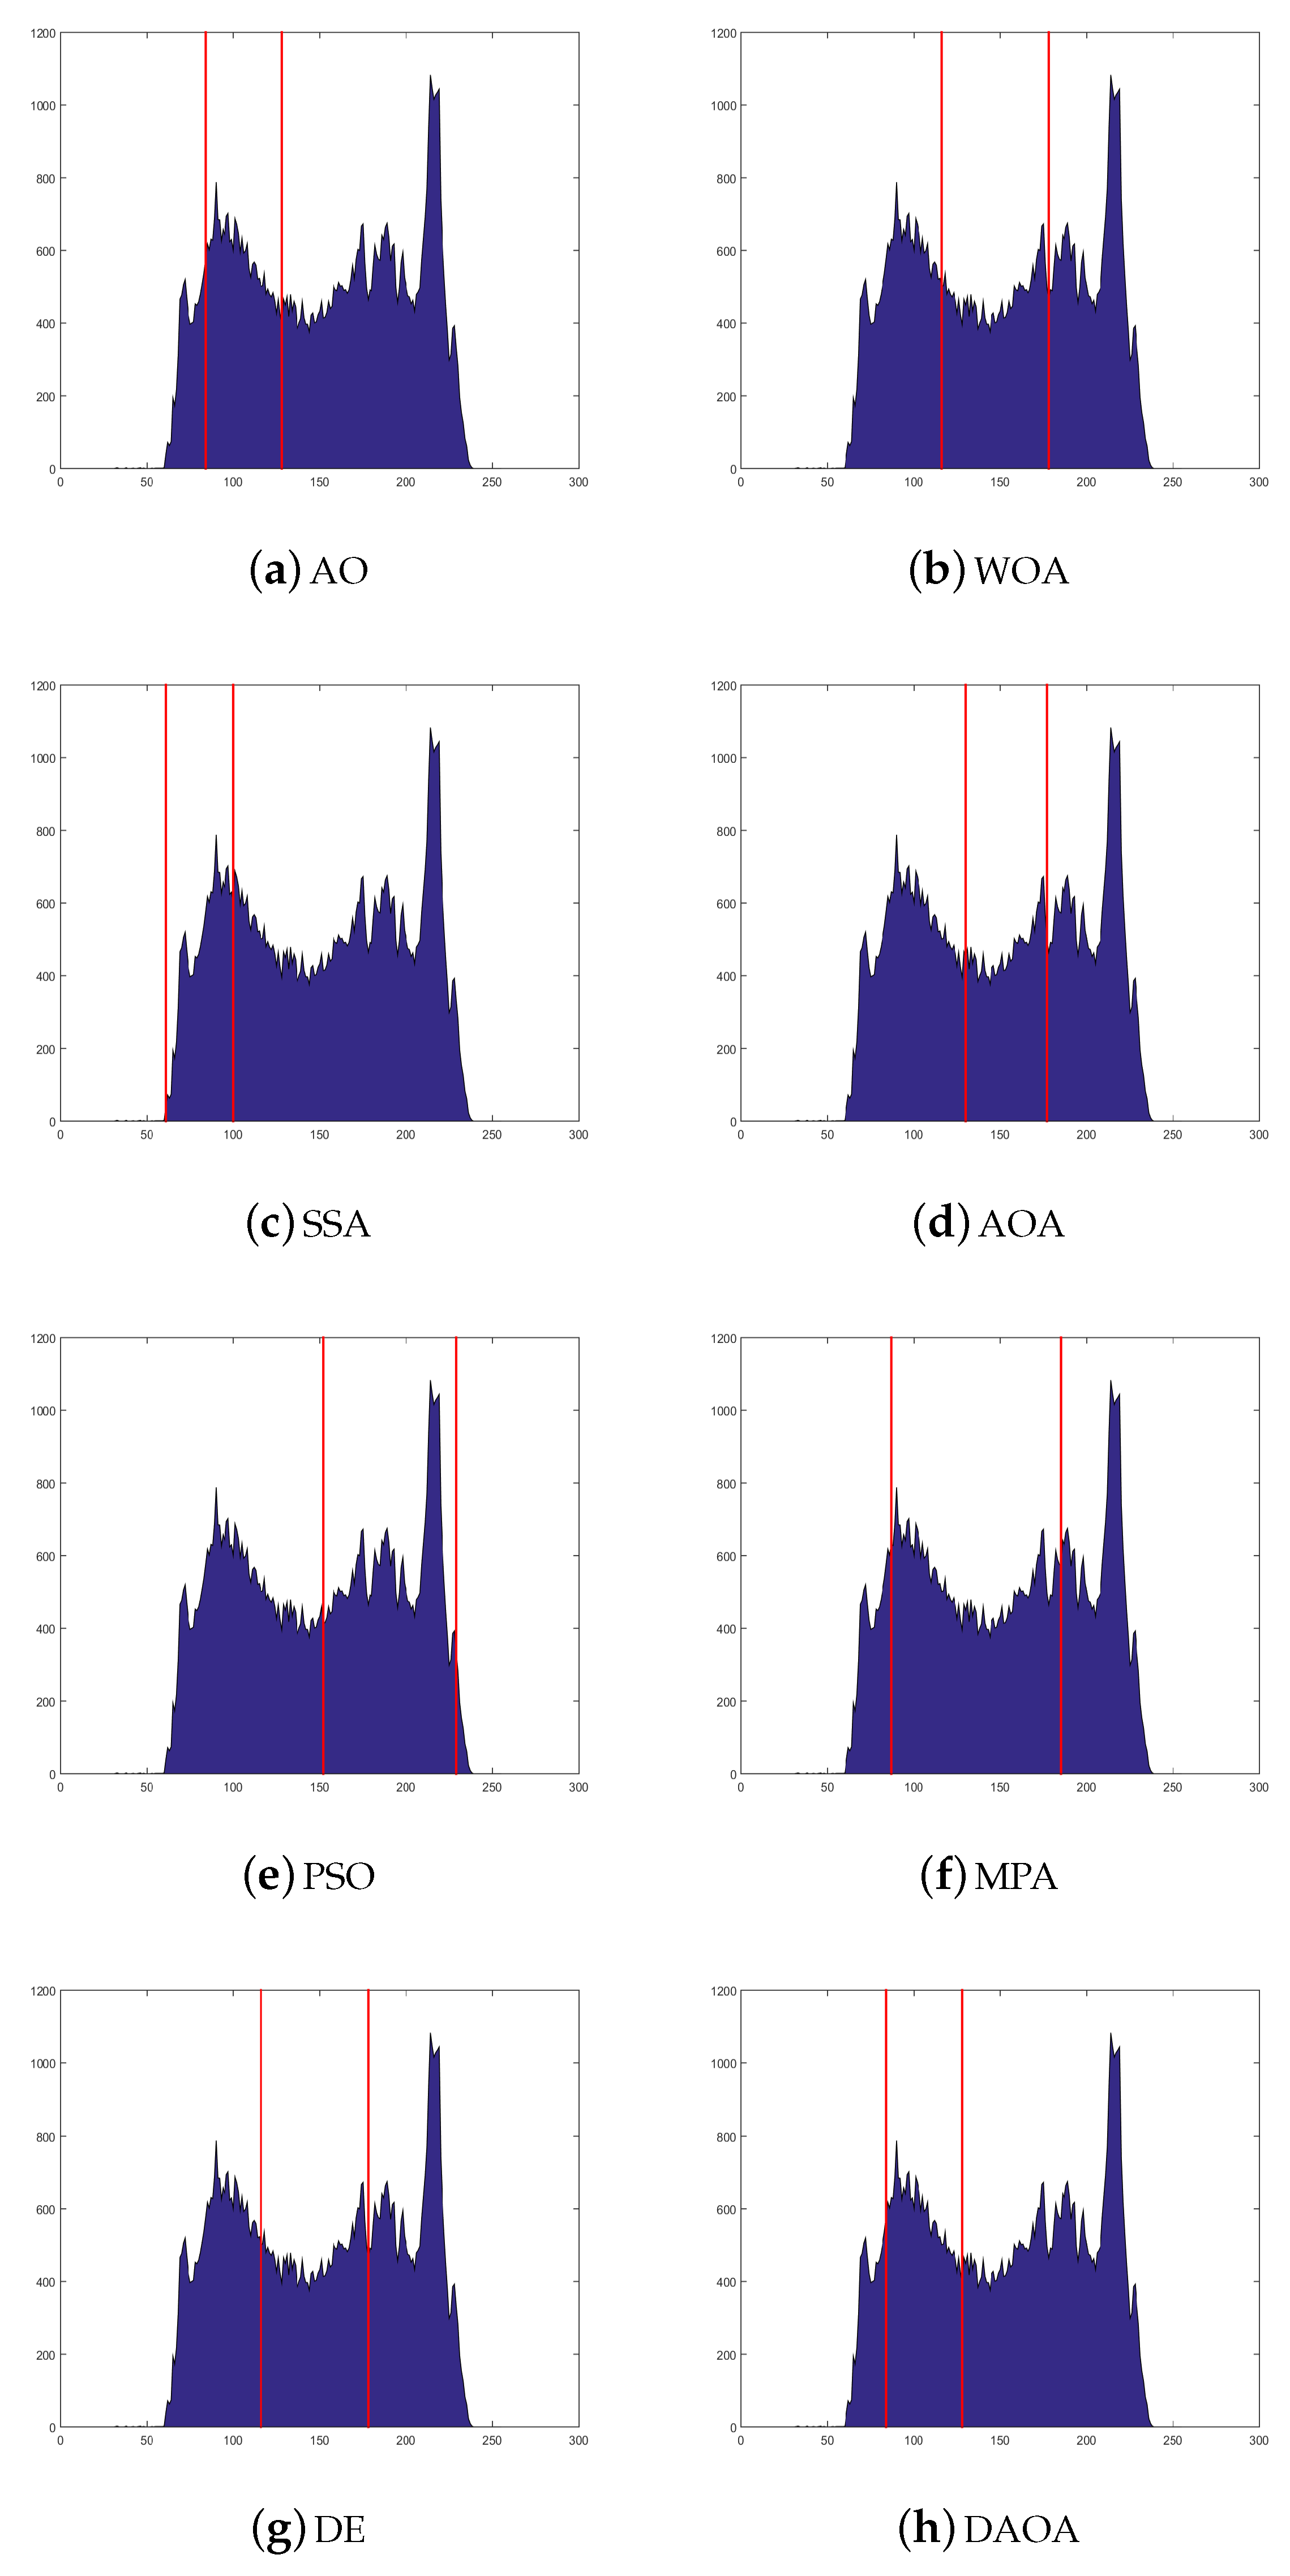
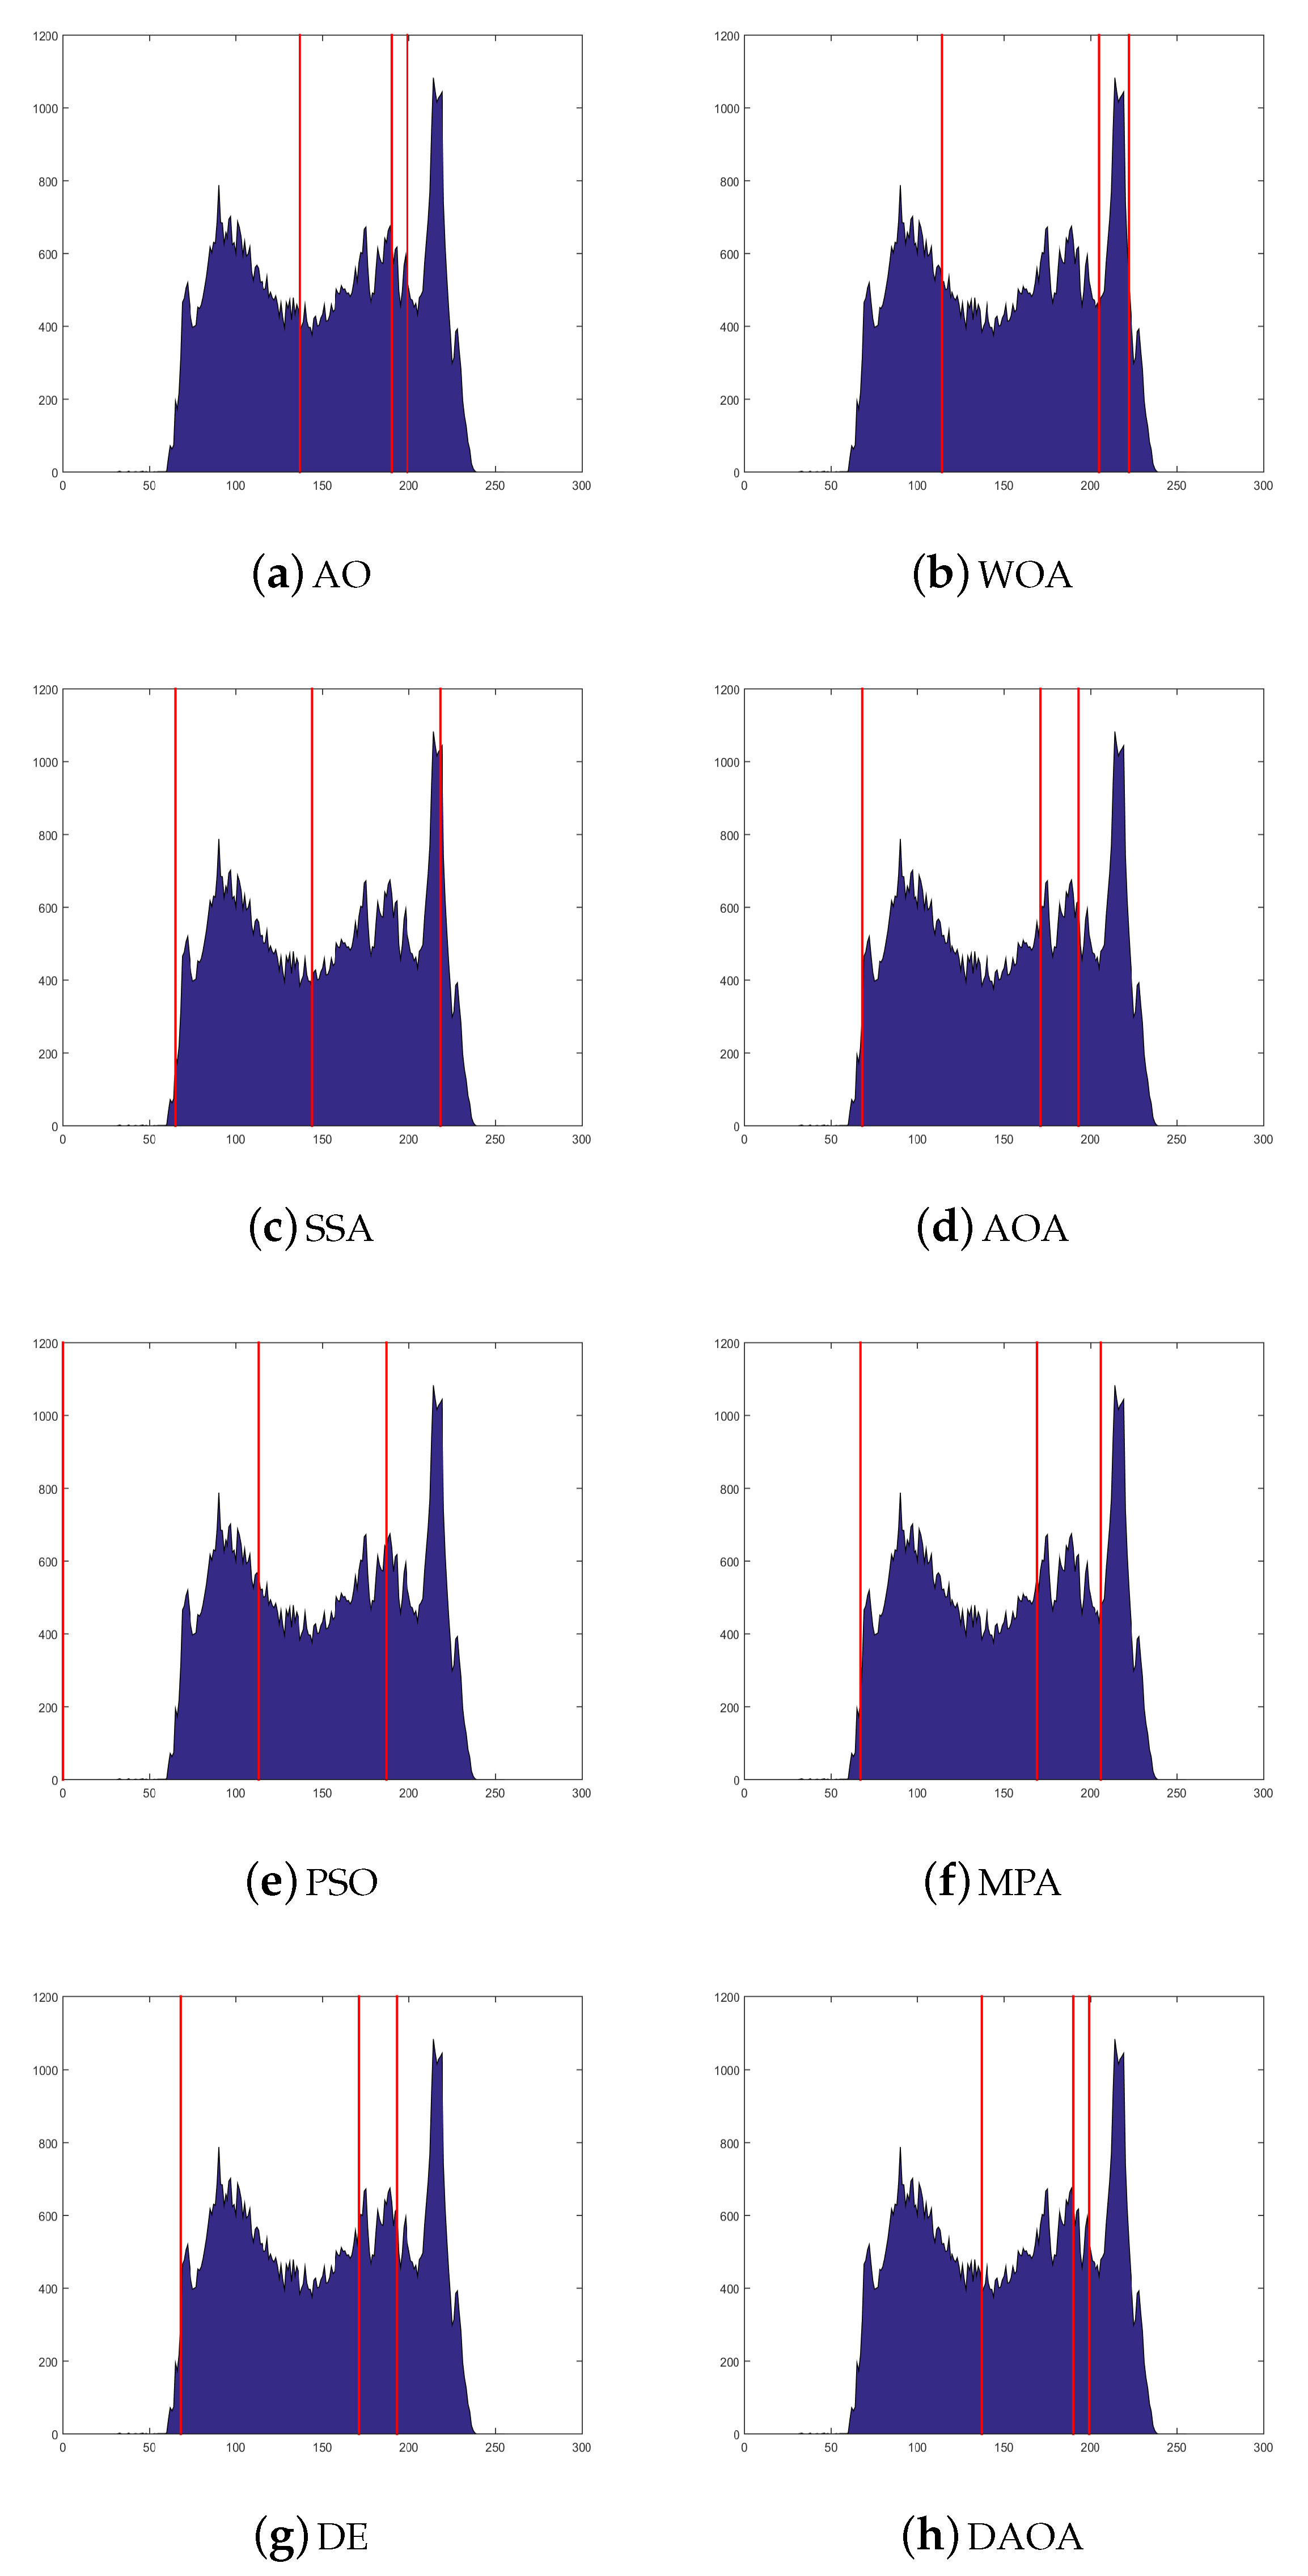
4. Experiments and Results
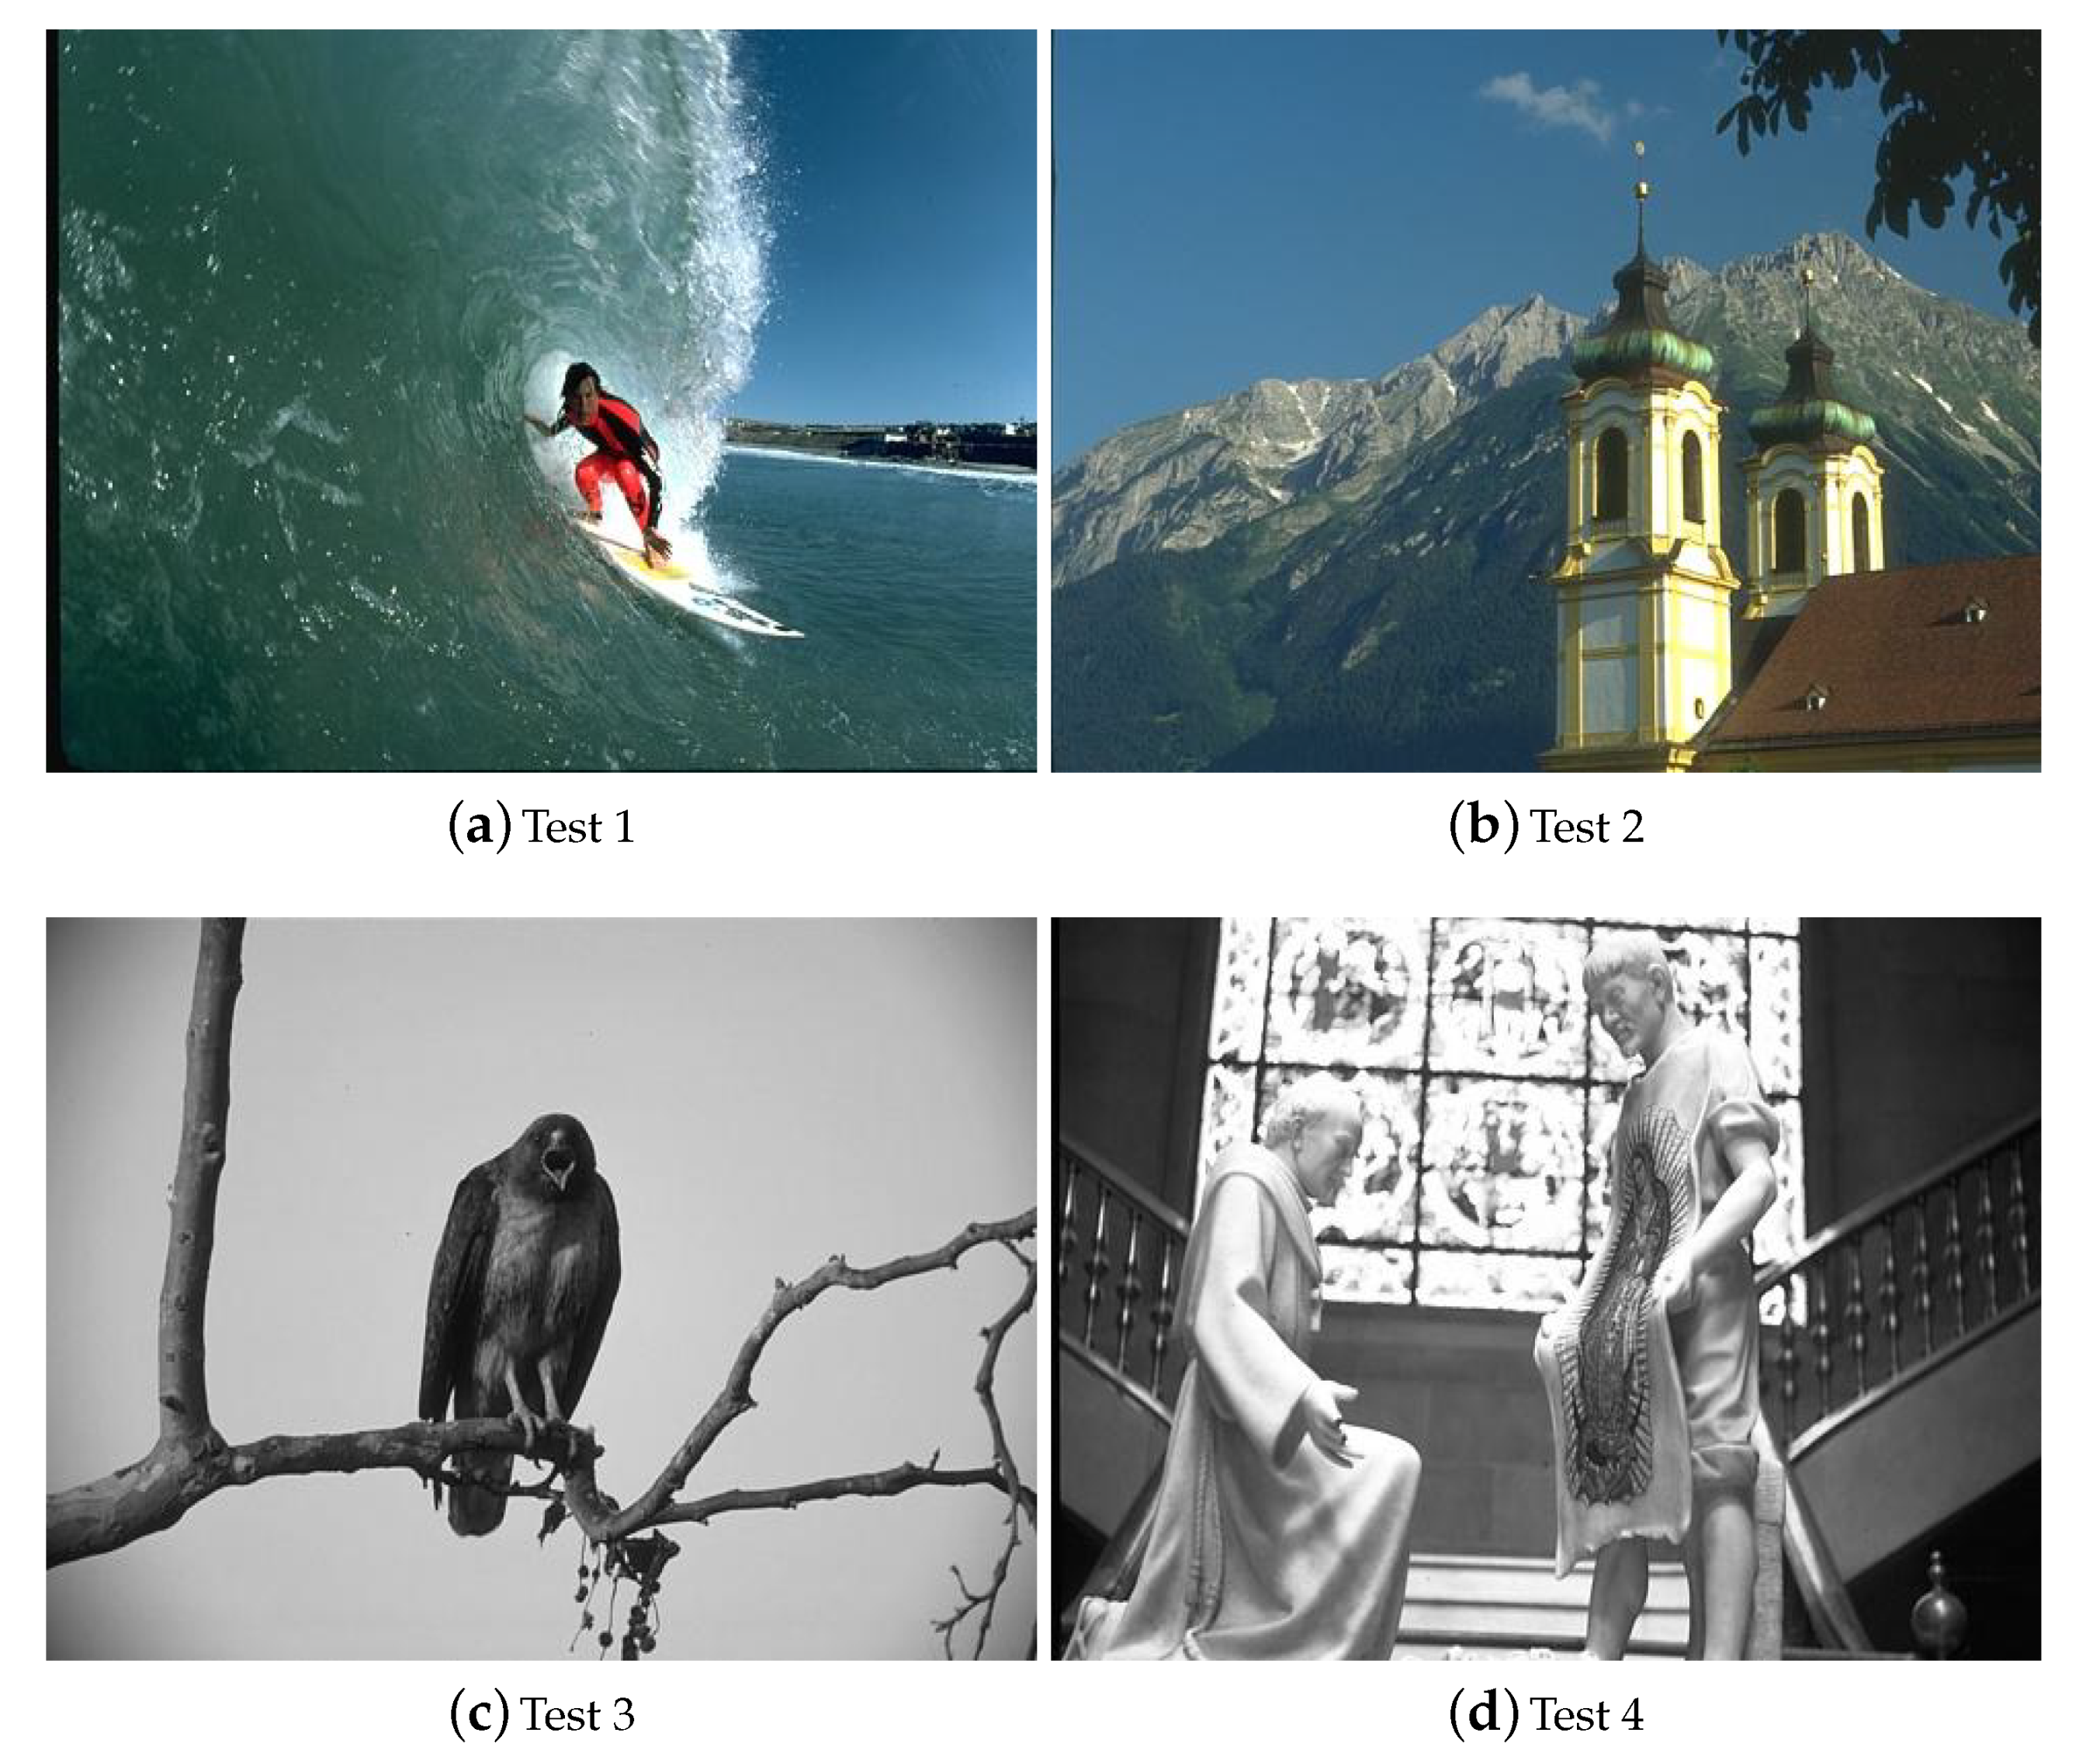
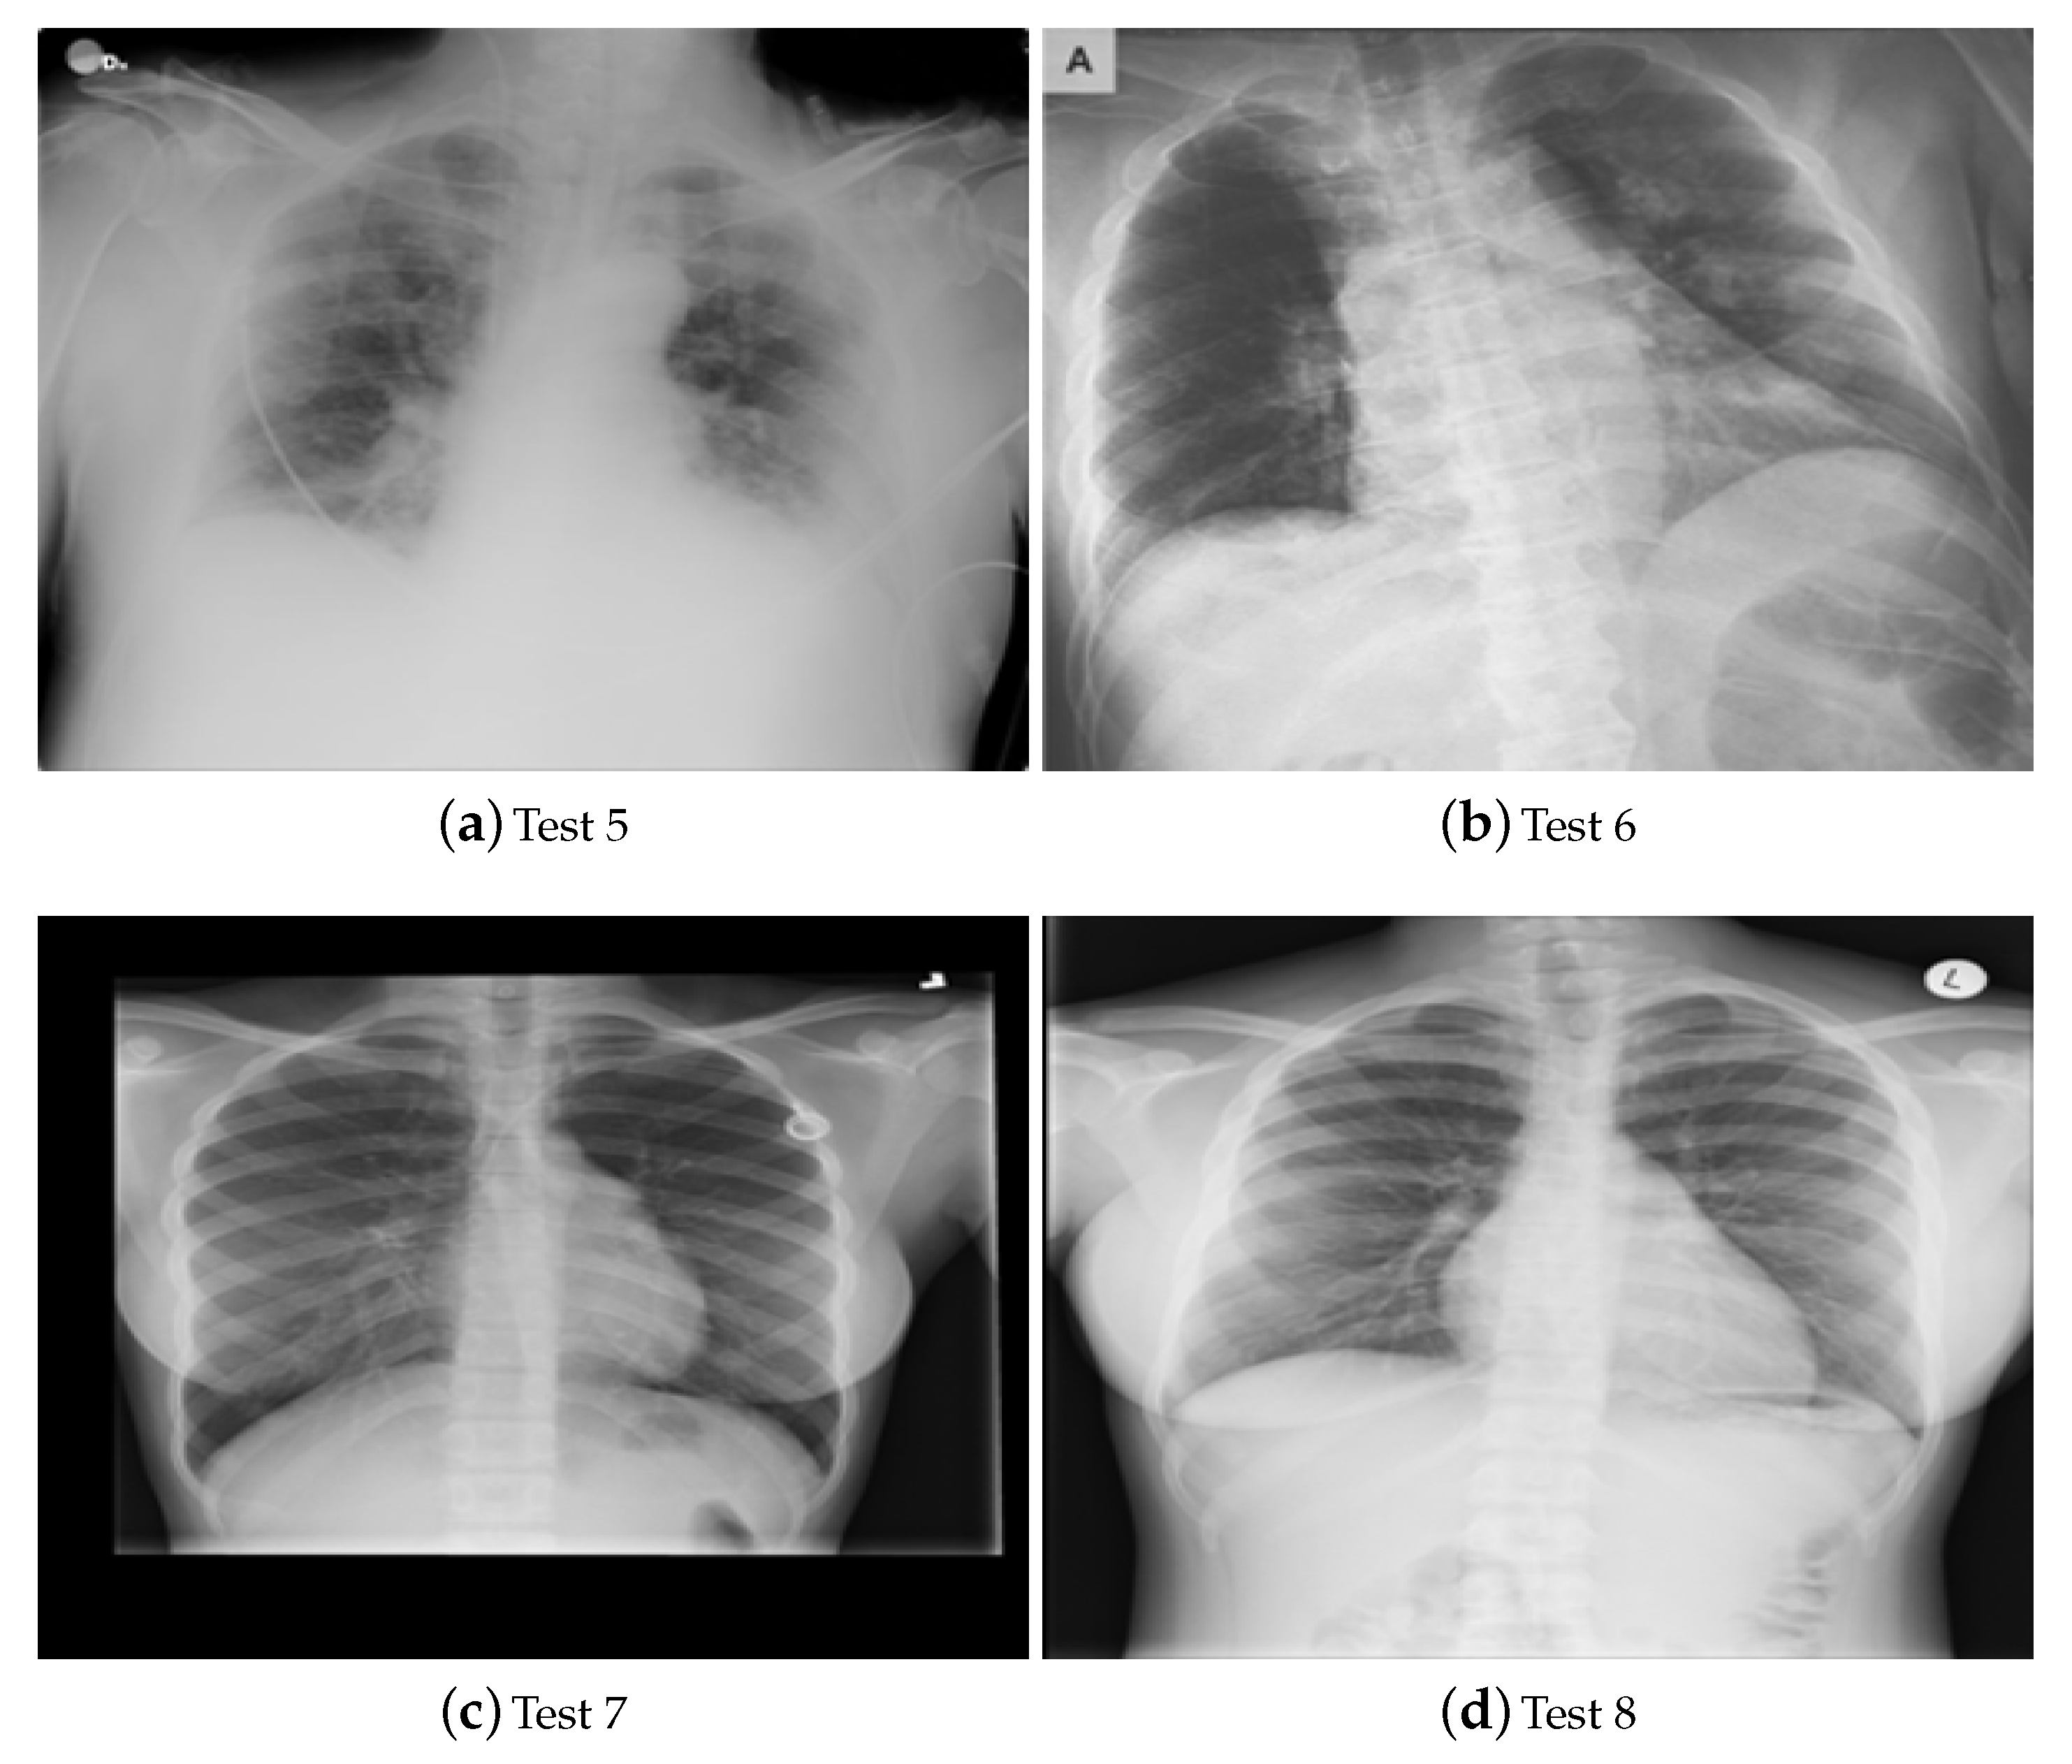
4.1. Benchmark Images
4.2. Comparative Algorithms and Parameter Setting
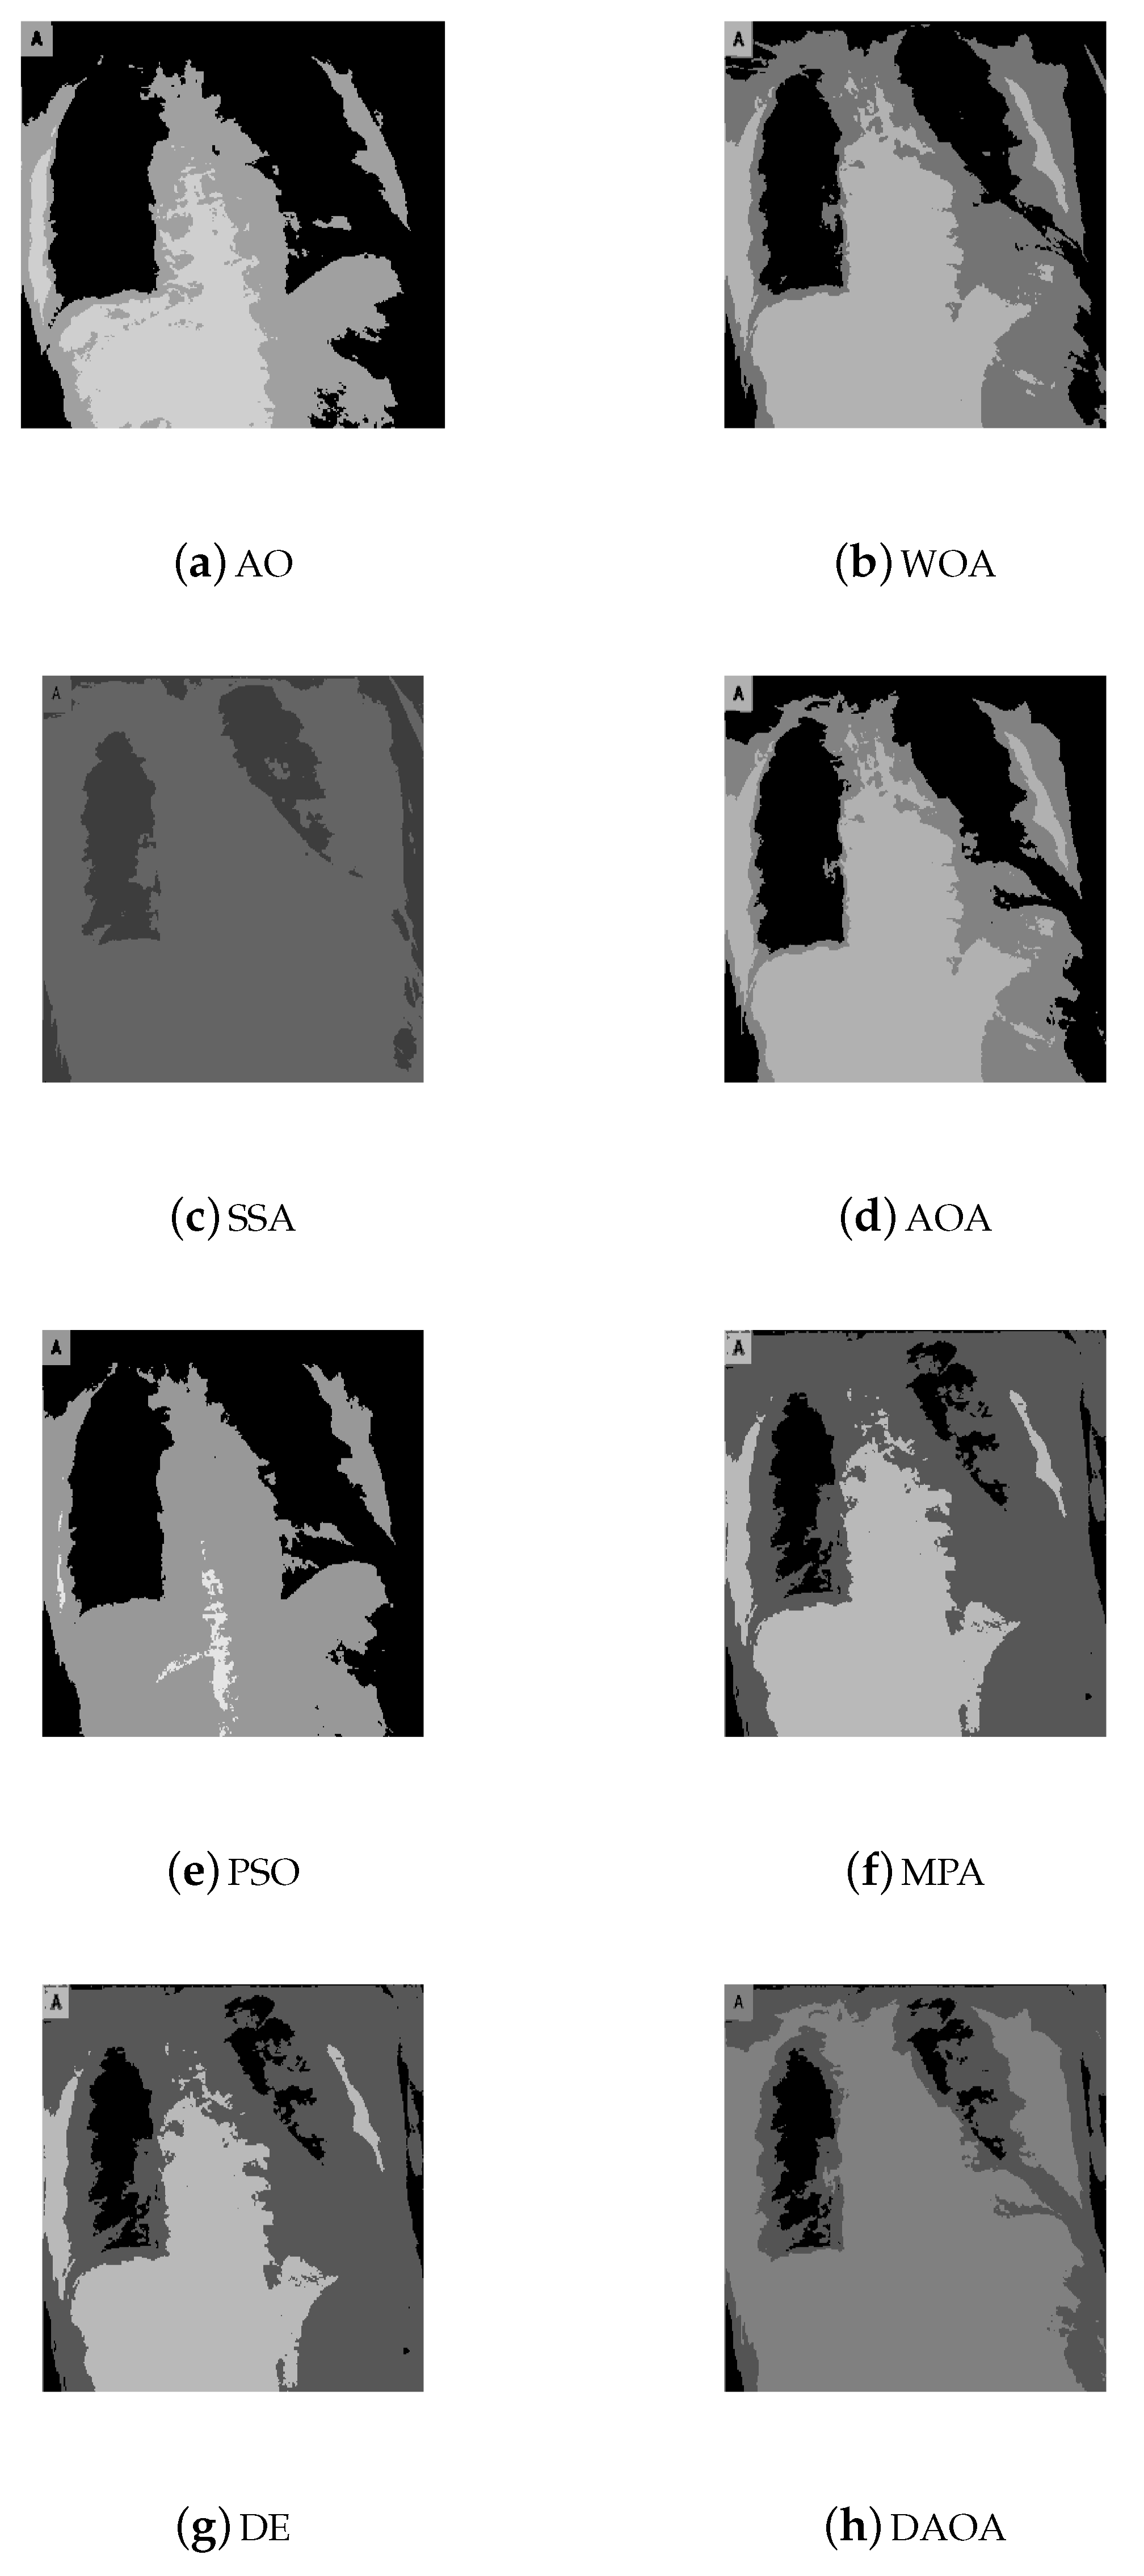
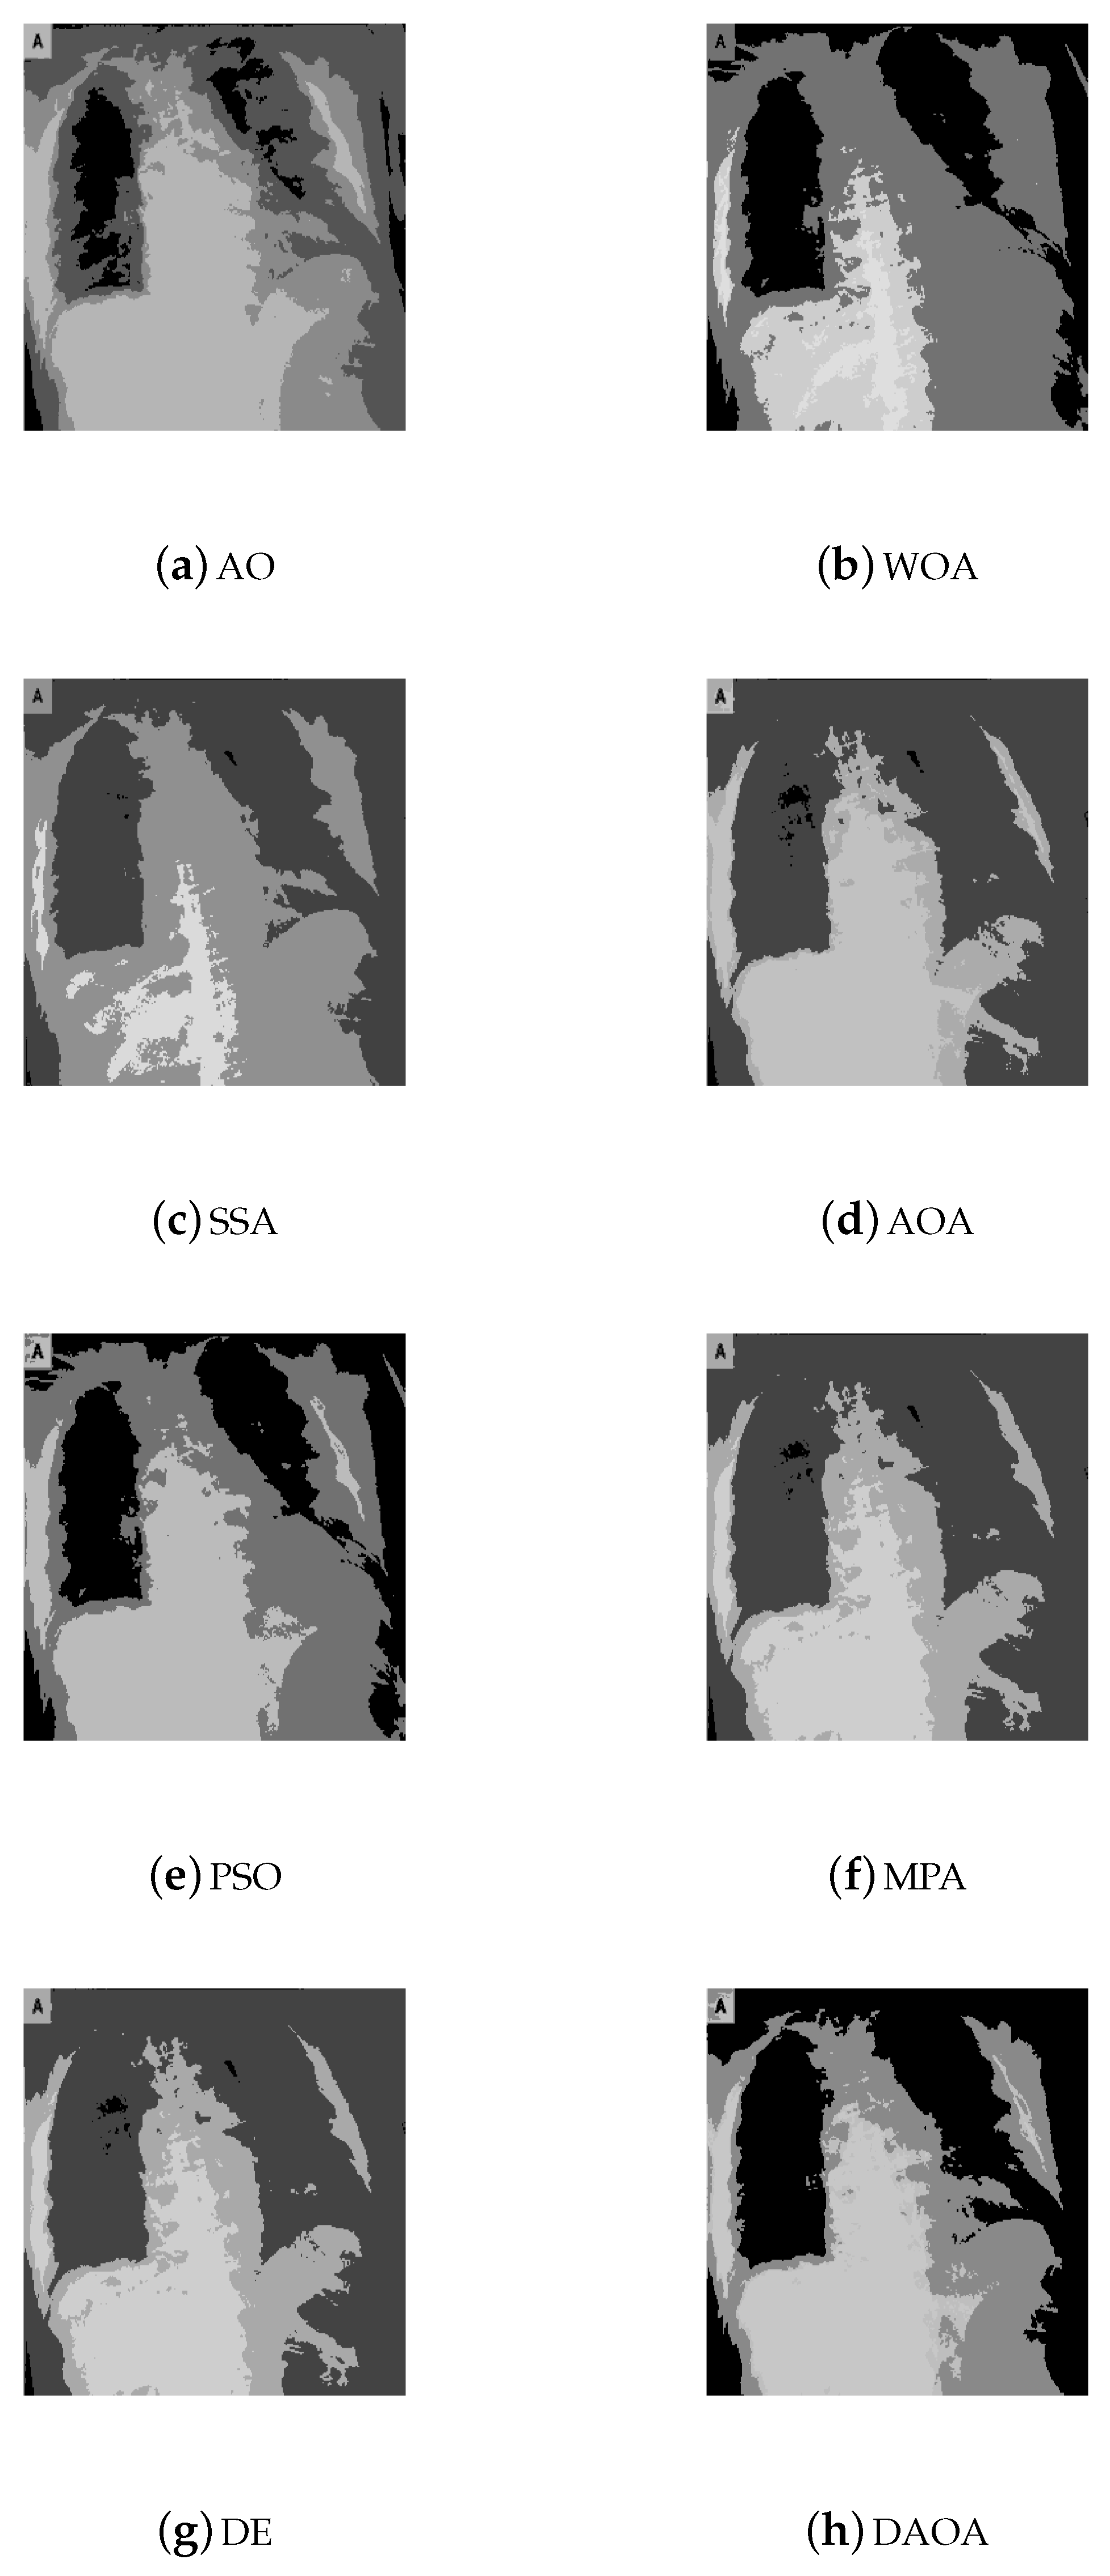
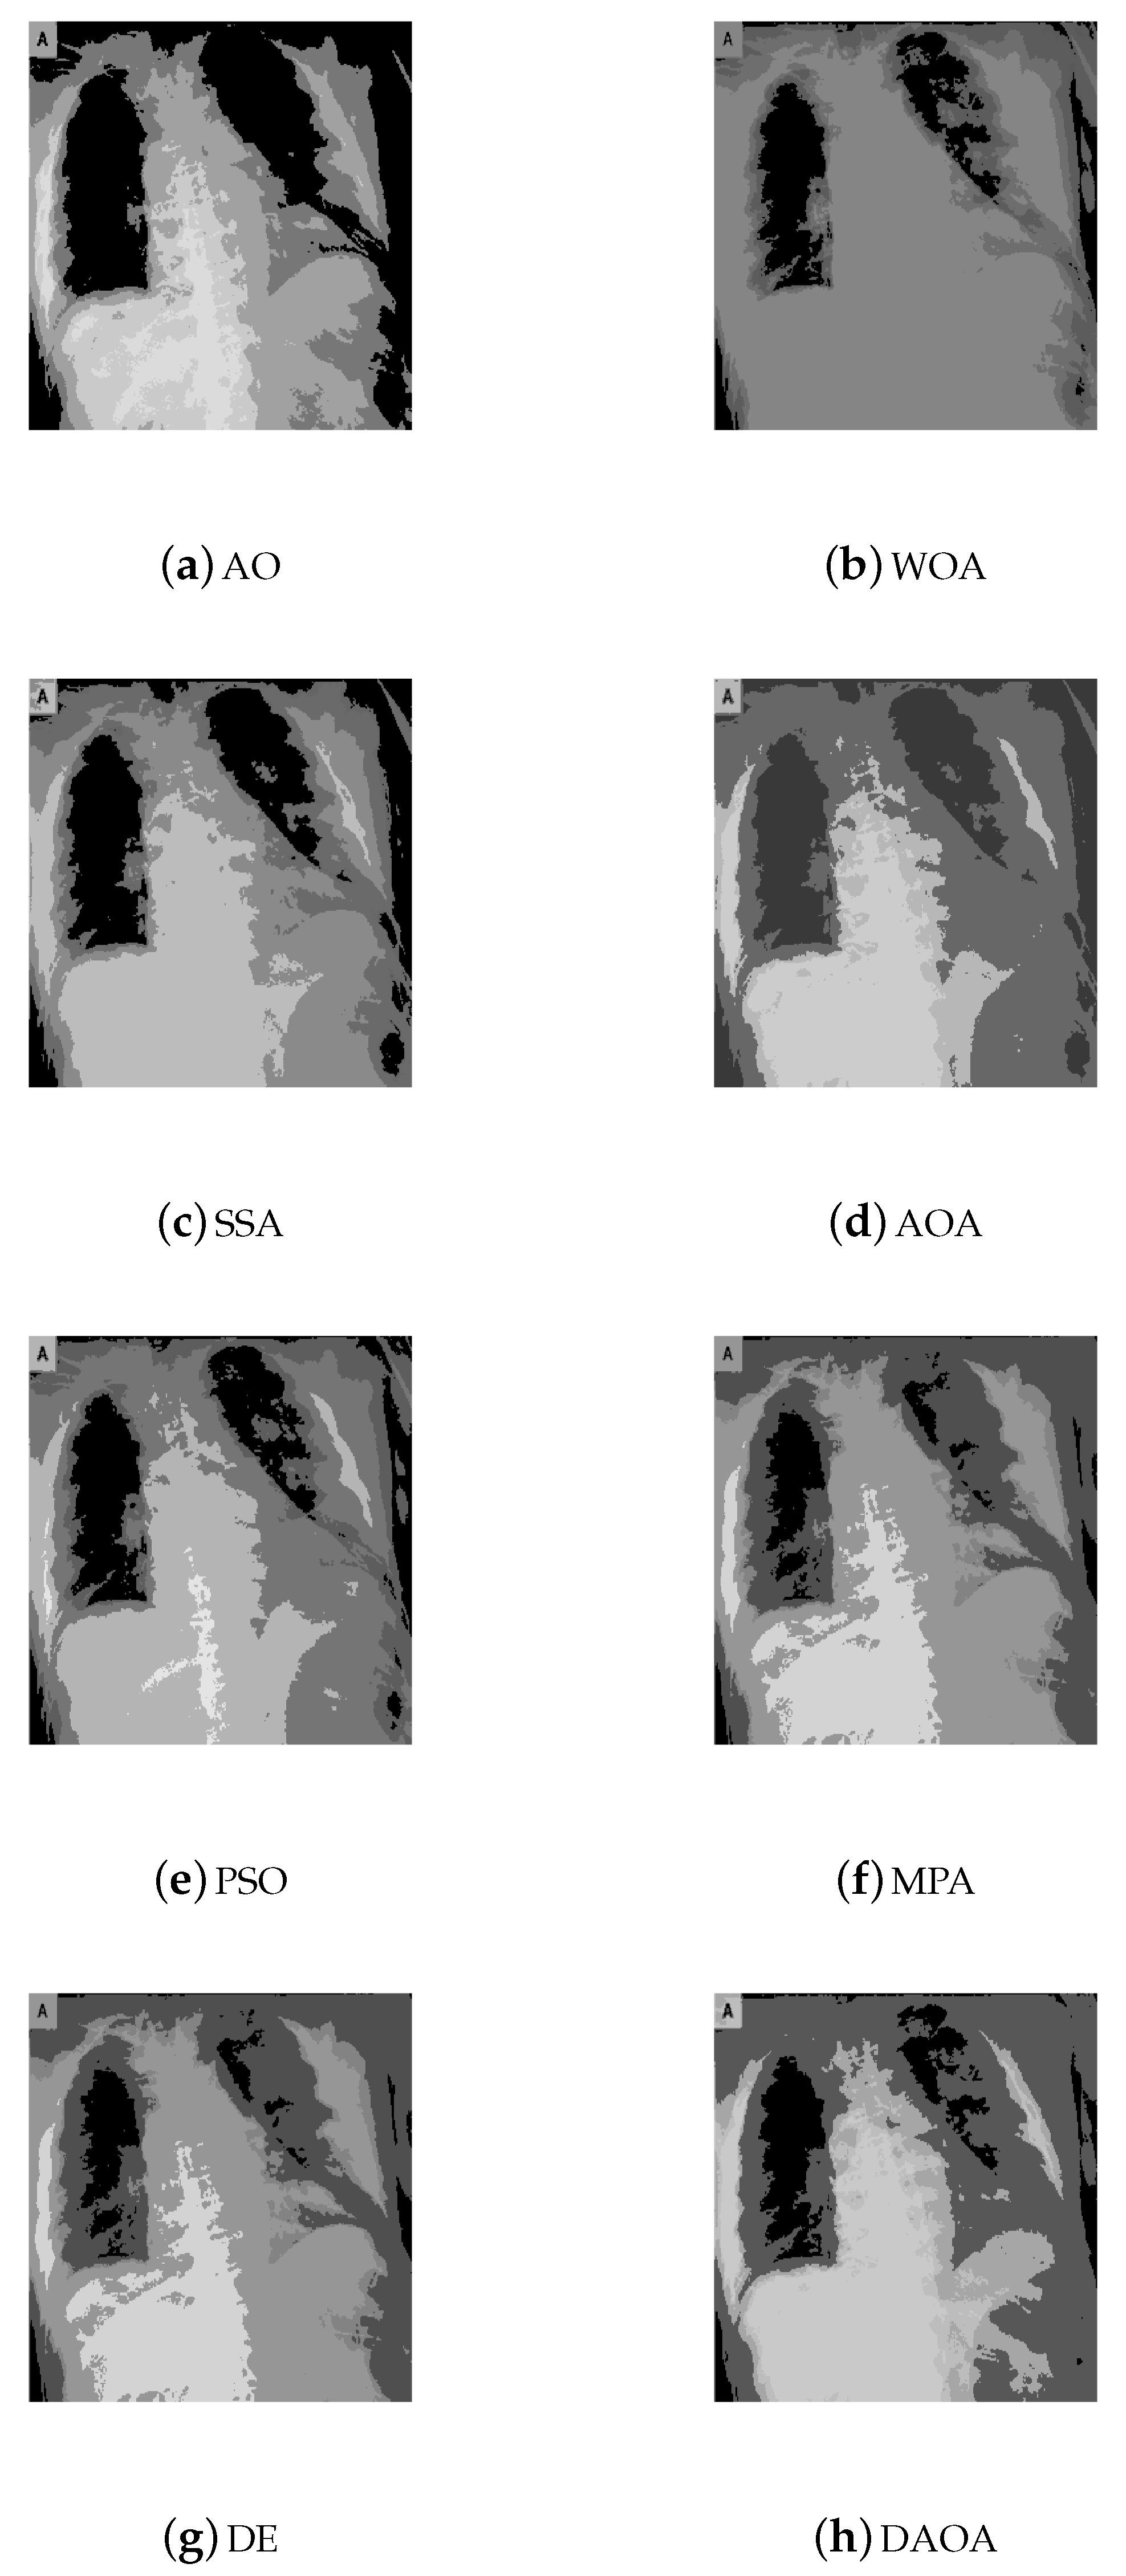
4.3. Performance Evaluation
5. Conclusions and Future Works
Author Contributions
Funding
Conflicts of Interest
References
- Abd El Aziz, M.; Ewees, A.A.; Hassanien, A.E. Whale optimization algorithm and moth-flame optimization for multilevel thresholding image segmentation. Expert Syst. Appl. 2017, 83, 242–256. [Google Scholar] [CrossRef]
- Shubham, S.; Bhandari, A.K. A generalized Masi entropy based efficient multilevel thresholding method for color image segmentation. Multimed. Tools Appl. 2019, 78, 17197–17238. [Google Scholar] [CrossRef]
- Abd Elaziz, M.; Lu, S. Many-objectives multilevel thresholding image segmentation using knee evolutionary algorithm. Expert Syst. Appl. 2019, 125, 305–316. [Google Scholar] [CrossRef]
- Pare, S.; Bhandari, A.K.; Kumar, A.; Singh, G.K. An optimal color image multilevel thresholding technique using grey-level co-occurrence matrix. Expert Syst. Appl. 2017, 87, 335–362. [Google Scholar] [CrossRef]
- Bao, X.; Jia, H.; Lang, C. A novel hybrid harris hawks optimization for color image multilevel thresholding segmentation. IEEE Access 2019, 7, 76529–76546. [Google Scholar] [CrossRef]
- Abd Elaziz, M.; Ewees, A.A.; Oliva, D. Hyper-heuristic method for multilevel thresholding image segmentation. Expert Syst. Appl. 2020, 146, 113201. [Google Scholar] [CrossRef]
- Houssein, E.H.; Helmy, B.E.d.; Oliva, D.; Elngar, A.A.; Shaban, H. A novel Black Widow Optimization algorithm for multilevel thresholding image segmentation. Expert Syst. Appl. 2021, 167, 114159. [Google Scholar] [CrossRef]
- Gill, H.S.; Khehra, B.S.; Singh, A.; Kaur, L. Teaching-learning-based optimization algorithm to minimize cross entropy for Selecting multilevel threshold values. Egypt. Inform. J. 2019, 20, 11–25. [Google Scholar] [CrossRef]
- Tan, Z.; Zhang, D. A fuzzy adaptive gravitational search algorithm for two-dimensional multilevel thresholding image segmentation. J. Ambient. Intell. Humaniz. Comput. 2020, 11, 4983–4994. [Google Scholar] [CrossRef]
- Yousri, D.; Abd Elaziz, M.; Abualigah, L.; Oliva, D.; Al-Qaness, M.A.; Ewees, A.A. COVID-19 X-ray images classification based on enhanced fractional-order cuckoo search optimizer using heavy-tailed distributions. Appl. Soft Comput. 2021, 101, 107052. [Google Scholar] [CrossRef] [PubMed]
- Srikanth, R.; Bikshalu, K. Multilevel thresholding image segmentation based on energy curve with harmony Search Algorithm. Ain Shams Eng. J. 2021, 12, 1–20. [Google Scholar] [CrossRef]
- Duan, L.; Yang, S.; Zhang, D. Multilevel thresholding using an improved cuckoo search algorithm for image segmentation. J. Supercomput. 2021, 77, 6734–6753. [Google Scholar] [CrossRef]
- Jia, H.; Lang, C.; Oliva, D.; Song, W.; Peng, X. Hybrid grasshopper optimization algorithm and differential evolution for multilevel satellite image segmentation. Remote Sens. 2019, 11, 1134. [Google Scholar] [CrossRef] [Green Version]
- Khairuzzaman, A.K.M.; Chaudhury, S. Multilevel thresholding using grey wolf optimizer for image segmentation. Expert Syst. Appl. 2017, 86, 64–76. [Google Scholar] [CrossRef]
- He, L.; Huang, S. Modified firefly algorithm based multilevel thresholding for color image segmentation. Neurocomputing 2017, 240, 152–174. [Google Scholar] [CrossRef]
- Li, Y.; Bai, X.; Jiao, L.; Xue, Y. Partitioned-cooperative quantum-behaved particle swarm optimization based on multilevel thresholding applied to medical image segmentation. Appl. Soft Comput. 2017, 56, 345–356. [Google Scholar] [CrossRef]
- Manic, K.S.; Priya, R.K.; Rajinikanth, V. Image multithresholding based on Kapur/Tsallis entropy and firefly algorithm. Indian J. Sci. Technol. 2016, 9, 89949. [Google Scholar] [CrossRef]
- Bhandari, A.K.; Kumar, A.; Singh, G.K. Modified artificial bee colony based computationally efficient multilevel thresholding for satellite image segmentation using Kapur’s, Otsu and Tsallis functions. Expert Syst. Appl. 2015, 42, 1573–1601. [Google Scholar] [CrossRef]
- Liang, H.; Jia, H.; Xing, Z.; Ma, J.; Peng, X. Modified grasshopper algorithm-based multilevel thresholding for color image segmentation. IEEE Access 2019, 7, 11258–11295. [Google Scholar] [CrossRef]
- Abualigah, L. Group search optimizer: A nature-inspired meta-heuristic optimization algorithm with its results, variants, and applications. Neural Comput. Appl. 2020, 33, 2949–2972. [Google Scholar] [CrossRef]
- Alsalibi, B.; Abualigah, L.; Khader, A.T. A novel bat algorithm with dynamic membrane structure for optimization problems. Appl. Intell. 2021, 51, 1992–2017. [Google Scholar] [CrossRef]
- Ewees, A.A.; Abualigah, L.; Yousri, D.; Algamal, Z.Y.; Al-qaness, M.A.; Ibrahim, R.A.; Abd Elaziz, M. Improved Slime Mould Algorithm based on Firefly Algorithm for feature selection: A case study on QSAR model. Eng. Comput. 2021, 1–15. [Google Scholar] [CrossRef]
- Şahin, C.B.; Dinler, Ö.B.; Abualigah, L. Prediction of software vulnerability based deep symbiotic genetic algorithms: Phenotyping of dominant-features. Appl. Intell. 2021, 1–17. [Google Scholar] [CrossRef]
- Mirjalili, S.; Mirjalili, S.M.; Lewis, A. Grey wolf optimizer. Adv. Eng. Softw. 2014, 69, 46–61. [Google Scholar] [CrossRef] [Green Version]
- Safaldin, M.; Otair, M.; Abualigah, L. Improved binary gray wolf optimizer and SVM for intrusion detection system in wireless sensor networks. J. Ambient. Intell. Humaniz. Comput. 2021, 12, 1559–1576. [Google Scholar] [CrossRef]
- Alshinwan, M.; Abualigah, L.; Shehab, M.; Abd Elaziz, M.; Khasawneh, A.M.; Alabool, H.; Al Hamad, H. Dragonfly algorithm: A comprehensive survey of its results, variants, and applications. Multimed. Tools Appl. 2021, 80, 14979–15016. [Google Scholar] [CrossRef]
- Shehab, M.; Abualigah, L.; Al Hamad, H.; Alabool, H.; Alshinwan, M.; Khasawneh, A.M. Moth–flame optimization algorithm: Variants and applications. Neural Comput. Appl. 2020, 32, 9859–9884. [Google Scholar] [CrossRef]
- Al-Qaness, M.A.; Ewees, A.A.; Fan, H.; Abualigah, L.; Abd Elaziz, M. Marine predators algorithm for forecasting confirmed cases of COVID-19 in Italy, USA, Iran and Korea. Int. J. Environ. Res. Public Health 2020, 17, 3520. [Google Scholar] [CrossRef]
- Abualigah, L.; Diabat, A.; Mirjalili, S.; Abd Elaziz, M.; Gandomi, A.H. The arithmetic optimization algorithm. Comput. Methods Appl. Mech. Eng. 2021, 376, 113609. [Google Scholar] [CrossRef]
- Abualigah, L.; Yousri, D.; Abd Elaziz, M.; Ewees, A.A.; Al-qaness, M.A.; Gandomi, A.H. Aquila Optimizer: A novel meta-heuristic optimization algorithm. Comput. Ind. Eng. 2021, 157, 107250. [Google Scholar] [CrossRef]
- Gandomi, A.H.; Alavi, A.H. Krill herd: A new bio-inspired optimization algorithm. Commun. Nonlinear Sci. Numer. Simul. 2012, 17, 4831–4845. [Google Scholar] [CrossRef]
- Jouhari, H.; Lei, D.; Al-qaness, M.A.; Elaziz, M.A.; Damaševičius, R.; Korytkowski, M.; Ewees, A.A. Modified Harris Hawks Optimizer for Solving Machine Scheduling Problems. Symmetry 2020, 12, 1460. [Google Scholar] [CrossRef]
- Połap, D.; Woźniak, M. Red fox optimization algorithm. Expert Syst. Appl. 2021, 166, 114107. [Google Scholar] [CrossRef]
- Mernik, M.; Liu, S.H.; Karaboga, D.; Črepinšek, M. On clarifying misconceptions when comparing variants of the artificial bee colony algorithm by offering a new implementation. Inf. Sci. 2015, 291, 115–127. [Google Scholar] [CrossRef]
- Sahlol, A.T.; Abd Elaziz, M.; Tariq Jamal, A.; Damaševičius, R.; Farouk Hassan, O. A novel method for detection of tuberculosis in chest radiographs using artificial ecosystem-based optimisation of deep neural network features. Symmetry 2020, 12, 1146. [Google Scholar] [CrossRef]
- Abualigah, L.; Diabat, A. Advances in sine cosine algorithm: A comprehensive survey. Artif. Intell. Rev. 2021, 54, 2567–2608. [Google Scholar] [CrossRef]
- Abualigah, L.; Diabat, A. A comprehensive survey of the Grasshopper optimization algorithm: Results, variants, and applications. Neural Comput. Appl. 2020, 32, 15533–15556. [Google Scholar] [CrossRef]
- Tuba, E.; Alihodzic, A.; Tuba, M. Multilevel image thresholding using elephant herding optimization algorithm. In Proceedings of the 2017 14th International Conference on Engineering of Modern Electric Systems (EMES), Oradea, Romania, 1–2 June 2017; pp. 240–243. [Google Scholar]
- Sahlol, A.T.; Yousri, D.; Ewees, A.A.; Al-Qaness, M.A.; Damasevicius, R.; Abd Elaziz, M. COVID-19 image classification using deep features and fractional-order marine predators algorithm. Sci. Rep. 2020, 10, 1–15. [Google Scholar] [CrossRef] [PubMed]
- Wang, X.; Pan, J.S.; Chu, S.C. A parallel multi-verse optimizer for application in multilevel image segmentation. IEEE Access 2020, 8, 32018–32030. [Google Scholar] [CrossRef]
- Gao, Y.; Li, X.; Dong, M.; Li, H.P. An enhanced artificial bee colony optimizer and its application to multi-level threshold image segmentation. J. Cent. South Univ. 2018, 25, 107–120. [Google Scholar] [CrossRef]
- Resma, K.B.; Nair, M.S. Multilevel thresholding for image segmentation using Krill Herd Optimization algorithm. J. King Saud. Univ.-Comput. Inf. Sci. 2018, 33, 528–541. [Google Scholar]
- Abd Elaziz, M.; Yousri, D.; Al-qaness, M.A.; AbdelAty, A.M.; Radwan, A.G.; Ewees, A.A. A Grunwald–Letnikov based Manta ray foraging optimizer for global optimization and image segmentation. Eng. Appl. Artif. Intell. 2021, 98, 104105. [Google Scholar] [CrossRef]
- Sörensen, K. Metaheuristics—The metaphor exposed. Int. Trans. Oper. Res. 2015, 22, 3–18. [Google Scholar] [CrossRef]
- García-Martínez, C.; Gutiérrez, P.D.; Molina, D.; Lozano, M.; Herrera, F. Since CEC 2005 competition on real-parameter optimisation: A decade of research, progress and comparative analysis’s weakness. Soft Comput. 2017, 21, 5573–5583. [Google Scholar] [CrossRef]
- Storn, R.; Price, K. Differential evolution—A simple and efficient heuristic for global optimization over continuous spaces. J. Glob. Optim. 1997, 11, 341–359. [Google Scholar] [CrossRef]
- Tanabe, R.; Fukunaga, A. Success-history based parameter adaptation for differential evolution. In Proceedings of the 2013 IEEE Congress on Evolutionary Computation, Cancun, Mexico, 20–23 June 2013; pp. 71–78. [Google Scholar]
- Črepinšek, M.; Liu, S.H.; Mernik, M. Replication and comparison of computational experiments in applied evolutionary computing: Common pitfalls and guidelines to avoid them. Appl. Soft Comput. 2014, 19, 161–170. [Google Scholar] [CrossRef]
- Maitra, M.; Chatterjee, A. A hybrid cooperative–comprehensive learning based PSO algorithm for image segmentation using multilevel thresholding. Expert Syst. Appl. 2008, 34, 1341–1350. [Google Scholar] [CrossRef]
- Yin, P.Y. Multilevel minimum cross entropy threshold selection based on particle swarm optimization. Appl. Math. Comput. 2007, 184, 503–513. [Google Scholar] [CrossRef]
- Zhou, W. Image quality assessment: From error measurement to structural similarity. IEEE Trans. Image Process. 2004, 13, 600–613. [Google Scholar]
- Sumari, P.; Syed, S.J.; Abualigah, L. A Novel Deep Learning Pipeline Architecture based on CNN to Detect Covid-19 in Chest X-ray Images. Turk. J. Comput. Math. Educ. (TURCOMAT) 2021, 12, 2001–2011. [Google Scholar]
- Mirjalili, S.; Lewis, A. The whale optimization algorithm. Adv. Eng. Softw. 2016, 95, 51–67. [Google Scholar] [CrossRef]
- Mirjalili, S.; Gandomi, A.H.; Mirjalili, S.Z.; Saremi, S.; Faris, H.; Mirjalili, S.M. Salp Swarm Algorithm: A bio-inspired optimizer for engineering design problems. Adv. Eng. Softw. 2017, 114, 163–191. [Google Scholar] [CrossRef]
- Eberhart, R.; Kennedy, J. A new optimizer using particle swarm theory. In Proceedings of the MHS’95. Proceedings of the Sixth International Symposium on Micro Machine and Human Science, Nagoya, Japan, 4–6 October 1995; pp. 39–43. [Google Scholar]
- Faramarzi, A.; Heidarinejad, M.; Mirjalili, S.; Gandomi, A.H. Marine Predators Algorithm: A nature-inspired metaheuristic. Expert Syst. Appl. 2020, 152, 113377. [Google Scholar] [CrossRef]
- Price, K.; Storn, R.M.; Lampinen, J.A. Differential Evolution: A Practical Approach to Global Optimization; Science & Business Media: Berlin/Heidelberg, Germany, 2006. [Google Scholar]
- Derrac, J.; García, S.; Molina, D.; Herrera, F. A practical tutorial on the use of nonparametric statistical tests as a methodology for comparing evolutionary and swarm intelligence algorithms. Swarm Evol. Comput. 2011, 1, 3–18. [Google Scholar] [CrossRef]
- Abualigah, L.M.Q. Feature Selection and Enhanced Krill Herd Algorithm for Text Document Clustering; Springer: Berlin/Heidelberg, Germany, 2019. [Google Scholar]


| No. | Algorithm | Reference | Parameter | Value |
|---|---|---|---|---|
| 1 | AO | [30] | 0.1 | |
| / | 0.1 | |||
| 2 | WOA | [53] | Decreased from 2 to 0 | |
| b | 2 | |||
| 3 | SSA | [54] | 0 | |
| 4 | AOA | [29] | 5 | |
| 0.5 | ||||
| 5 | PSO | [55] | Topology | Fully connected |
| Cognitive and social constant | (C1, C2) 2, 2 | |||
| Inertia weight | Linear reduction values [0.9 0.1] | |||
| Velocity limit | 10% of dimension range | |||
| 6 | MPA | [56] | > 1 | |
| P | 0.0 | |||
| 7 | DE | [57] | Co | 0.5 |
| Mu | 0.5 |
| Threshold | Metric | Comparative Methods | |||||||
|---|---|---|---|---|---|---|---|---|---|
| AO | WOA | SSA | AOA | PSO | MPA | DE | DAOA | ||
| 2 | Max | 12.74479 | 13.20368 | 13.72521 | 13.27539 | 13.70085 | 12.02615 | 13.51551 | 14.55374 |
| Mean | 11.43681 | 11.97746 | 12.58728 | 12.61579 | 12.51339 | 11.79407 | 11.25852 | 12.76203 | |
| Min | 10.60697 | 10.16222 | 10.98468 | 12.02184 | 11.85952 | 11.60000 | 10.33365 | 11.86358 | |
| STD | 1.14631 | 1.60401 | 1.42813 | 0.62935 | 1.03013 | 0.21560 | 0.65885 | 1.55167 | |
| Ranking | 7 | 5 | 3 | 2 | 4 | 6 | 8 | 1 | |
| 3 | Max | 16.44011 | 14.27535 | 16.08140 | 16.89013 | 14.18813 | 15.13210 | 14.41440 | 15.73708 |
| Mean | 15.19863 | 13.28605 | 14.43510 | 14.68456 | 13.49286 | 14.37895 | 12.22514 | 14.61015 | |
| Min | 14.28507 | 11.36665 | 12.18756 | 11.73528 | 12.53317 | 12.91041 | 11.02215 | 13.64585 | |
| STD | 1.11431 | 1.66251 | 2.01534 | 2.65668 | 0.85858 | 1.27194 | 0.56698 | 1.05506 | |
| Ranking | 1 | 7 | 4 | 2 | 6 | 5 | 8 | 3 | |
| 4 | Max | 15.17656 | 17.95691 | 17.47235 | 17.16435 | 17.32833 | 16.30057 | 15.65854 | 17.94836 |
| Mean | 14.00183 | 15.22041 | 16.87263 | 15.59121 | 16.52225 | 15.72838 | 14.25484 | 16.04748 | |
| Min | 13.30037 | 12.55354 | 15.90180 | 14.37544 | 16.09469 | 15.11861 | 13.95558 | 15.09213 | |
| STD | 1.02372 | 2.70236 | 0.84849 | 1.42839 | 0.69852 | 0.59188 | 0.47447 | 1.64622 | |
| Ranking | 8 | 6 | 1 | 5 | 2 | 4 | 7 | 3 | |
| 5 | Max | 16.72622 | 16.42710 | 16.24110 | 17.90312 | 16.37420 | 16.30256 | 16.32254 | 18.67014 |
| Mean | 15.54953 | 16.02096 | 15.54791 | 16.92259 | 15.84138 | 15.24571 | 15.22541 | 15.86760 | |
| Min | 14.49543 | 15.61807 | 14.88442 | 15.62385 | 15.34763 | 14.57955 | 14.02554 | 14.01993 | |
| STD | 1.12043 | 0.40452 | 0.67883 | 1.17248 | 0.51440 | 0.92557 | 0.65558 | 2.46778 | |
| Ranking | 5 | 2 | 6 | 1 | 4 | 7 | 8 | 3 | |
| 6 | Max | 19.43582 | 20.61942 | 19.52344 | 20.43187 | 19.96838 | 18.86744 | 17.95101 | 20.03906 |
| Mean | 18.38781 | 18.75391 | 17.85512 | 18.23439 | 18.71728 | 16.92716 | 16.25870 | 19.23425 | |
| Min | 16.37613 | 17.07040 | 14.78261 | 14.88956 | 17.44713 | 14.57855 | 15.33652 | 17.83410 | |
| STD | 1.74267 | 1.78149 | 2.66414 | 2.94391 | 1.26073 | 2.17340 | 1.25412 | 1.21708 | |
| Ranking | 4 | 2 | 6 | 5 | 3 | 7 | 8 | 1 | |
| Summation | 25 | 22 | 20 | 15 | 19 | 29 | 39 | 11 | |
| Mean Rank | 5 | 4.4 | 4 | 3 | 3.8 | 5.8 | 7.8 | 2.2 | |
| Final Ranking | 6 | 5 | 4 | 2 | 3 | 7 | 8 | 1 | |
| Threshold | Metric | Comparative Methods | |||||||
|---|---|---|---|---|---|---|---|---|---|
| AO | WOA | SSA | AOA | PSO | MPA | DE | DAOA | ||
| 2 | Max | 0.269717 | 0.362146 | 0.380757 | 0.264672 | 0.454587 | 0.220516 | 0.374454 | 0.385465 |
| Mean | 0.173575 | 0.223227 | 0.256072 | 0.231906 | 0.257714 | 0.1974 | 0.23555 | 0.277138 | |
| Min | 0.116657 | 0.019721 | 0.184588 | 0.204993 | 0.133367 | 0.1606 | 0.018985 | 0.122664 | |
| STD | 0.083731 | 0.180118 | 0.108367 | 0.030267 | 0.172455 | 0.032217 | 0.15415 | 0.137343 | |
| Ranking | 8 | 6 | 3 | 5 | 2 | 7 | 4 | 1 | |
| 3 | Max | 0.417374 | 0.675072 | 0.673859 | 0.580374 | 0.631389 | 0.560641 | 0.64544 | 0.631938 |
| Mean | 0.353685 | 0.44114 | 0.555818 | 0.511786 | 0.580212 | 0.504252 | 0.51445 | 0.588044 | |
| Min | 0.305838 | 0.217671 | 0.478485 | 0.417965 | 0.554552 | 0.438945 | 0.48554 | 0.53806 | |
| STD | 0.05743 | 0.22888 | 0.103854 | 0.084094 | 0.04432 | 0.061337 | 0.22252 | 0.047235 | |
| Ranking | 8 | 7 | 3 | 5 | 2 | 6 | 4 | 1 | |
| 4 | Max | 0.417374 | 0.675072 | 0.631938 | 0.580374 | 0.631389 | 0.560641 | 0.58887 | 0.673859 |
| Mean | 0.353685 | 0.44114 | 0.588044 | 0.511786 | 0.580212 | 0.504252 | 0.54414 | 0.555818 | |
| Min | 0.305838 | 0.217671 | 0.53806 | 0.417965 | 0.554552 | 0.438945 | 0.501141 | 0.478485 | |
| STD | 0.05743 | 0.22888 | 0.047235 | 0.084094 | 0.04432 | 0.061337 | 0.08885 | 0.103854 | |
| Ranking | 8 | 7 | 1 | 5 | 2 | 6 | 4 | 3 | |
| 5 | Max | 0.577496 | 0.500592 | 0.535451 | 0.686032 | 0.685014 | 0.455519 | 0.55241 | 0.606479 |
| Mean | 0.477899 | 0.461272 | 0.472833 | 0.604613 | 0.470727 | 0.406442 | 0.43525 | 0.483806 | |
| Min | 0.401935 | 0.390055 | 0.354047 | 0.545124 | 0.290476 | 0.317459 | 0.40125 | 0.387526 | |
| STD | 0.090135 | 0.061787 | 0.102922 | 0.072969 | 0.199459 | 0.077198 | 0.45452 | 0.111837 | |
| Ranking | 3 | 6 | 4 | 1 | 5 | 8 | 7 | 2 | |
| 6 | Max | 0.716201 | 0.826943 | 0.751183 | 0.802334 | 0.768344 | 0.76727 | 0.59858 | 0.790498 |
| Mean | 0.634075 | 0.674239 | 0.574338 | 0.641546 | 0.679048 | 0.575139 | 0.56555 | 0.736605 | |
| Min | 0.541354 | 0.522776 | 0.279256 | 0.394027 | 0.608891 | 0.388121 | 0.52555 | 0.669011 | |
| STD | 0.087904 | 0.152087 | 0.257223 | 0.217532 | 0.081431 | 0.189626 | 0.04414 | 0.061891 | |
| Ranking | 5 | 3 | 7 | 4 | 2 | 6 | 8 | 1 | |
| Summation | 32 | 29 | 18 | 20 | 13 | 33 | 27 | 8 | |
| Mean Rank | 6.4 | 5.8 | 3.6 | 4 | 2.6 | 6.6 | 5.4 | 1.6 | |
| Final Ranking | 7 | 6 | 3 | 4 | 2 | 8 | 5 | 1 | |
| Threshold | Metric | Comparative Methods | |||||||
|---|---|---|---|---|---|---|---|---|---|
| AO | WOA | SSA | AOA | PSO | MPA | DE | DAOA | ||
| 2 | Max | 13.77491 | 12.63881 | 14.5297 | 10.51233 | 12.64124 | 13.99214 | 13.25145 | 13.27729 |
| Mean | 11.98281 | 11.5817 | 12.11305 | 10.25692 | 11.54775 | 13.59189 | 12.2221 | 12.59842 | |
| Min | 10.73612 | 10.40495 | 10.15998 | 9.823369 | 10.95149 | 13.24731 | 12.01211 | 12.09539 | |
| STD | 1.591121 | 1.121728 | 2.221443 | 0.377446 | 0.948281 | 0.375522 | 0.25212 | 0.610259 | |
| Ranking | 5 | 6 | 4 | 8 | 7 | 1 | 3 | 2 | |
| 3 | Max | 15.86388 | 16.44113 | 15.82975 | 14.47644 | 14.87275 | 14.35493 | 15.32521 | 16.8866 |
| Mean | 14.94664 | 15.4703 | 15.49832 | 12.8352 | 13.88411 | 13.22512 | 14.14191 | 14.508 | |
| Min | 13.15776 | 14.64112 | 14.9623 | 11.6457 | 13.24925 | 11.88844 | 13.95478 | 12.02299 | |
| STD | 1.549381 | 0.908328 | 0.468519 | 1.468445 | 0.867645 | 1.24619 | 2.25141 | 2.433551 | |
| Ranking | 3 | 2 | 1 | 8 | 6 | 7 | 5 | 4 | |
| 4 | Max | 16.53801 | 13.20085 | 17.12718 | 16.28012 | 17.27728 | 16.84103 | 16.5474 | 16.96062 |
| Mean | 15.69685 | 12.29933 | 15.28839 | 15.53055 | 14.89734 | 15.66251 | 15.25145 | 16.84254 | |
| Min | 14.14842 | 11.1013 | 13.34897 | 14.77009 | 12.92993 | 14.78322 | 14.25114 | 16.71792 | |
| STD | 1.342654 | 1.080725 | 1.891116 | 0.755074 | 2.202842 | 1.06104 | 0.25496 | 0.121484 | |
| Ranking | 2 | 8 | 5 | 4 | 7 | 3 | 6 | 1 | |
| 5 | Max | 17.94799 | 16.77612 | 16.58759 | 17.72468 | 17.66078 | 15.7246 | 18.25641 | 20.50293 |
| Mean | 17.3332 | 16.14486 | 15.69308 | 15.81531 | 16.97316 | 15.13329 | 17.14954 | 17.45356 | |
| Min | 16.85601 | 15.47308 | 14.74147 | 12.33775 | 16.23477 | 14.29046 | 16.25415 | 15.26742 | |
| STD | 0.55884 | 0.652461 | 0.924385 | 3.016486 | 0.714359 | 0.749426 | 2.33365 | 2.722404 | |
| Ranking | 2 | 5 | 7 | 6 | 4 | 8 | 3 | 1 | |
| 6 | Max | 18.41641 | 16.73333 | 17.63323 | 17.86417 | 16.98896 | 17.69201 | 17.54845 | 20.23421 |
| Mean | 18.35135 | 16.26801 | 15.56212 | 16.33655 | 16.40105 | 15.7609 | 16.36652 | 19.55858 | |
| Min | 18.23814 | 15.46543 | 13.57085 | 14.13927 | 15.2753 | 12.90929 | 14.95854 | 18.29391 | |
| STD | 0.098406 | 0.697999 | 2.032367 | 1.950656 | 0.975254 | 2.52073 | 1.36945 | 1.096094 | |
| Ranking | 2 | 6 | 8 | 5 | 3 | 7 | 4 | 1 | |
| Summation | 14 | 27 | 25 | 31 | 27 | 26 | 21 | 9 | |
| Mean Rank | 2.80 | 5.40 | 5.00 | 6.20 | 5.40 | 5.20 | 4.20 | 1.80 | |
| Final Ranking | 2 | 6 | 4 | 8 | 6 | 5 | 3 | 1 | |
| Threshold | Metric | Comparative Methods | |||||||
|---|---|---|---|---|---|---|---|---|---|
| AO | WOA | SSA | AOA | PSO | MPA | DE | DAOA | ||
| 2 | Max | 0.406268 | 0.372786 | 0.488313 | 0.098776 | 0.381066 | 0.416608 | 0.35652 | 0.388003 |
| Mean | 0.247171 | 0.228951 | 0.26402 | 0.062589 | 0.260623 | 0.406156 | 0.32541 | 0.299891 | |
| Min | 0.055504 | 0.119071 | 0.090368 | 0.028341 | 0.156191 | 0.397245 | 0.32336 | 0.153948 | |
| STD | 0.177636 | 0.130221 | 0.203748 | 0.035257 | 0.113289 | 0.009773 | 0.45485 | 0.127294 | |
| Ranking | 6 | 7 | 4 | 8 | 5 | 1 | 2 | 3 | |
| 3 | Max | 0.542502 | 0.591926 | 0.62208 | 0.469152 | 0.556273 | 0.429674 | 0.55241 | 0.577128 |
| Mean | 0.48568 | 0.515704 | 0.385801 | 0.280354 | 0.407758 | 0.322274 | 0.51254 | 0.543097 | |
| Min | 0.382238 | 0.463366 | 0.116914 | 0.133011 | 0.319945 | 0.116597 | 0.46524 | 0.479899 | |
| STD | 0.089729 | 0.067526 | 0.254157 | 0.171862 | 0.12933 | 0.17818 | 0.51425 | 0.054785 | |
| Ranking | 4 | 2 | 6 | 8 | 5 | 7 | 3 | 1 | |
| 4 | Max | 0.643506 | 0.372327 | 0.649426 | 0.569008 | 0.616709 | 0.630261 | 0.53652 | 0.609209 |
| Mean | 0.540682 | 0.251443 | 0.515642 | 0.536243 | 0.469759 | 0.533684 | 0.51414 | 0.591323 | |
| Min | 0.343984 | 0.050187 | 0.373123 | 0.484871 | 0.345458 | 0.483908 | 0.46585 | 0.565499 | |
| STD | 0.170405 | 0.175466 | 0.138359 | 0.045049 | 0.137036 | 0.083651 | 0.25854 | 0.022911 | |
| Ranking | 2 | 8 | 5 | 3 | 7 | 4 | 6 | 1 | |
| 5 | Max | 0.568273 | 0.535196 | 0.563217 | 0.613346 | 0.611966 | 0.810183 | 0.58475 | 0.647781 |
| Mean | 0.53032 | 0.527867 | 0.529725 | 0.488084 | 0.578773 | 0.65271 | 0.54541 | 0.618783 | |
| Min | 0.455118 | 0.523047 | 0.467038 | 0.239554 | 0.556387 | 0.507866 | 0.51245 | 0.604212 | |
| STD | 0.065128 | 0.006451 | 0.054331 | 0.215235 | 0.029323 | 0.151553 | 0.25414 | 0.025113 | |
| Ranking | 5 | 7 | 6 | 8 | 3 | 1 | 4 | 2 | |
| 6 | Max | 0.728985 | 0.589624 | 0.791703 | 0.692676 | 0.55024 | 0.64645 | 0.42541 | 0.666054 |
| Mean | 0.688055 | 0.543363 | 0.751029 | 0.58507 | 0.505091 | 0.45092 | 0.42545 | 0.490001 | |
| Min | 0.658136 | 0.498046 | 0.689368 | 0.4474 | 0.427197 | 0.183286 | 0.40121 | 0.306101 | |
| STD | 0.036686 | 0.045797 | 0.054299 | 0.125371 | 0.067742 | 0.239853 | 0.15424 | 0.180105 | |
| Ranking | 2 | 4 | 1 | 3 | 5 | 7 | 8 | 6 | |
| Summation | 19 | 28 | 22 | 30 | 25 | 20 | 23 | 13 | |
| Mean Rank | 3.8 | 5.6 | 4.4 | 6 | 5 | 4 | 4.6 | 2.6 | |
| Final Ranking | 2 | 7 | 4 | 8 | 6 | 3 | 5 | 1 | |
| Threshold | Metric | Comparative Methods | |||||||
|---|---|---|---|---|---|---|---|---|---|
| AO | WOA | SSA | AOA | PSO | MPA | DE | DAOA | ||
| 2 | Max | 16.43851 | 15.52329 | 16.17178 | 13.34026 | 10.70417 | 13.80156 | 11.25454 | 17.02237 |
| Mean | 11.77337 | 13.62698 | 11.4258 | 10.90943 | 8.940243 | 11.97697 | 12.54562 | 13.0293 | |
| Min | 6.919499 | 10.52621 | 8.829951 | 8.362172 | 7.32234 | 10.25363 | 11.65856 | 10.1937 | |
| STD | 4.762311 | 2.707536 | 4.116175 | 2.491085 | 1.695636 | 1.776132 | 2.66525 | 3.558437 | |
| Ranking | 5 | 1 | 6 | 7 | 8 | 4 | 3 | 2 | |
| 3 | Max | 16.32218 | 14.37629 | 19.8809 | 17.08167 | 18.01695 | 16.32078 | 17.54548 | 18.7061 |
| Mean | 15.52933 | 13.1609 | 18.08332 | 15.15354 | 14.40812 | 12.59758 | 15.36525 | 14.62128 | |
| Min | 14.29581 | 11.73748 | 17.06783 | 12.61578 | 11.10578 | 8.576877 | 13.52541 | 11.41963 | |
| STD | 1.082679 | 1.331649 | 1.561118 | 2.294509 | 3.465768 | 3.880514 | 3.25414 | 3.722657 | |
| Ranking | 2 | 7 | 1 | 4 | 6 | 8 | 3 | 5 | |
| 4 | Max | 17.09702 | 17.55333 | 17.6847 | 19.73127 | 19.45281 | 19.19681 | 18.56958 | 20.754 |
| Mean | 16.23917 | 14.16665 | 16.1249 | 18.28651 | 15.02841 | 15.17751 | 16.52565 | 18.02446 | |
| Min | 14.73755 | 10.43243 | 13.88539 | 16.01418 | 9.874085 | 12.62804 | 15.96841 | 13.89724 | |
| STD | 1.30484 | 3.573146 | 1.988767 | 1.991944 | 4.830901 | 3.522425 | 2.59716 | 3.635777 | |
| Ranking | 4 | 8 | 5 | 1 | 7 | 6 | 3 | 2 | |
| 5 | Max | 20.47295 | 20.08702 | 20.21561 | 19.42765 | 17.8608 | 20.6646 | 18.49371 | 20.41022 |
| Mean | 17.9702 | 17.76647 | 18.04407 | 16.94888 | 17.74178 | 16.39606 | 16.46743 | 18.58232 | |
| Min | 15.06634 | 14.62097 | 15.09986 | 14.78632 | 17.57167 | 13.9744 | 15.45547 | 16.23457 | |
| STD | 2.725534 | 2.824863 | 2.643952 | 2.336768 | 0.151186 | 3.707817 | 2.65478 | 2.135811 | |
| Ranking | 3 | 4 | 2 | 6 | 5 | 8 | 7 | 1 | |
| 6 | Max | 21.16341 | 21.39185 | 21.70955 | 20.93593 | 23.09058 | 19.19694 | 20.12154 | 21.98094 |
| Mean | 19.12374 | 19.85058 | 16.84504 | 17.56936 | 16.8876 | 16.95177 | 18.15414 | 20.41186 | |
| Min | 16.5207 | 18.82027 | 12.89516 | 13.91389 | 12.51858 | 15.33711 | 16.36987 | 19.1292 | |
| STD | 2.372071 | 1.359806 | 4.477811 | 3.519921 | 5.519455 | 2.005675 | 1.64856 | 1.447282 | |
| Ranking | 3 | 2 | 8 | 5 | 7 | 6 | 4 | 1 | |
| Summation | 17 | 22 | 22 | 23 | 33 | 32 | 20 | 11 | |
| Mean Rank | 3.40 | 4.40 | 4.40 | 4.60 | 6.60 | 6.40 | 4.00 | 2.20 | |
| Final Ranking | 2 | 4 | 4 | 6 | 8 | 7 | 3 | 1 | |
| Threshold | Metric | Comparative Methods | |||||||
|---|---|---|---|---|---|---|---|---|---|
| AO | WOA | SSA | AOA | PSO | MPA | DE | DAOA | ||
| 2 | Max | 0.810797 | 0.784223 | 0.737701 | 0.807984 | 0.729805 | 0.784964 | 0.74548 | 0.810173 |
| Mean | 0.701346 | 0.726586 | 0.679275 | 0.652562 | 0.652503 | 0.748363 | 0.71254 | 0.777743 | |
| Min | 0.51097 | 0.614391 | 0.642633 | 0.512459 | 0.544859 | 0.707409 | 0.69584 | 0.738525 | |
| STD | 0.165486 | 0.097176 | 0.051142 | 0.148357 | 0.096133 | 0.03896 | 0.02514 | 0.036303 | |
| Ranking | 5 | 3 | 6 | 7 | 8 | 2 | 4 | 1 | |
| 3 | Max | 0.858715 | 0.84955 | 0.879072 | 0.869936 | 0.846474 | 0.810939 | 0.801454 | 0.862403 |
| Mean | 0.829113 | 0.82117 | 0.846587 | 0.810768 | 0.803586 | 0.714867 | 0.74125 | 0.826664 | |
| Min | 0.794989 | 0.799088 | 0.811991 | 0.7567 | 0.72253 | 0.656383 | 0.70215 | 0.798218 | |
| STD | 0.032103 | 0.025814 | 0.033591 | 0.05679 | 0.070237 | 0.083855 | 0.02193 | 0.032708 | |
| Ranking | 2 | 4 | 1 | 5 | 6 | 8 | 7 | 3 | |
| 4 | Max | 0.835799 | 0.786265 | 0.889158 | 0.89639 | 0.831634 | 0.877477 | 0.81256 | 0.842558 |
| Mean | 0.816523 | 0.765247 | 0.835175 | 0.863757 | 0.802387 | 0.856942 | 0.76585 | 0.820005 | |
| Min | 0.780192 | 0.748503 | 0.782824 | 0.807497 | 0.751995 | 0.824078 | 0.71369 | 0.776304 | |
| STD | 0.031483 | 0.019241 | 0.053186 | 0.04893 | 0.043828 | 0.028755 | 0.21454 | 0.037853 | |
| Ranking | 5 | 8 | 3 | 1 | 6 | 2 | 7 | 4 | |
| 5 | Max | 0.869899 | 0.862851 | 0.864441 | 0.895398 | 0.889066 | 0.86625 | 0.85645 | 0.901137 |
| Mean | 0.846835 | 0.858303 | 0.821075 | 0.863123 | 0.872182 | 0.862527 | 0.81021 | 0.874055 | |
| Min | 0.830022 | 0.850494 | 0.788281 | 0.836486 | 0.854754 | 0.856039 | 0.75645 | 0.837004 | |
| STD | 0.02066 | 0.006793 | 0.039165 | 0.029858 | 0.017162 | 0.005639 | 0.021114 | 0.033208 | |
| Ranking | 6 | 5 | 7 | 3 | 2 | 4 | 8 | 1 | |
| 6 | Max | 0.897095 | 0.882473 | 0.910729 | 0.920257 | 0.898452 | 0.884757 | 0.84145 | 0.890175 |
| Mean | 0.893914 | 0.868849 | 0.869001 | 0.850437 | 0.825776 | 0.87171 | 0.79568 | 0.874336 | |
| Min | 0.892161 | 0.848929 | 0.845306 | 0.787637 | 0.758887 | 0.848342 | 0.76582 | 0.855048 | |
| STD | 0.002759 | 0.017636 | 0.036248 | 0.066588 | 0.069962 | 0.020283 | 0.029447 | 0.017816 | |
| Ranking | 1 | 5 | 4 | 6 | 7 | 3 | 8 | 2 | |
| Summation | 19 | 25 | 21 | 22 | 29 | 19 | 34 | 11 | |
| Mean Rank | 3.8 | 5 | 4.2 | 4.4 | 5.8 | 3.8 | 6.8 | 2.2 | |
| Final Ranking | 2 | 6 | 4 | 5 | 7 | 2 | 8 | 1 | |
| Threshold | Metric | Comparative Methods | |||||||
|---|---|---|---|---|---|---|---|---|---|
| AO | WOA | SSA | AOA | PSO | MPA | DE | DAOA | ||
| 2 | Max | 0.513176 | 0.446739 | 0.469347 | 0.303735 | 0.468033 | 0.472675 | 0.465855 | 0.493285 |
| Mean | 0.420537 | 0.411645 | 0.379839 | 0.268241 | 0.395591 | 0.407972 | 0.432165 | 0.450537 | |
| Min | 0.297393 | 0.34853 | 0.312674 | 0.238732 | 0.353913 | 0.285825 | 0.415441 | 0.390067 | |
| STD | 0.111078 | 0.054773 | 0.080691 | 0.032912 | 0.062974 | 0.105845 | 0.065135 | 0.053842 | |
| Ranking | 3 | 4 | 7 | 8 | 6 | 5 | 2 | 1 | |
| 3 | Max | 0.639969 | 0.518822 | 0.570567 | 0.642874 | 0.550295 | 0.516935 | 0.541685 | 0.638931 |
| Mean | 0.539264 | 0.496794 | 0.476032 | 0.559045 | 0.522348 | 0.480253 | 0.451684 | 0.565094 | |
| Min | 0.483693 | 0.453509 | 0.406394 | 0.442666 | 0.507116 | 0.421783 | 0.401513 | 0.427189 | |
| STD | 0.087369 | 0.037488 | 0.084871 | 0.103997 | 0.024235 | 0.051181 | 0.165152 | 0.119529 | |
| Ranking | 3 | 5 | 7 | 2 | 4 | 6 | 8 | 1 | |
| 4 | Max | 0.635584 | 0.520955 | 0.647437 | 0.629088 | 0.583309 | 0.567589 | 0.545438 | 0.59171 |
| Mean | 0.558847 | 0.495081 | 0.624364 | 0.52697 | 0.542197 | 0.540923 | 0.484153 | 0.566602 | |
| Min | 0.496035 | 0.475477 | 0.612318 | 0.455541 | 0.49695 | 0.494102 | 0.351535 | 0.530519 | |
| STD | 0.070809 | 0.023378 | 0.019989 | 0.090753 | 0.043328 | 0.040678 | 0.91351 | 0.032038 | |
| Ranking | 3 | 7 | 1 | 6 | 4 | 5 | 8 | 2 | |
| 5 | Max | 0.625459 | 0.722689 | 0.626088 | 0.678775 | 0.695846 | 0.682412 | 0.646849 | 0.752727 |
| Mean | 0.574159 | 0.65505 | 0.608905 | 0.623735 | 0.681637 | 0.593452 | 0.568435 | 0.654905 | |
| Min | 0.544652 | 0.576303 | 0.589048 | 0.563386 | 0.661464 | 0.468945 | 0.515464 | 0.571449 | |
| STD | 0.044594 | 0.073823 | 0.018664 | 0.057878 | 0.01795 | 0.111084 | 0.51354 | 0.091489 | |
| Ranking | 7 | 2 | 5 | 4 | 1 | 6 | 8 | 3 | |
| 6 | Max | 0.678699 | 0.761036 | 0.655062 | 0.693875 | 0.74922 | 0.721603 | 0.711543 | 0.765842 |
| Mean | 0.655502 | 0.652531 | 0.558392 | 0.577277 | 0.735573 | 0.627711 | 0.658435 | 0.721667 | |
| Min | 0.613377 | 0.518519 | 0.460651 | 0.501179 | 0.727322 | 0.503922 | 0.615534 | 0.656329 | |
| STD | 0.036543 | 0.123255 | 0.09721 | 0.102534 | 0.011905 | 0.111878 | 0.153112 | 0.057742 | |
| Ranking | 4 | 5 | 8 | 7 | 1 | 6 | 3 | 2 | |
| Summation | 20 | 23 | 28 | 27 | 16 | 28 | 29 | 9 | |
| Mean Rank | 4 | 4.6 | 5.6 | 5.4 | 3.2 | 5.6 | 5.8 | 1.8 | |
| Final Ranking | 3 | 4 | 6 | 5 | 2 | 6 | 8 | 1 | |
| Threshold | Metric | Comparative Methods | |||||||
|---|---|---|---|---|---|---|---|---|---|
| AO | WOA | SSA | AOA | PSO | MPA | DE | DAOA | ||
| 2 | Max | 15.93985 | 14.4854 | 15.99861 | 17.14705 | 15.0977 | 16.05831 | 16.55749 | 17.53916 |
| Mean | 14.10613 | 13.00072 | 15.294 | 14.79149 | 12.72877 | 14.46087 | 14.35989 | 15.82038 | |
| Min | 12.39387 | 11.27298 | 14.72307 | 11.8401 | 11.51447 | 13.62663 | 11.9752 | 13.42614 | |
| STD | 1.776107 | 1.619943 | 0.648191 | 2.703178 | 2.051771 | 1.383874 | 2.296871 | 2.138085 | |
| Ranking | 6 | 7 | 2 | 3 | 8 | 4 | 5 | 1 | |
| 3 | Max | 19.40981 | 18.86115 | 17.48266 | 16.55749 | 17.95279 | 17.69139 | 19.44663 | 19.93627 |
| Mean | 18.72279 | 17.28213 | 16.52113 | 14.35989 | 16.27857 | 17.1941 | 19.26877 | 18.13099 | |
| Min | 18.29158 | 15.95137 | 15.92209 | 11.9752 | 14.07194 | 16.51551 | 19.01602 | 15.35808 | |
| STD | 0.60141 | 1.470694 | 0.841066 | 2.296871 | 1.994456 | 0.608547 | 0.224857 | 2.437657 | |
| Ranking | 2 | 4 | 6 | 8 | 7 | 5 | 1 | 3 | |
| 4 | Max | 18.13386 | 19.1223 | 18.90861 | 17.45745 | 19.1043 | 18.23407 | 18.83735 | 18.38066 |
| Mean | 16.94739 | 16.40329 | 17.94929 | 15.50893 | 18.1176 | 16.67171 | 17.28304 | 17.01377 | |
| Min | 15.98498 | 14.81291 | 16.68311 | 13.37735 | 16.4206 | 14.93103 | 15.51976 | 15.35199 | |
| STD | 1.091819 | 2.366025 | 1.14404 | 2.046204 | 1.476127 | 1.658724 | 1.494198 | 1.535719 | |
| Ranking | 5 | 7 | 2 | 8 | 1 | 6 | 3 | 4 | |
| 5 | Max | 20.21398 | 20.02404 | 21.27214 | 20.18245 | 18.91496 | 20.6886 | 20.25546 | 21.56663 |
| Mean | 18.99103 | 18.67004 | 20.53727 | 20.04683 | 18.26845 | 19.69356 | 18.05347 | 20.9167 | |
| Min | 17.36811 | 17.86499 | 19.6089 | 19.85296 | 17.79804 | 18.97903 | 17.51354 | 20.14592 | |
| STD | 1.464489 | 1.179571 | 0.848332 | 0.172297 | 0.578907 | 0.888634 | 0.15434 | 0.718025 | |
| Ranking | 5 | 6 | 2 | 3 | 7 | 4 | 8 | 1 | |
| 6 | Max | 21.09476 | 21.57137 | 21.3434 | 22.18733 | 23.89824 | 19.44663 | 21.54999 | 22.99988 |
| Mean | 20.41811 | 20.42529 | 20.47827 | 21.60813 | 22.10233 | 19.26877 | 20.25987 | 21.55413 | |
| Min | 19.49805 | 19.07294 | 19.90813 | 21.16347 | 21.02315 | 19.01602 | 19.64856 | 19.98576 | |
| STD | 0.825716 | 1.261926 | 0.761747 | 0.525019 | 1.565831 | 0.224857 | 0.16655 | 1.510799 | |
| Ranking | 6 | 5 | 4 | 2 | 1 | 8 | 7 | 3 | |
| Summation | 24 | 29 | 16 | 24 | 24 | 27 | 24 | 12 | |
| Mean Rank | 4.80 | 5.80 | 3.20 | 4.80 | 4.80 | 5.40 | 4.80 | 2.40 | |
| Final Ranking | 3 | 8 | 2 | 3 | 3 | 7 | 3 | 1 | |
| Threshold | Metric | Comparative Methods | |||||||
|---|---|---|---|---|---|---|---|---|---|
| AO | WOA | SSA | AOA | PSO | MPA | DE | DAOA | ||
| 2 | Max | 0.670559 | 0.663185 | 0.670191 | 0.656707 | 0.638999 | 0.641328 | 0.625454 | 0.652777 |
| Mean | 0.615808 | 0.577209 | 0.627177 | 0.602737 | 0.588212 | 0.607857 | 0.58944 | 0.638984 | |
| Min | 0.554493 | 0.497657 | 0.570064 | 0.537508 | 0.547586 | 0.575353 | 0.523565 | 0.622532 | |
| STD | 0.058311 | 0.082951 | 0.051531 | 0.060392 | 0.046546 | 0.032998 | 0.051351 | 0.015297 | |
| Ranking | 3 | 8 | 2 | 5 | 7 | 4 | 6 | 1 | |
| 3 | Max | 0.728918 | 0.677149 | 0.714839 | 0.663648 | 0.667938 | 0.717054 | 0.646841 | 0.704409 |
| Mean | 0.719125 | 0.660935 | 0.666536 | 0.59634 | 0.629253 | 0.664745 | 0.551844 | 0.671047 | |
| Min | 0.712656 | 0.629315 | 0.6219 | 0.510537 | 0.576046 | 0.622826 | 0.493545 | 0.639151 | |
| STD | 0.008626 | 0.027387 | 0.046578 | 0.078213 | 0.047636 | 0.047965 | 0.050315 | 0.032654 | |
| Ranking | 1 | 5 | 3 | 7 | 6 | 4 | 8 | 2 | |
| 4 | Max | 0.748435 | 0.70822 | 0.687422 | 0.729796 | 0.706817 | 0.729298 | 0.715434 | 0.720751 |
| Mean | 0.676713 | 0.668007 | 0.675521 | 0.661629 | 0.681985 | 0.674847 | 0.698434 | 0.678177 | |
| Min | 0.633531 | 0.627958 | 0.660419 | 0.590072 | 0.636336 | 0.601496 | 0.651354 | 0.614625 | |
| STD | 0.062543 | 0.040131 | 0.013783 | 0.069924 | 0.039584 | 0.065964 | 0.05134 | 0.056087 | |
| Ranking | 4 | 7 | 5 | 8 | 2 | 6 | 1 | 3 | |
| 5 | Max | 0.760316 | 0.744595 | 0.760228 | 0.722269 | 0.701088 | 0.713294 | 0.715469 | 0.754593 |
| Mean | 0.735256 | 0.721088 | 0.707533 | 0.706524 | 0.686357 | 0.694403 | 0.694685 | 0.740905 | |
| Min | 0.719429 | 0.693768 | 0.680723 | 0.680577 | 0.665994 | 0.665244 | 0.645135 | 0.720782 | |
| STD | 0.021952 | 0.025627 | 0.045637 | 0.022641 | 0.018212 | 0.025618 | 0.100351 | 0.0178 | |
| Ranking | 2 | 3 | 4 | 5 | 8 | 7 | 6 | 1 | |
| 6 | Max | 0.778606 | 0.802338 | 0.787056 | 0.759268 | 0.775117 | 0.754872 | 0.714354 | 0.759996 |
| Mean | 0.745632 | 0.767851 | 0.728188 | 0.743422 | 0.760561 | 0.715035 | 0.69456 | 0.757846 | |
| Min | 0.717157 | 0.728973 | 0.685219 | 0.730438 | 0.737718 | 0.682379 | 0.646758 | 0.755781 | |
| STD | 0.030971 | 0.036879 | 0.052747 | 0.014627 | 0.02003 | 0.036776 | 0.14353 | 0.002109 | |
| Ranking | 4 | 1 | 6 | 5 | 2 | 7 | 8 | 3 | |
| Summation | 14 | 24 | 20 | 30 | 25 | 28 | 29 | 10 | |
| Mean Rank | 2.8 | 4.8 | 4 | 6 | 5 | 5.6 | 5.8 | 2 | |
| Final Ranking | 2 | 4 | 3 | 8 | 5 | 6 | 7 | 1 | |
| Threshold | Metric | Comparative Methods | |||||||
|---|---|---|---|---|---|---|---|---|---|
| AO | WOA | SSA | AOA | PSO | MPA | DE | DAOA | ||
| 2 | Max | 14.29003 | 14.99666 | 13.23076 | 14.2586 | 13.67276 | 13.88699 | 13.25669 | 13.62076 |
| Mean | 12.13124 | 13.5679 | 12.00795 | 13.53452 | 12.69334 | 12.56354 | 12.76658 | 12.88169 | |
| Min | 11.02309 | 10.86625 | 10.71159 | 13.00777 | 11.90018 | 10.75974 | 11.81577 | 11.91395 | |
| STD | 1.86979 | 2.340995 | 1.261197 | 0.648342 | 0.900847 | 1.618015 | 0.727573 | 0.876084 | |
| Ranking | 7 | 1 | 8 | 2 | 5 | 6 | 4 | 3 | |
| 3 | Max | 17.13609 | 13.26265 | 15.86297 | 16.70329 | 16.39937 | 16.77276 | 15.56435 | 16.70329 |
| Mean | 14.80299 | 12.70421 | 14.27818 | 14.73781 | 15.54628 | 15.68245 | 14.56435 | 14.73781 | |
| Min | 11.88525 | 11.81721 | 13.19349 | 13.30319 | 14.95156 | 13.81152 | 13.54531 | 13.30319 | |
| STD | 2.673792 | 0.776716 | 1.40325 | 1.761111 | 0.757696 | 1.627652 | 0.35531 | 1.761111 | |
| Ranking | 3 | 8 | 7 | 4 | 2 | 1 | 6 | 4 | |
| 4 | Max | 19.72094 | 16.65405 | 18.53668 | 18.36352 | 18.18219 | 16.8171 | 16.16153 | 17.29736 |
| Mean | 17.42215 | 15.6372 | 16.4182 | 17.40203 | 16.17031 | 14.66404 | 15.61533 | 16.81609 | |
| Min | 14.47883 | 14.30732 | 14.08529 | 16.52227 | 14.97604 | 13.31745 | 14.65844 | 15.89593 | |
| STD | 2.679828 | 1.204274 | 2.233427 | 0.923342 | 1.752483 | 1.884058 | 0.513153 | 0.797164 | |
| Ranking | 1 | 6 | 4 | 2 | 5 | 8 | 7 | 3 | |
| 5 | Max | 19.95971 | 18.41277 | 19.46272 | 20.77475 | 19.71927 | 18.09801 | 20.15615 | 21.7643 |
| Mean | 16.21653 | 17.16753 | 18.12133 | 17.29533 | 17.30211 | 16.23449 | 19.56652 | 18.92589 | |
| Min | 12.15348 | 16.07533 | 17.44474 | 14.33996 | 15.60841 | 15.08771 | 18.91434 | 16.95589 | |
| STD | 3.912932 | 1.176211 | 1.161691 | 3.249246 | 2.148801 | 1.628114 | 0.44345 | 2.519088 | |
| Ranking | 8 | 6 | 3 | 5 | 4 | 7 | 1 | 2 | |
| 6 | Max | 19.70338 | 18.99666 | 19.15752 | 19.97796 | 17.4372 | 20.54731 | 20.48618 | 21.16495 |
| Mean | 17.55594 | 18.51687 | 18.95646 | 18.38941 | 16.73036 | 17.68373 | 17.67164 | 19.65434 | |
| Min | 14.92323 | 17.6852 | 18.62038 | 17.45989 | 16.33641 | 15.14494 | 14.56169 | 17.72153 | |
| STD | 2.426738 | 0.723084 | 0.292923 | 1.382353 | 0.613485 | 2.715789 | 3.51355 | 1.760107 | |
| Ranking | 7 | 3 | 2 | 4 | 8 | 5 | 6 | 1 | |
| Summation | 26 | 24 | 24 | 17 | 24 | 27 | 24 | 13 | |
| Mean Rank | 5.20 | 4.80 | 4.80 | 3.40 | 4.80 | 5.40 | 4.80 | 2.60 | |
| Final Ranking | 7 | 3 | 3 | 2 | 3 | 8 | 3 | 1 | |
| Threshold | Metric | Comparative Methods | |||||||
|---|---|---|---|---|---|---|---|---|---|
| AO | WOA | SSA | AOA | PSO | MPA | DE | DAOA | ||
| 2 | Max | 0.585171 | 0.575848 | 0.507334 | 0.584204 | 0.554758 | 0.583274 | 0.545458 | 0.566448 |
| Mean | 0.529789 | 0.511152 | 0.47466 | 0.558141 | 0.510173 | 0.517028 | 0.53251 | 0.551596 | |
| Min | 0.451429 | 0.421518 | 0.440468 | 0.528648 | 0.468501 | 0.418339 | 0.510512 | 0.540869 | |
| STD | 0.069769 | 0.08013 | 0.033459 | 0.027936 | 0.043202 | 0.087123 | 0.051651 | 0.013279 | |
| Ranking | 4 | 6 | 8 | 1 | 7 | 5 | 3 | 2 | |
| 3 | Max | 0.633602 | 0.566445 | 0.593976 | 0.643107 | 0.624665 | 0.587316 | 0.584547 | 0.620738 |
| Mean | 0.573218 | 0.53021 | 0.539426 | 0.586845 | 0.561226 | 0.554322 | 0.52548 | 0.6091 | |
| Min | 0.531603 | 0.476157 | 0.445784 | 0.557298 | 0.51424 | 0.500738 | 0.49522 | 0.590855 | |
| STD | 0.053527 | 0.047709 | 0.081464 | 0.048745 | 0.057022 | 0.046817 | 0.15479 | 0.015999 | |
| Ranking | 3 | 7 | 6 | 2 | 4 | 5 | 8 | 1 | |
| 4 | Max | 0.625898 | 0.599759 | 0.688634 | 0.647084 | 0.588007 | 0.619283 | 0.60147 | 0.651858 |
| Mean | 0.620455 | 0.584845 | 0.631581 | 0.584162 | 0.561247 | 0.577285 | 0.564549 | 0.631427 | |
| Min | 0.616739 | 0.561825 | 0.576099 | 0.541342 | 0.520971 | 0.552471 | 0.514625 | 0.594978 | |
| STD | 0.004818 | 0.020224 | 0.056284 | 0.055664 | 0.035503 | 0.036571 | 0.51556 | 0.031643 | |
| Ranking | 3 | 4 | 1 | 5 | 8 | 6 | 7 | 2 | |
| 5 | Max | 0.639309 | 0.611599 | 0.670374 | 0.706368 | 0.662426 | 0.621919 | 0.61444 | 0.688438 |
| Mean | 0.580397 | 0.593407 | 0.626018 | 0.659053 | 0.615559 | 0.601187 | 0.53255 | 0.657403 | |
| Min | 0.481486 | 0.57193 | 0.58953 | 0.596054 | 0.552583 | 0.585043 | 0.50144 | 0.634943 | |
| STD | 0.086179 | 0.020038 | 0.040992 | 0.056805 | 0.056666 | 0.018861 | 0.254516 | 0.027759 | |
| Ranking | 7 | 6 | 3 | 1 | 4 | 5 | 8 | 2 | |
| 6 | Max | 0.732761 | 0.721116 | 0.702031 | 0.639447 | 0.669456 | 0.741237 | 0.62156 | 0.670238 |
| Mean | 0.617062 | 0.675843 | 0.66037 | 0.614623 | 0.623098 | 0.698053 | 0.60156 | 0.621129 | |
| Min | 0.500442 | 0.628145 | 0.615404 | 0.582216 | 0.593419 | 0.632455 | 0.581685 | 0.555772 | |
| STD | 0.116162 | 0.046533 | 0.043408 | 0.029359 | 0.04067 | 0.057751 | 0.051617 | 0.058938 | |
| Ranking | 6 | 2 | 3 | 7 | 4 | 1 | 8 | 5 | |
| Summation | 23 | 25 | 21 | 16 | 27 | 22 | 34 | 12 | |
| Mean Rank | 4.6 | 5 | 4.2 | 3.2 | 5.4 | 4.4 | 6.8 | 2.4 | |
| Final Ranking | 5 | 6 | 3 | 2 | 7 | 4 | 8 | 1 | |
| Threshold | Metric | Comparative Methods | |||||||
|---|---|---|---|---|---|---|---|---|---|
| AO | WOA | SSA | AOA | PSO | MPA | DE | DAOA | ||
| 2 | Max | 13.20515 | 14.81541 | 13.46643 | 15.49531 | 15.62603 | 15.20099 | 10.56165 | 11.17017 |
| Mean | 12.41868 | 11.78621 | 13.27459 | 12.55658 | 13.52688 | 13.84887 | 8.68468 | 9.014158 | |
| Min | 11.32961 | 9.315363 | 13.00626 | 9.442963 | 9.675792 | 12.68271 | 7.51654 | 6.574355 | |
| STD | 0.973697 | 2.792211 | 0.239434 | 3.029961 | 3.339657 | 1.269397 | 2.26558 | 2.311011 | |
| Ranking | 5 | 6 | 3 | 4 | 2 | 1 | 8 | 7 | |
| 3 | Max | 16.56695 | 17.57886 | 16.2908 | 16.58067 | 16.53626 | 15.88719 | 16.98971 | 18.01761 |
| Mean | 15.69994 | 15.46688 | 14.50615 | 14.19241 | 14.84154 | 15.17141 | 14.15556 | 16.2308 | |
| Min | 15.1533 | 14.25297 | 13.45161 | 10.44799 | 12.24822 | 14.03169 | 10.44162 | 13.04052 | |
| STD | 0.759328 | 1.835835 | 1.554045 | 3.283571 | 2.280885 | 0.997755 | 3.255033 | 2.769505 | |
| Ranking | 2 | 3 | 6 | 7 | 5 | 4 | 8 | 1 | |
| 4 | Max | 16.90963 | 17.97752 | 17.78105 | 17.43689 | 16.94918 | 19.34317 | 17.45543 | 19.60255 |
| Mean | 15.08816 | 14.69292 | 16.45214 | 14.2211 | 12.8884 | 16.99385 | 14.22669 | 17.64468 | |
| Min | 11.44578 | 11.37666 | 14.68077 | 11.04897 | 8.255611 | 13.29746 | 11.4265 | 16.42001 | |
| STD | 3.154397 | 3.300544 | 1.596797 | 3.194184 | 4.374921 | 3.240157 | 3.143737 | 1.71328 | |
| Ranking | 4 | 5 | 3 | 7 | 8 | 2 | 6 | 1 | |
| 5 | Max | 19.95651 | 19.11383 | 17.60007 | 20.11243 | 19.91776 | 20.2333 | 19.11482 | 20.05669 |
| Mean | 17.89666 | 15.96258 | 16.58689 | 18.8553 | 17.88667 | 18.66736 | 15.96018 | 18.17262 | |
| Min | 16.75255 | 10.41909 | 15.4047 | 16.91343 | 15.05058 | 17.34947 | 10.42944 | 16.15425 | |
| STD | 1.78753 | 4.815784 | 1.1074 | 1.705889 | 2.531472 | 1.457831 | 4.39728 | 1.954685 | |
| Ranking | 4 | 7 | 6 | 1 | 5 | 2 | 8 | 3 | |
| 6 | Max | 21.4354 | 20.29606 | 21.05977 | 22.61835 | 20.03635 | 21.47684 | 20.24338 | 21.70695 |
| Mean | 19.4399 | 17.25886 | 19.58102 | 19.89625 | 19.37838 | 18.84269 | 17.35445 | 20.29721 | |
| Min | 17.7851 | 14.28299 | 17.61442 | 17.48669 | 18.99359 | 15.24118 | 14.23249 | 19.17387 | |
| STD | 1.848842 | 3.007007 | 1.773725 | 2.580068 | 0.572543 | 3.22842 | 3.234234 | 1.290597 | |
| Ranking | 4 | 8 | 3 | 2 | 5 | 6 | 7 | 1 | |
| Summation | 19 | 29 | 21 | 21 | 25 | 15 | 37 | 13 | |
| Mean Rank | 3.80 | 5.80 | 4.20 | 4.20 | 5.00 | 3.00 | 7.40 | 2.60 | |
| Final Ranking | 3 | 7 | 4 | 4 | 6 | 2 | 8 | 1 | |
| Threshold | Metric | Comparative Methods | |||||||
|---|---|---|---|---|---|---|---|---|---|
| AO | WOA | SSA | AOA | PSO | MPA | DE | DAOA | ||
| 2 | Max | 0.73278 | 0.712288 | 0.560122 | 0.72505 | 0.733305 | 0.723576 | 0.564865 | 0.730313 |
| Mean | 0.643606 | 0.617796 | 0.485729 | 0.645712 | 0.676013 | 0.683473 | 0.448642 | 0.710998 | |
| Min | 0.567798 | 0.478926 | 0.34029 | 0.519034 | 0.567055 | 0.639678 | 0.348649 | 0.691961 | |
| STD | 0.0833 | 0.122848 | 0.125965 | 0.110867 | 0.094402 | 0.042071 | 0.184476 | 0.019178 | |
| Ranking | 5 | 6 | 7 | 4 | 3 | 2 | 8 | 1 | |
| 3 | Max | 0.773342 | 0.738051 | 0.693211 | 0.729915 | 0.747102 | 0.706363 | 0.694864 | 0.760805 |
| Mean | 0.770604 | 0.721144 | 0.67817 | 0.65064 | 0.677895 | 0.700246 | 0.676463 | 0.725786 | |
| Min | 0.768211 | 0.698601 | 0.665159 | 0.495505 | 0.593947 | 0.693075 | 0.666456 | 0.672091 | |
| STD | 0.002582 | 0.02032 | 0.014136 | 0.134362 | 0.077634 | 0.006707 | 0.017743 | 0.047213 | |
| Ranking | 1 | 3 | 5 | 8 | 6 | 4 | 7 | 2 | |
| 4 | Max | 0.742182 | 0.74847 | 0.727827 | 0.732508 | 0.782284 | 0.746116 | 0.728807 | 0.790683 |
| Mean | 0.687277 | 0.664643 | 0.701216 | 0.669205 | 0.739291 | 0.579421 | 0.652713 | 0.763686 | |
| Min | 0.610196 | 0.549827 | 0.659058 | 0.632616 | 0.701494 | 0.394956 | 0.62996 | 0.719773 | |
| STD | 0.068731 | 0.102883 | 0.036927 | 0.055044 | 0.040645 | 0.176253 | 0.050762 | 0.038362 | |
| Ranking | 4 | 6 | 3 | 5 | 2 | 8 | 7 | 1 | |
| 5 | Max | 0.79007 | 0.805645 | 0.822652 | 0.819285 | 0.748588 | 0.740407 | 0.791501 | 0.798539 |
| Mean | 0.76336 | 0.699754 | 0.772285 | 0.780482 | 0.714524 | 0.728473 | 0.774441 | 0.775382 | |
| Min | 0.733348 | 0.508825 | 0.736218 | 0.751391 | 0.65435 | 0.707817 | 0.732424 | 0.760992 | |
| STD | 0.028505 | 0.165678 | 0.044956 | 0.034973 | 0.052264 | 0.01796 | 0.036023 | 0.020251 | |
| Ranking | 5 | 8 | 4 | 1 | 7 | 6 | 3 | 2 | |
| 6 | Max | 0.767482 | 0.807074 | 0.769107 | 0.784627 | 0.803515 | 0.797439 | 0.762609 | 0.800054 |
| Mean | 0.748283 | 0.77661 | 0.748259 | 0.768866 | 0.791177 | 0.766987 | 0.745271 | 0.762369 | |
| Min | 0.713817 | 0.723776 | 0.710988 | 0.751543 | 0.768949 | 0.742903 | 0.718795 | 0.741915 | |
| STD | 0.029913 | 0.045934 | 0.032353 | 0.016597 | 0.019288 | 0.02782 | 0.030372 | 0.032675 | |
| Ranking | 6 | 2 | 7 | 3 | 1 | 4 | 8 | 5 | |
| Summation | 21 | 25 | 26 | 21 | 19 | 24 | 33 | 11 | |
| Mean Rank | 4.2 | 5 | 5.2 | 4.2 | 3.8 | 4.8 | 6.6 | 2.2 | |
| Final Ranking | 3 | 6 | 7 | 3 | 2 | 5 | 8 | 1 | |
| Threshold | Metric | Comparative Methods | |||||||
|---|---|---|---|---|---|---|---|---|---|
| AO | WOA | SSA | AOA | PSO | MPA | DE | DAOA | ||
| 2 | Max | 13.33503 | 12.70418 | 13.72589 | 13.87541 | 15.0179 | 13.22514 | 13.93463 | 14.2634 |
| Mean | 11.87001 | 11.35382 | 11.90455 | 12.30024 | 12.0788 | 11.78679 | 11.15836 | 13.26591 | |
| Min | 9.627695 | 9.504035 | 10.85728 | 11.2966 | 9.738495 | 9.930564 | 10.85364 | 11.58005 | |
| STD | 1.972111 | 1.657497 | 1.583232 | 1.381142 | 2.690154 | 1.686571 | 1.547691 | 1.468158 | |
| Ranking | 5 | 7 | 4 | 2 | 3 | 6 | 8 | 1 | |
| 3 | Max | 17.28625 | 16.57081 | 13.49278 | 14.92705 | 17.54352 | 15.13415 | 16.09049 | 16.35347 |
| Mean | 14.74539 | 15.01544 | 12.50533 | 14.48463 | 14.21932 | 14.43299 | 15.04035 | 15.21107 | |
| Min | 9.822409 | 12.05905 | 11.30417 | 14.18863 | 12.3542 | 13.62575 | 12.05713 | 13.80324 | |
| STD | 4.264167 | 2.561471 | 1.109849 | 0.390375 | 2.885987 | 0.759773 | 2.554852 | 1.295669 | |
| Ranking | 4 | 3 | 8 | 5 | 7 | 6 | 2 | 1 | |
| 4 | Max | 17.00622 | 17.0363 | 16.18631 | 17.26998 | 15.66957 | 17.89161 | 15.60819 | 18.921 |
| Mean | 14.98358 | 12.94104 | 14.49141 | 15.41649 | 13.31057 | 14.87131 | 13.39887 | 15.69837 | |
| Min | 13.05113 | 8.268197 | 13.05194 | 13.97806 | 8.738069 | 11.04877 | 8.879347 | 13.14273 | |
| STD | 1.979087 | 4.412494 | 1.582717 | 1.684754 | 3.96057 | 3.491248 | 3.703273 | 2.946311 | |
| Ranking | 3 | 8 | 5 | 2 | 7 | 4 | 6 | 1 | |
| 5 | Max | 19.33652 | 17.74905 | 19.68408 | 19.66732 | 20.9309 | 17.50957 | 17.83407 | 19.59432 |
| Mean | 17.51972 | 16.46752 | 14.99745 | 15.68612 | 17.03271 | 15.38835 | 17.15497 | 17.61533 | |
| Min | 16.56115 | 14.43826 | 9.169088 | 8.179696 | 14.13458 | 12.63953 | 15.98558 | 15.74747 | |
| STD | 1.574189 | 1.777538 | 5.349667 | 6.504749 | 3.506793 | 2.494939 | 1.29808 | 1.925829 | |
| Ranking | 2 | 5 | 8 | 6 | 4 | 7 | 3 | 1 | |
| 6 | Max | 22.35209 | 17.96208 | 20.45875 | 19.73508 | 19.56292 | 19.22911 | 19.91049 | 21.32792 |
| Mean | 19.18047 | 17.28236 | 15.36816 | 17.47522 | 17.49288 | 16.85966 | 15.75105 | 18.93027 | |
| Min | 14.9198 | 15.96895 | 12.60476 | 14.82897 | 13.72243 | 12.6153 | 8.963192 | 16.39383 | |
| STD | 3.833964 | 1.137678 | 4.413974 | 2.475771 | 3.270534 | 3.684026 | 6.585767 | 2.46997 | |
| Ranking | 1 | 5 | 8 | 4 | 3 | 6 | 7 | 2 | |
| Summation | 15 | 28 | 33 | 19 | 24 | 29 | 26 | 6 | |
| Mean Rank | 3.00 | 5.60 | 6.60 | 3.80 | 4.80 | 5.80 | 5.20 | 1.20 | |
| Final Ranking | 2 | 6 | 8 | 3 | 4 | 7 | 5 | 1 | |
| p-value | 2.254 × 10 | 3.455 × 10 | 4.254 × 10 | 2.368 × 10 | 6.589 × 10 | 4.554 × 10 | 3.887 × 10 | NaN | |
| Wilcoxon sign | 1 | 1 | 1 | 1 | 1 | 1 | 1 | NaN | |
| Threshold | Metric | Comparative Methods | |||||||
|---|---|---|---|---|---|---|---|---|---|
| AO | WOA | SSA | AOA | PSO | MPA | DE | DAOA | ||
| 2 | Max | 0.576023 | 0.454896 | 0.60648 | 0.629978 | 0.625702 | 0.567363 | 0.699381 | 0.633192 |
| Mean | 0.448062 | 0.416027 | 0.47257 | 0.542842 | 0.482223 | 0.501881 | 0.444351 | 0.525409 | |
| Min | 0.313677 | 0.343605 | 0.371043 | 0.424905 | 0.33731 | 0.400359 | 0.354733 | 0.383819 | |
| STD | 0.131291 | 0.062776 | 0.121013 | 0.10595 | 0.144201 | 0.089145 | 0.142674 | 0.128078 | |
| Ranking | 6 | 8 | 5 | 1 | 4 | 3 | 7 | 2 | |
| 3 | Max | 0.62594 | 0.649127 | 0.606039 | 0.621 | 0.673756 | 0.482675 | 0.653015 | 0.670905 |
| Mean | 0.521445 | 0.5597 | 0.577973 | 0.59104 | 0.509775 | 0.443829 | 0.570487 | 0.644174 | |
| Min | 0.328192 | 0.41791 | 0.533724 | 0.562574 | 0.411628 | 0.394558 | 0.52212 | 0.615842 | |
| STD | 0.167546 | 0.124184 | 0.038779 | 0.029241 | 0.142927 | 0.044974 | 0.020342 | 0.027566 | |
| Ranking | 6 | 5 | 3 | 2 | 7 | 8 | 4 | 1 | |
| 4 | Max | 0.659553 | 0.689073 | 0.651031 | 0.688422 | 0.619171 | 0.654426 | 0.609938 | 0.702364 |
| Mean | 0.585789 | 0.577215 | 0.572652 | 0.650246 | 0.538835 | 0.569699 | 0.444351 | 0.581725 | |
| Min | 0.457314 | 0.421803 | 0.524473 | 0.602193 | 0.438635 | 0.46478 | 0.373331 | 0.415275 | |
| STD | 0.111669 | 0.138856 | 0.068471 | 0.043955 | 0.091893 | 0.096422 | 0.144427 | 0.148926 | |
| Ranking | 2 | 4 | 5 | 1 | 7 | 6 | 8 | 3 | |
| 5 | Max | 0.71179 | 0.653103 | 0.679673 | 0.728578 | 0.739026 | 0.654866 | 0.710614 | 0.723238 |
| Mean | 0.667834 | 0.608033 | 0.628176 | 0.612995 | 0.625972 | 0.569295 | 0.65234 | 0.680701 | |
| Min | 0.645318 | 0.518308 | 0.529437 | 0.405271 | 0.535025 | 0.49256 | 0.543264 | 0.618906 | |
| STD | 0.038071 | 0.077705 | 0.085537 | 0.180276 | 0.103782 | 0.081513 | 0.020135 | 0.054767 | |
| Ranking | 2 | 7 | 4 | 6 | 5 | 8 | 3 | 1 | |
| 6 | Max | 0.749897 | 0.758664 | 0.700491 | 0.739996 | 0.733031 | 0.674032 | 0.621232 | 0.726155 |
| Mean | 0.700148 | 0.702408 | 0.625182 | 0.675597 | 0.681783 | 0.590369 | 0.60327 | 0.683228 | |
| Min | 0.614634 | 0.666246 | 0.567525 | 0.585931 | 0.60607 | 0.43936 | 0.513341 | 0.620501 | |
| STD | 0.074387 | 0.049377 | 0.068218 | 0.08008 | 0.066923 | 0.131032 | 0.780799 | 0.05554 | |
| Ranking | 2 | 1 | 6 | 5 | 4 | 8 | 7 | 3 | |
| Summation | 18 | 25 | 23 | 15 | 27 | 33 | 29 | 10 | |
| Mean Rank | 3.6 | 5 | 4.6 | 3 | 5.4 | 6.6 | 5.8 | 2 | |
| Final Ranking | 3 | 5 | 4 | 2 | 6 | 8 | 7 | 1 | |
| p-value | 3.856 × 10 | 2.669 × 10 | 2.665 × 10 | 2.814 × 10 | 6.665 × 10 | 3.854 × 10 | 3.225 × 10 | NaN | |
| Wilcoxon sign | 1 | 1 | 1 | 1 | 1 | 1 | 1 | NaN | |
Publisher’s Note: MDPI stays neutral with regard to jurisdictional claims in published maps and institutional affiliations. |
© 2021 by the authors. Licensee MDPI, Basel, Switzerland. This article is an open access article distributed under the terms and conditions of the Creative Commons Attribution (CC BY) license (https://creativecommons.org/licenses/by/4.0/).
Share and Cite
Abualigah, L.; Diabat, A.; Sumari, P.; Gandomi, A.H. A Novel Evolutionary Arithmetic Optimization Algorithm for Multilevel Thresholding Segmentation of COVID-19 CT Images. Processes 2021, 9, 1155. https://doi.org/10.3390/pr9071155
Abualigah L, Diabat A, Sumari P, Gandomi AH. A Novel Evolutionary Arithmetic Optimization Algorithm for Multilevel Thresholding Segmentation of COVID-19 CT Images. Processes. 2021; 9(7):1155. https://doi.org/10.3390/pr9071155
Chicago/Turabian StyleAbualigah, Laith, Ali Diabat, Putra Sumari, and Amir H. Gandomi. 2021. "A Novel Evolutionary Arithmetic Optimization Algorithm for Multilevel Thresholding Segmentation of COVID-19 CT Images" Processes 9, no. 7: 1155. https://doi.org/10.3390/pr9071155