
Residential Demand Response Strategy Based on Deep Deterministic Policy Gradient

Abstract
:1. Introduction
2. Related Work
2.1. Residential Demand Response
2.2. Deep Reinforcement Learning
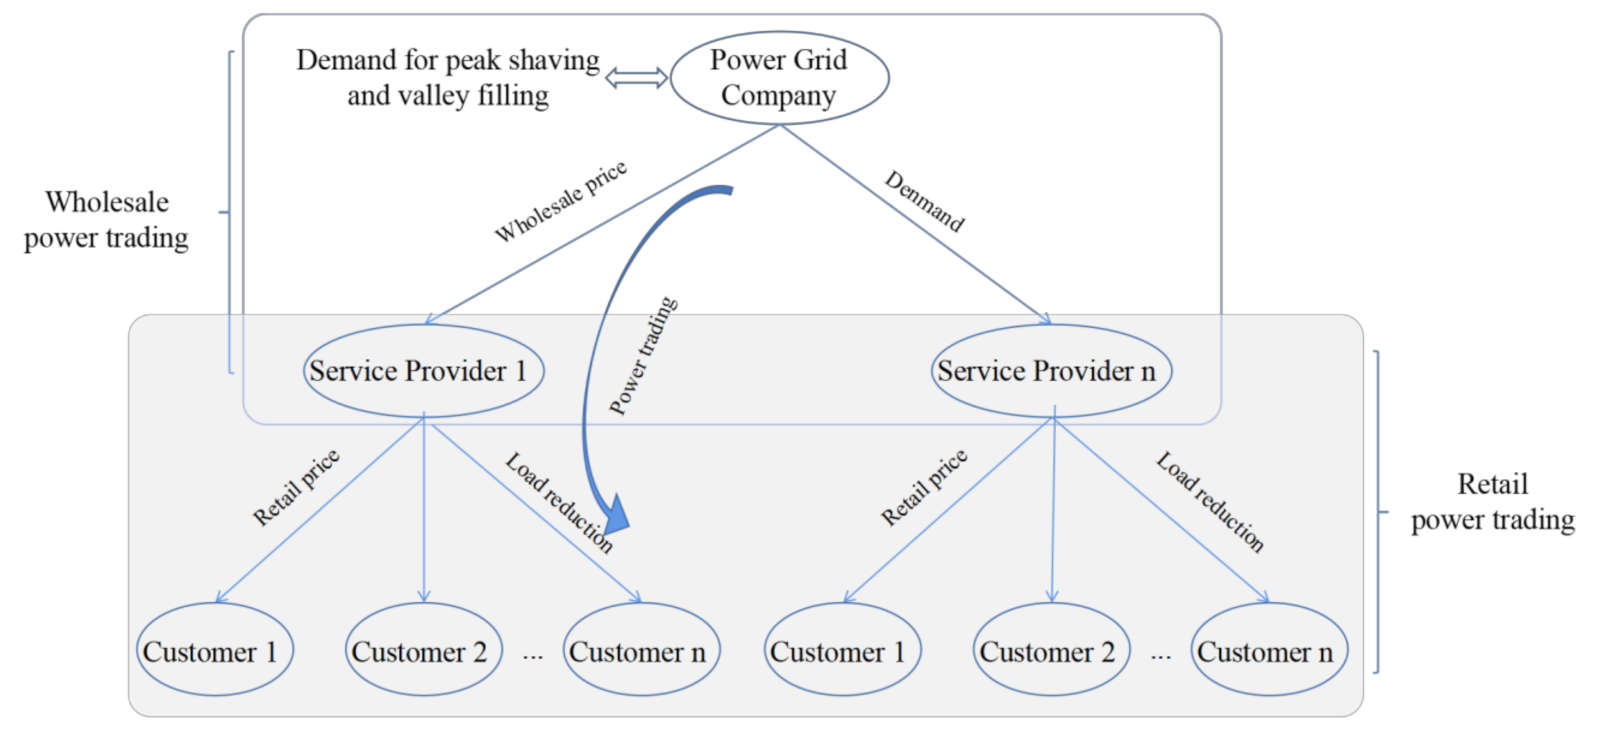
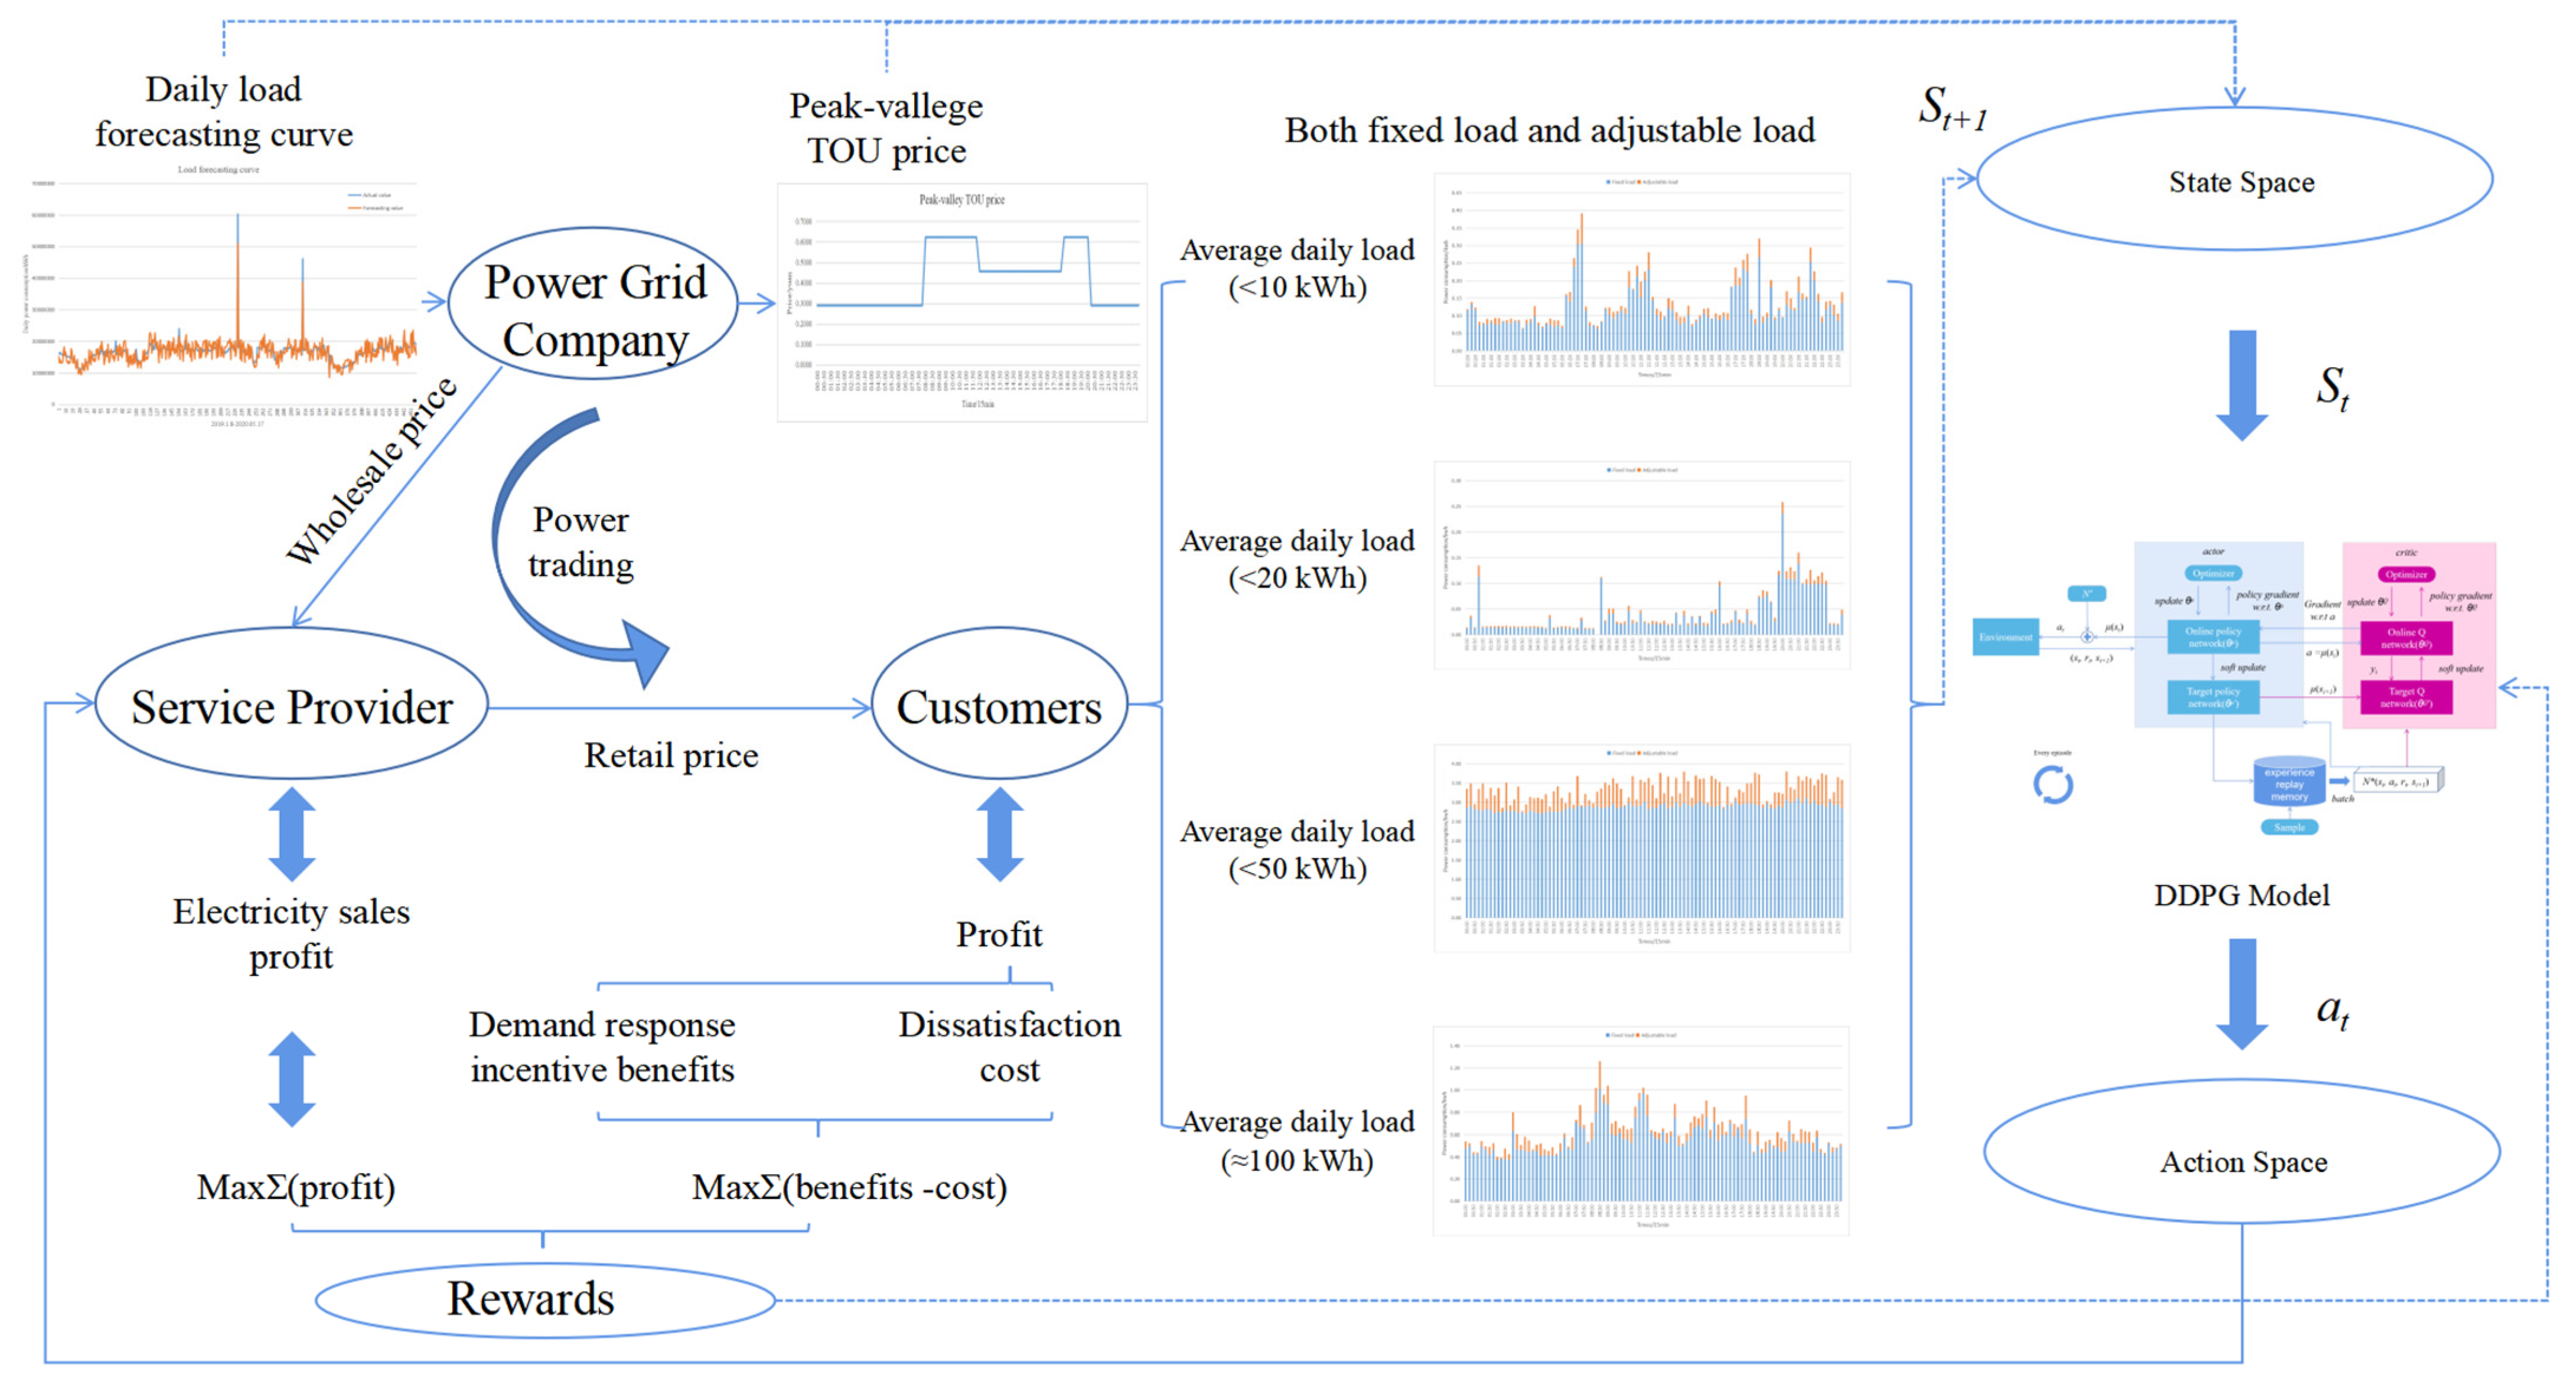
3. Research on Demand Response Model
4. Residual Demand Response Strategy Based on Deep Deterministic Policy Gradient
4.1. The Optimal Model of Power Consumption Strategy
- (1)
- At any time, the total amount to be regulated in load regulation should be less than the adjustable load of customers and the service provider hope the rate of actual power consumption and adjustable load will be greater.
- (2)
- We set the retail price in a range that is greater than or equal to the wholesale price, and less than or equal to the twice wholesale price. If the retail price is lower than the wholesale price, or the retail price is too higher that customers will no longer wish to buy the electricity, and the survival of service providers will be the biggest problem.
- (3)
- From the perspective of residential electricity demand, it can be assumed that the total amount of consumers who wish to actively participate in load regulation is no more than 50% of their normal load. The number of consumers who actively participate in demand response would be influenced by the retail price.
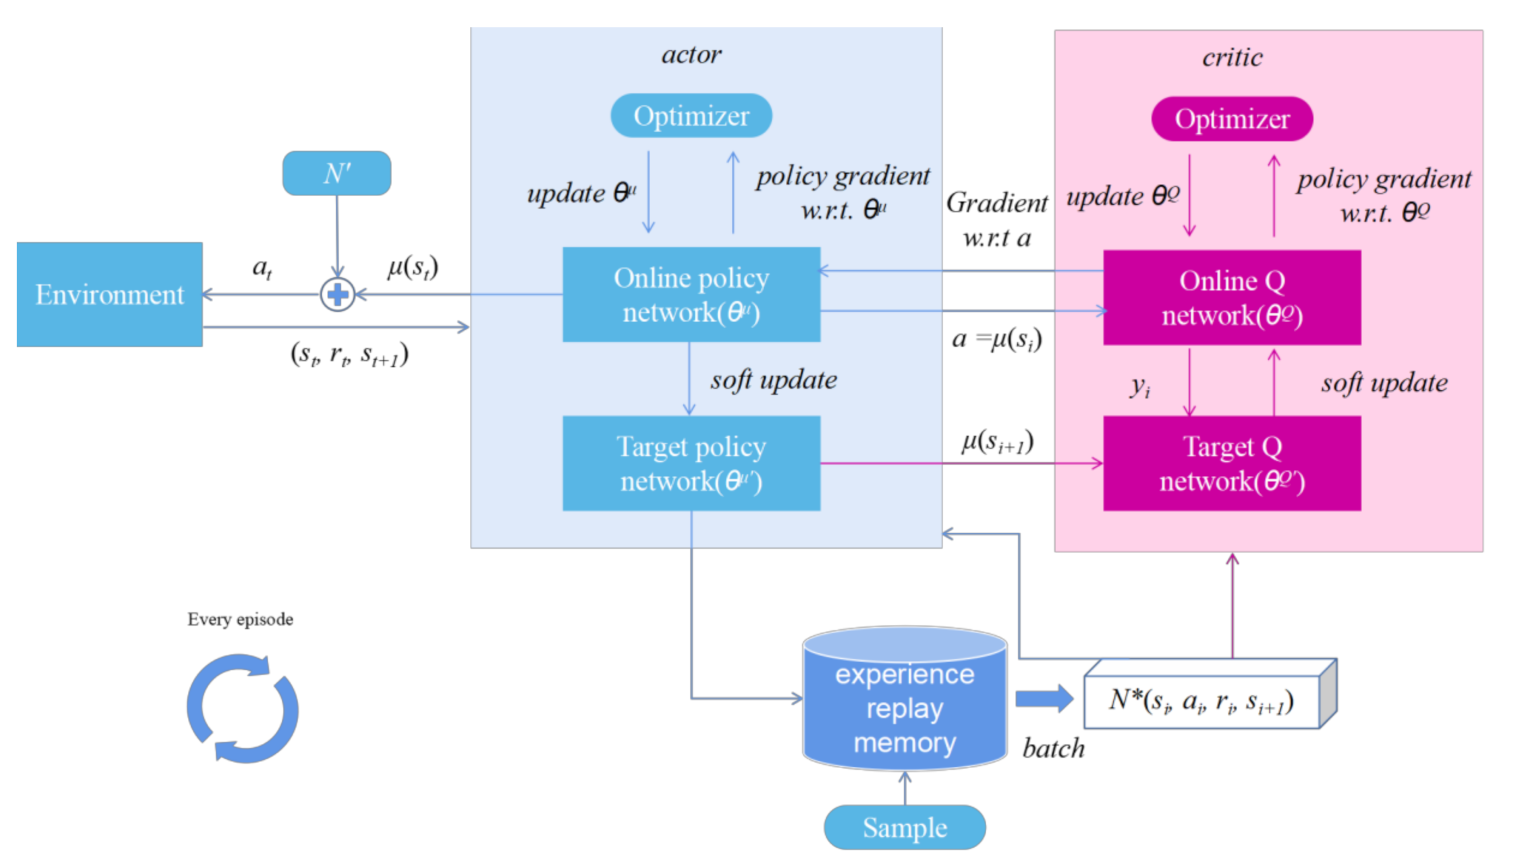
4.2. Deep Deterministic Policy Gradient Algorithm
4.3. Key Parts of the Model
4.3.1. State Space
4.3.2. Action Space
4.3.3. Design of Reward Function
5. Result Analysis
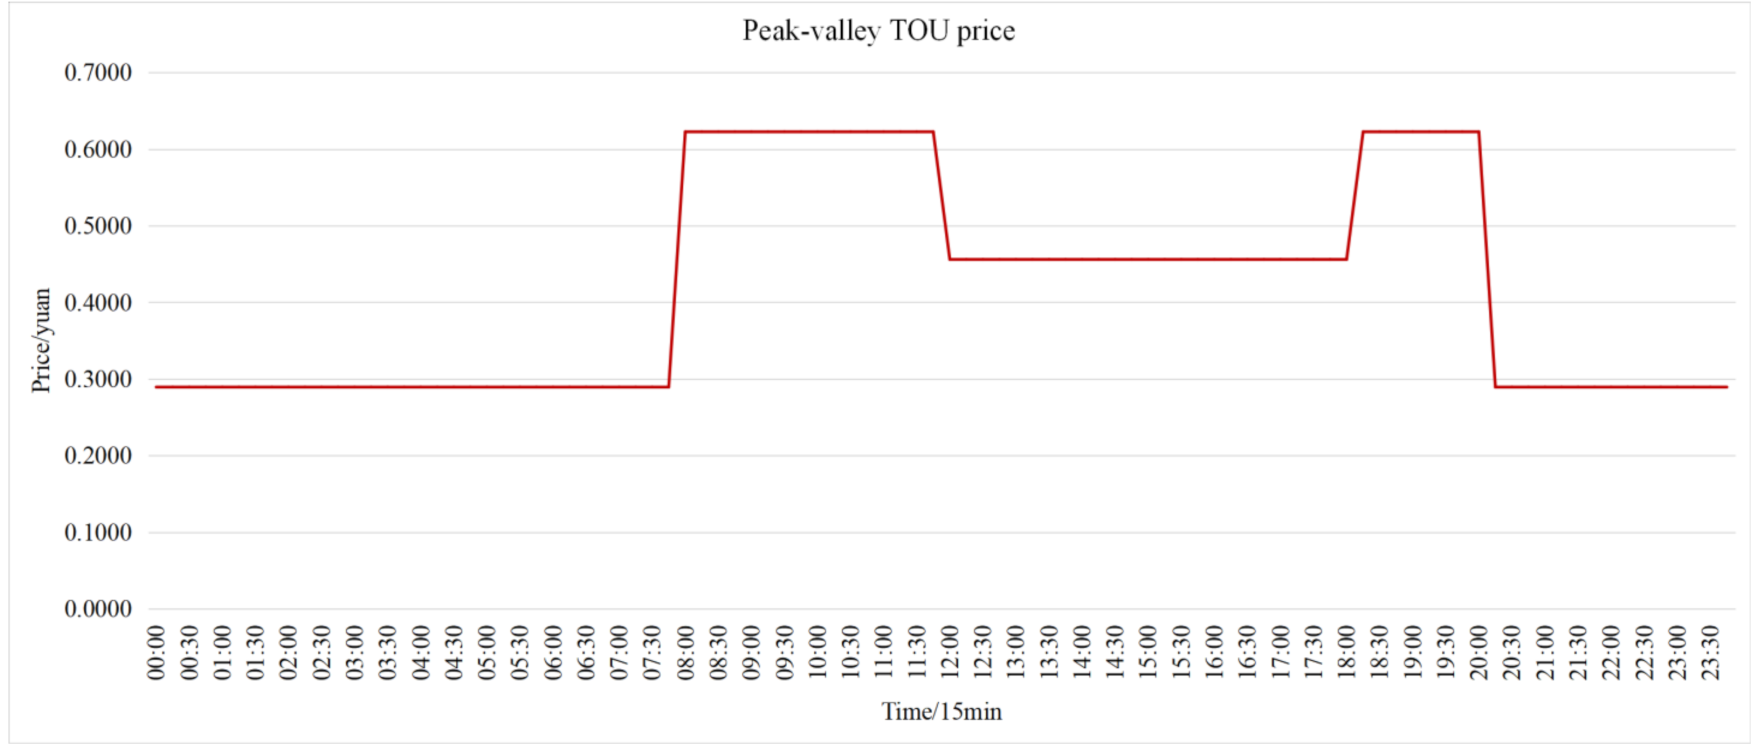
5.1. Peak-Valley Time of Use (TOU) Price
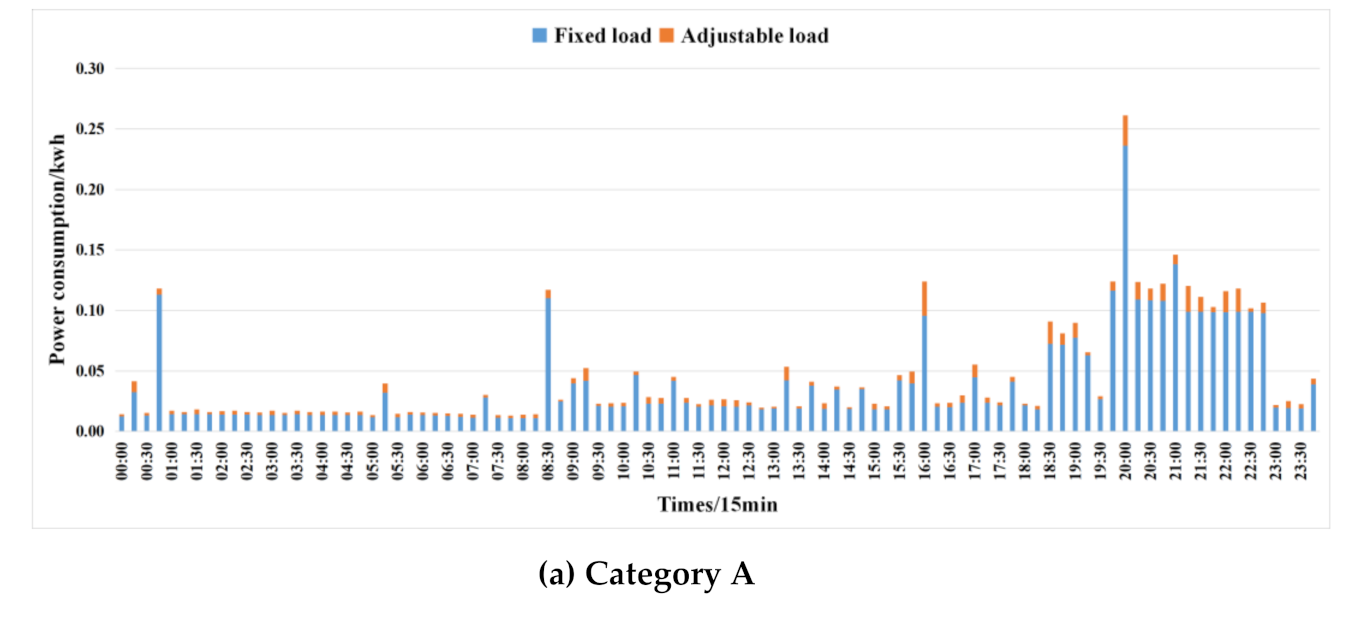
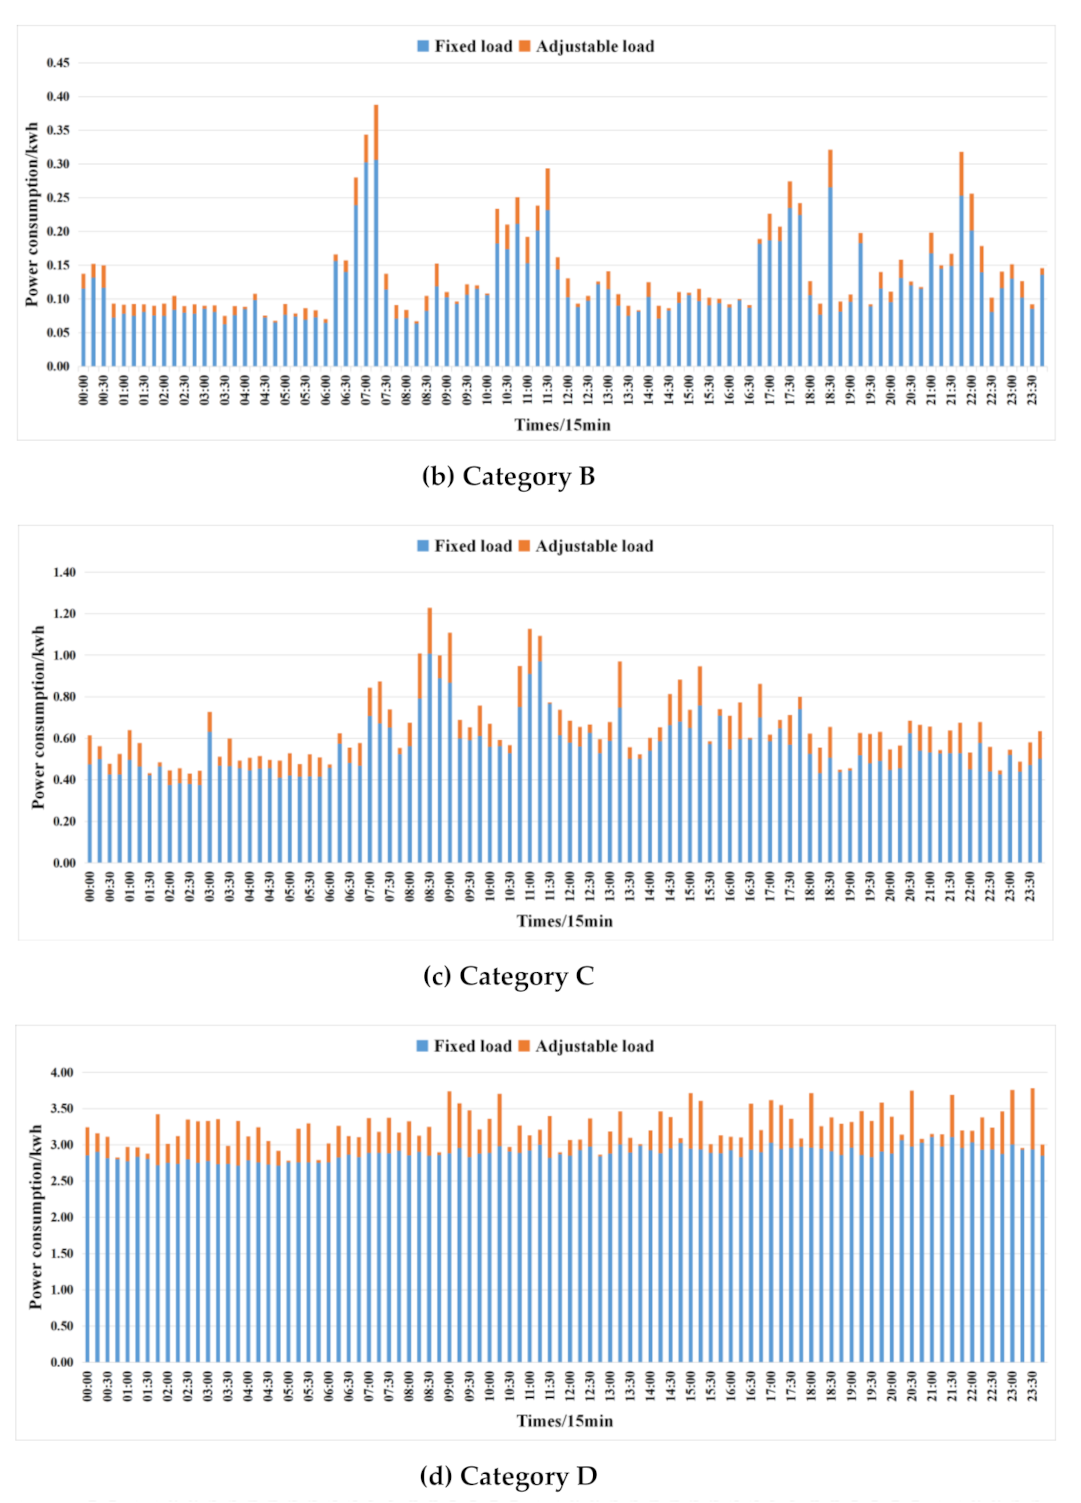
5.2. Data Set
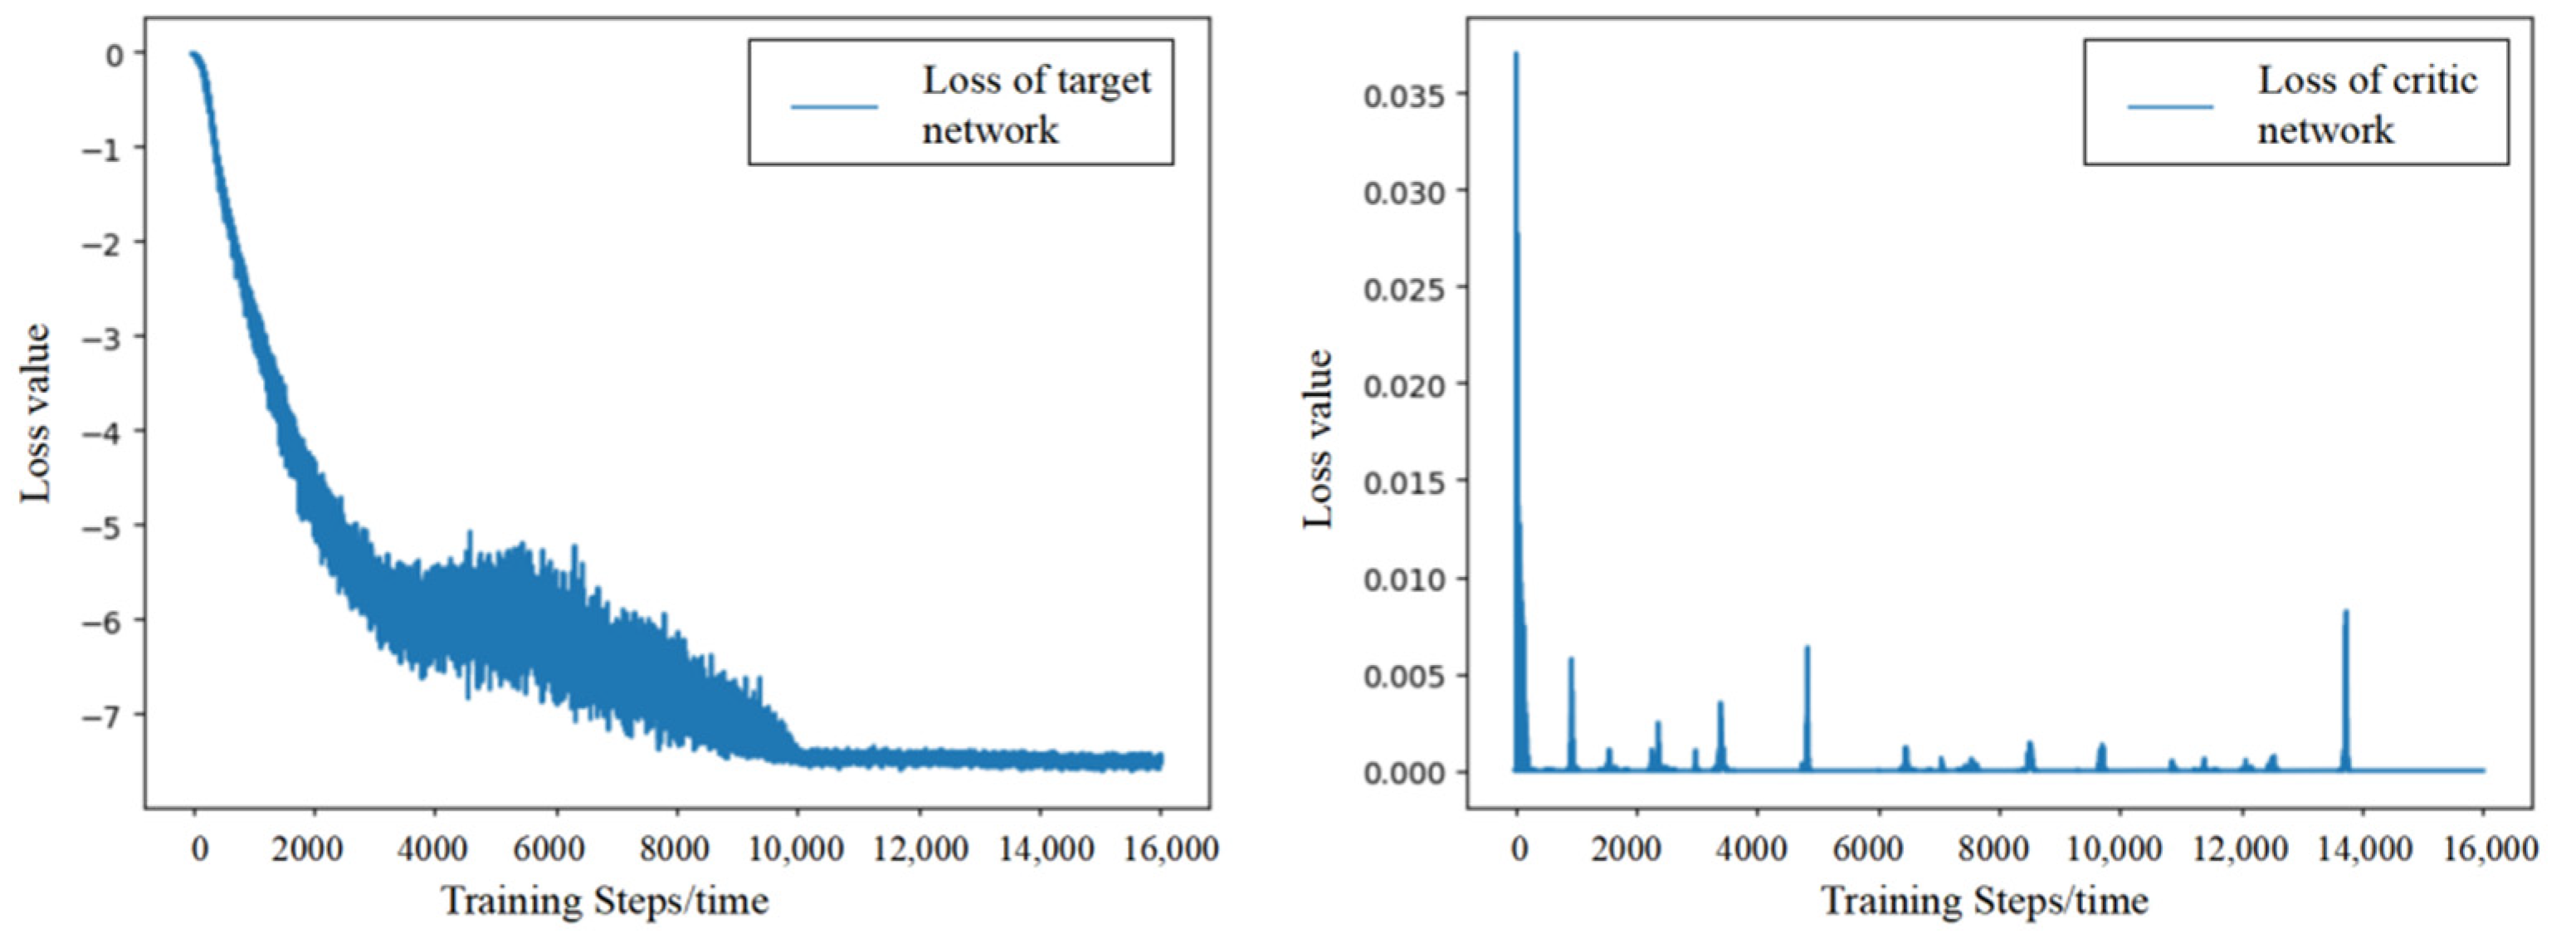
5.3. Model Training
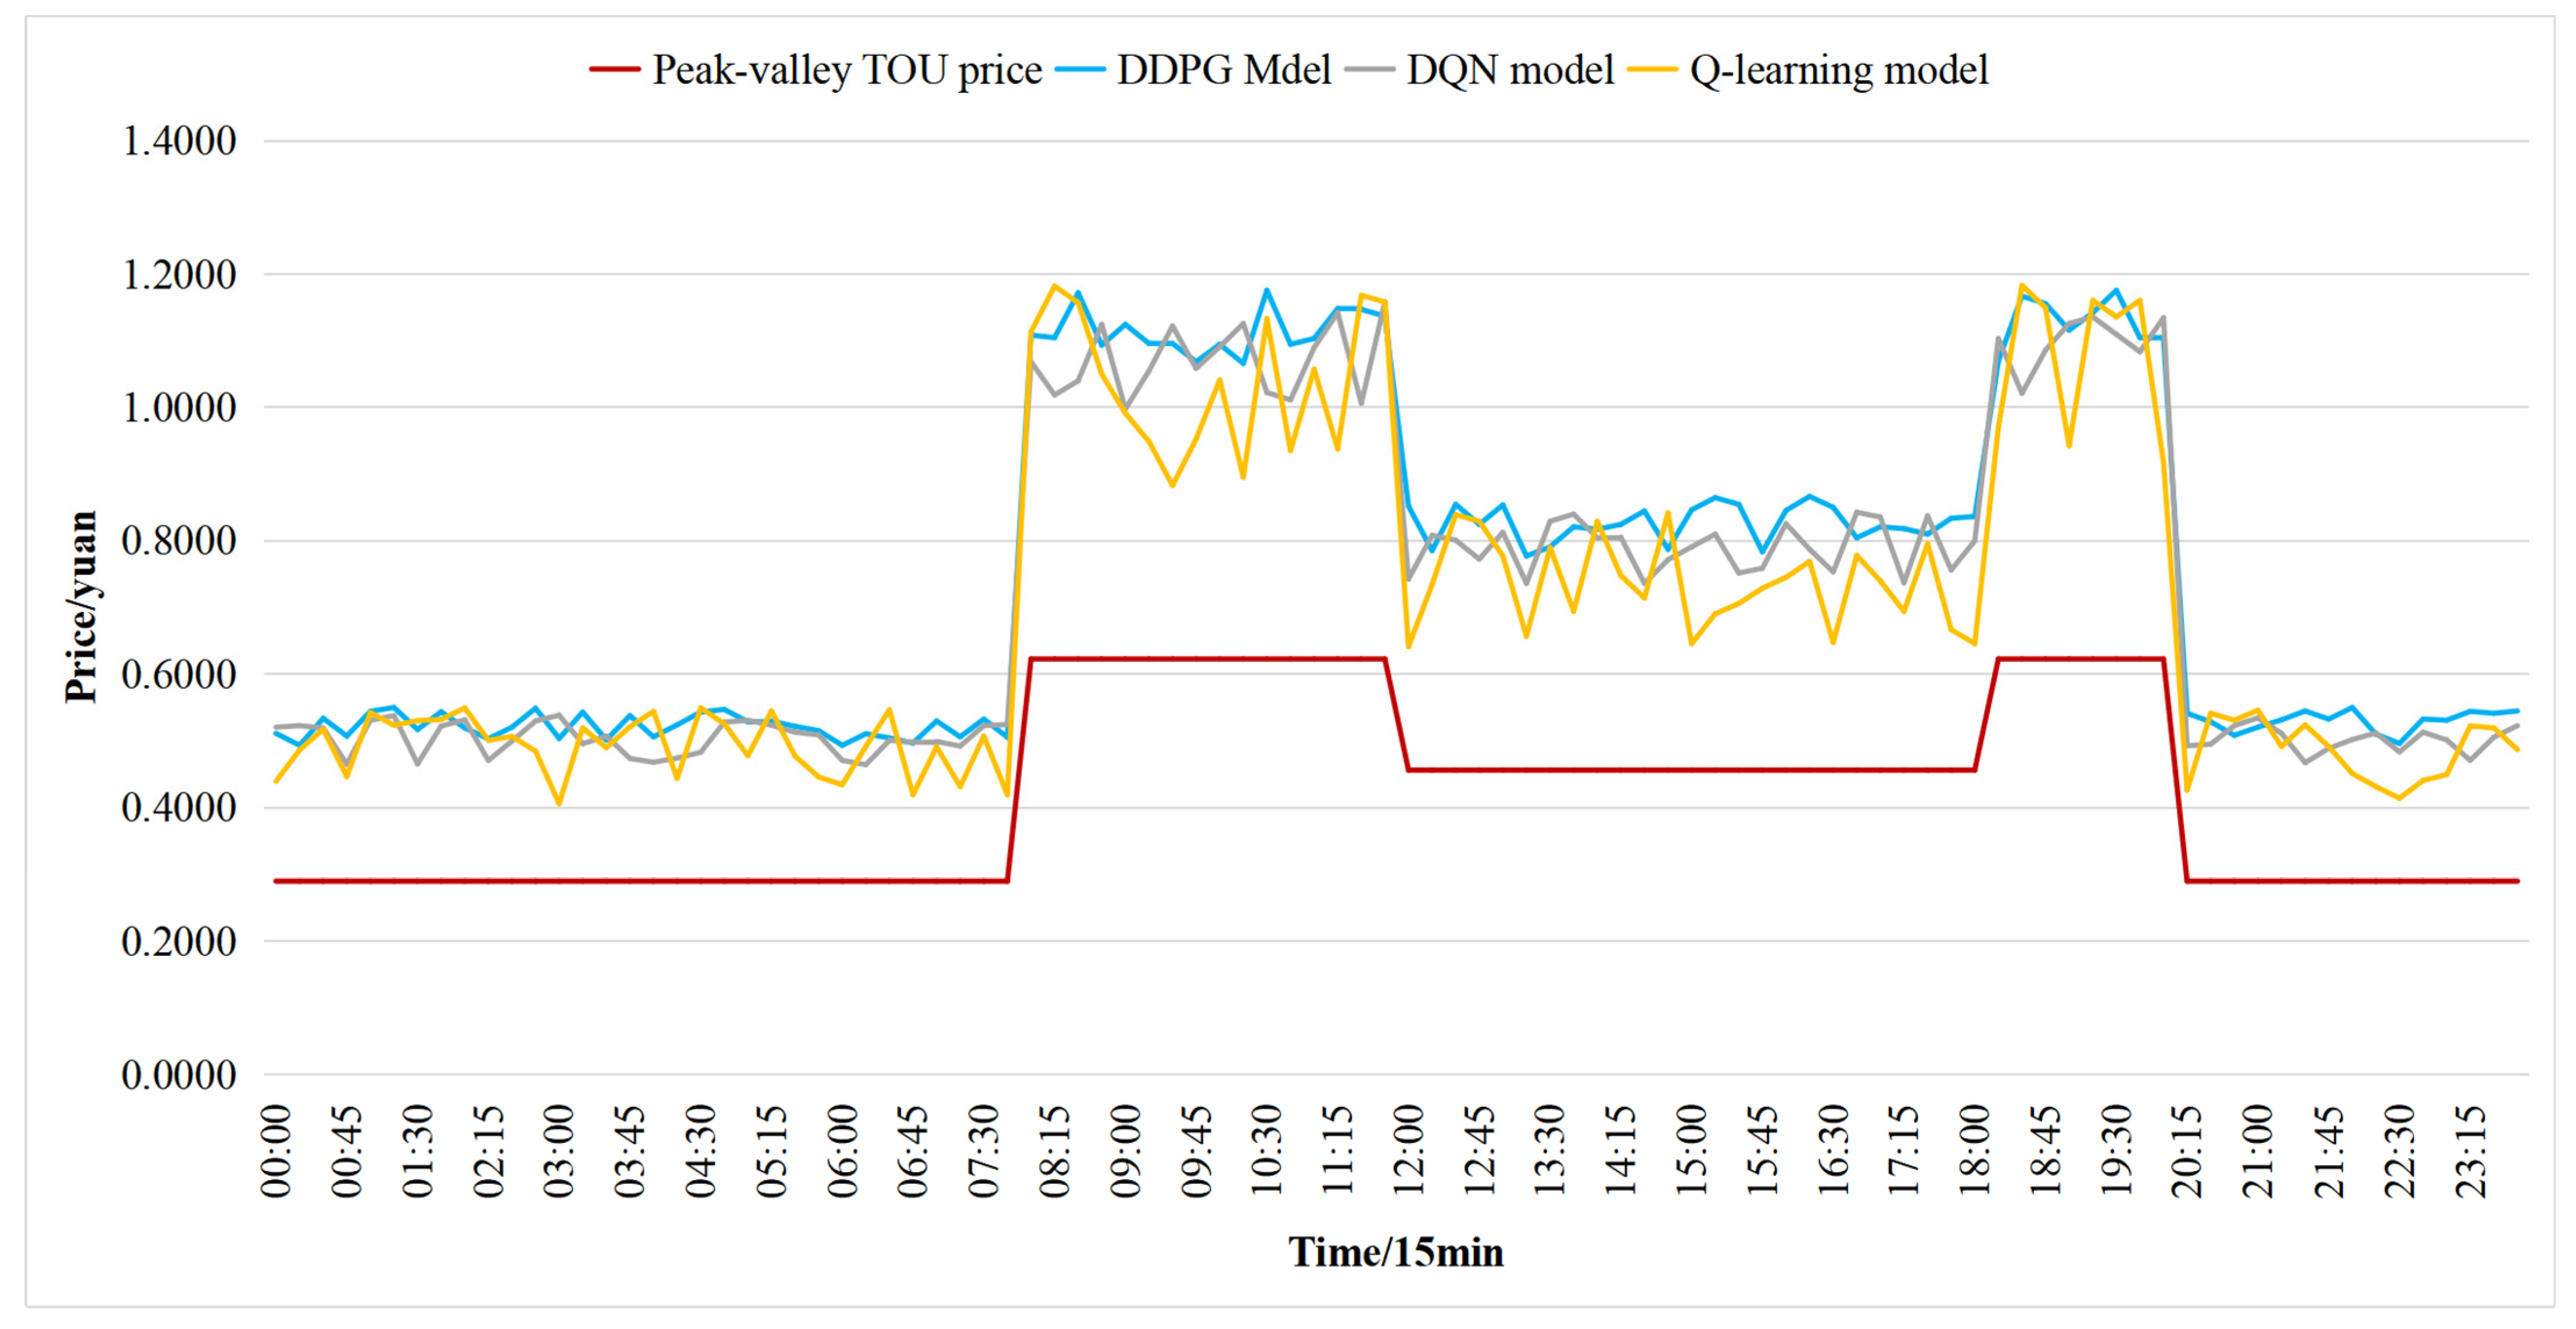
5.4. Analysis of Retail Price Strategy
6. Conclusions
- (1)
- In this paper, the optimal model of retail price generation strategy depends on the electricity consumption every 15 min; a shorter time scale should be introduced in the future, such as one minute or in seconds.
- (2)
- Determine if DRL model is suitable to deal with uncertain interaction process, and how to design the reward function has always been an important issue in modeling.
- (3)
- Present research focuses on a simulation system that consists of simplified parts. It could be applied in a real situation in the future in the process of electric power system reform in China.
Author Contributions
Funding
Institutional Review Board Statement
Informed Consent Statement
Conflicts of Interest
References
- State Council of the people’s Republic of China. Some Opinions on Further Deepening the Reform of Power System; State Council of the People’s Republic of China: Beijing, China, 2015. [Google Scholar]
- Li, Y.; Huang, L.; Cui, Q.; Shu, J. A Bi-level optimal configuration of combined cooling, heating, and power system considering demand side management. In Proceedings of the 2020 IEEE 4th Conference on Energy Internet and Energy System Integration: Connecting the Grids Towards a Low-Carbon High-Efficiency Energy System, EI2 2020, Wuhan, China, 30 October–1 November 2020; pp. 2064–2070. [Google Scholar]
- Li, Y.; Yao, J.; Yong, T.; Ju, P.; Yang, S.; Shi, X. Estimation approach to aggregated power and response potential of residential thermostatically controlled loads. Proc. CSEE 2017, 37, 5519–5528. [Google Scholar]
- Ren, Y.; Zhou, M.; Li, G. Bi-level model of electricity procurement and sale strategies for electricity retailers considering users’ demand response. Autom. Electr. Power Syst. 2017, 41, 30–36. [Google Scholar]
- Gu, W.; Ren, J.Y.; Gao, J.; Gao, F.; Song, X. Optimal dispatching model of electricity retailers considering distributed generator and adjustable load. Autom. Electr. Power Syst. 2017, 41, 37–44. [Google Scholar]
- Hu, Q.; Li, F.; Fang, X.; Bai, L. A framework of residential demand aggregation with financial incentives. IEEE Trans. Smart Grid 2018, 9, 497–505. [Google Scholar] [CrossRef]
- Wang, Z.; Paranjape, R. Optimal residential demand response for multiple heterogeneous homes with real-time price prediction in a multiagent framework. IEEE Trans. Smart Grid 2017, 8, 1173–1184. [Google Scholar] [CrossRef]
- Liu, X.; Gao, B.; Luo, J.; Tang, Y. Non-cooperative game based hierarchical dispatch model of residential loads. Autom. Electr. Power Syst. 2017, 41, 54–60. [Google Scholar]
- Jun, L.; Wenhao, P.; Yanping, Z.H. A scheduling strategy based on particle correction for intelligent power demand response. Power Syst. Technol. 2017, 41, 2370–2377. [Google Scholar]
- Yu, M.; Hong, S.H. Incentive-based demand response considering hierarchical electricity market: A Stackelberg game approach. Appl. Energy 2017, 203, 267–279. [Google Scholar] [CrossRef]
- De Paola, A.; Angeli, D.; Strbac, G. Price-based schemes for distributed coordination of flexible demand in the electricity market. IEEE Trans. Smart Grid 2017, 8, 3104–3116. [Google Scholar] [CrossRef]
- Safdarian, A.; Fotuhi-Firuzabad, M.; Lehtonen, M. Optimal residential load management in smart grids: A decentralized framework. IEEE Trans. Smart Grid 2016, 7, 1836–1845. [Google Scholar] [CrossRef]
- Joe-Wong, C.; Sen, S.; Ha, S.; Chiang, M. Optimized day-ahead pricing for smart grids with device-specific scheduling flexibility. IEEE J. Sel. Areas Commun. 2012, 30, 1075–1085. [Google Scholar] [CrossRef]
- Zhang, Y.; Kong, X.; Sun, B.; Wang, J. Multi-Time Scale Home Energy Management Strategy Based on Electricity Demand Response. Power Syst. Technol. 2018, 42, 1811–1818. [Google Scholar]
- Nunna, H.K.; Doolla, S. Demand response in smart distribution system with multiple microgrids. IEEE Trans. Smart Grid 2012, 3, 1641–1649. [Google Scholar] [CrossRef]
- Yu, D.; Xu, X.; Dong, M.; Nojavan, S.; Jermsittiparsert, K.; Abdollahi, A.; Aalami, H.A.; Pashaei-Didani, H. Modeling and prioritizing dynamic demand response programs in the electricity markets. Sustain. Cities Soc. 2020, 53, 101921. [Google Scholar] [CrossRef]
- Tang, R.; Wang, S.; Li, H. Game theory based interactive demand side management responding to dynamic pricing in price-based demand response of smart grids. Appl. Energy 2019, 250, 118–130. [Google Scholar] [CrossRef]
- Chen, T.; Alsafasfeh, Q.; Pourbabak, H.; Su, W. The next-generation U.S. retail electricity market with customers and prosumers-A bibliographical survey. Energies 2018, 11, 8. [Google Scholar] [CrossRef] [Green Version]
- Yang, H.; Wang, L.; Ma, Y.; Zhang, D.; WU, H. Optimization strategy of price-based demand response considering the bidirectional feedback effect. IET Gener. Transm. Distrib. 2021. [Google Scholar] [CrossRef]
- Tan, Z.F.; Chen, G.J.; Zhao, J.B.; Hou, J.C.; Jiang, H.Y. Optimization model for designing peak-valley time-of-use power price of generation side and sale side at the direction of energy conservation dispatch. Proc. Chin. Soc. Electr. Eng. 2009, 29, 55–62. [Google Scholar]
- Faddel, S.; Mohammed Osama, A. Automated distributed electric vehicle controller for residential demand side management. IEEE Trans. Ind. Appl. 2019, 55, 16–25. [Google Scholar] [CrossRef]
- Rigodanzo, J.; da Rosa Abaide, A.; Garcia, V.J.; da Silva, L.N.; Hammerschmitt, B.K.; Bibiano, L.M. Residential Consumer Satisfaction Considering Tariff Variation Based on a Fuzzy Model. In Proceedings of the 2019 IEEE PES Conference on Innovative Smart Grid Technologies, ISGT Latin America 2019, Gramado, Brazil, 15–18 September 2019. [Google Scholar]
- Dehnavi, E.; Abdi, H. Optimal pricing in time of use demand response by integrating with dynamic economic dispatch problem. Energy 2016, 109, 1086–1094. [Google Scholar] [CrossRef]
- Cui, Q.; Wang, X.; Wang, W. Stagger Peak Electricity Price for Heavy Energy-Consuming Enterprises Considering Improvement of Wind Power Accommodation. Power Syst. Technol. 2015, 39, 946–952. [Google Scholar]
- Yang, H.; Wang, L.; Gong, Z.; Zhang, X. TOU electricity price optimization model for multi-customer considering the PV ratio coefficient. In Proceedings of the 2019 4th International Conference on Intelligent Green Building and Smart Grid, Hubei, China, 6–9 September 2019; pp. 345–348. [Google Scholar]
- Ding, Y.; Xu, Q.; Xia, Y.; Zhao, J.; Yuan, X.; Yin, J. Optimal dispatching strategy for user-side integrated energy system considering multiservice of energy storage. Int. J. Electr. Power Energy Syst. 2021, 129, 106810. [Google Scholar] [CrossRef]
- Wu, L.; Lee, S. A deep learning-based strategy to the energy management-advice for time-of-use rate of household electricity consumption. J. Internet Technol. 2020, 21, 305–311. [Google Scholar]
- Li, Q.; Li, J.; Huang, Z.; Fan, F.; Teng, W. A Real-Time Electricity Price Decision Model for Demand Side Management in Wind Power Heating Mode. Front. Energy Res. 2021, 9, 16. [Google Scholar] [CrossRef]
- Deng, Z.; Wang, B.; Xu, Y.; Xu, T.; Liu, C.; Zhu, Z. Multi-scale convolutional neural network with time-cognition for multi-step short-term load forecasting. IEEE Access 2019, 7, 88058–88071. [Google Scholar] [CrossRef]
- Chang, Z.; Zhang, Y.; Chen, W. Electricity price prediction based on hybrid model of adam optimized LSTM neural network and wavelet transform. Energy 2019, 187, 115804. [Google Scholar] [CrossRef]
- Deng, Z.; Liu, C.; Zhu, Z. Inter-hours rolling scheduling of behind-the-meter storage operating systems using electricity price forecasting based on deep convolutional neural network. Int. J. Electr. Power Energy Syst. 2021, 125, 106499. [Google Scholar] [CrossRef]
- Nguyen, N.D.; Nguyen, T.T.; Vamplew, P.; Dazeley, R.; Nahavandi, S. A Prioritized objective actor-critic method for deep reinforcement learning. Neural Comput. Appl. 2021, 1–15, in press. [Google Scholar] [CrossRef]
- Zhang, D.X.; Han, X.Q.; Deng, C.Y. Review on the research and practice of deep learning and reinforcement learning in smart grids. CSEE J. Power Energy Syst. 2018, 4, 362–370. [Google Scholar] [CrossRef]
- Mnih, V.; Kavukcuoglu, K.; Silver, D.; Rusu, A.A.; Veness, J.; Bellemare, M.G.; Graves, A.; Riedmiller, M.; Fidjeland, A.K.; Ostrovski, G.; et al. Human-level control through deep reinforcement learning. Nature 2015, 518, 529–533. [Google Scholar] [CrossRef]
- Silver, D.; Huang, A.; Maddison, C.J.; Guez, A.; Sifre, L.; Van Den Driessche, G.; Schrittwieser, J.; Antonoglou, I.; Panneershelvam, V.; Lanctot, M.; et al. Mastering the game of Go with deep neural networks and tree search. Nature 2016, 529, 484–489. [Google Scholar] [CrossRef] [PubMed]
- Gu, S.; Holly, E.; Lillicrap, T.; Levine, S. Deep reinforcement learning for robotic manipulation with asynchronous off-policy updates[C]. In Proceedings of the 2017 IEEE International Conference on Robotics and Automation (ICRA), Marina Bay Sands, Singapore, 29 May–3 June 2017; pp. 1–9. [Google Scholar]
- Burda, Y.; Edwards, H.; Pathak, D.; Storkey, A.; Darrell, T.; Efros, A.A. Large-Scale Study of Curiosity-Driven Learning. In Proceedings of the 7th International Conference on Learning Representations, ICLR, New Orleans, LA, USA, 6–9 May 2019; pp. 1–15. [Google Scholar]
- Jang, E.; Devin, C.; Vanhoucke, V.; Levine, S. Grasp2Vec: Learning Object Representations from Self-Supervised Grasping. arXiv 2018, arXiv:1811.06964. [Google Scholar]
- Luo, W.; Sun, P.; Zhong, F.; Liu, W.; Zhang, T.; Wang, Y. End-to-end active object tracking and its real-world deployment via reinforcement learning. J. Latex Class Files 2015, 14, 1–16. [Google Scholar] [CrossRef] [PubMed] [Green Version]
- Fang, K.; Zhu, Y.; Garg, A.; Kurenkov, A.; Mehta, V.; Fei-Fei, L.; Savarese, S. Learning task-oriented grasping for tool manipulation from simulated self-supervision. Int. J. Robot. Res. 2020, 39, 202–216. [Google Scholar] [CrossRef] [Green Version]
- Liu, J.; Gao, F.; Luo, X. Survey of deep reinforcement learning based on value function and policy gradient. Chin. J. Comput. 2019, 42, 1406–1438. [Google Scholar]
- Antonopoulos, I.; Robu, V.; Couraud, B.; Kirli, D.; Norbu, S.; Kiprakis, A.; Flynn, D.; Elizondo-Gonzalez, S.; Wattam, S. Artificial intelligence and machine learning approaches to energy demand-side response: A systematic review. Renew. Sustain. Energy Rev. 2020, 130, 109899. [Google Scholar] [CrossRef]
- Vázquez-Canteli, J.R.; Nagy, Z. Reinforcement learning for demand response: A review of algorithms and modeling techniques. Appl. Energy 2019, 235, 1072–1089. [Google Scholar] [CrossRef]
- Zhang, Z.; Zhang, D.; Qiu, R.C. Deep reinforcement learning for power system: An overview. CSEE J. Power Energy Syst. 2019, 6, 213–225. [Google Scholar]
- Liu, Y.; Zhang, D.; Gooi, H.B. Data-driven decision-making strategies for electricity retailers: Deep reinforcement learning approach. CSEE J. Power Energy Syst. 2020. [Google Scholar] [CrossRef]
- Renzhi, L.; Seung, H.H. Incentive-based demand response for smart grid with reinforcement learning and deep neural network. Appl. Energy 2019, 236, 937–949. [Google Scholar]
- Asadinejad, A.; Rahimpour, A.; Tomsovic, K.; Qi, H.; Chen, C.F. Evaluation of residential customer elasticity for incentive based demand response programs. Electr. Power Syst. Res. 2018, 158, 26–36. [Google Scholar] [CrossRef]


| Classification | Reinforcement Learning | Deep Reinforcement Learning |
|---|---|---|
| Based on value function | Q-learning | Deep Q Network, DQN |
| Sarsa | ||
| Based on policy gradient | Reinforce algorithm | Deterministic policy gradient, DPG |
| Deep deterministic policy gradient, DDPG | ||
| actor–critic, AC | Trust region policy optimization, TRPO | |
| Asynchronous advantage actor-critic, A3C | ||
| Distributed proximal policy optimization, DPPO |
| DDPG Algorithm | |
|---|---|
| 1 | |
| 2 | |
| 3 | Initialize playback unit R |
| 4 | For episode = 1, max_episode do: |
| 5 | for the action to improve the exploration rate |
| 6 | Read initialization status S1 |
| 7 | For t = 1, T do: |
| 8 | |
| 9 | |
| 10 | to the playback unit R |
| 11 | |
| 12 | |
| 13 | |
| 14 | Update actor-network parameters according to the policy gradient: |
| 15 | Update target network parameters: |
| 16 | End |
| 17 | End |
| Q-Learning | DQN | DDPG | ||
|---|---|---|---|---|
| Group 1 | Service provider’s profit | ¥ 96.12 | ¥ 103.24 | ¥ 242.53 |
| Customer’s cost | ¥ −1.11 | ¥ −3.26 | ¥ 10.31 | |
| Group 2 | Service provider’s profit | ¥ 80.22 | ¥ 125.0 | ¥ 260.41 |
| Customer’s cost | ¥ −2.32 | ¥ −1.21 | ¥ 20.76 | |
| Group 3 | Service provider’s profit | ¥ 108.31 | ¥ 150.51 | ¥ 272.08 |
| Customer’s cost | ¥ −1.54 | ¥ −2.5 | ¥ 22.43 | |
| Group 4 | Service provider’s profit | ¥ 96.31 | ¥ 135.51 | ¥ 226.08 |
| Customer’s cost | ¥ −1.50 | ¥ −2.42 | ¥ 13.41 |
Publisher’s Note: MDPI stays neutral with regard to jurisdictional claims in published maps and institutional affiliations. |
© 2021 by the authors. Licensee MDPI, Basel, Switzerland. This article is an open access article distributed under the terms and conditions of the Creative Commons Attribution (CC BY) license (https://creativecommons.org/licenses/by/4.0/).
Share and Cite
Deng, C.; Wu, K. Residential Demand Response Strategy Based on Deep Deterministic Policy Gradient. Processes 2021, 9, 660. https://doi.org/10.3390/pr9040660
Deng C, Wu K. Residential Demand Response Strategy Based on Deep Deterministic Policy Gradient. Processes. 2021; 9(4):660. https://doi.org/10.3390/pr9040660
Chicago/Turabian StyleDeng, Chunyu, and Kehe Wu. 2021. "Residential Demand Response Strategy Based on Deep Deterministic Policy Gradient" Processes 9, no. 4: 660. https://doi.org/10.3390/pr9040660