Feasibility of Using VIS/NIR Spectroscopy and Multivariate Analysis for Pesticide Residue Detection in Tomatoes

 ,
, 
 ,
,  ,
, 
Abstract
:1. Introduction
2. Materials and Methods
2.1. Sample Preparation
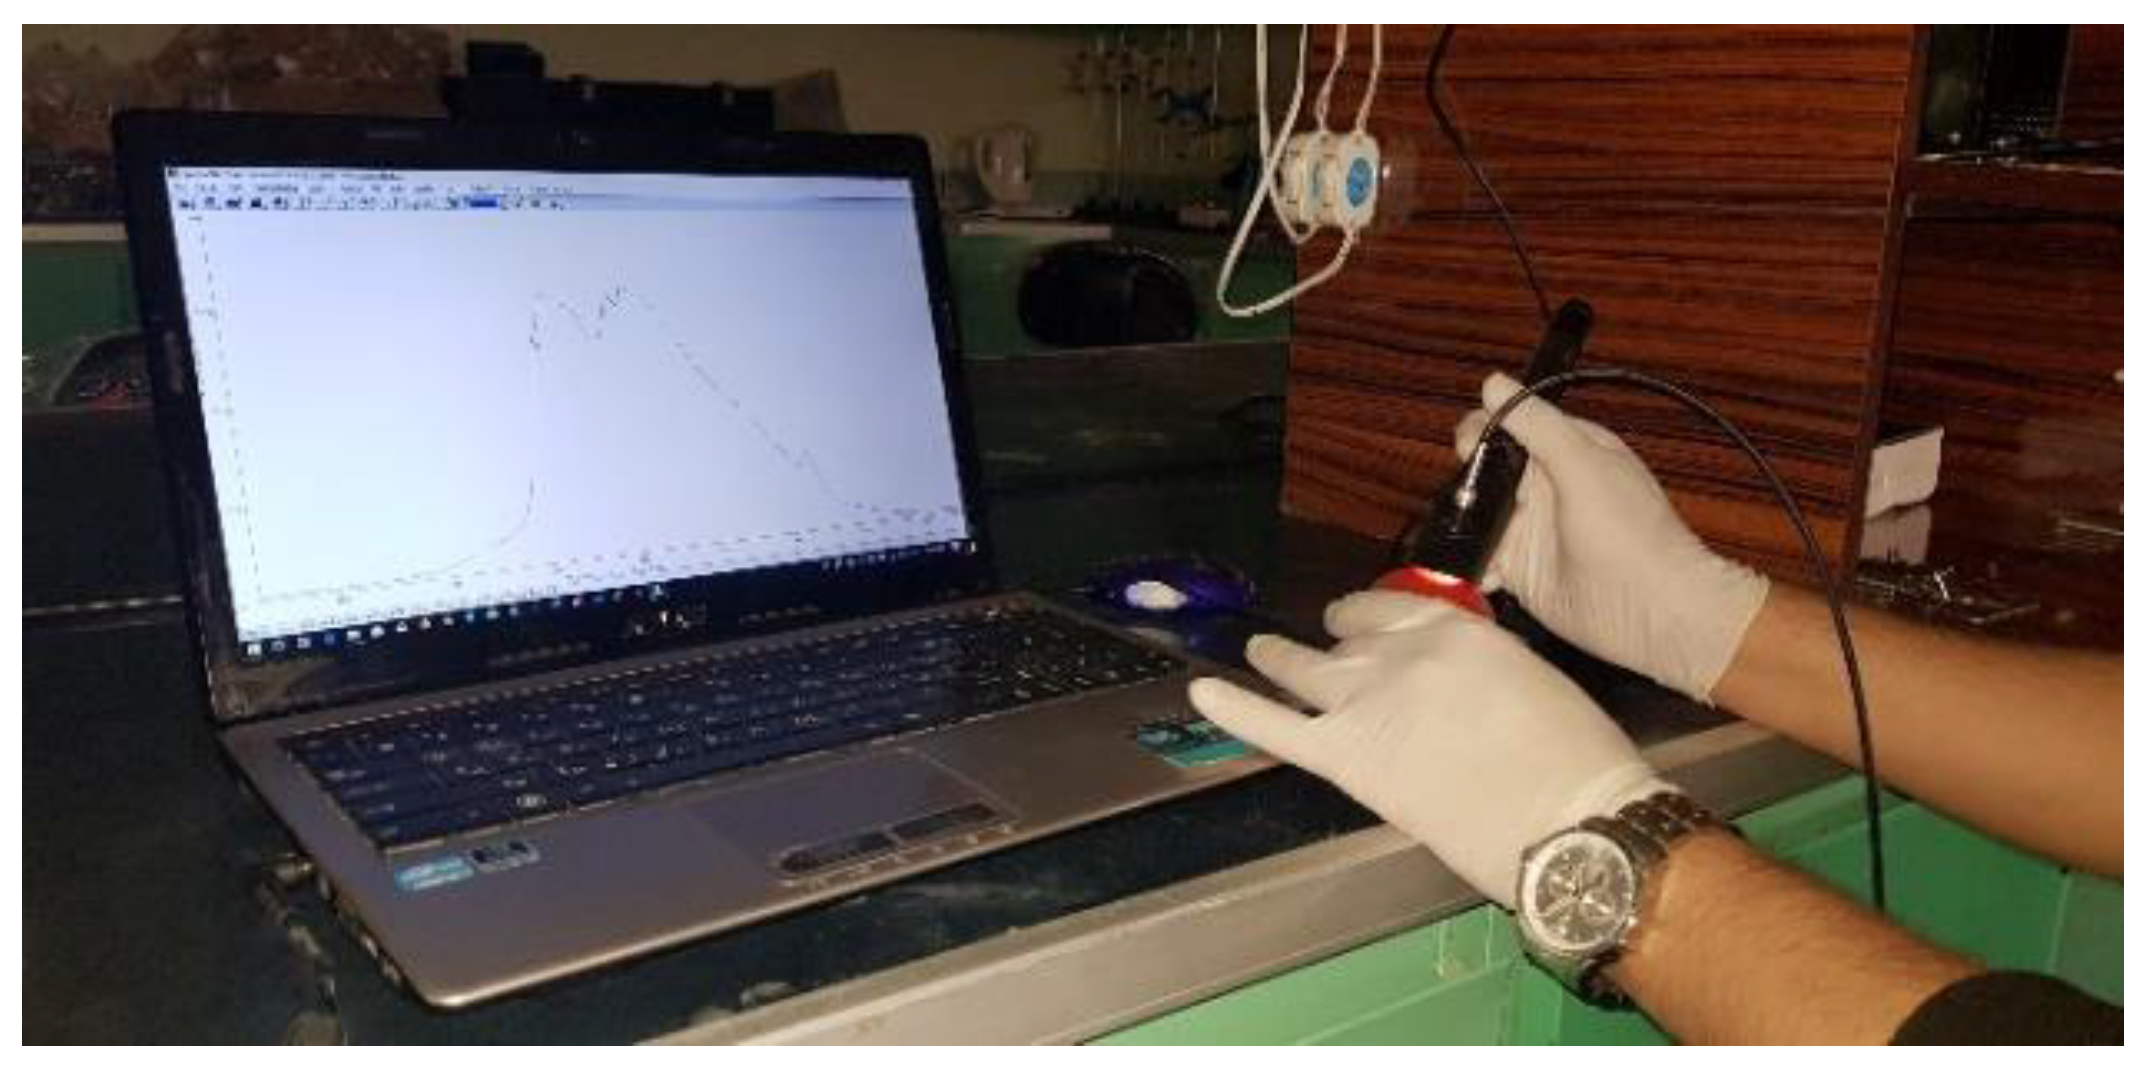
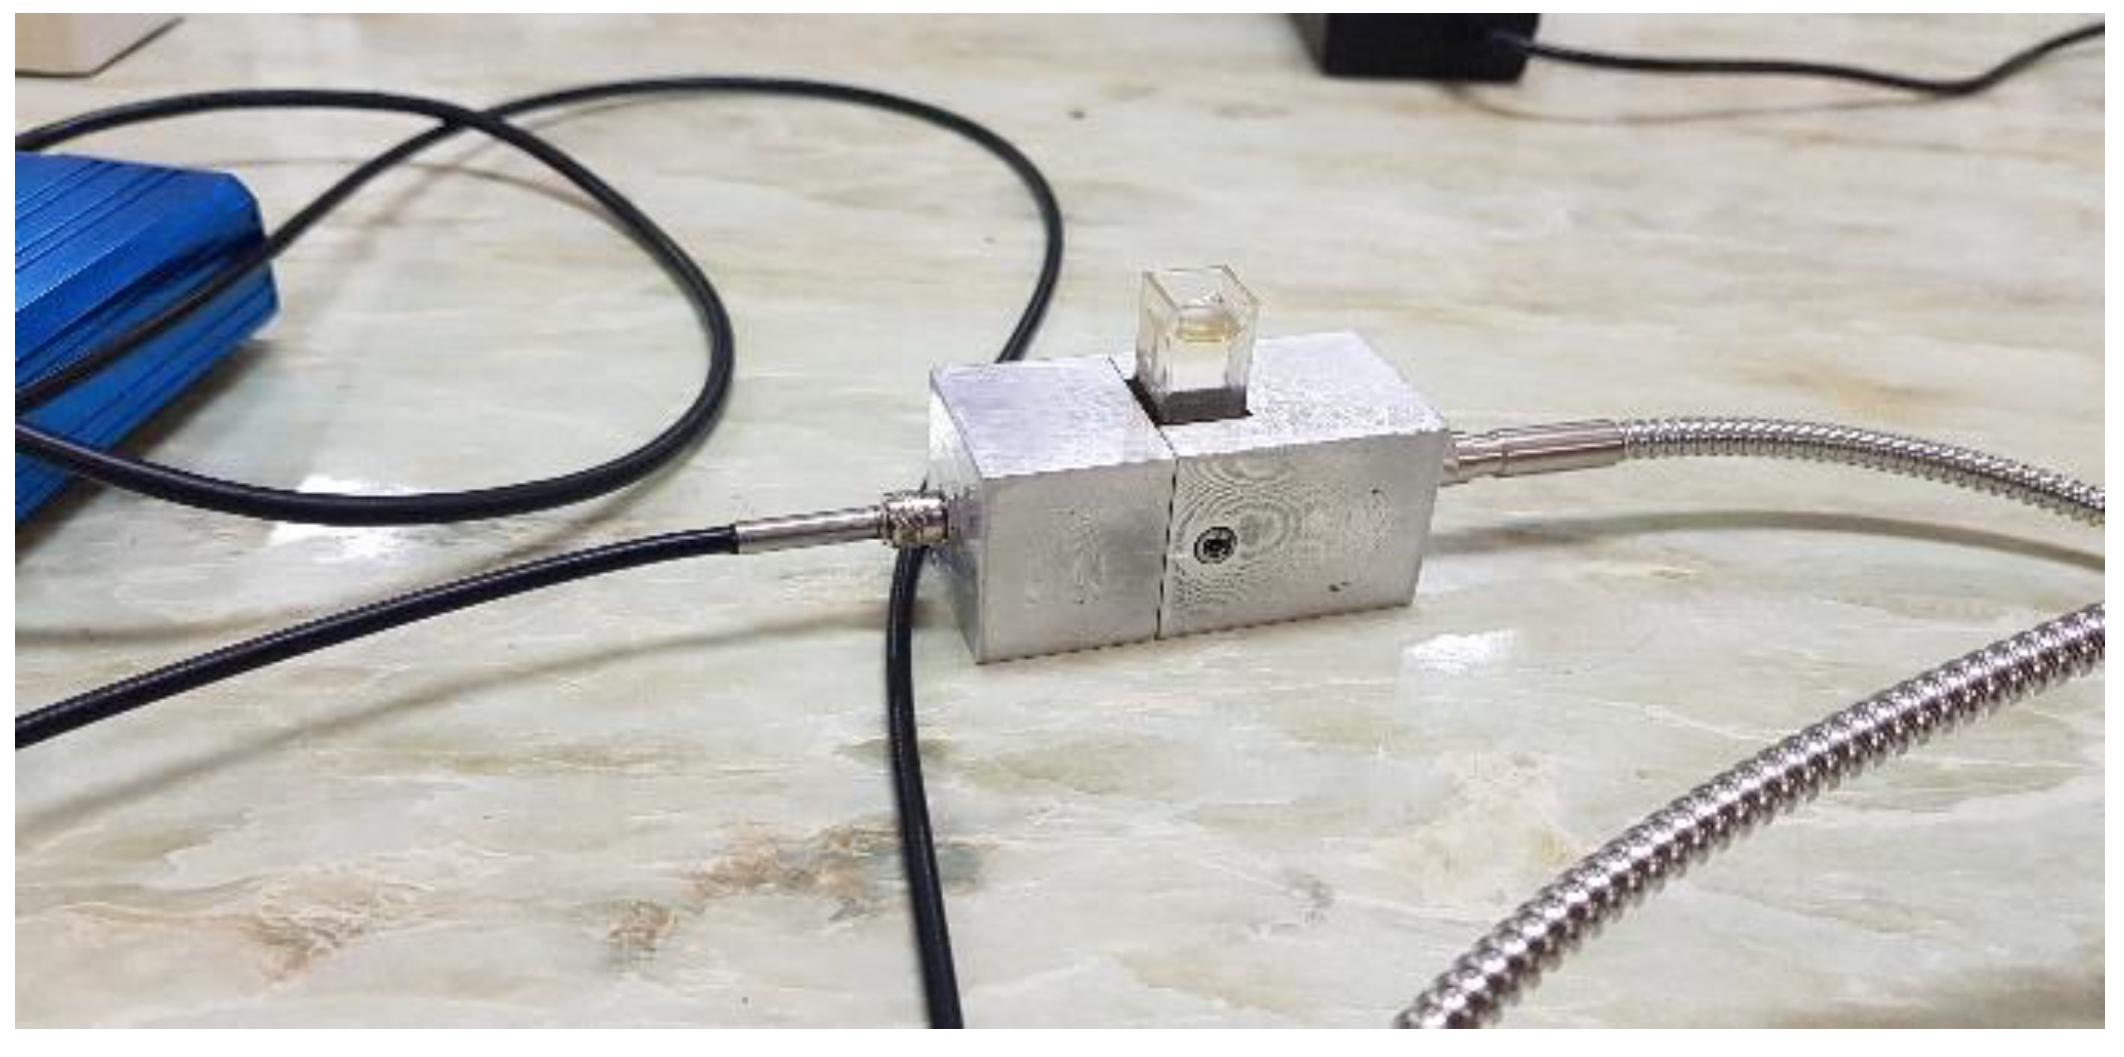
2.2. VIS/NIR Spectroscopy
2.3. Gas Chromatography
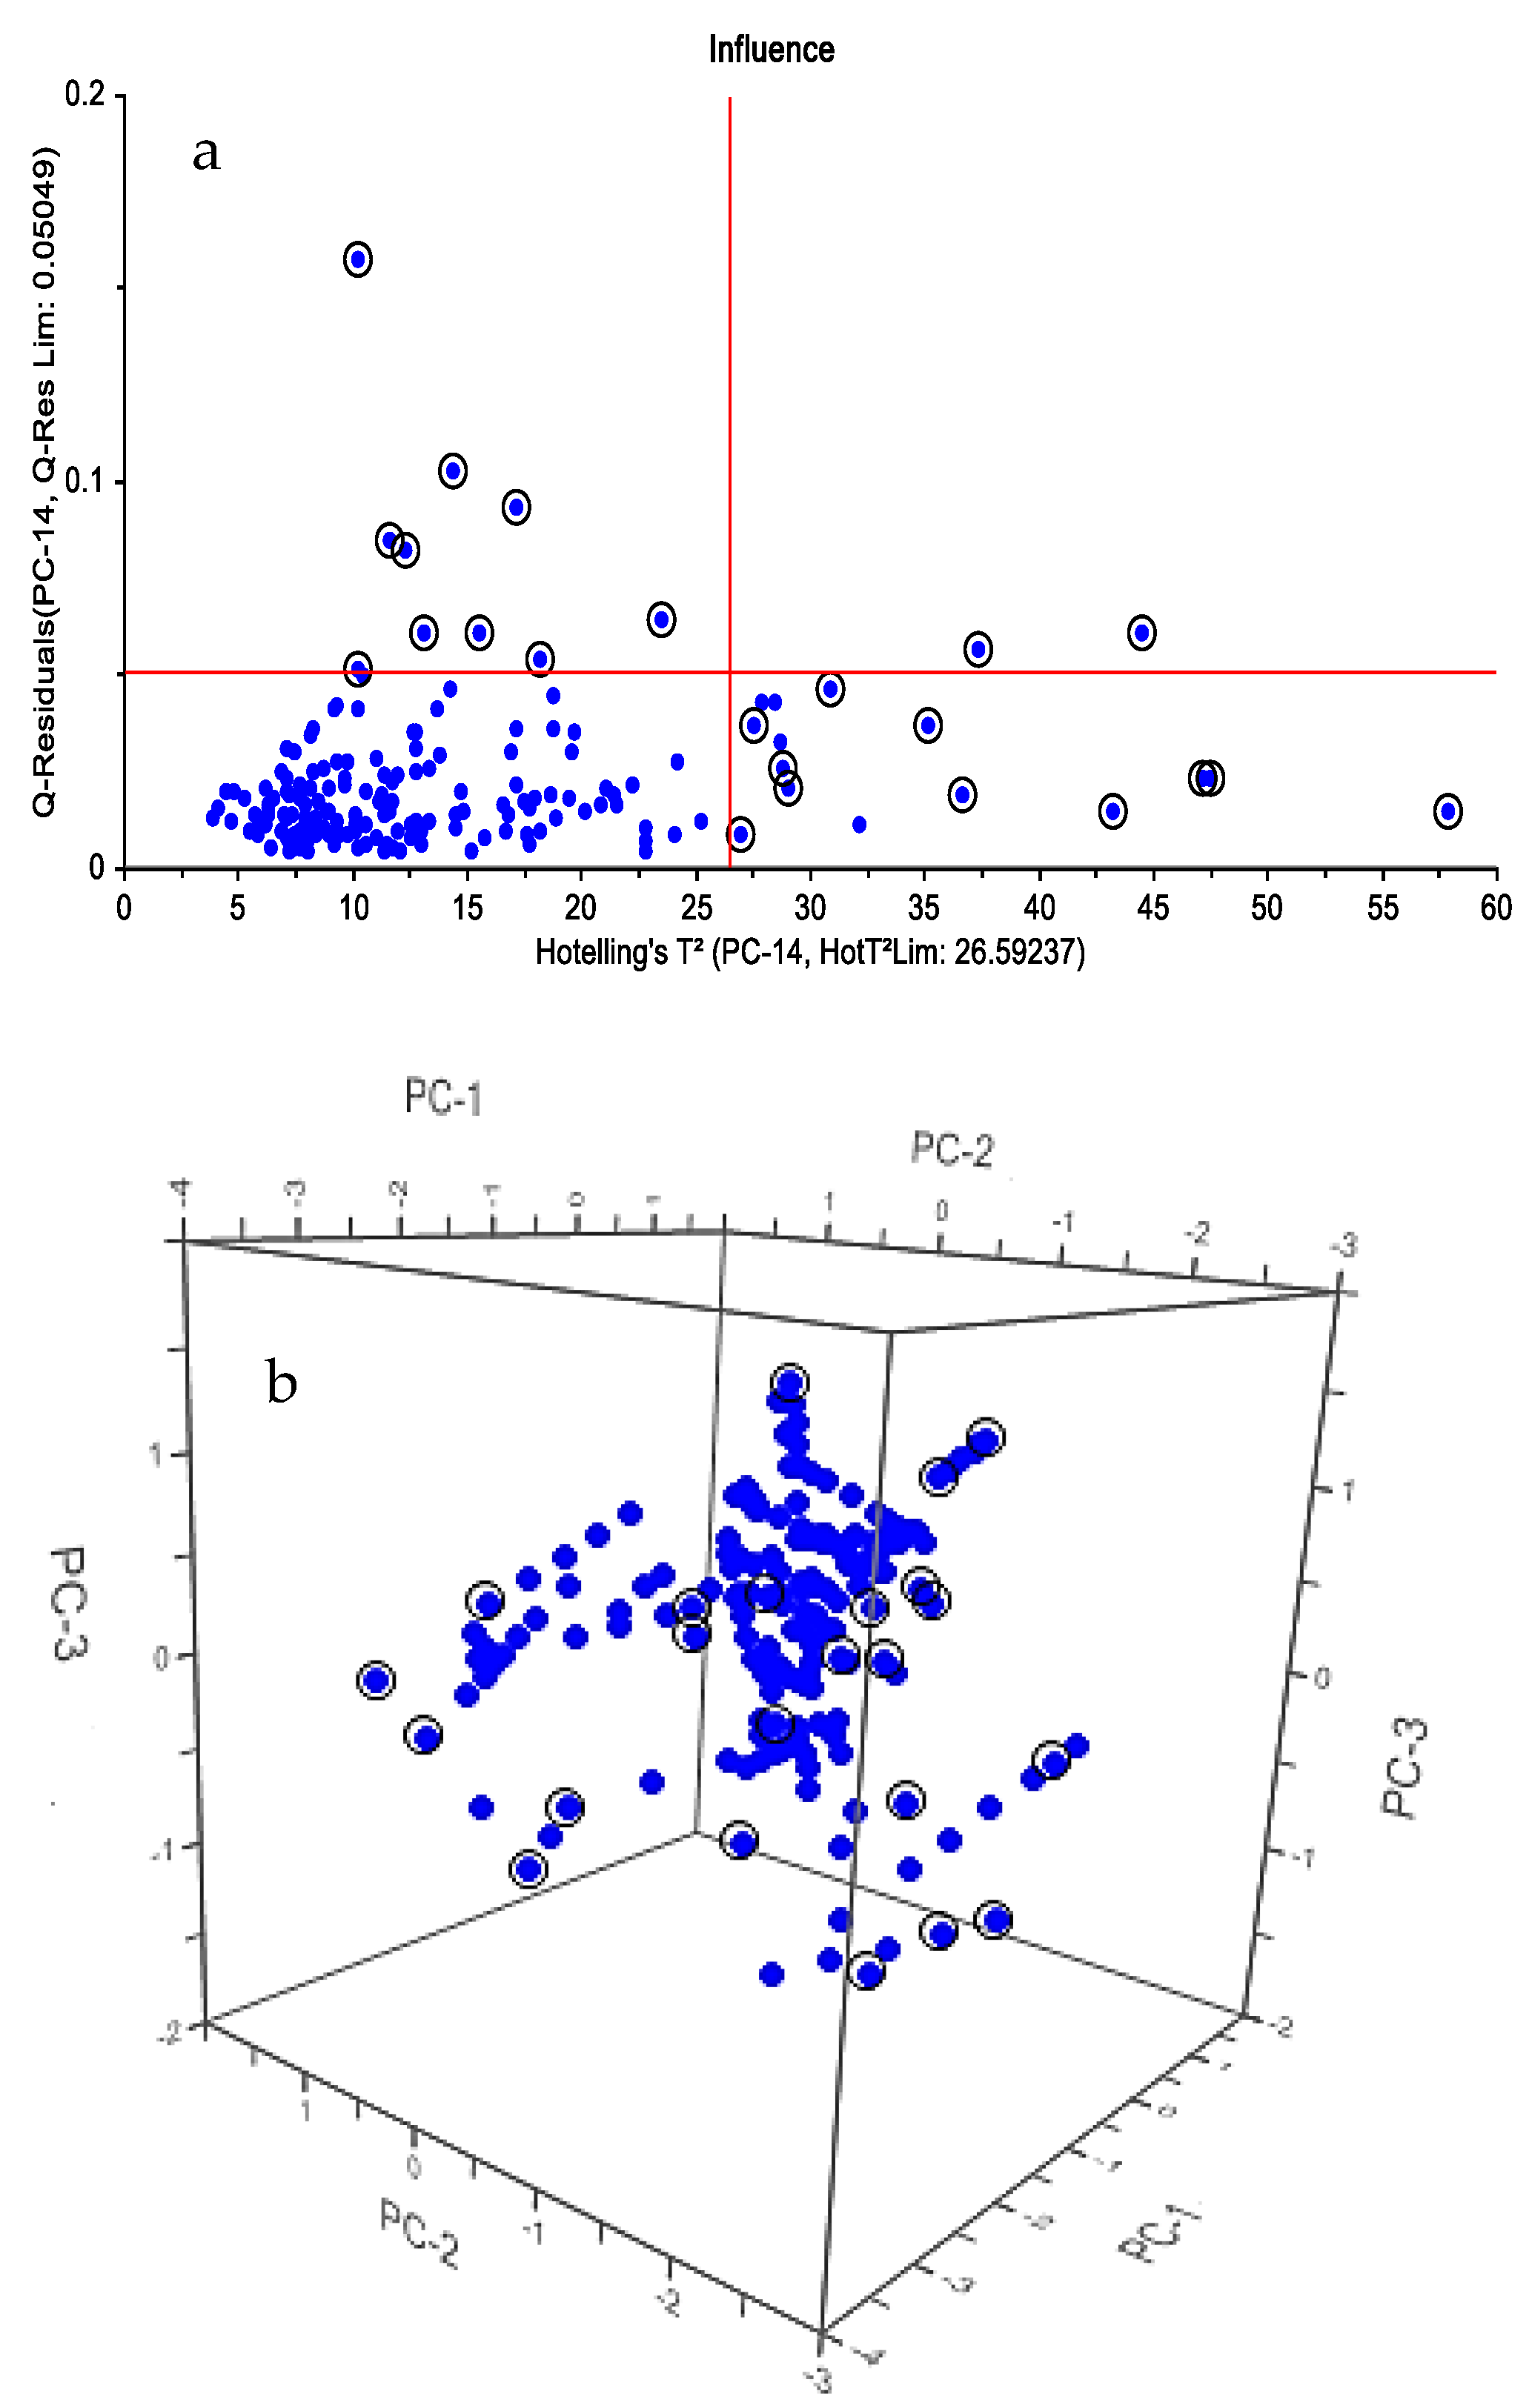
2.4. Dimension Reduction by PCA
2.5. PLS-DA Analysis
3. Results and Discussion
3.1. Reference Values for Profenofos Pesticide
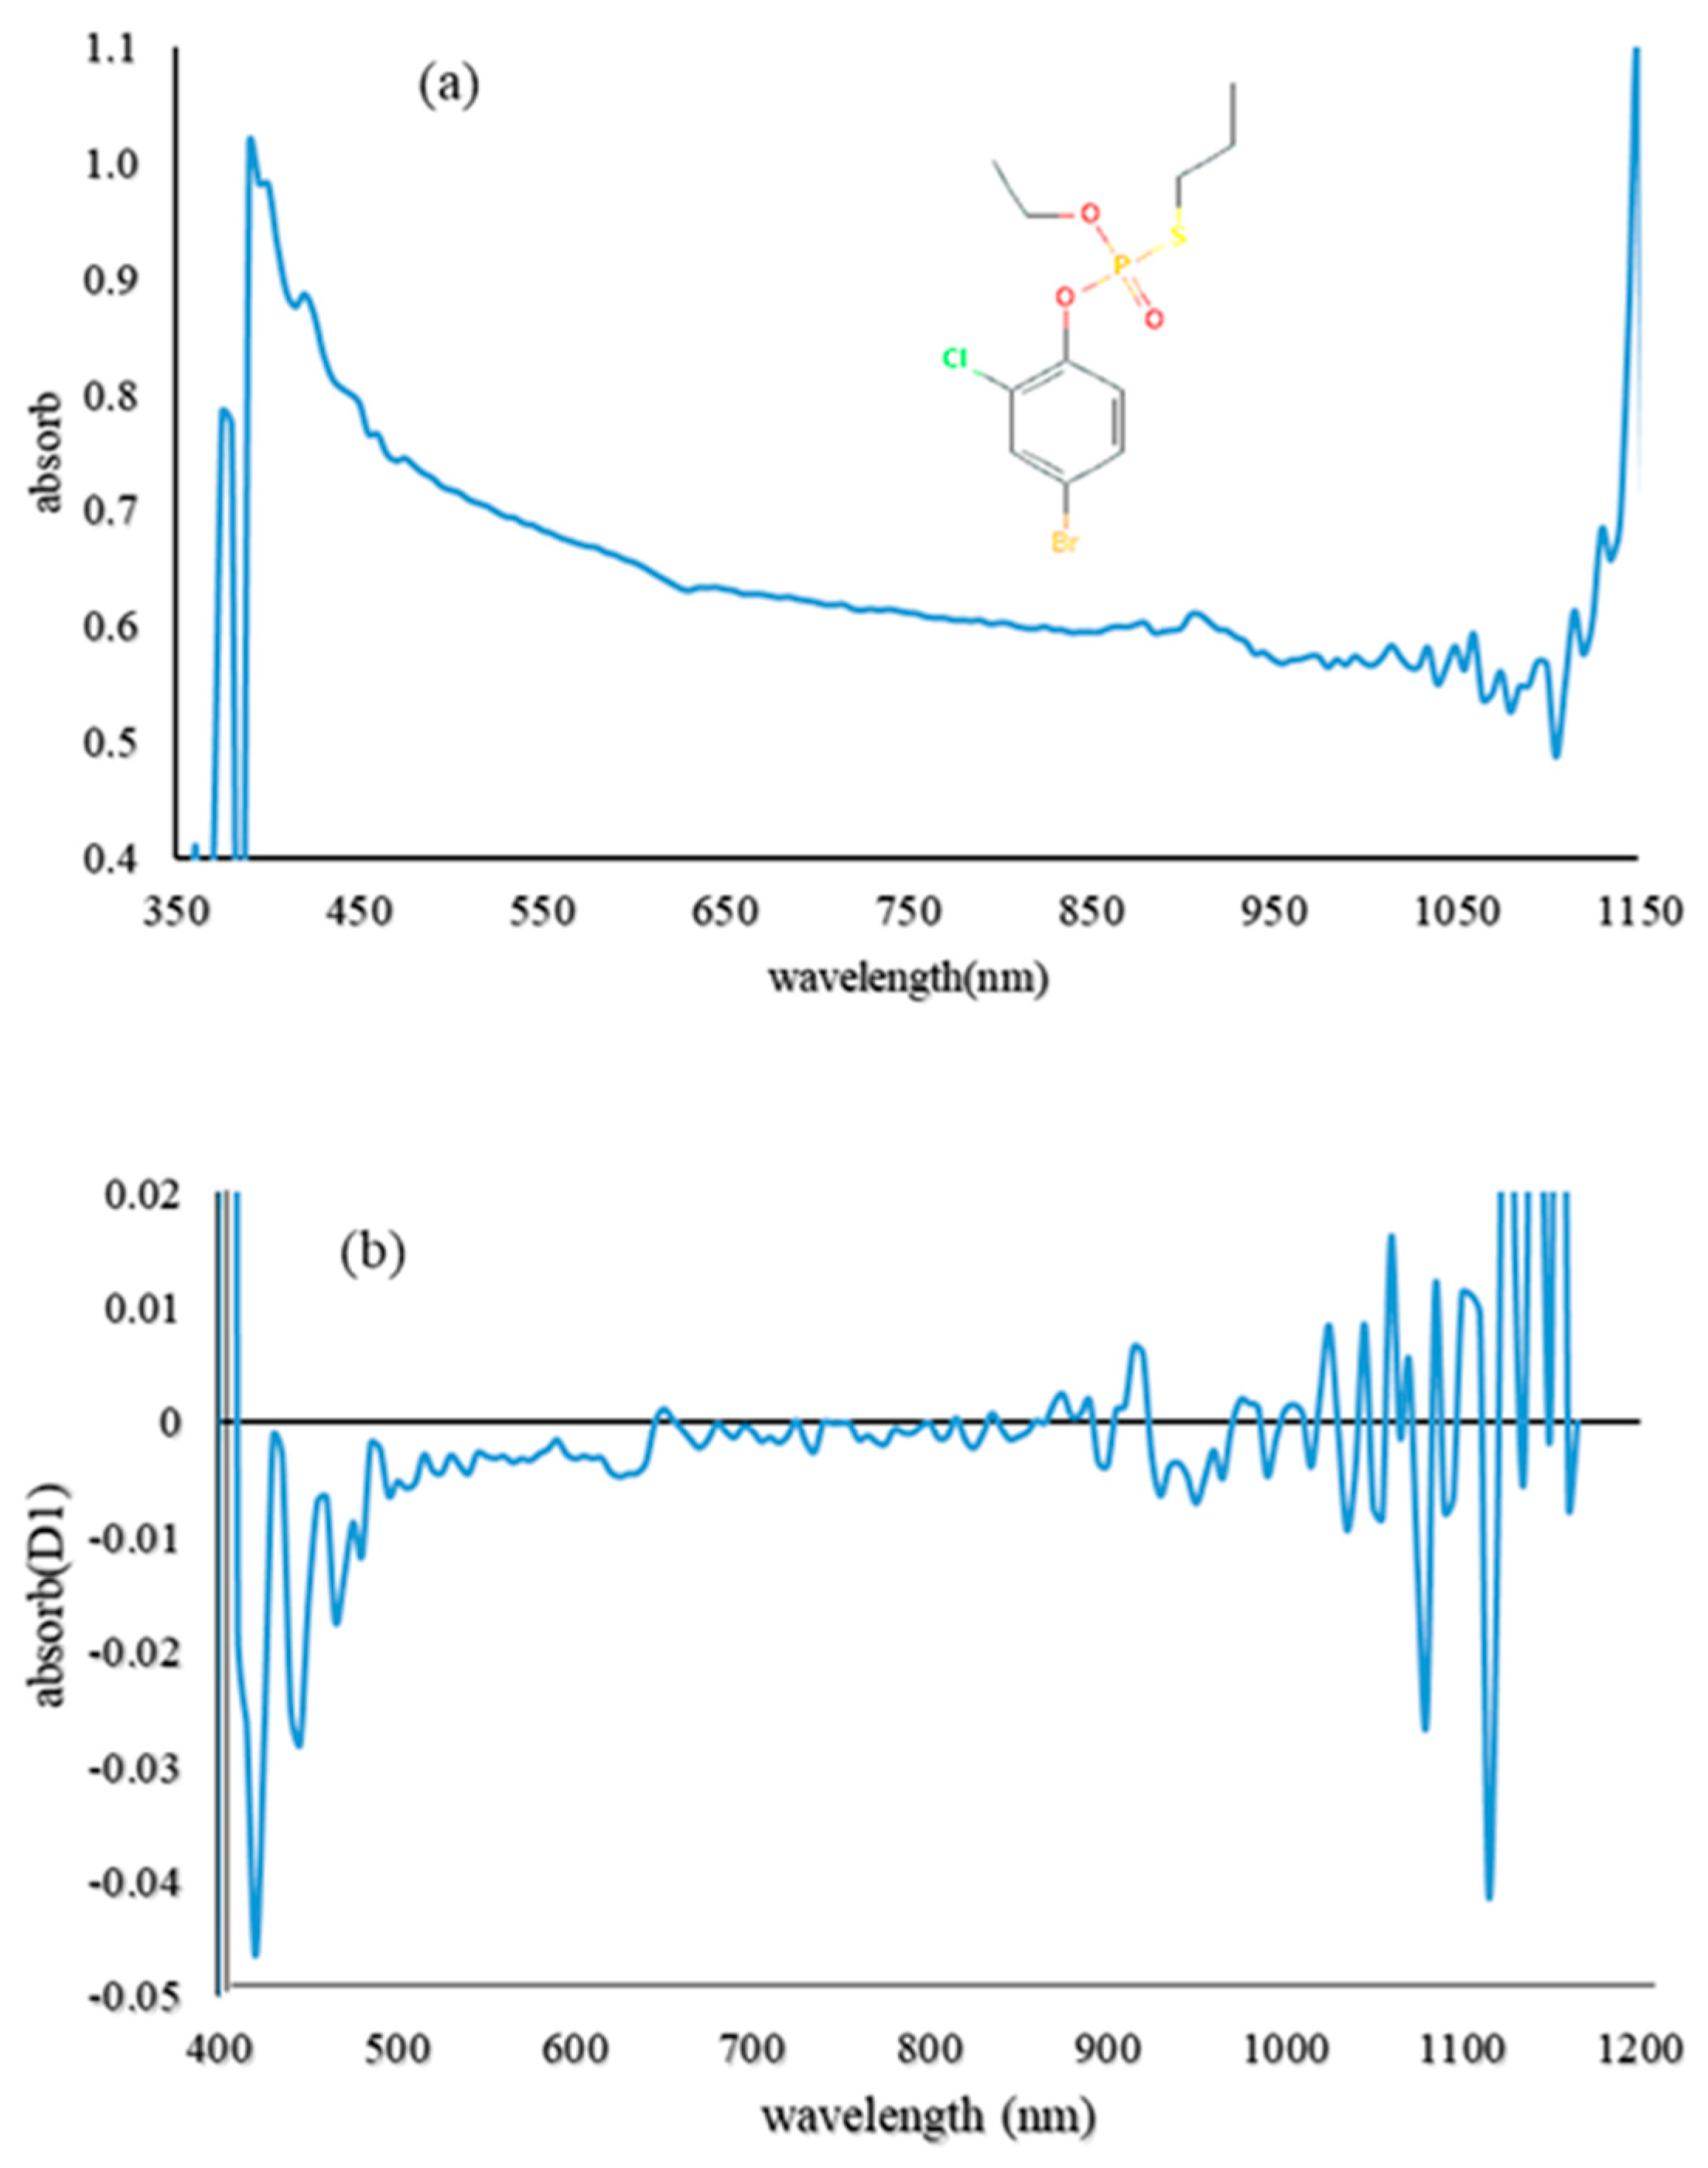
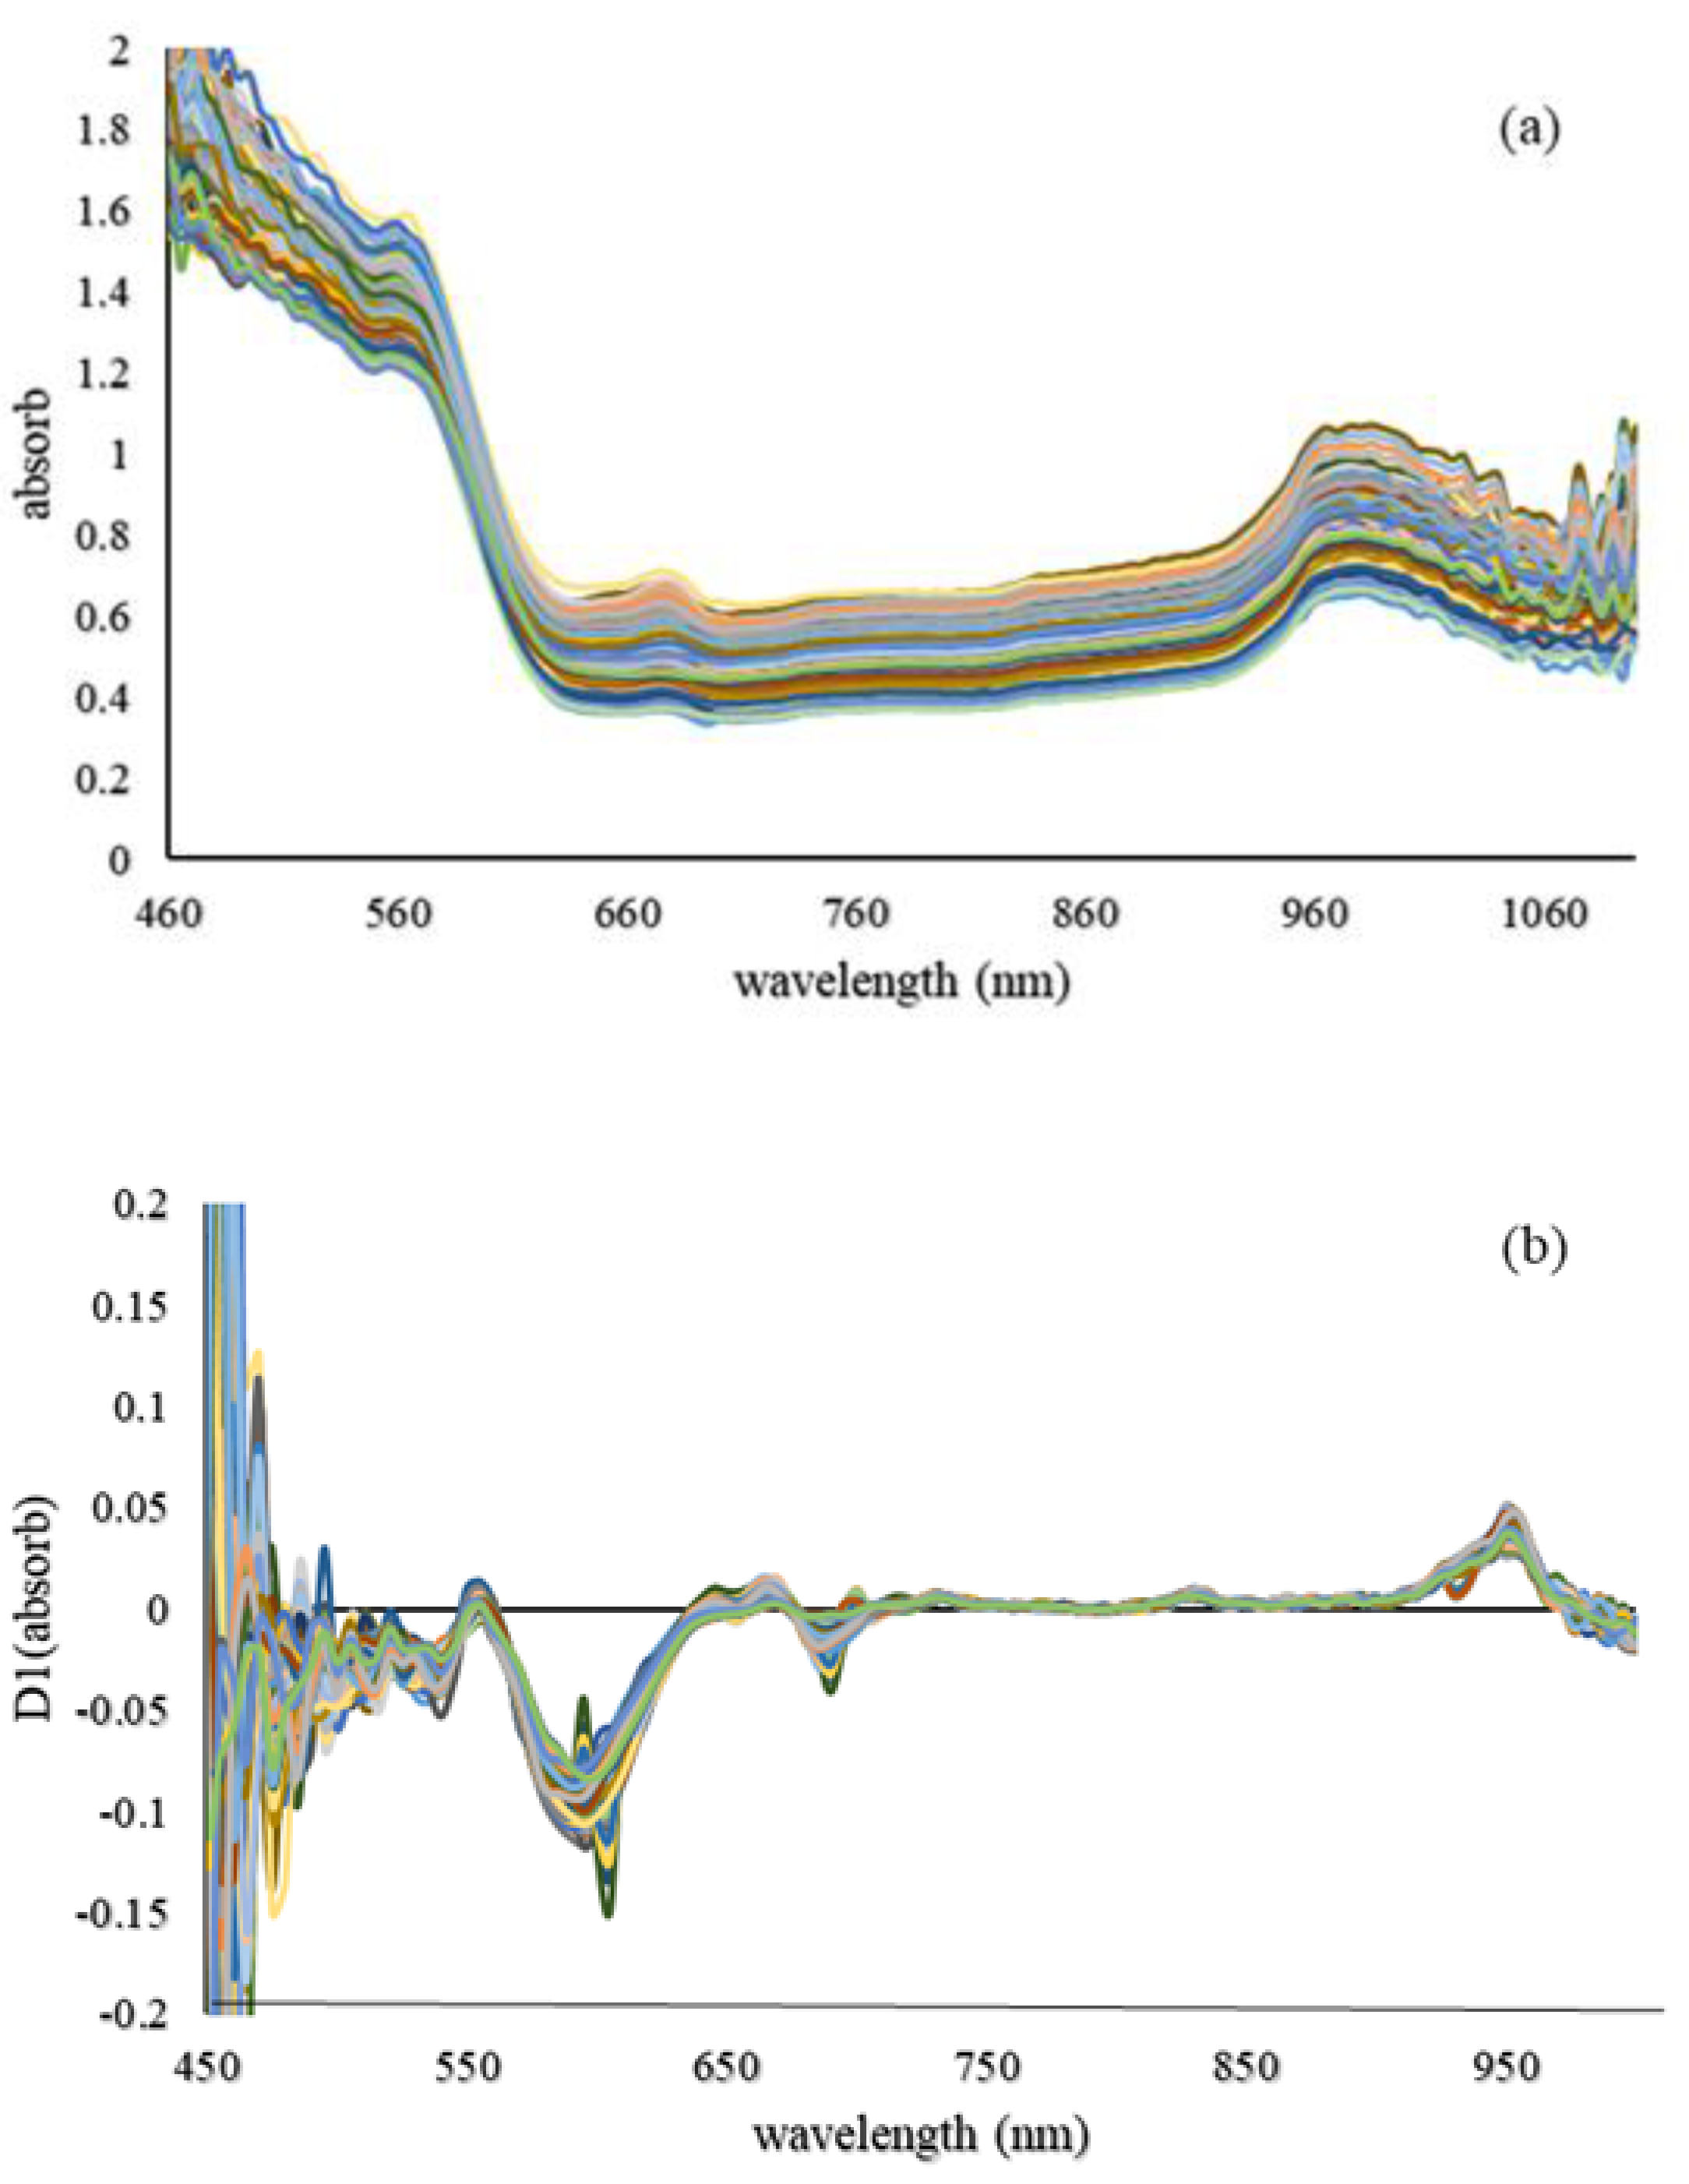
3.2. Spectral Interpretation
3.3. Multivariate Pre-Processing and Analysis
3.4. PLS-DA Analysis
4. Conclusions
Author Contributions
Funding
Institutional Review Board Statement
Informed Consent Statement
Data Availability Statement
Acknowledgments
Conflicts of Interest
Abbreviation
| MRL | maximum residue limit |
| EU | European Union |
| VIS/NIR | visible/near infrared |
| PCA | principal component analysis |
| PLSR | partial least squares regression |
| R2 | coefficient of determination |
| RMSE | root mean square error |
| RPD | residual prediction deviation |
| PLS-DA | partial least squares discriminant analysis |
| NIR-HSI | near infrared hyperspectral imaging |
| UPLC | ultra-performance liquid chromatography |
| SECV | standard error of cross validation |
| SD | standard deviation |
| OC | organic carbon |
| TN | total nitrogen |
| PHI | pre-harvest interval |
| LOD | limit of detection |
References
- Wu, Z.-X.; Xiao, L.; Wang, W.; Zhang, H.; Zhou, Z. Nondestructive Evaluation of Pesticide Residual in Tomatoes with Near Infrared Diffuse Reflection Spectrum. Hubei Agric. Sci. 2010, 4, 225–450. [Google Scholar]
- Zhang, C.X.; Ho, S.C.; Chen, Y.M.; Fu, J.H.; Cheng, S.Z.; Lin, F.Y. Greater vegetable and fruit intake is associated with a lower risk of breast cancer among Chinese women. Int. J. Cancer 2009, 125, 181–188. [Google Scholar] [CrossRef] [PubMed]
- Etminan, M.; Takkouche, B.; Caamaño-Isorna, F. The role of tomato products and lycopene in the prevention of prostate cancer: A meta-analysis of observational studies. Cancer Epidemiol. Prev. Biomark. 2004, 13, 340–345. [Google Scholar]
- Marengo, E.; Mazzucco, E.; Robotti, E.; Gosetti, F.; Manfredi, M.; Calabrese, G. Characterization study of tomato sauces stored in different packaging materials. Curr. Anal. Chem. 2017, 13, 187–201. [Google Scholar] [CrossRef]
- Andrikopoulos, C.J.; Cane, J.H. Two prolonged bee visits suffice to maximize drupelet set for red raspberry. HortScience 2018, 53, 1404–1406. [Google Scholar] [CrossRef] [Green Version]
- Faostat, F. 2017. Available online: http://www.fao.org/faostat/en/#data.QC (accessed on 17 January 2018).
- Salguero-Chaparro, L.; Gaitán-Jurado, A.J.; Ortiz-Somovilla, V.; Peña-Rodríguez, F. Feasibility of using NIR spectroscopy to detect herbicide residues in intact olives. Food Control 2013, 30, 504–509. [Google Scholar] [CrossRef]
- Saranwong, I.; Kawano, S. Rapid determination of fungicide contaminated on tomato surfaces using the DESIR-NIR: A system for ppm-order concentration. J. Near Infrared Spectrosc. 2005, 13, 169–175. [Google Scholar] [CrossRef]
- Maybury, R. Codex alimentarius approach to pesticide residue standards. J. Assoc. Off. Anal. Chem. 1989, 72, 538–541. [Google Scholar] [CrossRef]
- McGuire, S.; FAO; IFAD; WFP. The State of Food Insecurity in the World 2015: Meeting the 2015 International Hunger Targets: Taking Stock of Uneven Progress. Rome: FAO, 2015. Adv. Nutr. 2015, 6, 623–624. [Google Scholar] [CrossRef] [Green Version]
- Eto, M. Organophosphorus Pesticides; CRC Press: Boca Raton, FL, USA, 2018. [Google Scholar]
- Egan, H.; Hammond, E.; Thomson, J. The analysis of organo-phosphorus pesticide residues by gas chromatography. Analyst 1964, 89, 175–178. [Google Scholar] [CrossRef]
- Jamshidi, B.; Mohajerani, E.; Jamshidi, J.; Minaei, S.; Sharifi, A. Non-destructive detection of pesticide residues in cucumber using visible/near-infrared spectroscopy. Food Addit. Contam. Part A 2015, 32, 857–863. [Google Scholar] [CrossRef]
- Watanabe, E.; Kobara, Y.; Baba, K.; Eun, H. Determination of seven neonicotinoid insecticides in cucumber and eggplant by water-based extraction and high-performance liquid chromatography. Anal. Lett. 2015, 48, 213–220. [Google Scholar] [CrossRef]
- Tao, Y.; Dong, F.; Xu, J.; Liu, X.; Cheng, Y.; Liu, N.; Chen, Z.; Zheng, Y. Green and sensitive supercritical fluid chromatographic–tandem mass spectrometric method for the separation and determination of flutriafol enantiomers in vegetables, fruits, and soil. J. Agric. Food Chem. 2014, 62, 11457–11464. [Google Scholar] [CrossRef] [PubMed]
- Sánchez, M.T.; Flores-Rojas, K.; Guerrero, J.E.; Garrido-Varo, A.; Pérez-Marín, D. Measurement of pesticide residues in peppers by near-infrared reflectance spectroscopy. Pest Manag. Sci. Former. Pestic. Sci. 2010, 66, 580–586. [Google Scholar] [CrossRef]
- Teye, E.; Huang, X.-Y.; Afoakwa, N. Review on the potential use of near infrared spectroscopy (NIRS) for the measurement of chemical residues in food. Am. J. Food Sci. Technol. 2013, 1, 1–8. [Google Scholar]
- Yazici, A.; Tiryaki, G.Y.; Ayvaz, H. Determination of Pesticide Residual Levels in Strawberry (Fragaria) By Near-Infrared Spectroscopy. J. Sci. Food Agric. 2019, 100, 1980–1989. [Google Scholar] [CrossRef] [PubMed]
- Jamshidi, B.; Mohajerani, E.; Jamshidi, J. Developing a Vis/NIR spectroscopic system for fast and non-destructive pesticide residue monitoring in agricultural product. Measurement 2016, 89, 1–6. [Google Scholar] [CrossRef] [Green Version]
- Jamshidi, B. Non-destructive safety assessment of agricultural products using Vis/NIR spectroscopy. NIR News 2017, 28, 4–8. [Google Scholar] [CrossRef]
- Misal, R.M.; Deshmukh, R.R. Nondestructive Detection of Pesticide Residue on Banana Surface Based on Near Infrared Spectroscopy. Scanning 2016, 3, 700. [Google Scholar]
- González-Martín, M.; Revilla, I.; Vivar-Quintana, A.; Salcedo, E.B. Pesticide residues in propolis from Spain and Chile. An approach using near infrared spectroscopy. Talanta 2017, 165, 533–539. [Google Scholar] [CrossRef]
- Flémal, P.; Pigeon, O.; Dardenne, P.; Pierna, J.F.; Baeten, V.; Vermeulen, P. Assessment of pesticide coating on cereal seeds by near infrared hyperspectral imaging. J. Spectr. Imaging 2017, 6, 742–749. [Google Scholar]
- Shan, R.; Chen, Y.; Meng, L.; Li, H.; Zhao, Z.; Gao, M.; Sun, X. Rapid prediction of atrazine sorption in soil using visible near-infrared spectroscopy. Spectrochim. Acta Part A Mol. Biomol. Spectrosc. 2020, 224, 117455. [Google Scholar] [CrossRef] [PubMed]
- Nganchamung, T.; Robson, M.G.; Siriwong, W. Association between blood cholinesterase activity, organophosphate pesticide residues on hands, and health effects among chili farmers in Ubon Ratchathani Province, northeastern Thailand. Rocz. Państwowego Zakładu Hig. 2017, 68, 175–183. [Google Scholar]
- Anastassiades, M.; Lehotay, S.J.; Štajnbaher, D.; Schenck, F.J. Fast and easy multiresidue method employing acetonitrile extraction/partitioning and “dispersive solid-phase extraction” for the determination of pesticide residues in produce. J. AOAC Int. 2003, 86, 412–431. [Google Scholar] [CrossRef] [Green Version]
- Agilent Technologies Publication; Ciscato, C.; Barbosa, C.; Gebara, A. Analysis of Pesticide Residues in Mango by GC/MS/MS With Bond Elut QuEChERS EN Kits. Available online: https://www.agilent.com/cs/library/applications/5991-6054EN.pdf (accessed on 17 January 2018).
- Wang, Y.; Sun, F.; Li, X. Compound dimensionality reduction based multi-dynamic kernel principal component analysis monitoring method for batch process with large-scale data sets. J. Intell. Fuzzy Syst. 2020, 38, 471–480. [Google Scholar] [CrossRef]
- Brereton, R. Principal component analysis: The method. Chemometrics. In Data Analysis for the Laboratory and Chemical Plant, ed RG Brereton; John Wiley and Sons, Ltd.: Chichester, UK, 2003; pp. 191–223. [Google Scholar]
- Camacho, J.; Smilde, A.; Saccenti, E.; Westerhuis, J. All sparse PCA models are wrong, but some are useful. Part I: Computation of scores, residuals and explained variance. Chemom. Intell. Lab. Syst. 2020, 196, 103907. [Google Scholar] [CrossRef]
- Rafajłowicz, E.; Steland, A. The Hotelling—Like T2 Control Chart Modified for Detecting Changes in Images Having the Matrix Normal; Stochastic Models, Statistics and Their Applications: Dresden, Germany, March 2019; Volume 294, p. 193. [Google Scholar]
- Vieira, T.F.; Makimori, G.Y.F.; dos Santos Scholz, M.B.; Zielinski, A.A.F.; Bona, E. Chemometric Approach Using ComDim and PLS-DA for Discrimination and Classification of Commercial Yerba Mate (Ilex paraguariensis St. Hil.). Food Anal. Methods 2020, 13, 97–107. [Google Scholar] [CrossRef]
- Lottering, R.T.; Govender, M.; Peerbhay, K.; Lottering, S. Comparing partial least squares (PLS) discriminant analysis and sparse PLS discriminant analysis in detecting and mapping Solanum mauritianum in commercial forest plantations using image texture. ISPRS J. Photogramm. Remote Sens. 2020, 159, 271–280. [Google Scholar] [CrossRef]
- Meng, L.; Chen, X.; Chen, X.; Yuan, L.; Shi, W.; Cai, Q.; Huang, G. Linear and nonlinear classification models for tea grade identification based on the elemental profile. Microchem. J. 2020, 153, 104512. [Google Scholar] [CrossRef]
- Choi, J.-Y.; Heo, S.; Bae, S.; Kim, J.; Moon, K.-D. Discriminating the origin of basil seeds (Ocimum basilicum L.) using hyperspectral imaging analysis. LWT 2020, 118, 108715. [Google Scholar] [CrossRef]
- Yi, S.; Deng, L.; He, S.; Zheng, Y.; Zhang, X. Research on nitrogen content of leaf of Jincheng orange cultivar using visible near infrared spectroscopy model. J. Fruit Sci. 2010, 27, 13–17. [Google Scholar]
- Sharabiani, V.R.; Nazarloo, A.S.; Taghinezhad, E. Prediction of Protein Content of Winter Wheat by Canopy of Near Infrared Spectroscopy (NIRS), Using Partial Least Squares Regression (PLSR) and Artificial Neural Network (ANN) Models. Yüzüncü Yıl Üniversitesi Tarım Bilimleri Derg. 2019, 29, 43–51. [Google Scholar] [CrossRef]


| Mean | Standard Deviation | |
|---|---|---|
| Weight | 132.26 | 16.82 |
| Large diameter | 66.16 | 3.85 |
| Small diameter | 63.66 | 3.67 |
| Vertical diameter | 60.21 | 3.50 |
| Analytical Column | HP-5 ms Ultra Inert 30 m × 250 μm, 0.25 μm (p/n 19091S-433UI) |
|---|---|
| Injection volume | 1 μL |
| Injection mode | Splitless |
| Inlet temperature | 280 °C |
| Liner | UI, splitless, single taper, glass wool (p/n 5190–2293) |
| Plated seal kit | Gold Seal, Ultra Inert, with washer (p/n 5190–6144) |
| Carrier gas | Helium, constant flow, 1 ML/min |
| Oven program | 60 °C for 1 min, then 40 °C/min to 170 °C, then 10 °C/min to 310 °C, then hold for 2 min |
| Transfer line temperature | 280 °C |
| Number | Profenofos (mg·kg−1) | Group | Number | Profenofos (mg·kg−1) | |||||
|---|---|---|---|---|---|---|---|---|---|
| Range | Mean | Standard Deviation | Range | Mean | Standard Deviation | ||||
| Calibration | 112 | “n.d”–42.90 | 14.00 | 10.16 | Healthy | 40 | “n.d”–9.90 | 4.30 | 4.22 |
| Unhealthy | 72 | 10.10–42.90 | 19.60 | 8.14 | |||||
| Validation | 48 | “n.d”–34.00 | 13.70 | 8.92 | Healthy | 18 | “n.d”–10.00 | 4.90 | 4.20 |
| Unhealthy | 30 | 10.10–34.00 | 18.90 | 6.78 | |||||
| Treatments | Number | Range | Mean | Standard Deviation |
|---|---|---|---|---|
| P0 | 30 | n.d (<LOD) | n.d (<LOD) | n.d (<LOD) |
| P-2H | 30 | (6.70–42.94) | 22.97 | 10.63 |
| P-2D | 30 | (5.28–34.02) | 16.49 | 7.90 |
| P-2D-W | 30 | (5.07–25.91) | 14.29 | 6.43 |
| P-1W | 30 | (6.52–29.50) | 15.20 | 6.50 |
| P-2W | 30 | (8.27–28.34) | 14.61 | 5.52 |
| LV | RCV | RMSECV | |
|---|---|---|---|
| No pre-processing | 12 | 0.9152 | 4.5194 |
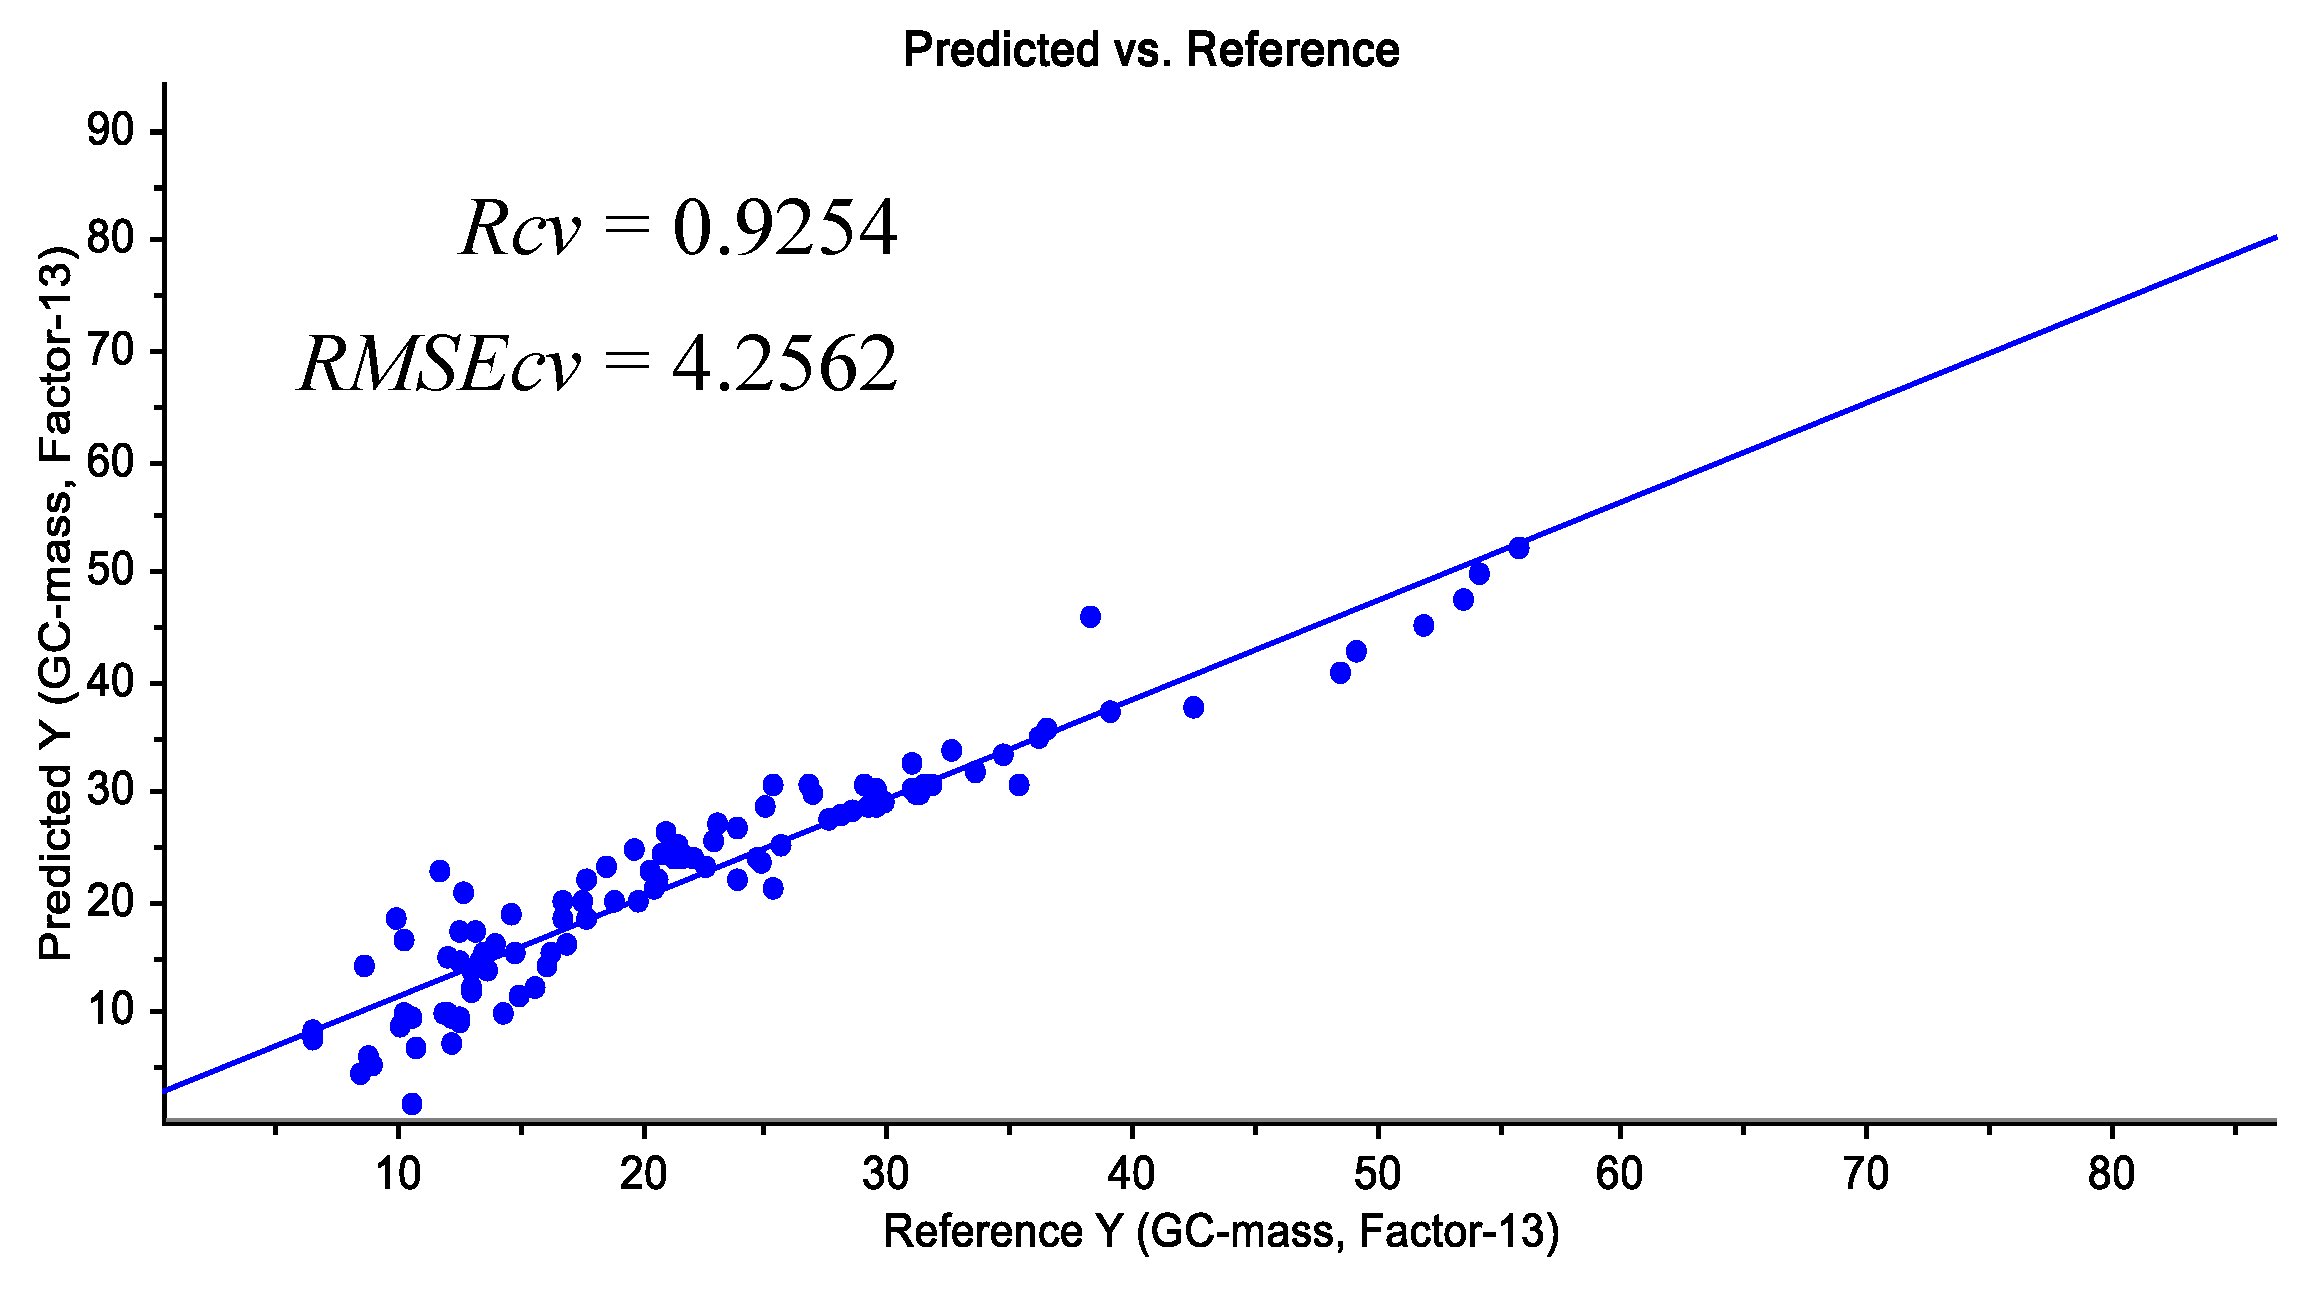
| Smoothing—moving average | 13 | 0.9254 | 4.2562 |
| Smoothing—gaussian filter | 14 | 0.9251 | 4.2680 |
| Smoothing—median filter | 13 | 0.8847 | 5.2481 |
| Smoothing—SGolay | 15 | 0.9295 | 4.1379 |
| Maximum normalize | 11 | 0.8679 | 5.5788 |
| 1derivative—SGolay | 15 | 0.7522 | 7.6328 |
| SNV | 13 | 0.7978 | 6.8656 |
| MSC | 15 | 0.7828 | 7.1441 |
| (Smoothing—Gaussian) + (smoothing median) | 11 | 0.7778 | 7.0276 |
| Normalize + Gaussian | 10 | 0.8490 | 5.9218 |
| Pre-Processing | Pls Factor | Accuracy of Calibration Data Classification (%) | SECV | Accuracy of Prediction Data Classification (%) |
|---|---|---|---|---|
| No pre-processing | 12 | 90.3 | 4.5406 | 89.30 |
| Smoothing—moving average | 13 | 90.0 | 4.2767 | 91.66 |
| Smoothing—gaussian filter | 14 | 89.0 | 4.2884 | 86.08 |
| Smoothing—median filter | 13 | 84.0 | 5.2727 | 87.61 |
| Smoothing—S-Golay | 15 | 88.2 | 4.1566 | 85.88 |
| Maximum normalize | 11 | 84.0 | 5.6056 | 89.25 |
| 1derivative—SGolay | 15 | 84.9 | 7.6652 | 89.25 |
| SNV | 13 | 85.5 | 6.8978 | 87.61 |
| MSC | 15 | 90.3 | 7.1780 | 89.25 |
| (Smoothing—Gaussian) + (smoothing median) | 11 | 84.8 | 7.0616 | 85.88 |
| Normalize + Gaussian | 10 | 88.9 | 5.9503 | 90.78 |
Publisher’s Note: MDPI stays neutral with regard to jurisdictional claims in published maps and institutional affiliations. |
© 2021 by the authors. Licensee MDPI, Basel, Switzerland. This article is an open access article distributed under the terms and conditions of the Creative Commons Attribution (CC BY) license (http://creativecommons.org/licenses/by/4.0/).
Share and Cite
Soltani Nazarloo, A.; Rasooli Sharabiani, V.; Abbaspour Gilandeh, Y.; Taghinezhad, E.; Szymanek, M.; Sprawka, M. Feasibility of Using VIS/NIR Spectroscopy and Multivariate Analysis for Pesticide Residue Detection in Tomatoes. Processes 2021, 9, 196. https://doi.org/10.3390/pr9020196
Soltani Nazarloo A, Rasooli Sharabiani V, Abbaspour Gilandeh Y, Taghinezhad E, Szymanek M, Sprawka M. Feasibility of Using VIS/NIR Spectroscopy and Multivariate Analysis for Pesticide Residue Detection in Tomatoes. Processes. 2021; 9(2):196. https://doi.org/10.3390/pr9020196
Chicago/Turabian StyleSoltani Nazarloo, Araz, Vali Rasooli Sharabiani, Yousef Abbaspour Gilandeh, Ebrahim Taghinezhad, Mariusz Szymanek, and Maciej Sprawka. 2021. "Feasibility of Using VIS/NIR Spectroscopy and Multivariate Analysis for Pesticide Residue Detection in Tomatoes" Processes 9, no. 2: 196. https://doi.org/10.3390/pr9020196