
Investigation of Individual Cells Replacement Concept in Lithium-Ion Battery Packs with Analysis on Economic Feasibility and Pack Design Requirements


Abstract
:1. Introduction
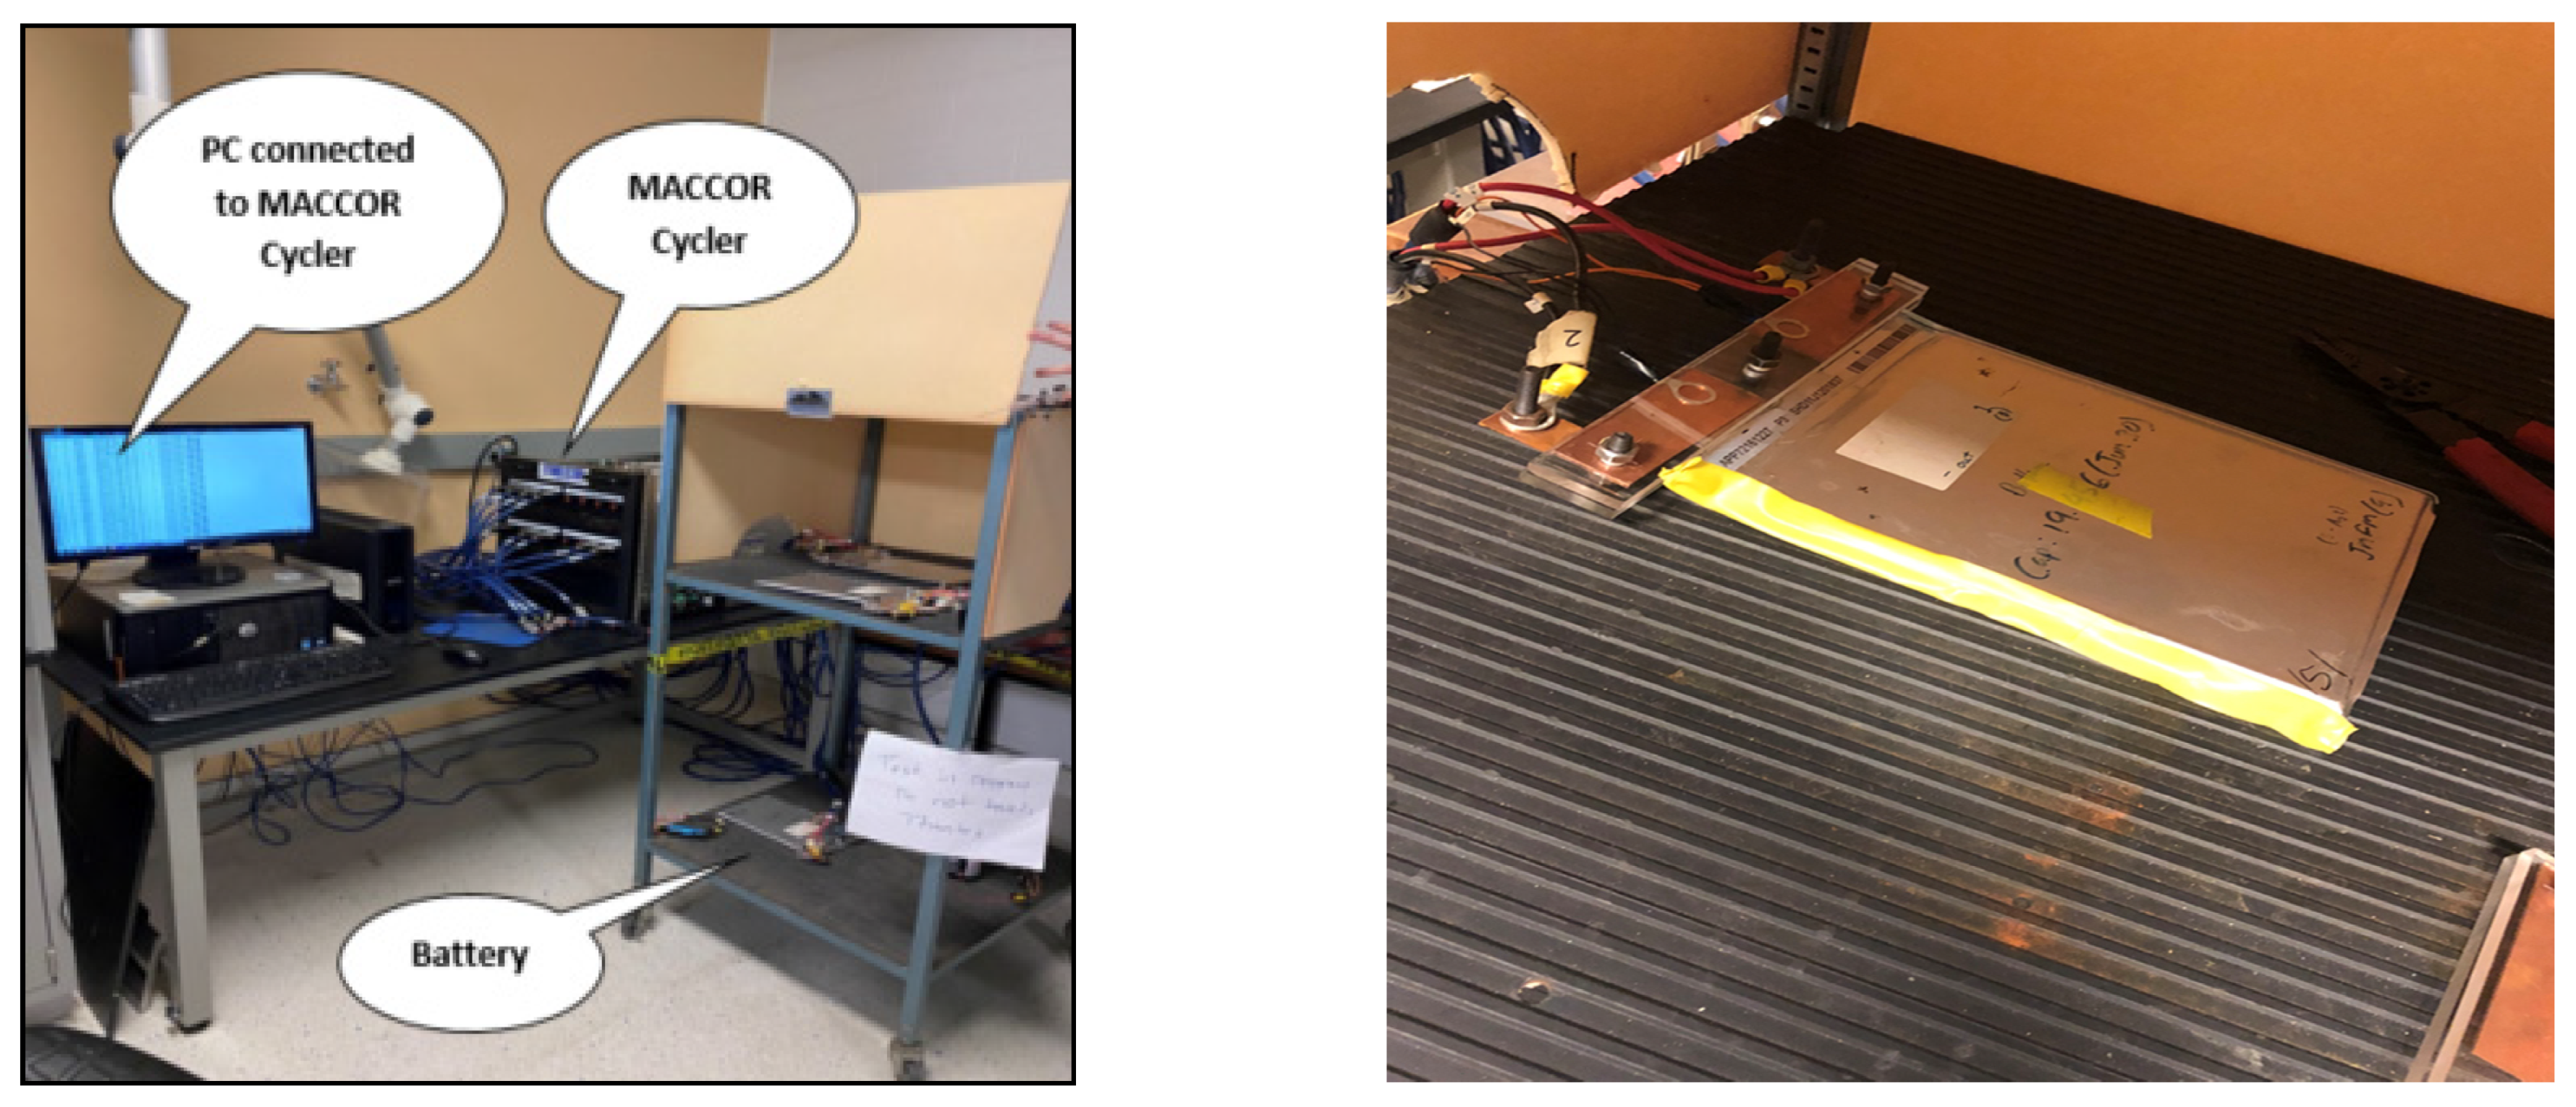
2. Experimental
3. Modeling and Simulation
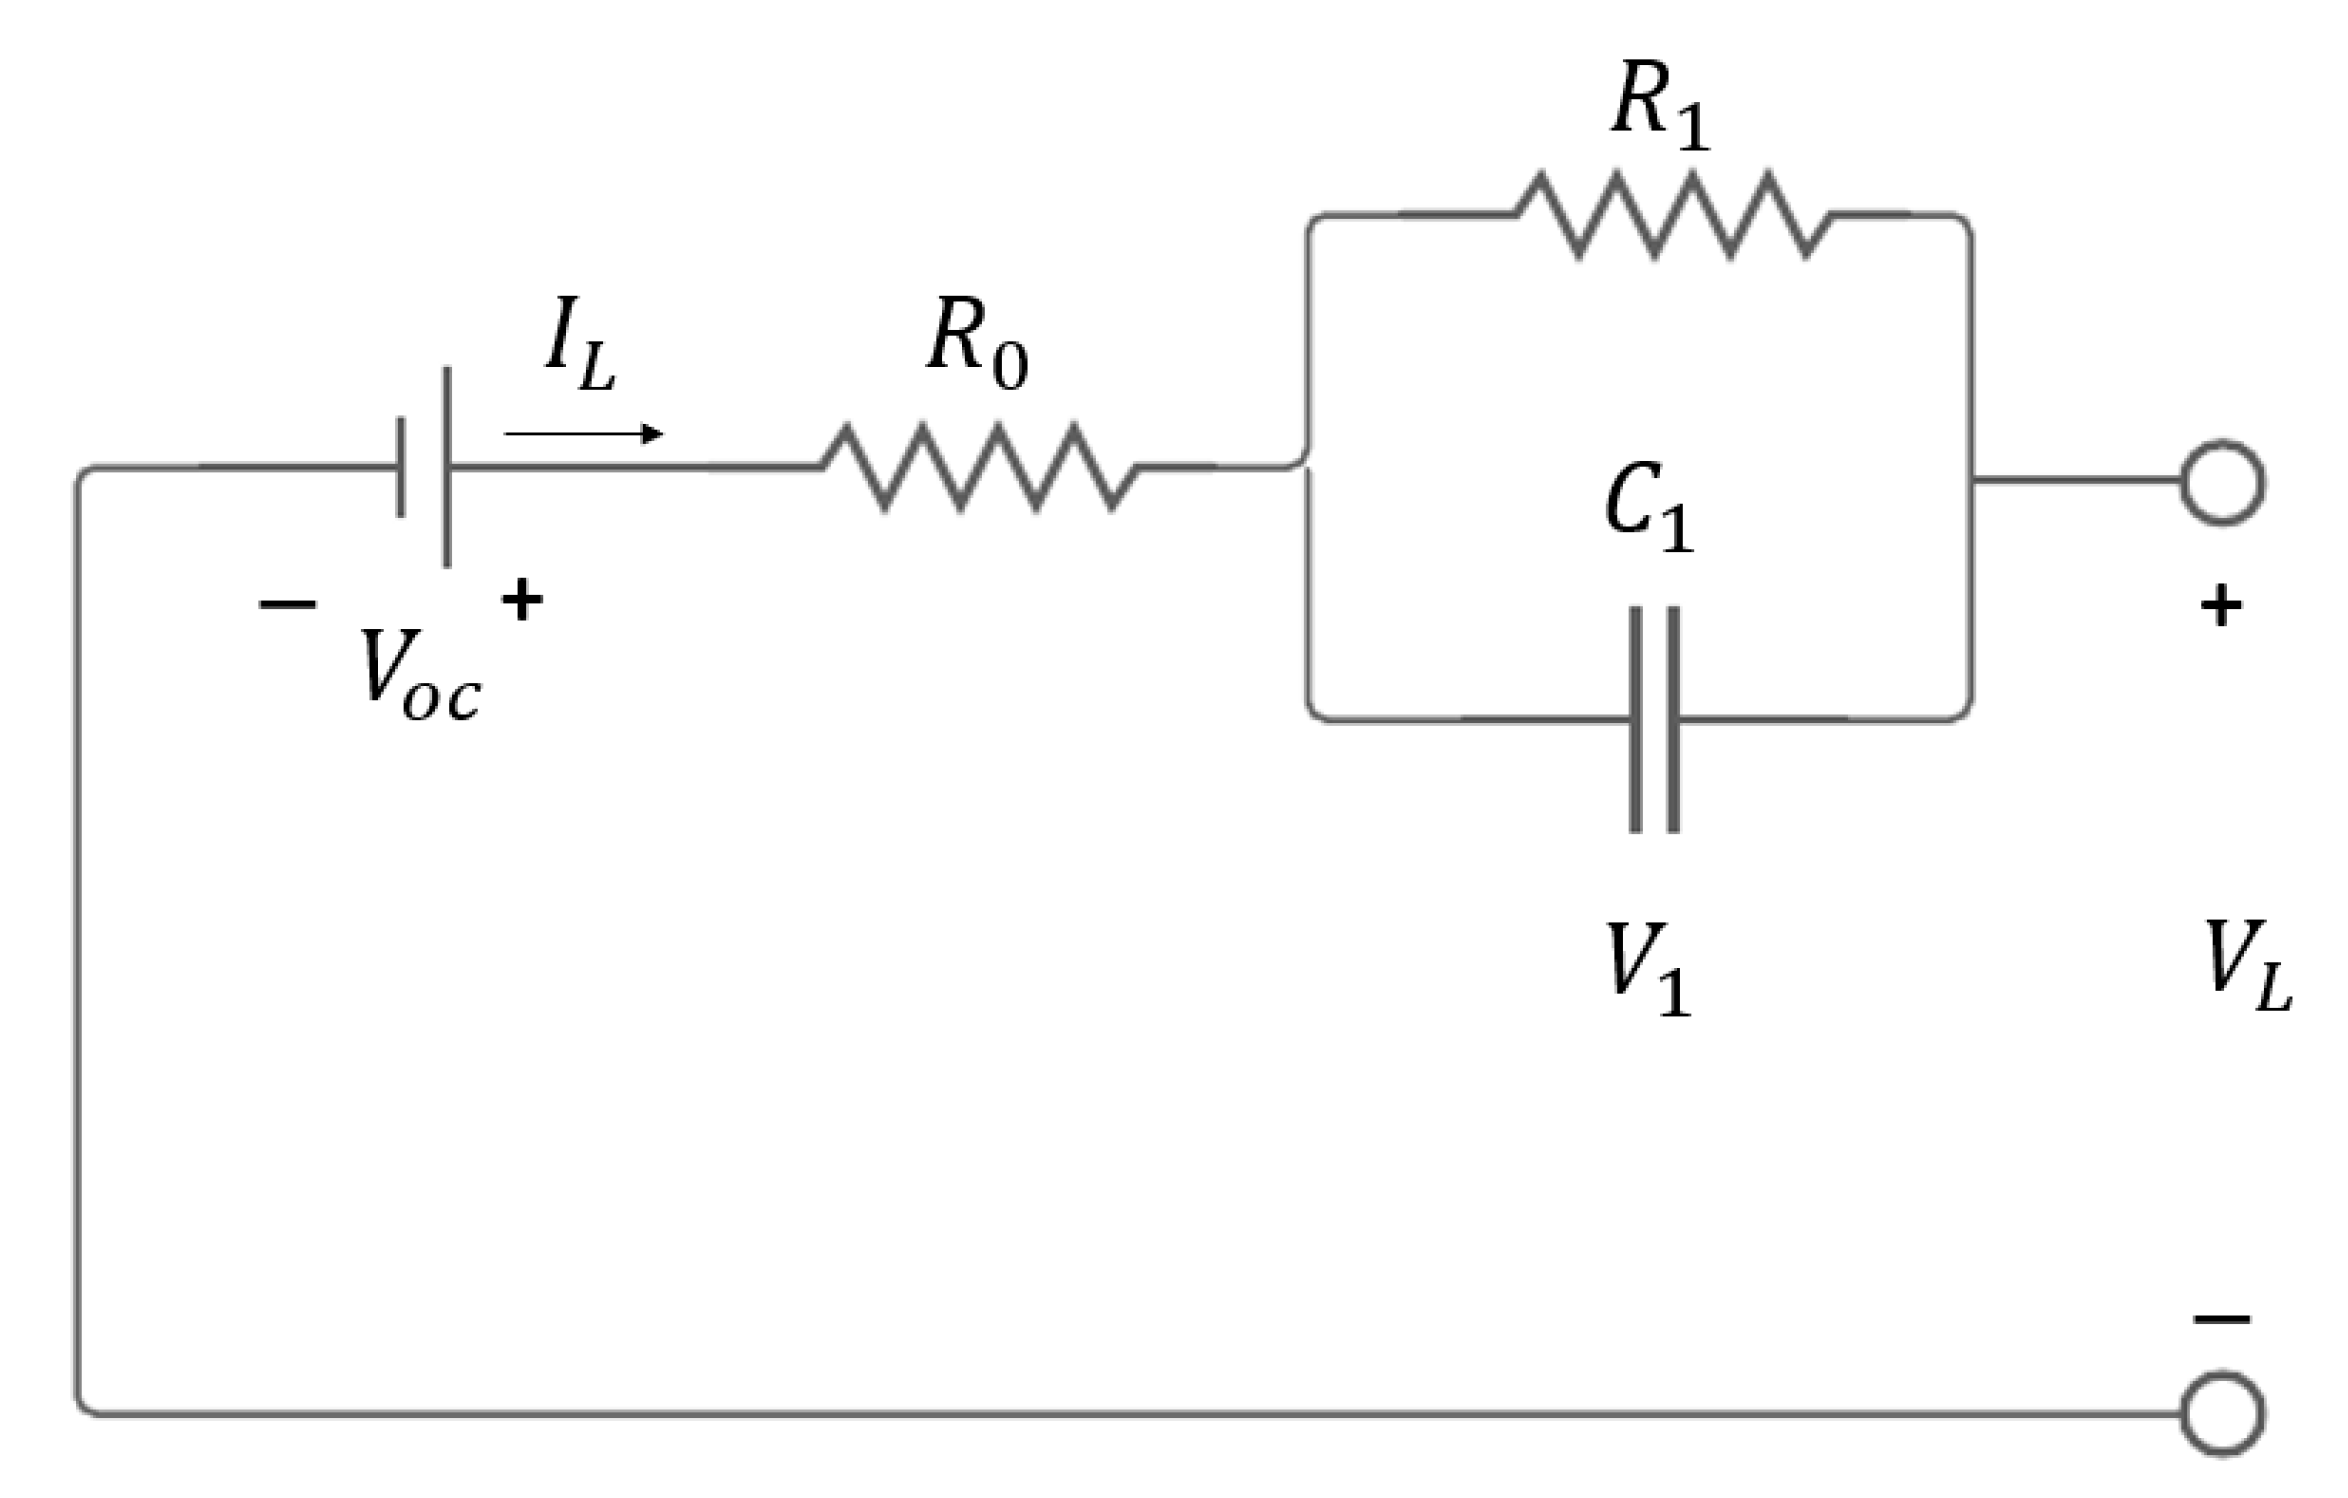
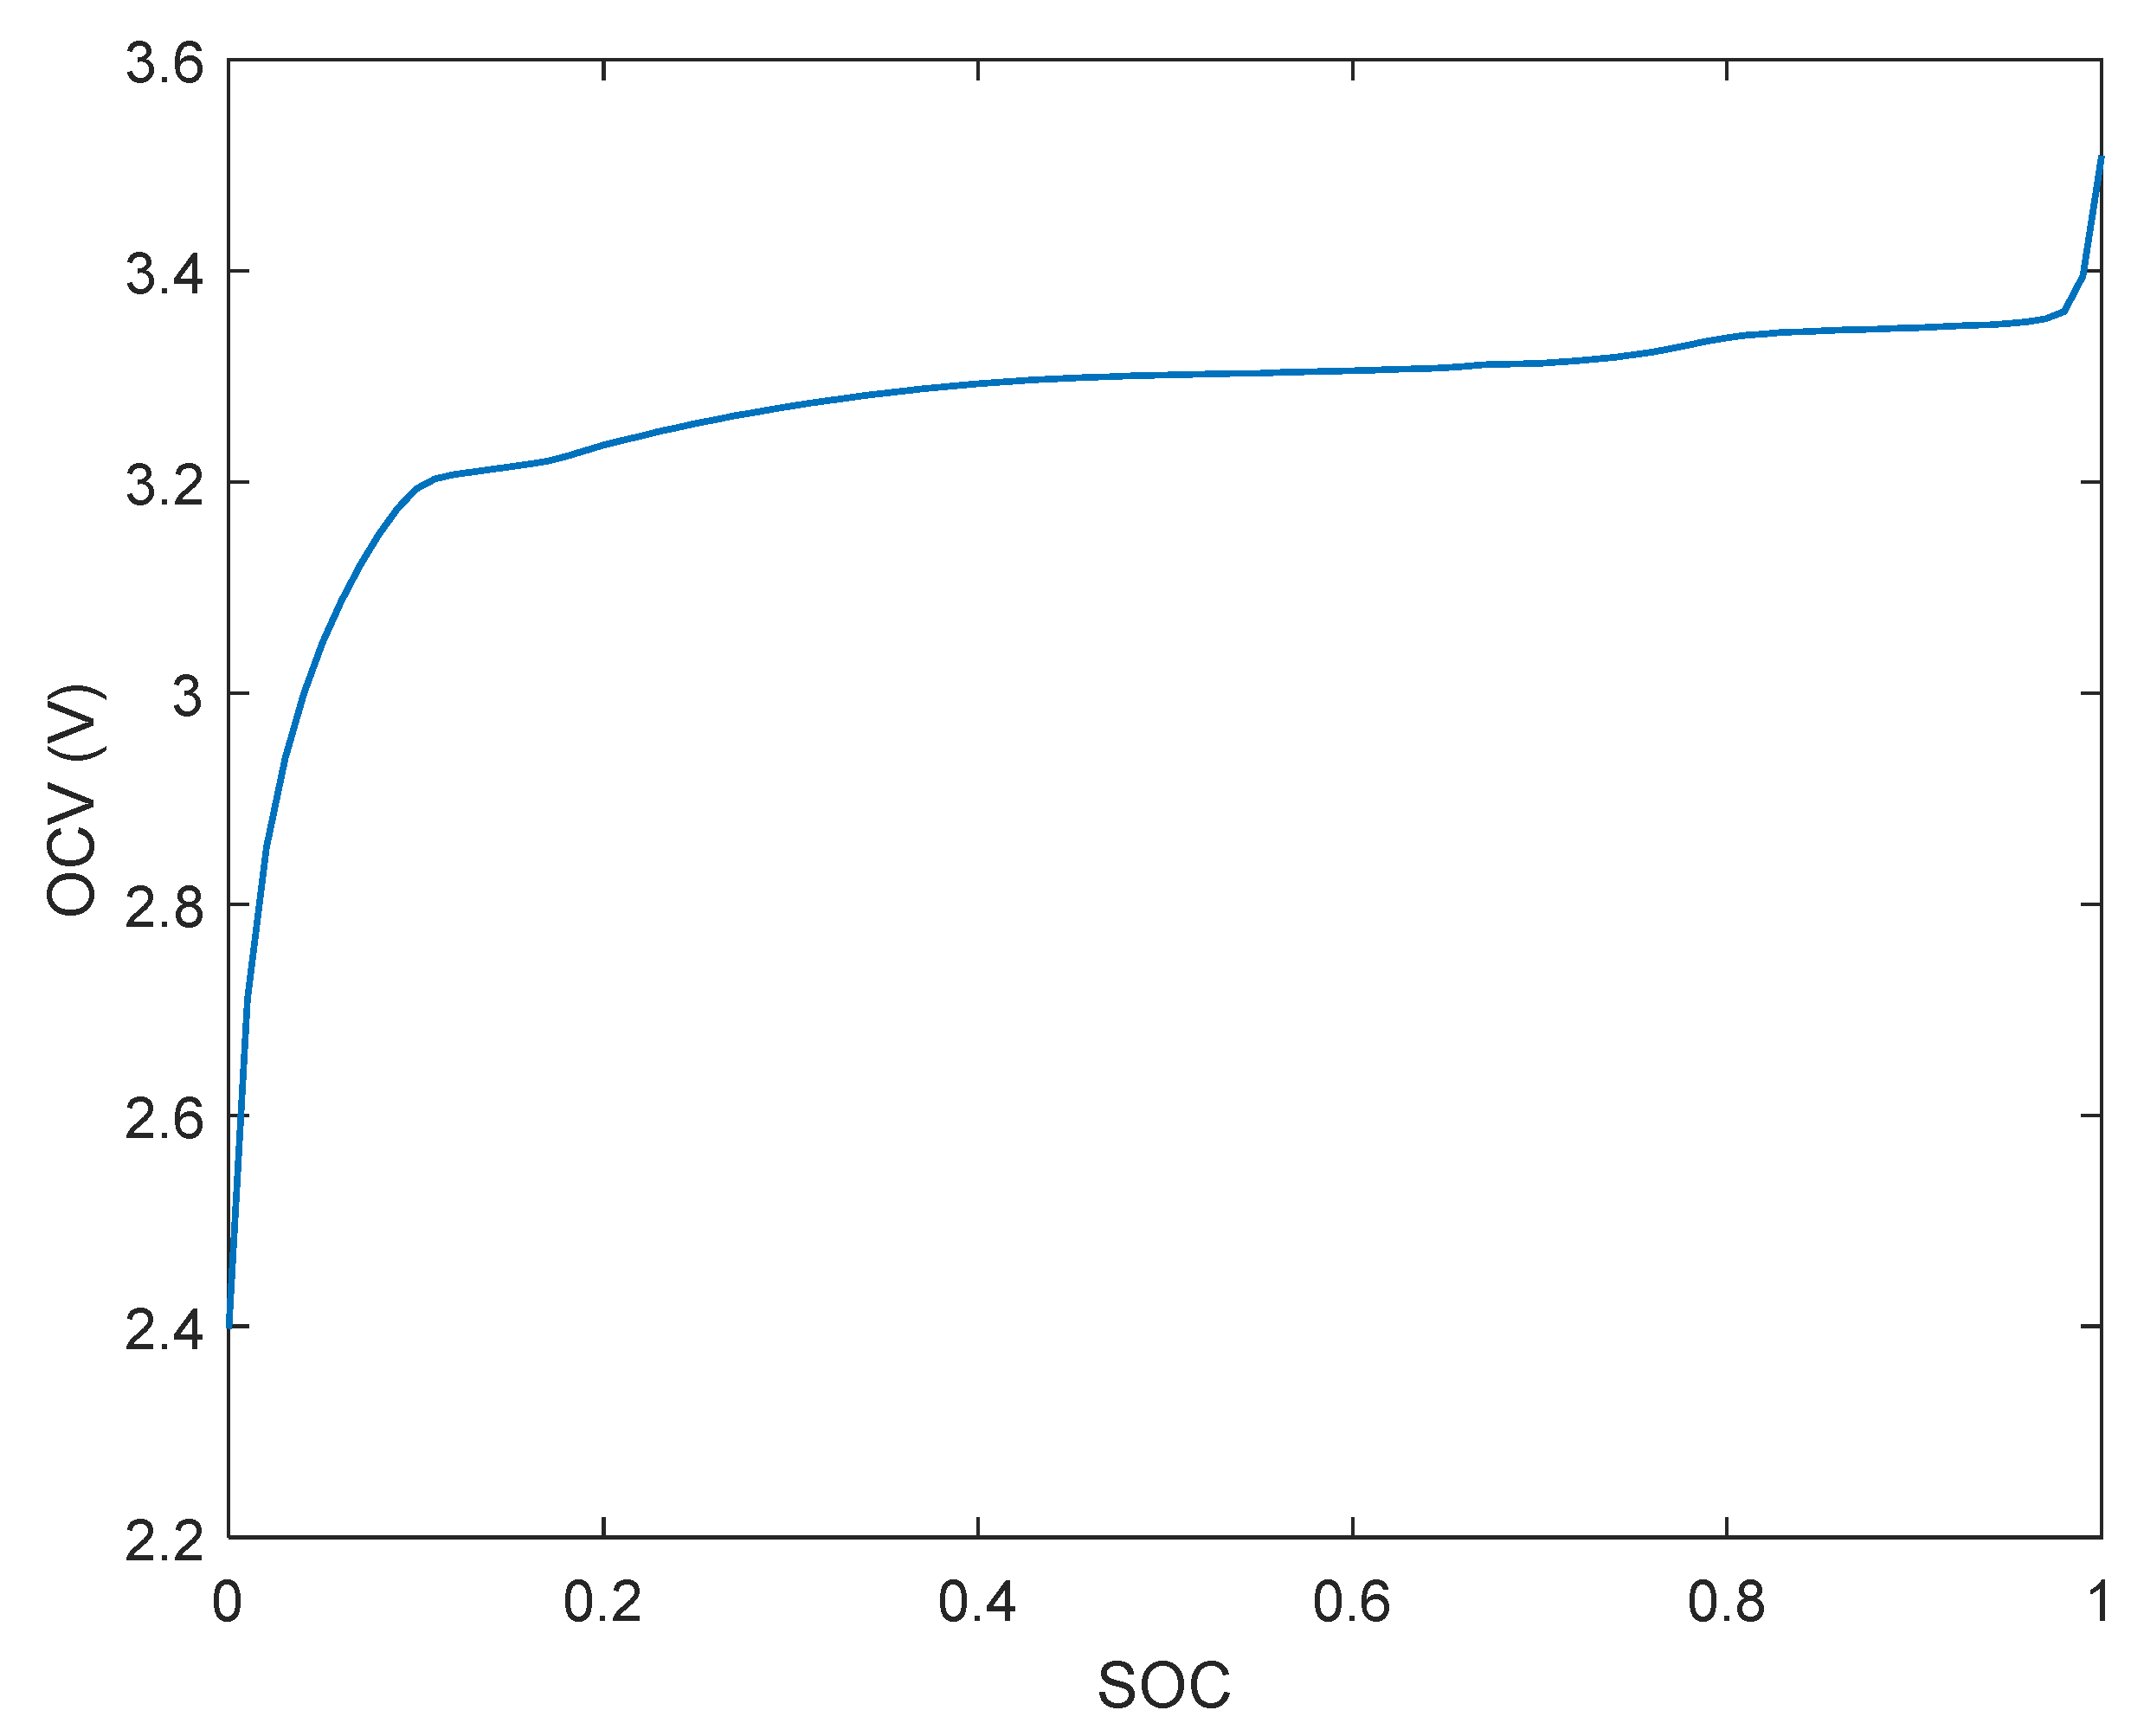
3.1. Cell Voltage Model
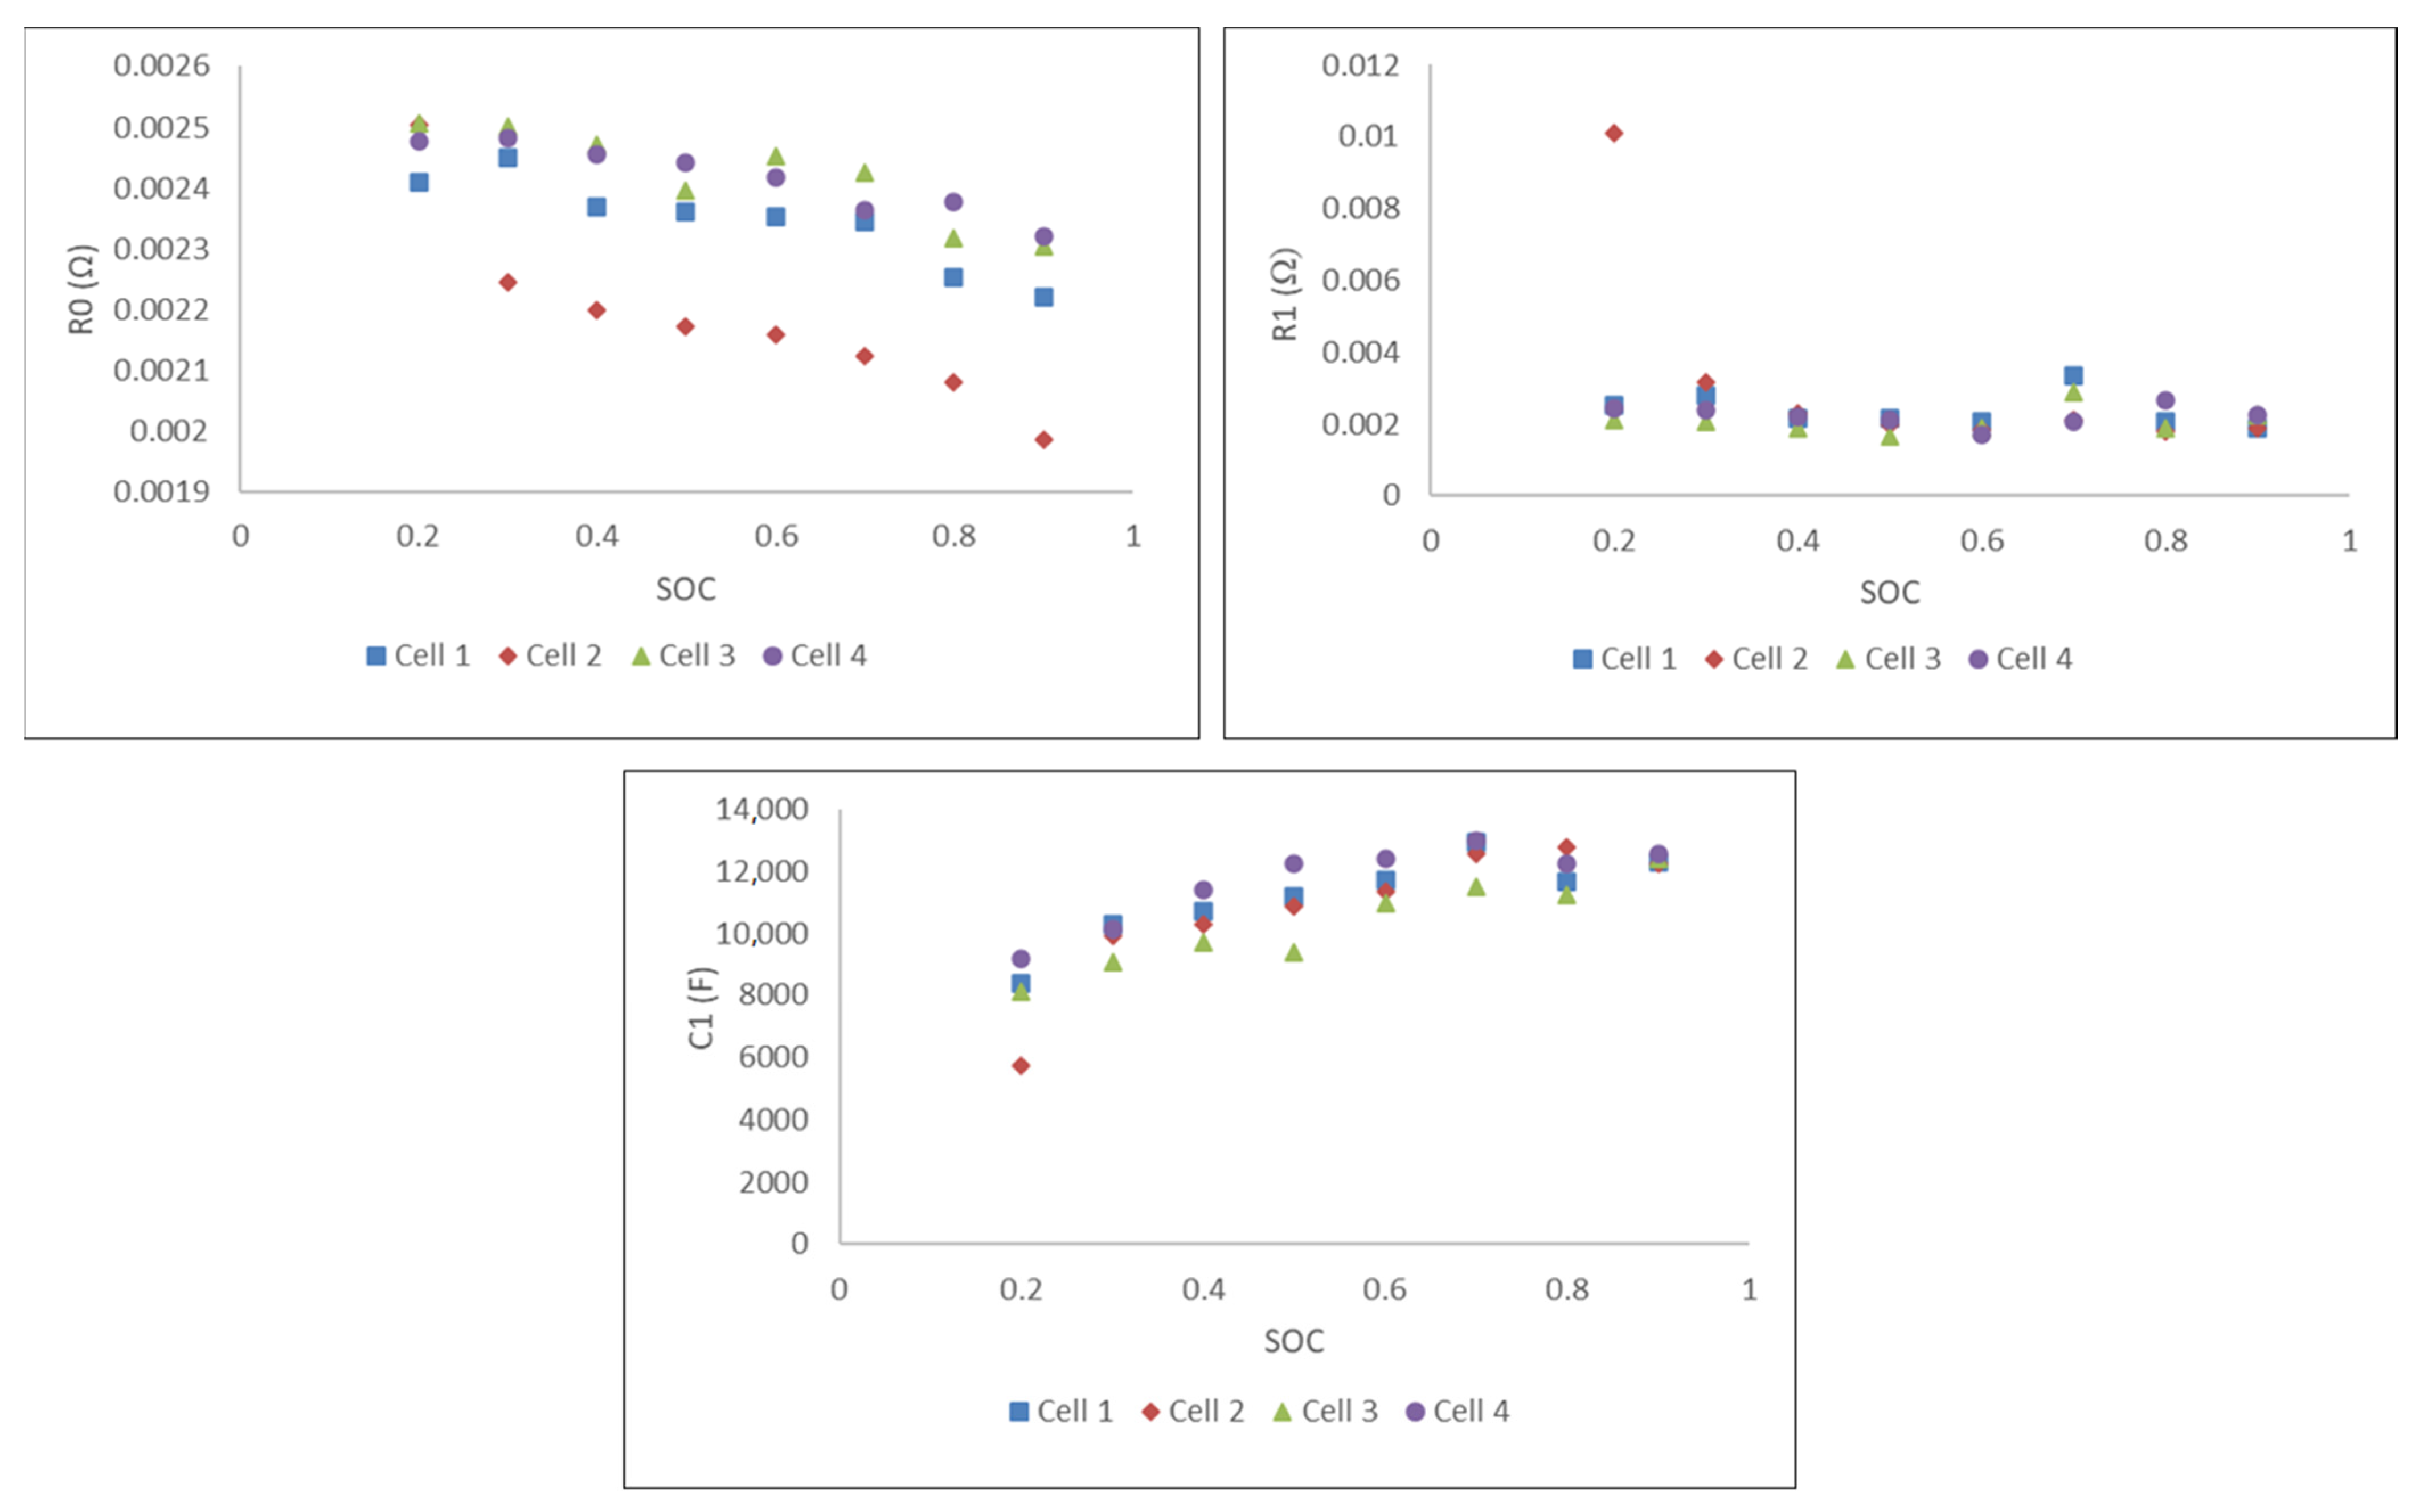
3.1.1. Model Development
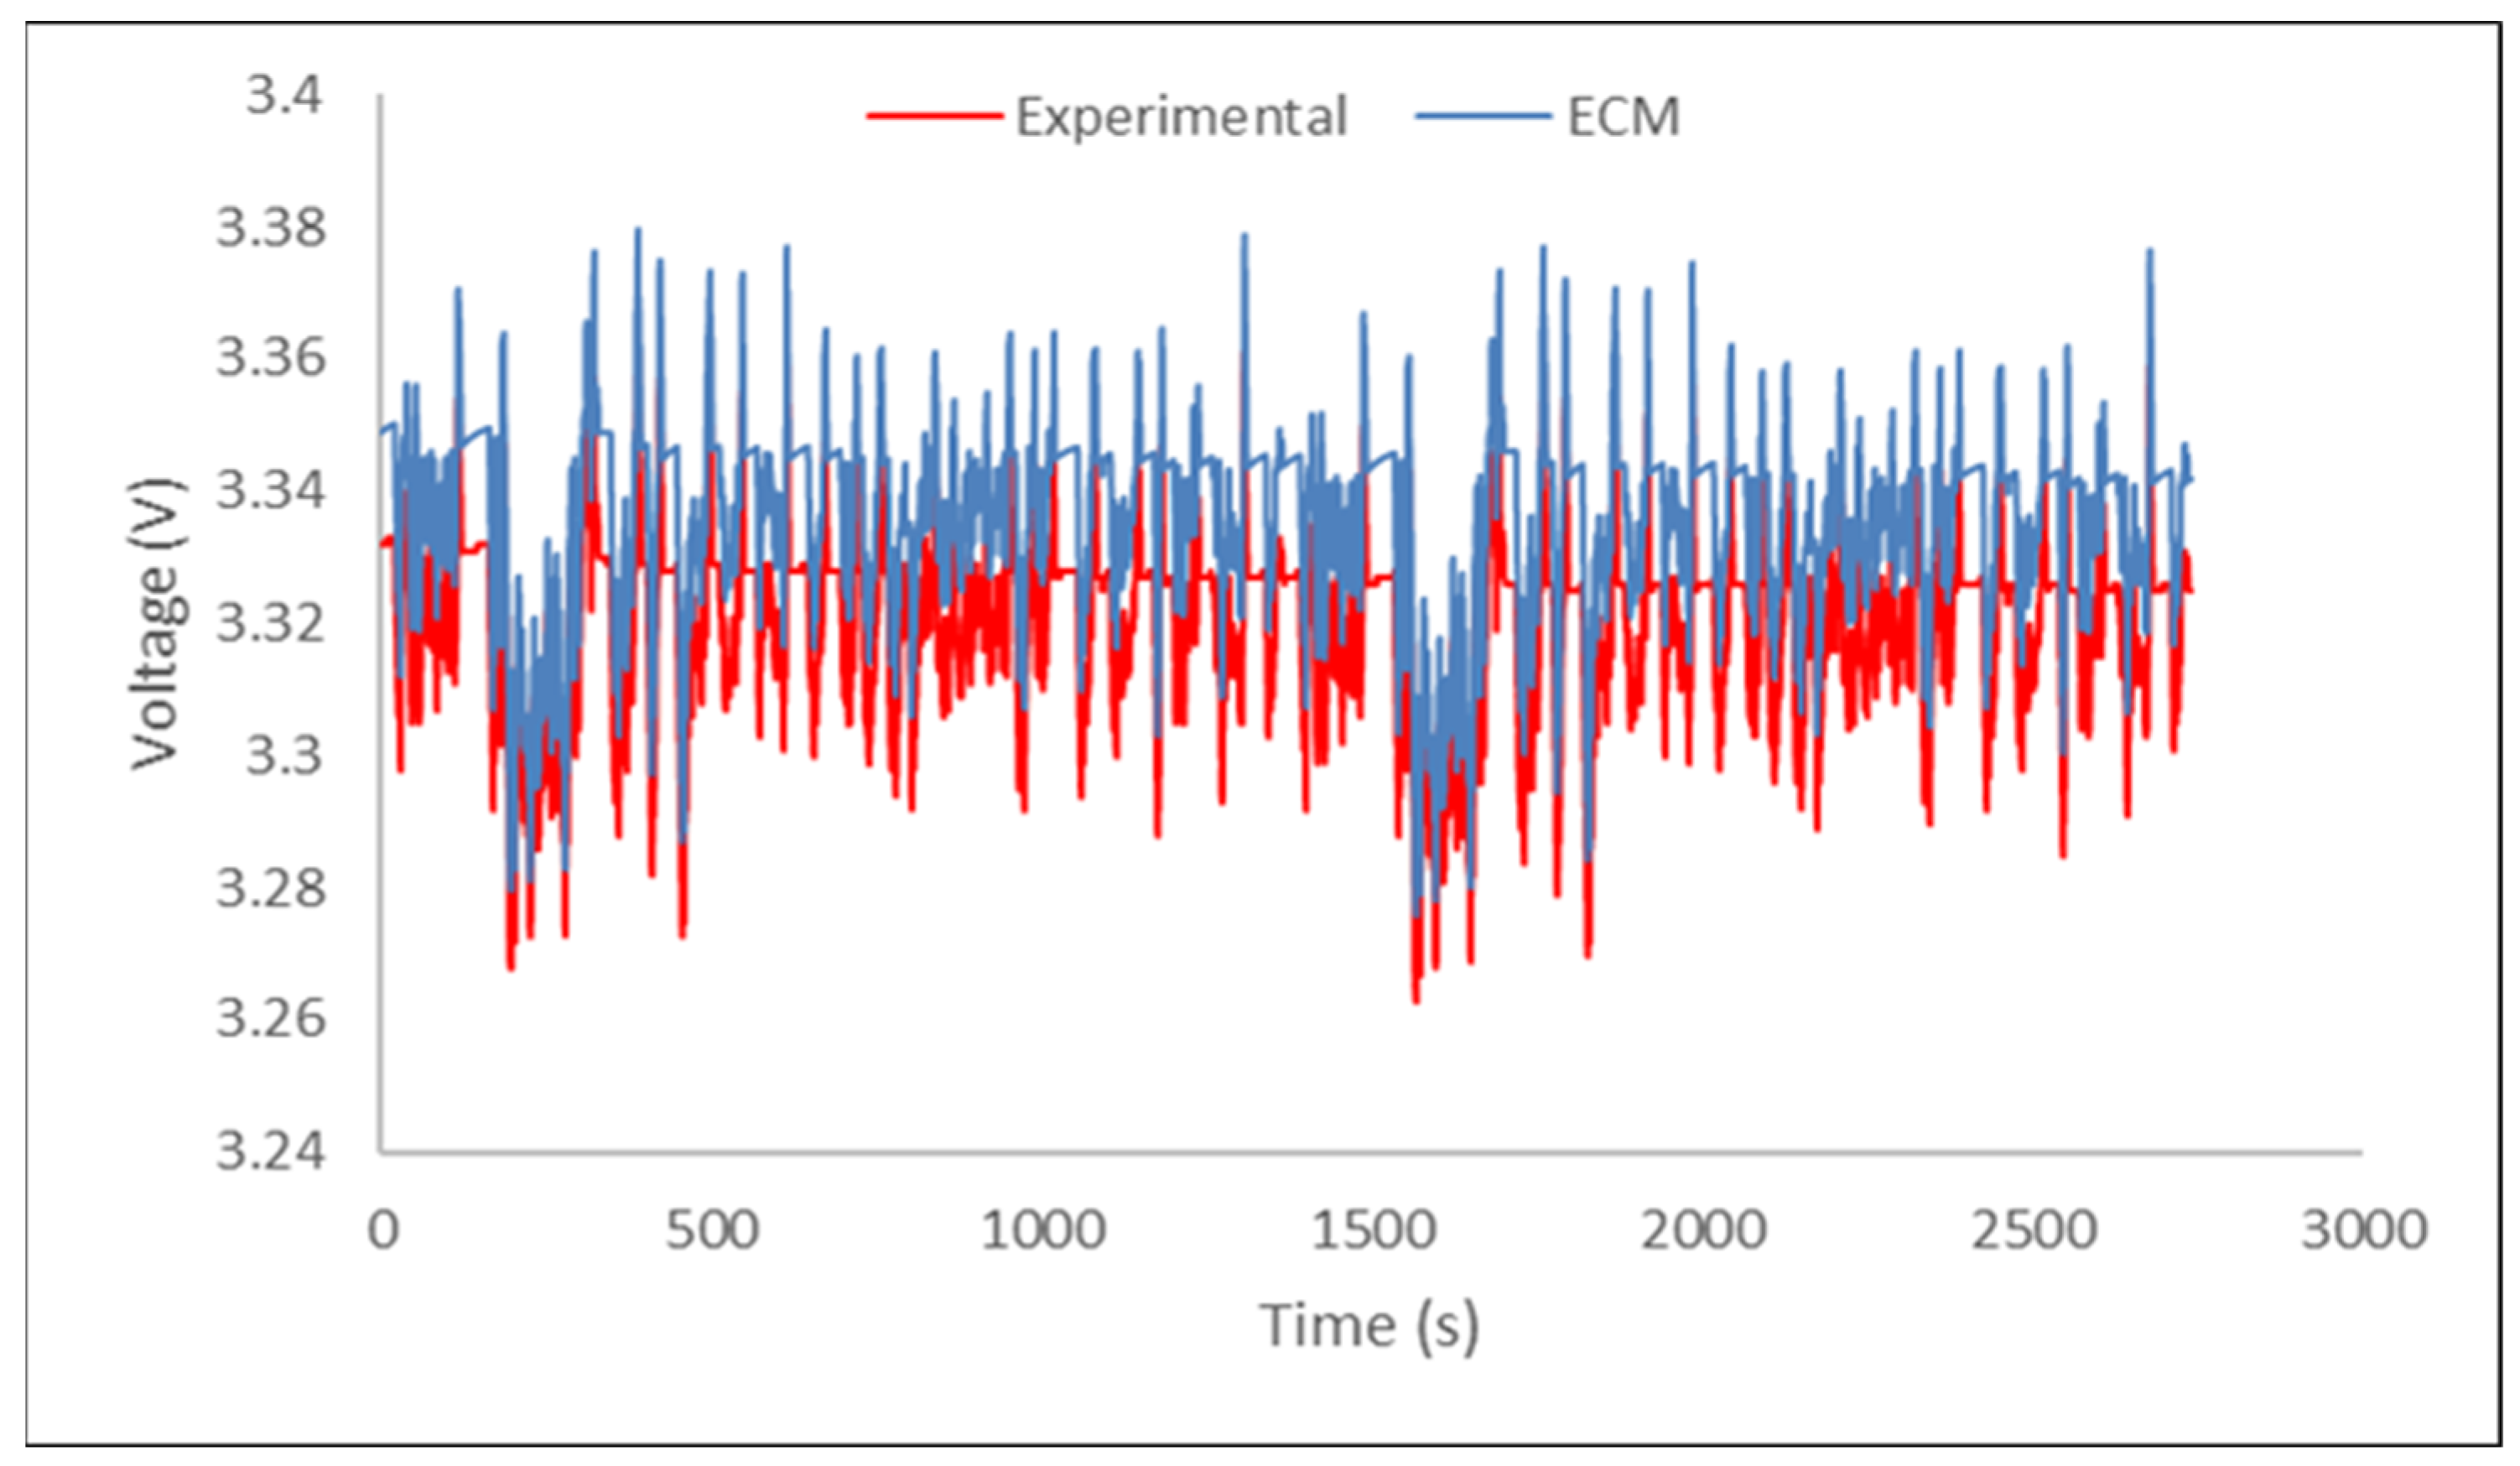
3.1.2. Model Validation and Results
3.2. Cell Degradation Model
3.3. Pack Voltage Model
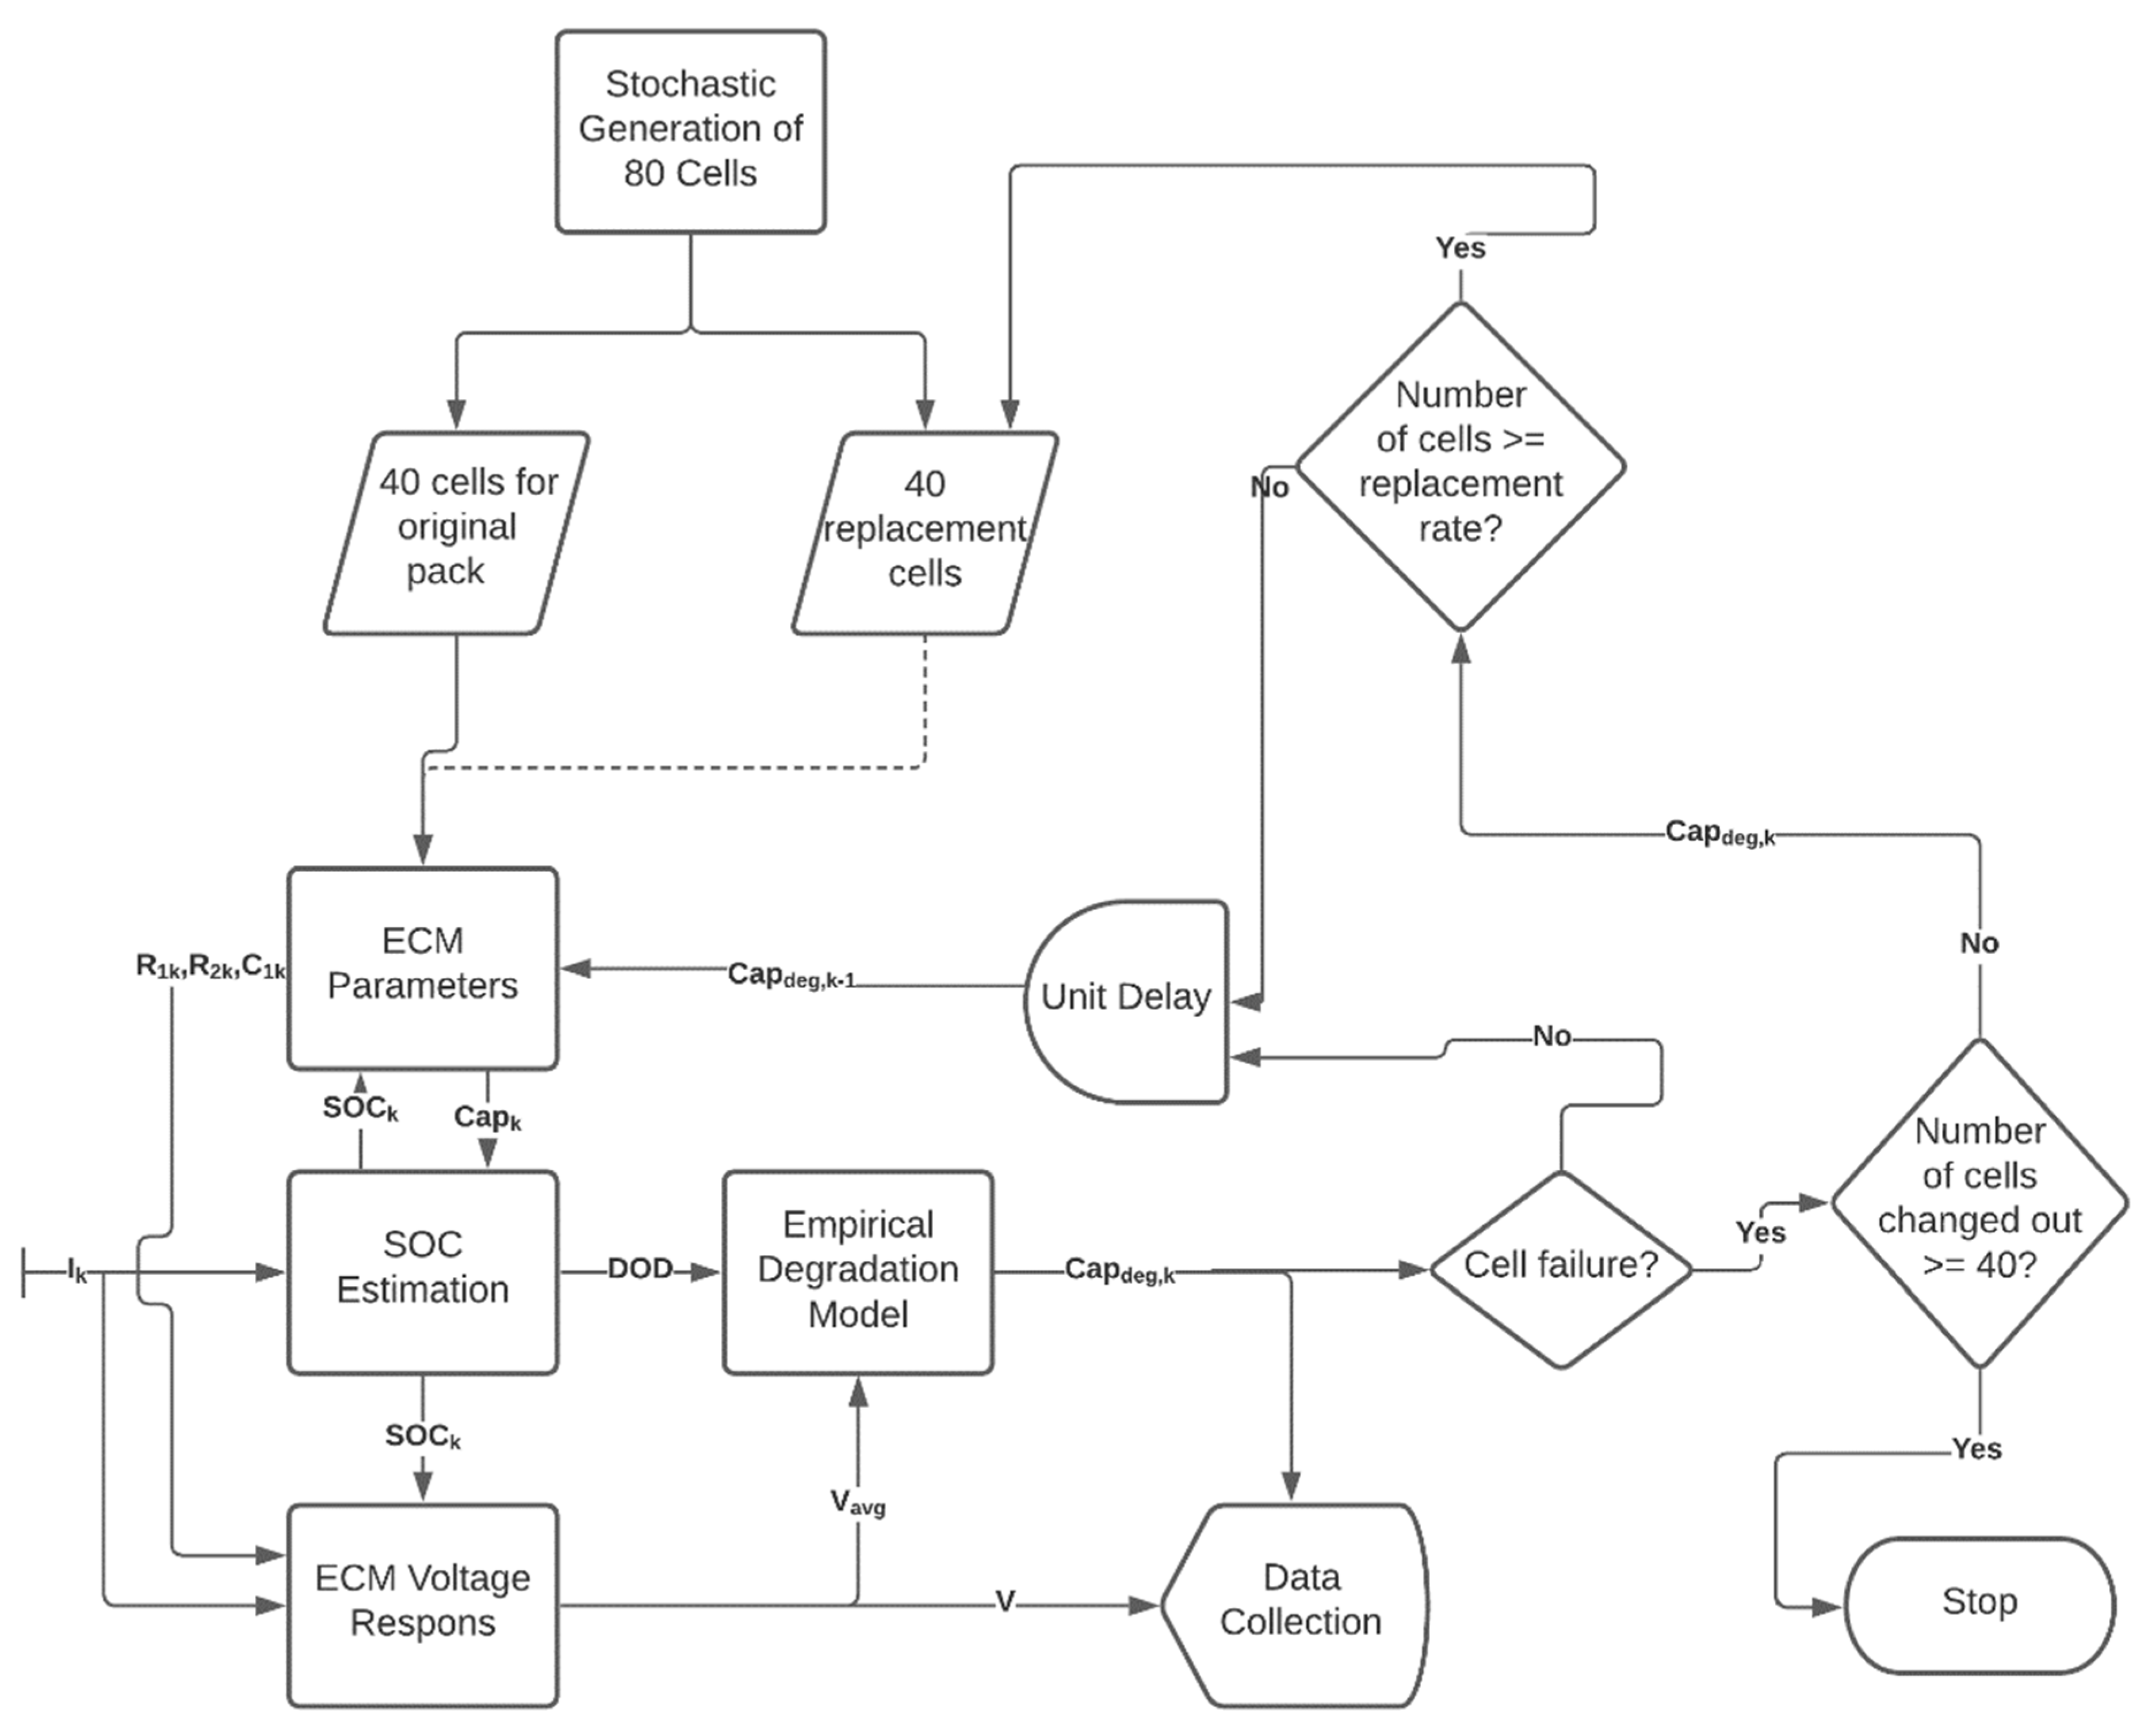
3.4. Cell Replacement Simulation Framework
4. Results and Discussion
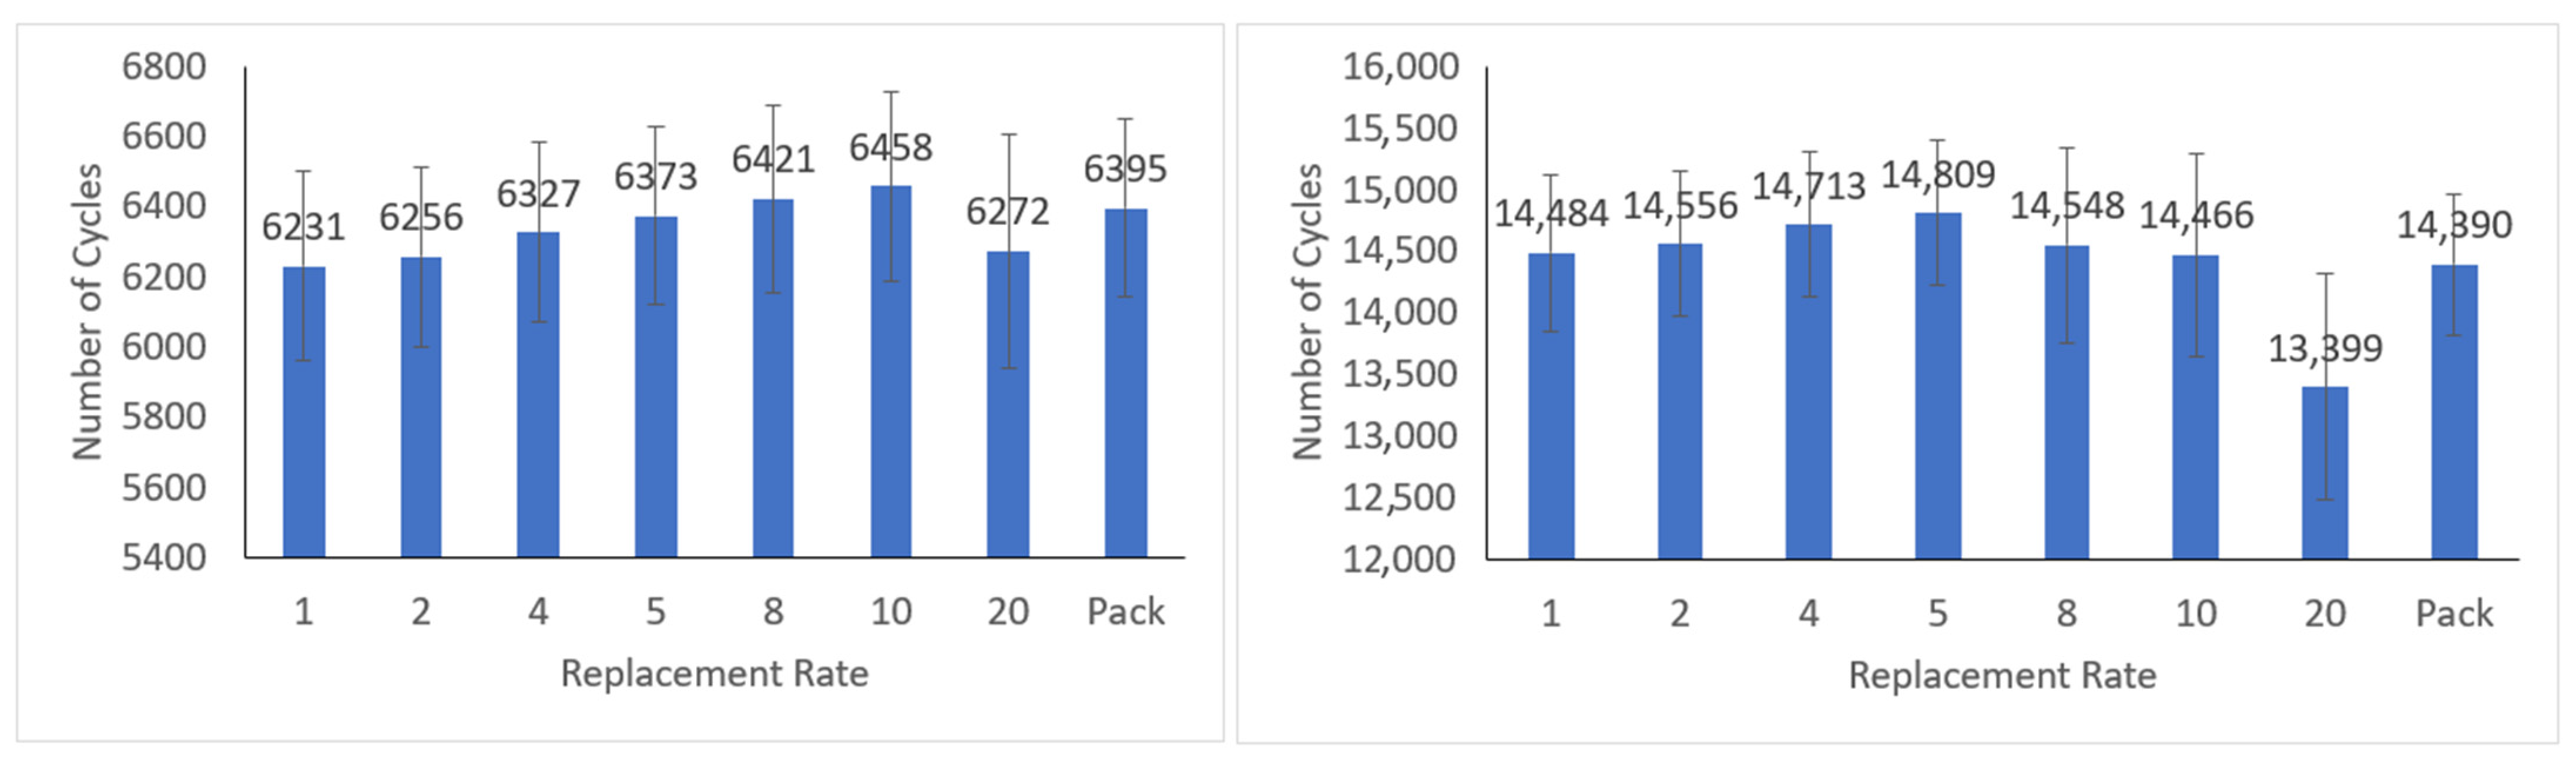
4.1. Cell Replacement Concept Simulation and Results
4.2. Battery Pack Design Requirements for Cell Replacement Concept
4.3. Economic Feasibility of Cell Replacement Concept
5. Conclusions
- The cell voltage model was validated and can be used to generate cells stochastically.
- The cell replacement approach can increase the total number of battery cycles by 63 cycles (or a 1% increase), on average, in the 80% SOH threshold case. This approach can also increase the total number of cycles by 419 cycles (or a 3% increase), on average, in the 70% SOH threshold case.
- Lowering the pack SOH threshold from 80% to 70% would significantly increase the total number of cycles if the battery application could accept the lower battery capacity.
- The cell replacement concept is only feasible if two main design criteria can be satisfied including individual cell monitoring and identification and accessibility to cells that require replacement. However, these design requirements can be difficult to achieve without significant costs.
- If the design requirements can be met, the cell replacement method will be more economically beneficial than the current pack replacement approach as it allows the reuse of many different components of the battery pack.
Author Contributions
Funding
Acknowledgments
Conflicts of Interest
References
- Tran, M.-K.; Bhatti, A.; Vrolyk, R.; Wong, D.; Panchal, S.; Fowler, M.; Fraser, R. A Review of Range Extenders in Battery Electric Vehicles: Current Progress and Future Perspectives. World Electr. Veh. J. 2021, 12, 54. [Google Scholar] [CrossRef]
- Shamsi, H.; Tran, M.-K.; Akbarpour, S.; Maroufmashat, A.; Fowler, M. Macro-Level Optimization of Hydrogen Infrastructure and Supply Chain for Zero-Emission Vehicles on a Canadian Corridor. J. Clean. Prod. 2020, 289, 125163. [Google Scholar] [CrossRef]
- Amrouche, S.O.; Rekioua, D.; Rekioua, T. Overview of Energy Storage in Renewable Energy Systems. Int. J. Hydrogen Energy 2015, 41, 20914–20927. [Google Scholar] [CrossRef]
- Tran, M.; Panchal, S.; Chauhan, V.; Brahmbhatt, N.; Mevawalla, A.; Fraser, R.; Fowler, M. Python-Based Scikit-Learn Machine Learning Models for Thermal and Electrical Performance Prediction of High-Capacity Lithium-Ion Battery. Int. J. Energy Res. 2021, 1–9. [Google Scholar] [CrossRef]
- Xie, J.; Lu, Y.-C. A Retrospective on Lithium-Ion Batteries. Nat. Commun. 2020, 11, 2499. [Google Scholar] [CrossRef]
- Tran, M.-K.; Sherman, S.; Samadani, E.; Vrolyk, R.; Wong, D.; Lowery, M.; Fowler, M. Environmental and Economic Benefits of a Battery Electric Vehicle Powertrain with a Zinc-Air Range Extender in the Transition to Electric Vehicles. Vehicles 2020, 2, 398–412. [Google Scholar] [CrossRef]
- Barcellona, S.; Piegari, L. Effect of Current on Cycle Aging of Lithium Ion Batteries. J. Energy Storage 2020, 29, 101310. [Google Scholar] [CrossRef]
- Tran, M.-K.; Fowler, M. Sensor Fault Detection and Isolation for Degrading Lithium-Ion Batteries in Electric Vehicles Using Parameter Estimation with Recursive Least Squares. Batteries 2019, 6, 1. [Google Scholar] [CrossRef] [Green Version]
- Tran, M.-K.; Fowler, M. A Review of Lithium-Ion Battery Fault Diagnostic Algorithms: Current Progress and Future Challenges. Algorithms 2020, 13, 62. [Google Scholar] [CrossRef] [Green Version]
- Tran, M.-K.; Akinsanya, M.; Panchal, S.; Fraser, R.; Fowler, M. Design of a Hybrid Electric Vehicle Powertrain for Performance Optimization Considering Various Powertrain Components and Configurations. Vehicles 2020, 3, 20–32. [Google Scholar] [CrossRef]
- Dubarry, M.; Vuillaume, N.; Liaw, B.Y. From Single Cell Model to Battery Pack Simulation for Li-Ion Batteries. J. Power Sources 2009, 186, 500–507. [Google Scholar] [CrossRef]
- Zhou, L.; Zheng, Y.; Ouyang, M.; Lu, L. A Study on Parameter Variation Effects on Battery Packs for Electric Vehicles. J. Power Sources 2017, 364, 242–252. [Google Scholar] [CrossRef]
- Rogers, D.J.; Aslett, L.J.; Troffaes, M.C. Modelling of Modular Battery Systems under Cell Capacity Variation and Degradation. Appl. Energy 2020, 283, 116360. [Google Scholar] [CrossRef]
- Winslow, K.M.; Laux, S.J.; Townsend, T.G. A Review on the Growing Concern and Potential Management Strategies of Waste Lithium-Ion Batteries. Resour. Conserv. Recycl. 2018, 129, 263–277. [Google Scholar] [CrossRef]
- Hossain, E.; Murtaugh, D.; Mody, J.; Faruque, H.M.R.; Sunny, S.H.; Mohammad, N. A Comprehensive Review on Second-Life Batteries: Current State, Manufacturing Considerations, Applications, Impacts, Barriers & Potential Solutions, Business Strategies, and Policies. IEEE Access 2019, 7, 73215–73252. [Google Scholar] [CrossRef]
- Peterson, S.B.; Whitacre, J.; Apt, J. The Economics of Using Plug-in Hybrid Electric Vehicle Battery Packs for Grid Storage. J. Power Sources 2010, 195, 2377–2384. [Google Scholar] [CrossRef]
- Foster, M.; Isely, P.; Standridge, C.R.; Hasan, M. Feasibility Assessment of Remanufacturing, Repurposing, and Recycling of End of Vehicle Application Lithium-Ion Batteries. J. Ind. Eng. Manag. 2014, 7, 698–715. [Google Scholar] [CrossRef] [Green Version]
- Kampker, A.; Wessel, S.; Fiedler, F.; Maltoni, F. Battery Pack Remanufacturing Process up to Cell Level with Sorting and Repurposing of Battery Cells. J. Remanufacturing 2020, 11, 1–23. [Google Scholar] [CrossRef]
- Mathew, M.; Kong, Q.; McGrory, J.; Fowler, M. Simulation of Lithium Ion Battery Replacement in a Battery Pack for Application in Electric Vehicles. J. Power Sources 2017, 349, 94–104. [Google Scholar] [CrossRef]
- Nenadic, N.G.; Trabold, T.A.; Thurston, M.G. Cell Replacement Strategies for Lithium Ion Battery Packs. Batteries 2020, 6, 39. [Google Scholar] [CrossRef]
- Lu, Y.; Li, K.; Han, X.; Feng, X.; Chu, Z.; Lu, L.; Huang, P.; Zhang, Z.; Zhang, Y.; Yin, F.; et al. A Method of Cell-to-Cell Variation Evaluation for Battery Packs in Electric Vehicles with Charging Cloud Data. eTransportation 2020, 6, 100077. [Google Scholar] [CrossRef]
- Omariba, Z.B.; Zhang, L.; Sun, D. Review of Battery Cell Balancing Methodologies for Optimizing Battery Pack Performance in Electric Vehicles. IEEE Access 2019, 7, 129335–129352. [Google Scholar] [CrossRef]
- Rehman, M.M.U.; Zhang, F.; Evzelman, M.; Zane, R.; Smith, K.; Maksimovic, D. Advanced Cell-Level Control for Extending Electric Vehicle Battery Pack Lifetime. In Proceedings of the 2016 IEEE Energy Conversion Congress and Exposition (ECCE), Milwaukee, WI, USA, 18–22 September 2016; pp. 1–8. [Google Scholar] [CrossRef]
- Zheng, Y.; Ouyang, M.; Lu, L.; Li, J. Understanding Aging Mechanisms in Lithium-Ion Battery Packs: From Cell Capacity Loss to Pack Capacity Evolution. J. Power Sources 2015, 278, 287–295. [Google Scholar] [CrossRef]
- Belt, J. Battery Test Manual for Plug-In Hybrid Electric Vehicles. Tech. Rep. 2010. [Google Scholar] [CrossRef] [Green Version]
- Tran, M.-K.; Mevawala, A.; Panchal, S.; Raahemifar, K.; Fowler, M.; Fraser, R. Effect of Integrating the Hysteresis Component to the Equivalent Circuit Model of Lithium-Ion Battery for Dynamic and Non-Dynamic Applications. J. Energy Storage 2020, 32, 101785. [Google Scholar] [CrossRef]
- Tran, M.-K.; DaCosta, A.; Mevawalla, A.; Panchal, S.; Fowler, M. Comparative Study of Equivalent Circuit Models Performance in Four Common Lithium-Ion Batteries: LFP, NMC, LMO, NCA. Batteries 2021, 7, 51. [Google Scholar] [CrossRef]
- Tran, M.-K.; Mathew, M.; Janhunen, S.; Panchal, S.; Raahemifar, K.; Fraser, R.; Fowler, M. A Comprehensive Equivalent Circuit Model for Lithium-Ion Batteries, Incorporating the Effects of State of Health, State of Charge, and Temperature on Model Parameters. J. Energy Storage 2021, 43, 103252. [Google Scholar] [CrossRef]
- Hu, X.; Li, S.; Peng, H. A comparative study of equivalent circuit models for Li-ion batteries. J. Power Sources 2012, 198, 359–367. [Google Scholar] [CrossRef]
- Deng, Z.; Hu, X.; Lin, X.; Xu, L.; Che, Y.; Hu, L. General Discharge Voltage Information Enabled Health Evaluation for Lithium-Ion Batteries. IEEE/ASME Trans. Mechatron. 2020, 26, 1295–1306. [Google Scholar] [CrossRef]
- Hu, X.; Yuan, H.; Zou, C.; Li, Z.; Zhang, L. Co-Estimation of State of Charge and State of Health for Lithium-Ion Batteries Based on Fractional-Order Calculus. IEEE Trans. Veh. Technol. 2018, 67, 10319–10329. [Google Scholar] [CrossRef]
- Schmalstieg, J.; Käbitz, S.; Ecker, M.; Sauer, D.U. A Holistic Aging Model for Li(NiMnCo)O2 Based 18,650 Lithium-Ion batteries. J. Power Sources 2014, 257, 325–334. [Google Scholar] [CrossRef]
- Ng, K.S.; Moo, C.-S.; Chen, Y.-P.; Hsieh, Y.-C. Enhanced Coulomb Counting Method for Estimating State-of-Charge and State-of-Health of Lithium-Ion Batteries. Appl. Energy 2009, 86, 1506–1511. [Google Scholar] [CrossRef]
- Gabbar, H.; Othman, A.; Abdussami, M. Review of Battery Management Systems (BMS) Development and Industrial Standards. Technologies 2021, 9, 28. [Google Scholar] [CrossRef]
- Beard, K.W.; Reddy, T.B. Linden’s Handbook of Batteries, 5th ed.; McGraw-Hill: New York, NY, USA, 2019; ISBN 978-1-260-11592-5. [Google Scholar]
- Lee, S.S.; Kim, T.H.; Hu, S.J.; Cai, W.W.; Abell, J.A. Joining Technologies for Automotive Lithium-Ion Battery Manufacturing: A Review. In Proceedings of the ASME 2010 International Manufacturing Science and Engineering Conference, Erie, PA, USA, 12–15 October 2010; Volume 1, pp. 541–549. [Google Scholar] [CrossRef]
- Wentker, M.; Greenwood, M.; Leker, J.; Wentker, M.; Greenwood, M.; Leker, J. A Bottom-Up Approach to Lithium-Ion Battery Cost Modeling with a Focus on Cathode Active Materials. Energies 2019, 12, 504. [Google Scholar] [CrossRef] [Green Version]


| Specifications | Value |
|---|---|
| Nominal Capacity | 20.0 Ah |
| Nominal Voltage | 3.3 V |
| Voltage Limits | 2.0–3.65 V |
| Cell Weight | 496 g |
| Dimensions | 7.25 mm × 160 mm × 227 mm |
| Operating Temperature | −30–55 °C |
| Parameter | Mean | Standard Deviation | Units |
|---|---|---|---|
| Capacity | 19.1750 | 0.4787 | |
| R0 | 0.0023 | 0.00012 | |
| R1 | 0.0019 | 0.00023 | |
| C1 | 10921 | 1188.1 |
| Parameter | Capacity Fade | Resistance Rise | Units |
|---|---|---|---|
| a | 0.00142 | 2.780 × 10⁻⁵ | |
| b | 3.274 | 3.199 | |
| c | 0.00119 | −2.237 × 10⁻⁵ | |
| d | −9.219 × 10⁻⁴ | 7.361 × 10⁻⁵ |
| Pack Replacement | Cell Replacement | |
|---|---|---|
| Cell cost (USD/cell) | $28.00 | $28.00 |
| Total number of cells in one pack | 40 | 40 |
| Cells-to-pack cost proportion | 48% | NA |
| Cell cost for original pack (40 cells) | $1120.00 | $1120.00 |
| Initial pack manufacturing cost | $1213.33 | $1820.00 |
| Total cost of original pack | $2333.33 | $2940.00 |
| Total cost of replacement | $2333.33 | $1120.00 |
| Total labor cost of replacement (for 80% SOH threshold) | $100.00 | $400.00 |
| Total labor cost of replacement (for 70% SOH threshold) | $100.00 | $800.00 |
| Total cost (for 80% SOH threshold) | $4766.67 | $4460.00 |
| Total cost (for 70% SOH threshold) | $4766.67 | $4860.00 |
Publisher’s Note: MDPI stays neutral with regard to jurisdictional claims in published maps and institutional affiliations. |
© 2021 by the authors. Licensee MDPI, Basel, Switzerland. This article is an open access article distributed under the terms and conditions of the Creative Commons Attribution (CC BY) license (https://creativecommons.org/licenses/by/4.0/).
Share and Cite
Tran, M.-K.; Cunanan, C.; Panchal, S.; Fraser, R.; Fowler, M. Investigation of Individual Cells Replacement Concept in Lithium-Ion Battery Packs with Analysis on Economic Feasibility and Pack Design Requirements. Processes 2021, 9, 2263. https://doi.org/10.3390/pr9122263
Tran M-K, Cunanan C, Panchal S, Fraser R, Fowler M. Investigation of Individual Cells Replacement Concept in Lithium-Ion Battery Packs with Analysis on Economic Feasibility and Pack Design Requirements. Processes. 2021; 9(12):2263. https://doi.org/10.3390/pr9122263
Chicago/Turabian StyleTran, Manh-Kien, Carlo Cunanan, Satyam Panchal, Roydon Fraser, and Michael Fowler. 2021. "Investigation of Individual Cells Replacement Concept in Lithium-Ion Battery Packs with Analysis on Economic Feasibility and Pack Design Requirements" Processes 9, no. 12: 2263. https://doi.org/10.3390/pr9122263