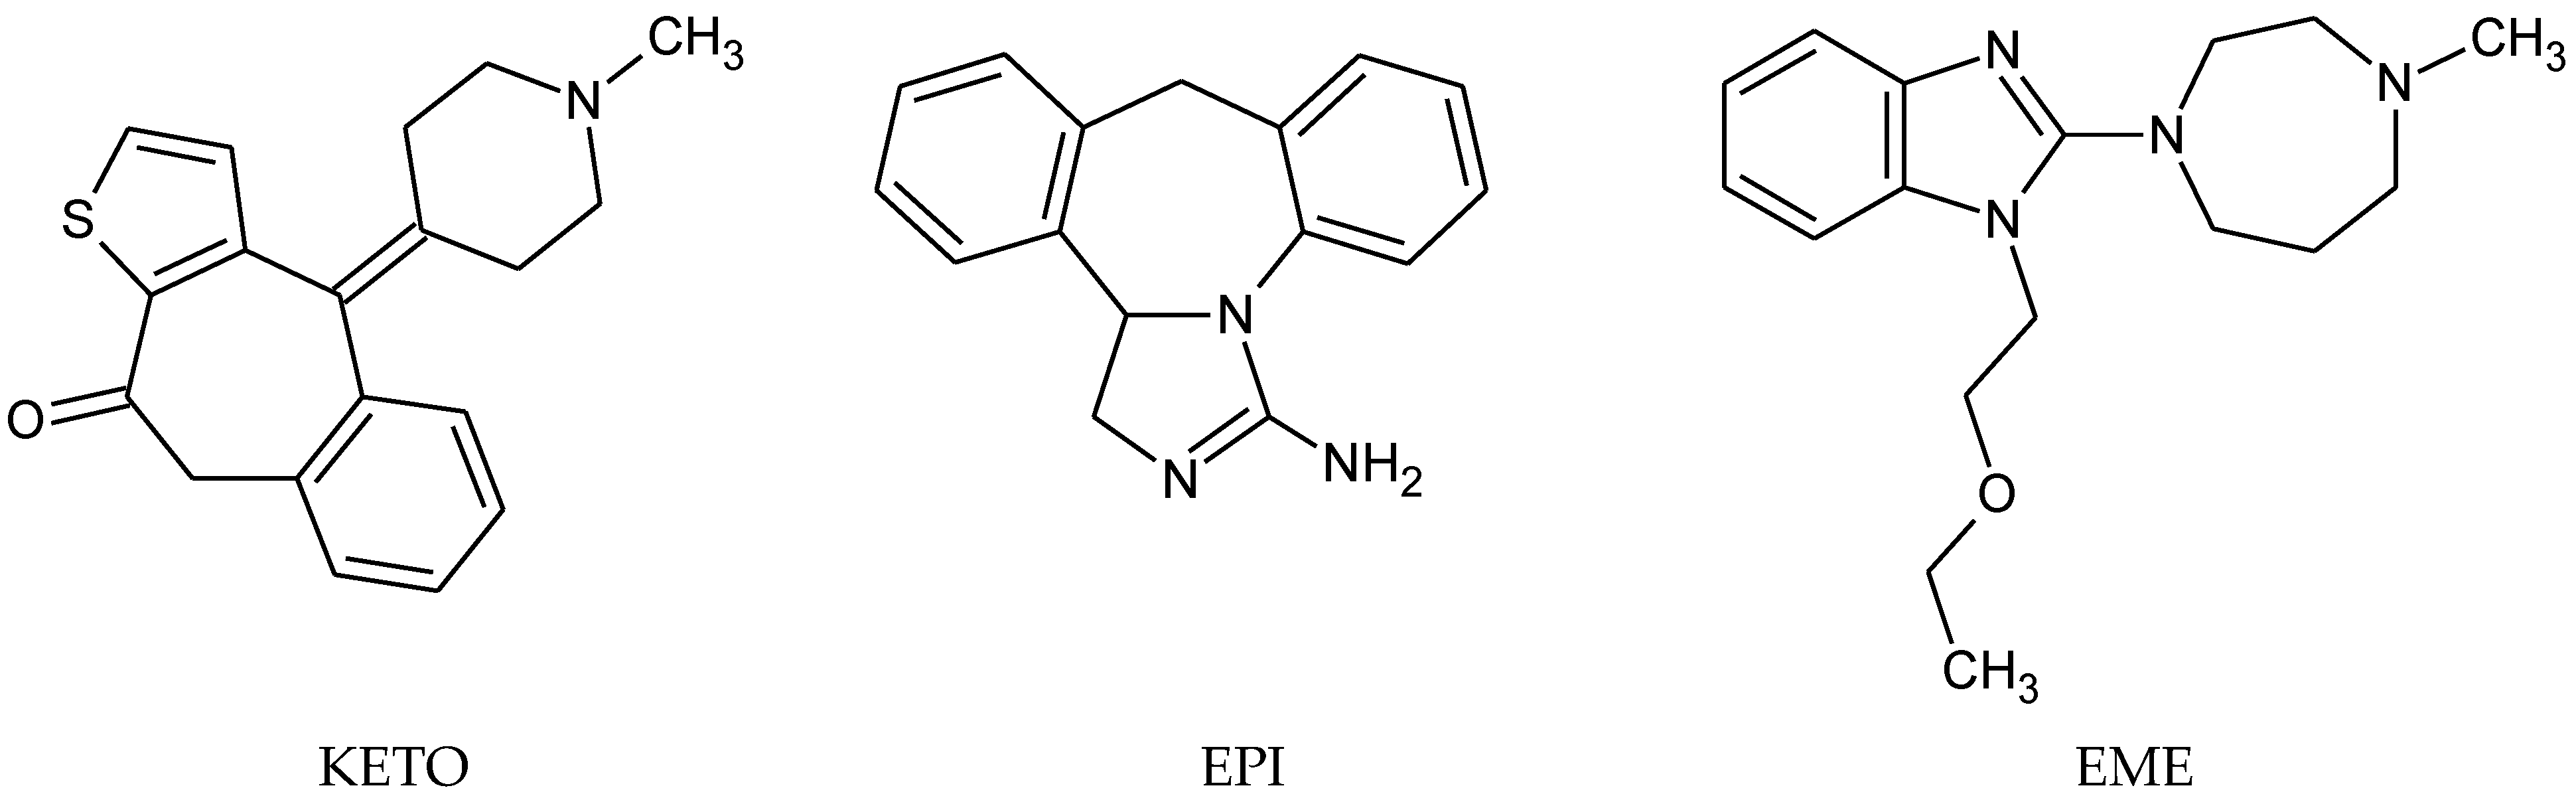
LC-UV and UPLC-MS/MS Methods for Analytical Study on Degradation of Three Antihistaminic Drugs, Ketotifen, Epinastine and Emedastine: Percentage Degradation, Degradation Kinetics and Degradation Pathways at Different pH


Abstract
:1. Introduction
2. Materials and Methods
2.1. Apparatus
2.2. Materials
2.3. LC-UV Methods
2.3.1. Chromatographic Conditions
2.3.2. Selectivity
2.3.3. Stock Solutions
2.3.4. System Suitability
2.3.5. Calibration of the Methods
2.3.6. Precision
2.3.7. Accuracy
2.4. Degradation at Different pH and High Temperature
2.4.1. Kinetics of Degradation
2.4.2. Degradation Pathways Using UPLC-MS/MS Method
3. Results and Discussion
4. Conclusions
Author Contributions
Funding
Institutional Review Board Statement
Informed Consent Statement
Data Availability Statement
Conflicts of Interest
References
- Jamrógiewicz, M. Consequences of new approach to chemical stability tests to active pharmaceutical ingredients. Front. Pharmacol. 2016, 7, 17. [Google Scholar] [CrossRef] [PubMed] [Green Version]
- Blessy, M.R.D.P.; Patel, R.D.; Prajapati, P.N.; Agrawal, Y.K. Development of forced degradation and stability indicating studies of drugs—A review. J. Pharm. Anal. 2014, 4, 159–165. [Google Scholar] [CrossRef] [PubMed] [Green Version]
- Fein, M.N.; Fischer, D.A.; O’Keefe, A.W.; Sussman, G.L. CSAI position statement: Newer generation H1-antihistamines are safer than first generation H1-antihistamines and should be the first-line antihistamines for the treatment of allergic rhinitis and urticaria. Allergy Asthma Clin. Immunol. 2019, 15, 1–6. [Google Scholar] [CrossRef] [PubMed] [Green Version]
- Nelson, W.L. Antihistamines and related anti-allergic and anti-ulcer agents. In Foye´s Principles of Medicinal Chemistry, 6th ed.; Lemke, T.L., Williams, D.A., Roche, V.F., Eds.; Lippincott Williams and Wilkins: Baltimore, MA, USA, 2006; pp. 112–120. [Google Scholar]
- Ben-Eli, H.; Solomon, A. Topical antihistamines, mast cell stabilizers, and dual-action agents in ocular allergy: Current trends. Curr. Opin. Allergy Clin. Immunol. 2018, 18, 411–416. [Google Scholar] [CrossRef] [PubMed]
- Kabra, P.V.; Nargund, L.V.G.; Murthy, M.S. Development and validation of a stability-indicating LC-UV method for simultaneous determination of ketotifen and cetirizine in pharmaceutical dosage forms. Trop. J. Pharm. 2014, 13, 1141–1147. [Google Scholar] [CrossRef] [Green Version]
- Elsayed, M.A.A. Development and validation of a rapid HPLC method for the determination of ketotifen in pharmaceuticals. Drug Dev. Ind. Pharm. 2006, 32, 457–461. [Google Scholar] [CrossRef] [PubMed]
- Alali, F.; Tashtoush, B.M. Determination of ketotifen in human plasma by LC-MS. J. Pharm. Biomed. Anal. 2003, 34, 87–94. [Google Scholar] [CrossRef] [PubMed]
- Chen, X.; Zhong, D.; Liu, D.; Wang, Y. Determination of ketotifen and its conjugated metabolite in human plasma by liquid chromatography/tandem mass spectrometry: Application to a pharmacokinetic study. Rapid Commun. Mass Spectrom. 2003, 17, 2459–2463. [Google Scholar] [CrossRef] [PubMed]
- Malakar, A.; Bokshi, B. Development and validation of stability indicating RP-HPLC method for the determination of epinastine hydrochloride in pharmaceutical dosage form. Int. Curr. Pharm. J. 2012, 1, 50–55. [Google Scholar] [CrossRef] [Green Version]
- Ahhirao, V.; Pawar, R. Stability-indicating LC method for the determination of epinastine in bulk drug and in pharmaceutical dosage form. Res. J. Recent Sci. 2012, 1, 281–288. [Google Scholar]
- Baburao Ubale, M. A validated stability-indicating HPLC assay method for epinastine HCl in bulk drug. J. Curr. Chem. Pharmaceut. Sci. 2012, 2, 107–112. [Google Scholar]
- Jeong, S.-H.; Jang, J.-H.; Cho, H.-J.; Lee, Y.-B. Simultaneous measurement of epinastine and its metabolite, 9,13b-dehydroepinastine, in human plasma by a newly developed ultra-performance liquid chromatography-tandem mass spectrometry and its application to pharmacokinetic studies. Biomed. Chromatogr. 2020, 34, e4848. [Google Scholar] [CrossRef] [PubMed]
- Jeong, S.-H.; Jang, J.-H.; Cho, H.-Y.; Lee, Y.-B. Pharmacokinetic comparison of epinastine using developed human plasma assays. Molecules 2020, 25, 209. [Google Scholar] [CrossRef] [PubMed] [Green Version]
- Salama, N.N.; Abdel-Razeq, S.A.; Abdel-Atty, S.; El-Kosy, N. Development and validation of densitometry TLC stability indicating method for quantitative determination of azelastine hydrochloride and emedastine hydrochloride in their drug products. Br. J. Pharm. Res. 2014, 4, 79–92. [Google Scholar] [CrossRef]
- Tian, Y.; Zhang, Z.; Liang, J.; Li, W.; Chen, Y. High-performance liquid chromatography -electrospray ionization-mass spectrometric determination of emedastine difumarate in human plasma and its pharmacokinetics. J. Chrom. Sci. 2007, 45, 158–164. [Google Scholar] [CrossRef] [PubMed] [Green Version]
- Takaya, R.; Ishida, M.; Sakamoto, F. Simultaneous determination method of emedastine and its metabolites in human plasma using high-performance liquid chromatography-tandem mass spectrometry. J. Mass Spectrom. Soc. Jpn. 2000, 48, 155–159. [Google Scholar] [CrossRef]
- Gumieniczek, A.; Berecka-Rycerz, A.; Hubicka, U.; Żmudzki, P.; Lejwoda, K.; Kozyra, P. Photodegradation of the H1 antihistaminic topical drugs emedastine, epinastine, and ketotifen and ROS tests for estimations of their potent phototoxicity. Pharmaceutics 2020, 12, 560. [Google Scholar] [CrossRef] [PubMed]
- Garcia-Valldecabres, M.; López-Alemany, A.; Refoj, M.F. pH stability of ophthalmic solutions. Optometry 2004, 75, 161–168. [Google Scholar] [CrossRef]
- Baranowski, P.; Karolewicz, B.; Gajda, M.; Pluta, J. Ophtalmic drug dosage forms: Characterization and research methods. Sci. World J. 2014, 2014, 861904. [Google Scholar] [CrossRef] [PubMed] [Green Version]
- ICH. The International Council for Harmonisation of Technical Requirements for Pharmaceuticals for Human Use (ICH). In Validation of Analytical Procedures: Text and Methodology Q2(R1); ICH: Geneva, Switzerland, 2005. [Google Scholar]
- FDA. Guidance for Industry. In Validation of Analytical Procedures: Definitions and Terminology Final Guidance; Center for Drug Evaluation and Research: Rockville, MD, USA, 2010. [Google Scholar]
- Available online: https://go.drugbank.com/ (accessed on 15 September 2020).
- Yoshioka, S.; Stella, V.J. pH and pH-rate profiles. In Stability of Drugs and Dosage Forms; Kluwer Academic Publications: New York, NY, USA, 2002; pp. 80–97. [Google Scholar]


| Parameter | Values | ||
|---|---|---|---|
| KETO | EPI | EME | |
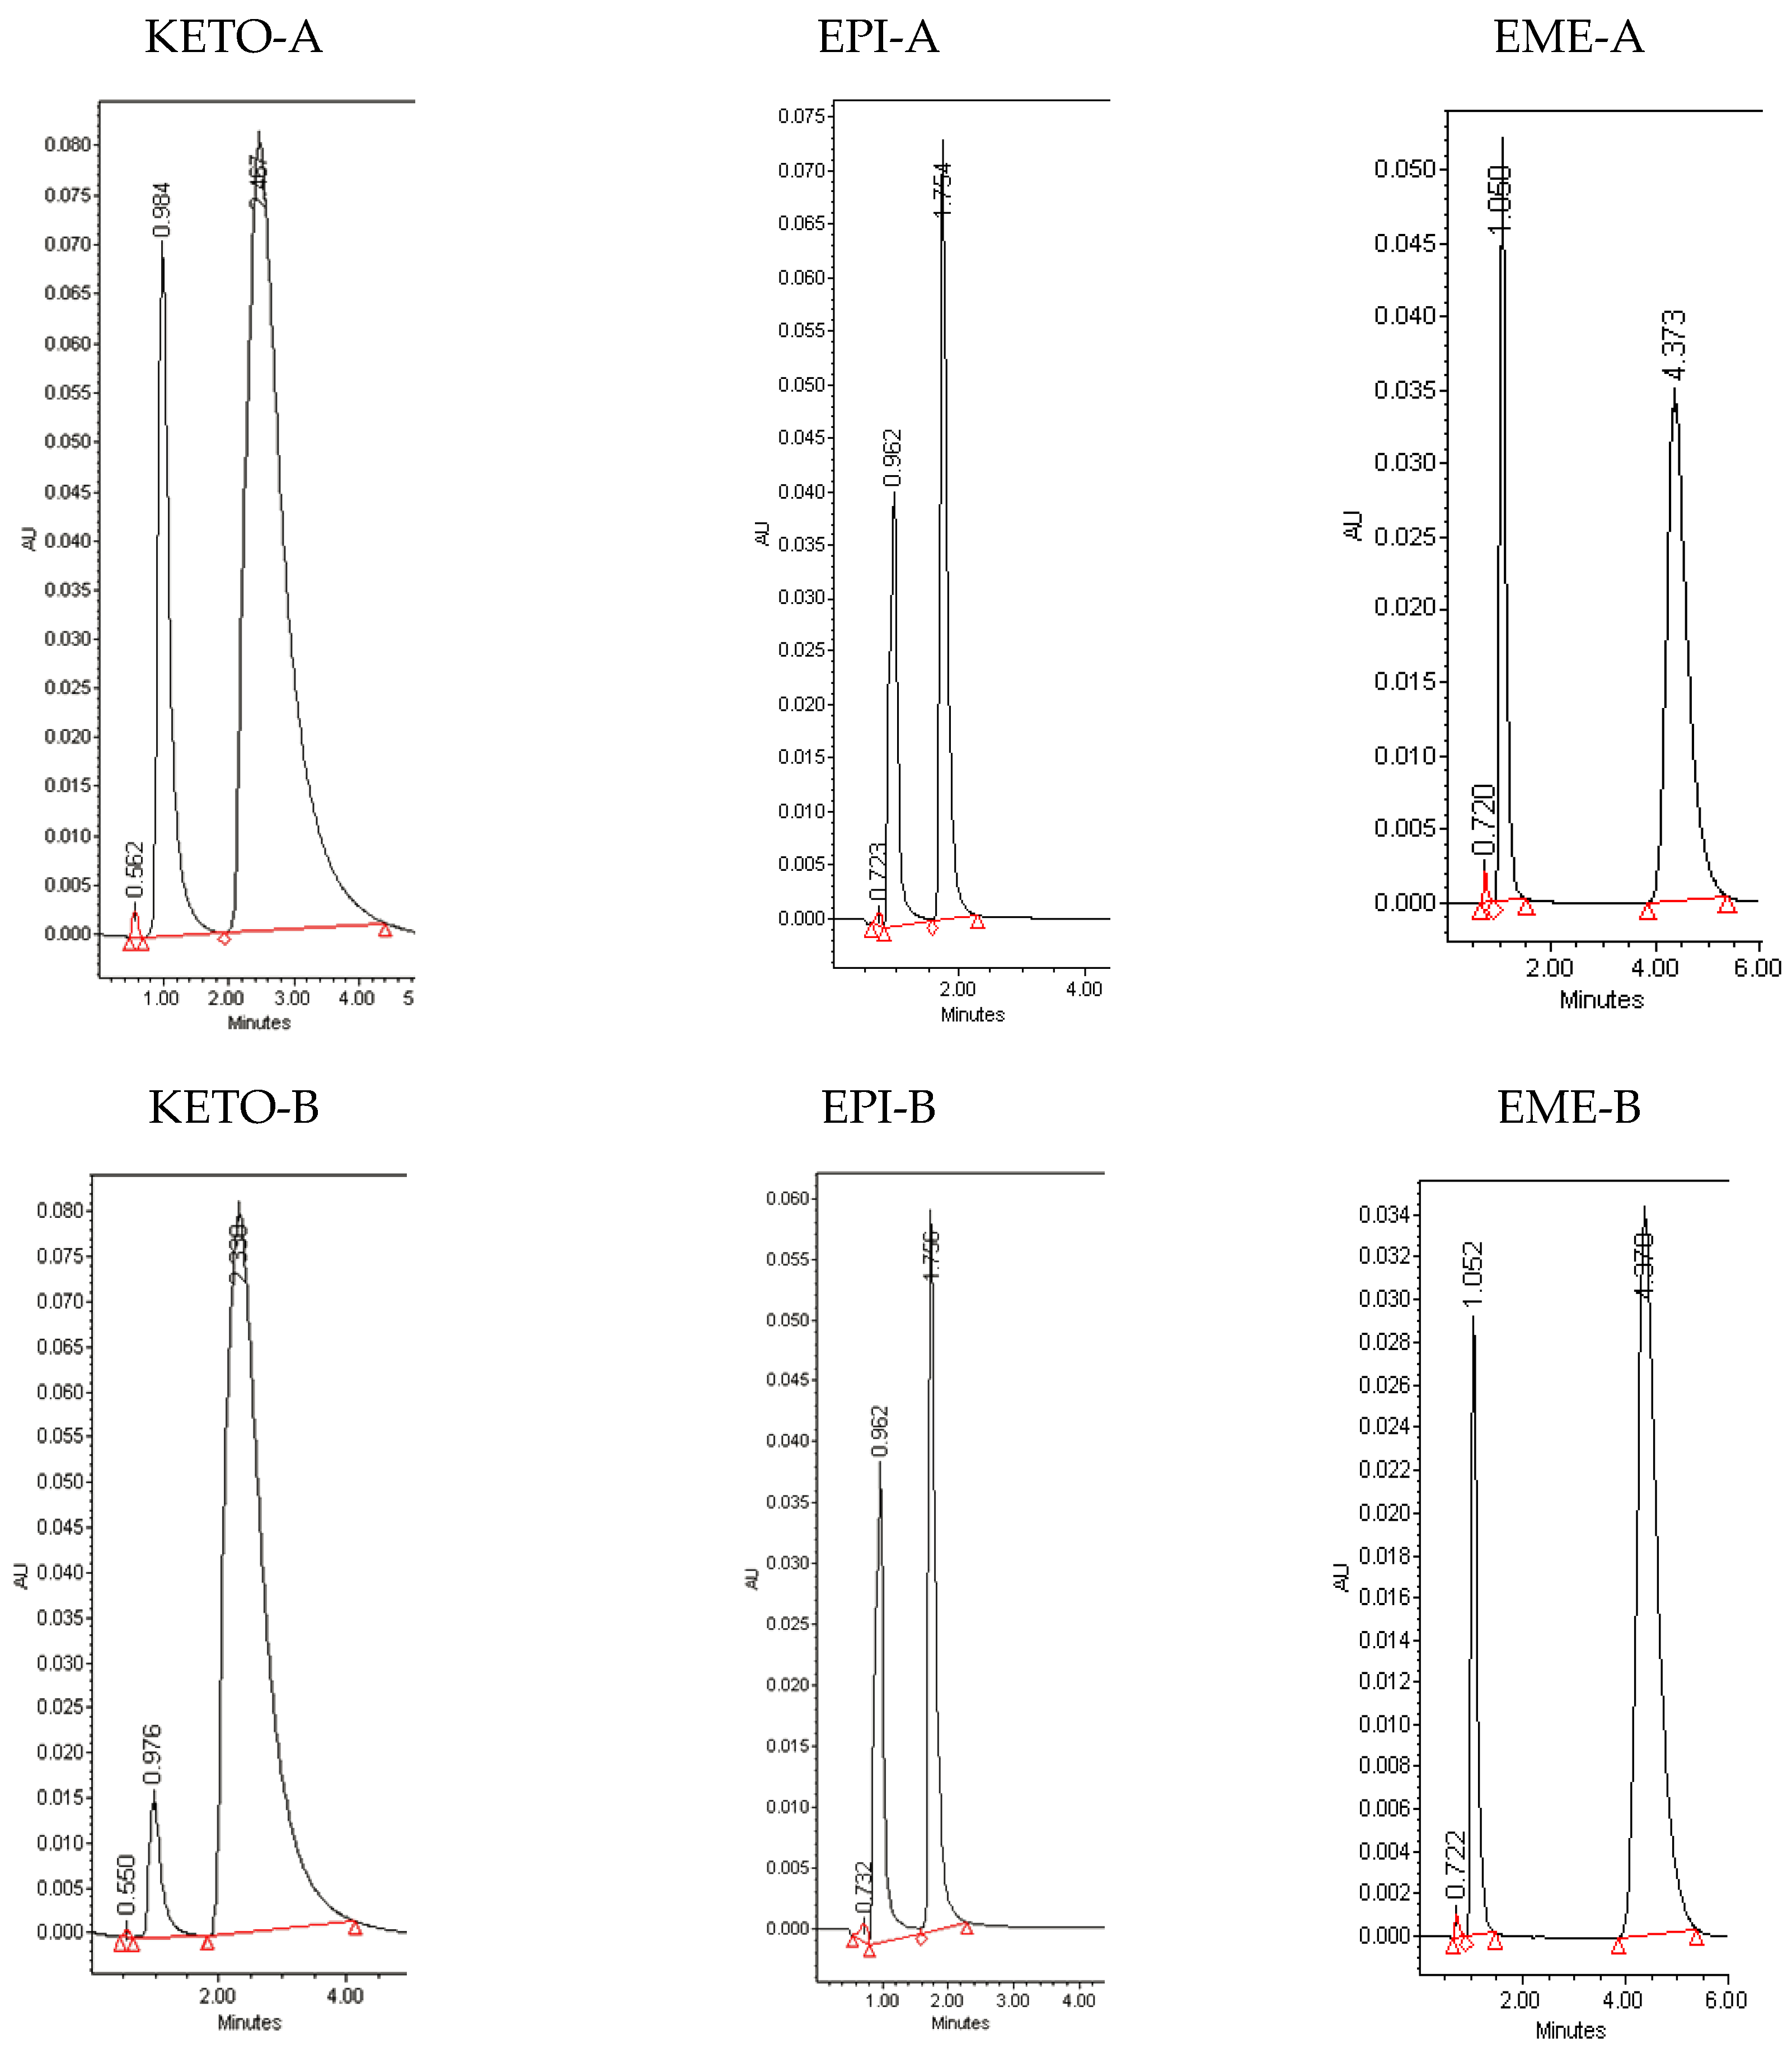
| Retention time (min) | 0.98 | 0.96 | 1.05 |
| Internal standard (i.s.) | 2.47 | 1.87 | 4.07 |
| Resolution (between the drug and i.s.) | 2.11 | 1.39 | 2.86 |
| RSD for system suitability (%) | 0.97 | 0.84 | 0.65 |
| Tailing factor for the drugs | 1.88 | 1.35 | 1.13 |
| Tailing factor for i.s. | 1.94 | 1.21 | 1.08 |
| Linearity range (µg/mL) | 10–100 | 10–100 | 10–100 |
| Slope | 0.0061 | 0.03020 | 0.01993 |
| SD of the slope | 0.00002 | 0.00028 | 0.00013 |
| Intercept | 0.00181 | 0.04752 | 0.06142 |
| SD of the intercept | 0.00012 | 0.00475 | 0.00089 |
| r2 | 0.9997 | 0.9962 | 0.9996 |
| SD of the r2 | 0.00018 | 0.00042 | 0.00031 |
| LOD (µg/mL) | 0.06 | 0.47 | 0.15 |
| LOQ (µg/mL) | 0.21 | 1.57 | 0.45 |
| Accuracy (% Recovery) | 100.49 | 100.44 | 100.93 |
| SD of Recovery | 1.74 | 1.61 | 1.36 |
| One-day precision (% RSD) | 0.24 | 1.02 | 1.86 |
| Inter-day precision (% RSD) | 0.21 | 1.03 | 1.98 |
| 0.1 M HCl | Buffer 3.0 | Buffer 7.0 | Buffer 10.0 | 0.1 M NaOH | |
|---|---|---|---|---|---|
| KETO | |||||
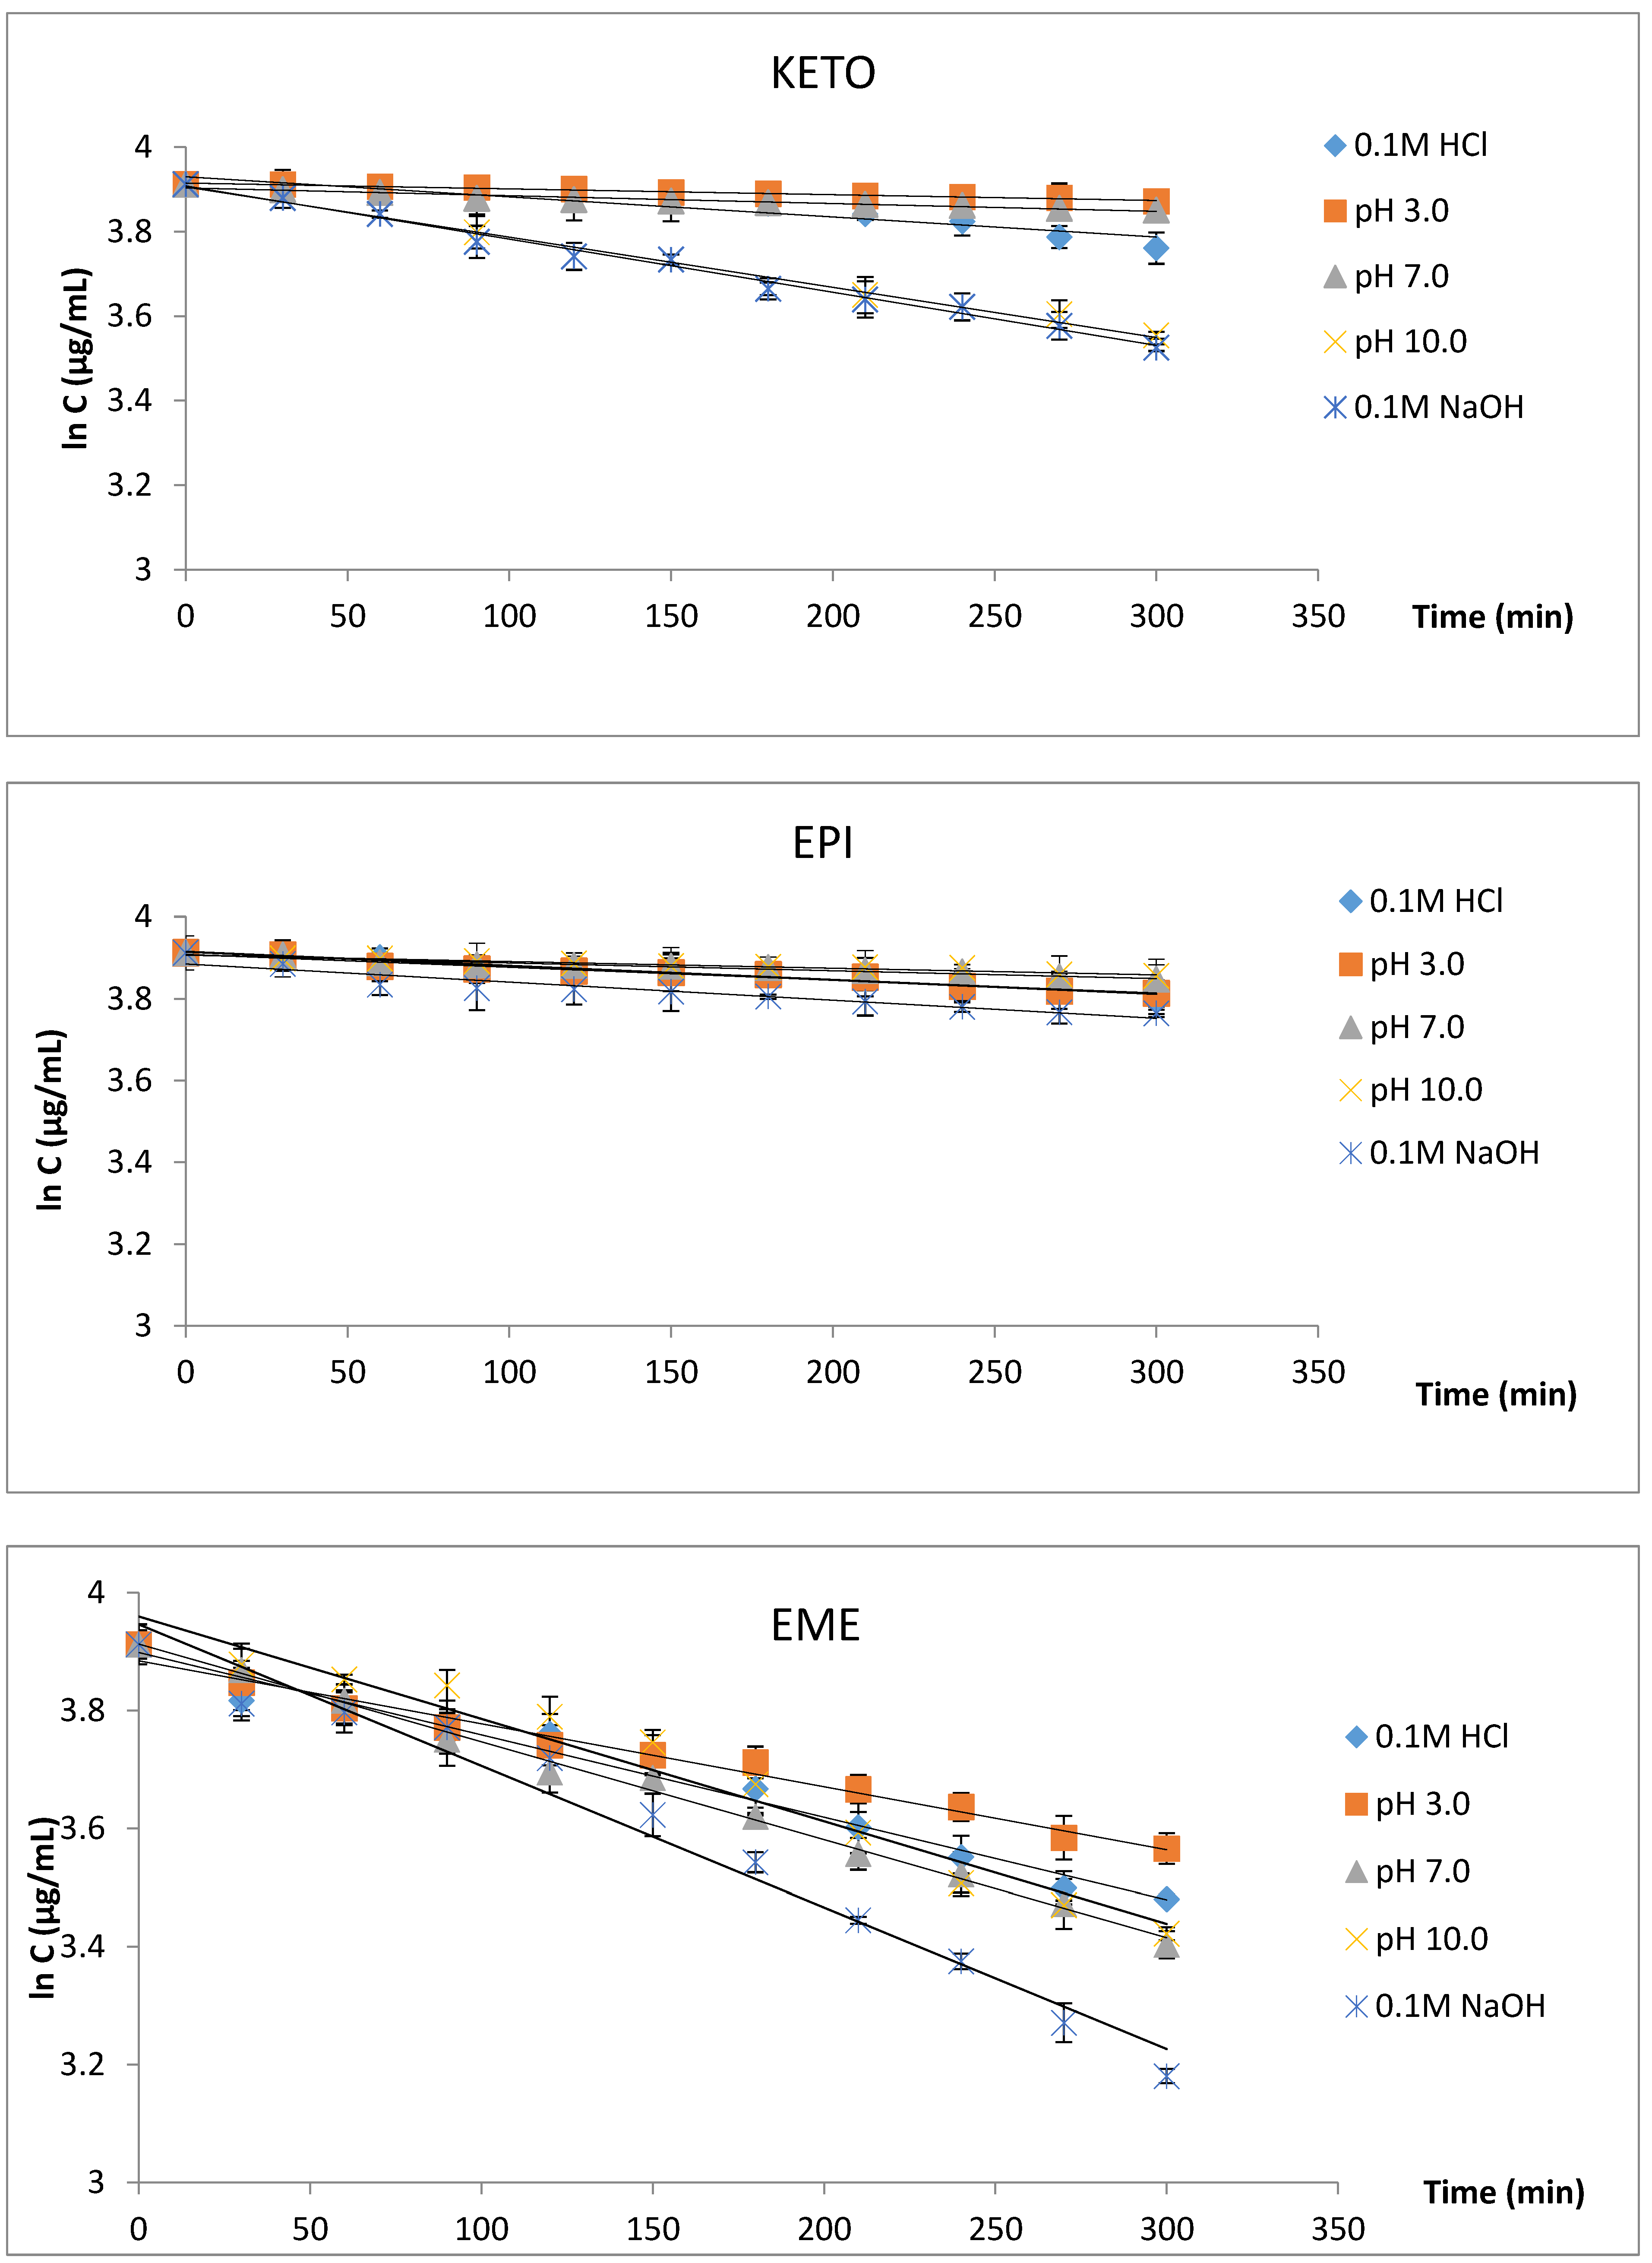
| %degradation | 14.04 | 3.94 | 5.96 | 30.06 | 32.07 |
| r2 | 0.9047 | 0.9834 | 0.9434 | 0.9868 | 0.9896 |
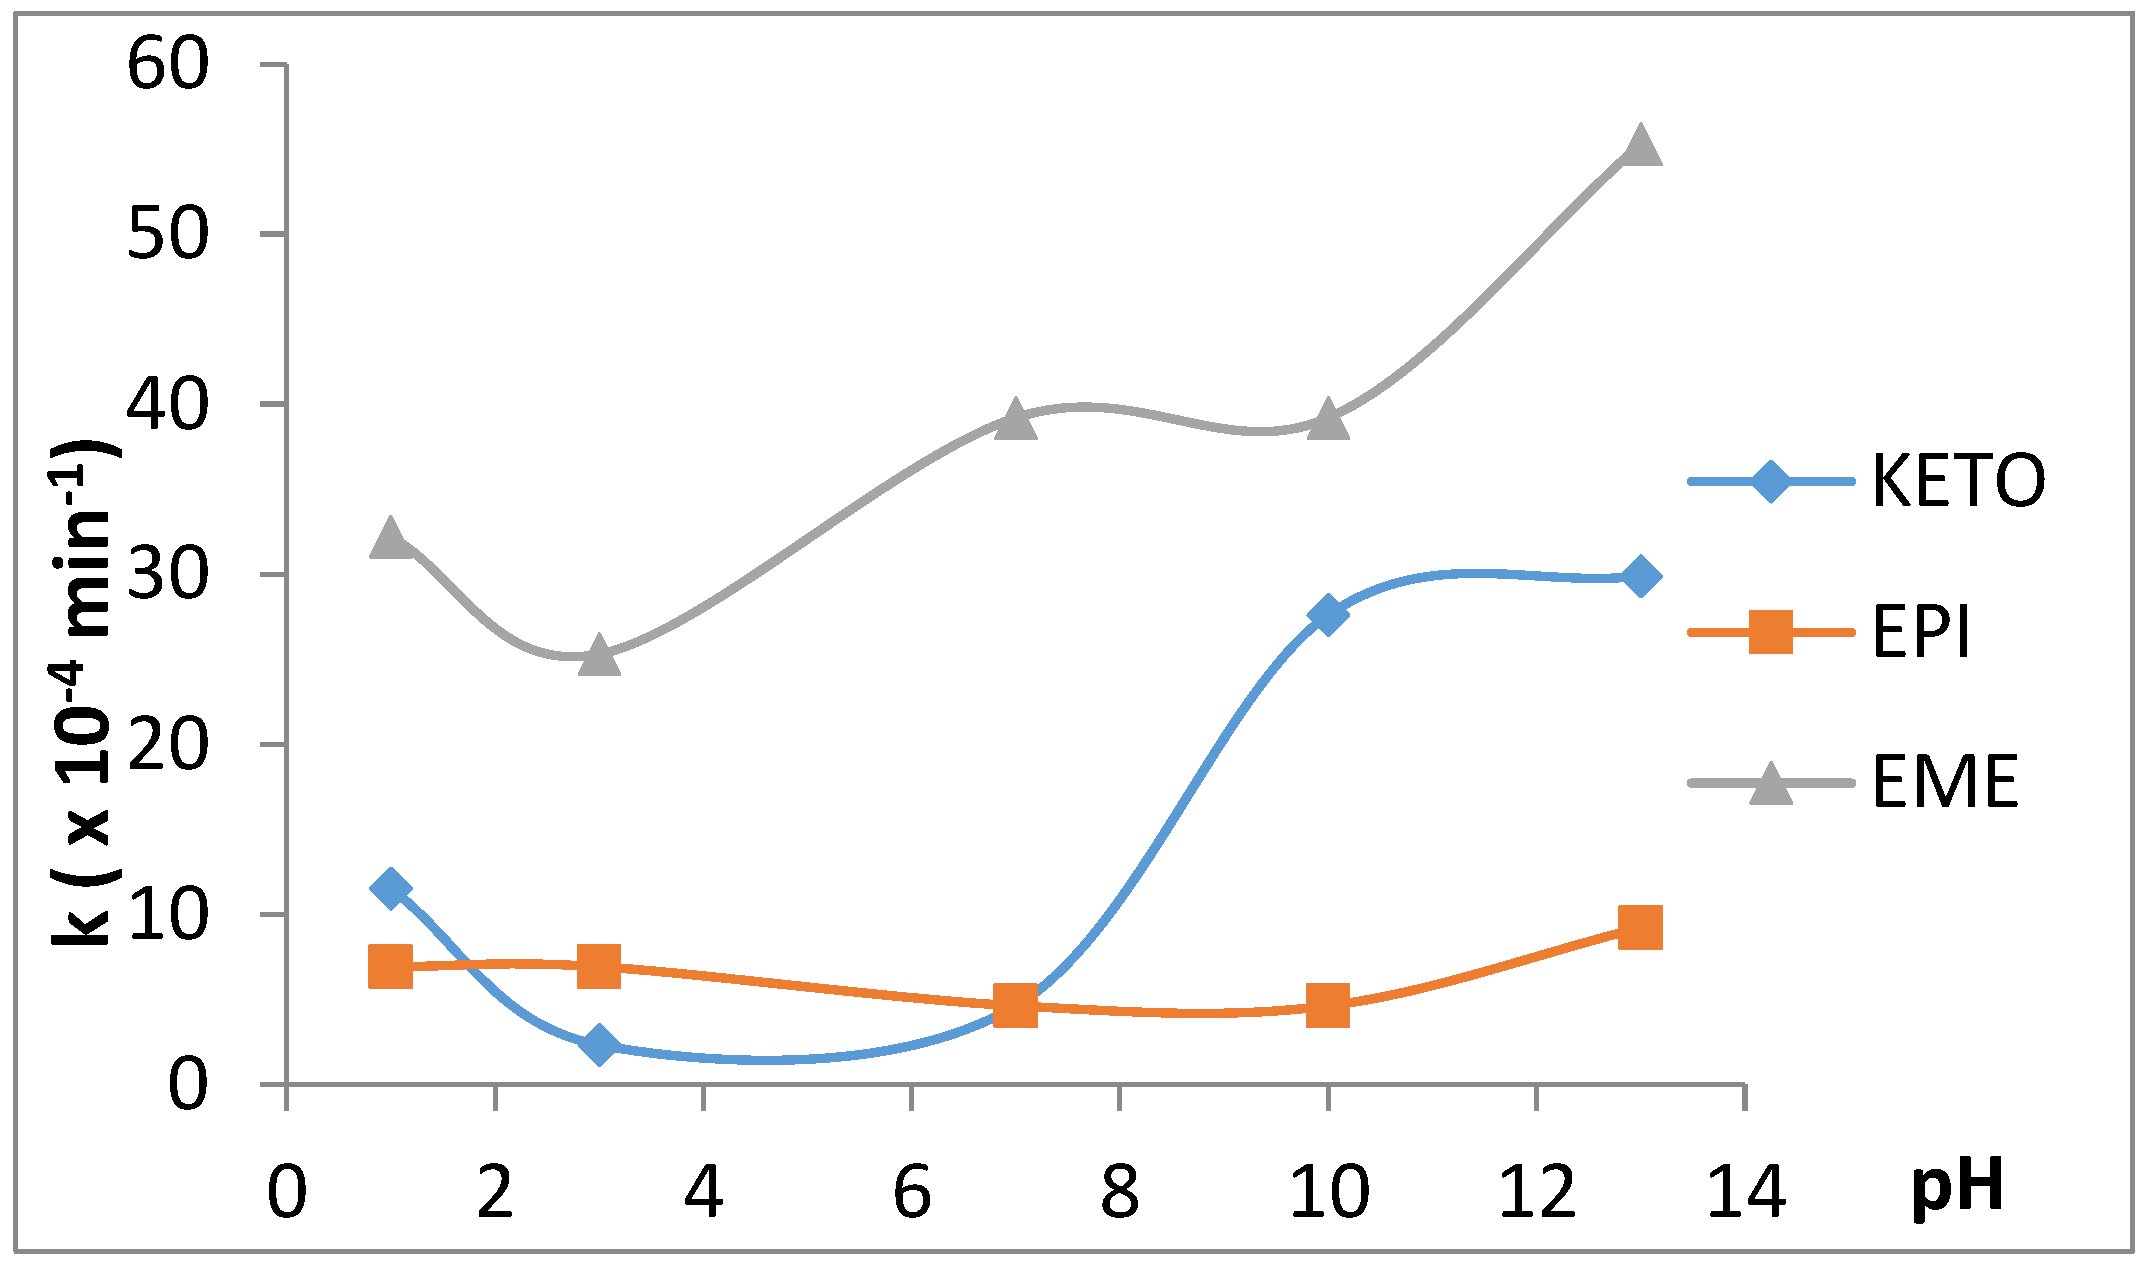
| k (min−1) | 1.15 × 10⁻³ | 2.31 × 10⁻⁴ | 4.61 × 10⁻⁴ | 2.76 × 10⁻³ | 2.99 × 10⁻³ |
| t0.5 (h) | 10.03 | 50.15 | 25.08 | 4.18 | 3.86 |
| EPI | |||||
| %degradation | 10.83 | 9.41 | 6.22 | 5.46 | 13.76 |
| r2 | 0.9671 | 0.9569 | 0.9447 | 0.9484 | 0.9042 |
| k (min−1) | 6.91 × 10⁻⁴ | 6.91 × 10⁻⁴ | 4.61 × 10⁻⁴ | 4.61 × 10⁻⁴ | 9.21 × 10⁻⁴ |
| t0.5 (h) | 16.72 | 16.72 | 25.08 | 25.08 | 12.54 |
| EME | |||||
| %degradation | 35.06 | 29.26 | 39.86 | 38.72 | 51.88 |
| r2 | 0.9764 | 0.9807 | 0.9950 | 0.9644 | 0.9734 |
| k (min−1) | 3.22 × 10⁻³ | 2.53 × 10⁻³ | 3.92 × 10⁻³ | 3.92 × 10⁻³ | 5.53 × 10⁻³ |
| t0.5 (h) | 3.58 | 4.57 | 2.95 | 2.95 | 2.08 |
| Compound | tR (min) | [M + H] + | Fragmentation Ions | Structures |
|---|---|---|---|---|
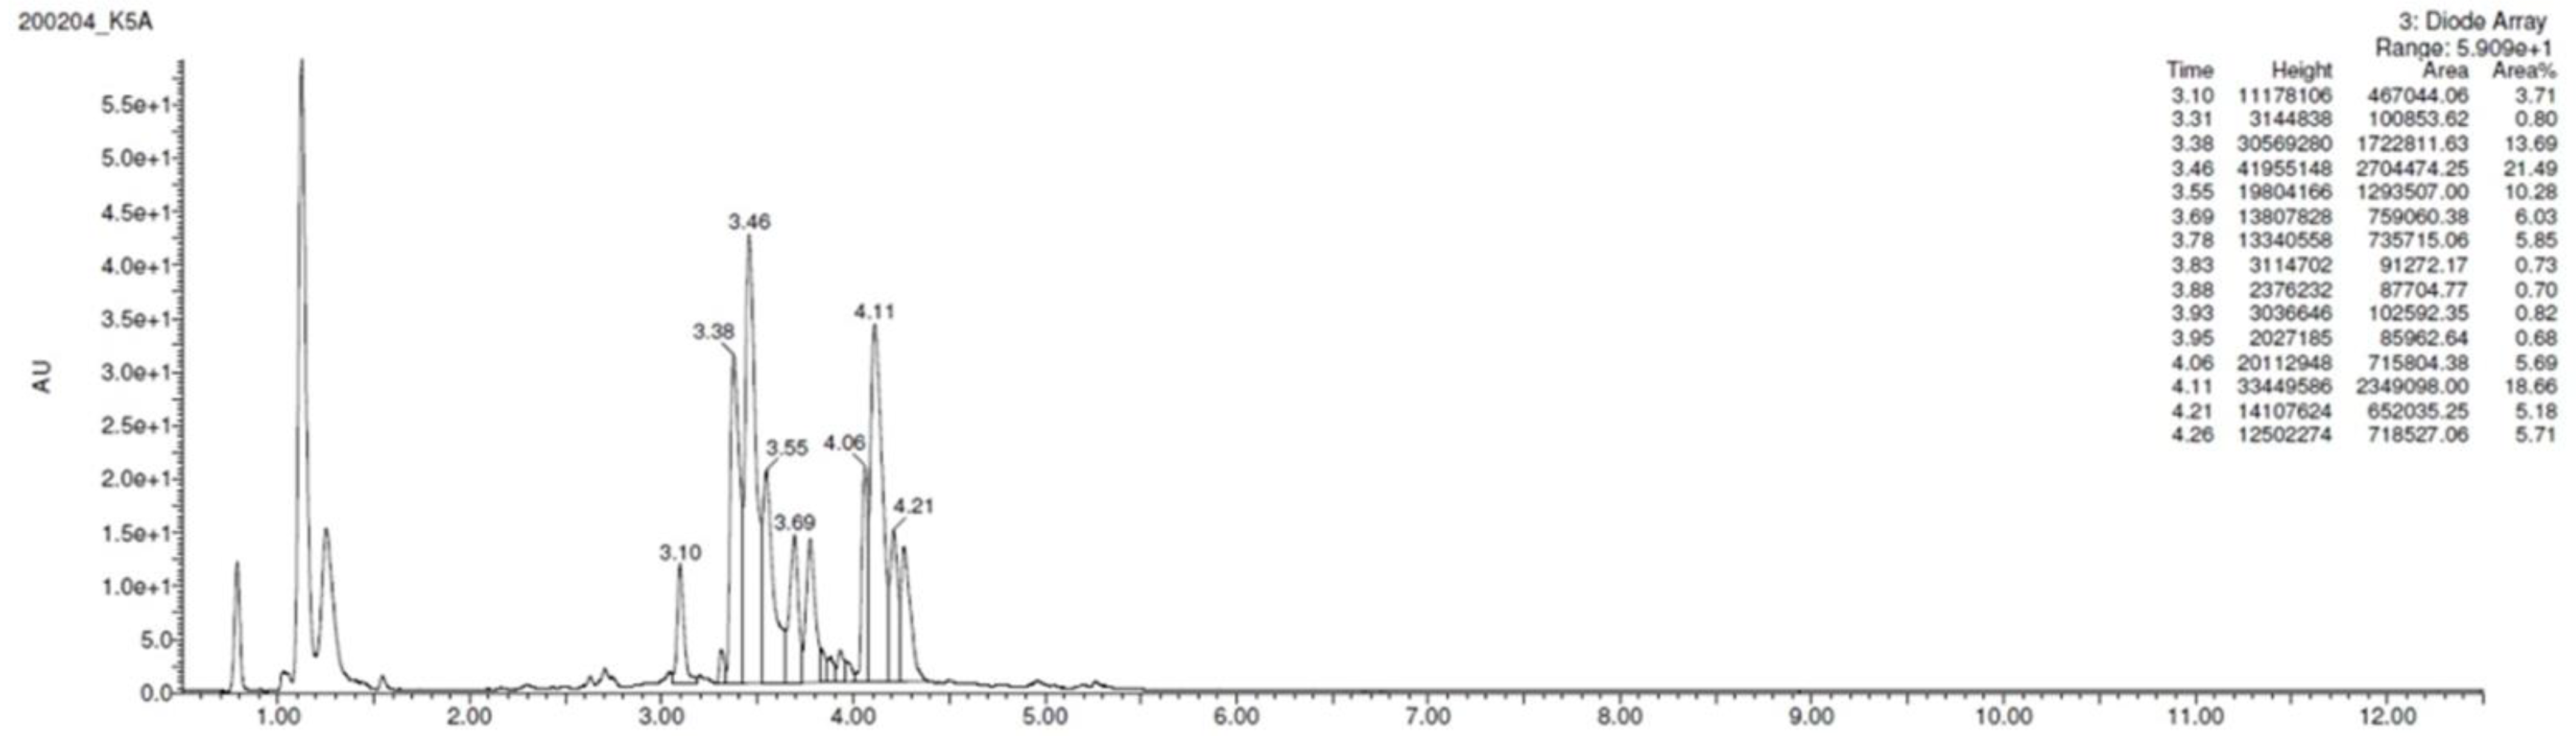
| KETO | 3.79 | 310.1 | 249.0, 221.0, 213.1, 199.0, 185.0, 96.1 |  |
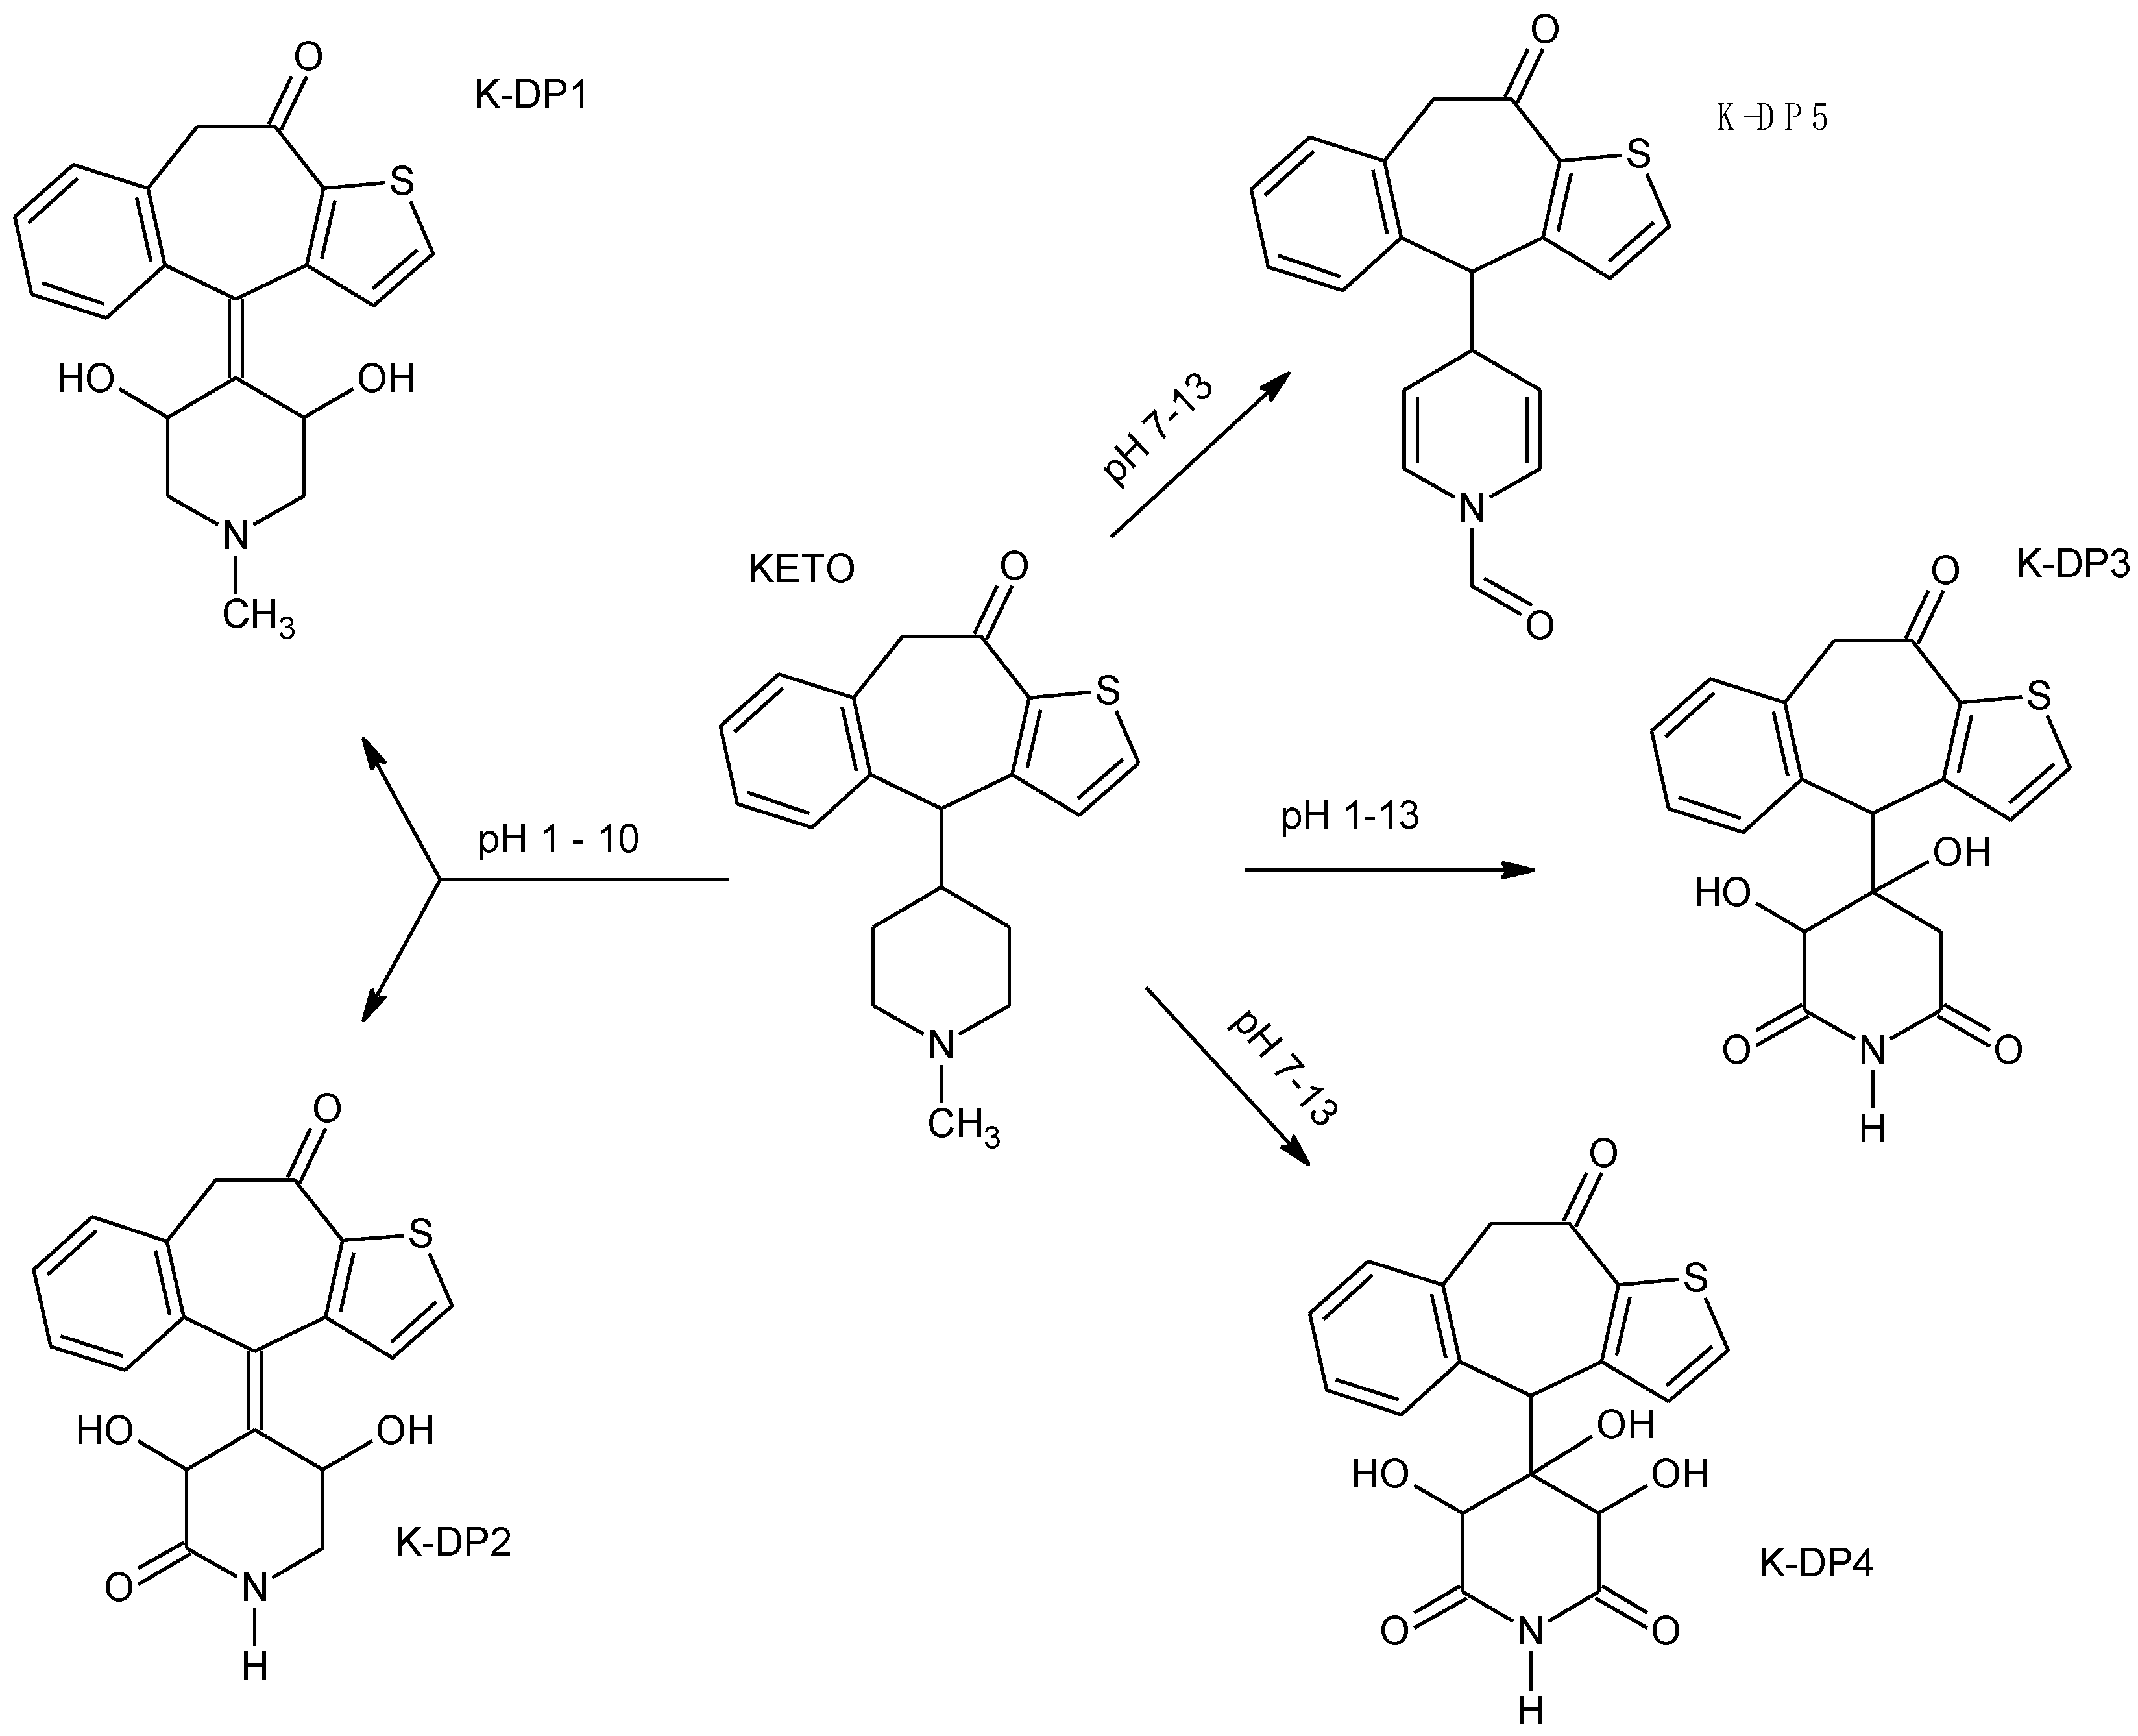
| K-DP1 0.1 M HCl Buffer 3.0 Buffer 7.0 Buffer 10.0 | 3.43 | 342.1 | 324.1, 306.1, 278.1, 221.0 |  |
| K-DP2 0.1 M HCl Buffer 3.0 Buffer 7.0 Buffer 10.0 | 3.69 | 342.1 | 324.1, 306.1, 278.1, 250.1, 221.0 |  |
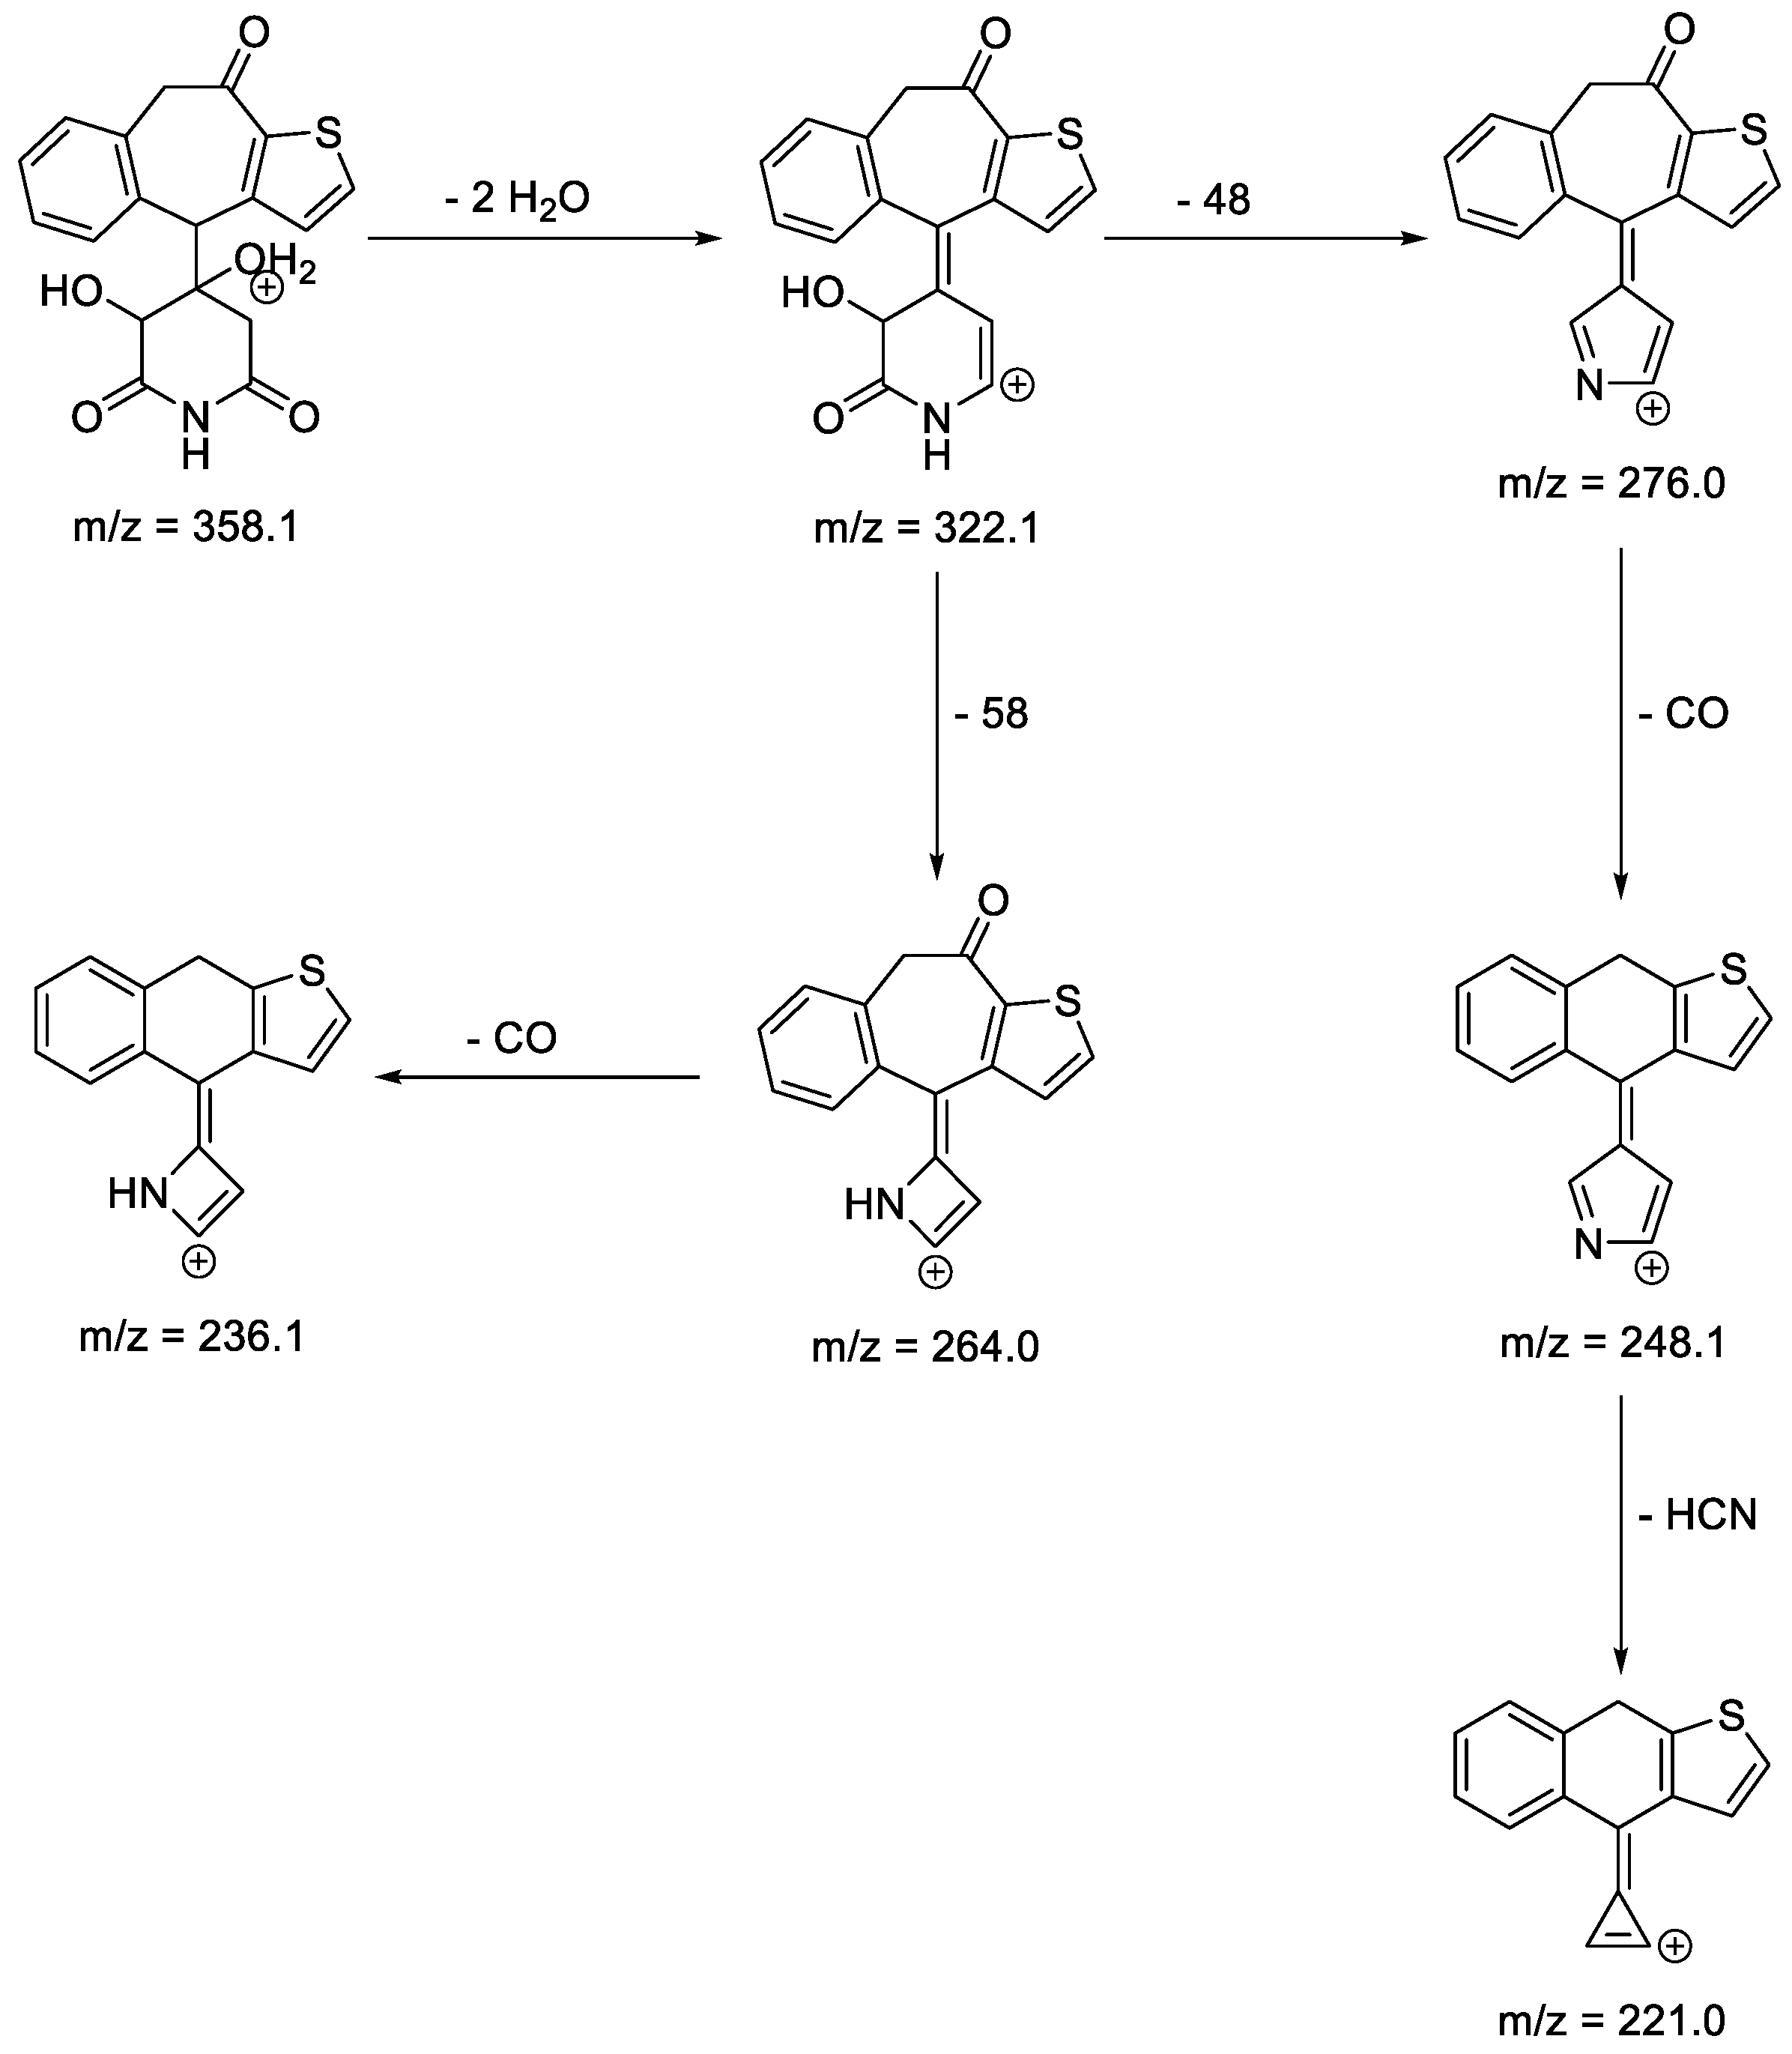
| K-DP3 0.1 M HCl Buffer 10.0 0.1 M NaOH | 3.46 | 358.1 | 322.1, 276.0, 264.0, 248.1, 236.1, 221.0 |  |
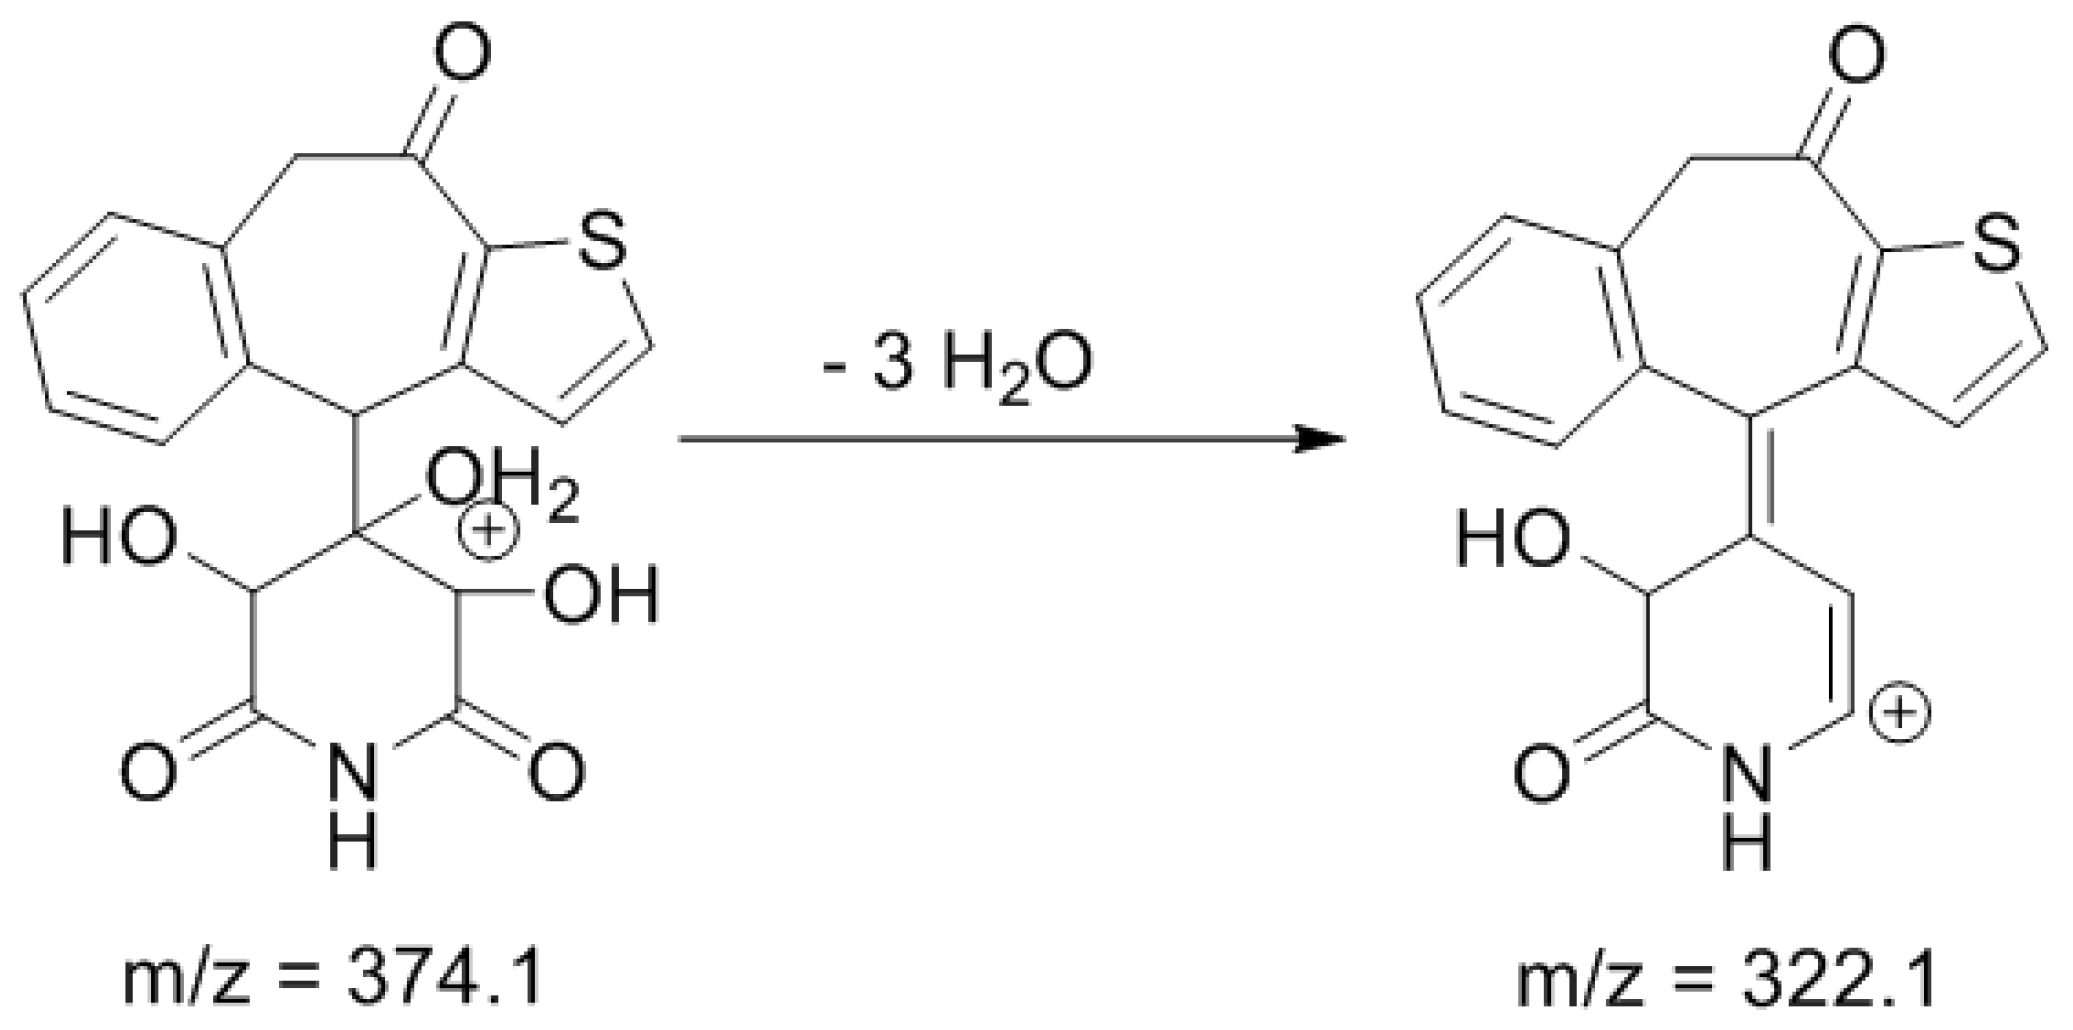
| K-DP4 Buffer 7.0 Buffer 10.0 0.1 M NaOH | 3.55 | 374.1 | 322.1 |  |
| K-DP5 Buffer 7.0 0.1 M NaOH | 3.56 | 320.1 | 292.1, 275.1, 263.1, 247.1 |  |
| Compound | tR (min) | [M + H] + | Fragmentation Ions | Structures |
|---|---|---|---|---|
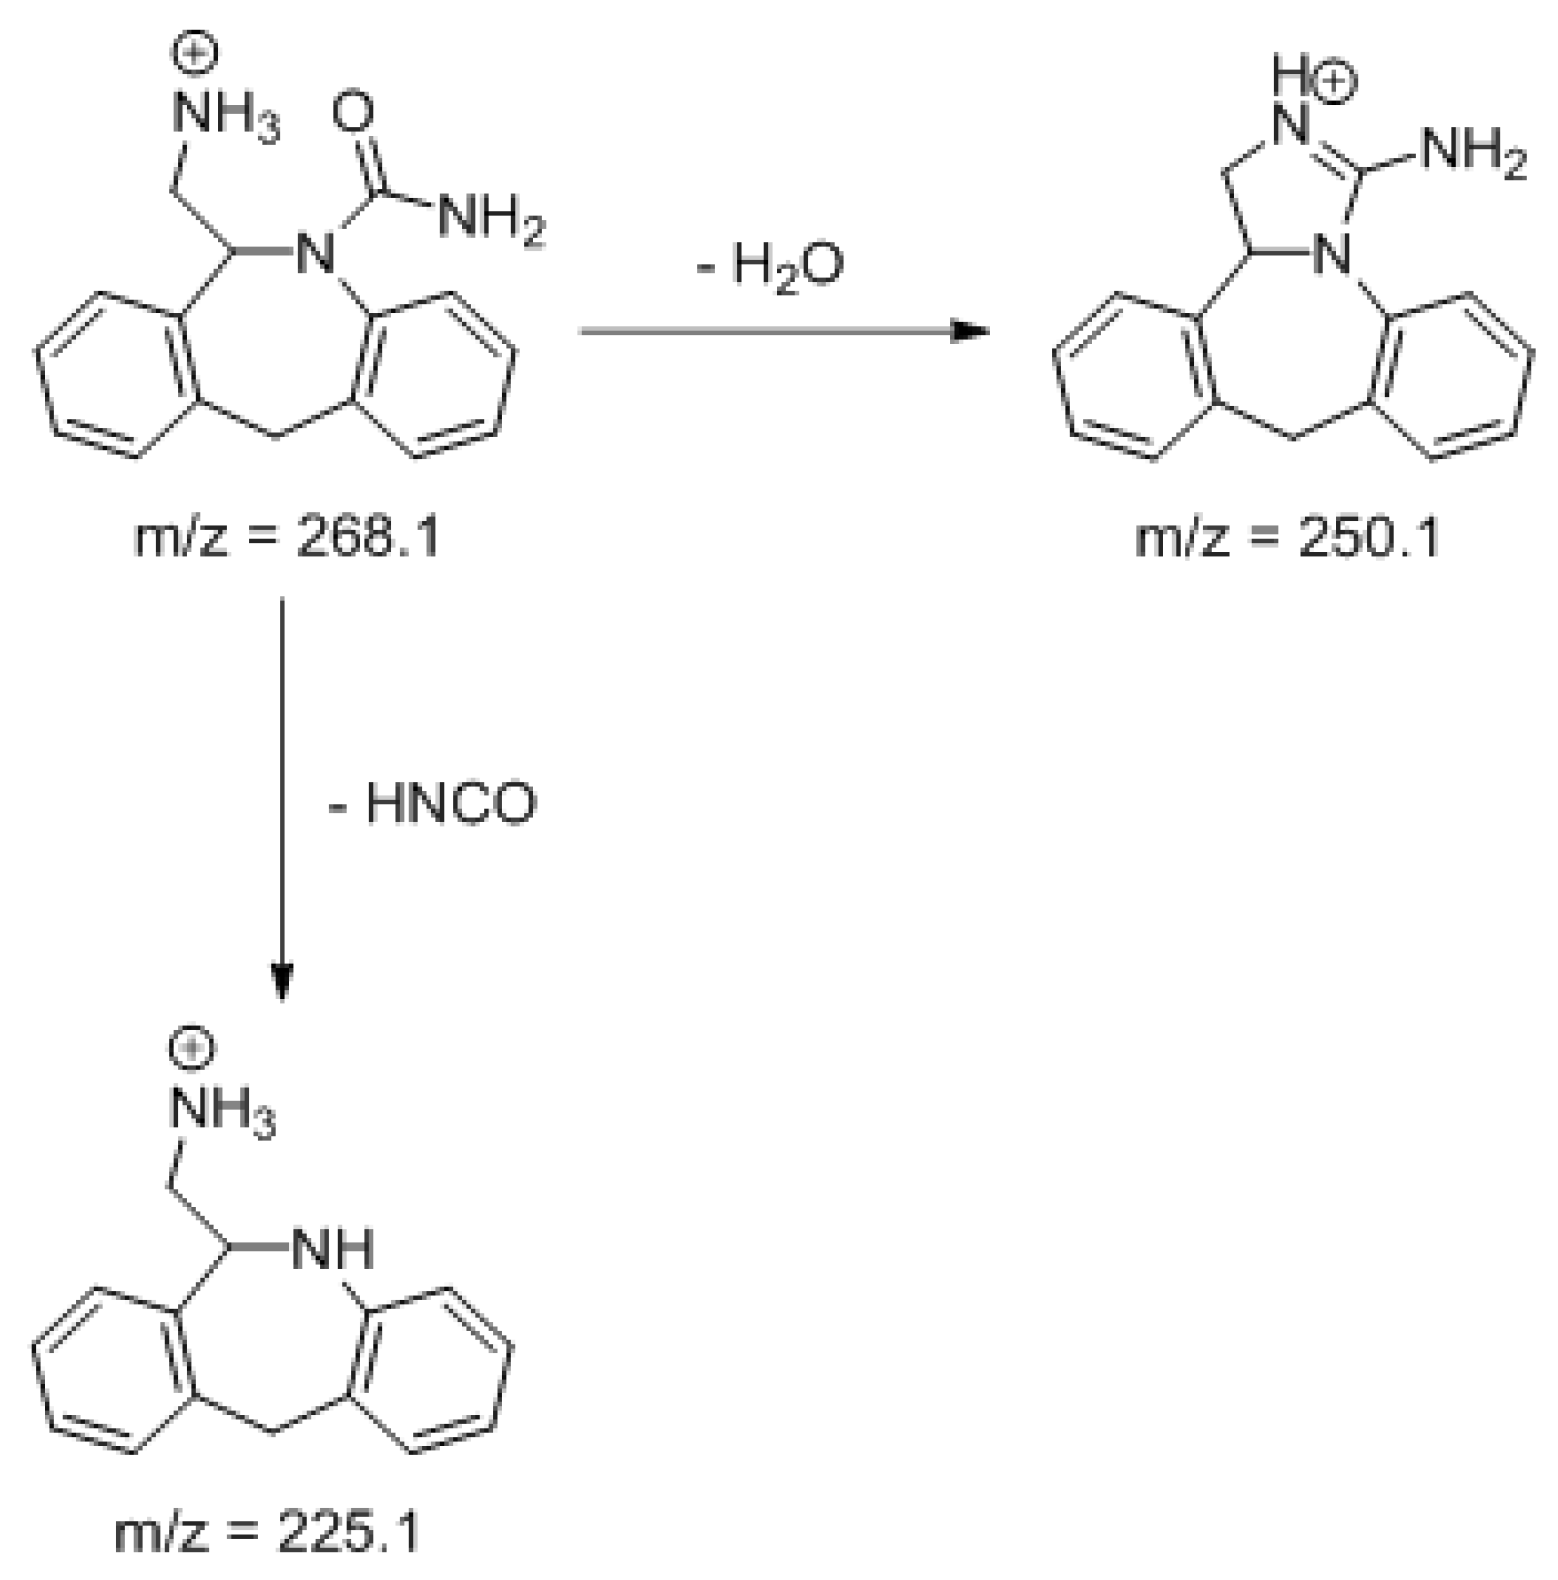
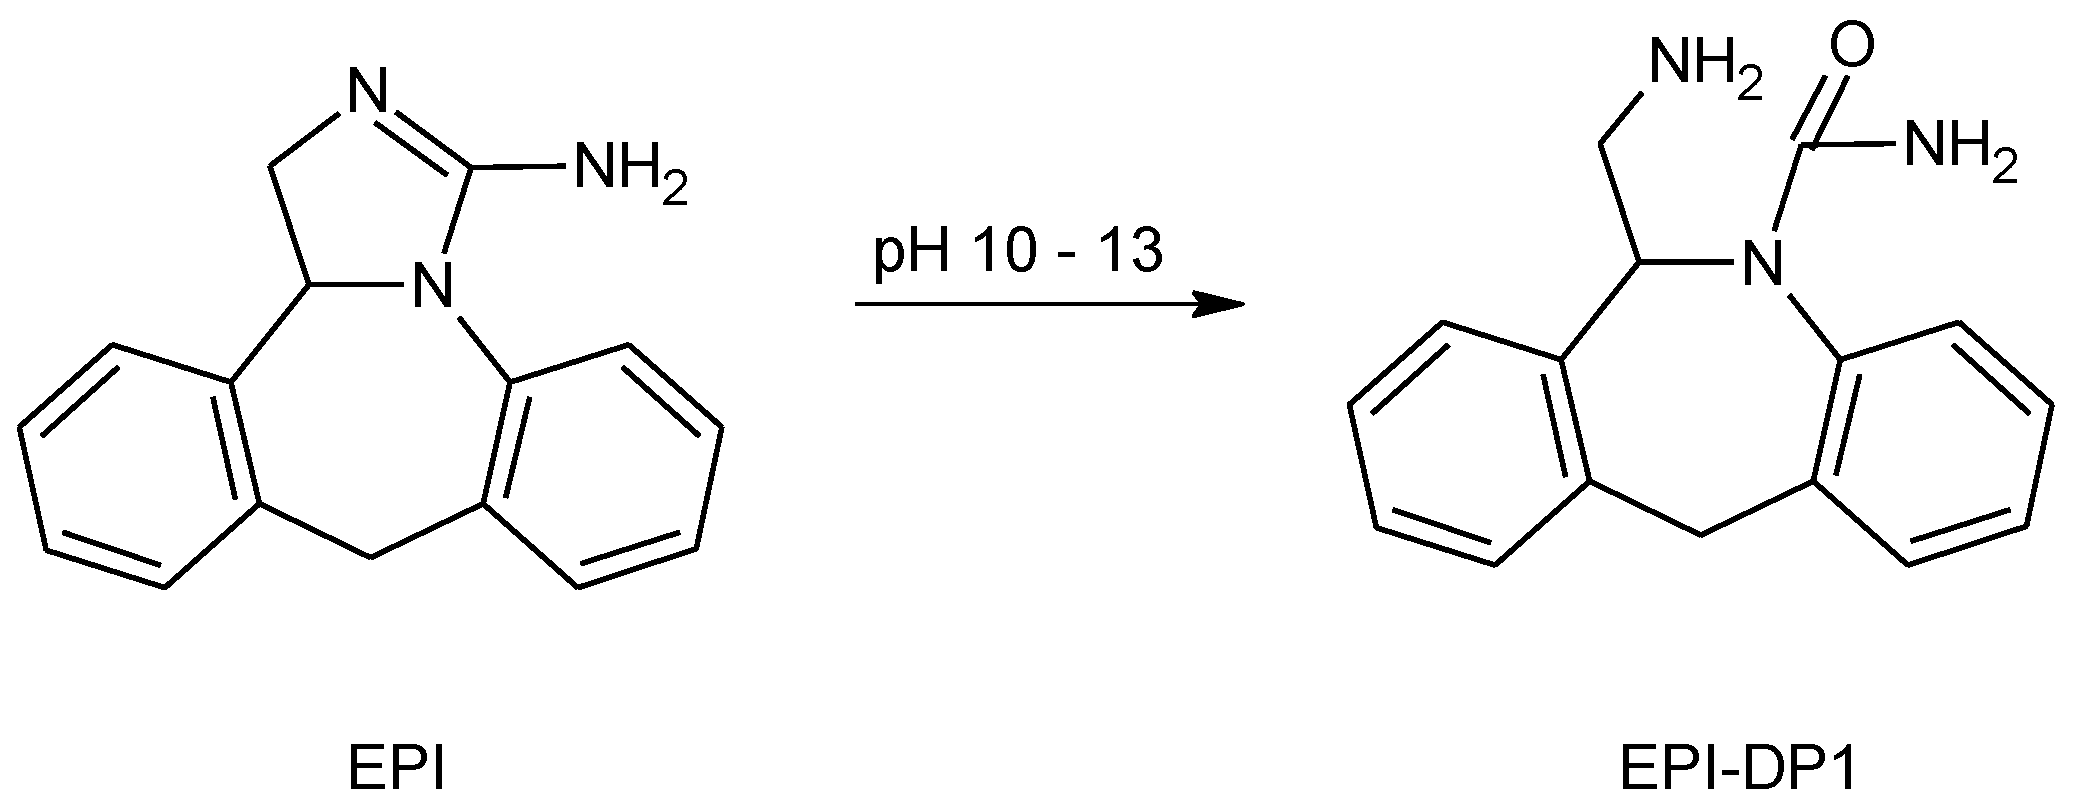
| EPI | 3.79 | 250.1 | 208.1, 193.1, 178.1, 165.1, 130.1, 115.1, 91.1, |  |
| EPI-DP1 Buffer pH 10.0 0.1 M NaOH | 3.06 | 268.1 | 250.1, 225.1, 208.1, 193.1, 130.1 |  |
| Compound | tR [min] | [M + H] + | Fragmentation Ions | Structure |
|---|---|---|---|---|
| EME | 2.20 | 303.2 | 246.2, 232.1, 218.1, 200.1, 174.1, 146.1, 134.1 |  |
Publisher’s Note: MDPI stays neutral with regard to jurisdictional claims in published maps and institutional affiliations. |
© 2020 by the authors. Licensee MDPI, Basel, Switzerland. This article is an open access article distributed under the terms and conditions of the Creative Commons Attribution (CC BY) license (http://creativecommons.org/licenses/by/4.0/).
Share and Cite
Gumieniczek, A.; Kozak, I.; Żmudzki, P.; Hubicka, U. LC-UV and UPLC-MS/MS Methods for Analytical Study on Degradation of Three Antihistaminic Drugs, Ketotifen, Epinastine and Emedastine: Percentage Degradation, Degradation Kinetics and Degradation Pathways at Different pH. Processes 2021, 9, 64. https://doi.org/10.3390/pr9010064
Gumieniczek A, Kozak I, Żmudzki P, Hubicka U. LC-UV and UPLC-MS/MS Methods for Analytical Study on Degradation of Three Antihistaminic Drugs, Ketotifen, Epinastine and Emedastine: Percentage Degradation, Degradation Kinetics and Degradation Pathways at Different pH. Processes. 2021; 9(1):64. https://doi.org/10.3390/pr9010064
Chicago/Turabian StyleGumieniczek, Anna, Izabela Kozak, Paweł Żmudzki, and Urszula Hubicka. 2021. "LC-UV and UPLC-MS/MS Methods for Analytical Study on Degradation of Three Antihistaminic Drugs, Ketotifen, Epinastine and Emedastine: Percentage Degradation, Degradation Kinetics and Degradation Pathways at Different pH" Processes 9, no. 1: 64. https://doi.org/10.3390/pr9010064