Article

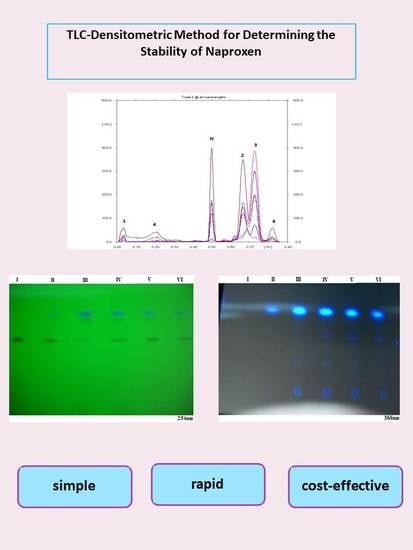
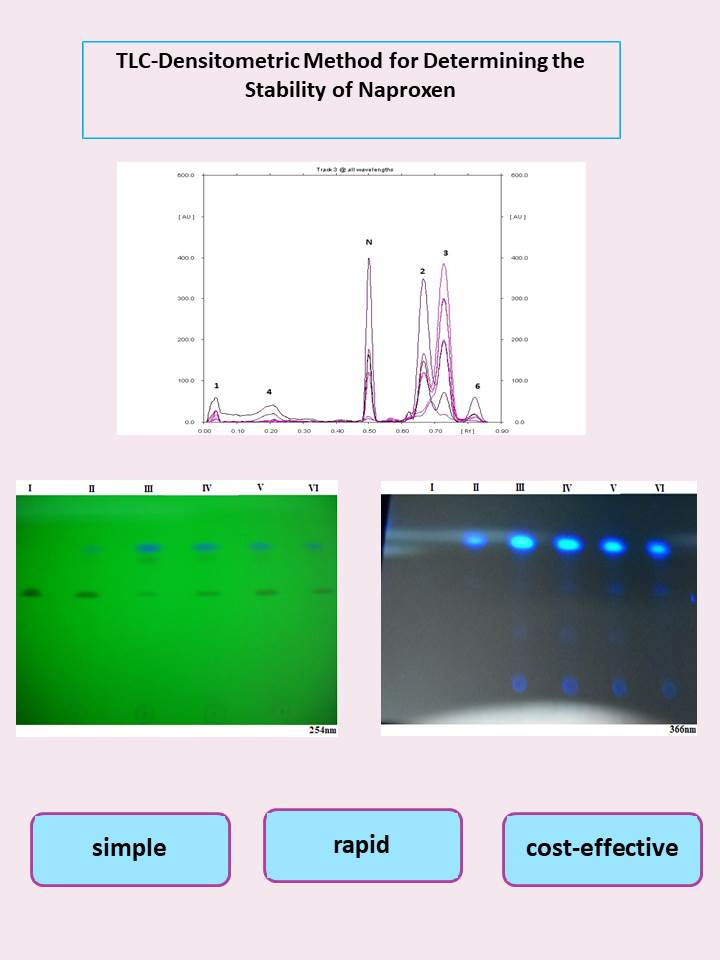
Rapid TLC with Densitometry for Evaluation of Naproxen Stability

Department of Analytical Chemistry, Faculty of Pharmaceutical Sciences in Sosnowiec, Medical University of Silesia in Katowice, 41-200 Sosnowiec, Poland
*
Author to whom correspondence should be addressed.
Processes 2020, 8(8), 962; https://doi.org/10.3390/pr8080962
Submission received: 10 June 2020 / Revised: 5 August 2020 / Accepted: 6 August 2020 / Published: 10 August 2020
(This article belongs to the Section Separation Processes)

Abstract

:
The purpose of the work was to develop such chromatographic conditions that allowed to separate as many naproxen degradation products as possible. In order to follow this process, thin-layer chromatography (TLC) coupled with densitometry and spectrodensitometry was used. A forced degradation study was performed using an ethanolic solution of naproxen spotted on silica gel plates, existing in the form of an aqueous solution at various pH values, and as solution prepared in saline and in hydrogen peroxide. Degradative effect of UV light on naproxen was watched in the context of naproxen spotted on plates precoated with silica gel and exposed to UV light, and also for its solution treated with UV light. However, the solution of naproxen prepared in water at pH ≈ 2.60 undergoes the largest changes as the results of its exposure to UV light during 10 h. Stressed samples of naproxen were analyzed by using a new and well validated TLC procedure including toluene (TOL)—acetone (ACE)—chloroform (CHL) (2:5:12, v/v/v) as mobile phase A and glacial acetic acid (AcOH)—n-hexane (Hex)—acetone (ACE)-(0.10:10:10, v/v/v) as mobile phase B. As the newly developed TLC-densitometric method can effectively separate the substances about pharmaceutical significance from products of its degradation, which are formed as a result of stress studies, is considered to be a good alternative and important tool in routine quality control and stability testing of naproxen in pharmaceutical formulations. These results indicate that proposed TLC-densitometric method is cost-effective, rapid, specific, accurate, and precise. This TLC procedure is comparable to HPLC and UPLC method in terms of detection the number of degradation products of naproxen. In addition, it realizes the criterion of linearity. A major advantage and novelty of proposed method is its low cost and ability to analyze examined drug and all degradation products simultaneously, including those which can be observed under intensive UV radiation exposure of naproxen solution which are not described by previous HPTLC studies available in the literature.

Graphical Abstract

1. Introduction

One of the major problems in pharmaceutical analysis, particularly in quality control of newly developed active pharmaceutical ingredients (API) as well as new marketed formulations is reliable determination of their stability. This will help to find such storage conditions which ensure that a drug product is safe for consumption throughout of its shelf-life [1,2]. For this reason data generated during stability test are essential to estimate the expiration date of each pharmaceutical product.
Because of different factors influencing the stability of any active drug ingredient or pharmaceutical product, respectively, the stability testing of drugs is a complex process composed of many steps. It is known that stability study will ensure quality of any pharmaceutical product and safety in use as well as its efficacy (i.e., biological activity) during the shelf-life. It is required by ICH guideline (The International Conference on Harmonization of Technical Requirements for Registration of Pharmaceuticals for Human Use) [2,3,4]. The loss of drug stability can lead to weakness or loss of therapeutic effect of a proper pharmaceutical product. In addition, some of the degradation products may be more toxic than the parent drug causing adverse effects on humans. Moreover, these degradation products can generate unknown biological effects and thereby they are very great risks for the natural environment (ecosystems) [2].
In general, the term stability is the ability of a particular active ingredient or drug formulation under storage conditions to maintain its toxicological, microbiological, chemical and physical properties [2,3]. Literature survey revealed that vital role in stability of pharmaceuticals play the following degradation reactions: hydrolysis, oxidation, reduction, photolysis, solvolysis, racemization, and polymerization [2]. Thus, the chemical drug decomposition as a result of the above mentioned reactions can be affected by different storage conditions, such as greater temperature, pH of solution, UV-radiation, catalysts, or the presence of bacteria which may also cause drug damage.
A variety of stability indicating chromatographic procedures under different stress conditions such as hydrolysis, thermal, photolytic degradation, and oxidative stress were applied for the analysis of naproxen in pharmaceutical formulations and its impurities [5,6,7,8,9,10,11,12,13,14].
For example, during an HPTLC study performed by Kothapalli et al. [5], naproxen was degraded in acidic (1M HCl), alkaline (1M NaOH) and oxidation (3% H2O2) conditions. However, no degradation was observed during neutral hydrolysis, heat (60 °C) and UV-exposure (254 nm) [5].
Next, RP-HPLC-PDA technique was used for the analysis of naproxen sodium in the presence of its degradants [6]. Naproxen was subjected to forced degradation such as acidic hydrolysis (1N HCl/ 60 °C/2 h), basic hydrolysis (1N NaOH/60 °C/8 h), oxidation (3% H2O2/60 °C/30 min), photo degradation (UV light/14 days) and thermal degradation (70 °C/7 days). It was stated that naproxen is stable only during photo and thermal degradation [6].
In another study, an effective RP-HPLC-UV was applied for assay and hydrolysis of a new naproxen amide prodrug [7]. The following stress conditions such as: acidic hydrolysis (0.1N HCl/25 °C/24 h), alkali hydrolysis (0.1N NaOH/25 °C and 0.01N NaOH/25 °C), oxidation (3% H2O2/25 °C/24 h; 3% H2O2/50 °C/24 h; 6% H2O2/50 °C/24 h), thermal analysis (70 °C/48 h) and photolytic (25 °C/48 h) were used in this study. It was stated that the degradation products showed good resolution and separation from the drug.
Songnaka et al. [8] developed a new stability-indicating HPLC procedure for the analysis of naproxen in an extemporaneous suspension. The decomposition of naproxen sample was stated in the acid-catalyzed hydrolysis (0.1N HCl). However, the drug remained intact in the basic (0.1N NaOH) and neutral (H2O) hydrolysis [8].
Next, RP-UPLC technique was elaborated for the detection of naproxen and its four impurities in pharmaceutical dosage forms [9]. The stress conditions applied during this degradation examination of naproxen were as follows: UV light (carried out according with guidelines ICH Q1B), acid hydrolysis (1N HCl/60 °C/2 h), basic hydrolysis (1N NaOH/60 °C/2 h), aqueous hydrolysis (60 °C/6 h), oxidation (6% H2O2/40 °C/2 h), thermal (105 °C/5 h). For examinations of the influences of light, the examination period was 10 days. Naproxen was degraded when subjected to acid and base degradation conditions. No change of naproxen sample was watched when subjected to heat, humidity, peroxide, water and photolytic conditions [9].
However in another experiment, in which naproxen and its four impurities were determined by RP-UPLC, it was seen that naproxen was degraded significantly in acid (1N HCl/80 °C) and oxidative (1% H2O2/room temp.) stress conditions, but it is stable in base (1N NaOH/80 °C), water (90 °C), and photolytic (UV light, 254 nm/10 days) stress conditions. The degradants showed good resolution from main peak [10].
In the next study, RP-UPLC technique was successfully applied for complete separation the seven potential impurities of naproxen sodium in gelatin capsules [11]. Sample solutions were made in different stress conditions i.e., acidic degradation (5M HCl/60 min/25 °C/1 mL), alkaline degradation (5M NaOH/120 min/85 °C/1 mL), peroxide degradation (30% H2O2/60 min/25 °C/1 mL), thermal (24 h/60 °C), humidity (90% RH/120 h/25 °C) and photolytic (10 K Lux/120 h + UV 200 watt hours/m2). It was stated that a substantial degradation was found for imputity-2, impurity-4, and impurity-7 of naproxen in oxidative, acid and alkali. During humidity degradation there was a substantial degradation was found for impurity-2 and impurity-7 of naproxen. In thermal degradation there was a substantial degradation was seen for impurity-7. However, there was no substantial degradation found in photolytic degradation.
Another HPLC technique proved useful for the determination of six potential impurities that may be formed from naproxen in fixed dose combination [12]. In acid stress condition (1M HCl/85 °C/3 h), photolytic stress conditions (10 K Lux for 120 h along with UV 200 W.Hr.m−2), as well as in thermal stress conditions (105 °C/120 h) naproxen underwent degradation and formation of new compounds i.e., potential impurities was observed. While examined naproxen found to be stable in base (1M NaOH/85 °C/3 h), oxidative (5% H2O2/15 min) and humidity (90% RH/25 °C/120 h) degradation conditions. Forced degradation investigations showed a good separation of all potential impurities which were formed under various stress conditions [12].
Intensive increase developing a new drug formulation confirms that there is a big need to find a reliable, selective, sensitive, as well as cost-effective analytical method suitable for accelerated stability measurements of available pharmaceutical products. Following on our previous papers [15,16,17,18,19] and those prepared by other authors [6,20,21,22,23]. It is well known that from all analytical methods used, thin-layer chromatography combined with densitometry (TLC-densitometry) is still simple and cost-effective stability indicating method worldwide used in pharmaceutical analysis of various active ingredients, like for example naproxen.
Chemical name of naproxen (N) is chemically (+)-(S)-2-(6-methoxynaphthalen-2-yl) propanoic acid. It is a non-steroidal anti-inflammatory drug (NSAID) indicated in inflammation, fever or the reduction of moderate-to-severe pain after an operation. Naproxen and its sodium salt are also used for rheumatoid arthritis, bursitis, osteoarthritis, acute gout, and dysmenorrhea [24,25].
Numerous analytical methods like spectrophotometry [19,26,27,28], titration [29], microextraction [30], voltammetry [31,32,33] chromatographic technologies in combination with various detection systems (HPLC, UPLC, GC, TLC) [5,6,7,8,9,10,11,12,13,14,18,20,28,32,34,35,36,37,38,39,40,41,42,43,44] and also electrophoresis [45,46] were utilized for the naproxen determination in different matrix in sampling biological materials (e.g., urine, plasma), water samples (wastewater), and also in simple and complex drug formulations.
The subject of current investigation was, therefore, to evolve such chromatographic conditions that allowed as many naproxen degradation products to separate as possible by means of newly developed reliable, rapid, and inexpensive both TLC-densitometric and spectrodensitometric procedure. A forced degradation study was performed using an ethanolic solution of naproxen spotted on silica gel plates as well as existing in the form of an aqueous solution at various pH values, and as solution prepared in saline and in hydrogen peroxide.
Estimation the effectiveness of proposed TLC method for stability testing of naproxen as pharmaceutical active ingredient was performed in these investigations.

2. Materials and Methods

2.1. Chemicals and Reagents

Pharmaceutical reference standard naproxen (N) and naproxen ethyl ester (NEE) as pharmaceutical impurity standard were supplied by Sigma-Aldrich (St. Louis, MO, USA). Absolute ethanol (EtOH, 99.8%) was supplied by POCh (Gliwice, Poland). Physiological salt solution was supplied by Baxter Terpol (Warsaw, Poland). Chemically stabilized hydrogen peroxide solution containing hydrogen dioxide solution 30%, 1-hydroxyethane-1,1-diphosphoric acid, sodium dihydrogen phosphate, and purified water was from Amara (Cracow, Poland). The solvents of mobile phases, such as chloroform CHL), acetone (ACE), toluene (TOL), n-hexane (Hex), glacial acetic acid (AcOH) were purchased from POCh (Gliwice, Poland). All reagents and chemicals applied in these investigations were of HPLC purity.

2.2. Preparation of Stock and Working Standard Solutions

Standard solutions containing 4 mg·mL−1 of naproxen (N) and ethyl (2S)-2-(6-methoxynaphthalen-2-yl)propanoate (synonym of naproxen ethyl ester) were prepared individually by dissolving of 100 mg of naproxen and naproxen ethyl ester, respectively in 25 mL of absolute ethanol. An ethanolic solution of naproxen (I) used in the case of stability study on silica gel has been prepared by mixing of 2 mL of stock standard solution (equivalent to 8 mg of naproxen) and 5 mL of absolute ethanol (corresponding to 1.14 mg·mL−1 of naproxen). Assess the effect of UV radiation on chemical stability of examined naproxen, the five solutions of naproxen (II–VI) prepared in various solvents were used: II—in physiological salt; III—in water at pH ≈ 2.60; IV—in water at pH ≈ 5.70; V—in water at pH ≈ 8.50 and VI—in hydrogen peroxide were evaluated. All solutions have been prepared in appropriate beakers (diameter 4 cm and height 6.5 cm) in an amount of 7 mL by mixing of 2 mL of standard solution (equivalent to 8 mg of naproxen), 1 mL of EtOH (99.8%), and 4 mL of proper solvent to obtain final concentration in each combined solution of 1.14 mg mL−1. An ethanolic solution of naproxen (I) was used as the reference standard solution.

2.3. Chromatographic Conditions

Chromatography was performed on aluminum foil plates coated with 0.20 mm layers of silica gel 60F254 (E. Merck, Darmstadt, Germany). The chromatographic plates were activated at 120 °C for 30 min and next five microliters of solution were spotted by use of micropipette (Camag, Muttenz, Switzerland) onto chromatographic plates in each case. Two mobile phases were applied in these investigations, namely: mobile phase (A) consisted of TOL, ACE, and CHL in a volume composition 2:5:12; and mobile phase (B) consisted of AcOH, Hex and ACE in a volume ratio 0.10:10:10. We placed 50 milliliters of above mentioned mobile phases into classical twin trough glass chamber (Camag, Muttenz, Switzerland). The chromatographic chambers were saturated by vapors of mobile phase for 20 min at room temperature (20 ± 1 °C). The plates were developed to 75 mm.

2.4. Validation of Method

Elaborated TLC method connected with densitometry was validated according to ICH guideline as well with the guideline described by Ferenczi-Fodor et al. [47,48]. Evaluated parameters were for specificity, linearity, limits of detection and quantification, accuracy, and precision.

2.4.1. Specificity of Method

Stability Study of Naproxen on Silica Gel

The influence of the UV light (λ = 254 nm) on the chemical stability of naproxen on silica gel was evaluated. Five µL of the solution (I) was spotted on each chromatographic plate. After evaporation of the solvent, the two plates were placed under UV lamp (UV-C, 6W, Cobrabid, Warsaw, Poland) at a distance of 18.5 cm, and then they have been irradiated to UV light for 60 min (that correspond to irradiation dose equal to 1.8 W∙s∙cm−2). After this time the plates were cooled down, and then 5 µL of examined solution of naproxen was spotted again onto new starting point of each plate. After evaporation of the solvent, the plates were irradiated to UV light for next 60 min. Irradiation under a UV lamp was carried out at room temperature (20 ± 1 °C). This study was repeated three times. Generally, the examined solution of naproxen was irradiated to UV light during 5 h (that correspond to irradiation dose equal to 9.0 W∙s∙cm−2). Under these conditions, the longest time on silica gel (5 h) had the substance, which was spotted on silica gel as the first, and the shortest time (1 h) had the substance, which was spotted on silica gel as the last, on fifth starting point. After 5 hours of exposing to UV radiation, the plates were cooled down, and 5 µL of standard solution of naproxen (I) was spotted on sixth starting point. The plates were then developed using described above mobile phases.

Stability of Naproxen in Form of Solutions

The solutions of naproxen prepared in proper solvents II–VI were placed into the open beakers and then exposed to UV radiation (at distance of 18.5 cm from the source of radiation) for a period of 5 h (that correspond to irradiation dose equal to 9.0 W∙s∙cm−2). Irradiation under a UV lamp was carried out at room temperature (20 ± 1 °C). After this time the solutions were transported into a glass flask (10 mL) and replenished to declared volume using 99.8% ethanol. Finally, the concentration of naproxen in obtained solutions was 0.8 mg mL−1. Next 5µL of both, analyzed solutions and standard solution (0.8 mg mL−1) were spotted onto two previously activated chromatographic plates. Then, the plates were developed using a mobile phase A and B, respectively. The process described above was repeated using freshly prepared solutions of naproxen at the same composition, but the time of exposition to UV radiation was 10 h (that correspond to irradiation dose equal to 18.0 W∙s∙cm−2).

2.4.2. Linearity and Range

Standard solutions of naproxen at the following concentrations 0.006, 0.008, 0.010, 0.012, 0.014, 0.016, 0.018, 0.020, 0.040, 0.060, 0.080, 0.100, 0.120, 0.140, 0.160, 0.180, 0.200, 0.220, 0.240, 0.260, 0.280, and 0.300 mg mL−1 were used to elaborate the linearity of proposed TLC-densitometric method. The five μL of standard solutions were spotted on the chromatographic plate. The chromatographic plates were developed using above mentioned mobile phases A and B, respectively, and next scanned. The calibration plots for both mobile phases were developed by plotting band area versus naproxen concentration.
The linearity was calculated on the basis six different analysis.

2.4.3. Accuracy

The accuracy of the TLC-densitometric method was determined by examining the recovery percentage of the added naproxen standard at 80%, 100%, and 120%. Accuracy was also expressed as coefficient of variation, CV (%). The analyses were performed five times.

2.4.4. Precision

Precision was evaluated in parameters of repeatability and intermediate precisions. Repeatability and intermediate precisions of proposed method were determined by analysis of three replicates of sample solutions of naproxen according to ICH [47]. The precisions were described on the basis of the band areas obtained and expressed as coefficient of variation, CV (%).

2.4.5. Detection Limit (LOD) and Quantification Limit (LOQ)

The low range of concentrations of naproxen were used to determination of LOD and LOQ. Detection and quantification limits were calculated from formulas which have been featured in other publications [18,49,50]. The analyses were performed six times.

2.5. Densitometric and Spectrodensitometric Analysis

TLC Scanner 3 (Camag, Muttenz, Switzerland) operated in the absorbance mode and controlled by winCATS 1.4.2 software was used to densitometric and spectrodensitometric investigations. Densitometric scanning was performed in a MLW (multi-wavelength) mode from 200 to 380 nm, at wavelength intervals of 30 nm at each step.

2.6. Photographs of TLC Chromatograms

The chromatograms placed in the UV viewing cabinet (Camag, Muttenz, Switzerland) at wavelength of 254 nm and 366 nm, respectively have been photographed using a digital camera Nikon Coolpix L20 (Nikon Coorporation, Tokyo, Japan)—see Supplementary Materials.

2.7. Statistical Evaluation of Data

Statistical analysis was carried out by means of the Statistica 10.0 computer program. Using Statistica the average values of obtained results, standard deviations as well as coefficients of variations were calculated. The Statistica program was also used to determine all parameters needed to validate method (linearity, precision, accuracy, LOD and LOQ).

3. Results and Discussion

This investigation aimed to evaluate the naproxen stability by reliable, rapid, and inexpensive TLC method in combination with densitometry and spectrodensitometry. Naproxen as a member of NSAIDs is commercially available in formulations, e.g., tablets, ointments, as well as in the form of solutions or suspensions, respectively. Hence, development of simple, cost-effective and selective analytical method is regarded as important tool to characterize the stability of naproxen in different pharmaceutical formulations including solutions in current drug analysis. In addition, this can also be useful for the determination of naproxen and products of chemical transformation of naproxen as residues in wastewater, thus to monitor the intake of naproxen by people. Both presented aspects of this study are key to ensure the safety of use the marketed preparations of naproxen. In order to exclude the possible degradation results of UV radiation as well as the kind of solvent, naproxen was found to degrade under different stress conditions.
The study of forced decomposition of an ethanolic solution of naproxen spotted on silica gel plates was treated by exposing a sample to the UV light at λ = 254 nm from 1 to 5 h. Although, in order to check possible degradative effect of the UV light exposure on examined naproxen in form of various solutions, i.e., five solutions of naproxen prepared in saline solution, next in water at pH ≈ 2.60, 5.70, 8.50, respectively and also that prepared in oxidizing reagent (i.e., 30% hydrogen peroxide) have been examined under the same stress conditions (UV light λ = 254 nm). Densitometric analysis of chromatograms obtained during each step of conducted stability test allowed to show and to characterize (by RF values and maximum absorption) the number of degradation products of naproxen produced during this degradation study. Based on the measurements of band area (AU) of examined naproxen and its degradation products, the conditions that caused the maximum degradation of this compound were chosen. In order to find the most suitable mobile phase, several mobile phases containing different volume compositions of glacial acetic acid, toluene, acetone, ethyl acetate, n-hexane, cyclohexane, methanol, chloroform, benzene, and acetonitrile including also the mobile phases previously reported by Starek, Krzek et al. [20,51] were tested. Finally, the two described in current study mobile phases composed of TOL-ACE-CHL (2:5:12, v/v/v) and AcOH-Hex-ACE(0.10:10:10, v/v/v) giving compact bands with a proper RF value of naproxen and related substances i.e., naproxen ethyl ester (S2), and its degradation products. Described mobile phases enabled complete separation from two up to six degradation products of naproxen.

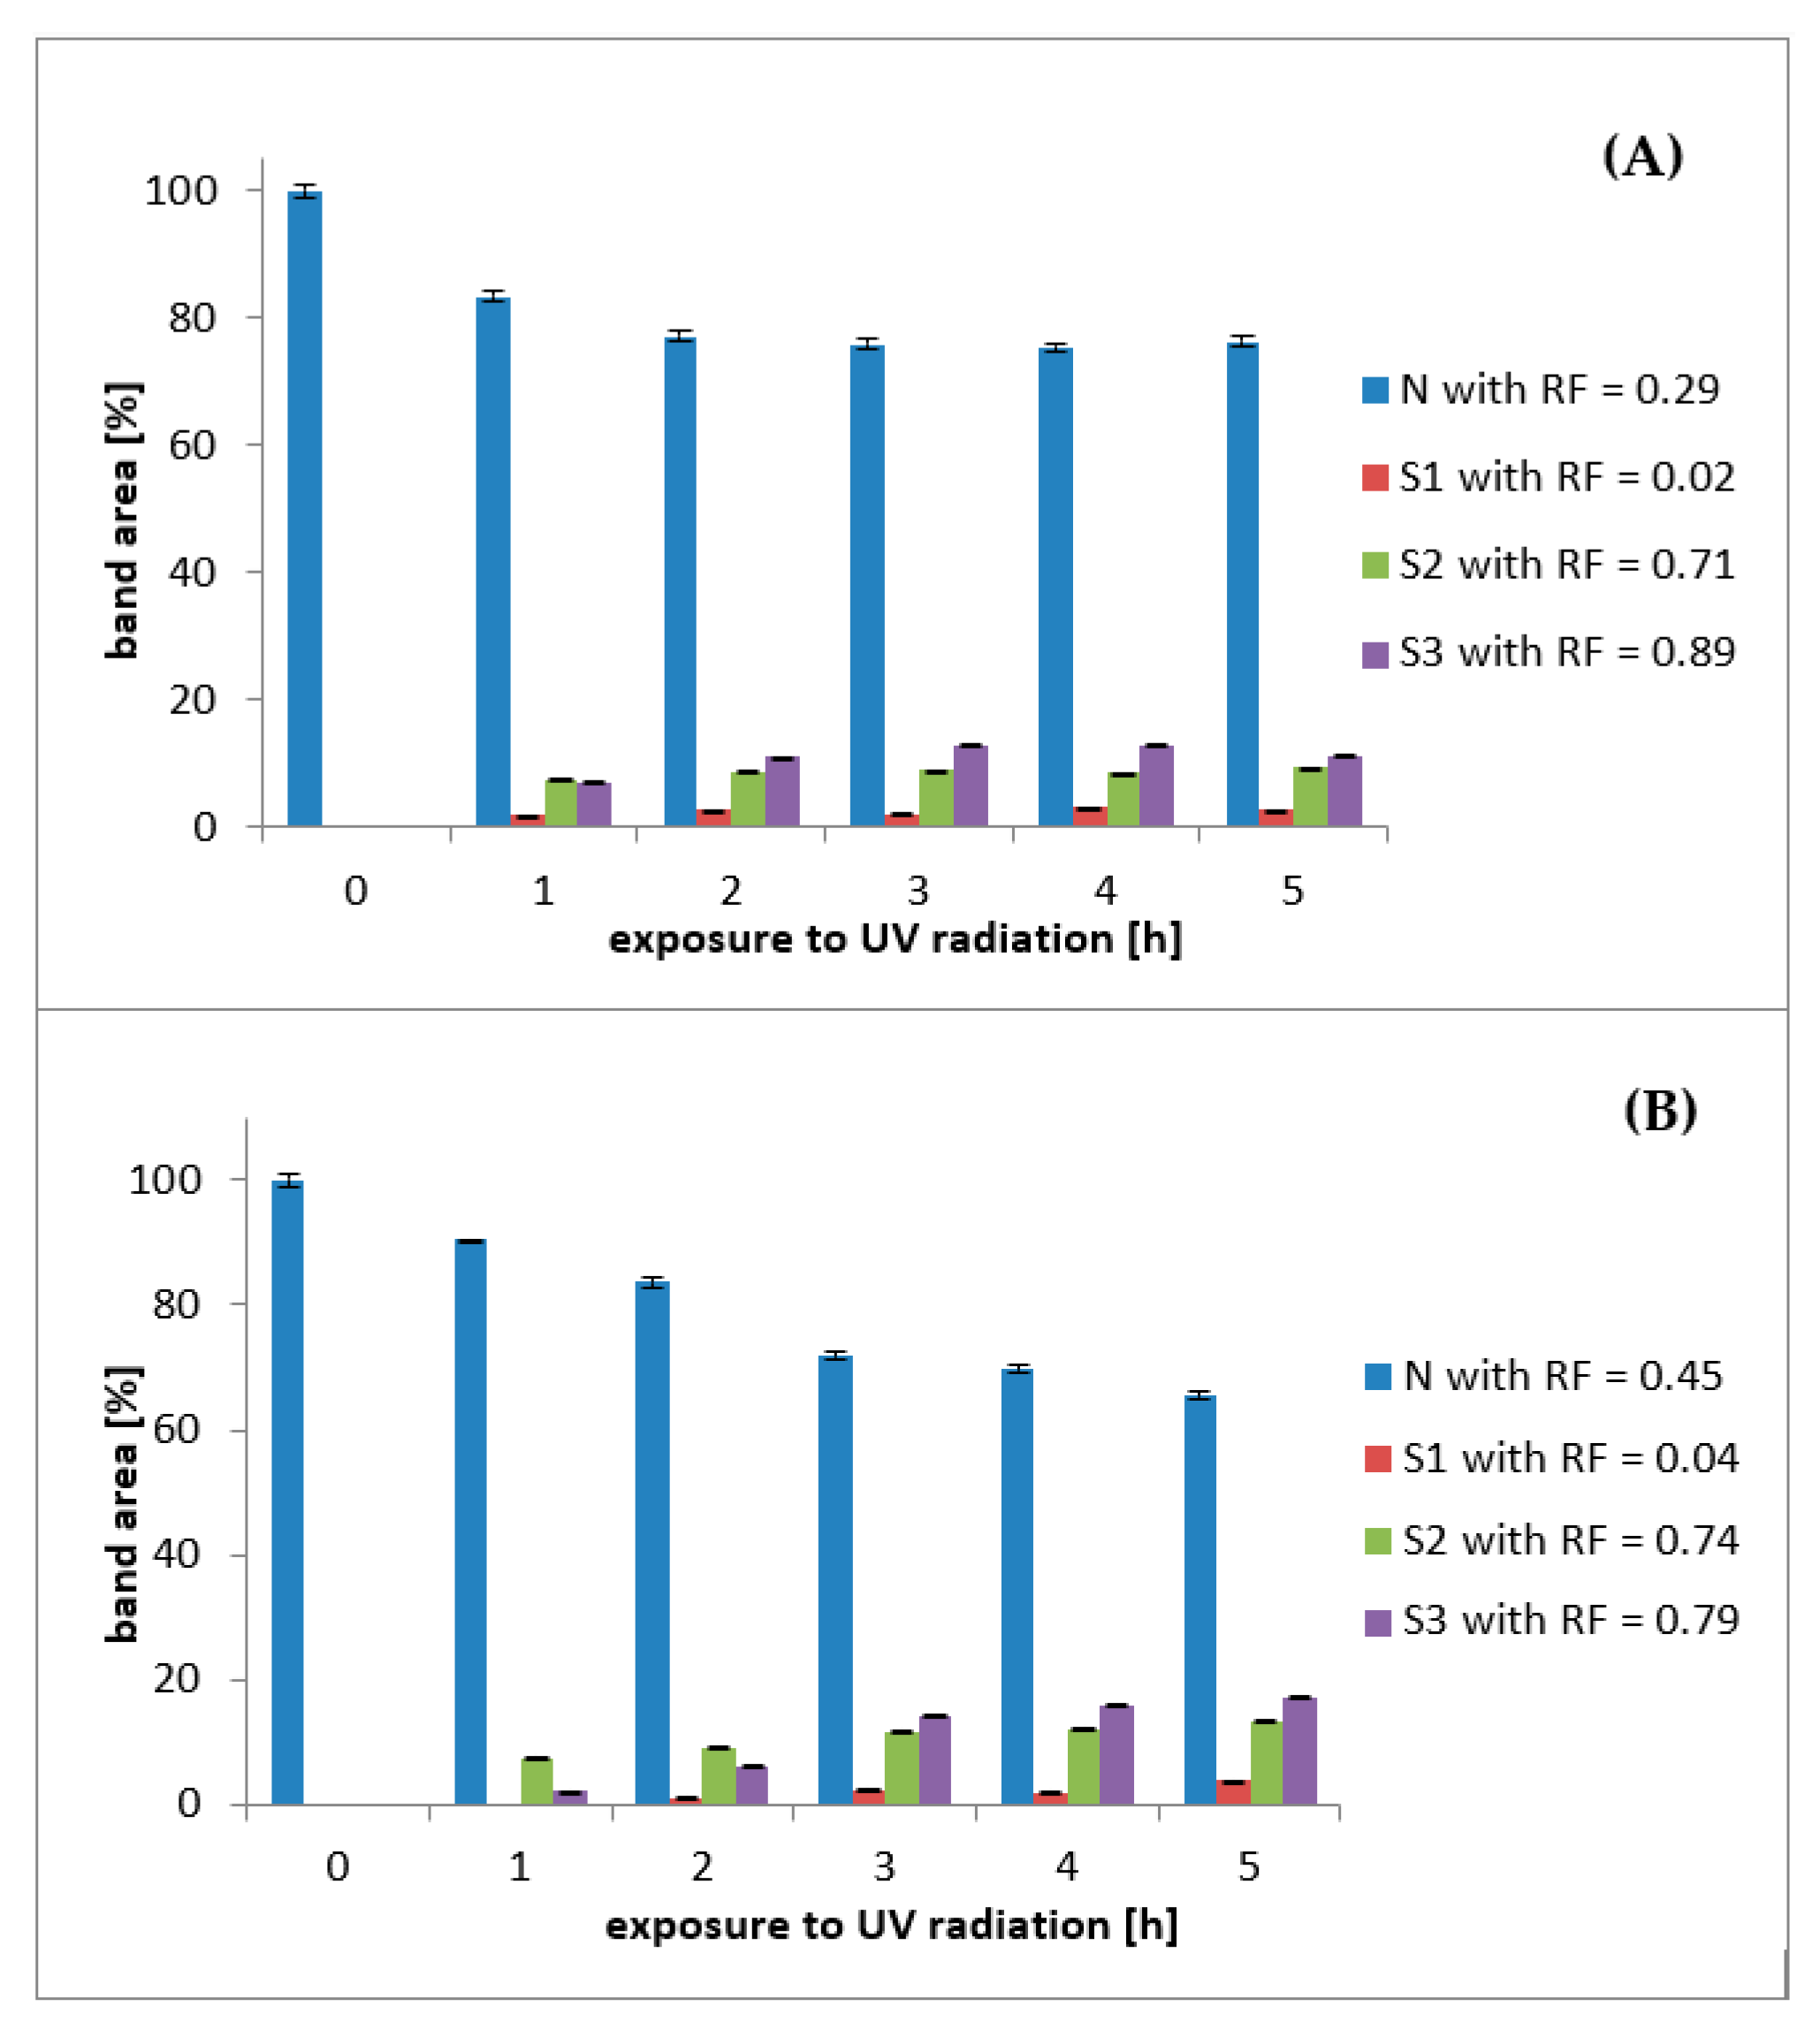
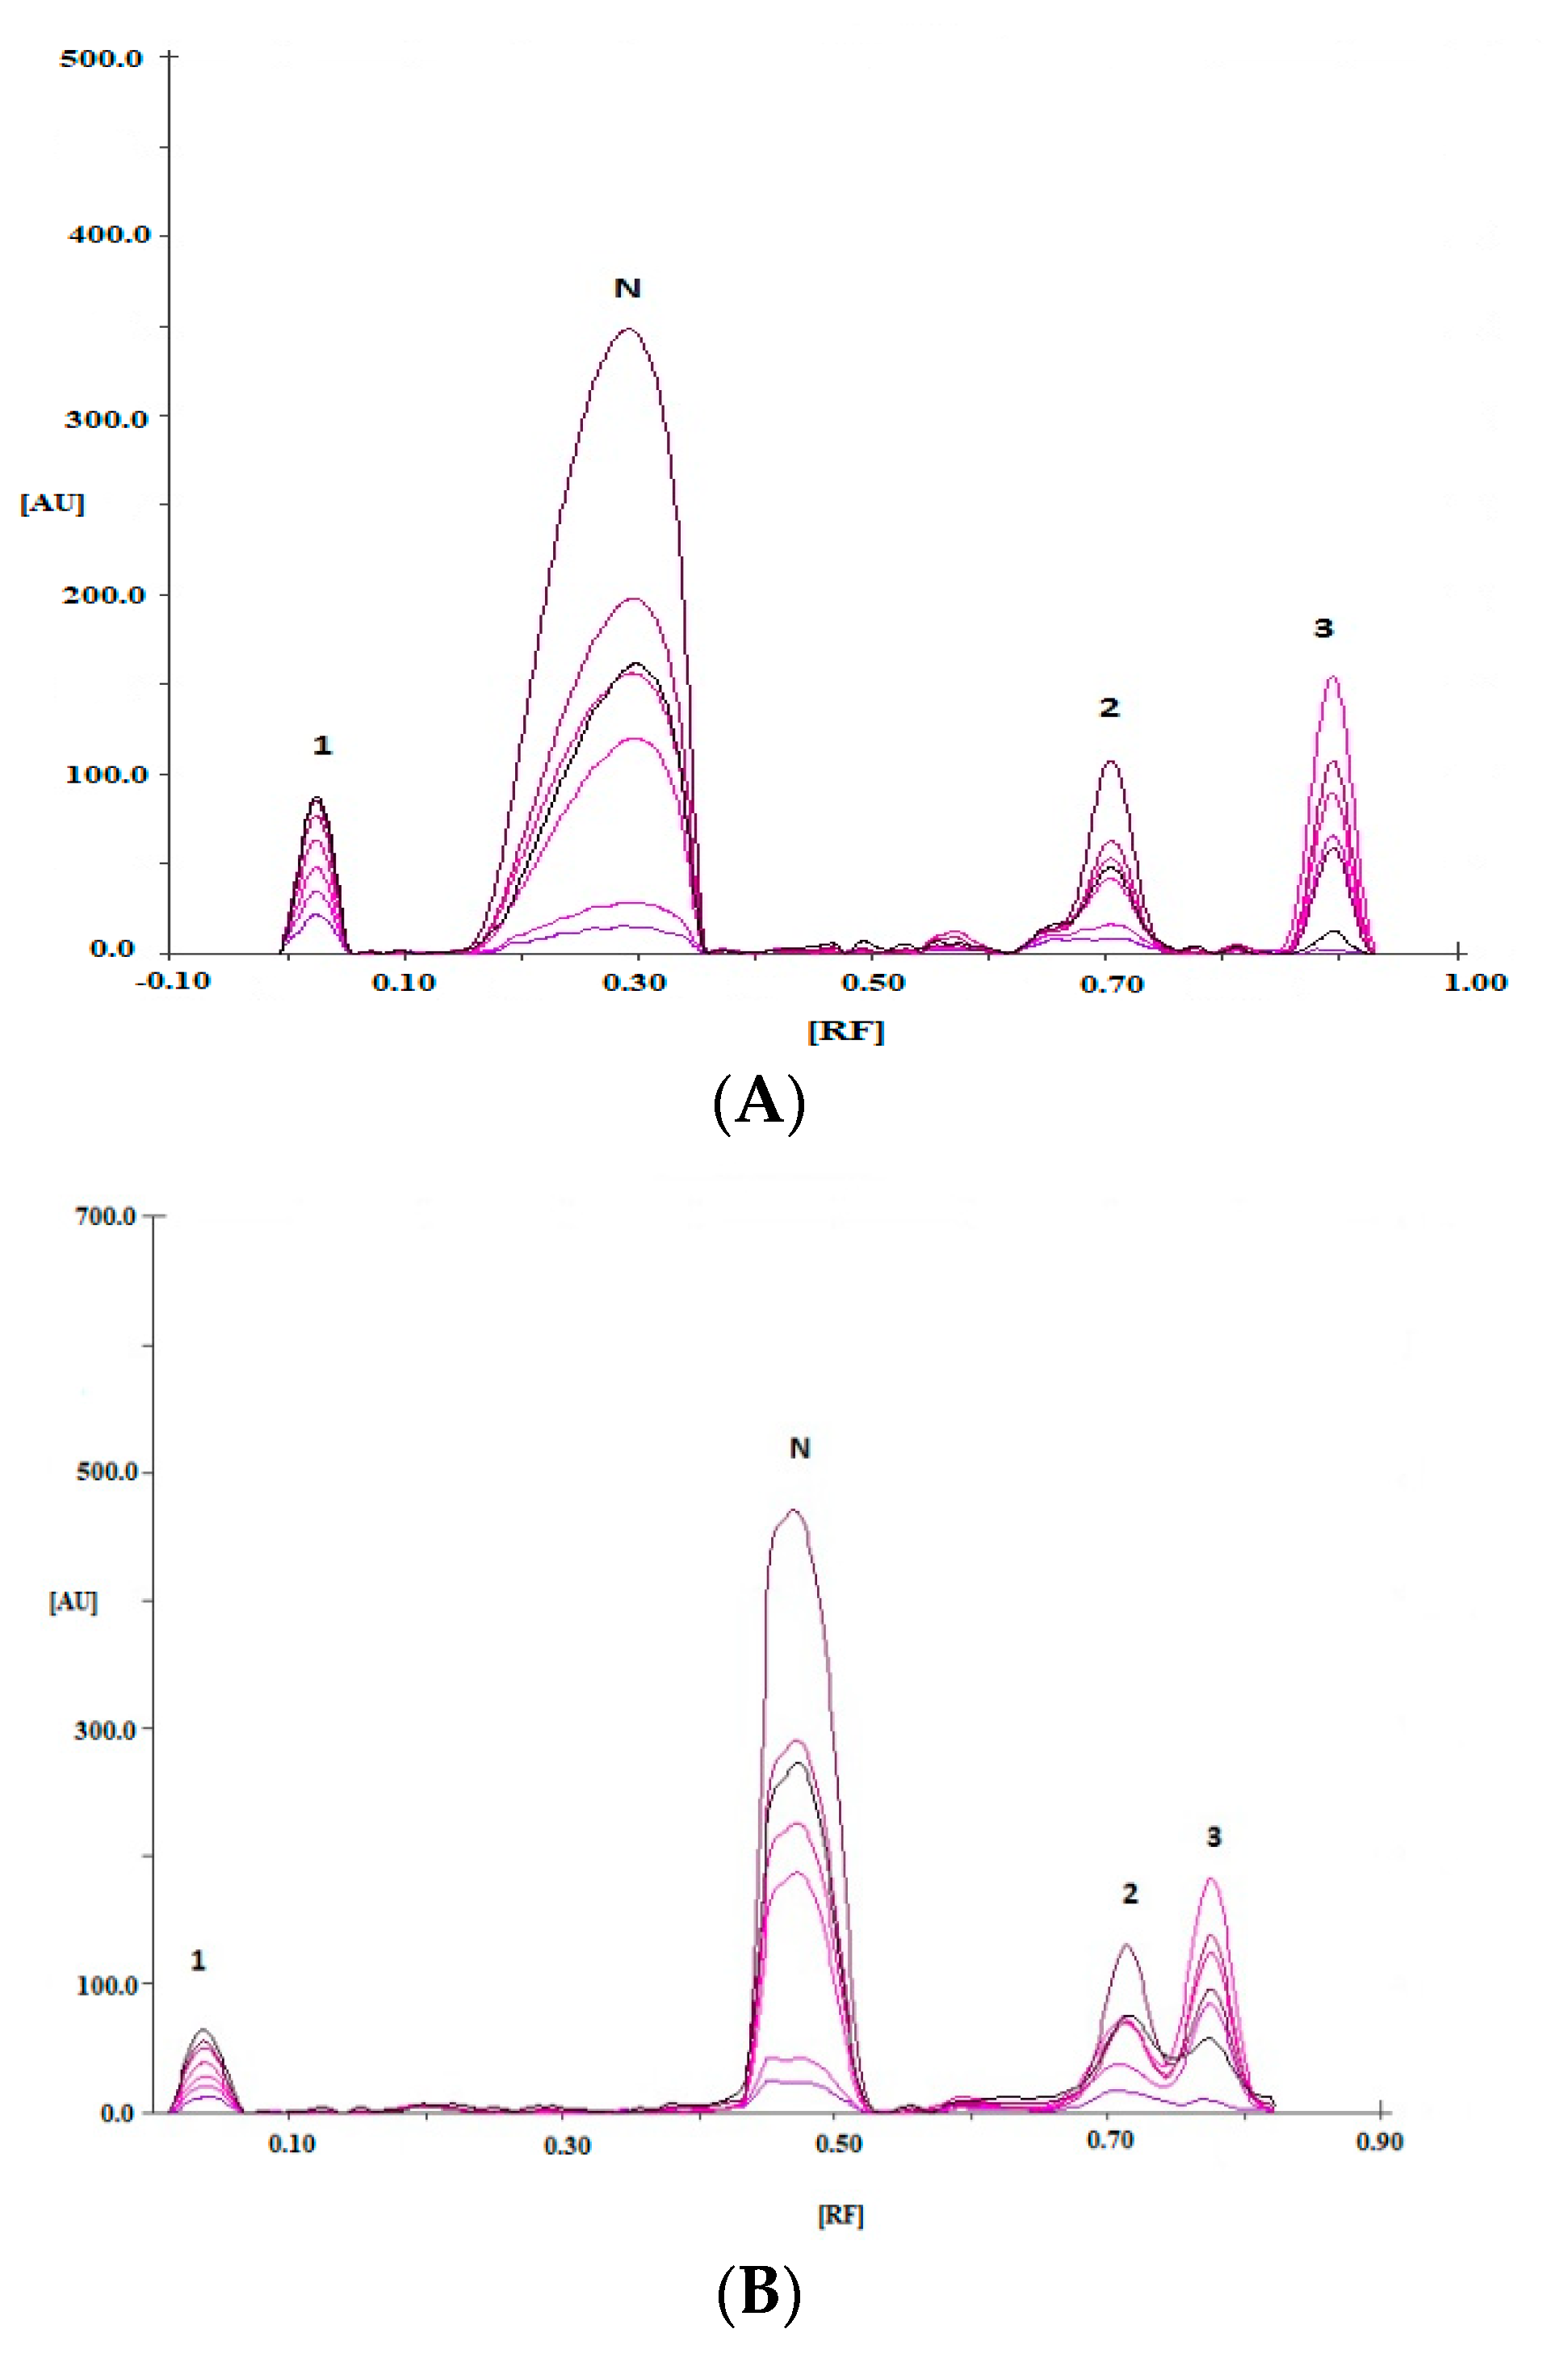
3.1. Chemical Stability (Effect of UV Radiation) Study of Naproxen on Silica Gel

As is was accurately described in experimental part of this work, in order to describe the effect of UV radiation on the naproxen stability on silica gel, an ethanolic solution of naproxen was spotted onto chromatographic plate and next it was irradiated to UV light (254 nm) for 1 h, 2 h, 3 h, 4 h and 5 h, respectively. This study was carried out by using the two mobile phases: (A) TOL-ACE-CHL (2:5:12, v/v/v) and (B) AcOH-Hex-ACE(0.10:10:10, v/v/v).
Comparison the area of chromatographic bands of both i.e., sample solution of naproxen which was irradiated to UV light (λ = 254 nm) from 1 to 5 h on silica gel and also reference standard solution of naproxen (not exposed to UV) but analyzed like sample by using mobile phase consisted of TOL-ACE-CHL (2:5:12, v/v/v) and AcOH-Hex-ACE (0.10:10:10, v/v/v) is presented in Figure 1A,B.
Figure 1 indicates the progress of degradation process of naproxen i.e., decrease of naproxen peak area in (%) at the expense of new peaks (S1, S2 and S3) obtained during conducted degradation study under UV radiation.
Next Figure 2 confirms the fact, that after chromatographic separation of obtained mixture by using of mobile phase consisting of TOL-ACE-CHL (2:5:12, v/v/v), four chromatographic bands, thus three degradation products except for the examined naproxen are shown on the densitograms of naproxen, which was irradiated to UV light (254 nm) for 1 h, 2 h, 3 h, 4 h and 5 h on silica gel. The RF values of them are equal to 0.02; 0.29; 0.70 ÷ 0.71 and 0.89 ÷ 0.90, accordingly. Chromatographic band with RF equal to 0.29 relates to naproxen, while the peaks with RF equal to 0.02 and 0.70 ÷ 0.71 and 0.89 ÷ 0.90, respectively belong to the products of its chemical changes after exposition to UV radiation (λ = 254 nm) from 1 to 5 h. The degradation product with RF equal 0.70 ÷ 0.71 was identified as naproxen ethyl ester. Confirmation the observed changes are photos (presented in Supplementary Materials) of the original chromatograms of naproxen treated with UV radiation which have been made in UV cabinet at λ = 254 and λ = 366 nm, respectively. Densitograms of naproxen, which was irradiated to UV light (λ = 254 nm) for 5 h on silica gel after separation with a mobile phases: TOL-ACE-CHL in a volume of 2:5:12 and AcOH-Hex-ACE (0.10:10:10) are shown in Figure 2A,B, accordingly. The peak area of naproxen was equal to 37,896 AU (that correspond to 100%), and RF was equal to 0.44. Generally, three chromatographic bands were visible on densitogram of naproxen, which was irradiated to UV light for 1 h on silica gel as well as after separation using a mixture of AcOH-Hex-ACE (0.10:10:10, v/v/v) as mobile phase. After 2, 3, 4 and 5 h of exposure to UV radiation of naproxen on silica gel the four chromatographic bands can be seen. The RF values were equal to 0.03 ÷ 0.04 (for naproxen exposed to UV radiation from 2 to 5 h); 0.45 ÷ 0.47; 0.71 ÷ 0.75 and 0.78 ÷ 0.81, respectively. The chromatographic band with RF equal to 0.45 ÷ 0.47 belonged to naproxen, while the peaks with RF equal to 0.71 ÷ 0.75 and 0.78 ÷ 0.81 related to the degradation products of naproxen irradiated to UV light from 1 to 5 h. Next peak with RF= 0.03 ÷ 0.04 was the effect of naproxen exposition to UV light from 2 to 5 h. The degradation product with RF equal 0.71 ÷ 0.75 was identified as naproxen ethyl ester. It was stated that the largest changes occurred during 5 h of exposure to UV radiation of naproxen on silica gel.

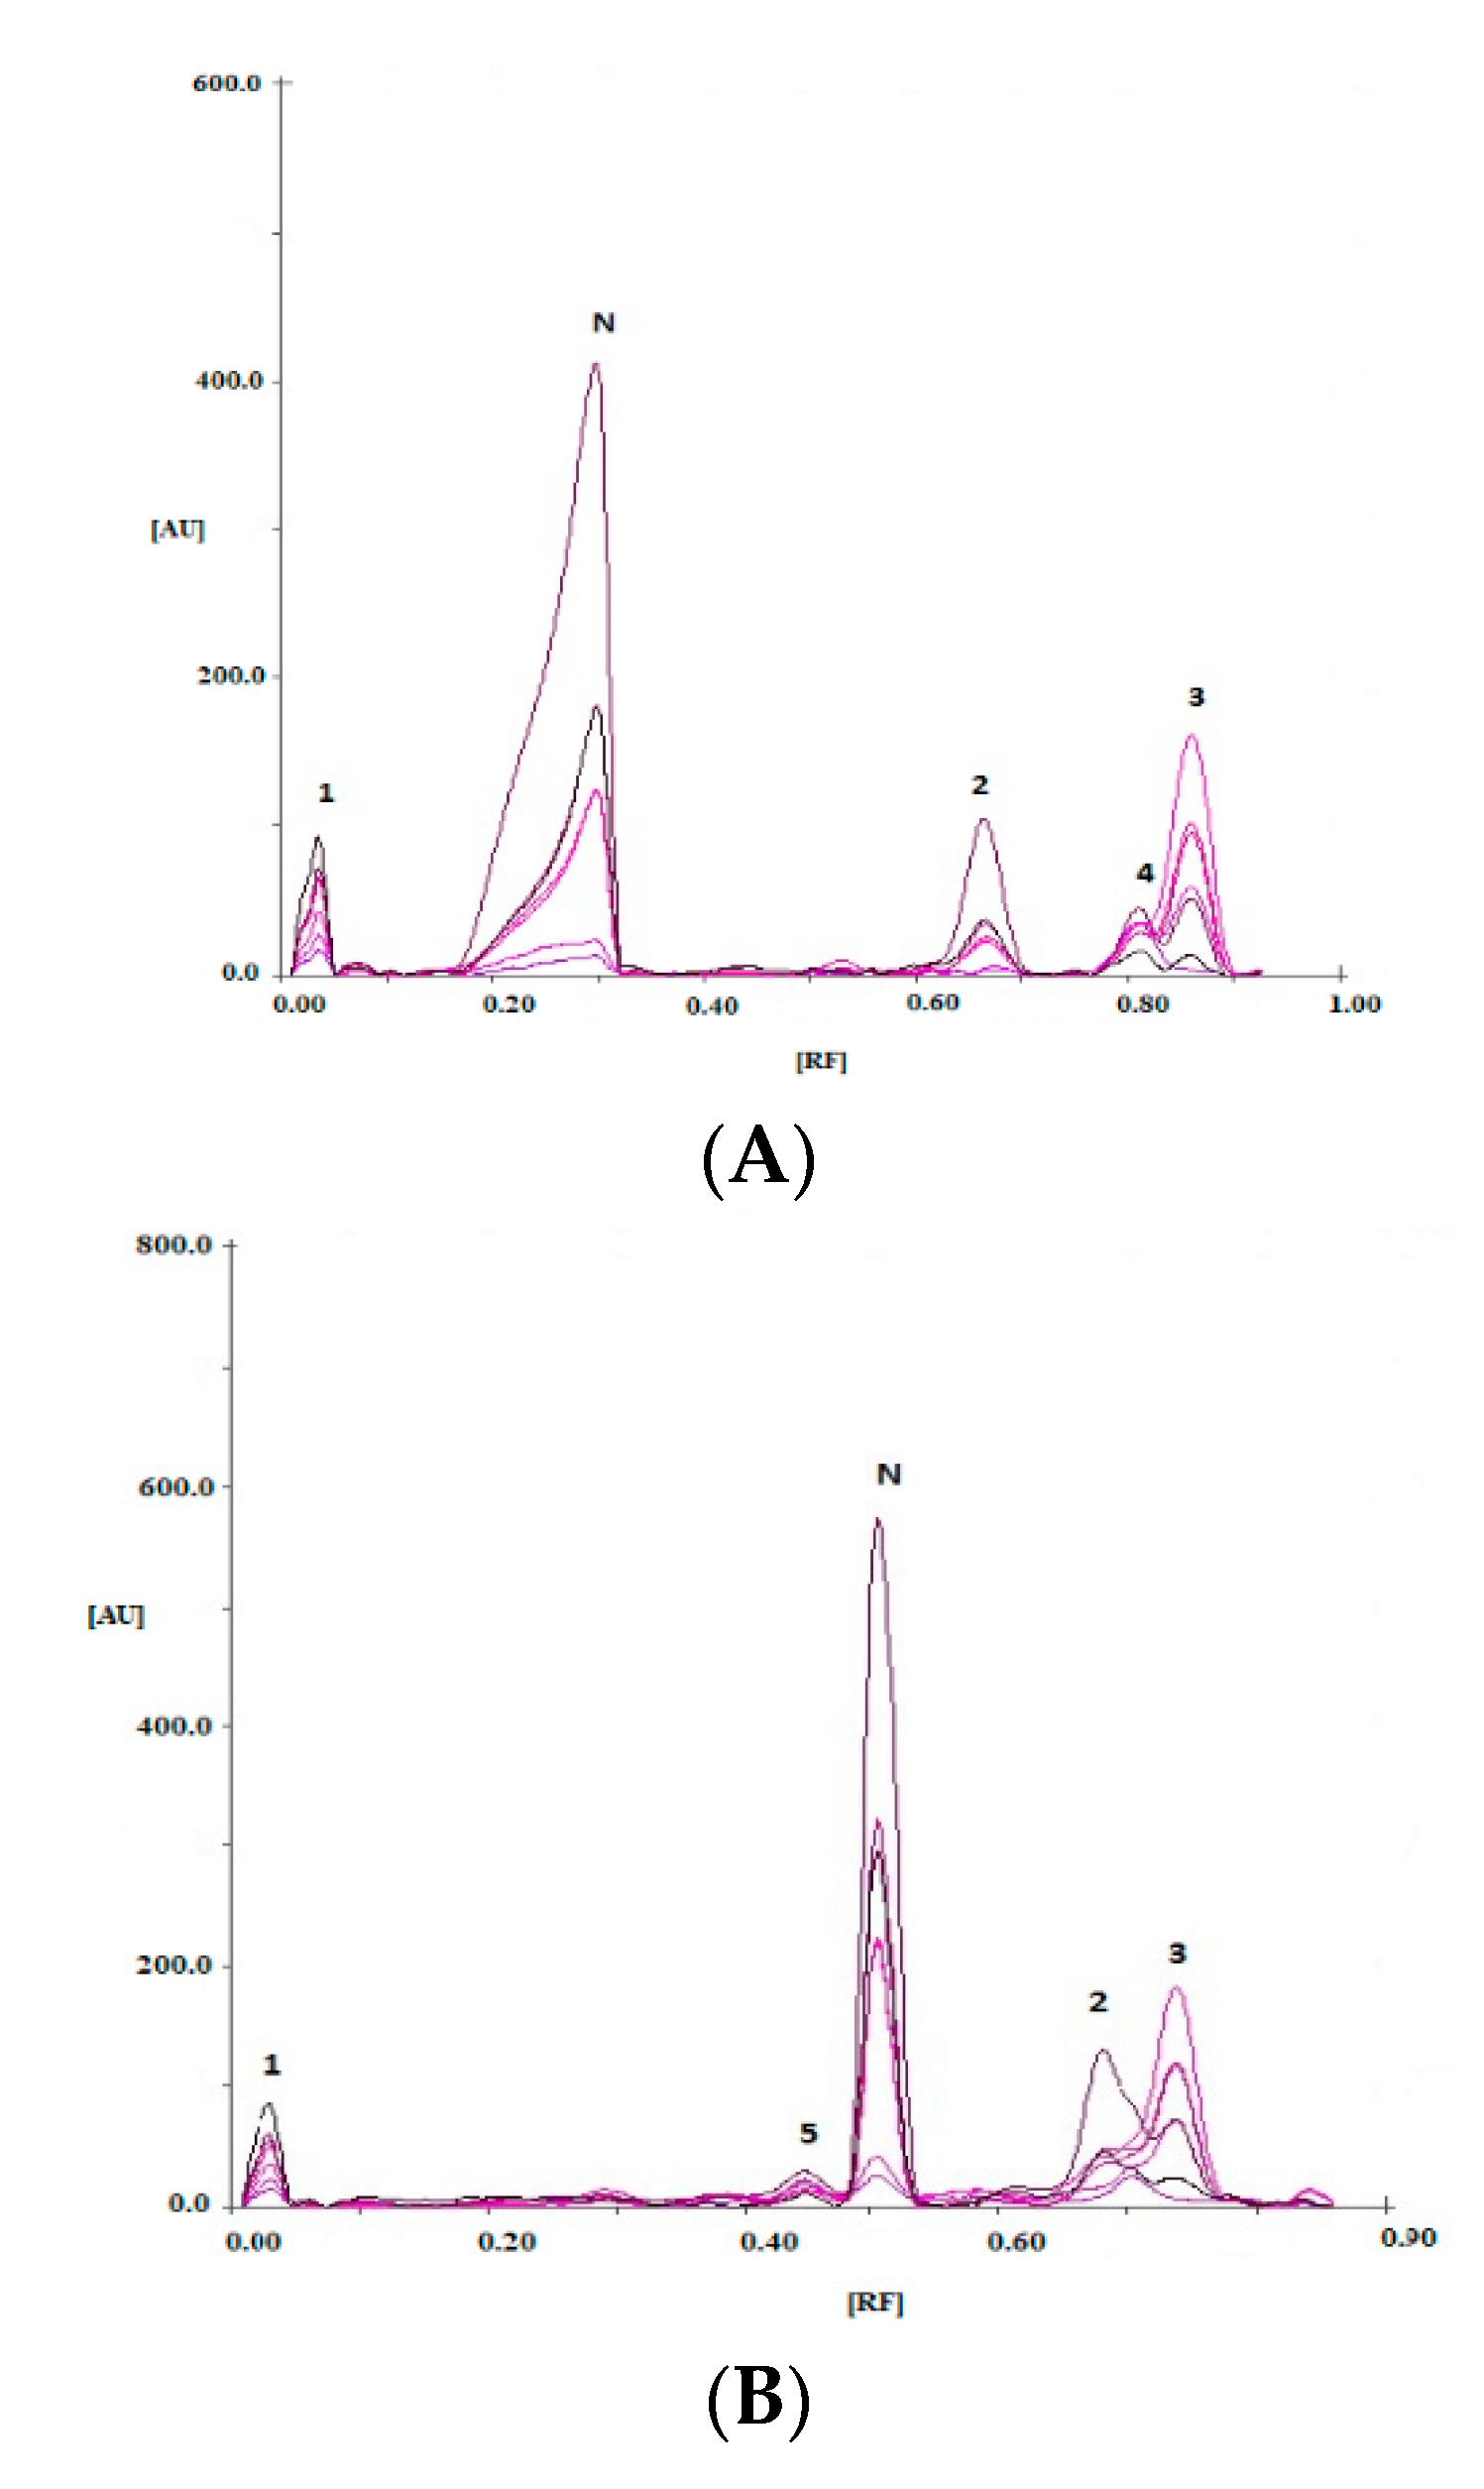
3.2. Stability Study of Naproxen Examined in Form of Proper Solutions Exposed to UV Radiation

Stability of naproxen in the form of solutions denoted as II, III, IV, V and VI (its composition was well described in materials and methods part) was examined by their irradiate to UV light (254 nm) from the top during 5 and 10 h. Then these solutions were spotted onto chromatographic plates together with an ethanolic solution of naproxen (reference standard—solution I). This analysis was carried out by two mobile phases A and B. In estimation the stability of the individual solutions of naproxen (II–VI) exposured to UV light at λ = 254 nm, the results shown in Table 1, which represent the changes in the appearance of the tested solutions of naproxen during 5 and 10 h exposure to UV light, can be also very helpful in visual control of quality and stability of naproxen.

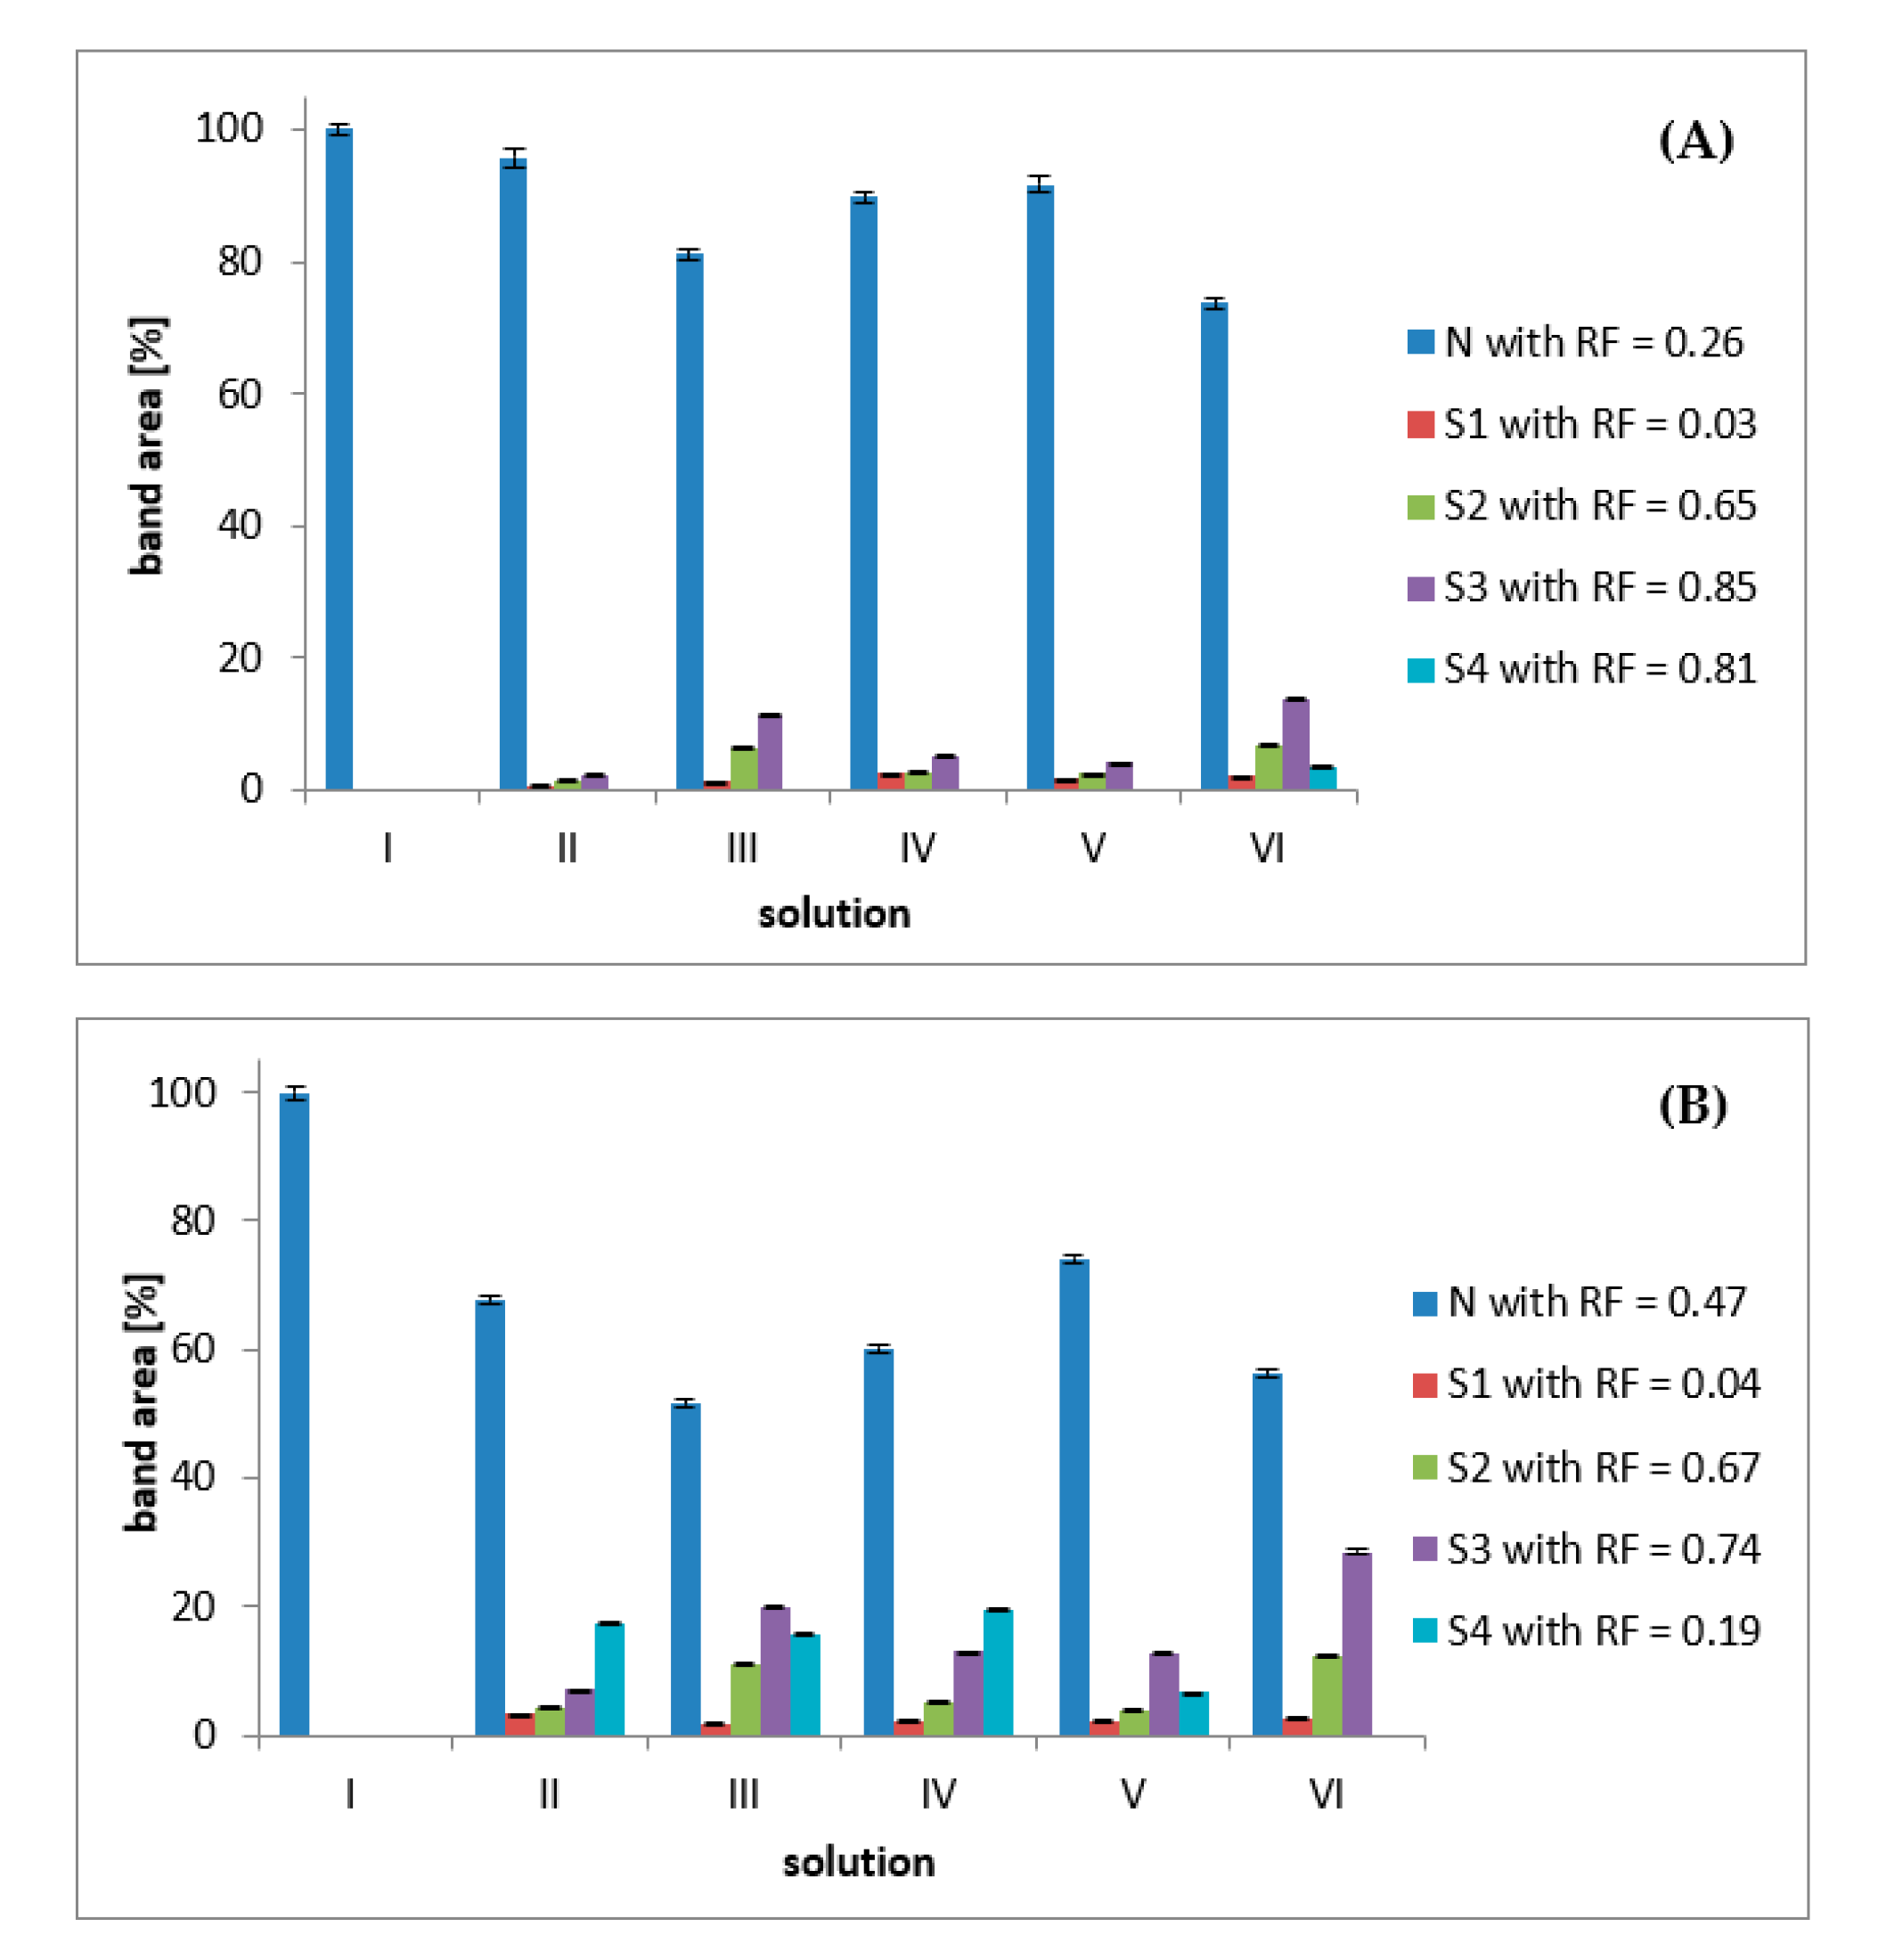
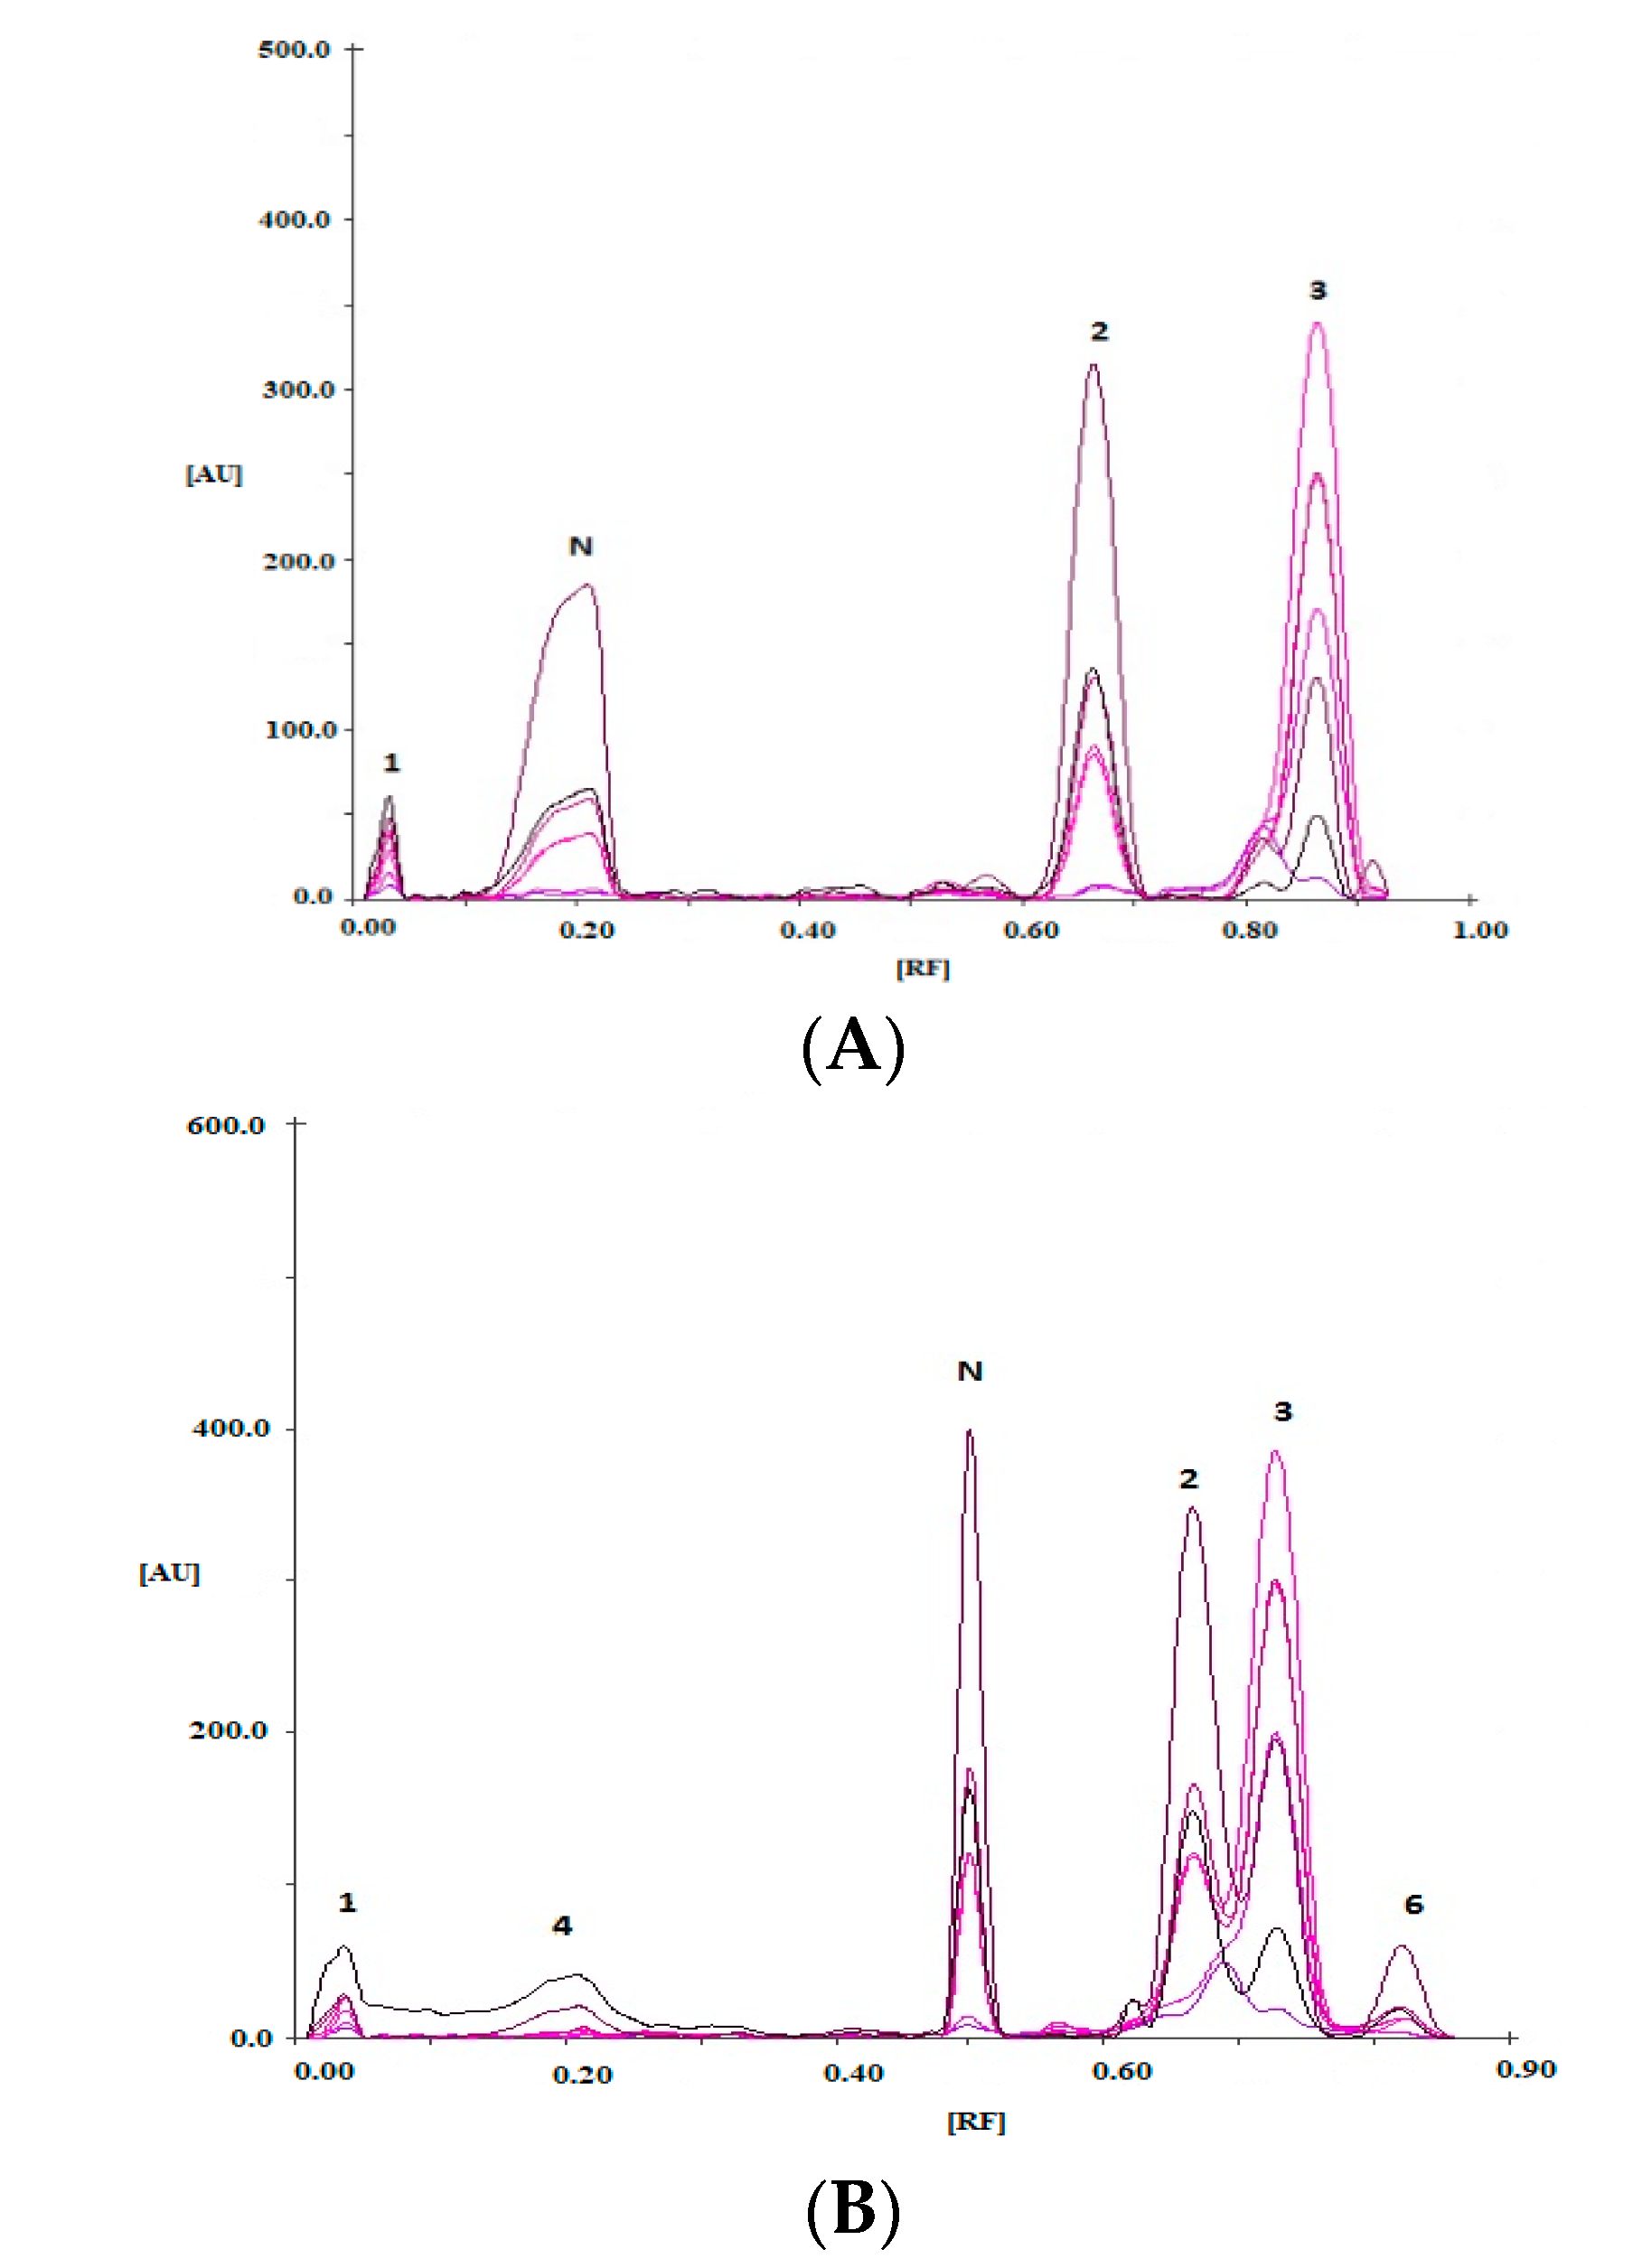
3.2.1. Estimation of Stability of Naproxen in Form of Solutions after 5 h of Exposure to UV Radiation

There were four chromatographic bands in the case of solutions II, III, IV, and for solution VI—five chromatographic bands can be observed on densitograms of naproxen after 5 h of exposure to UV light (Figure 3A). The obtained RF values were respectively: 0.03 ÷ 0.04; 0.25 ÷ 0.31; 0.65 ÷ 0.66; 0.85 ÷ 0.86 as well as 0.81 (for solution VI) using TOL-ACE-CHL in volume composition 2:5:12 as mobile phase A. The chromatographic bands characterized by RF = 0.25 ÷ 0.31 and RF = 0.65 ÷ 0.66 were from naproxen and naproxen ethyl ester, respectively. The peaks with RF = 0.03 ÷ 0.04 as well as 0.85 ÷ 0.86 and 0.81 were from unknown products of chemical changes of naproxen exposure to UV light during 5 h. The most visible changes were after 5 h of exposure in solution VI, in which the solvent was hydrogen peroxide. The area of chromatographic band of naproxen was then 30,519 AU, which is 73.68% of total peak area of naproxen and products of its degradation.
Further analysis confirmed that there were four chromatographic bands formed in the case of solution VI, but the number increased in the case of solutions II, III, IV and V i.e., there were five chromatographic bands visible on densitograms of naproxen after 5 h of exposure using AcOH-Hex-ACE in volume ratio 0.10:10:10 as mobile phase B (Figure 3B). The values of RF were respectively: 0.03 ÷ 0.04; 0.18 ÷ 0.19 (for solutions II–V); 0.47 ÷ 0.49; 0.67 ÷ 0.69 as well as 0.73 ÷ 0.75. The band with RF = 0.47 ÷ 0.49 is from naproxen, but substances with RF which are 0.03 ÷ 0.04 and 0.18 ÷ 0.19 as well as 0.67 ÷ 0.69 (naproxen ethyl ester) and 0.73 ÷ 0.75 were the products of chemical changes of naproxen exposed to UV light during 5 h. The largest changes after 5 h of UV exposure took place in solution III, when the solvent used was water with pH ≈ 2.60. The chromatographic band area of naproxen was 12,790 AU, which is 51.58% of total peak area of naproxen and pollution of products its degradation.

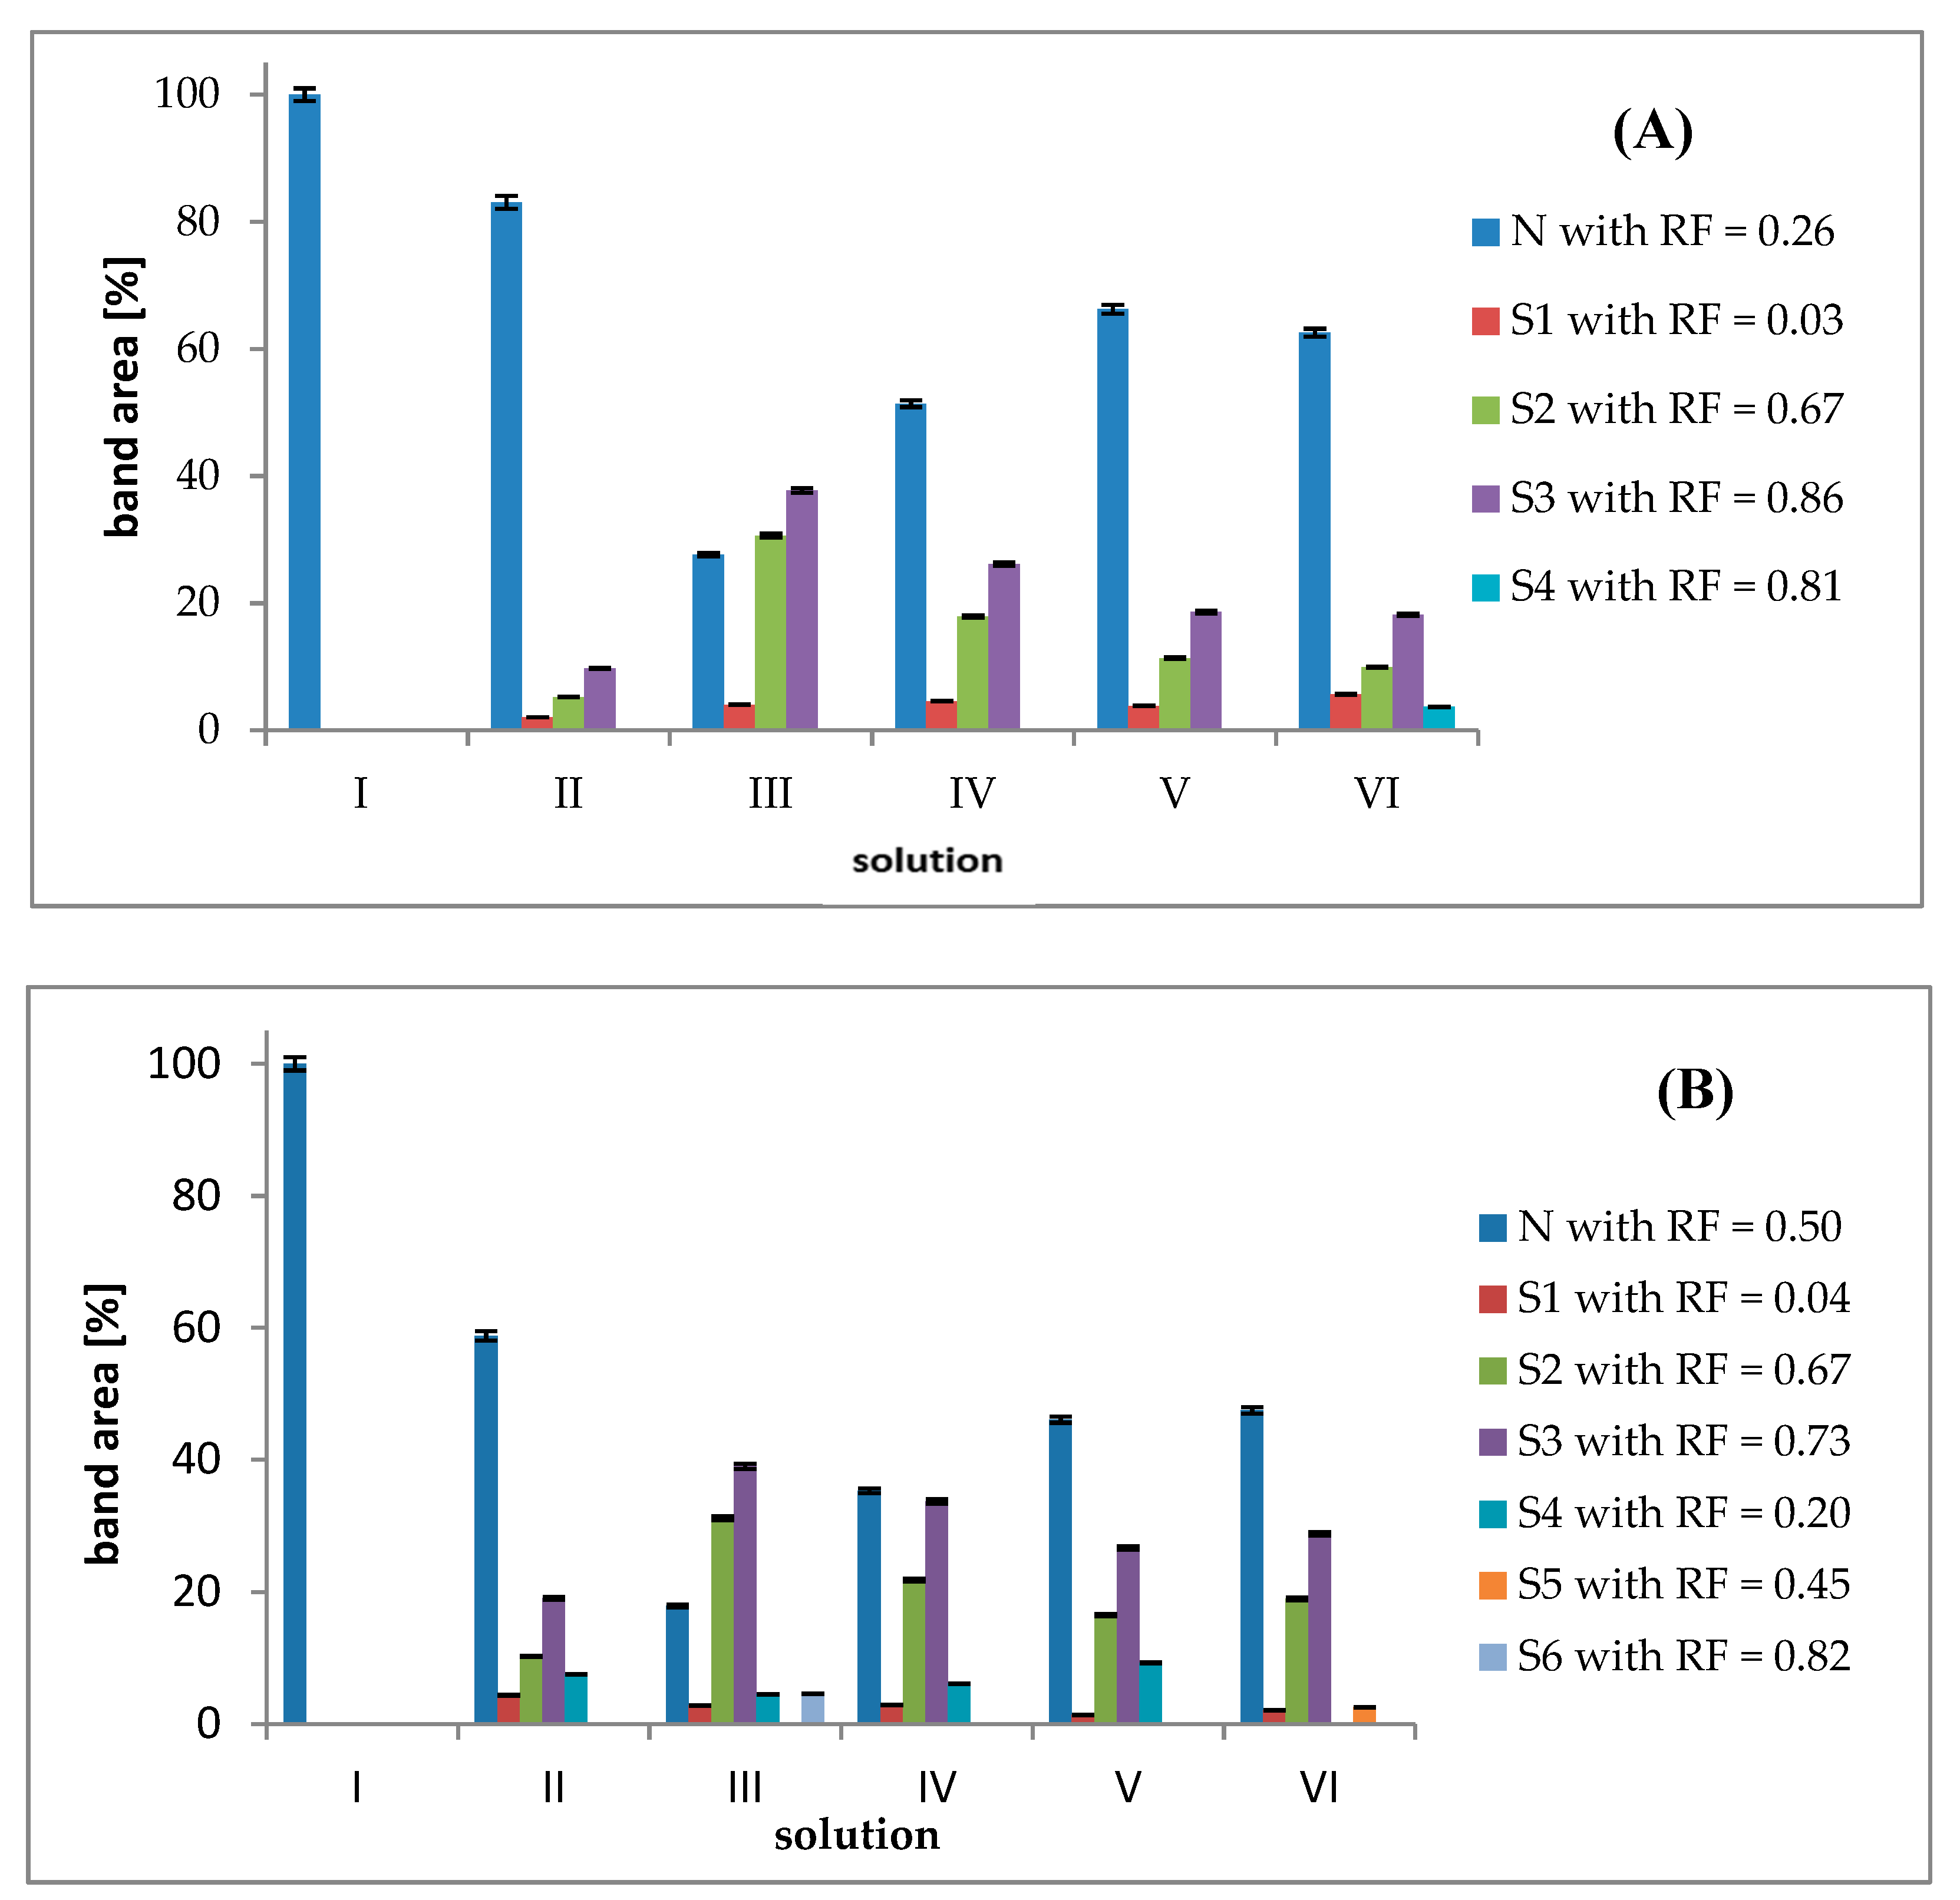
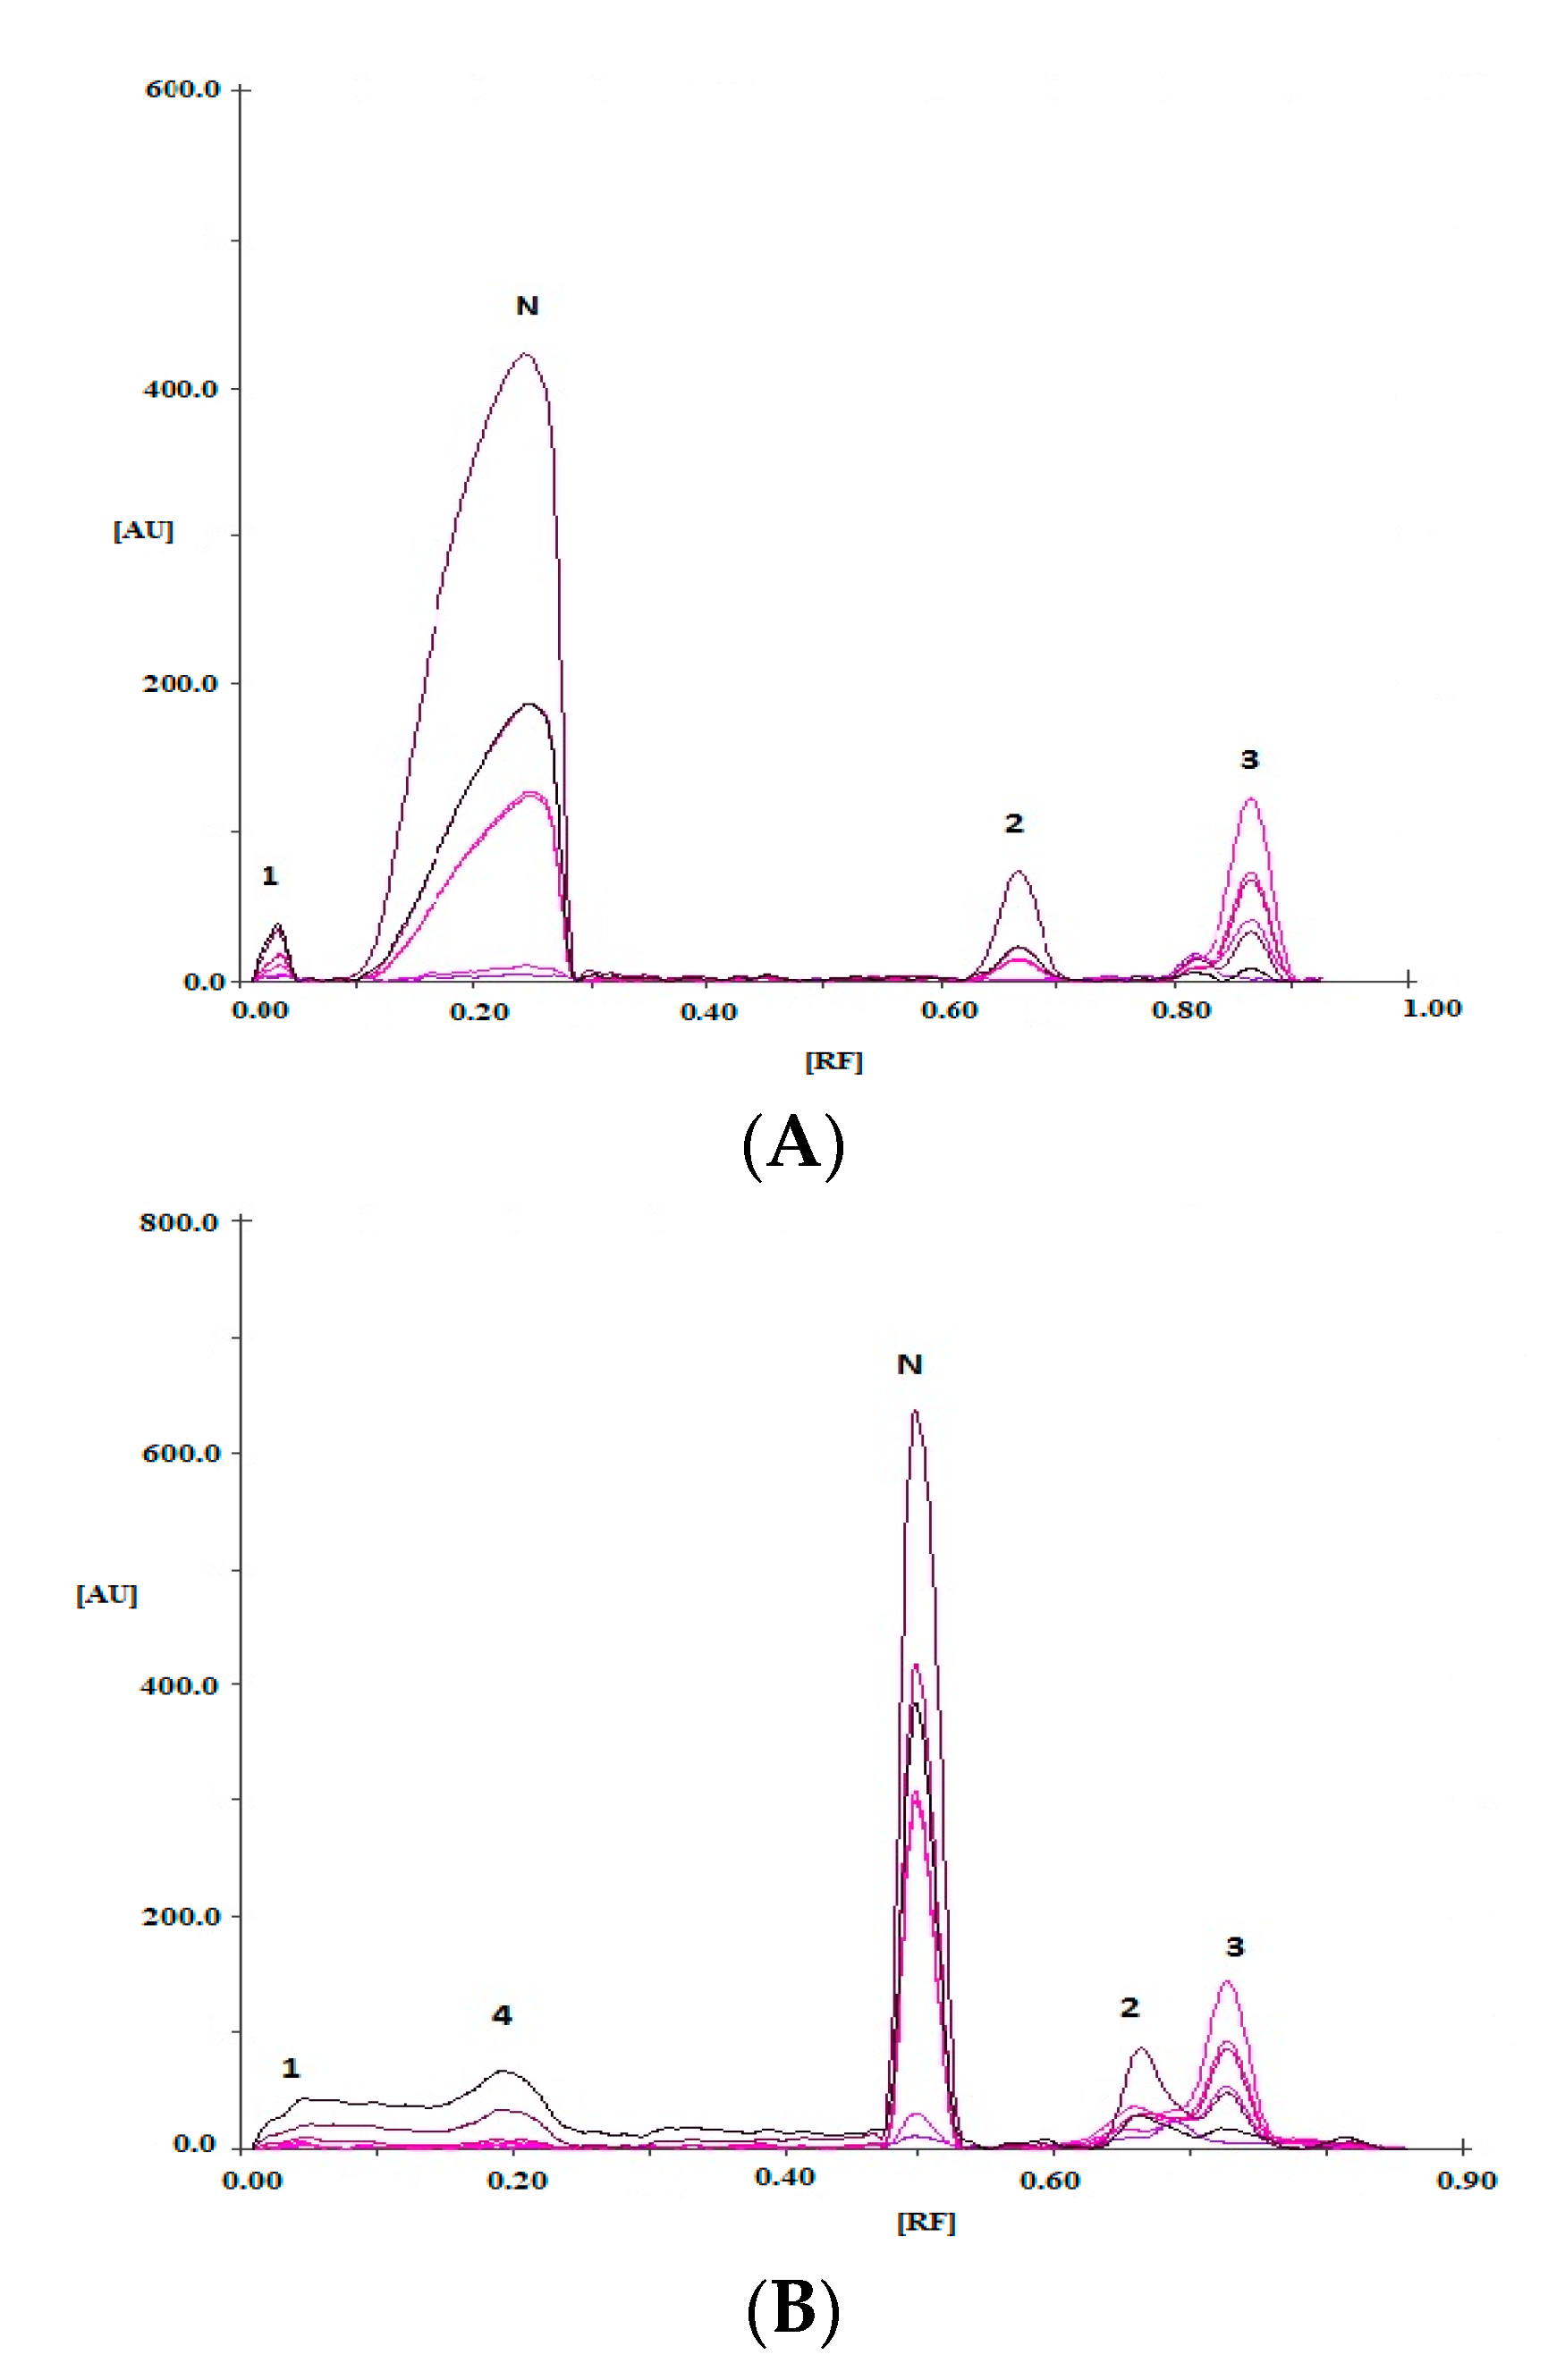
3.2.2. Estimation of Stability of Naproxen in Form of Various Solutions after 10 h of Exposure to UV light

Further studies showed that there were four chromatographic bands in the case of solutions II, III, IV and V, but in the case of solution VI—five chromatographic bands were visible on densitograms of naproxen after 10 h of exposure to UV light and next analyzed using TOL-ACE-CHL in volume ratio 2:5:12 as mobile phase A (Figure 4A). The RF values were respectively: 0.02 ÷ 0.03; 0.24 ÷ 0.29; 0.66 ÷ 0.67; 0.85 ÷ 0.87 as well as 0.81 (for solution VI). The band characterized by RF = 0.24 ÷ 0.29 was from naproxen and substances with RF = 0.02 ÷ 0.03 and 0.66 ÷ 0.67 (naproxen ethyl ester) as well as 0.85 ÷ 0.87 and 0.81 were from products of chemical changes of naproxen exposed to UV light during 10 h. It was stated that the amount of substances that occurred as a result of exposure to UV radiation after 10 h was bigger than after 5 h. The largest changes after 10 h of exposure were observed in solution III (Figure 4A, in which the solvent was water pH ≈ 2.60, as was described in experimental part). The area of chromatographic band of naproxen was 9513 AU which was 27.64% of total peak area of naproxen and its pollution. The smallest amount of the products of chemical changes of naproxen were observed in solution II, in which the solvent was saline.
Figure 4B indicates that there were five chromatographic bands on the densitograms of naproxen solutions II, IV, V, VI after 10 h of irradiate (λ = 254 nm), but in the occurrence of solution III a sixth band could be seen after separation using AcOH-Hex-ACE in volume composition 0.10:10:10 as mobile phase. The values of RF were respectively: 0.03 ÷ 0.04; 0.19 ÷ 0.21; 0.45 (for solution VI); 0.50 ÷ 0.51; 0.66 ÷ 0.68; 0.73 ÷ 0.74 and 0.82 (for solution III). The band with RF = 0.50 ÷ 0.51 was from naproxen, and the peaks with RF = 0.03 ÷ 0.04: 0.19 ÷ 0.21; 0.45; 0.66 ÷ 0.68 (naproxen ethyl ester); 0.73 ÷ 0.74 as well as 0.82 belonged to the products of chemical changes of naproxen exposed to UV radiation during 10 h. It was stated, that the amount of substances occured as a result of irradiate to UV radiation after 10 h are larger than after 5 h. The largest changes after 10 h of exposure were in solution III, in which the solvent was water at pH ≈ 2.60. The area of chromatographic band of naproxen is 5956 AU, what is 17.91% of total of area of spot of naproxen and its pollution. The smallest amount the products of chemical changes of naproxen was stated in solution II in which the solvent was saline. Next Figure 5, Figure 6 and Figure 7 show exemplary densitograms of solutions II, III and VI of naproxen irradiated for 10 h after developing with mobile phases A and B, respectively.
Full characteristics the chromatographic bands of naproxen and the products of its chemical changes appeared as a result of UV light exposure (λ = 254 nm) are showed in Table 2.
Several, but mostly HPLC and UPLC methods have been reported to examine naproxen and its related compounds (impurities) in pharmaceutical formulations [9,10,11,12,13,14].
Both, HPLC and UPLC techniques allowed the separation of four [9,10,13], five [14], six [12] and seven [11] potential degradation products (impurities) from naproxen. Naproxen was well separated from all its impurities in each case. In our study, the proposed TLC method allowed the six potential degradation products from naproxen to separate well. Elaborated TLC-densitometric method was comparable to HPLC and UPLC method in terms of detection the number of degradation products of naproxen.
The areas of chromatographic bands of naproxen and its degradation products which are presented in Figure 1, Figure 2, Figure 3 and Figure 4 were mean values of five analyses with the coefficients of variation indicated in the figures. The coefficients of variation (CV, %) for the determined areas of the chromatographic bands were not greater than 1%. These results indicated a small spread of results obtained.

3.3. Validation of Methods

Summarized effects of validation process of elaborated in this work thin layer chromatography methods are presented in Table 3 and Table 4.

3.3.1. Specificity

All obtained densitograms indicate that the proposed chromatographic conditions ensure the separation of potential impurities from naproxen. Chromatographic analysis of degraded naproxen samples with mobile phase A consisted of TOL-ACE-CHL (2:5:12, v/v/v) enables identification of four peaks (three unknown degradation products of naproxen and naproxen ethyl ester). The use of the second mobile phase B: AcOH-Hex-ACE (0.10:10:10, v/v/v) allowed the separation and identification of five peaks, thus four unknown products of naproxen degradation and naproxen ethyl ester induced by UV radiation at λ = 254 nm.

3.3.2. Accuracy

The accuracy of the method was investigated by measurement of recovery. Naproxen content quantitative recoveries of 99.1 ÷ 101.8% and 98.4 ÷ 102.3% were obtained using mobile phase A and B, respectively (Table 3 and Table 4). The calculated variation coefficients were less than 2% which indicates that elaborated TLC-densitometric method is accurate.

3.3.3. Linearity and Range

The elaborated TLC-densitometric method was found to be linear for naproxen in concentration range of 0.04−1.00 μg spot −1 (n = 14) for analysis using mobile phase A. The plot (n = 11) was linear in the range 0.08 to 1.00 μg spot −1 for analysis using mobile phase B. The regression data presented in Table 3 and Table 4 revealed a good linear relationship over the concentration range studied.

3.3.4. Precision

Repeatability and intermediate precisions were determined on the basis of three different concentrations of naproxen and expressed as the coefficients of variation (CV, %), which are shown in Table 3 and Table 4. The method was precise because coefficient of variation was less than 2%.

3.3.5. Detection (LOD) and Quantification (LOQ) Limits

Under the experimental conditions used, the lowest amount of naproxen that could be detected LOD as well as quantified LOQ of naproxen were 0.013 μg spot −1 and 0.040 μg spot −1 using mobile phase A, respectively. Detection and quantification limits of naproxen were 0.026 μg spot −1 and 0.080 μg spot−1 using mobile phase B, respectively. It indicates that the elaborated TLC-densitometric method was sensitive. In addition, the results of LOD received of presented method using mobile phases A and B were better than naproxen content determined by Krzek and Starek, which was 0.030 μg spot −1 [20] and 0.080 μg spot −1 [51], respectively.

4. Conclusions

The developed TLC method combined with densitometry and spectrodensitometry has been found to be an important tool for the determination the chemical stability of naproxen under different stress conditions. Densitograms shown in this work confirm that examined naproxen indicates in the studied UV range, i.e., from 200 to 380 nm, four characteristic absorption bands placed (at λ = 229 nm, at λ = 272 or at λ = 273 nm, at λ = 316 or at λ = 317 or at λ = 318 nm as well at λ = 329 or at λ = 330 nm), but the maximum absorption wavelength (λmax) is exactly at the wavelength of 229 nm. The most significant changes of naproxen (i.e., formation of unknown degradation products and naproxen ethyl ester, respectively) can be observed after UV exposure the chromatographic plates with spotted naproxen to UV light (λ = 254 nm). In this case three substances can be seen as the products of chemical changes of naproxen under these stress conditions. Their amount increases over the time of this UV exposure. In addition, the impact the time of naproxen irradiate to UV radiation and the kind of solvent on the stability of naproxen and its different solutions was also examined during this experiment. Degradative influence of UV radiation on the naproxen stability was stated in all solvents investigated (i.e., saline, water at pH ≈ 2.60, 5.70, 8.50 and hydrogen peroxide) after 5 and 10 h of exposure, respectively. Examined naproxen in solution of saline is more stable under the exposure to UV light (λ = 254 nm) during 10 h. Moreover, it was stated that the solution of naproxen in water at pH ≈ 2.60 underwent the largest changes as the results of irradiate to UV radiation during 10 h. However, the use of mobile phase B allows us to obtain better (more accurate) degradation profile of examined naproxen. In the case of separation process by mixture of TOL-ACE-CHL(2:5:12, v/v/v) as mobile phase A, it can be seen the appearance of four degradation products, including naproxen ethyl ester, as a result of chemical changes of examined naproxen. When the second mixture of AcOH-Hex-ACE (0.10:10:10, v/v/v) was used as mobile phase B, the six products of degradation were successfully found.
Therefore, the results confirm that developed and validated thin layer chromatography coupled with densitometry found to be cost-effective, rapid, specific, accurate, and precise for the determination of chemical stability of naproxen. This procedure also realizes the criterion of the linearity in the required range of naproxen concentrations and is comparable to HPLC and UPLC method in terms of detection the number of degradation products of naproxen. The developed method can be employed for the routine analysis of naproxen and its products of chemical change of naproxen in quantity control laboratories.

Supplementary Materials

The following are available online at https://www.mdpi.com/2227-9717/8/8/962/s1, Figure S1: Photograph of naproxen chromatogram that was irradiated with UV radiation at λ = 254 nm on silica gel for a period of 1 h, 2 h, 3 h, 4 h, 5 h before developing the chromatographic plate (mobile phase A: TOL-ACE-CHL, 2:5:12 (v/v/v); photo taken at λ = 254 nm; where st—standard of naproxen (non-irradiated), Figure S2: Photograph of naproxen chromatogram that was irradiated with UV radiation at λ = 254 nm on silica gel for a period of 1 h, 2 h, 3 h, 4 h, 5 h before developing the chromatographic plate (mobile phase A: TOL-ACE-CHL, 2:5:12 (v/v/v); photo taken under UV light at 366 nm); where st—standard of naproxen (non-irradiated), Figure S3: Densitogram of naproxen irradiated on silica gel with UV radiation λ = 254 nm for a period of 5 h (mobile phase A: TOL-ACE-CHL, 2:5:12 (v/v/v)), Figure S4: Densitogram of naproxen irradiated on silica gel with UV radiation λ = 254 nm for a period of 4 h (mobile phase A: TOL-ACE-CHL, 2:5:12 (v/v/v)), Figure S5: Densitogram of naproxen irradiated on silica gel with UV radiation λ = 254 nm for a period of 3 h (mobile phase A: TOL-ACE-CHL, 2:5:12 (v/v/v)), Figure S6: Densitogram of naproxen irradiated on silica gel with UV radiation λ = 254 nm for a period of 2 h (mobile phase A: TOL-ACE-CHL, 2:5:12 (v/v/v)), Figure S7: Densitogram of naproxen irradiated on silica gel with UV radiation λ = 254 nm for a period of 1 h (mobile phase A: TOL-ACE-CHL, 2:5:12 (v/v/v)), Figure S8: Densitogram of naproxen (non-irradiated) standard (mobile phase A: TOL-ACE-CHL, 2:5:12 (v/v/v)), Figure S9: Spectra of naproxen not exposed and irradiated with UV radiation at λ = 254 nm for a period of 1 h to 5 h on silica gel (mobile phase A: TOL-ACE-CHL, 2:5:12 v/v/v)), Figure S10: Spectra of substance 1 with the value RF = 0.02 formed after irradiation with UV light at λ = 254 nm naproxen on silica gel for 1 h, 2 h, 3 h, 4 h and 5 h (mobile phase A: TOL-ACE-CHL, 2:5:12 (v/v/v)), Figure S11: Spectra of substance 2 (naproxen ethyl ester) with the value RF = 0.71 formed after irradiation with UV light with λ = 254 nm naproxen on silica gel for 1 h, 2 h, 3 h, 4 h and 5 h (mobile phase A: TOL-ACE-CHL, 2:5:12 (v/v/v)), Figure S12: Spectra of substance 3 with the value RF = 0.89 formed after irradiation with UV light with λ = 254 nm naproxen on silica gel for 1 h, 2 h, 3 h, 4 h and 5 h (mobile phase A: TOL-ACE-CHL, 2:5:12 (v/v/v)), Table S1: RF values and chromatographic peak areas of naproxen and its chemical transformation products under the influence of UV light (254 nm) on silica gel, after separation using a mobile phase A: TOL-ACE-CHL (2:5:12, v/v/v), Figure S13: Photographs of chromatograms of naproxen that was irradiated with UV light (254 nm) on silica gel for 1 h, 2 h, 3 h, 4 h, 5 h before developing the chromatographic plate (mobile phase B: AcOH-Hex-ACE, 0.10:10:10, (v/v/v); photos taken under UV light at (a) 254 nm and (b) 366 nm); where st—standard of naproxen (non-irradiated), Figure S14: Densitogram of naproxen irradiated on silica gel with UV light (254 nm) for a period of 5 h (mobile phase B: AcOH-Hex-ACE, 0.10:10:10 (v/v/v)), Figure S15: Densitogram of naproxen irradiated on silica gel with UV light (λ = 254 nm) for a period of 4 h (mobile phase B: AcOH-Hex-ACE, 0.10:10:10 (v/v/v)), Figure S16: Densitogram of naproxen irradiated on silica gel with UV light (λ = 254 nm) for a period of 3 h (mobile phase B: AcOH-Hex-ACE, 0.10:10:10 (v/v/v)), Figure S17: Densitogram of naproxen irradiated on silica gel with UV light (λ = 254 nm) for a period of 2 h (mobile phase B: AcOH-Hex-ACE, 0.10:10:10 (v/v/v)), Figure S18: Densitogram of naproxen irradiated on silica gel with UV light (λ = 254 nm) for a period of 1 h (mobile phase B: AcOH-Hex-ACE, 0.10:10:10 (v/v/v)), Figure S19: Densitogram of naproxen standard (non-irradiated) (mobile phase B: AcOH-Hex-ACE, 0.10:10:10 (v/v/v)), Figure S20: The spectra of naproxen not exposed and irradiated with UV radiation at λ = 254 nm for a period of 1 h to 5 h on silica gel (mobile phase B: AcOH-Hex-ACE, 0.10:10:10 (v/v/v)), Figure S21: The spectra of substance 1 with RF = 0.03 formed after UV irradiation with λ = 254 nm naproxen on silica gel for 2 h, 3 h, 4 h and 5 h (mobile phase B: AcOH-Hex-ACE, 0.10:10:10 (v/v/v)), Figure S22: Spectra of substance 2 with RF = 0.74 formed after UV irradiation with λ = 254 nm naproxen on silica gel for 2 h, 3 h, 4 h and 5 h (mobile phase B: AcOH-Hex-ACE, 0.10:10:10 (v/v/v)), Figure S23: Spectra of substance 3 with RF = 0.79 formed after UV irradiation with λ = 254 nm naproxen on silica gel for 2 h, 3 h, 4 h and 5 h (mobile phase B: AcOH-Hex-ACE, 0.10:10:10 (v/v/v)), Table S2: RF values and chromatographic peak areas of naproxen and its chemical transformation products under the influence of UV light (254 nm) on silica gel, after separation using a mobile phase B: AcOH-Hex-ACE, 0.10:10:10 (v/v/v), Figure S24: Photographs of chromatograms, naproxen not exposed (I) and naproxen in solutions II, III, IV, V and VI irradiated for 5 h with UV radiation at λ = 254 nm taken in UV light at 254 nm (a) and 366 nm (b), after separation using a mobile phase A: TOL-ACE-CHL, 2:5:12 (v/v/v), Figure S25: Densitogram of naproxen standard (not exposed to UV) developed using mobile phase A: TOL-ACE-CHL (2:5:12, v/v/v), Figure S26: Densitogram of naproxen (N) in solution of physiological salt (II), which was irradiated to UV light (254 nm) for 5 h (mobile phase A: TOL-ACE-CHL; 2:5:12, v/v/v); 1, 2, 3—degradation products of naproxen; and 2 was identified as naproxen ethyl ester, Figure S27: Densitogram of naproxen (N) in solution of water at pH ≈ 2.60 (III), which was irradiated to UV light (254 nm) for 5 h (mobile phase A: TOL-ACE-CHL; 2:5:12, v/v/v); 1, 2, 3—degradation products of naproxen; and 2 was identified as naproxen ethyl ester, Figure S28: Densitogram of naproxen (N) in solution of water at pH ≈ 5.70 (IV), which was irradiated to UV light (254 nm) for 5 h (mobile phase A: TOL-ACE-CHL; 2:5:12, v/v/v); 1, 2, 3—degradation products of naproxen; and 2 was identified as naproxen ethyl ester, Figure S29: Densitogram of naproxen (N) in solution of water at pH ≈ 8.50 (V) which was irradiated to UV light (254 nm) for 5 h (mobile phase A: TOL-ACE-CHL; 2:5:12, v/v/v); 1, 2, 3—degradation products of naproxen; and 2 was identified as naproxen ethyl ester, Figure S30: Densitogram of naproxen (N) in hydrogen peroxide (VI), which was irradiated to UV light (254 nm) for 5 h (mobile phase A: TOL-ACE-CHL; 2:5:12, v/v/v); 1, 2, 3—degradation products of naproxen; and 2 was identified as naproxen ethyl ester, Figure S31: Comparison of naproxen spectra (RF = 0.29), which in solutions II, III, IV, V, VI was irradiated from above for 5 h and naproxen standard (mobile phase A: TOL-ACE-CHL, 2:5:12 (v/v/v)), Figure S32: Spectra of substance 1 with RF = 0.03 formed after irradiation of naproxen in solutions II, III, IV, V, VI for 5 h (mobile phase A: TOL-ACE-CHL, 2:5:12 (v/v/v)), Figure S33: Spectra of substance 2 (naproxen ethyl ester) with RF = 0.65 formed after irradiation of naproxen in solutions II, III, IV, V, VI for 5 h (mobile phase A: TOL-ACE-CHL, 2:5:12 (v/v/v)), Figure S34: Spectra of substance 3 with RF = 0.85 formed after irradiation of naproxen in solutions II, III, IV, V, VI for 5 h (mobile phase A: TOL-ACE-CHL, 2:5:12 (v/v/v)), Figure S35: Spectra of substance 4 with RF = 0.81 formed after irradiation of naproxen in solutions II, III, IV, V, VI for 5 h (mobile phase A: TOL-ACE-CHL, 2:5:12 (v/v/v)), Figure S36: Photographs of chromatograms, naproxen not exposed (I) and naproxen in solutions II, III, IV, V and VI irradiated for 10 h with UV radiation λ = 254 nm taken at 254 nm (a) and 366 nm (b), after separation using a mobile phase A: TOL-ACE-CHL, 2:5:12 (v/v/v), Figure S37: Densitogram of naproxen (N) in solution of physiological salt (II), which was irradiated to UV light (254 nm) for 10 h (mobile phase A: TOL-ACE-CHL; 2:5:12, v/v/v); 1, 2, 3—degradation products of naproxen; and 2 was identified as naproxen ethyl ester, Figure S38: Densitogram of naproxen (N) in water at pH ≈ 2.60 (III), which was irradiated to UV light (254 nm) for 10 h (mobile phase A: TOL-ACE-CHL; 2:5:12, v/v/v); 1, 2, 3—degradation products of naproxen; and 2 was identified as naproxen ethyl ester, Figure S39: Densitogram of naproxen (N) in water at pH ≈ 5.70 (IV), which was irradiated to UV light (254 nm) for 10 h (mobile phase A: TOL-ACE-CHL; 2:5:12, v/v/v); 1, 2, 3—degradation products of naproxen; and 2 was identified as naproxen ethyl ester, Figure S40: Densitogram of naproxen (N) in water at pH ≈ 8.50 (V), which was irradiated to UV light (254 nm) for 10 h (mobile phase A: TOL-ACE-CHL; 2:5:12, v/v/v); 1, 2, 3—degradation products of naproxen; and 2 was identified as naproxen ethyl ester, Figure S41: Densitogram of naproxen (N) in hydrogen peroxide (VI), which was irradiated to UV light (254 nm) for 10 h (mobile phase A: TOL-ACE-CHL; 2:5:12, v/v/v); 1, 2, 3, 4—degradation products of naproxen; and 2 was identified as naproxen ethyl ester, Figure S42: Comparison of naproxen spectra (RF = 0.26), which in solutions II, III, IV, V, VI was irradiated from above for 10 h and naproxen standard (mobile phase A: TOL-ACE-CHL, 2:5:12, v/v/v), Figure S43: Spectra of substance 1 with RF = 0.03 formed after irradiation of naproxen in solutions II, III, IV, V, VI for 10 h (mobile phase A: TOL-ACE-CHL, 2:5:12, v/v/v), Figure S44: Spectra of substance 2 (naproxen ethyl ester) with RF = 0.67 formed after irradiation of naproxen in solutions II, III, IV, V, VI for 10 h (mobile phase A: TOL-ACE-CHL, 2:5:12, v/v/v), Figure S45: Spectra of substance 3 with RF = 0.86 formed after irradiation of naproxen in solutions II, III, IV, V, VI for 10 h (mobile phase A: TOL-ACE-CHL, 2:5:12, v/v/v), Figure S46: Spectra of substance 4 with RF = 0.81 formed after irradiation of naproxen in solution VI for 10 h (mobile phase A: TOL-ACE-CHL, 2:5:12, v/v/v), Table S3: RF values and chromatographic peak area of naproxen and its chemical transformation products formed in individual solutions irradiated from the top by UV light (254 nm), after separation using a mobile phase A: TOL-ACE-CHL 2:5:12 (v/v/v), Figure S47: Photographs of chromatograms, naproxen not exposed (I) and naproxen in solutions II, III, IV, V and VI irradiated for 5 h with UV radiation λ = 254 nm taken at 254 nm (a) and 366 nm (b), after separation using a mobile phase B: AcOH-Hex-ACE, 0.10:10:10 (v/v/v), Figure S48: Densitogram of naproxen standard (not exposed to UV) developed using mobile phase B: AcOH-Hex-ACE (0.10:10:10,v/v/v), Figure S49: Densitogram of naproxen (N) in solution of physiological salt (II), which was irradiated to UV light (254 nm) for 5 h (mobile phase B: AcOH-Hex-ACE, 0.10:10:10, v/v/v); 1, 2, 3, 4—degradation products of naproxen; and 2 was identified as naproxen ethyl ester, Figure S50: Densitogram of naproxen (N) in solution of water at pH ≈ 2.60 (III), which was irradiated to UV light (254 nm) for 5 h (mobile phase B: AcOH-Hex-ACE, 0.10:10:10, v/v/v); 1, 2, 3, 4—degradation products of naproxen; and 2 was identified as naproxen ethyl ester, Figure S51: Densitogram of naproxen (N) in solution of water at pH ≈ 5.70 (IV), which was irradiated to UV light (254 nm) for 5 h (mobile phase B: AcOH-Hex-ACE, 0.10:10:10,v/v/v); 1, 2, 3, 4—degradation products of naproxen; and 2 was identified as naproxen ethyl ester, Figure S52: Densitogram of naproxen (N) in solution of water at pH ≈ 8.50 (V), which was irradiated to UV light (254 nm) for 5 h (mobile phase B: AcOH-Hex-ACE, 0.10:10:10, v/v/v); 1, 2, 3, 4—products of naproxen; and 2 was identified as naproxen ethyl ester, Figure S53: Densitogram of naproxen (N) in hydrogen peroxide (VI), which was irradiated to UV light (254 nm) for 5 h (mobile phase B: AcOH-Hex-ACE, 0.10:10:10,v/v/v); 1, 2, 3—degradation products of naproxen; and 2 was identified as naproxen ethyl ester, Figure S54: Comparison of naproxen spectra (RF = 0.50), which in solutions II, III, IV, V, VI was irradiated from above for 5 h and naproxen standard (mobile phase B: AcOH-Hex-ACE, 0.10:10:10, v/v/v), Figure S55: Spectra of substance 1 with RF = 0.04 formed after irradiation of naproxen in solutions II, III, IV, V, VI for 5 h (mobile phase B: AcOH-Hex-ACE, 0.10:10:10, v/v/v), Figure S56: Spectra of substance 2 (naproxen ethyl ester) with RF = 0.67 formed after irradiation of naproxen in solutions II, III, IV, V, VI for 5 h (mobile phase B: AcOH-Hex-ACE, 0.10:10:10, v/v/v), Figure S57: Spectra of substance 3 with RF = 0.74 formed after irradiation of naproxen in solutions II, III, IV, V, VI for 5 h (mobile phase B: AcOH-Hex-ACE, 0.10:10:10, v/v/v), Figure S58: Spectra of substance 4 with RF = 0.19 formed after irradiation of naproxen in solutions II, III, IV, V, VI for 5 h (mobile phase B: AcOH-Hex-ACE, 0.10:10:10, v/v/v), Figure S59: Photographs of chromatograms, naproxen not exposed (I) and naproxen in solutions II, III, IV, V and VI irradiated for 10 h with UV radiation λ = 254 nm taken at 254 nm (a) and 366 nm (b), after separation using a mobile phase B: AcOH-Hex-ACE, 0.10:10:10 (v/v/v), Figure S60: Densitogram of naproxen (N) in solution of physiological salt (II), which was irradiated to UV light (254 nm) for 10 h (mobile phase B: AcOH-Hex-ACE, 0.10:10:10, v/v/v); 1, 2, 3, 4—degradation products of naproxen; and 2 was identified as naproxen ethyl ester, Figure S61: Densitogram of naproxen (N) in solution of water at pH = 2.60 (III), which was irradiated to UV light (254 nm) for 10 h (mobile phase B: AcOH-Hex-ACE, 0.10:10:10, v/v/v); 1, 2, 3, 4, 6—degradation products of naproxen; and 2 was identified as naproxen ethyl ester, Figure S62: Densitogram of naproxen (N) in solution of water at pH ≈ 5.70 (IV), which was irradiated to UV light (254 nm) for 10 h (mobile phase B: AcOH-Hex-ACE, 0.10:10:10, v/v/v); 1, 2, 3, 4—degradation products of naproxen; and 2 was identified as naproxen ethyl ester, Figure S63: Densitogram of naproxen (N) in solution of water at pH ≈ 8.50 (V), which was irradiated to UV light (254 nm) for 10 h (mobile phase B: AcOH-Hex-ACE, 0.10:10:10, v/v/v); 1, 2, 3, 4—degradation products of naproxen; and 2 was identified as naproxen ethyl ester, Figure S64: Densitogram of naproxen (N) in hydrogen peroxide (VI), which was irradiated to UV light (254 nm) for 10 h (mobile phase B: AcOH-Hex-ACE, 0.10:10:10, v/v/v); 1, 2, 3, 5—degradation products of naproxen; and 2 was identified as naproxen ethyl ester, Figure S65: Comparison of naproxen spectra (RF = 0.50), which in solutions II, III, IV, V, VI was irradiated from above for 10 h and naproxen standard (mobile phase B: AcOH-Hex-ACE, 0.10:10:10, v/v/v)), Figure S66: Spectra of substance 1 with RF = 0.04 formed after irradiation of naproxen in solutions II, III, IV, V, VI for 10 h (mobile phase B: AcOH-Hex-ACE, 0.10:10:10, v/v/v)), Figure S67: Spectra of substance 2 (naproxen ethyl ester) with RF = 0.67 formed after irradiation of naproxen in solutions II, III, IV, V, VI for 10 h (mobile phase B: AcOH-Hex-ACE, 0.10:10:10, v/v/v)), Figure S68: Spectra of substance 3 with RF = 0.73 formed after irradiation of naproxen in solutions II, III, IV, V, VI for 10 h (mobile phase B: AcOH-Hex-ACE, 0.10:10:10, v/v/v)), Figure S69: Spectra of substance 4 with RF = 0.20 formed after irradiation of naproxen in solutions II, III, IV, V, VI for 10 h (mobile phase B: AcOH-Hex-ACE, 0.10:10:10, v/v/v)), Figure S70: Spectra of substance 5 with RF = 0.45 formed after irradiation of naproxen in solution VI for 10 h (mobile phase B: AcOH-Hex-ACE, 0.10:10:10, v/v/v)), Figure S71: Spectra of substance 6 with RF = 0.82 formed after irradiation of naproxen in solution III for 10 h (mobile phase B: AcOH-Hex-ACE, 0.10:10:10, v/v/v)), Table S4: RF values and chromatographic peak areas of naproxen and its chemical transformation products formed in individual solutions irradiated from the top by UV light (254 nm), after separation using a mobile phase B: AcOH-Hex-ACE, 0.10:10:10 (v/v/v).

Author Contributions

W.P., and A.P.-P. have collected the data, designed and written the manuscript, M.D., has revised the manuscript. All authors have read and agreed to the published version of the manuscript.

Funding

This research received no external funding

Acknowledgments

This research was financed by the Medical University of Silesia in Katowice as part of statutory research project.

Conflicts of Interest

The authors declare that there is no conflict of interests regarding the publication of this paper.

References

  1. Waterman, K.C.; Adami, R.C. Accelerated aging: Prediction of chemical stability of Pharmaceuticals. Int. J. Pharm. 2005, 293, 101–125. [Google Scholar] [CrossRef]
  2. Bajaj, S.; Singla, D.; Sakhuja, N. Stability testing of pharmaceutical products. J. Appl. Pharm. Sci. 2012, 2, 129–138. [Google Scholar]
  3. Blessy, M.; Patel, R.D.; Prajapati, P.N.; Agrawal, Y.K. Development of forced degradation and stability indicating studies of drugs—A review. J. Pharm. Anal. 2014, 4, 159–165. [Google Scholar] [CrossRef] [Green Version]
  4. ICH. ICH Harmonised Tripartite Guideline: Stability Testing of New Drug Substances and Products, International Conference on Harmonization Guidance Documents, Q1A (R2); ICH: Geneva, Switzerland, 2005; Available online: http://www.ich.org/fileadmin/Public_Web_Site/ICH_Products/Guidelines/Quality/Q1A_R2/Step4/Q1A_R2__Guideline.pdf (accessed on 28 May 2020).
  5. Kothapalli, L.P.; Shahane, R.R.; Nanda, R.K.; Thomas, A.B. Development and validation of stability indicating HPTLC method for simultaneous estimation of Domperidone maleate and Naproxen sodium in pharmaceutical formulations. Asian J. Res. Chem. 2016, 9, 350–356. [Google Scholar] [CrossRef]
  6. Nalluri, B.N.; Mrudula, B.; Chitralatha, K.; Sultana, S.A.; Chandra, T.U. Development of stability indicating RP-HPLC-PDA method for the simultaneous analysis of naproxen sodium and diphenhydramine hydrochloride in bulk and tablet dosage forms. Indian Drugs 2015, 52, 40–47. [Google Scholar]
  7. Hamid, M.H.M.; Elsaman, T. A stability-indicating RP-HPLC-UV method for determination and chemical hydrolysis study of a novel naproxen prodrug. J. Chem. 2017, 2017, 5285671. [Google Scholar] [CrossRef] [Green Version]
  8. Songnaka, N.; Sawatdee, S.; Atipairin, A. Stability-indicating HPLC method for determination of naproxen in an extemporaneous suspension. Res. J. Pharm. Technol. 2018, 11, 4332–4338. [Google Scholar] [CrossRef]
  9. Venkatarao, P.; Kumar, M.N.; Kumar, M.R. Novel validated stability-indicating UPLC method for the estimation of naproxen and its impurities in bulk and drugs and pharmaceutical dosage form. Sci. Pharm. 2012, 80, 965–976. [Google Scholar] [CrossRef] [PubMed] [Green Version]
  10. Reddy, P.S.; Sait, S.; Hotha, K.K. Estimation of naproxen related substances in sumatriptan succinate and naproxen sodium tablets by UPLC. Asian J. Chem. 2013, 25, 9717–9721. [Google Scholar] [CrossRef]
  11. Reddy, R.S.; Krishna, R.M.; Vekaria, N.A.; Sumathi, R.V.; Mantena, B.P.V. Determination of potential impurities of naproxen sodium in soft gelatin capsules dosage by using Ultra Performance Liquid Chromatography. Anal. Chem. Lett. 2016, 6, 55–69. [Google Scholar] [CrossRef]
  12. Vittal, S.P.; Rao, S.V.; Ramakrishna, K. Stability indicating RP-HPLC method for simultaneous determination of potential impurities of sumatriptan and naproxen sodium in fixed dose combination. Rasayan J. Chem. 2019, 12, 1601–1612. [Google Scholar] [CrossRef]
  13. Reddy, P.S.; Saita, S.; Vasudevmurthy, G.; Vishwanatha, B.; Prasada, V.; Reddy, S.J. Stability indicating simultaneous estimation of assay method for naproxen and esomeprazole in pharmaceutical formulations by RP-HPLC. Der Pharma Chem. 2011, 3, 553–564. [Google Scholar]
  14. Rao, K.T.; Rao, L.V. A validated stability-indicating UHPLC method for determination of naproxen and its related compounds in bulk drug samples. Am. J. Anal. Chem. 2013, 4, 286–292. [Google Scholar] [CrossRef] [Green Version]
  15. Pyka, A.; Bober, K.; Klimczok, W.; Stefaniak, M. Densitometric investigations of chemical durability of pyrocatechol. J. Liq. Chromatogr. Relat. Technol. 2006, 29, 3017–3027. [Google Scholar] [CrossRef]
  16. Pyka, A.; Klimczok, W. Use of thin layer chromatography to evaluate the stability of methyl nicotinate. J. Liq. Chromatogr. Relat. Technol. 2009, 32, 1299–1316. [Google Scholar] [CrossRef]
  17. Pyka, A.; Gurak, D. Use of RP-TLC and densitometry to analytical characteristic of vitamin K1. J. Liq. Chromatogr. Relat. Technol. 2009, 32, 2097–2104. [Google Scholar] [CrossRef]
  18. Pyka, A.; Wiatr, E.; Kwiska, K.; Gurak, D. Validation thin layer chromatography for the determination of naproxen in tablets and comparison with a pharmacopeil method. J. Liq. Chromatogr. Relat. Technol. 2011, 34, 829–847. [Google Scholar] [CrossRef]
  19. Pyka, A.; Nieduziak, A. Application of spectrophotometry to naproxen determination in pharmaceutical preparations. Farm. Pol. 2010, 66, 673–676. (In Polish) [Google Scholar]
  20. Krzek, J.; Starek, M. Densitometric determination of naproxen, and of naproxen methyl ester, its impurity, in pharmaceutical preparations. J. Planar Chromatogr. Mod. TLC 2004, 17, 137–142. [Google Scholar] [CrossRef]
  21. Bhole, R.P.; Shinde, S.S.; Chitlange, S.S.; Wankhede, S.B. A high-performance thin layer chromatography (HPTLC) method for simultaneous determination of diphenhydramine hydrochloride and naproxen sodium in tablets. Anal. Chem. Insights 2015, 10, 47–51. [Google Scholar] [CrossRef] [Green Version]
  22. Abdel-Moety, E.M.; Al-Obaid, A.M.; Jado, A.I.; Lotfi, E.A. Coupling of TLC and UV-measurement for quantification of naproxen and its main metabolite in urine. Eur. J. Drug Metab. Pharmacokinet. 1988, 13, 267–271. [Google Scholar] [CrossRef] [PubMed]
  23. Zhang, D.; Strock, J.; Sherma, J. Development of HPTLC-densitometry methods for quantifying naproxen sodium, loperamide hydrochloride and loratadine in pharmaceutical tablets using a model procedure reported earlier to transfer TLC screening methods for fake and substandard drugs. Trends Chromatogr. 2016, 10, 1–5. [Google Scholar]
  24. DrugBank. Available online: https://www.drugbank.ca/drugs/DB00788 (accessed on 28 May 2020).
  25. USP. The United States Pharmacopeia, 34th ed.; United States Pharmacopeial Convention: Rockville, MD, USA, 2011. [Google Scholar]
  26. Sádecká, J.; Cakrt, M.; Hercegová, A.; Polonský, J.; Skacáni, I. Determination of ibuprofen and naproxen in tablets. J. Pharm. Biomed. Anal. 2001, 25, 881–891. [Google Scholar] [CrossRef]
  27. Alizadeh, N.; Keyhanian, F. Simple, sensitive and selective spectrophotometric assay of naproxen in pure, pharmaceutical preparation and human serum sample. Acta Pol. Pharm. Drug Res. 2015, 72, 867–875. [Google Scholar]
  28. Mabrouk, M.M.; Hammad, S.F.; Mansour, F.R.; El-Khateeb, B.Z. Simultaneous determination of naproxen and diphenhydramine by reversed phase liquid chromatography and derivative spectrophotometry. Der Pharma Chem. 2015, 7, 181–192. [Google Scholar]
  29. Shevchenko, G.; Kulichenko, S. Alkalimetric determination of hydrophobic pharmaceuticals using stabilized o/w emulsions. Chem. Pap. 2008, 62, 435–439. [Google Scholar] [CrossRef]
  30. Aresta, A.; Palmisano, F.; Zambonin, C.G. Determination of naproxen in human urine by solid-phase microextraction coupled to liquid chromatography. J. Pharm. Biomed. Anal. 2005, 39, 643–647. [Google Scholar] [CrossRef]
  31. Suryanarayanan, V.; Zhang, Y.; Yoshihara, S.; Shirakashi, T. Voltammetric assay of naproxen in pharmaceutical formulations using boron-doped diamond electrode. Electroanalysis 2005, 17, 925–932. [Google Scholar] [CrossRef]
  32. Yanik, S.; Yilmaz, S.; Saglikoglu, G.; Sadikoglu, M.; Tonguc Yayintas, Ö. Voltammetric and chromatographic determination of naproxen in drug formulation. J. Sci. Perspect. 2019, 3, 299–310. [Google Scholar] [CrossRef] [Green Version]
  33. Afzali, M.; Jahromi, Z.; Nekooie, R. Sensitive voltammetric method for the determination of naproxen at the surface of carbon nanofiber/gold/polyaniline nanocomposite modified carbon ionic liquid electrode. Mikrochem. J. 2019, 145, 373–379. [Google Scholar] [CrossRef]
  34. Veeragoni, A.K.; Sindgi, V.M.; Satla, S.R. Bioanalytical validated LC-MS method for determination of naproxen in human plasma. Int. J. Mod. Trends Sci. Technol. 2016, 2, 96–99. [Google Scholar]
  35. Satterwhite, J.H.; Boudinot, F.D. High-performance liquid chromatographic determination of ketoprofen and naproxen in rat plasma. J. Chromatogr. 1988, 431, 444–449. [Google Scholar] [CrossRef]
  36. Dinç, E.; Özdemir, A.; Aksoy, H.; Üstündağ, Ö.; Balean, D. Chemometric determination of naproxen sodium and pseudoephedrine hydrochloride in tablets by HPLC. Chem. Pharm. Bull. 2006, 54, 415–421. [Google Scholar] [CrossRef] [PubMed] [Green Version]
  37. Yilmaz, B.; Sahin, H.; Erdem, A.F. Determination of naproxen in human plasma by GC-MS. J. Sep. Sci. 2014, 37, 997–1003. [Google Scholar] [CrossRef] [PubMed]
  38. Muneer, S.; Muhammad, I.N.; Abrar, M.A.; Munir, I.; Kaukab, I.; Sagheer, A.; Zafar, H.; Sultana, K. High performance liquid chromatographic determination of naproxen in prepared pharmaceutical dosage form and human plasma and its application to pharmacokinetic study. J. Chromatogr. Sep. Tech. 2017, 8, 1000369. [Google Scholar] [CrossRef]
  39. Krokos, A.; Tsakelidou, E.; Michopoulou, E.; Raikos, N.; Theodoridis, G.; Gika, H. NSAIDs determination in human serum by GC-MS. Separations 2018, 5, 37. [Google Scholar] [CrossRef] [Green Version]
  40. Monser, L.; Darghouth, F. Simultaneous determination of naproxen and related compounds by HPLC using porous graphitic carbon column. J. Pharm. Biomed. Anal. 2003, 32, 1087–1092. [Google Scholar] [CrossRef]
  41. Wabaidur, S.M.; AlOthman, Z.A.; Siddiqui, M.R.; Mohsin, K.; Bousiakou, L.G.; Karikas, G.A. UPLC-MS method for the simultaneous determination of naproxen, fluvastatin and ibuprofen in waste water samples. J. Ind. Eng. Chem. 2015, 24, 302–307. [Google Scholar] [CrossRef]
  42. Becerra-Herrera, M.; Honda, L.; Richter, P. Ultra-high-performance liquid chromatography-time-of-flight high resolution mass spectrometry to quantify acidic drugs in wastewater. J. Chromatogr. A 2015, 1423, 96–103. [Google Scholar] [CrossRef]
  43. Mohamed, A.; Salama, A.; Nasser, W.S.; Uheida, A. Photodegradation of ibuprofen, cetirizine, and naproxen by PAN-MWCNT/TiO2-NH2 nanofiber membrane under UV light irradiation. Environ. Sci. Eur. 2018, 30, 47. [Google Scholar] [CrossRef]
  44. Ganesan, T.; Mukhtar, N.H.; Lim, H.N.; See, H.H. Mixed matrix membrane tip extraction coupled with UPLC-MS/MS for the monitoring of nonsteroidal anti-inflammatory drugs in water samples. Separations 2020, 7, 19. [Google Scholar] [CrossRef] [Green Version]
  45. Phillip, T.M.; Wellner, E.F. Measurement of naproxen in human plasma by chip-based immunoaffinity capillary electrophoresis. Biomed. Chromatogr. 2006, 20, 662–667. [Google Scholar] [CrossRef] [PubMed]
  46. Zhang, P.; Sun, Y.; Xue, H.; Wang, X.; Lian, K. Determination of naproxen in human urine by capillary electrophoresis with chemiluminescence detection. Glob. Drugs Ther. 2018, 3, 1–5. [Google Scholar] [CrossRef] [Green Version]
  47. ICH. ICH Harmonised Tripartite Guideline: Validation of Analytical Procedures: Text and Methodology, Q2 (R1); ICH: Geneva, Switzerland, 2005; Available online: http://www.ich.org/products/guidelines/efficacy/article/efficacy-guidelines.html (accessed on 28 May 2020).
  48. Ferenczi-Fodor, K.; Renger, B.; Végh, Z. THE frustrated reviewer—Recurrent failures in manuscripts describing validation of quantitative TLC/HPTLC procedures for analysis of pharmaceuticals. J. Planar Chromatogr. Mod TLC 2010, 23, 173–179. [Google Scholar] [CrossRef]
  49. Dołowy, M.; Pyka-Pająk, A. Comparison of the limits of detection and quantification of estradiol hemihydrate determined by thin-layer chromatography using different chromatographic conditions. J. Liq. Chromatogr. Relat. Technol. 2016, 39, 264–270. [Google Scholar] [CrossRef]
  50. Jampilek, J.; Dolowy, M.; Pyka-Pajak, A. Estimating limits of detection and quantification of ibuprofen by TLC-densitometry at different chromatographic conditions. Processes 2020, 8, 919. [Google Scholar] [CrossRef]
  51. Starek, M.; Krzek, J.; Stoch, M. Densitometric analysis of 2-arylpropionate derivatives in pharmaceutical preparations. J. Planar Chromatogr.-Mod. TLC 2008, 21, 251–258. [Google Scholar] [CrossRef]
Figure 1. The comparison of area (in %) of chromatographic bands obtained from naproxen (N) irradiated to UV light (λ = 254 nm) from 1 to 5 h on silica gel and substances (S1–S3) being the main products of chemical degradations of naproxen and the standard of naproxen not exposed to UV light (0 h), mobile phase used: TOL-ACE-CHL (2:5:12, v/v/v) (A) and AcOH-Hex-ACE (0.10:10:10, v/v/v) (B). S2—naproxen ethyl ester; S1, S3—unknown products of transformation of naproxen.
Processes 08 00962 g001
Figure 2. Densitogram of naproxen irradiated on silica gel with UV light at λ = 254 nm for a period of 5 h using a mobile phase: (A) TOL-ACE-CHL in a volume of 2:5:12, (B) AcOH-Hex-ACE in a volume of 0.10:10:10.
Processes 08 00962 g002
Figure 3. The comparison of peak areas (in %) of naproxen (N), which was irradiated to UV light (254 nm) from above in solutions II, III, IV, V, VI for 5 h. Substances (S1–S4) being the main products of its degradations and the standard of naproxen (I) (mobile phase: TOL-ACE-CHL (2:5:12, v/v/v) (A) and AcOH-Hex-ACE (0.10:10:10, v/v/v) (B)), where S2—naproxen ethyl ester; S1, S3, S4—unknown degradation products of chemical transformation of naproxen.
Processes 08 00962 g003
Figure 4. The comparison of peak areas (in %) of naproxen (N), which was irradiated to UV light (254 nm) from above in solutions II, III, IV, V, VI for 10 h. Substances (S1–S6 being the main products of its degradations and the standard of naproxen, mobile phase: TOL-ACE-CHL (2:5:12, v/v/v) (A) and AcOH-Hex-ACE (0.10:10:10, v/v/v) (B), where S2—naproxen ethyl ester; S1, S3, S4, S5, S6—unknown degradation products of chemical transformation of naproxen.
Processes 08 00962 g004
Figure 5. Densitogram of naproxen (N) in physiological salt (II), which was irradiated (254 nm) for 10 h and analyzed using: (A) TOL-ACE-CHL; 2:5:12, v/v/v; and (B) AcOH-Hex-ACE, 0.10:10:10 v/v/v as mobile phases, where: 1, 2, 3, 4—degradation products of naproxen; and 2 was identified as naproxen ethyl ester.
Processes 08 00962 g005
Figure 6. Densitogram of naproxen (N) in water at pH ≈ 2.60 (III), which was irradiated (254 nm) for 10 h and analyzed using: (A) TOL-ACE-CHL; 2:5:12, v/v/v; and (B) AcOH-Hex-ACE, 0.10:10:10 v/v/v as mobile phases, where: 1, 2, 3, 4, 6—degradation products of naproxen; and 2 was identified as naproxen ethyl ester.
Processes 08 00962 g006
Figure 7. Densitogram of naproxen (N) in hydrogen peroxide (VI), which was irradiated (254 nm) for 10 h and analyzed using: (A) TOL-ACE-CHL; 2:5:12, v/v/v; and (B) AcOH-Hex-ACE, 0.10:10:10 v/v/v as mobile phases, where: 1, 2, 3, 4, 5—degradation products of naproxen; and 2 was identified as naproxen ethyl ester.
Processes 08 00962 g007
Table 1. Visible changes of naproxen solutions (II, III, IV, V, VI) observed after their irradiate to UV light (254 nm) during 5 and 10 h, respectively.
Solution No.Sample Appearance
After 5 h of Exposure to UV LightAfter 10 h of Exposure to UV Light
IIlight yellow color, transparent, after dilution with an ethanol—colorless solutionlight yellow color, transparent; a few crystals of crystallized substances dissolve upon dilution with an ethanol, and the solution becomes colorless
IIIcolorlessyellow, straw color, even after dilution; some misshapen precipitate which disappear after dilution with an ethanol and shaking
IVcolorlessyellow color goes into orange, stable after dilution; presence of misshapen precipitate which disappear after dilution with an and shaking
Vcolorlessyellow color goes into light orange, stable after dilution; presence of misshapen precipitate which disappear after dilution with an ethanol and shaking
VIyellow color, also after dilution with an ethanoldark yellow color with orange hue (the strongest color of all solution), stable after dilution; no other precipitates, a few crystals of crystallized substances dissolve upon dilution with an ethanol
Table 2. Full descriptions the chromatographic peaks of examined naproxen and its degradation products formed during naproxen exposure to UV light obtained using thin-layer chromatography (TLC)/densitometry.
Sample Exposure Conditions/
Mobile Phase Used in TLC Analysis
Compound (a)RF ValuesAbsorption Wavelength (nm)
Exposure of naproxen to UV light on silica gelA:
TOL-ACE-CHL
(2:5:12, v/v/v)
N
1
2
3
0.29
0.02
0.70 ÷ 0.71
0.89 ÷ 0.90
229; 272; 316; 329
210; 232; 260
227; 271; 316; 326
249; 259; 313
B:
AcOH-Hex-ACE
(0.10:10:10, v/v/v)
N
1
2
3
0.44 ÷ 0.47
0.03 ÷ 0.04
0.71 ÷ 0.75
0.78 ÷ 0.81
229; 273; 316; 329
204; 231; 266
227; 277; 313
249; 260; 311
Exposure of solution of naproxen during5 hA:
TOL-ACE-CHL
(2:5:12, v/v/v)
N
1
2
3
4
0.25 ÷ 0.31
0.03 ÷ 0.04
0.65 ÷ 0.66
0.85 ÷ 0.86
0.81
229; 272; 317; 329
228 ÷ 230; 275
227; 263 ÷ 282
258 ÷ 260; 310 ÷ 312
227; 280; 330
10 hN
1
2
3
4
0.24 ÷ 0.29
0.02 ÷ 0.03
0.66 ÷ 0.67
0.85 ÷ 0.87
0.81
229; 272; 317; 330
229 ÷ 234; 273 ÷ 282
227; 272; 316; 328
248; 260; 312
227; 264; 280
Exposure of solution of naproxen during5 hB:
AcOH-Hex-ACE
(0.10:10:10, v/v/v)
N
1
2
3
4
0.47 ÷ 0.50
0.03 ÷ 0.04
0.67 ÷ 0.69
0.73 ÷ 0.75
0.18 ÷ 0.19
229; 272; 318; 329
227 ÷ 231; 282 (for solution No. 6)
227; 273; 329
210; 249; 260; 313
211; 231
10 hN
1
2
3
4
5
6
0.50 ÷ 0.51
0.03 ÷ 0.04
0.66 ÷ 0.68
0.73 ÷ 0.74
0.19 ÷ 0.21
0.45
0.82
229; 272; 317; 329
229 ÷ 233; 283 (for solution No. 6)
227; 272; 317; 327
249; 260; 311
200 ÷ 202
202; 233; 238; 273
203; 227; 273; 327
where: (a) N—naproxen, 1, 2, 3, 4, 5, 6—degradation products of naproxen; product 2 was identified as naproxen ethyl ester.
Table 3. Validation of TLC-densitometric method for naproxen analyzed using mobile phase A a.
Method CharacteristicsResults
SpecificitySpecific
Range (μg spot −1)0.04 ÷ 1.00
Linearity (μg spot −1)A = 18201.2(±113.2) x + 975.3(±28.9)
n = 16; r = 0.999; F = 12302
Detection Limit (LOD) (μg spot −1)0.013
Quantification Limit (LOQ) (μg spot −1)0.040
Accuracy
naproxen added in % (n = 5)
80%R = 99.2%; CV = 1.89%
100% R = 101.8%; CV = 1.25%
120%R = 99.1%; CV = 0.86%
Precision (CV, (%))
Repeatability
for 0.25 μg spot −1 (n = 3)1.22
for 0.50 μg spot −1 (n = 3)1.08
for 0.75 μg spot −1 (n = 3)1.49
Intermediate
for 0.25 μg spot −1 (n = 3)1.08
for 0.50 μg spot −1 (n = 3)1.53
for 0.75 μg spot −1 (n = 3)1.22
a A—band area (AU), x—amount (μg spot −1) of naproxen, r—correlation coefficient, R—recovery (%), CV—coefficient of variation (%).
Table 4. Validation of TLC-densitometric method for naproxen analyzed using mobile phase B a.
Method CharacteristicsResults
SpecificitySpecific
Range (μg spot −1)0.08 ÷ 1.00
Linearity (μg spot −1)A = 9413.1(±82.4) x + 1575.3(±49.4)
N = 12; r = 0.999; F = 13,401
Detection Limit (LOD) (μg spot −1)0.026
Quantification Limit (LOQ) (μg spot −1)0.080
Accuracy
naproxen added in % (n = 5)
80%R = 102.3%; CV = 1.51%
100%R = 98.4%; CV = 1.18%
120%R = 100.3%; CV = 0.93%
Precision (CV, (%))
Repeatability
for 0.25 μg spot −1 (n = 3)1.13
for 0.50 μg spot −1 (n = 3)1.28
for 0.75 μg spot −1 (n = 3)1.27
Intermediate
for 0.25 μg spot −1 (n = 3)1.28
for 0.50 μg spot −1 (n = 3)1.36
for 0.75 μg spot −1 (n = 3)1.31
a A—band area (AU), x—amount (μg spot −1) of naproxen, r—correlation coefficient, R—recovery (%), CV—coefficient of variation (%).

