1. Introduction
Currently, there is a great interest in adopting more efficient and low-cost processes for the treatment of wastewater. The rapid growth of the world population is resulting in increased contamination of freshwater sources, generating conditions of water stress in the short term [
1]. The adsorption technique using activated carbon is one of the most-used methods for the removal of organic pollutants and metal ions in wastewaters, with previous studies reporting effective removal of impurities [
2,
3].
Activated carbons are highly porous carbon materials with a high specific internal surface area and commonly serve as adsorbent material in various industrial separation and purification applications [
4]. Activated carbons can be obtained from chemical activation processes or physical activation of organic precursors. Chemical activation consists of the impregnation of the raw material with chemical agents, such as KOH, ZnCl
2, and H
3PO
4, among others, and simultaneous carbonization (pyrolysis) of the impregnated biomass in an inert gaseous atmosphere, where the main role of the activating compound is the degradation of the cellulosic material [
5,
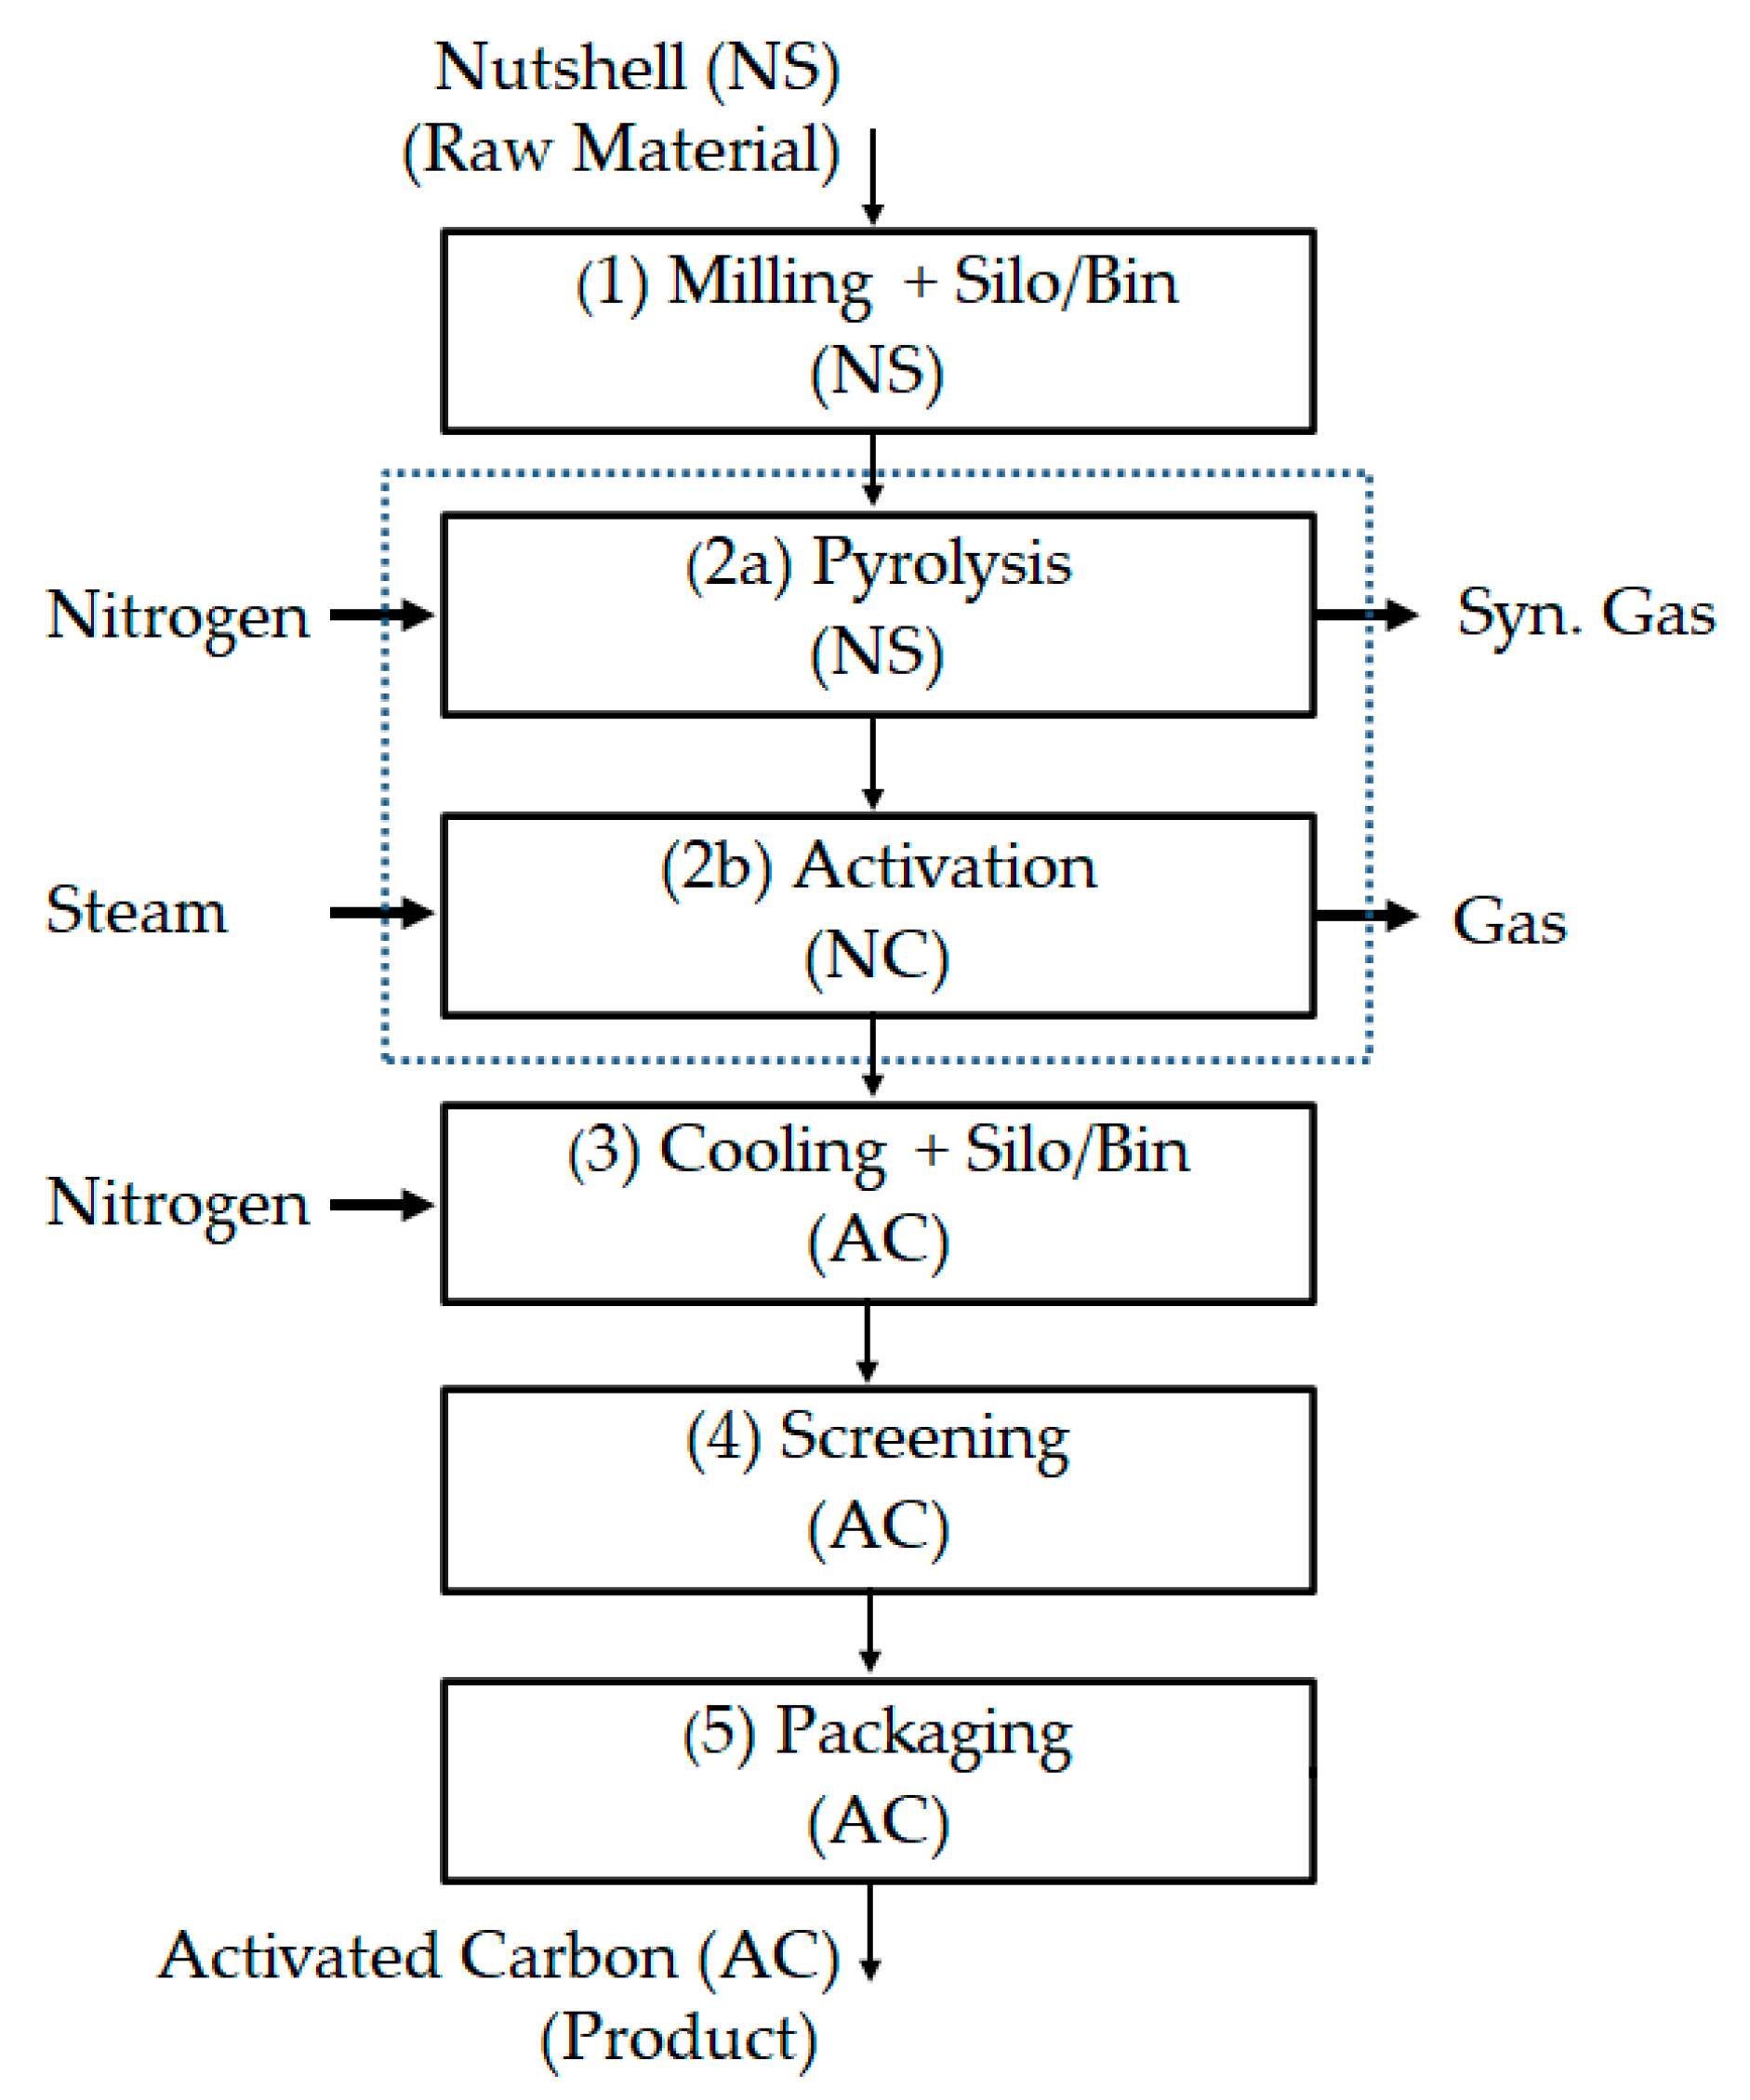
6]. On the other hand, two relevant processes are involved in physical activation. The first process involves the pyrolysis of the raw material in an inert atmosphere that usually uses a gaseous stream of nitrogen. The second stage of activation involves gases, such as water vapor, carbon dioxide, or a mixture of these gasses with nitrogen or air in different proportions at high temperatures for the final activation [
5,
6].
Generally, the raw material’s pyrolysis process takes place at temperatures between 400 and 600 °C, while the activation stage takes place between 800 and 1100 °C [
5,
6]. In comparison with chemical activation, physical activation can be considered clean and environmentally friendly, which would avoid the incorporation of impurities from chemical activation agents. There are various organic materials that serve as raw materials for obtaining activated coals, such as coconut shells [
7], rice shells [
8], palm shells [
9], peanut shells [
10], and nutshells [
11], among others [
5,
6]. Recent studies have shown that physically activating carbon with steam using nutshells as a precursor has presented interesting characteristics for applications in the removal of heavy metals from effluents of polluted waters [
12,
13]. In this sense, it could be interesting to develop a complete economic evaluation of a nutshell activated carbon production plant, using the parameters and conditions used in the laboratory.
There are few reports on the analysis of production costs of activated carbon production plants. Noticeably, the study of Ng et al. [
14] in 2003 considers the production-cost analysis for an activated carbon plant from pecan shells. The study compares the physical activation with steam and the chemical activation with phosphoric acid and reaches a production cost of 2.72 USD/kg and 2.89 USD/kg, respectively. Choy et al. [
15] in 2005 reported on the production of activated carbon from bamboo waste and the evaluation of two production plants: one independent and one integrated. The study presents a thorough economic investigation and sensitivity analysis, estimating values for the internal return rate of 13.0% and 20.1%, respectively, among other economic indicators of interest. Subsequently, Lima et al. [
16] in 2008 reported the capital and operating costs for an activated carbon plant from poultry waste, obtaining a global production cost of 1.44 USD/kg. Next, Stavropoulos et al. [
17] in 2009 reported different production costs and other economic indicators for physically and chemically activated carbon production processes based on precursors, such as used tires, wood, petroleum coke, carbon black, coal, and lignite. The authors obtained production costs of 2.23 USD/kg, 2.49 USD/kg, 1.08 USD/kg, 1.22 USD/kg, 1.25 USD/kg and 2.18 USD/kg, respectively. Moreover, Vanreppelen et al. [
18] in 2011 reported results on the feasibility of a process to produce nitrogenous activated carbon by co-pyrolysis of a mixture of particle board (chipboard) and melamine formaldehyde resin, estimating different economic indicators and developing sensitivity analyses. Furthermore, Santadkha and Skolpap [
19] in 2017 reported the results of the economic evaluation for three types of production processes: first, a process of generating activated carbon from coconut shells; second, a process of regenerating coal obtained from the petrochemical industry, and, third, an integrated process that combines the production and regeneration of activated carbon. Nandiyanto [
20] in 2018 reported the economic feasibility of the production of activated carbon and silica particles from rice straw residues, obtaining various economic indicators, such as an internal return rate of 44.06% for a case study.
The present work updates, complements, and discusses new economic approaches on the implementation of an industrial plant that produces physically activated carbon from nutshells. Results can be extrapolated to various types of raw material, as long as the selected raw materials and process conditions are similar. Although the assumptions made for the selected production process provide an adequate initial technical basis for the economic evaluation of a production plant at the industrial scale, there are limitations related to the conditions provided in this particular work. In this sense, the precision of this study is highly dependent on the variation in the cost of the main equipment, the cost of the raw material, the sale price of the product, and the estimated operating conditions of the production process. Another weakness may be related to the use of the factorial method to estimate the total capital investment used to calculate the economic indicators of profitability. Future work should be directed towards the optimization of the selected production process, through the use of a suitable chemical process simulation software. This information would greatly improve the economic study.
4. Discussion
It is important to mention that the costs reported in the bibliography are linked to different time periods, which may affect the comparisons with respect to the values estimated in this work. In this sense, the cost comparison described below considers this as a limitation of the present work. As established in
Table 1, the cost estimate of the main equipment and auxiliary equipment reached an updated value of USD 1,063,064, which is, in some cases, similar to the costs found in the literature for activated carbon production processes, using the physical route with steam as an activating agent. This value was estimated considering a plant size to process 6.6 ton/day of waste nutshells as raw materials. On the other hand, some of the most current costs are related to the estimate made by Lima et al. [
16] in 2008, which reported a total cost of main equipment of USD 1,776,000, to process 20 tons/day of poultry litter. Subsequently, Stavropoulos et al. [
17] in 2009 reported a total cost for process equipment of USD 1,154,416, for a production size of 4.5 ton/day considering various raw materials. More recently, Santadkha and Skolpap [
19] in 2017 reported a total cost of main machinery and equipment of USD 1,301,429 for the generation of activated carbon from coconut shells and the regeneration of spent activated carbon obtained from the petrochemical industries, considering a plant capacity of 12 ton/day and 10 ton/day, respectively.
As previously mentioned,
Table 3 shows that the total manufacturing cost for the base case reached a value of USD 3,821,529, and the total cost of the product reached a value of USD 4,523,987. If we divide these values by the total annual activated carbon production quantity of 2,100,000 kg/year, we obtain a manufacturing cost of USD 1.82 per kg of product and USD 2.15 per kg of product, respectively. For the calculation of these values, a non-zero cost for the raw material of USD 1,124,894 per year was considered. This makes a difference with other published studies that consider a marginal cost or do not consider costs in this important item, which can decrease the total cost of the product and lead to unrealistic conclusions about production costs, since any waste material used in industrial processes acquires economic value [
17].
The values mentioned above can be compared with some costs reported in similar studies, being lower, for example, than the cost of the product obtained by Ng et al. [
14] in 2003 who reached a production cost of activated carbon from pecan shells of USD 2.72 per kg and USD 2.89 per kg when the process was carried out by physical activation with steam and chemical activation with phosphoric acid, respectively, considering a minimum cost of USD 35,000 for raw materials. The costs obtained in the present work compare favorably with the costs reported by Stavropoulos et al. [
17] in 2009 who reported production costs of USD 2.23 per kg, USD 2.49 per kg, and USD 2.18 per kg for the production of physically activated carbon with steam, using worn tires, wood, and lignite as raw materials, respectively. It is important to highlight that these last values were obtained considering a zero cost for raw materials. On the other hand, in the same study, lower production costs of USD 1.92 per kg, USD 1.84 per kg, and USD 1.72 per kg were reported for the production of chemically activated carbon with KOH, using worn tires, wood, and lignite as raw materials, respectively, considering a zero cost for raw materials. However, when a non-zero value was considered for raw materials, higher costs were calculated as USD 11.4 per kg, USD 6.39 per kg, and USD 5.38 per kg for the same precursors, respectively. In another study developed by Lima et al. [
16] a lower production cost of USD 1.44 per kg was reported for an activated carbon plant from poultry waste, using physical activation with steam and a subsequent washing step with hydrochloric acid, followed by a step rinse with water. However, the cost was obtained considering a cost for raw materials of USD 269,537 per year, including the transportation of poultry waste, which is below the value considered here.
4.1. Economic Evaluation (10-Year Production Project)
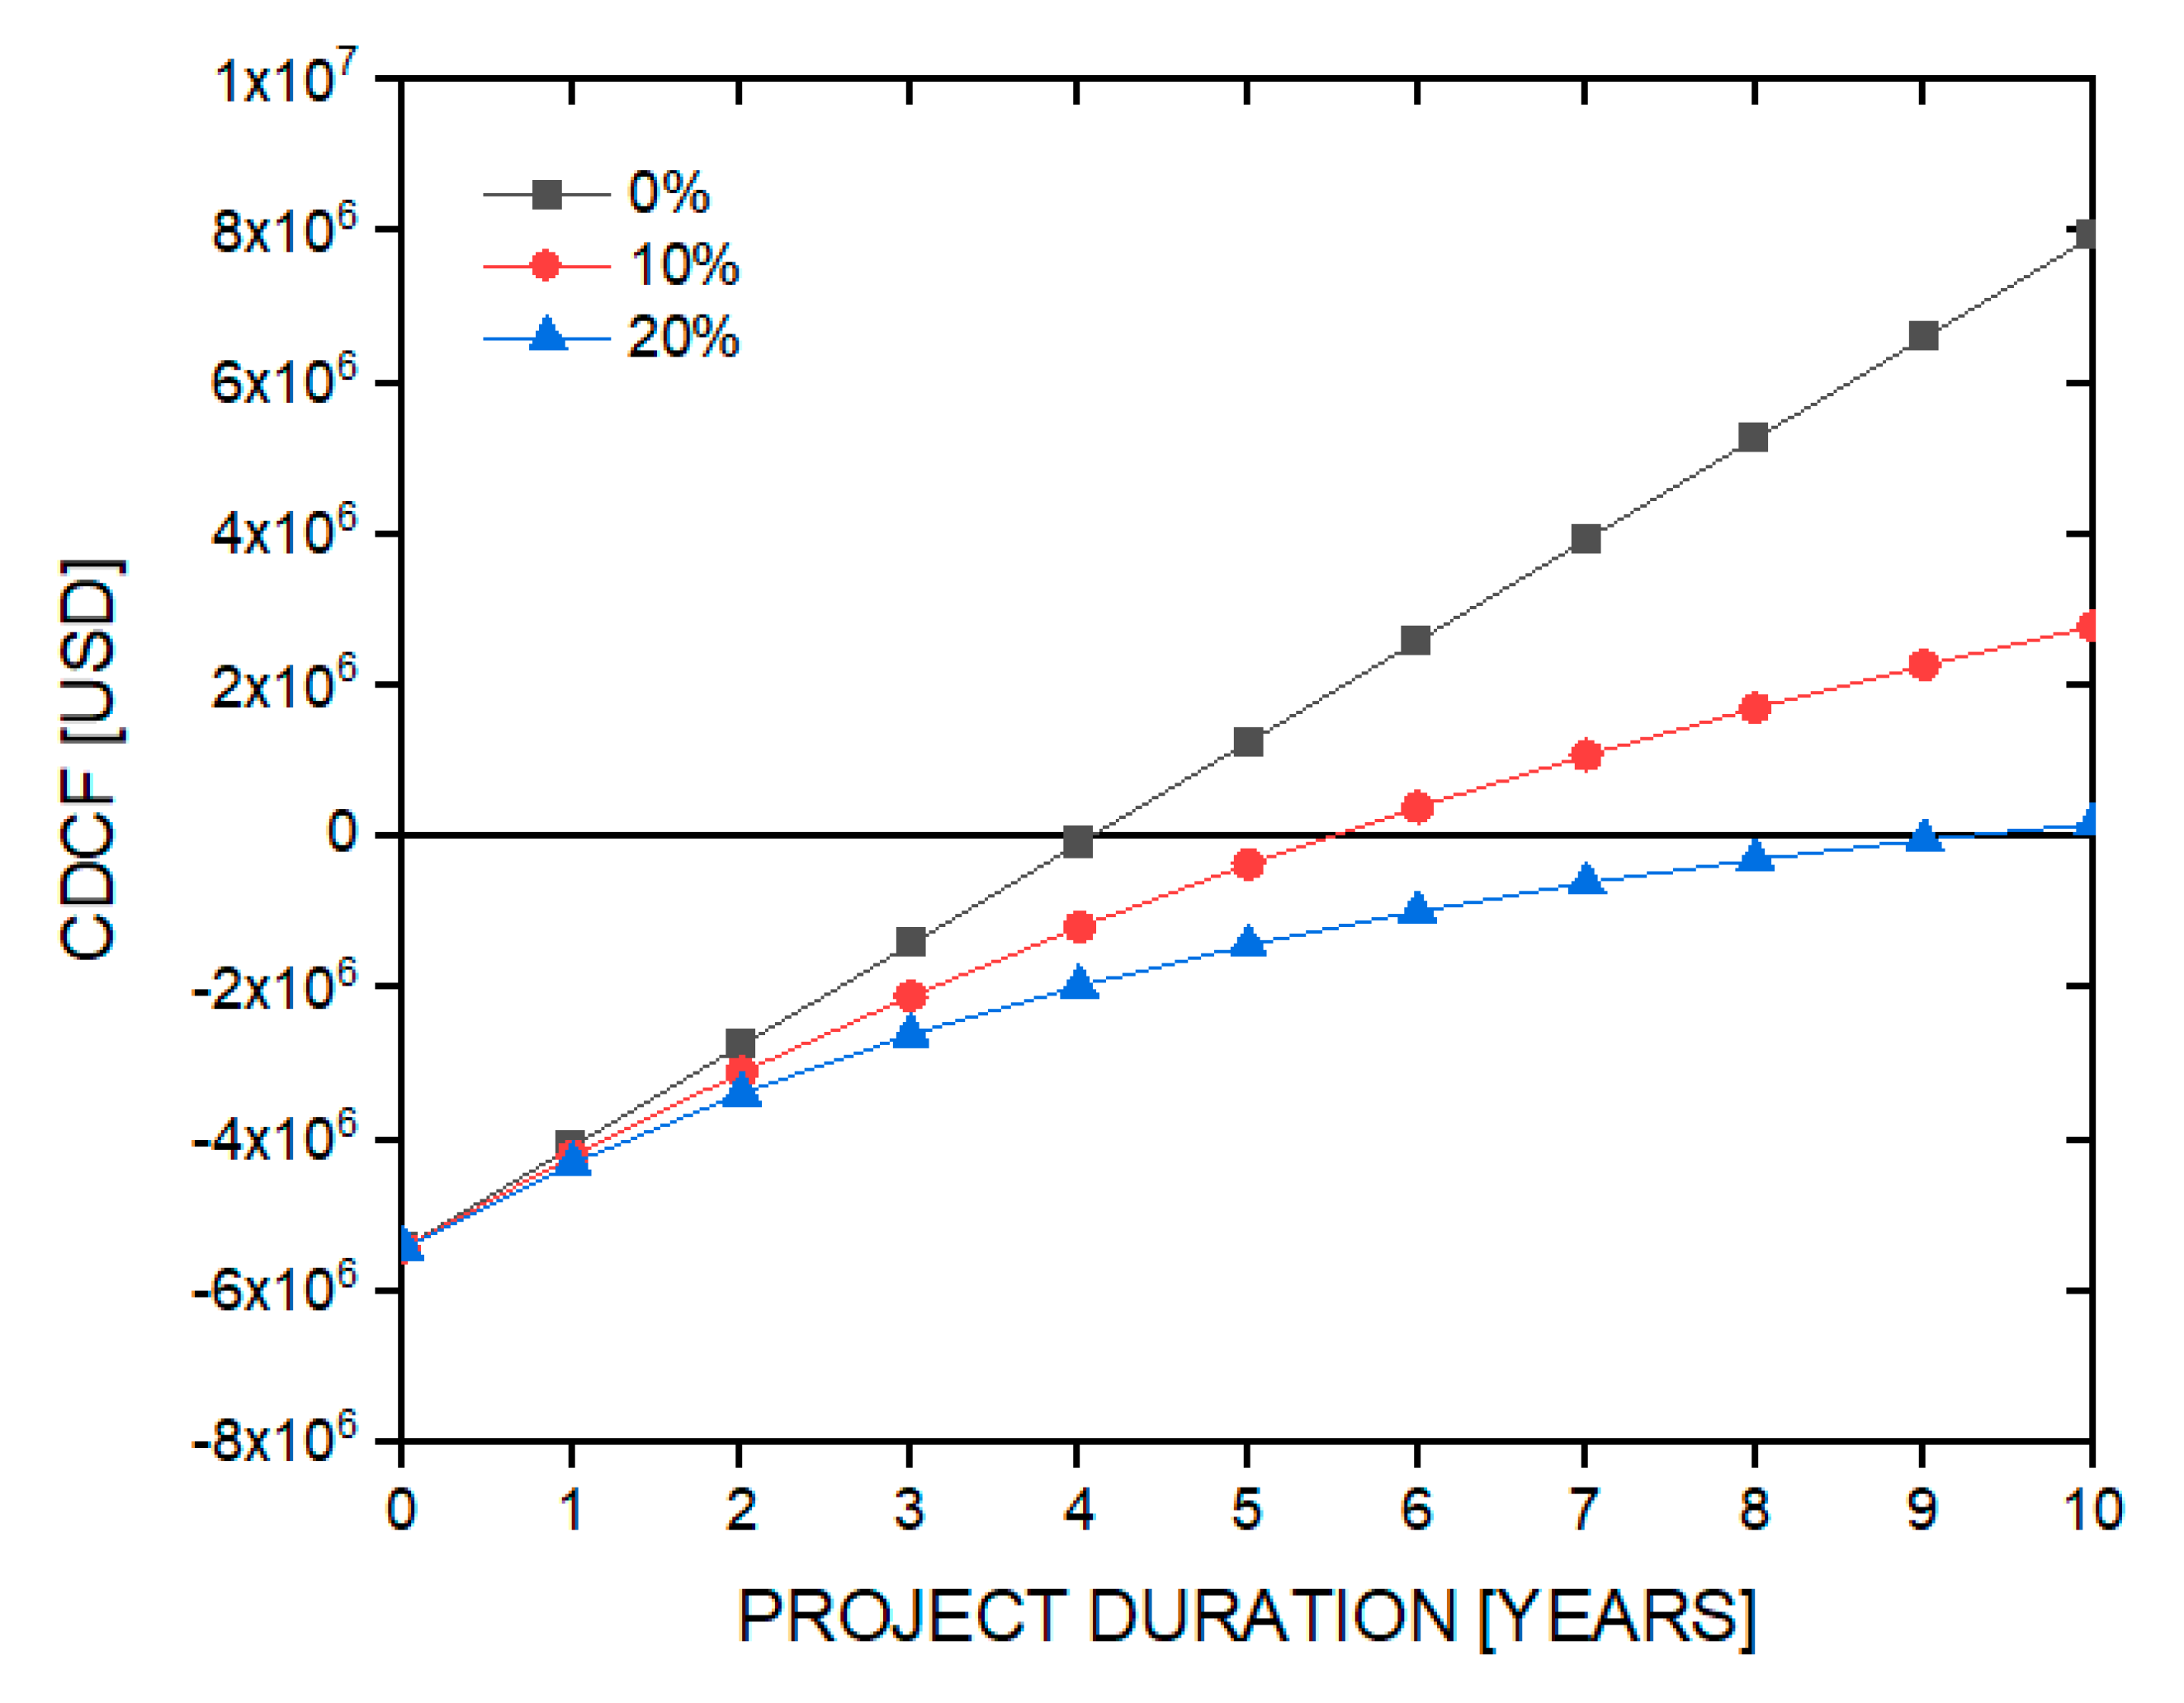
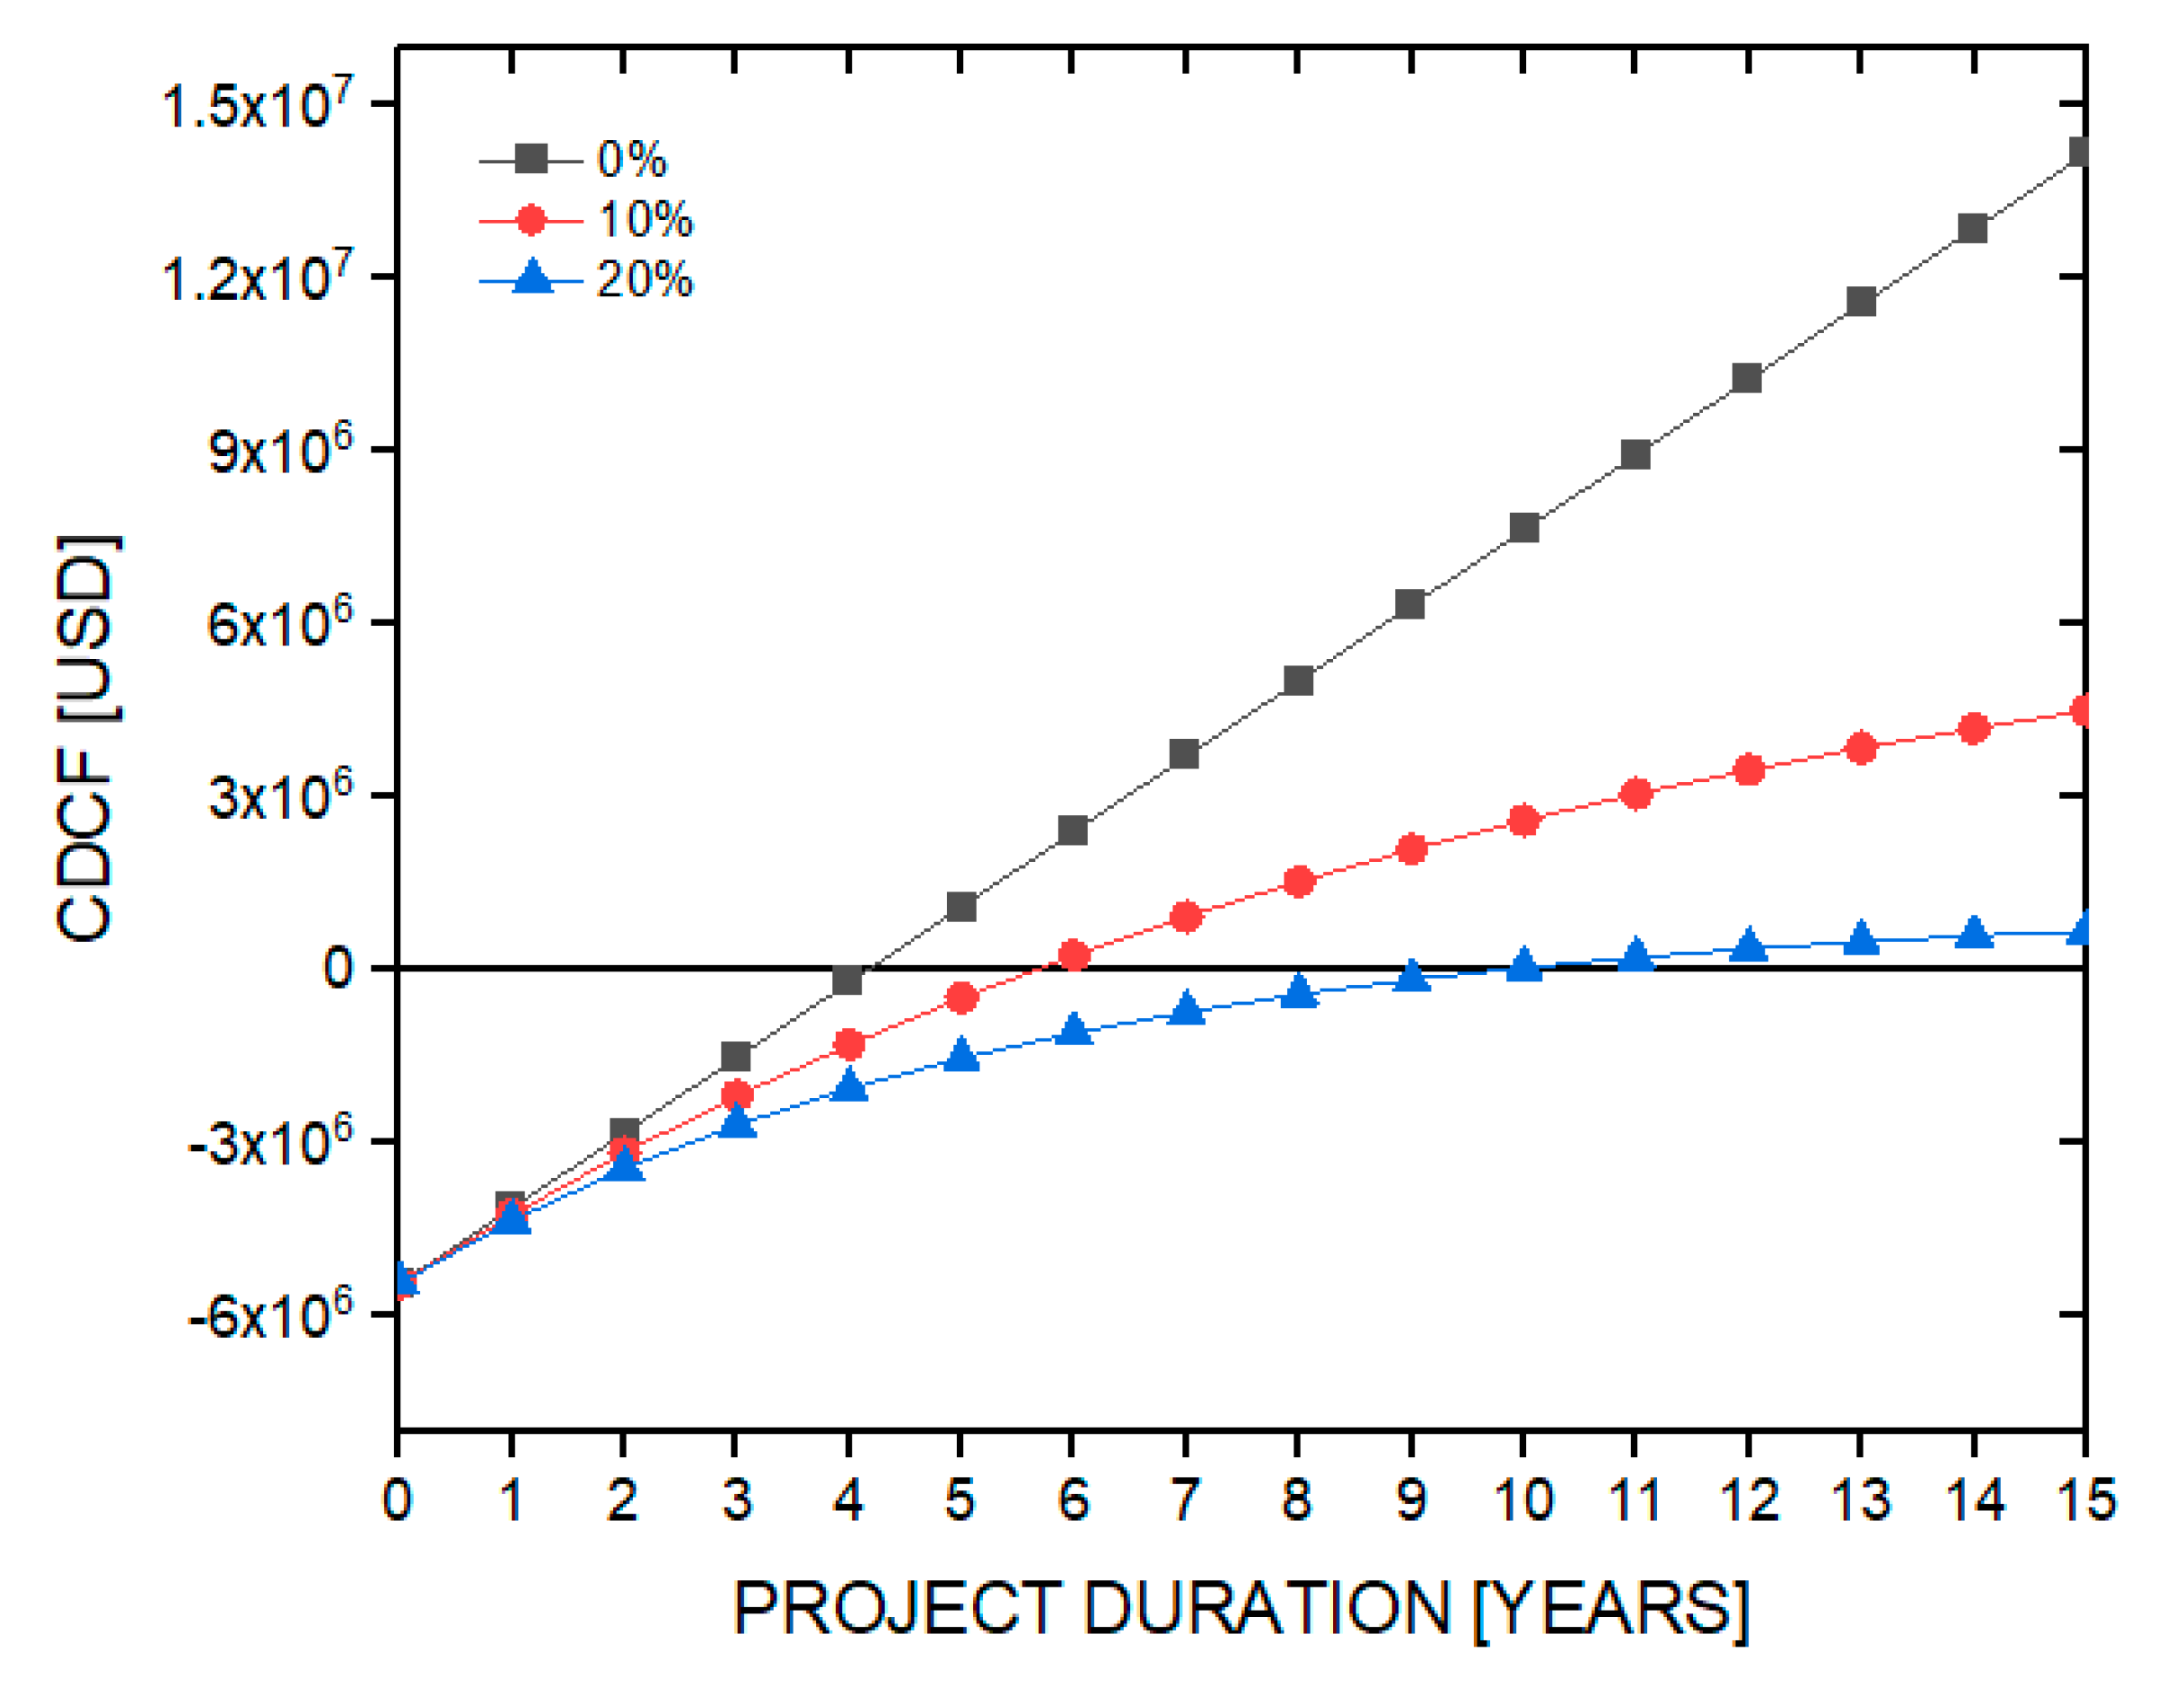
Figure 2 shows the cumulative discounted cash-flow diagrams (CDCF) at different applied discount rates and without external financing, to determine the payback period for the capital investment. The payback period was after the fourth year of production, giving a net present value of USD 7,939,235 for a zero discount rate. For a 10% discount rate, the payback period was after the fifth year of production, giving a net present value of USD 2,785,624. Finally, for a discount rate of 20%, the investment recovery period was after the ninth year of production, giving a net present value of USD 176,231. In all cases the return on investment was 25%. On the other hand,
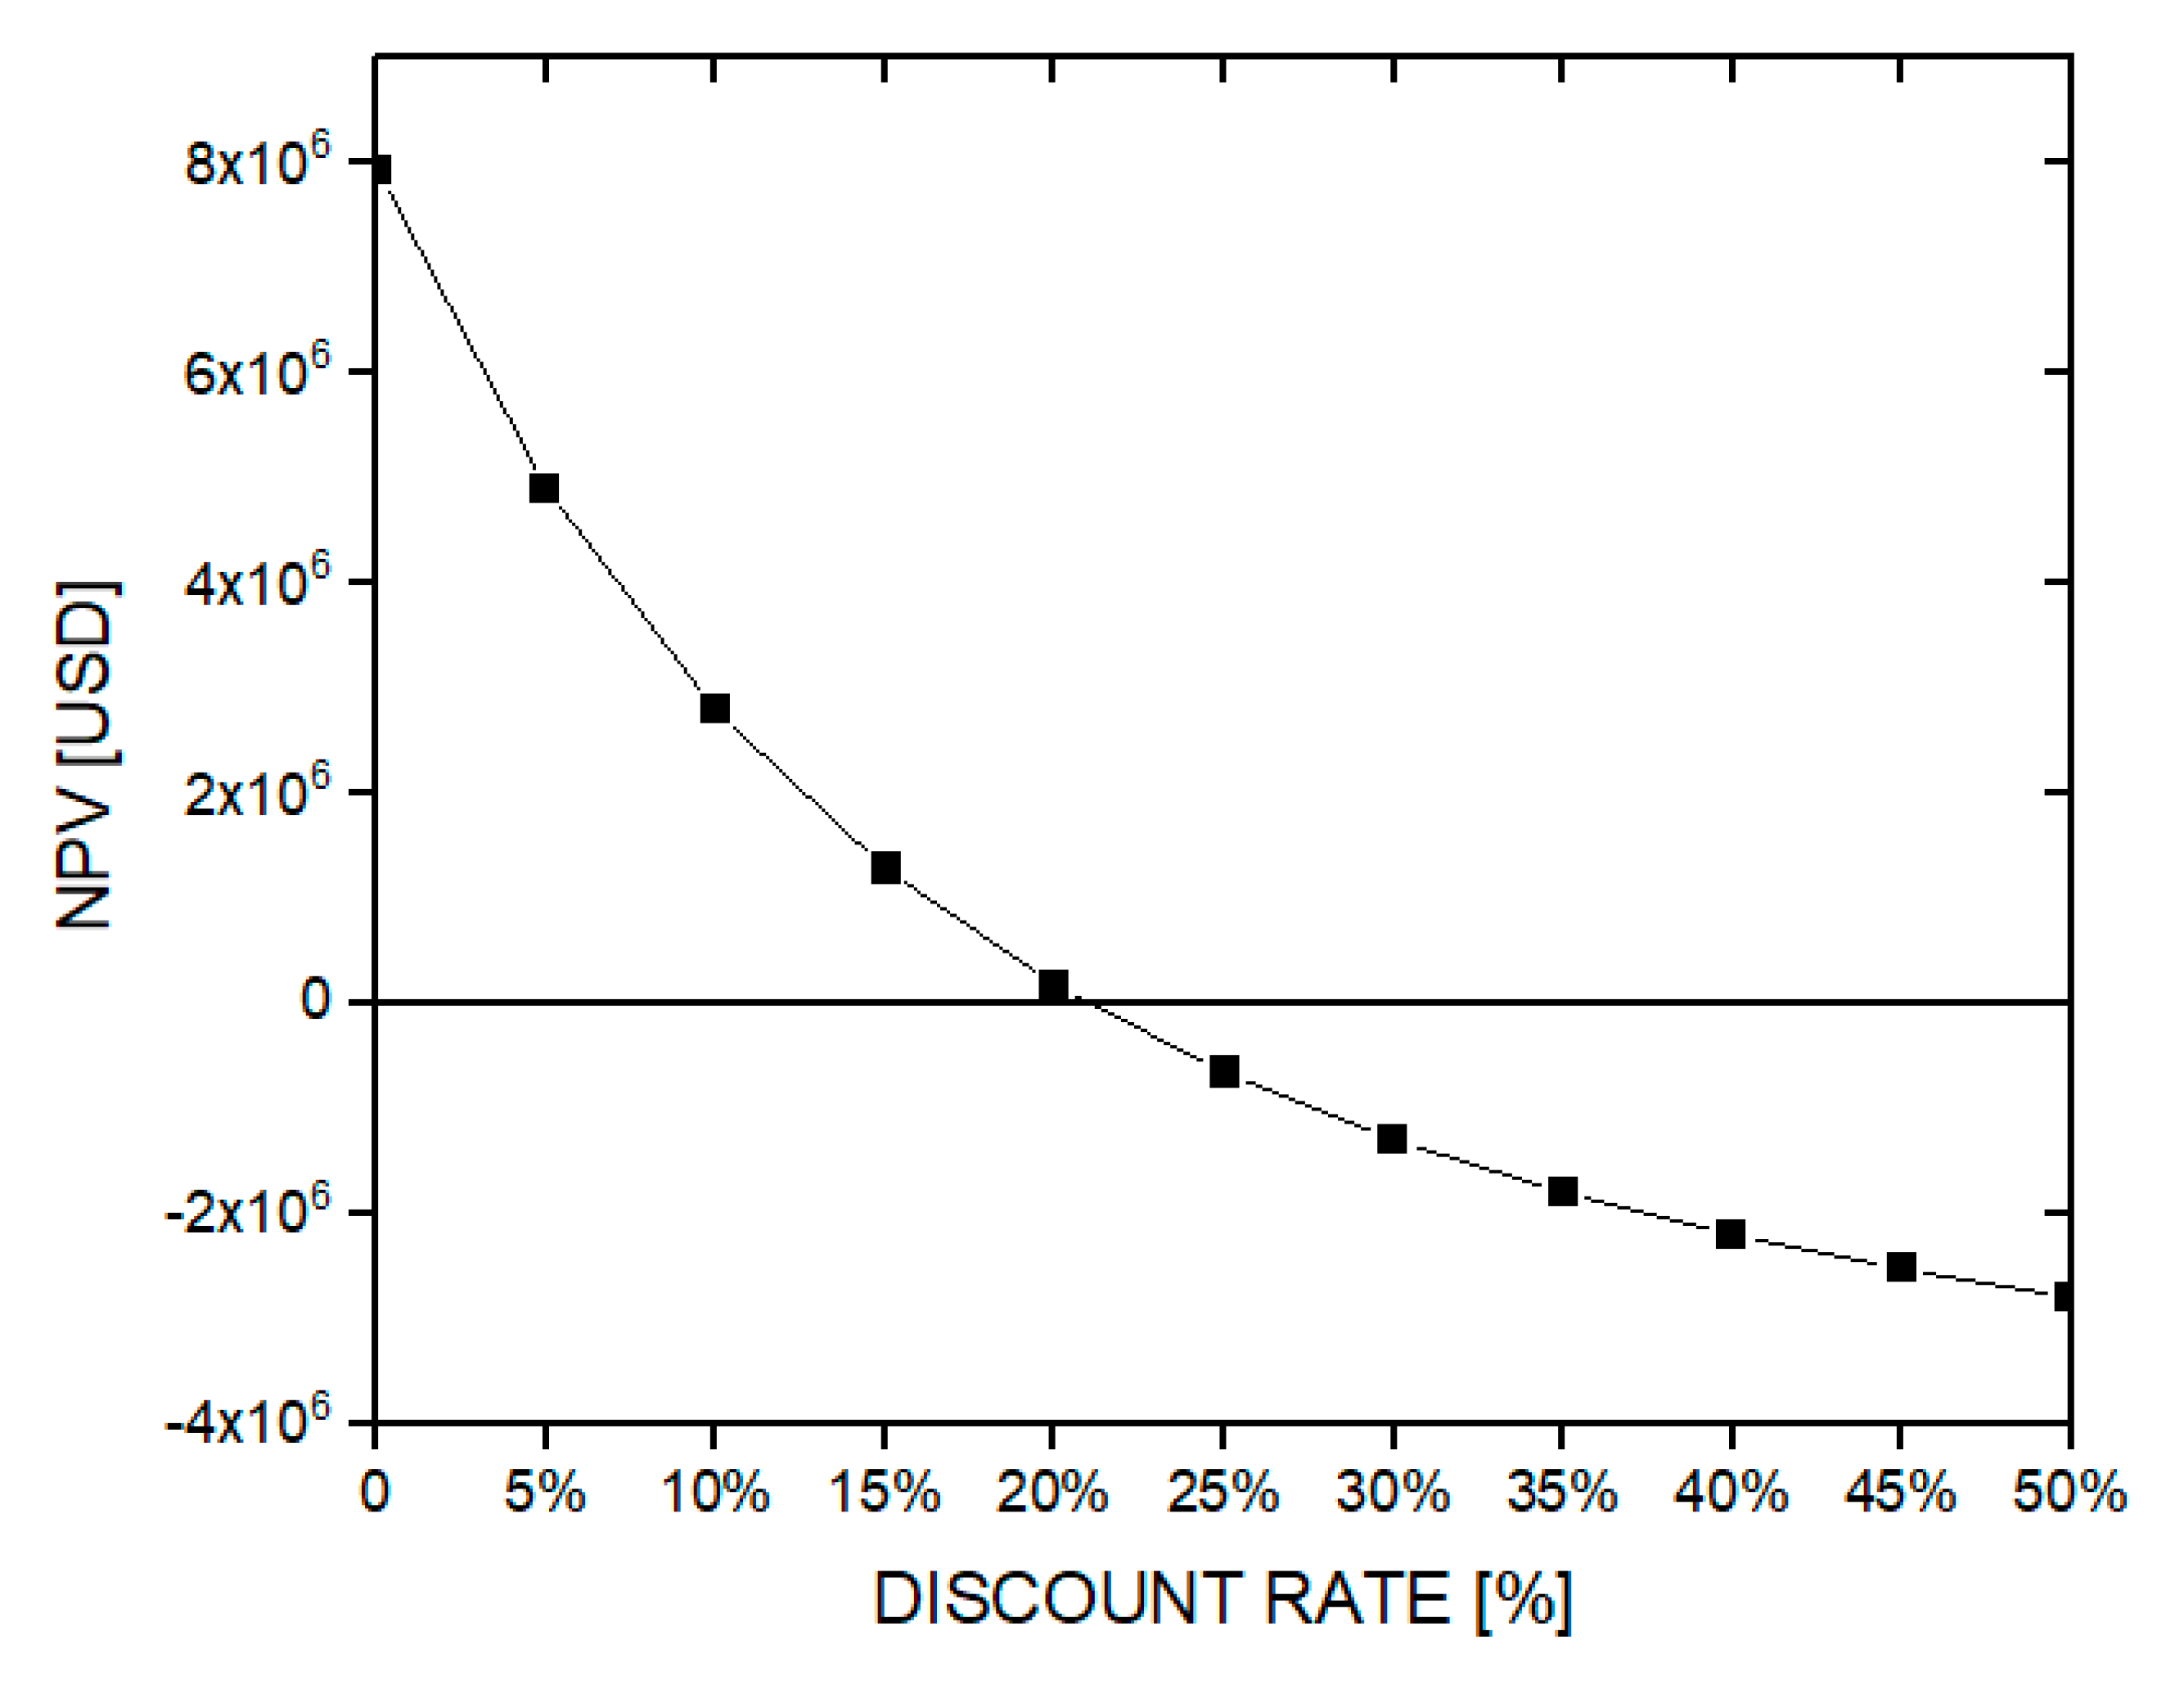
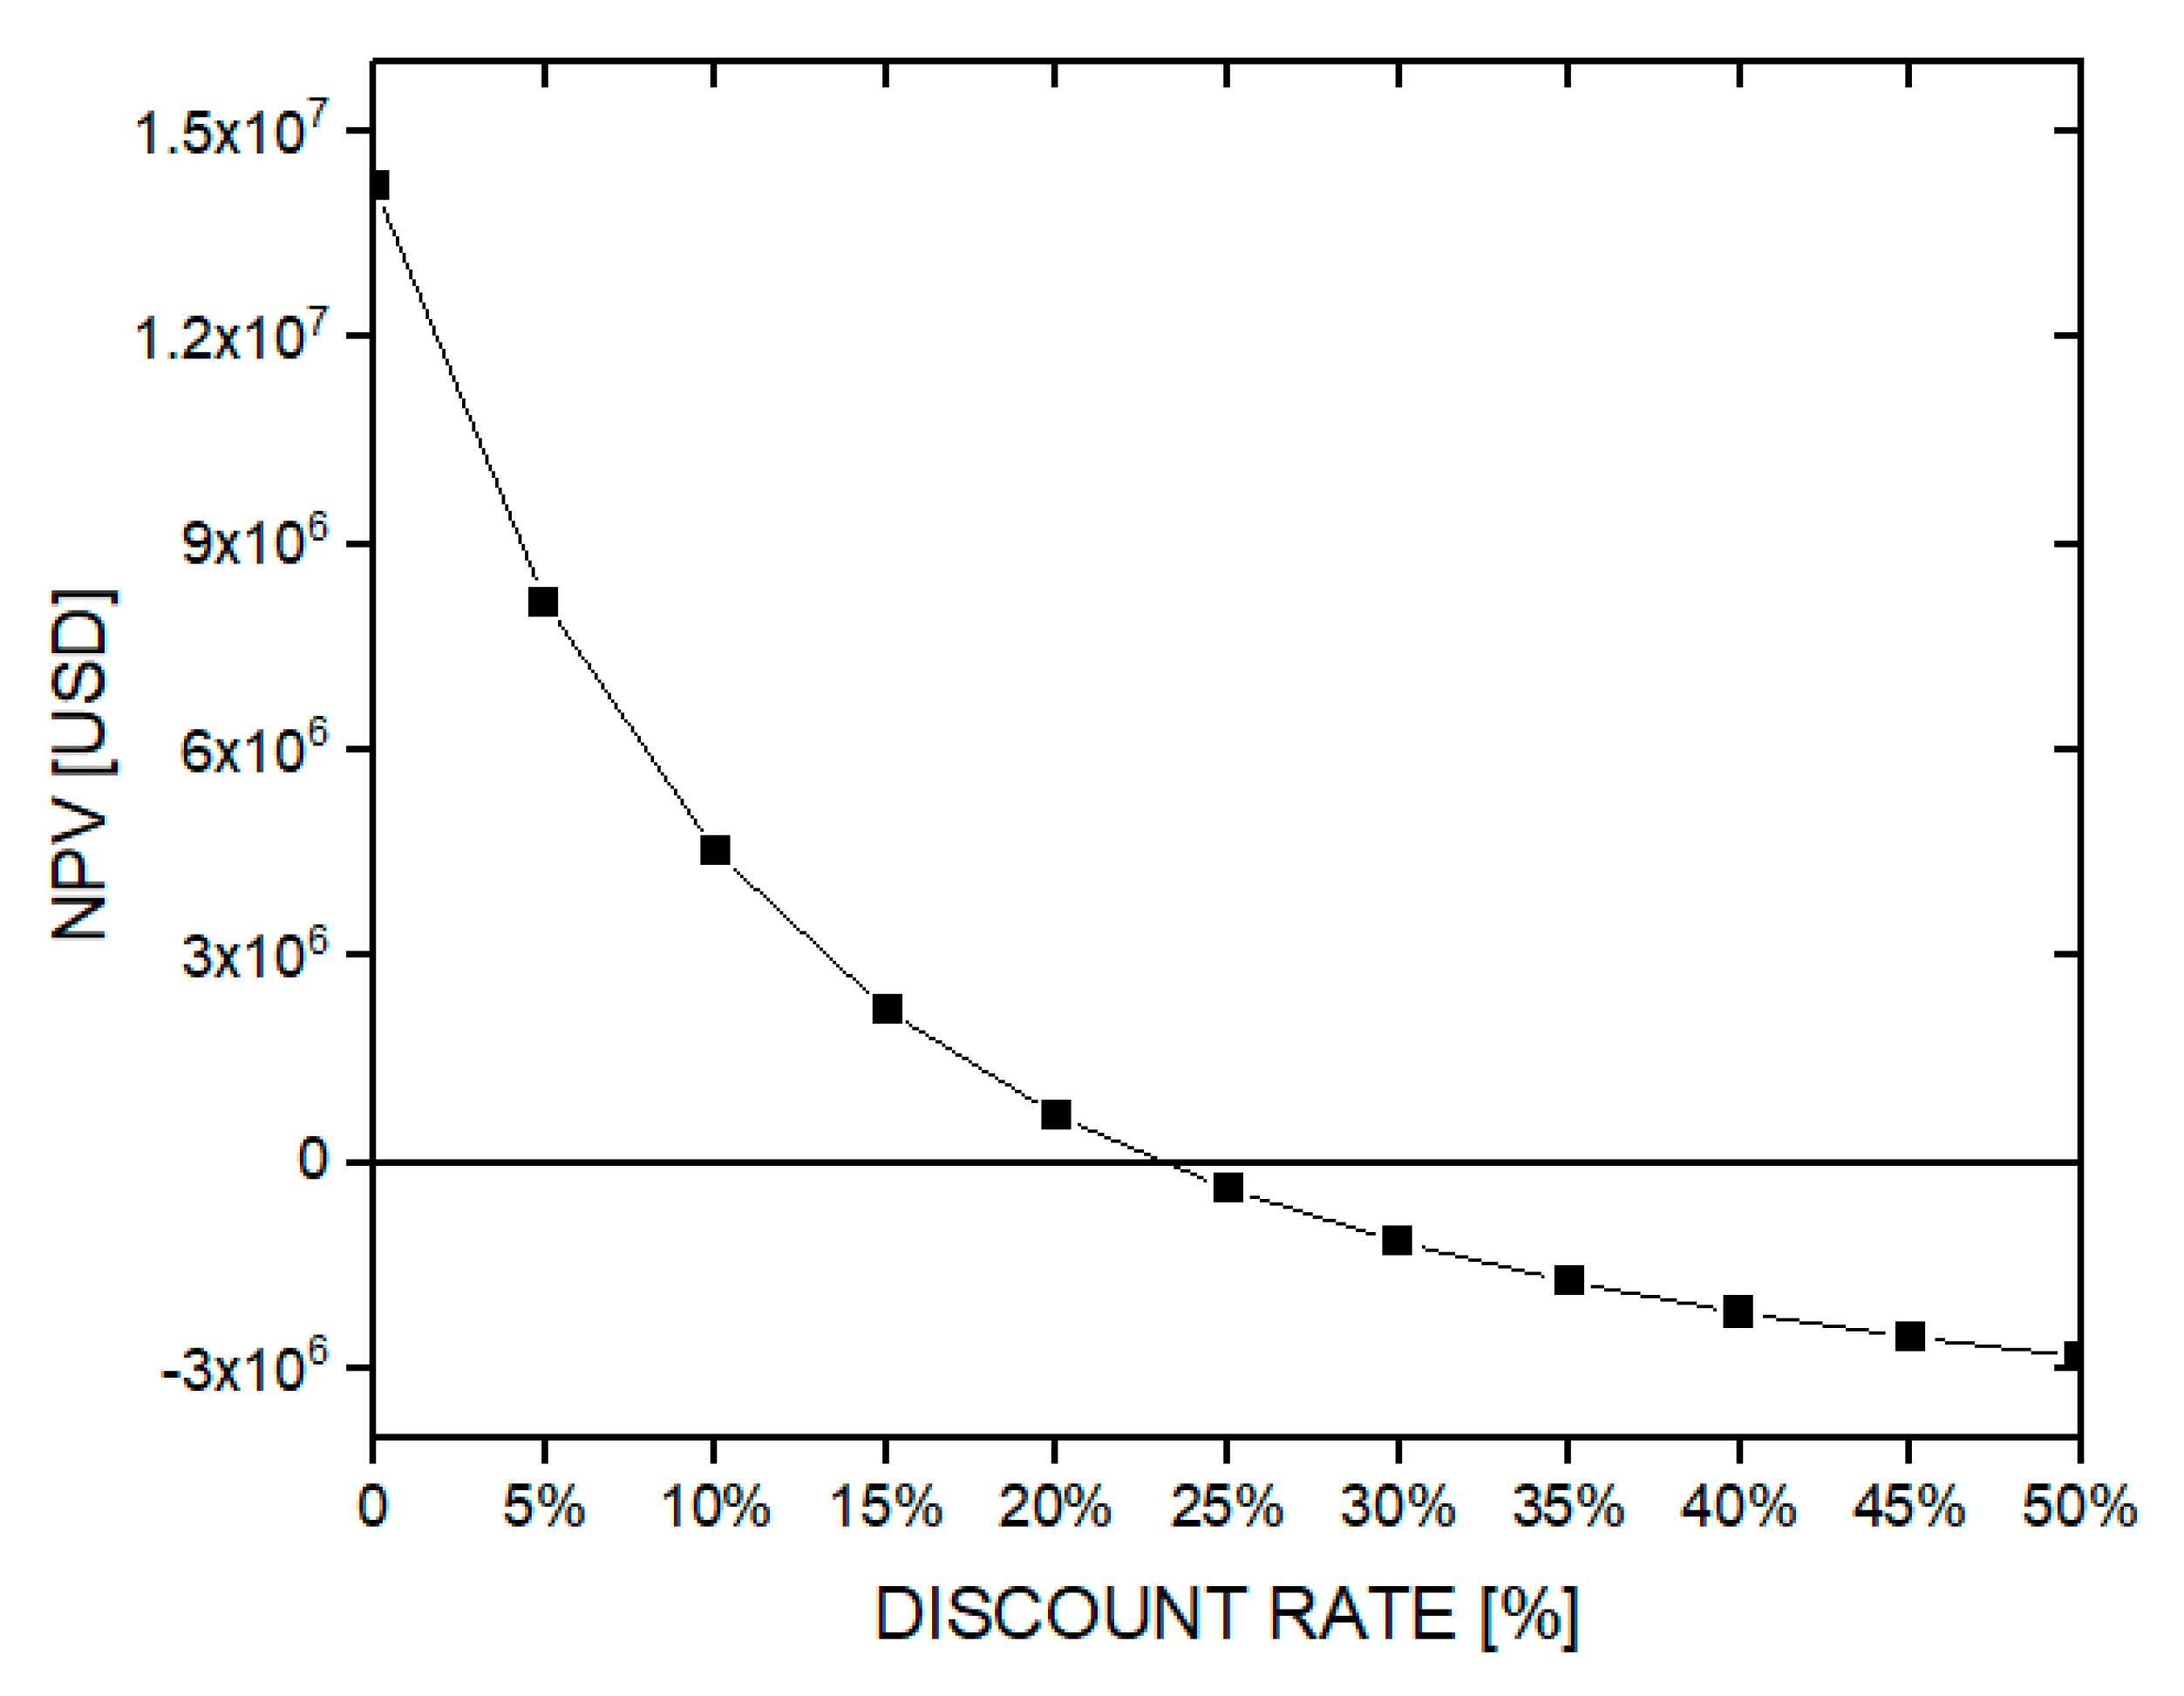
Figure 3 shows the variation curve of the net present value at different discount rates. The internal rate of return (IRR) was estimated at 21%, which is higher than the minimum discount rate (LDR) of 10%, which is generally used by companies for the evaluation of investment projects in chemical plants; therefore, the project is viable for this particular condition.
4.2. Sensitivity Analysis (Base Case of 10 Years of Production)
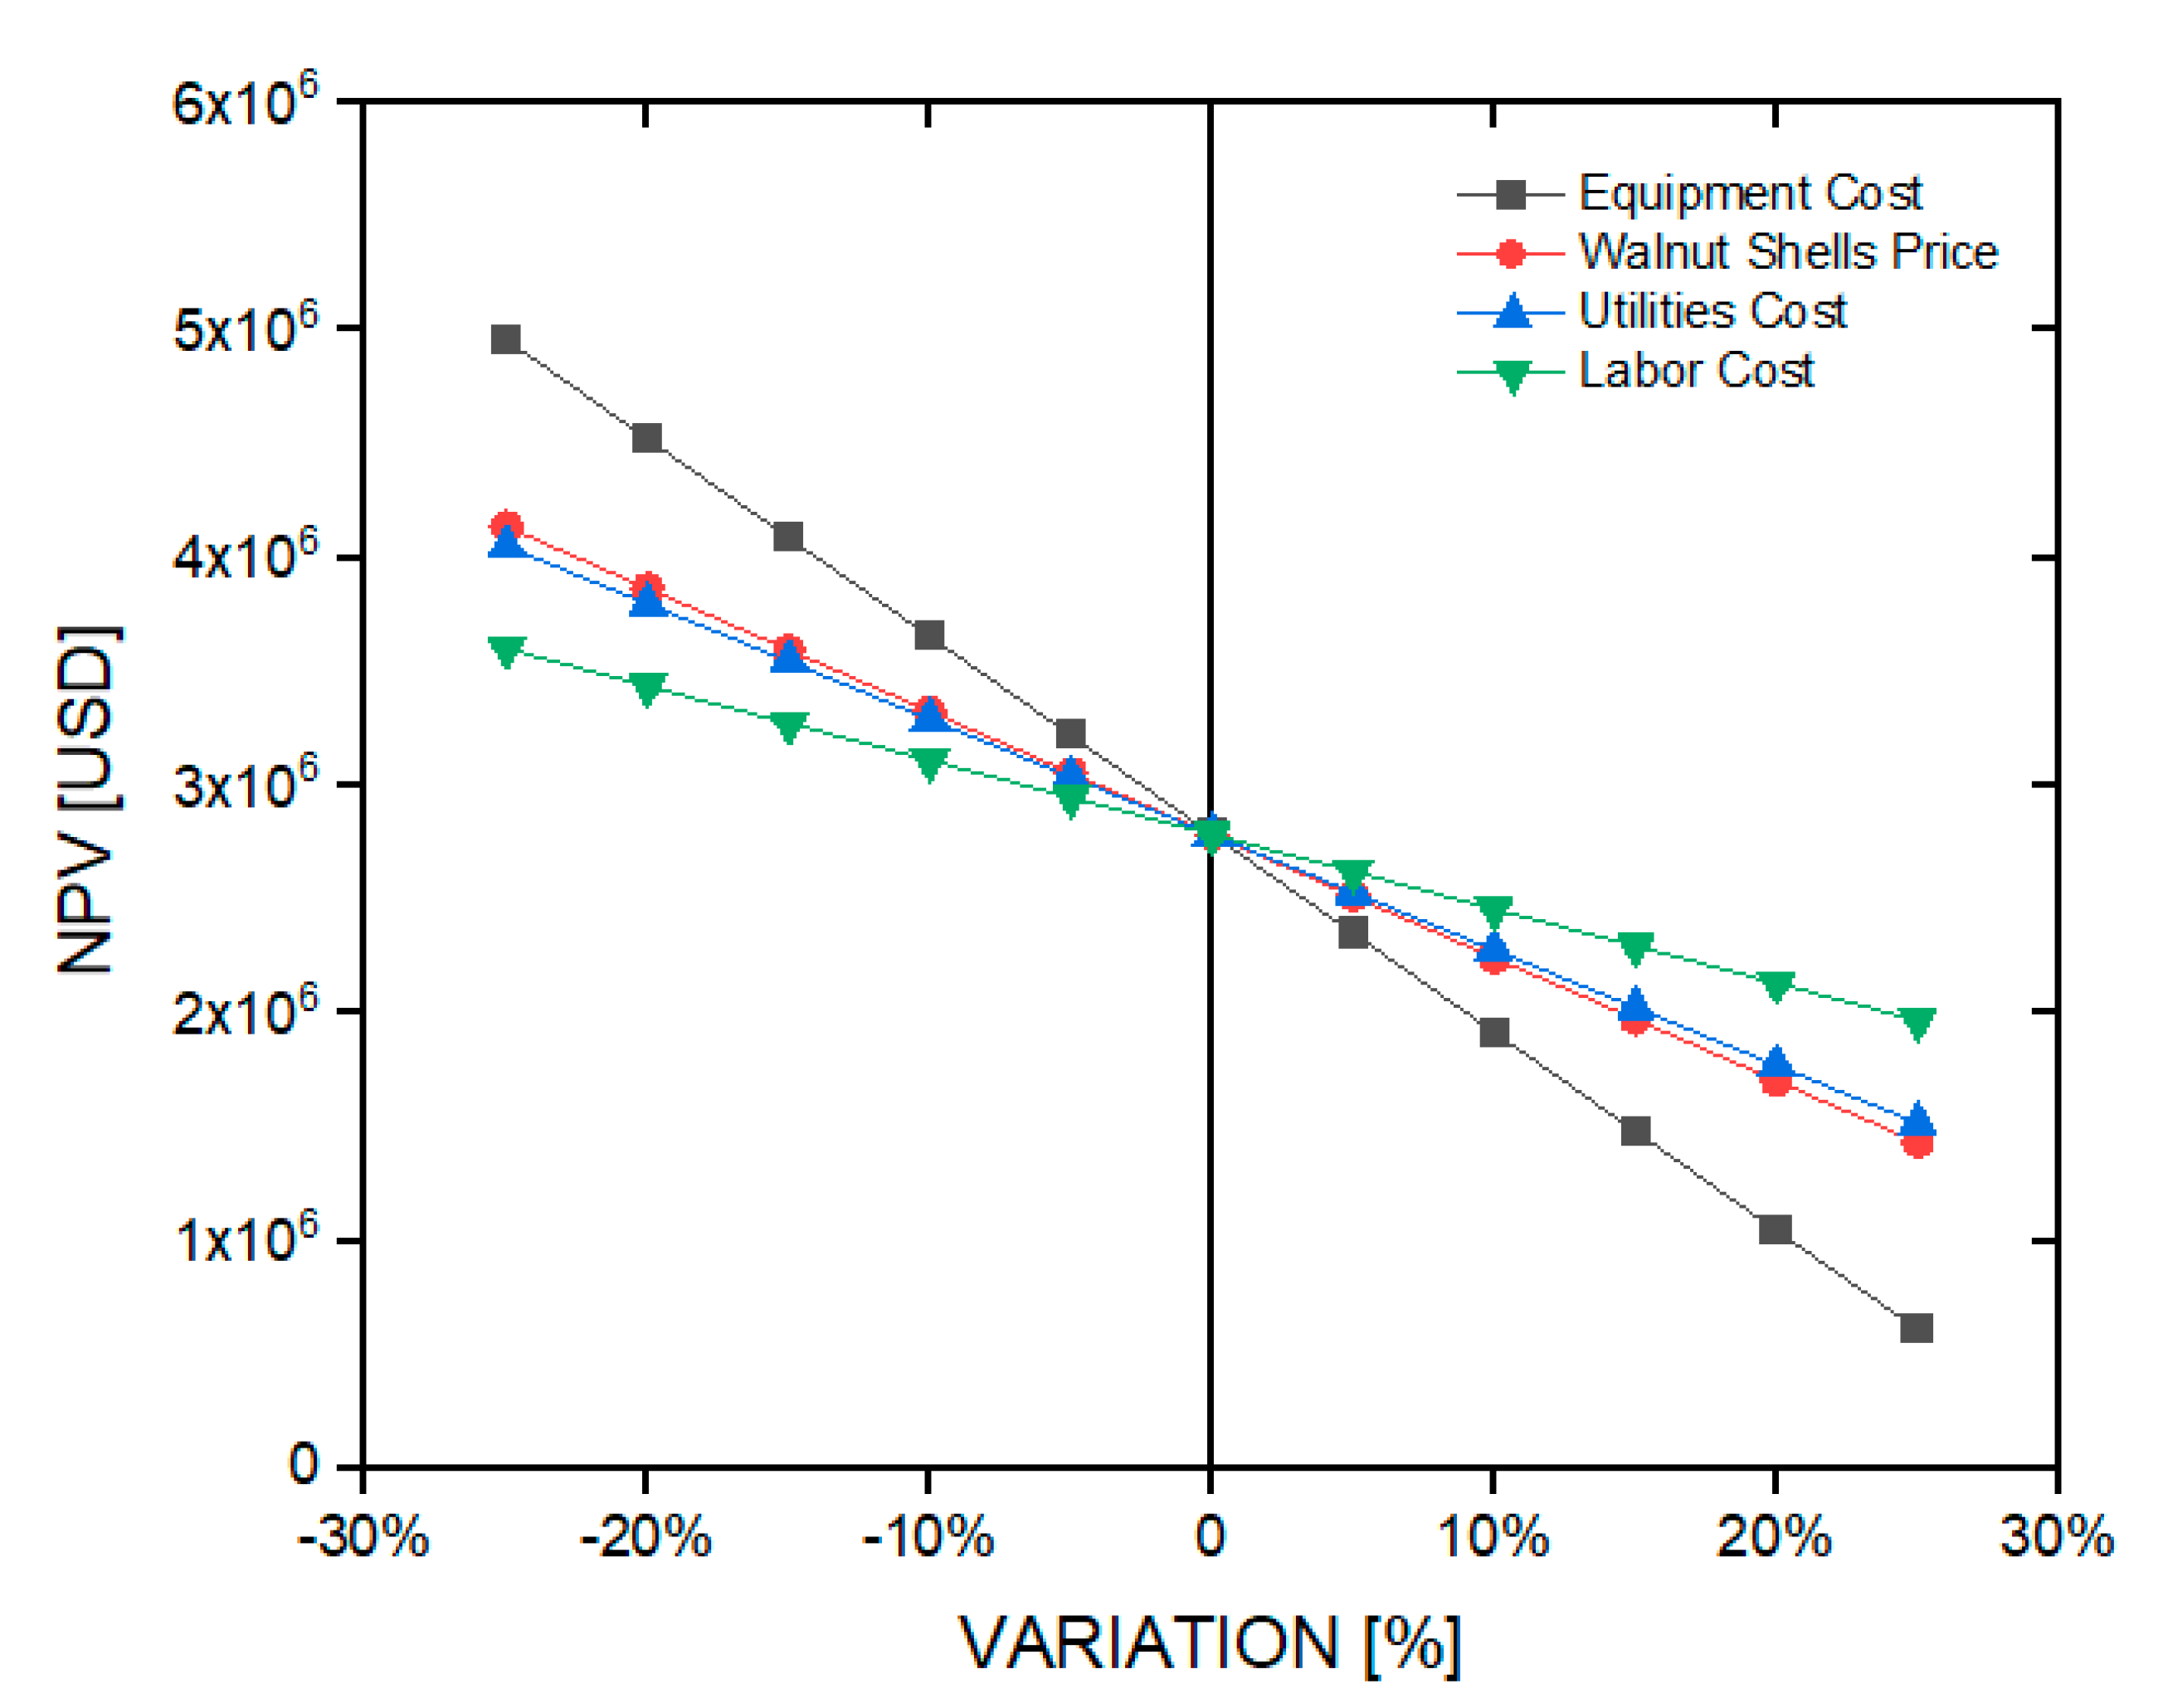
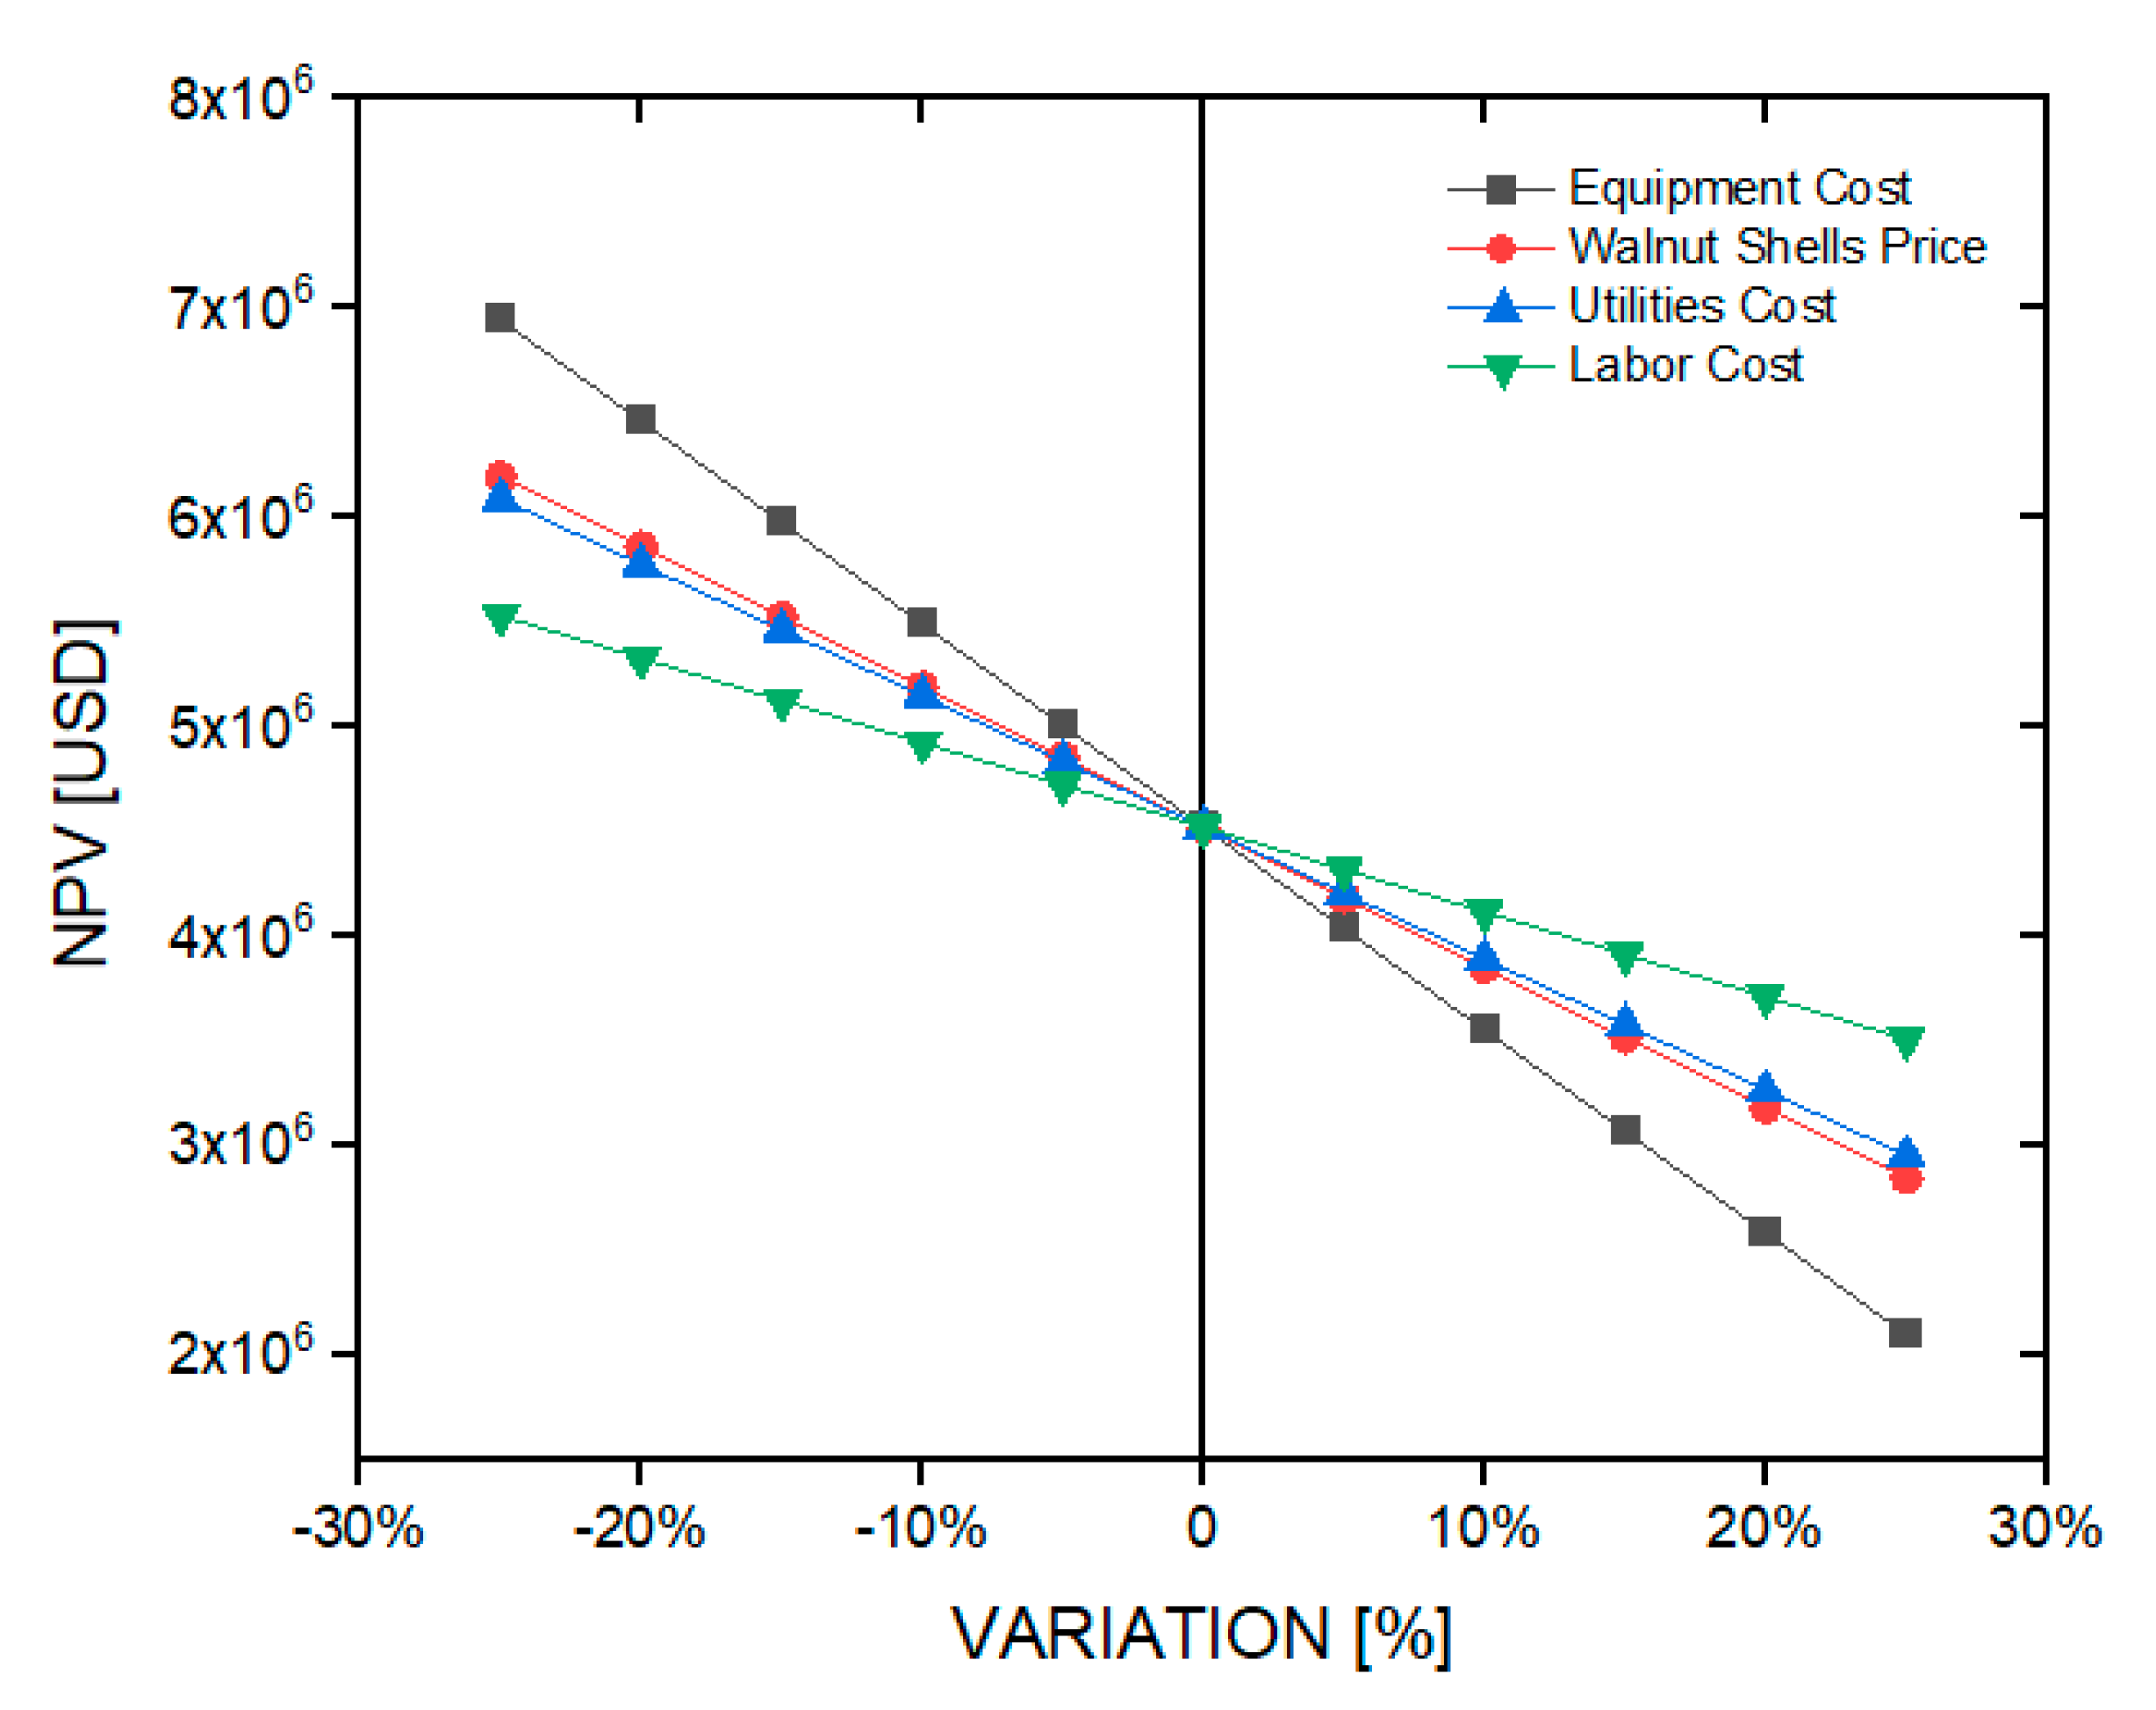
Figure 4 shows the effect on the NPV of the project’s cash flow at ten years of production as a base case (using a tax rate of 27% and an LDR of 10% per year) due to the variation of ±25% in the cost of the equipment delivered to the plant, including the auxiliary equipment, the purchase price of the raw material (nutshells), the cost of basic services, and the cost of operational labor. The NPV varied by up to ±78% when the cost of equipment delivered was modified from the base case (USD 1,063,044). When the equipment delivered cost changed by +25%, a minimum NPV of USD 611,708 was obtained, along with an IRR of 12% and an ROI of 18% for this case. On the other hand, the NPV had a maximum variation of ±49% when the nutshells’ raw material price changed for the base case (100 USD/ton), this variation being lower than the previous example. The NPV reached a minimum value of USD 1,432,787, when the price of the raw material was increased by 25%, obtaining an IRR of 16% and an ROI of 21%.
When the costs of the basic services were modified, the NPV had a ±46% variation lower than in the previous cases. Thus, the NPV reached a minimum value of USD 1,518,102 when the cost of basic services increased by 25%, obtaining an IRR and ROI value of 16% and 21%, respectively. Finally, the NPV had an ±29% variation when the cost of operational labor was modified for the base case (USD 280,800). It was the smallest variation within the cases studied in this particular item. In this case, the NPV minimum was USD 1,969,277, when the operational labor cost increased by 25%, obtaining an 18% IRR and an ROI of 22%.
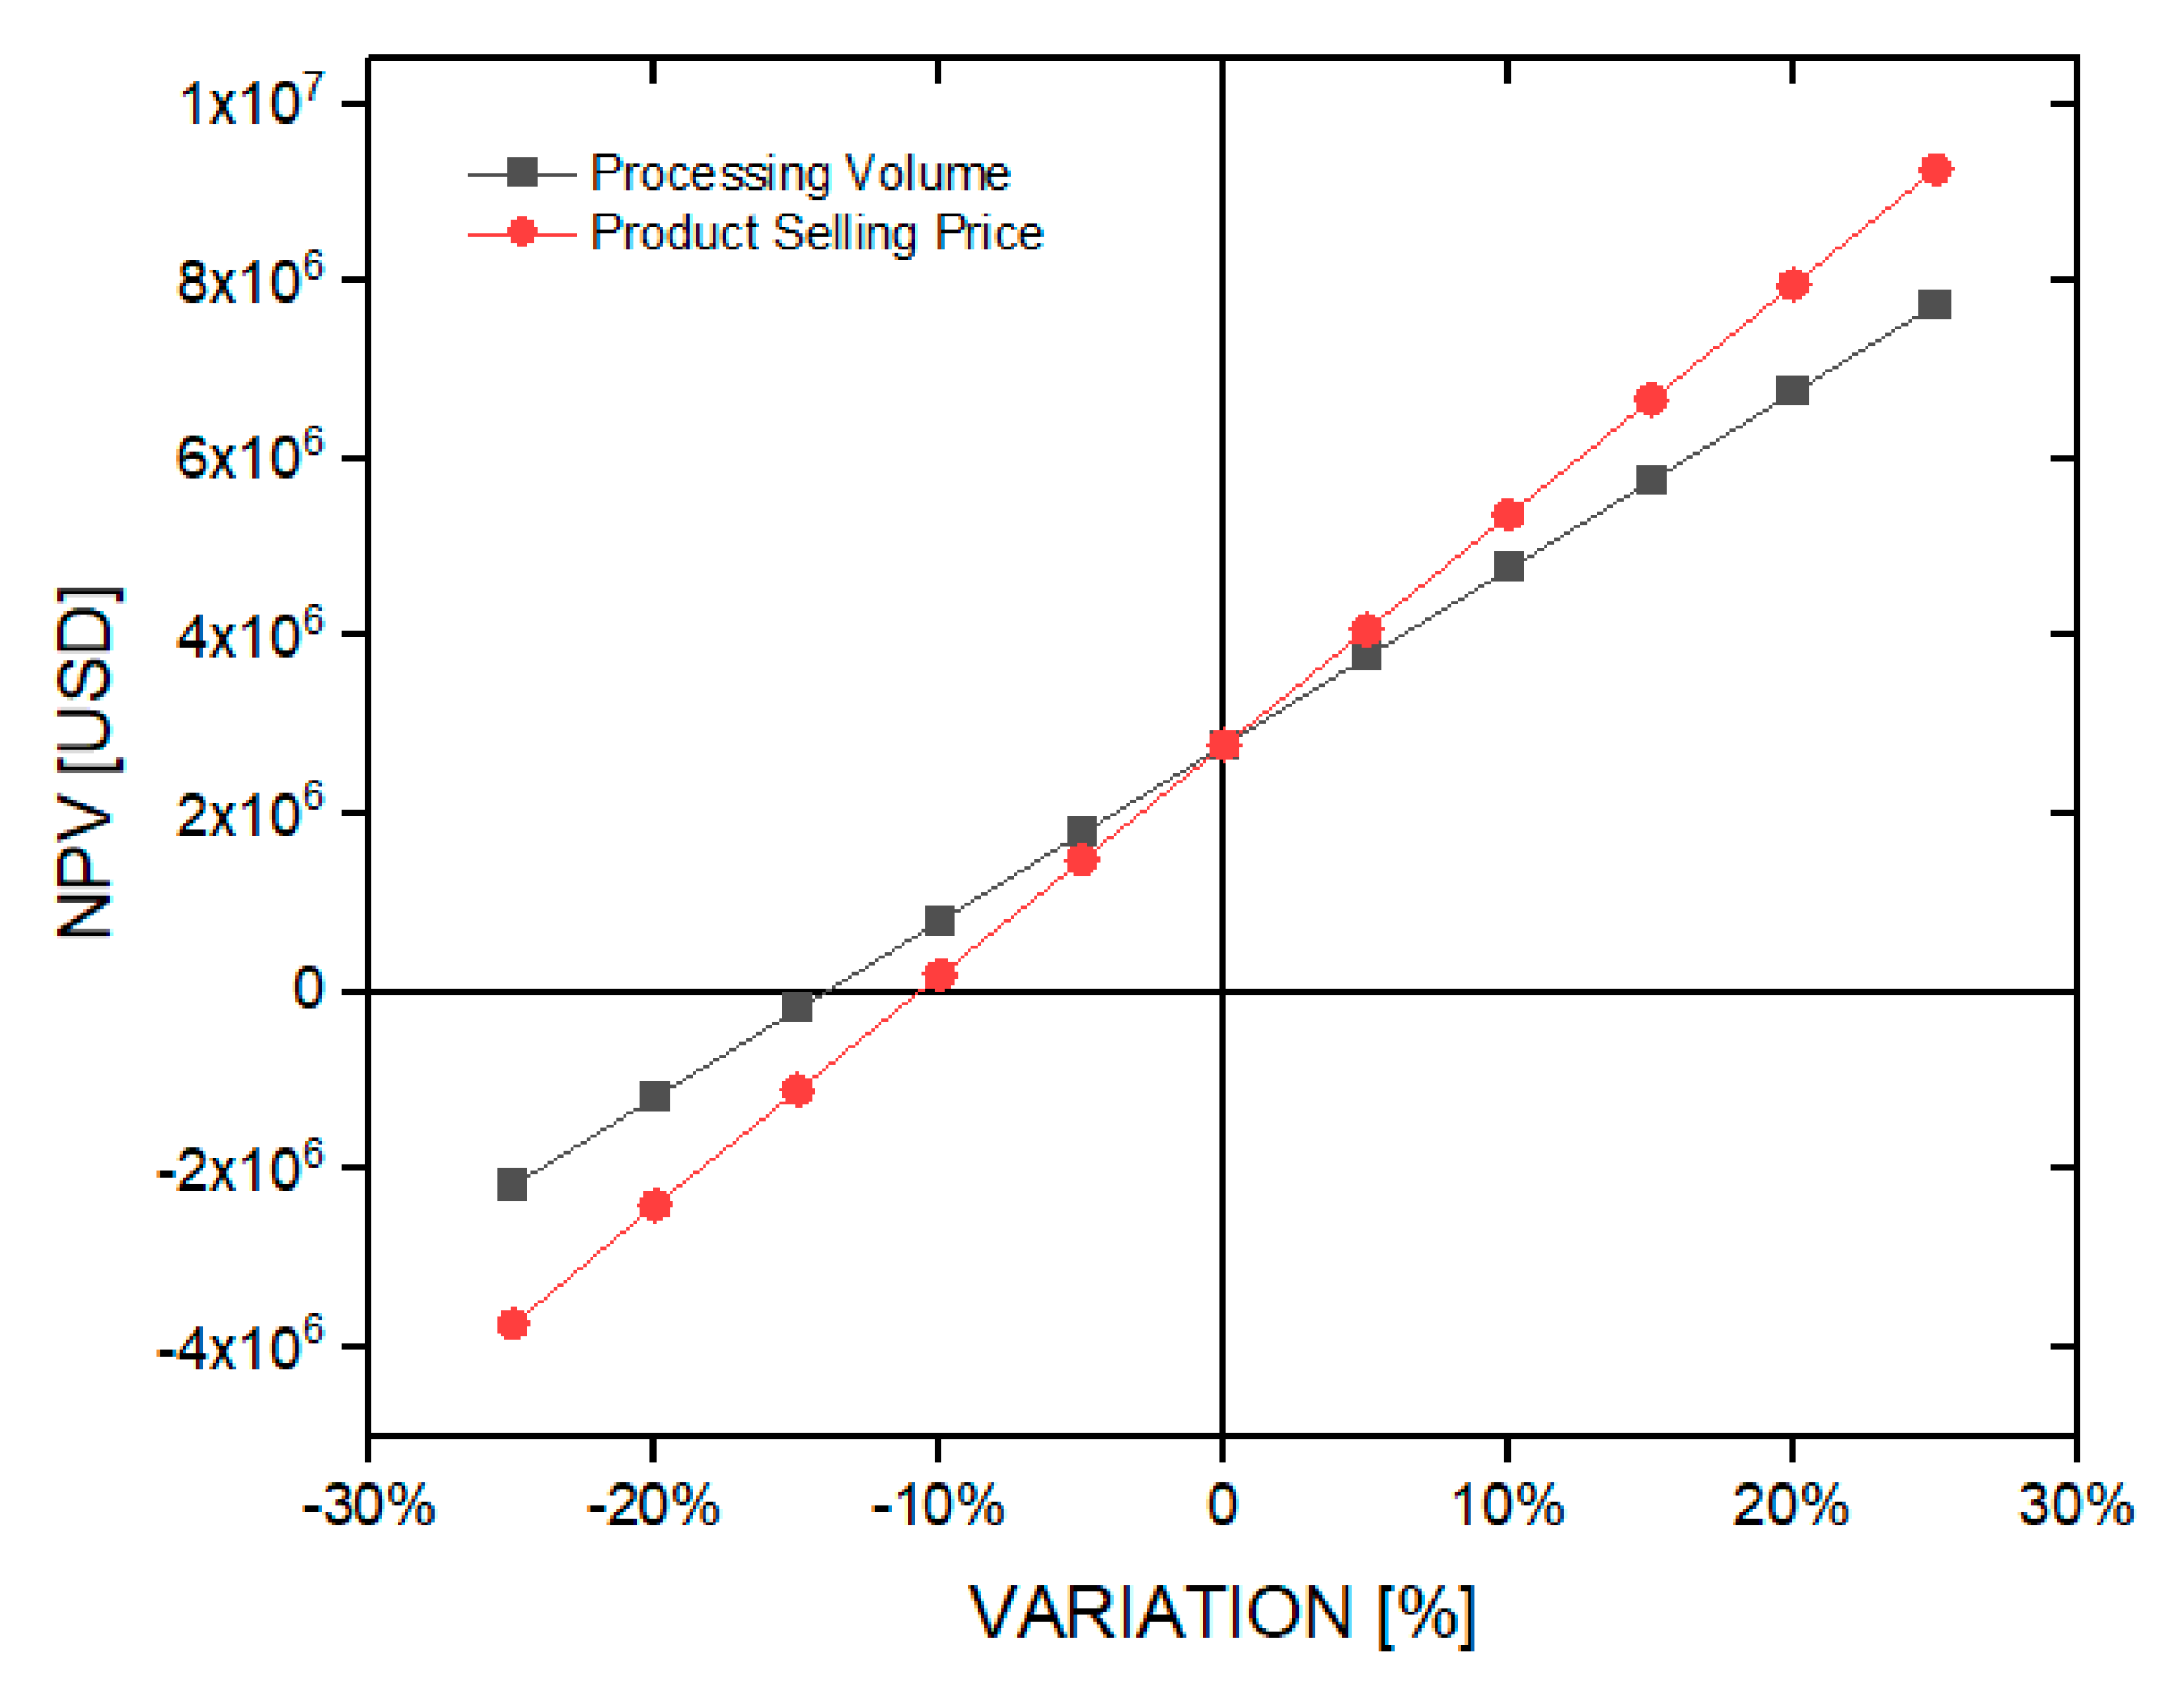
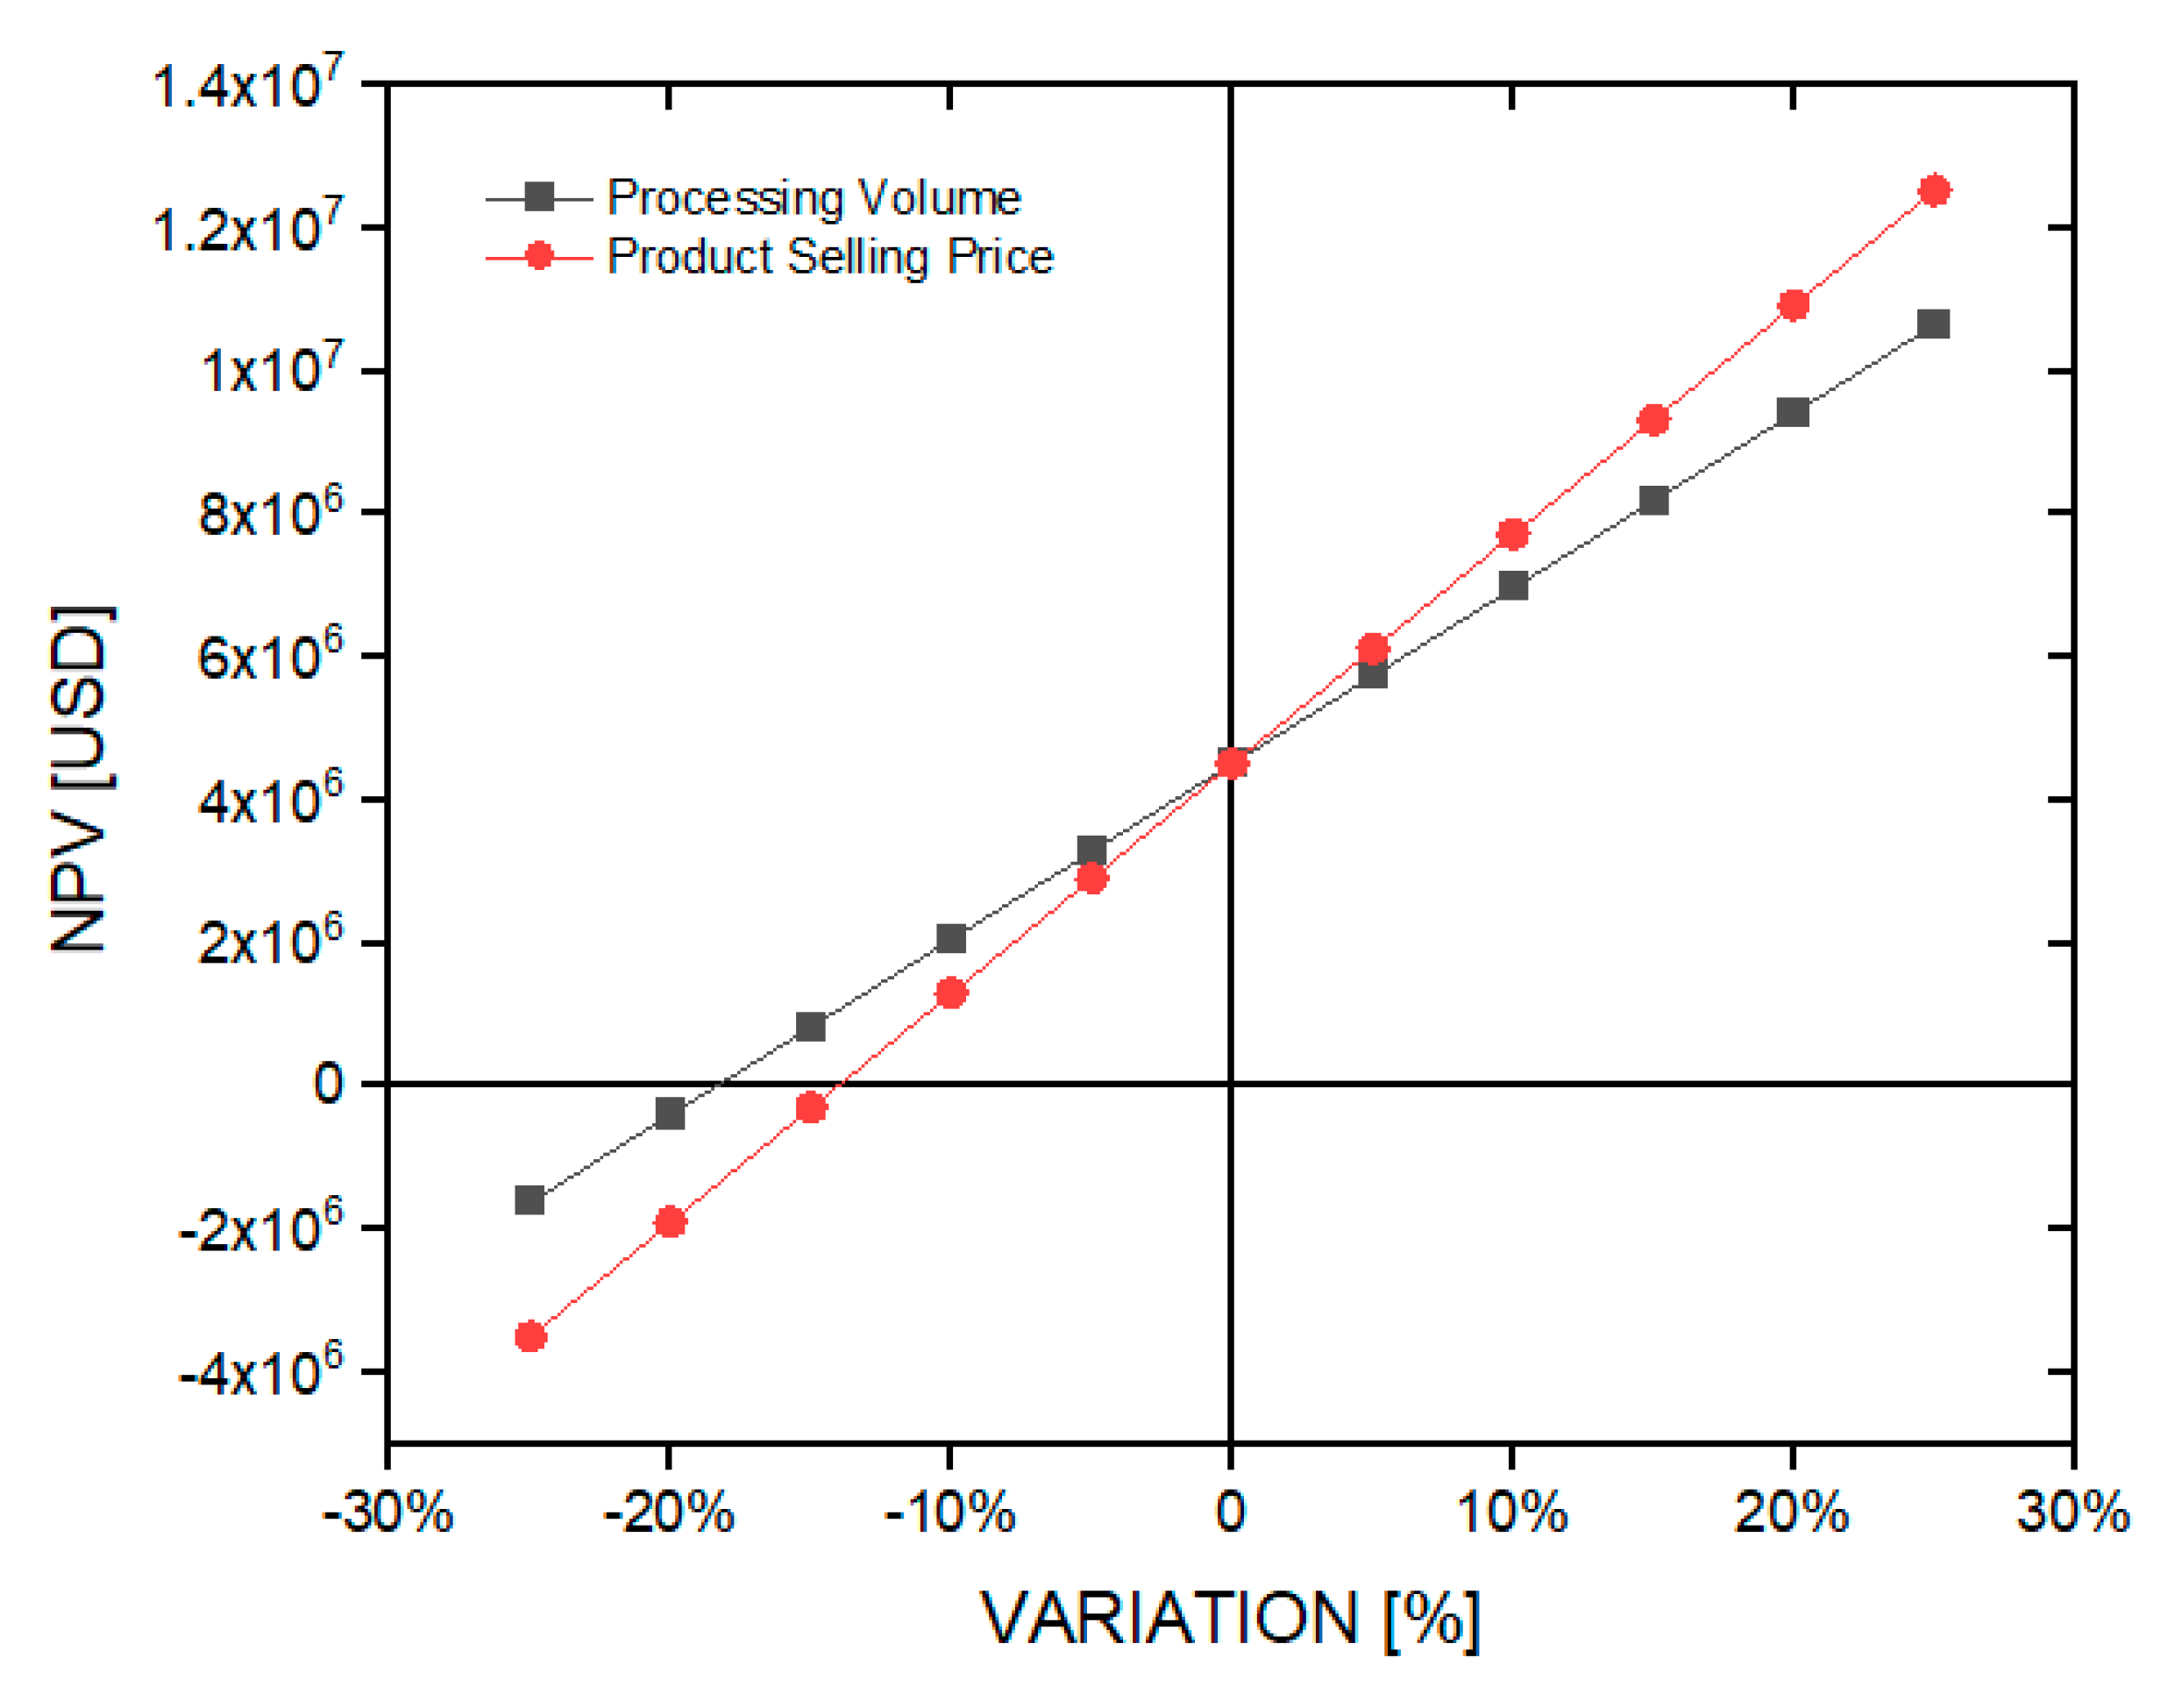
Figure 5 shows the variation in net present value for the ±25% change in the volume of raw material processing (nutshells) and in the sales price of the finished product (activated carbon), which for the base case under consideration were 10 kton/year and 2.75 USD/kg, respectively. The NPV varied by up to ±178% when the processing volume of the raw material was modified to the base case. When the processing volume decreased by 25%, a minimum NPV with a negative value of USD 2,170,121 was obtained.
The NPV had a ±234% variation when the sales price of the finished product was modified to the base case. When this sales price decreased by 25%, a minimum NPV with a negative value of USD 3,731,774 was obtained. Consequently, the final product’s sales price is the parameter with the highest sensitivity of the series studied, as it delivers the most upper range of variation in the net present value of the net cash flow of the investment project at 10 years of production.
4.3. Economic Evaluation (15-Year Production Project)
Similar to the previous case,
Figure 6 shows the cumulative discounted cash-flow diagrams at different discount rates to determine the payback period. For a zero discount rate, the payback period was after the fourth year of production, giving a net present value of USD 14,189,402. For a 10% discount rate, the payback period was after the fifth year of production, giving a net present value of USD 4,519,482. For a discount rate of 20%, the payback period was after the ninth year of production, giving a net present value of USD 686,744. In all cases the return on investment was 24%.
Figure 7 shows the variation curve of the net present value at different discount rates. From this figure, the cost of the internal rate of return (IRR) can be graphically estimated at 23%. Therefore, the project is feasible for this particular condition, as discussed above.
4.4. Sensitivity Analysis (Base Case of 15 Years of Production)
Figure 8 shows the change in the NPV of the project cash flow at 15 years of production as a base case (using a tax rate of 27% per year and an LDR of 10% per year) due to the variation in ±25% in the cost of the equipment delivered (including auxiliary equipment), the price of the raw material (nutshells), the cost of basic services, and the cost of operational labor. This analysis is similar to the case seen above, which involves a 10-year production project. The NPV varied by up to ±54% when the cost of the equipment delivered was modified from the base case (USD 1,063,044). When the delivered equipment cost was increased by 25%, a minimum NPV was obtained of USD 2,096,311, along with an IRR of 15% and an ROI of 17%.
The NPV had a maximum variation of ±37% when the price of the nutshells’ raw material was modified for the base case (100 USD/ton), this variation being lower than the previous case. When the price of the raw material increased by 25%, a minimum NPV for this case of UDS 2,844,866 was obtained, along with an IRR of 18% and an ROI of 20%. When the costs of the basic services were modified, the NPV had a ±35% variation lower than in the previous cases. Thus, NPV reached a minimum value of USD 2,950,474 for a +25% variation in the cost of basic services, obtaining a 19% IRR and a 20% ROI. Finally, the NPV had a maximum difference of ±22% when the cost of operational labor was modified to the base case (USD 280,800), the lowest variation being within the cases studied in this particular item. In this case, a minimum NPV of USD 3,508,962, an IRR of 20%, and an ROI of 22% were obtained if the operational labor cost is increased by 25%.
Figure 9 shows the change in net present value for the ±25% change in the volume of processing of the raw material and the selling price of the finished product for their base cases discussed above. The NPV had a variation of up to ±136% when the processing volume of the raw material was changed from the base case. When the processing volume decreased by 25%, a minimum NPV with a negative value of USD 1,615,009 was obtained. On the other hand, the NPV had a ±177% variation when the sales price of the finished product was modified for the base case. When this sales price decreased by 25%, a minimum NPV with a negative value of USD 3,496,851 was obtained. Consequently, the sales price of the finished product is the most sensitive parameter of the series studied for the 15-year production investment project, in a similar way to the 10-year operation project.
5. Conclusions
Based on the economic analysis developed, it is estimated that the generation of activated carbon from industrial waste nutshells by physical methods through the use of water vapor as an activating agent is economically profitable under the particular characteristics of the cases studied in this work. The activated carbon from nutshells would have a total cost of approximately USD 2.15 per kilogram of final product. In addition, the total manufacturing cost reached a value of USD 1.82 per kilogram of final product. For the calculation of these values, a non-zero cost was considered for the purchase of the raw material. This consideration makes a difference with other published studies that consider a marginal cost or do not consider the costs of purchasing raw materials. The estimated internal rate of return was 21% and 23% for 10 and 15 years of operating time, respectively. Such results are higher than the typical minimum discount rate of 10%, which is generally used by companies to evaluate investment projects in chemical plants, thus making the investment project viable. It was estimated that for the projected case of 10 years of operation (tax rate of 27% and LDR of 10% per year), the return on investment reaches 25%, and that for the planned case of 15 years of service (tax rate of 27% and LDR of 10% per year) the return on investment reaches 24%. In both cases, the payment period was made after the fifth year of production. The analysis of various sensitivity factors showed the limits to ensure the profitability of the project. Among these factors, the selling price of the finished product is the most sensitive parameter. On the other hand, one of the most important contributions of this work is to try to reduce the degree of uncertainty in the estimation of production costs and in the analysis of profitability indicators to provide a better approximation of the real costs involved in the economic analysis of an activated carbon production plant and provide a greater amount of information for potential industrial investors. In summary, this study can support the academic, research and financial analysis of investment projects and provide valuable information to industrial investors who could identify a good return on their investment capital.


