Article

Indoor Environmental Quality (IEQ) Analysis of a Two-Sided Windcatcher Integrated with Anti-Short-Circuit Device for Low Wind Conditions

by
Payam Nejat
1,2,
Hasanen Mohammed Hussen
3,
Fodil Fadli
4,*,
Hassam Nasarullah Chaudhry
5,*,
John Calautit
6,* and
Fatemeh Jomehzadeh
1
1
Department of of Civil Engineering, Faculty of Engineering, University Technology of Malaysia (UTM), Skudai 81310, Malaysia
2
Advanced Building and Environment Research (ABER) Group, Johor Bahru 81300, Malaysia
3
Department of Mechanical Engineering, University of Technology (UOT), Baghdad 10066, Iraq
4
Department of Architecture and Urban Planning, College of Engineering, Qatar University, Doha 2713, Qatar
5
School of Energy, Geoscience, Infrastructure and Society, Heriot-Watt University, Edinburgh EH14 4AS, UK
6
Department of Architecture and Built Environment, The University of Nottingham, Nottingham NG7 2RD, UK
*
Authors to whom correspondence should be addressed.
Processes 2020, 8(7), 840; https://doi.org/10.3390/pr8070840
Submission received: 15 June 2020 / Revised: 5 July 2020 / Accepted: 6 July 2020 / Published: 15 July 2020
(This article belongs to the Special Issue CFD Applications in Energy Engineering Research and Simulation)

Abstract

:
Windcatchers are considered as promising passive ventilation and cooling strategy, but the ventilation performance of this system is still of concern in areas with low speed and unpredictable winds. The air short circuiting in windcatchers can reduce its ventilation performance and ability to introduce clean air and remove stale air. The current work aimed to evaluate the indoor environmental quality (IEQ) performance of a two-sided windcatcher fitted with an anti-short-circuit device (ASCD) for improving its performance in low wind speed conditions. Computational Fluid Dynamics (CFD) simulations were performed for different ASCD configurations. The CFD method was verified using grid-sensitivity analysis and validated by comparing the simulation results with wind tunnel data. The results indicated that the average difference between CFD results and previous experimentation was below 10%, therefore indicating good agreement. Building on the findings of the previous research, the study focused on evaluating the impact of the length of ASCD on the achieved fresh air supply rates and air change rate. The length of the ASCD was varied between 5 cm to 50 cm, while the angle was maintained at 80°. The shorter ASCD was still able to minimize the fresh supply airflow short-circuiting to the exhaust stream, and at the same time, it would also require a smaller ceiling space for installation and lower material cost. Hence, the 15 cm ASCD with 80° angle was selected for further analysis in this study. Then, consideration of low wind speed and various directions were studied to evaluate the ventilation performance of windcatcher with ASCD. The study simulated wind speeds between 0.5–2 m/s and two wind directions. Based on the assessment of IEQ factors, including mean age of air and percentage of dead zone, a 0° incident angle demonstrated slightly better results. The achieved fresh air supply rates ranged between 180 L/s to 890 L/s in 45° wind angle, while, for 0°, these values were from 160 L/s to 642 L/s. Likewise, the range of air change rates (ACH) was from 8 ACH to 32 ACH in 0° wind angle and increased to 9 ACH and then to 45 ACH in 45° wind angle.

1. Introduction and Literature Review

The built environment sector accounts for 30–40% of world energy consumption [1]. This Figure is expected to increase by up to 50% by 2050. Buildings account for more than a third of the total emissions released to the atmosphere, which gives rise to climate change and global warming [2]. Cooling and ventilation are significant contributors to the high building energy demand, in particular in tropical and hot climates. Hence, researchers are looking for solutions to eliminate or minimize the cooling energy requirement of buildings. Many are focused on exploring how passive techniques, such as natural ventilation strategies, can be effectively incorporated into the building design [3]. Many works [4,5,6] have shown that natural ventilation and passive cooling strategies can reduce energy consumption during the cooling season and, at the same time, improve the indoor air quality and, in some cases, the comfort level of occupants.
An excellent example of a passive cooling strategy is a windcatcher, which is recently gaining lots of attention due to its capability to provide high fresh air rates and, at the same time, extract stale air out of the building [4,5,6]. The windcatcher utilizes two driving forces to ventilate building spaces: buoyancy forces, which are due to the temperature differential between indoor and outdoor; and wind forces which are due to the pressure differential between the openings [7]. The windcatcher concept is not exactly new and has been effectively utilized in traditional buildings for centuries in the Middle East [8]. Recently, a modern version of the windcatcher was employed in buildings in the UK, such as in schools and open-plan offices [9,10,11].
Another advantage of using a windcatcher is that it incorporates no moving parts, which leads to low maintenance cost. It can be an attractive option for large spaces, such as gyms and storage facilities, which are typically ventilated by mechanical ventilation systems. Moreover, unlike simple natural ventilation methods, such as windows, a windcatcher can capture the wind at higher elevations [12,13]. This can lead to higher ventilation rates, especially in urban or built-up areas where neighboring structures can obstruct the flow. A windcatcher can also have several openings which allow it to capture wind from different directions [14]. Windcatchers located in areas with variable wind directions can have two or four openings. A problem for both the commercial and traditional windcatcher, which outweigh its advantages, is the air short circuit phenomena which were observed and discussed by previous researches [8,15,16,17]. It occurs when the fresh supply airflow immediately leaves the outlet/exhaust channel, instead of circulating inside the space to be ventilated. Hence, effectively reducing the ventilation performance of multi-opening windcatchers [18,19].
Several works have investigated the ventilation performance of two-sided windcatchers. Montazeri et al. [14] employed wind tunnel testing and Computational Fluid Dynamics (CFD) modeling to evaluate the impact of the wind direction on the ventilation efficiency of a two-sided rectangular windcatcher. The study observed that air short-circuiting was present at higher wind angles, reaching a maximum value at 60°. Ghadiri et al. [20] also used CFD to assess the wind-induced cross ventilation for a room with a two-sided windcatcher at different wind directions (0–90°). The results focused on comparing different types of turbulence models and showed that the SSG Reynolds Stress Model provided the most accurate results as compared to experimental data. Furthermore, Afshin et al. [21] evaluated the ventilation performance of a two-sided windcatcher at different wind conditions using wind tunnel testing and smoke flow visualization. The highest rate of ventilation was seen at a wind angle of 90°, and the windcatcher was observed to be functioning as a chimney for wind angles larger than 55° (windward transition angle).
In one previous study [22], it was found that the use of a new windcatcher component, called an anti-short-circuit device (ASCD), resulted in a significant reduction of air short-circuiting in two-sided windcatchers. It was observed that the supply airflow could be effectively directed toward the occupied zone instead of leaving the exhaust immediately. Different angles of ASCD (10° to 90°) were studied by evaluating the windcatcher ventilation performance. The results showed that the ASCD (with different angles) could significantly reduce the short circuit, but the maximum reduction was seen between 80° to 90°. The present work builds on the previous study to assess the influence of the ASCD on the indoor environmental quality (IEQ) of the ventilated space, by assessing parameters, such as air change rate (ACE) and mean age of air (MAA).
Furthermore, the effect of the ASCD length (5 cm to 50 cm) on the induced supply airflow and IEQ in low wind speed conditions was evaluated. Different wind conditions were simulated for a small room integrated with windcatcher and ASCD. The computational model that was employed was validated using experimental data.

2. Method

In this study, CFD was used to model and assess the performance of a two-sided windcatcher. The initial computational model of a two-sided windcatcher with ACD was validated by comparing the results with wind tunnel experiment data. For the validation, identical boundary conditions were utilized, simulating similar conditions as in the experiment. Then, the performance of the windcatcher integrated with ASCD was investigated in terms of the airflow patterns and IEQ parameters.

2.1. Solver Settings

The 3D steady Reynolds-Averaged Navier-Stokes (RANS) simulations were performed using the commercial CFD software, ANSYS Fluent. The RANS approach is the most commonly used method for the simulation of natural ventilation and windcatchers. The numerical model utilized the SIMPLEC pressure-velocity coupling algorithm with second-order pressure interpolation. For the convection and viscous terms, the second-order upwind discretization was used. The verification of the turbulence model is necessary to assess the reliability of CFD modeling. The turbulence model analysis of a similar geometry was conducted in previous research [23,24], which found that the standard k-epsilon model provided accurate predictions and therefore, this study also utilized same turbulence mode. The standard k-epsilon model was also employed in other natural ventilation studies, such as Reference [25,26,27,28], and was concluded to be accurate and reliable. The momentum, mass, and energy equations, along with the turbulence kinetic energy and energy dissipation rate equations, were solved. These governing equations were not modified in this study and are fully detailed in the Fluent theory guide [29].

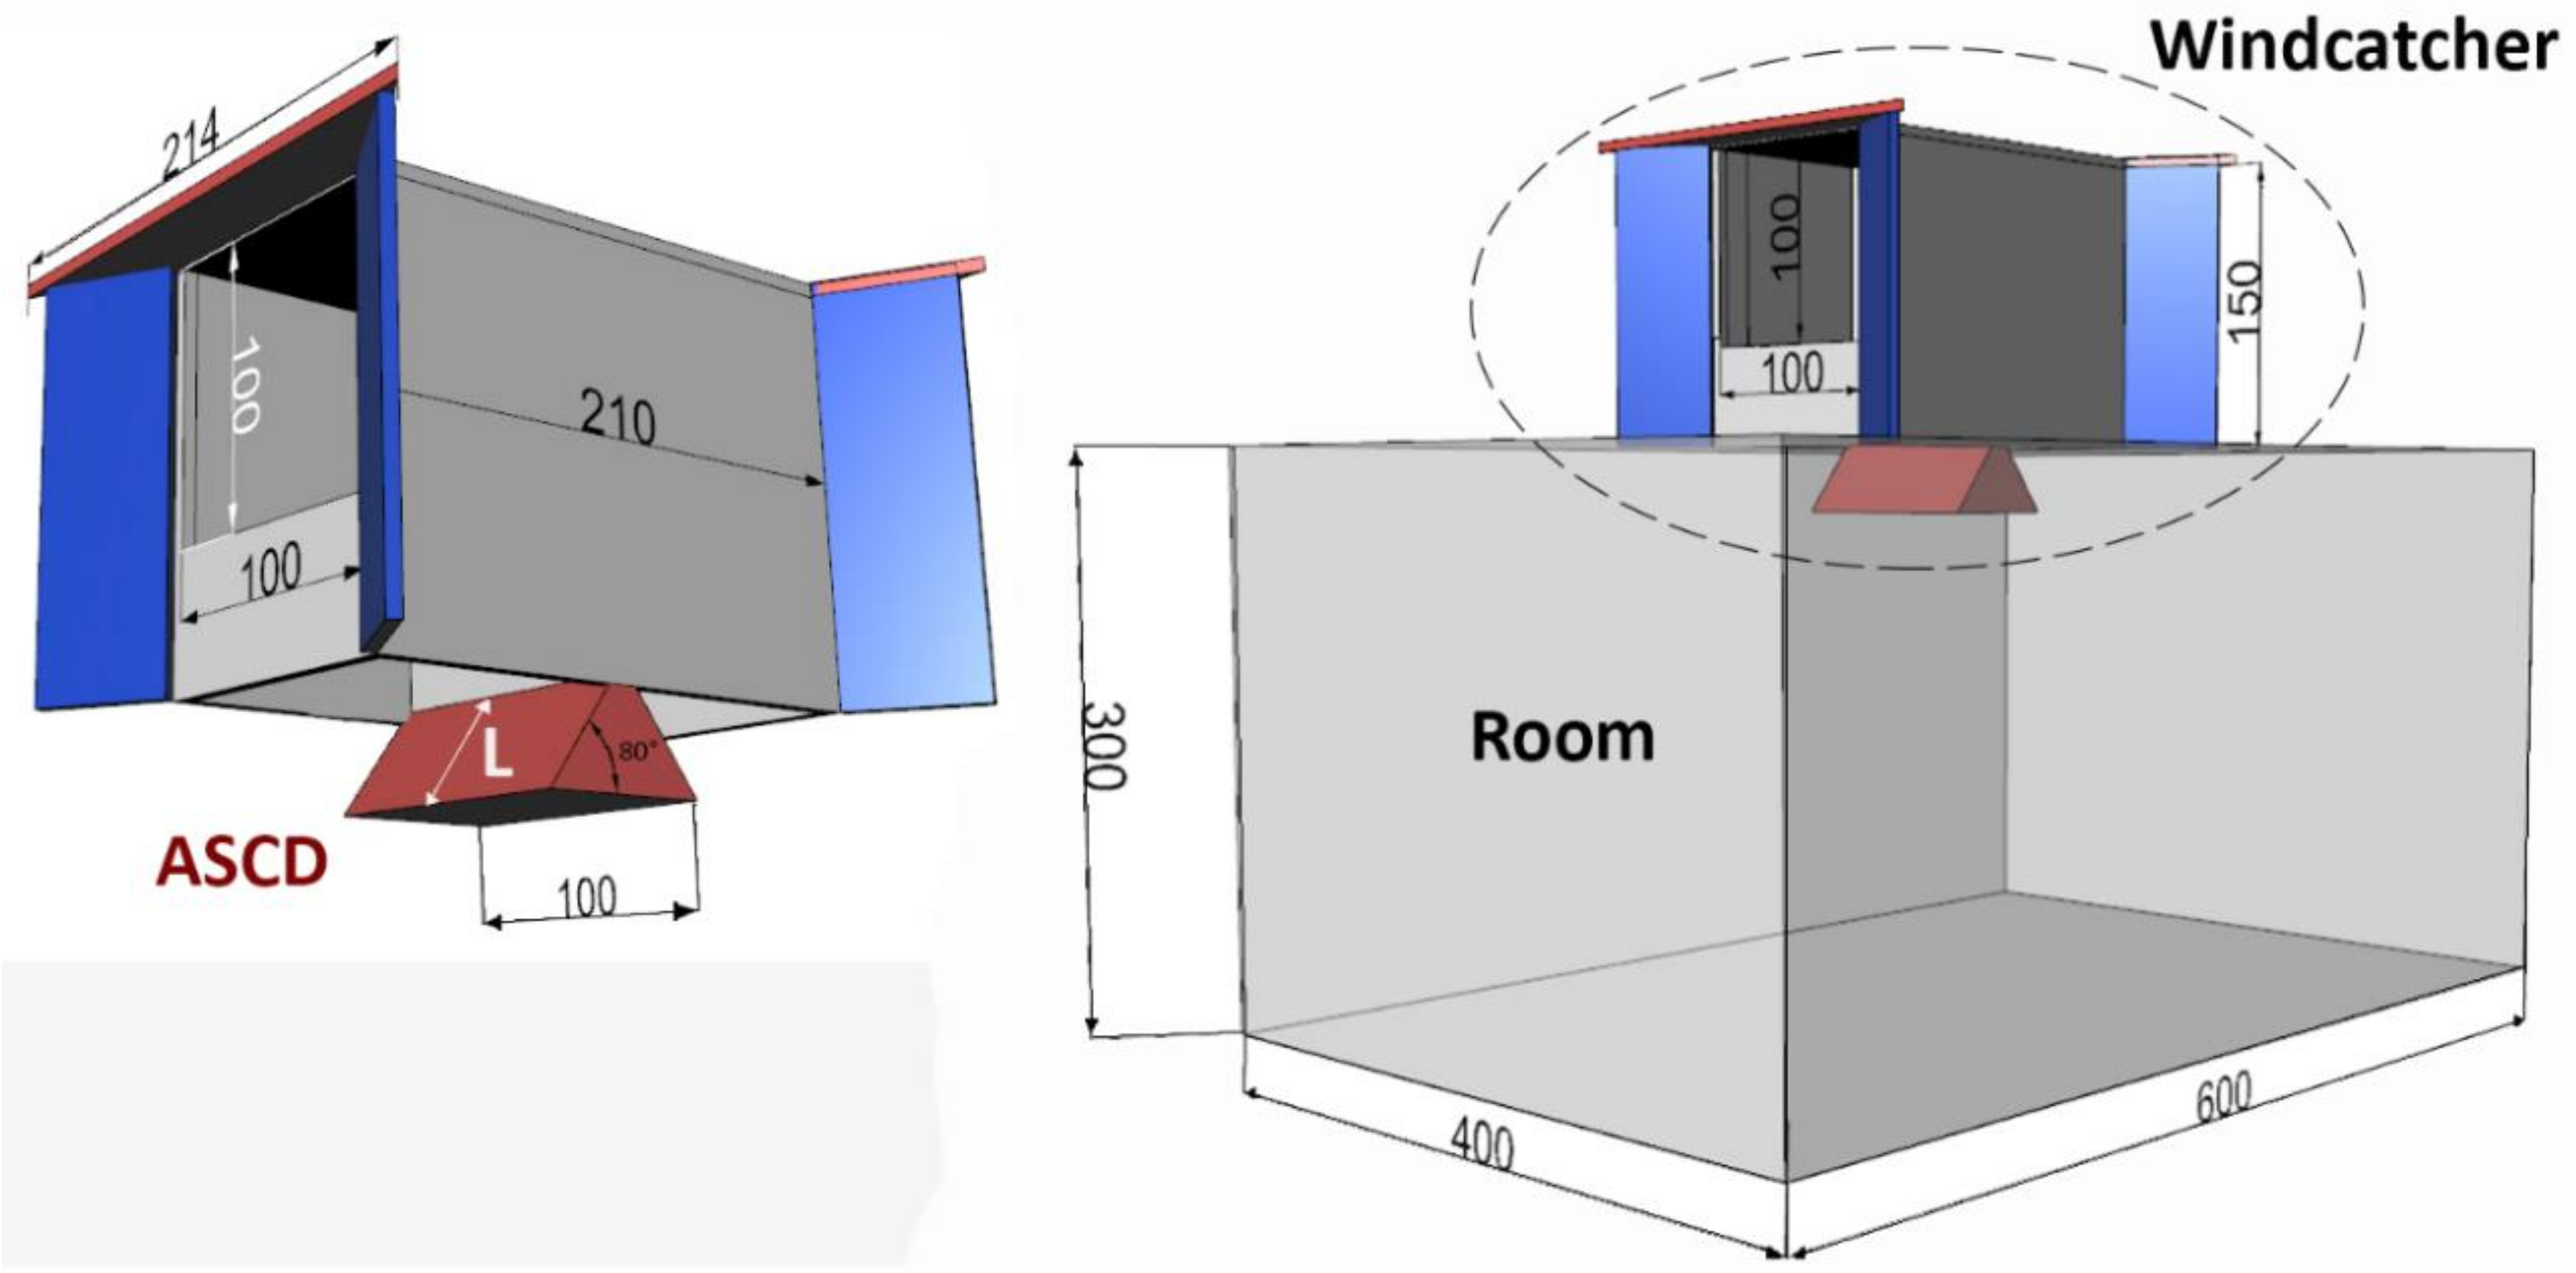
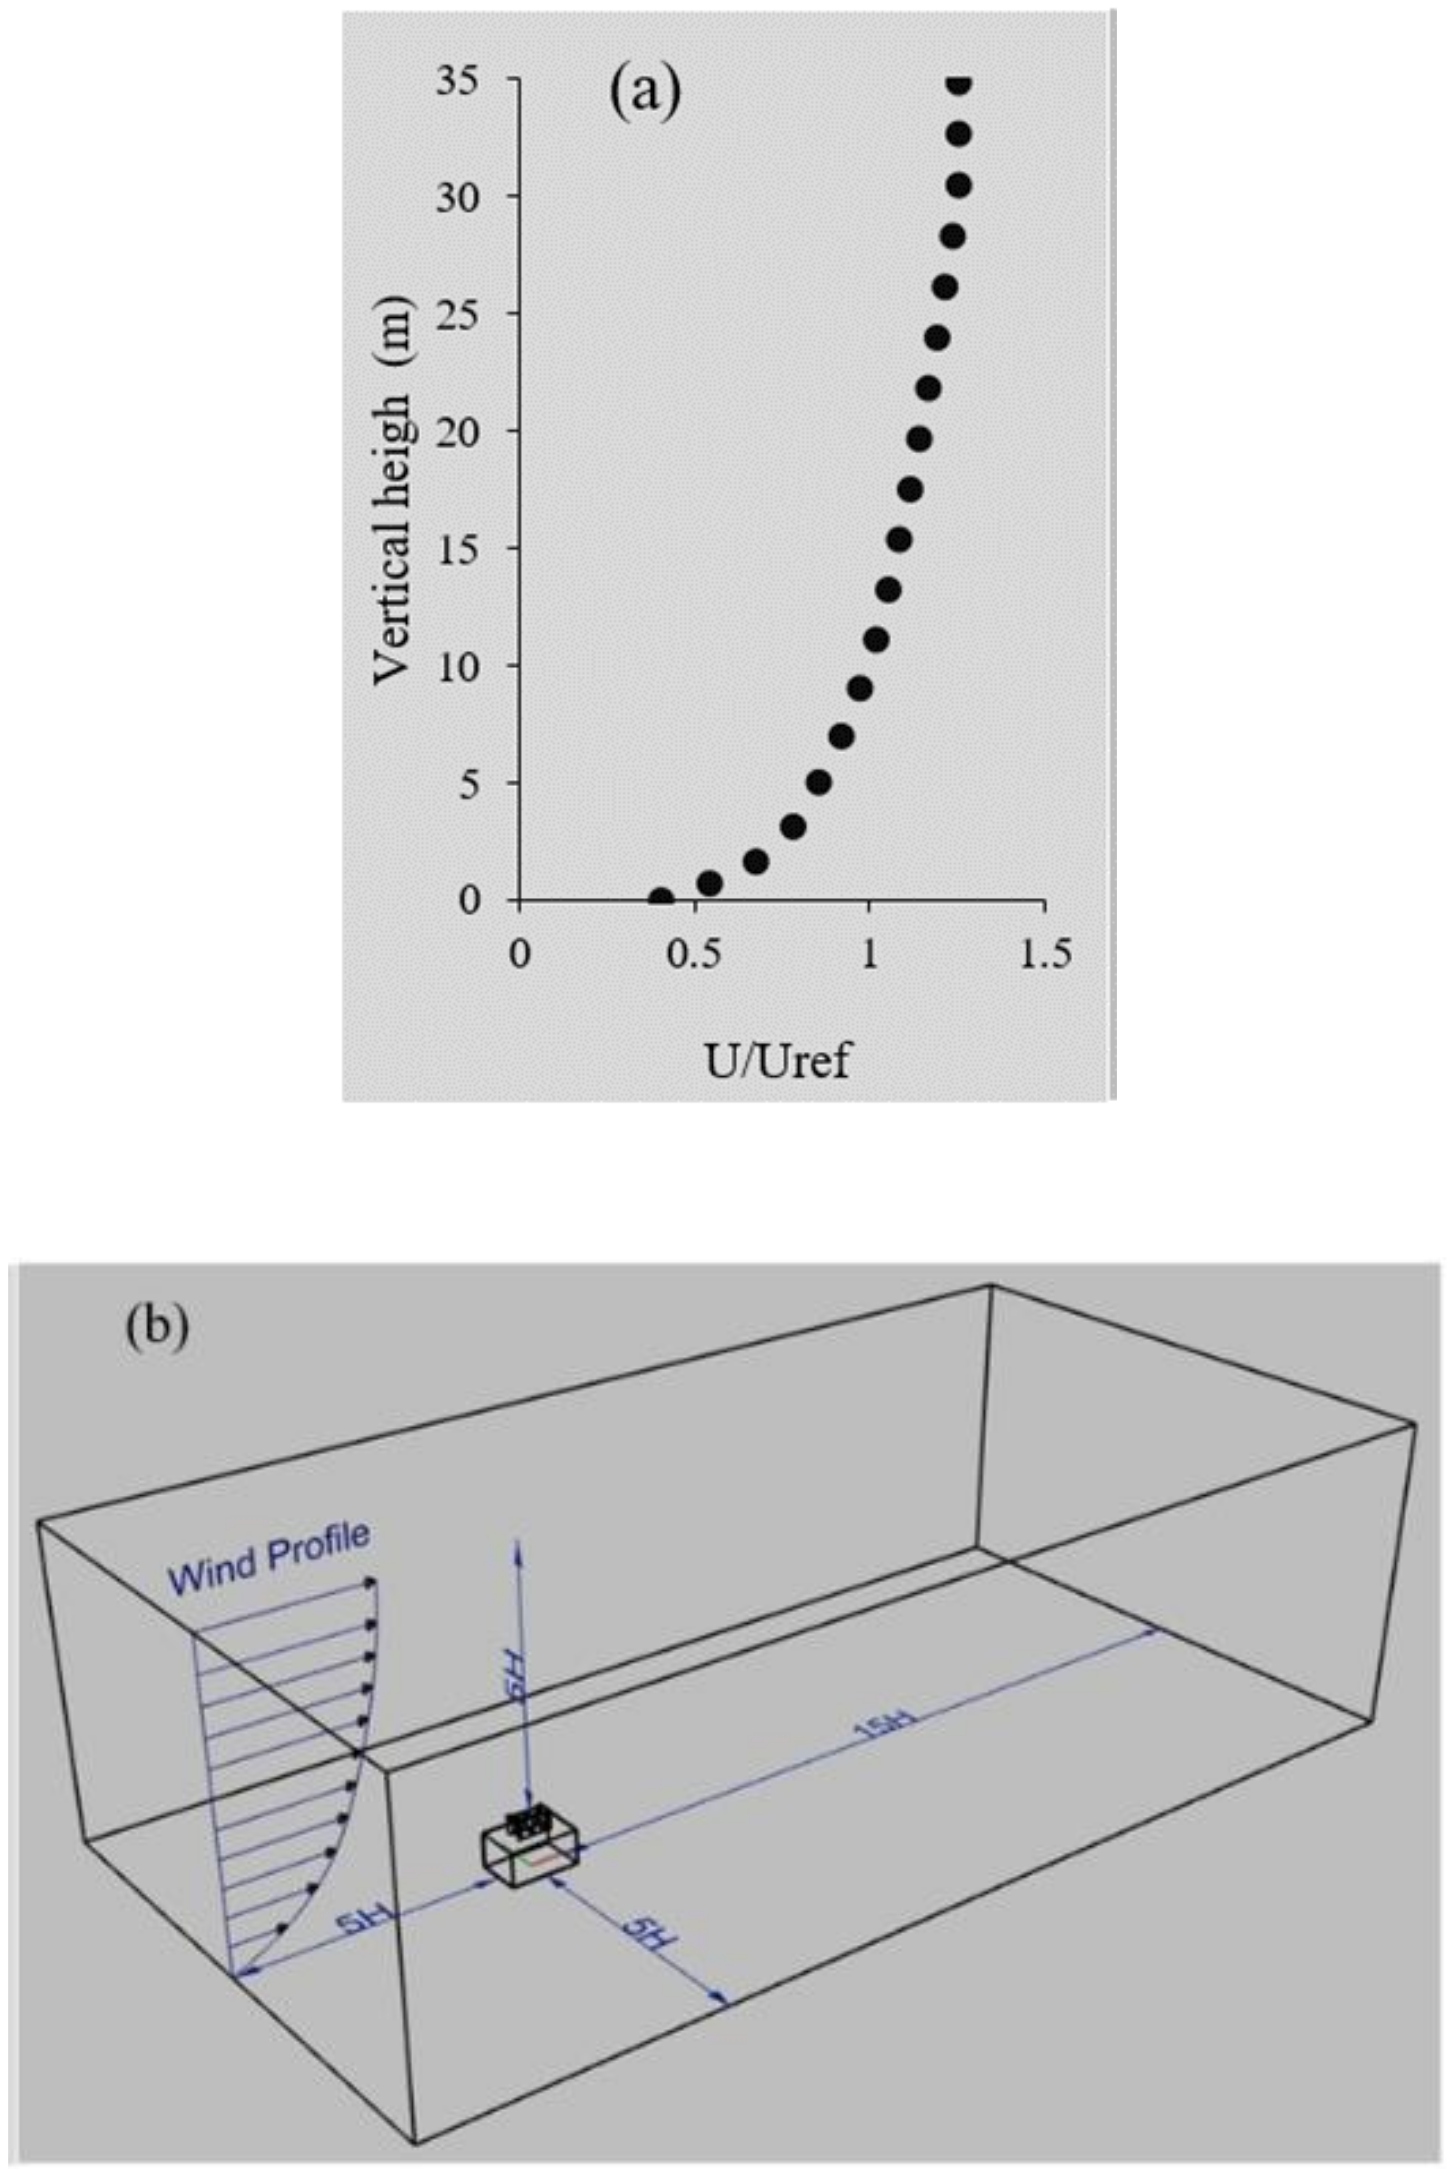
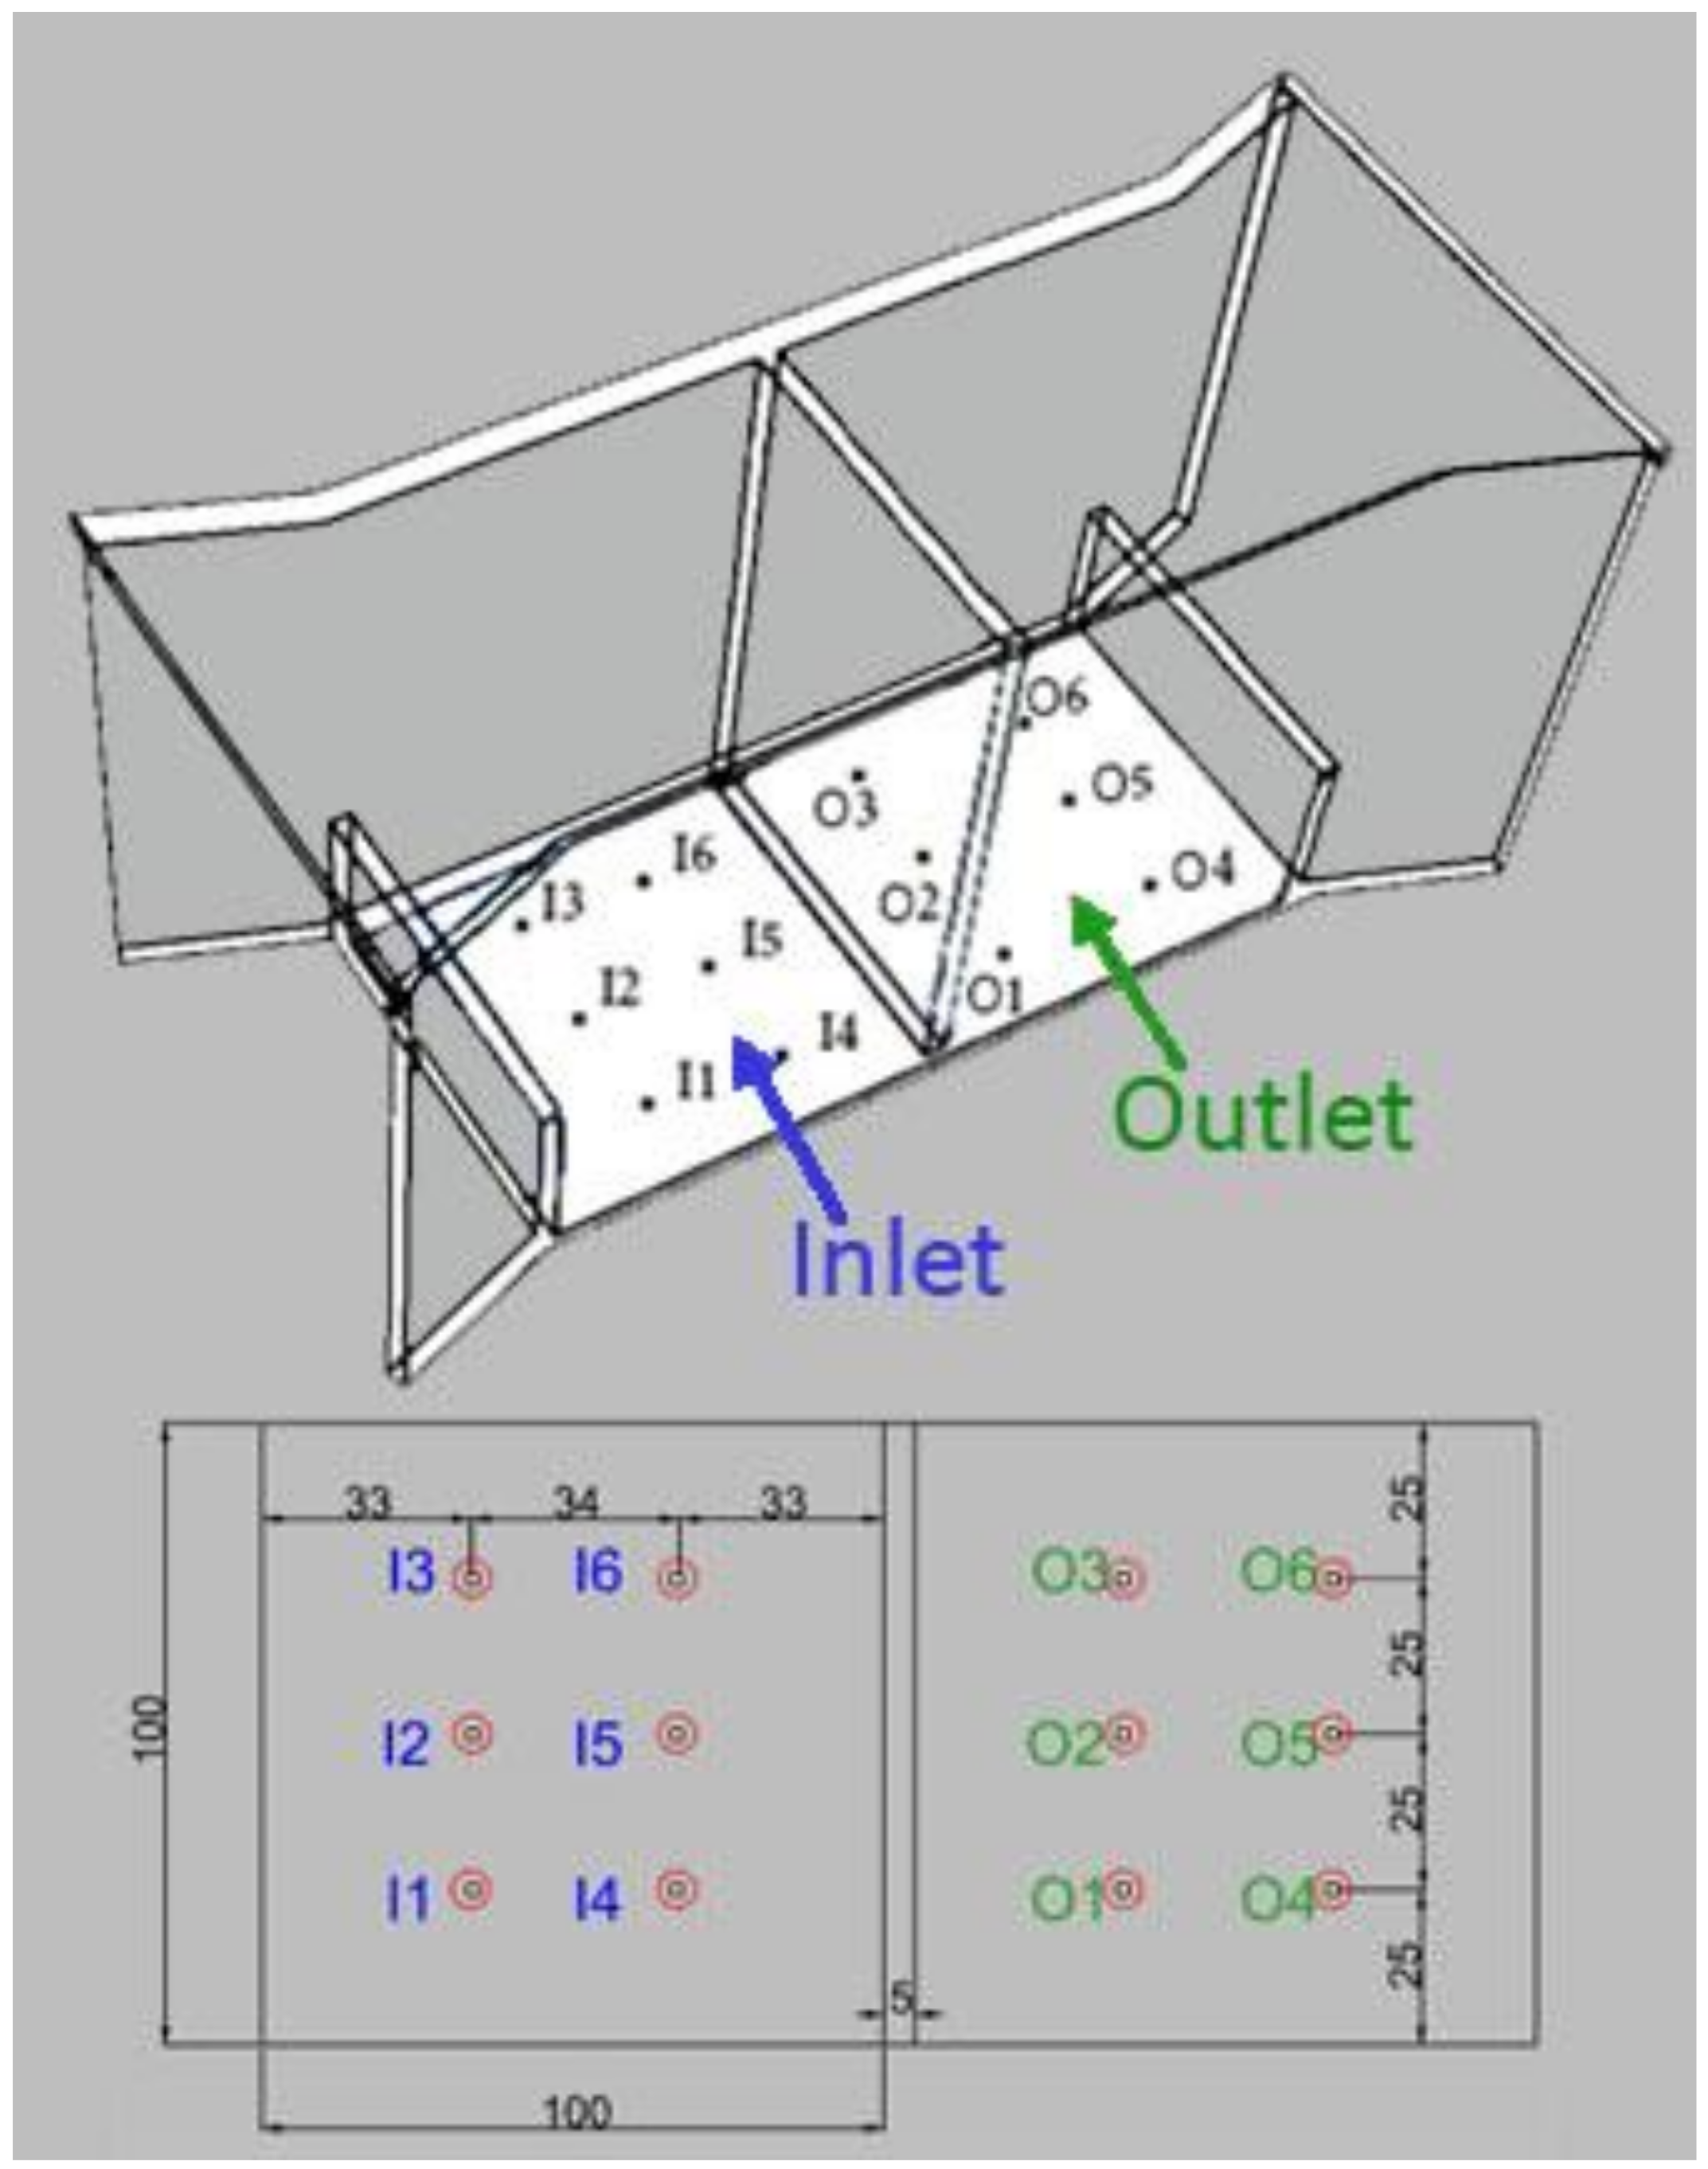
2.2. Geometry and Computational Domain

In this work, Computational Fluid Dynamics (CFD) modeling was employed for evaluating the ventilation performance of the proposed windcatcher design [23]. As shown in Figure 1, the physical domain included a rectangular shaped room with a floor area of 4 m × 6 m and a height of 3 m. A two-sided windcatcher was mounted on top of the room. The windcatcher was separated by an internal wall forming two air channels; one for supplying the airflow and another for exhausting the stale air out of the space. In some cases, both channels will function as exhaust channels, depending on the direction of the wind [30]. The windcatcher cross-sectional area and opening were 1 m × 1 m and height of 1.5 m. The form and size of the windcatcher were based on the study of Reference [22,23]. As detailed previously, the anti-short-circuit device (ASCD) was incorporated below the windcatcher channel to eliminate or minimize the air short-circuiting between the two channels (Figure 1). The ASCD had an angle of 80°, based on previous research [22].
To select the size of the numerical domain, COST Action 732 [31] guidelines were used to simulate the wind flow around the windcatcher and building model (Figure 2). As per the guidelines, the lateral domain boundaries were 5 H from the room sidewalls (H is the height of the room). The inlet of the domain was 5 H from the windward wall of the building. However, further extension (15 H) is recommended for outlet boundary to permit the redevelopment of flow in the back of the wake region because the fully developed flow is one of underlying assumption in steady RANS computations. Extension between 4 H and 10 H is advised for the vertical direction (while considering the blockage effect). 5 H was selected to ensure that the blockage was below 5%.

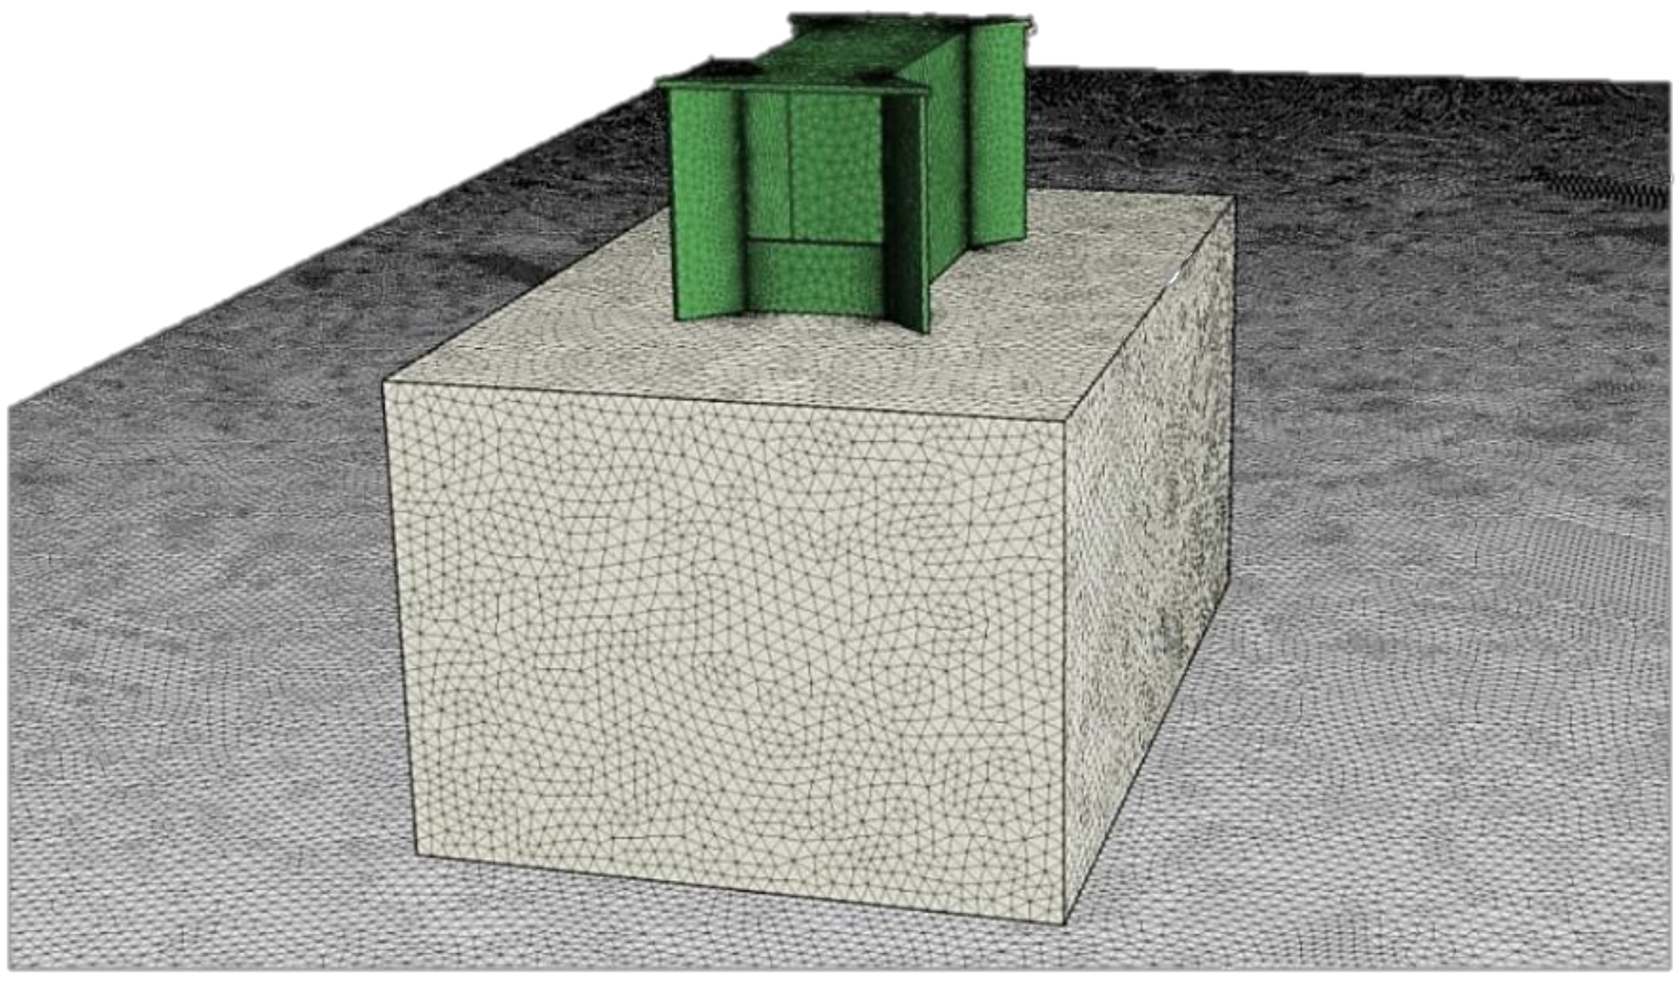
2.3. Mesh Generation

The computational model, which consisted of the outdoor domain, windcatcher with ASCD, and test room, was meshed using tetrahedral type elements, with a finer resolution near the regions of interest, such as the windcatcher and indoor space (Figure 3). The mesh was generated using the preprocessing tool ANSYS Mesh which resulted in an unstructured mesh with 1.5 million nodes and 8.5 million elements. The mesh resolution was selected based on a grid sensitivity analysis and comparison with experimental data, which will be explained in Section 3.1.

2.4. Solution Convergence and Flux Balance

For assessing the CFD solution convergence, the residual values were monitored, and, at the same time, variables of interest were also monitored to judge if convergence was reached [29]. In order to monitor the variable or quantity of interest (airflow velocity), point surfaces (supply air and indoor points) were defined in the model, and each one was monitored during the numerical calculations. The solution was run until the monitored flow variables no longer changed with more iterations. In addition, the flux report tool in Fluent was used to examine the overall mass balance when the solution converged. This was conducted by checking the mass flow rate flux for the inlet and outlet and ensuring that the net imbalance through the domain was lower than 1%.

2.5. Boundary Conditions

The recommendations of COST Action 732 [31] and AIJ guidelines for urban wind simulations [32] were followed when defining the boundary conditions in this study. Wind profile (Figure 2) and turbulence kinetic energy profiles were set as inflow boundary conditions [33]. As detailed previously, the focus of the research is to enhance the ventilation performance of windcatchers in areas with low wind speed conditions; hence, the wind velocity at H was varied between 0.5–2 m/s. For the wall boundaries, the standard wall function was employed [34]. However, for the ground surface, the sand-grain wall function was adjusted based on Reference [35]. This provides an accurate description of the flow near the ground. The roughness of the wall was specified by an equivalent sand grain roughness ks in the wall functions. For the top and sides of the computational domain, the symmetry wall boundary conditions were defined, i.e., zero gradients for all the variables at the walls. The pressure outlet was set to zero static pressure. Table 1 summarizes the computational modeling setup and boundary conditions.

3. Results and Discussion

The following sections will discuss the validation of the numerical modeling of the two-sided windcatcher against the experimental data. Then, the influence of the addition of ASCD on ventilation performance and IEQ will be discussed. Furthermore, the impact of the ASCD length will also be covered.

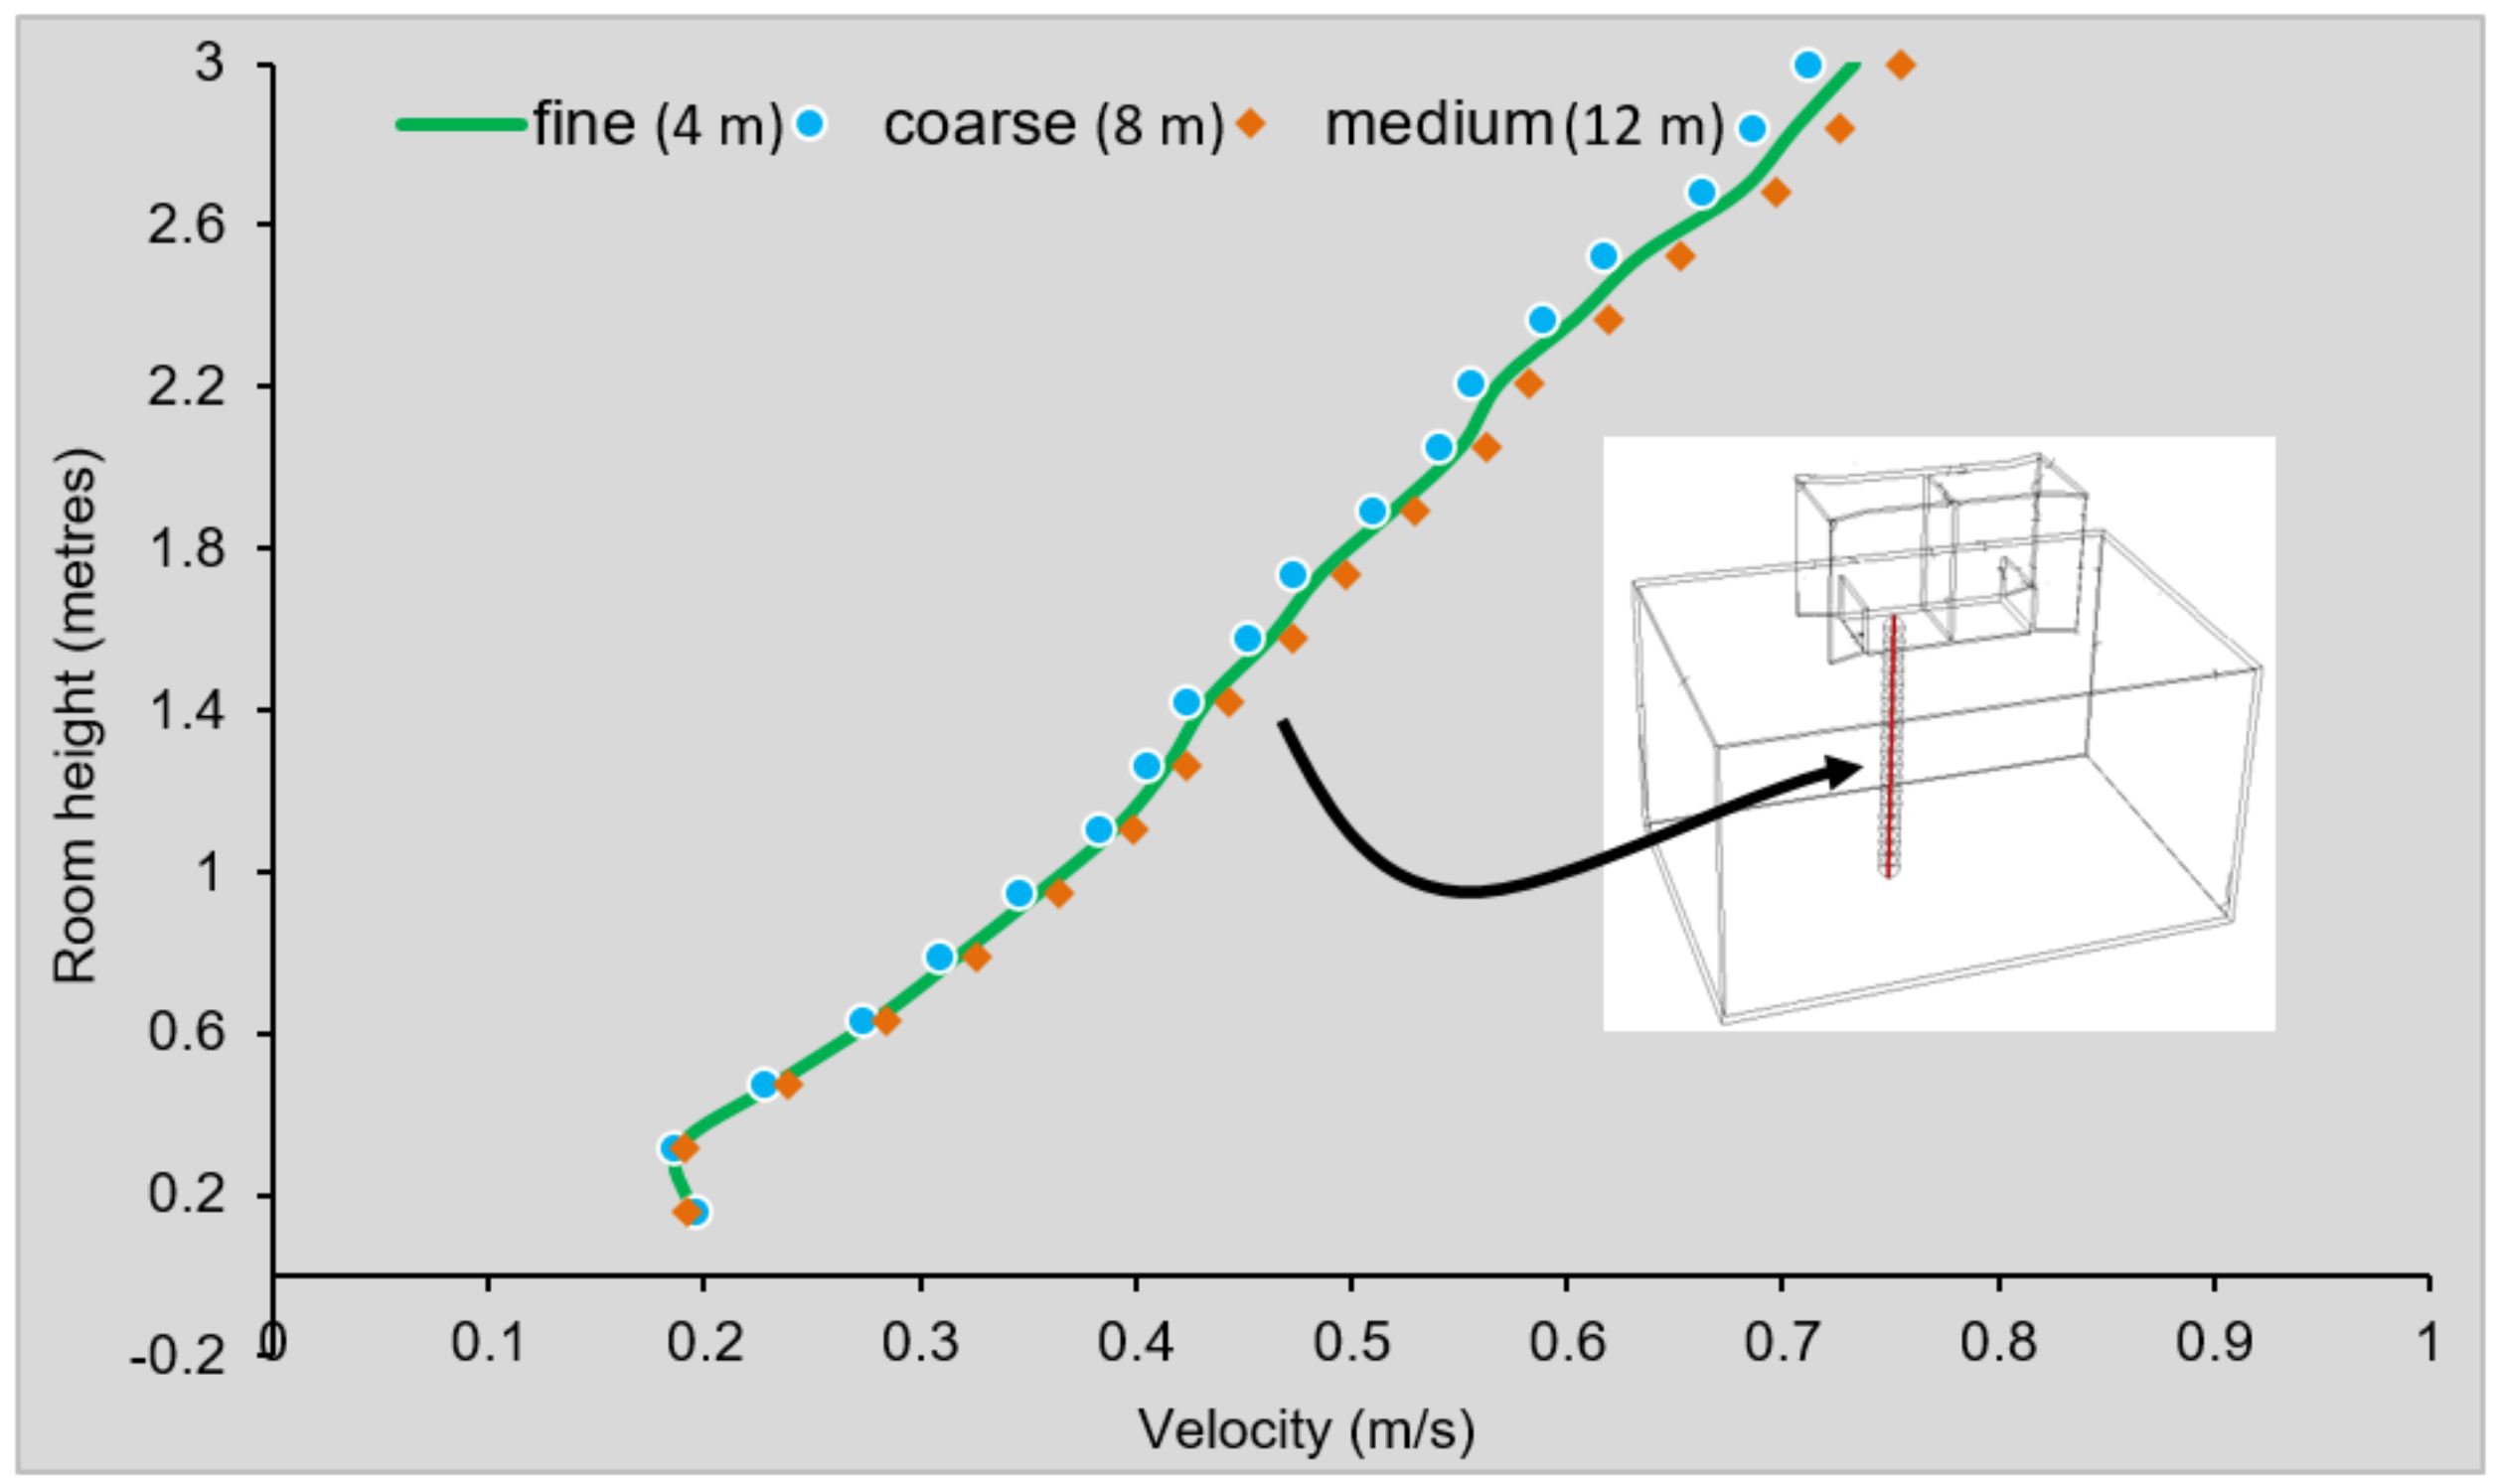
3.1. Validation and Grid Adoption of CFD Simulation

Before carrying out further simulations and analysis, the numerical modeling accuracy was evaluated by validating against wind tunnel measurements. The simulation results were compared against the supply and exhaust airflow velocity measurements from the wind tunnel testing of the windcatcher with ASCD, as detailed in previous work [22]. A total of 12 measurement points inside the windcatcher channels were used for the comparison of the two methods, as shown in Figure 4. A hot-wire anemometer was used to carry out the airflow velocity measurements at different points. Figure 5 compares the simulation results of the airflow velocity against the experimental data [22]. Overall, a good agreement between the numerical and measurements values was observed. It was found that the average difference in the values was 9%. This is in line with the findings of Reference [36,37], which showed the capabilities of the turbulence model for the prediction of natural ventilation airflows.
The selected mesh resolution was based on a sensitivity analysis which was accomplished by carrying out simulations with two additional mesh sizes: coarser (4 million elements) and finer mesh (12 million elements). The analysis is conducted for the reference windcatcher model with ASCD using the same computational domain and boundary conditions. The airflow velocity values across a vertical line in the supply airstream was compared for the three mesh sizes, as shown in Figure 6. It was observed that the velocity values variation between the three mesh sizes was negligible and mostly independent from the mesh sizes. The largest deviation was observed for the points near the supply channel. At the height of 2.8 m, the deviation between the medium (reference with 8 million mesh) and the finer mesh (12 million) was 2.1%. While taking into account the negligible dependence on the mesh resolution and, at the same time, to minimize the computational time, the medium mesh was utilized for further analysis.

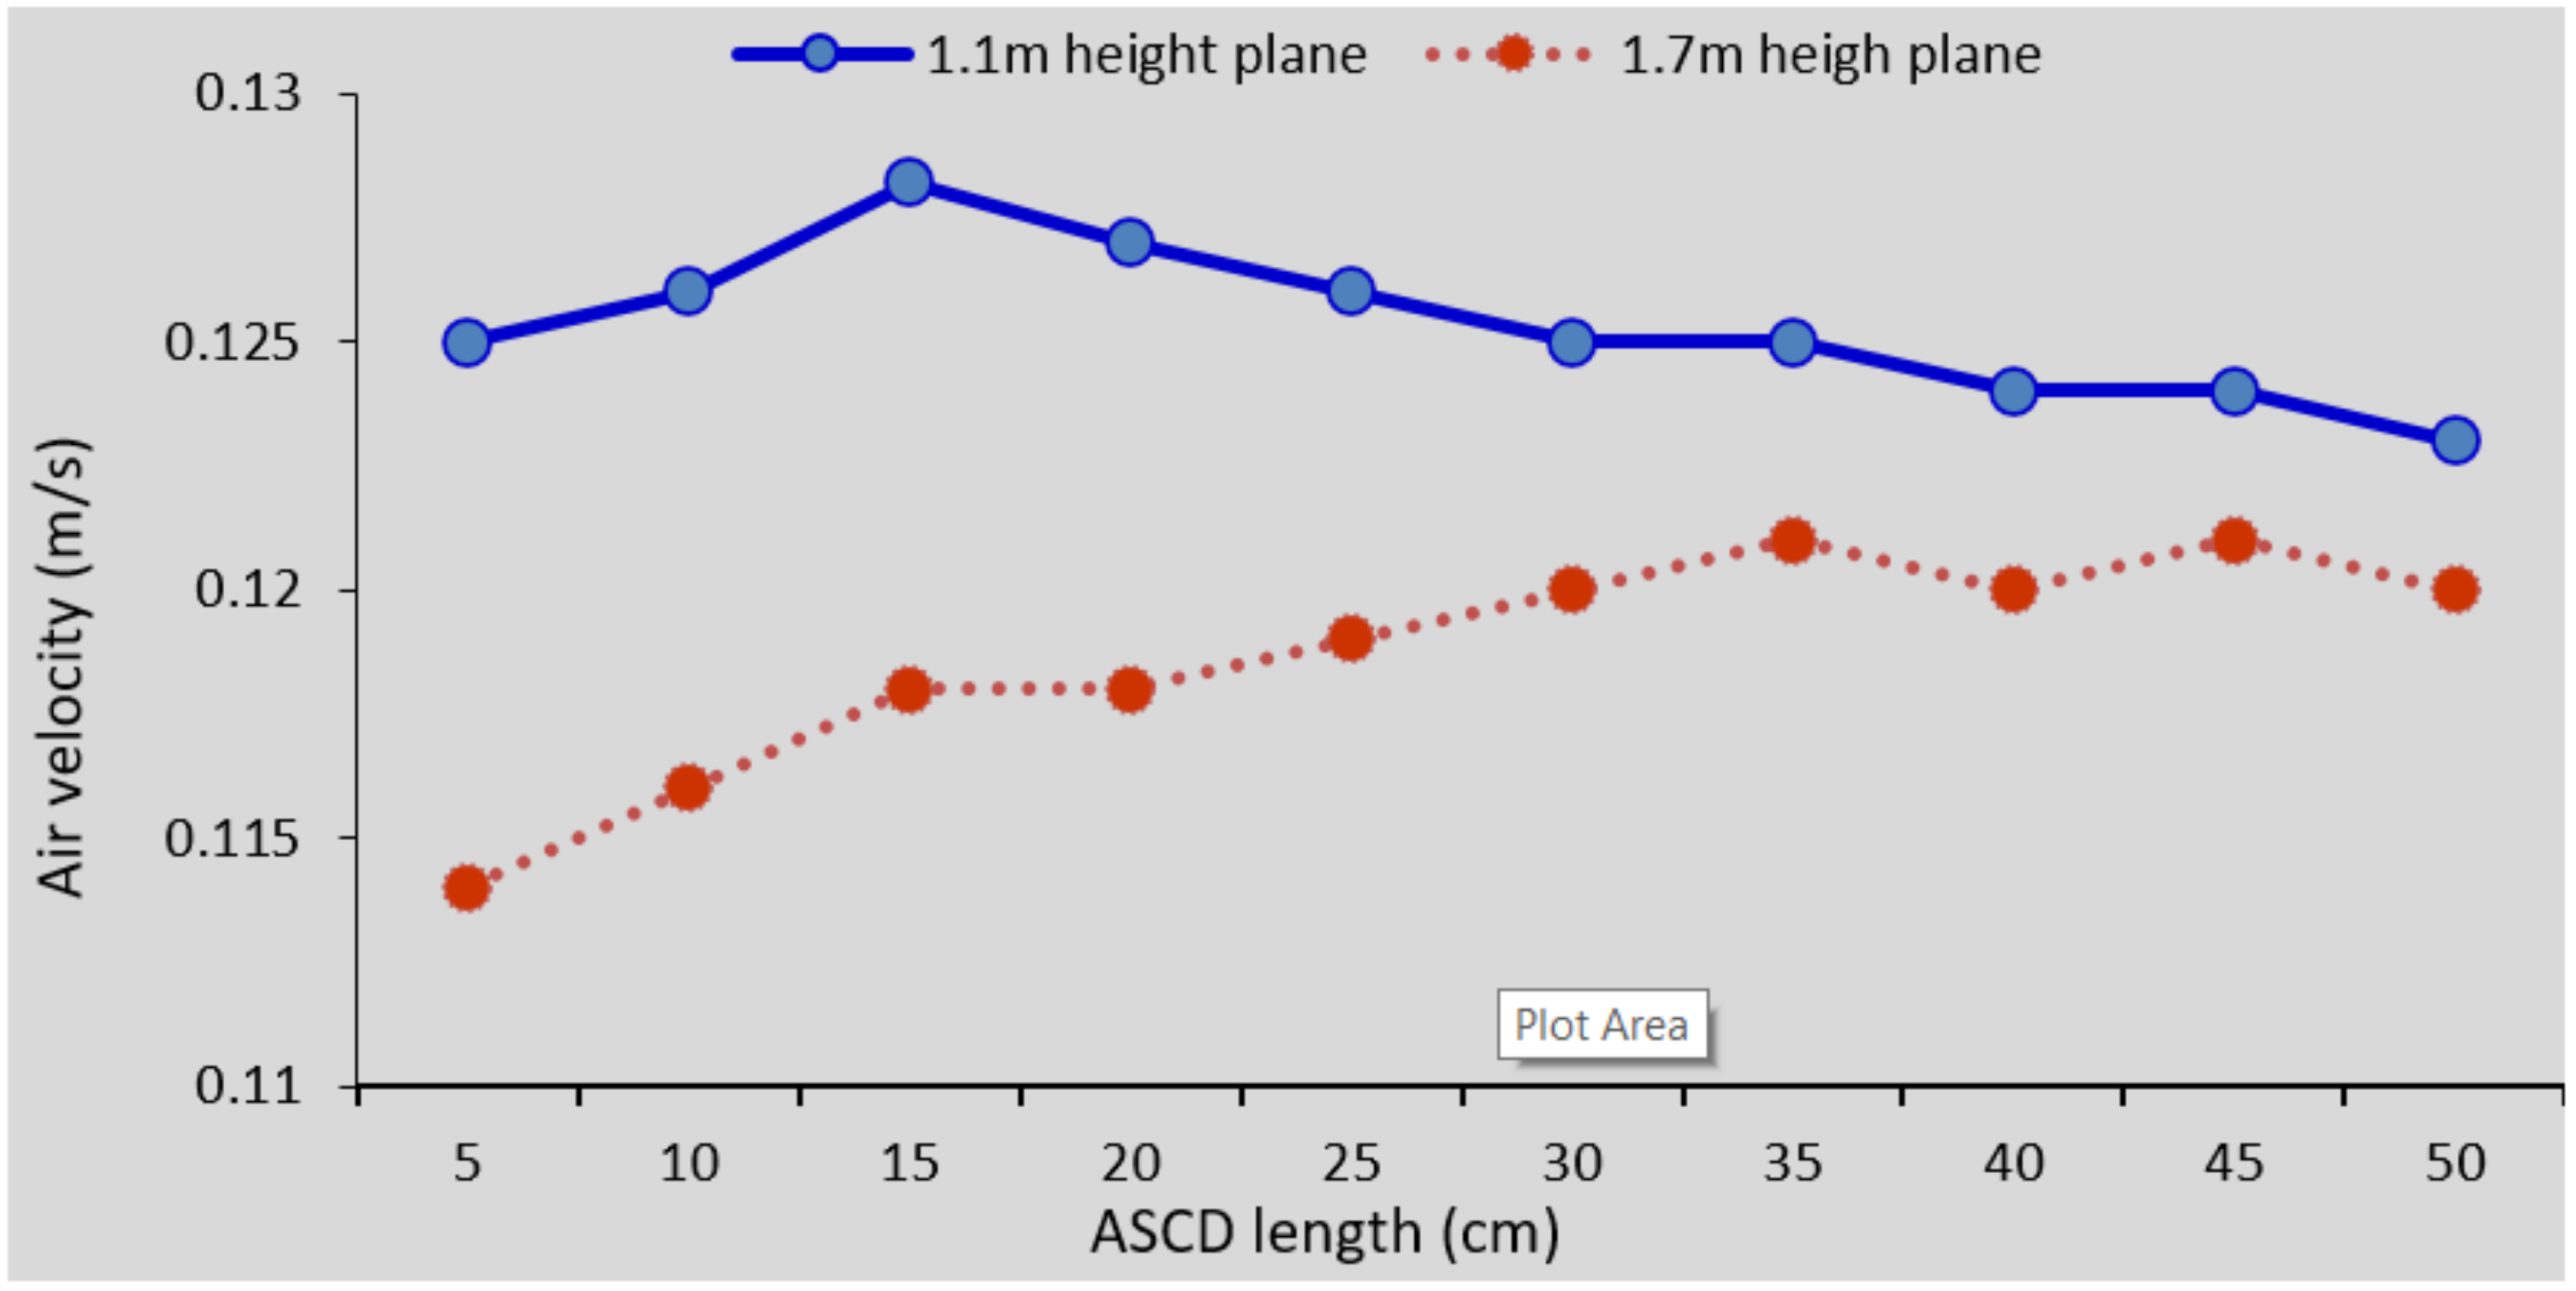
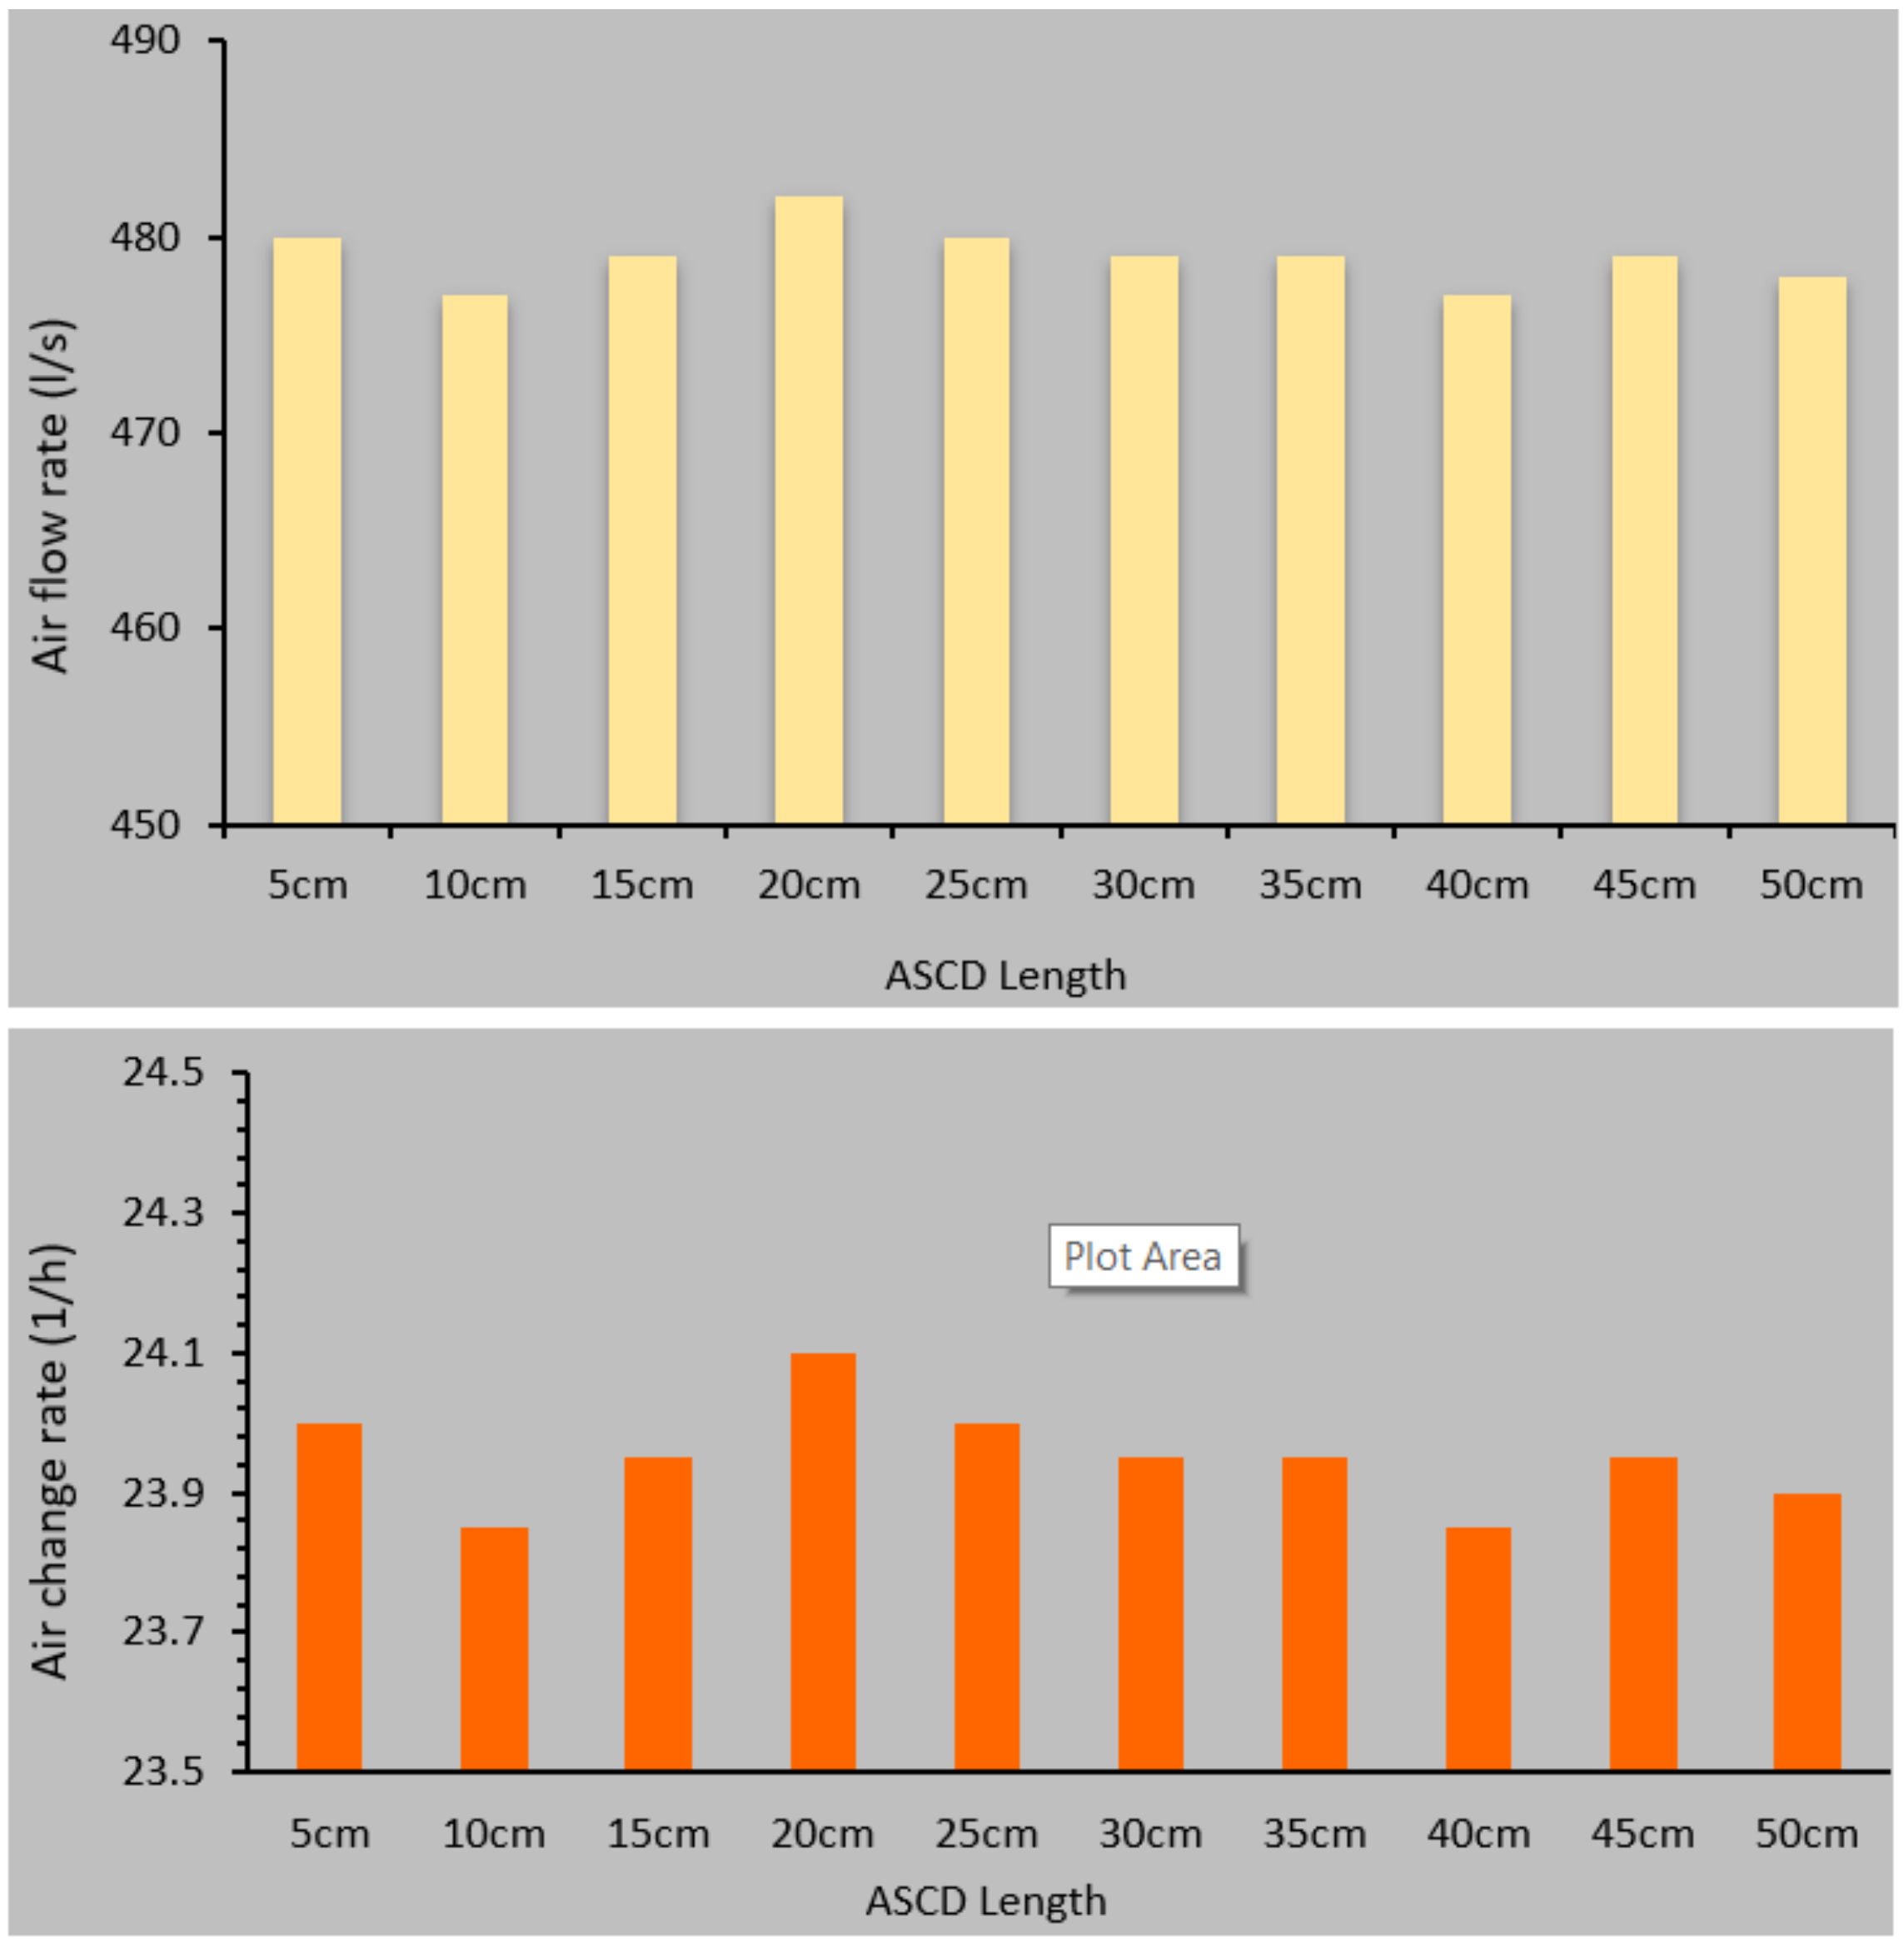
3.2. Impact of the Length of ASCD on the Ventilation Performance

Building on the findings of Reference [24], which evaluated the impact of ASCD angle, this section will evaluate the influence of the length of the ASCD on the ventilation performance based on simulation analysis. Ideally, a shorter and compact ASCD design which requires smaller space for integration and lower cost is preferred. However, it should still be able to prevent the air short-circuiting of the fresh air into the exhaust region. Hence, a detailed evaluation of ventilation performance is required before progressing on to the IEQ analysis. The length of the ASCD was varied between 5 cm to 50 cm, while the angle was maintained at 80°.
The mean airflow velocity was compared at two heights using a planar surface created at 1.1 m, which represents the breathing height at sitting position; and 1.7 m, which represents the standing height [38]. As shown in Figure 7, although the effect was minimal, the mean airflow speed in the 1.7 m plane increased as the length of the ASCD increased. An opposite trend was observed for the mean airflow speed in the 1.1 m plane. This can be better explained by the velocity contour and vector diagram in Figure 8, which shows how the increased in ASCD length redirected the airflow towards one corner of the room, which influenced the mean airflow speed at the upper and lower regions of the room.
Figure 8 shows a comparison between the airflow distribution of the windcatcher with 15 cm ASCD and 50cm ASCD. As observed, the indoor space with the 15 cm ASCD had less stagnant air spots (dark blue color in Figure 8). The shorter ASCD was still able to minimize the fresh supply airflow short-circuiting to the exhaust stream, and, at the same time, it would also require a smaller ceiling space for installation and lower material cost. Hence, the 15 cm ASCD was selected for further analysis in this study. The influence of the ASCD length on the achieved airflow supply rate (L/s) and air change rate (1/h) are shown in Figure 9. Similarly, the effect was minimal, and the device was capable of providing the recommended fresh air rates (15 L/s), even at low wind speed conditions, assuming there are 15 occupants in the space.

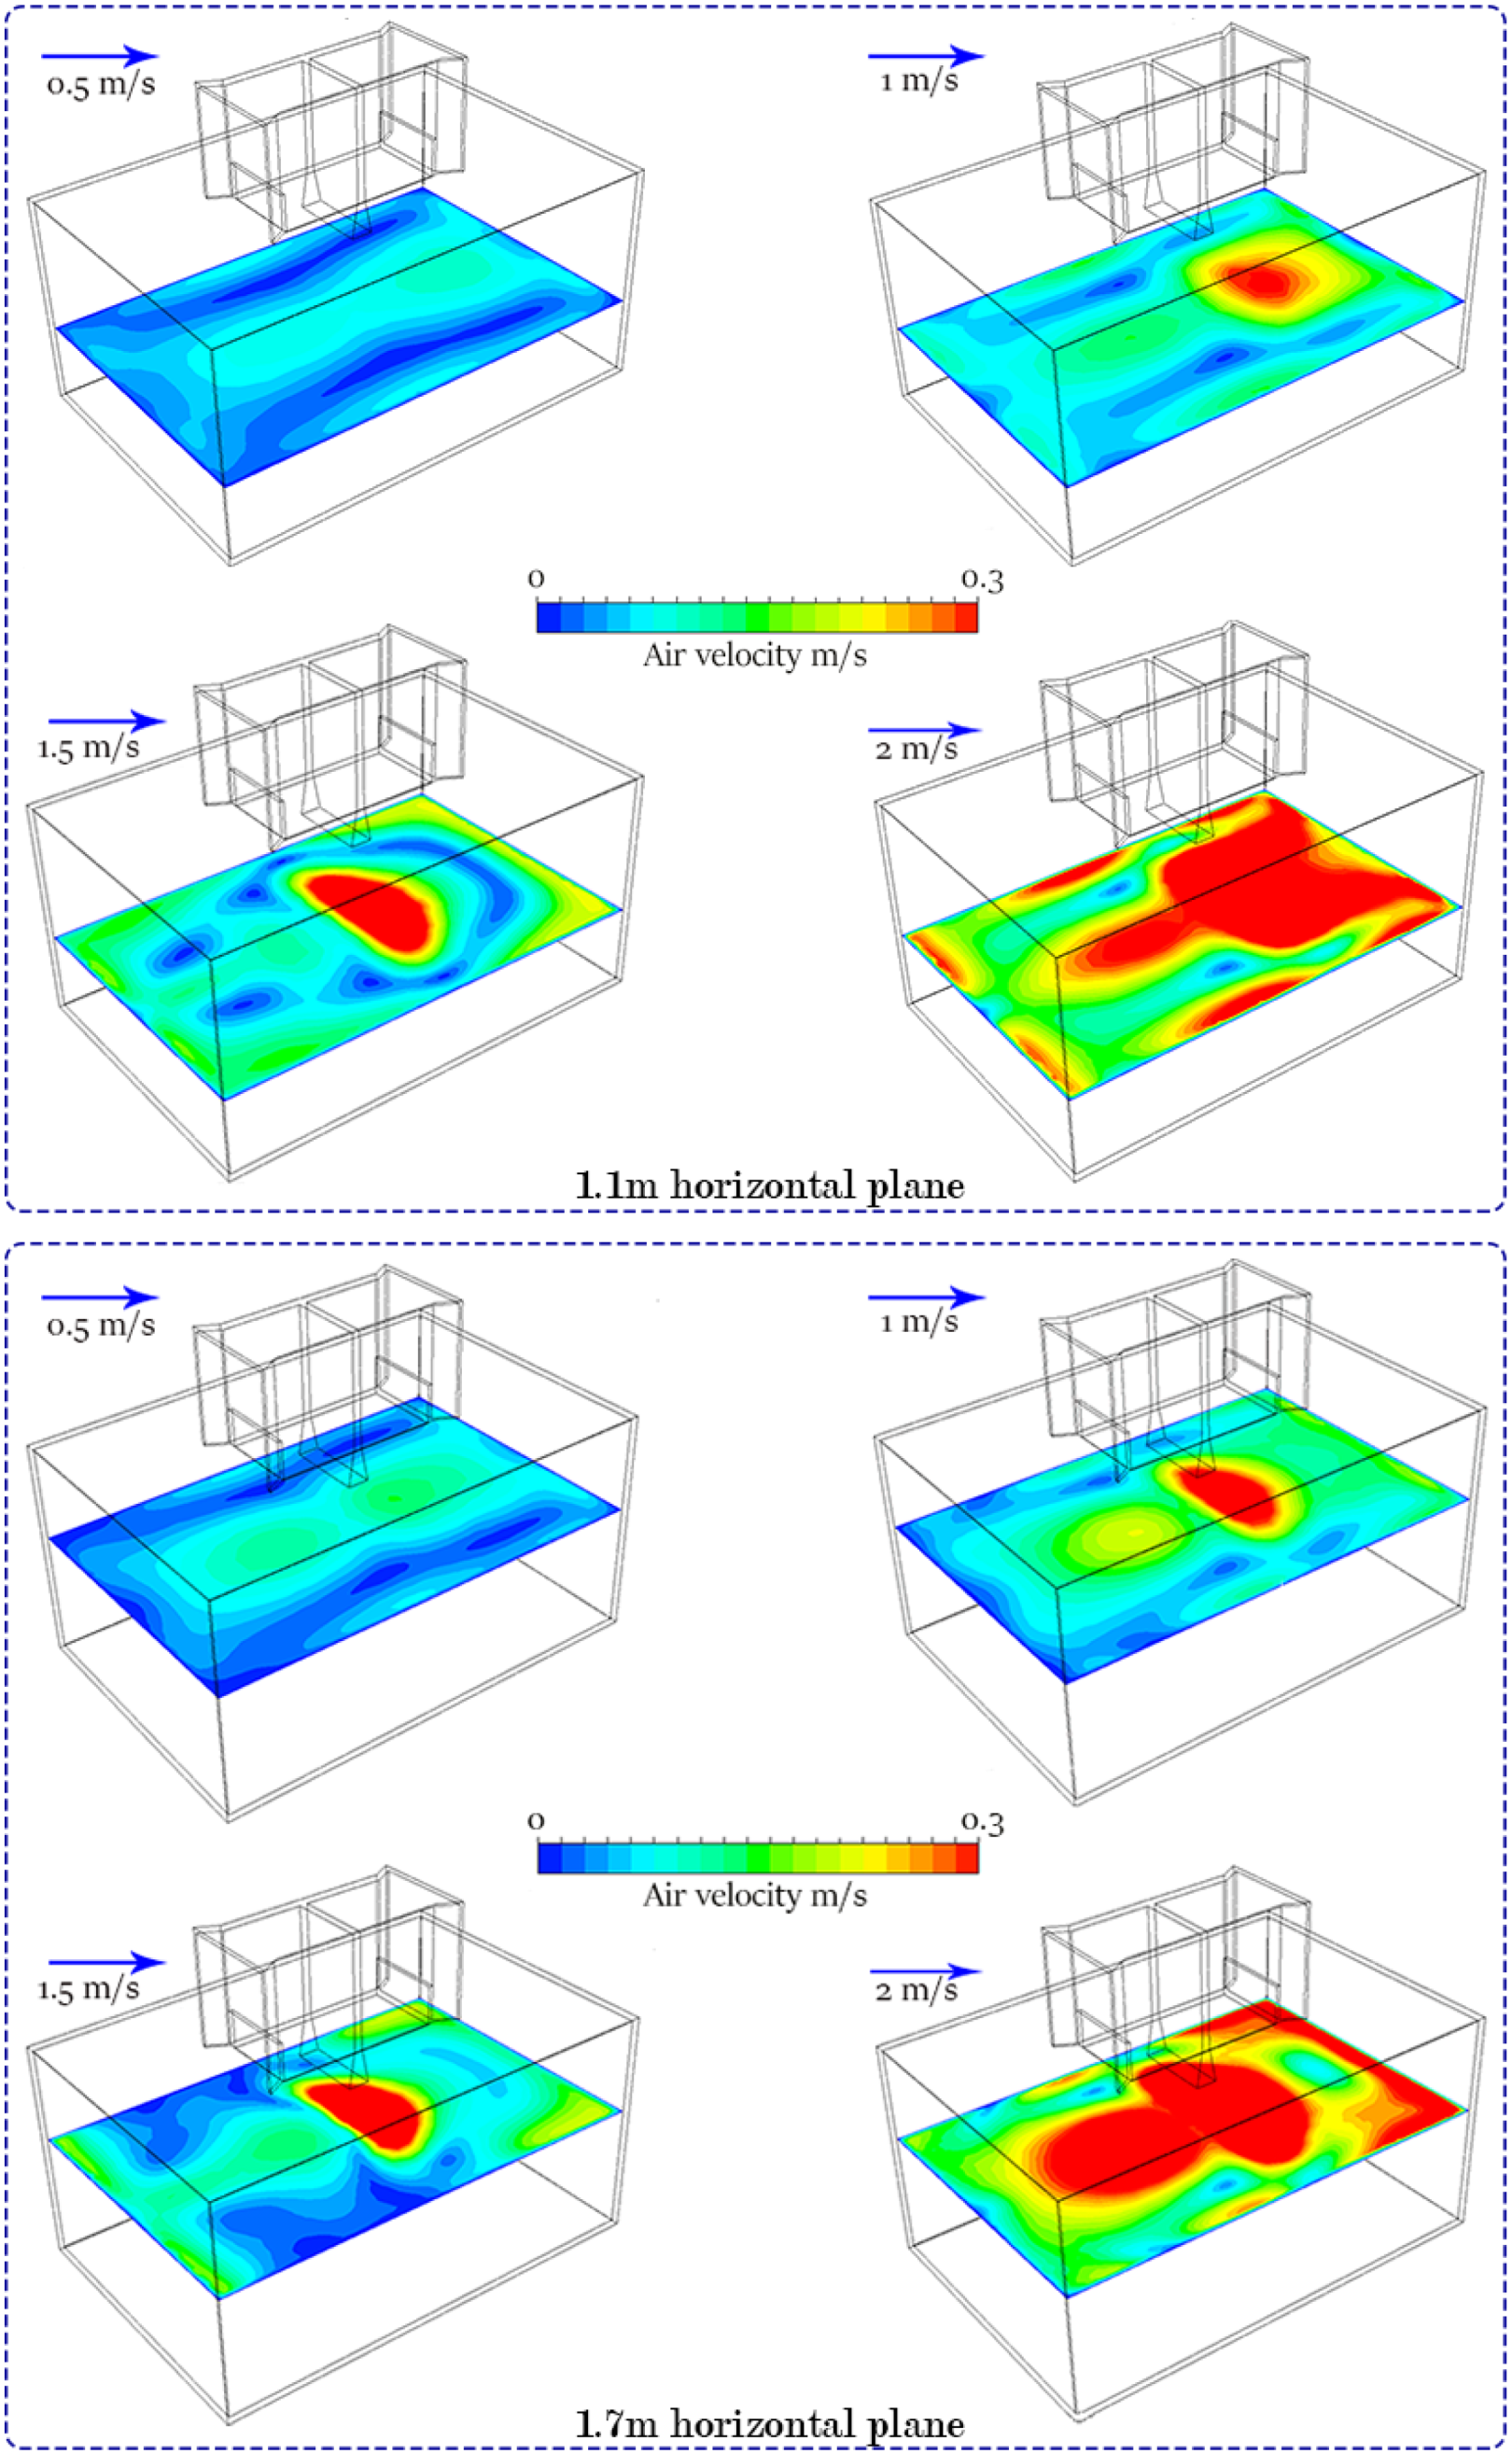
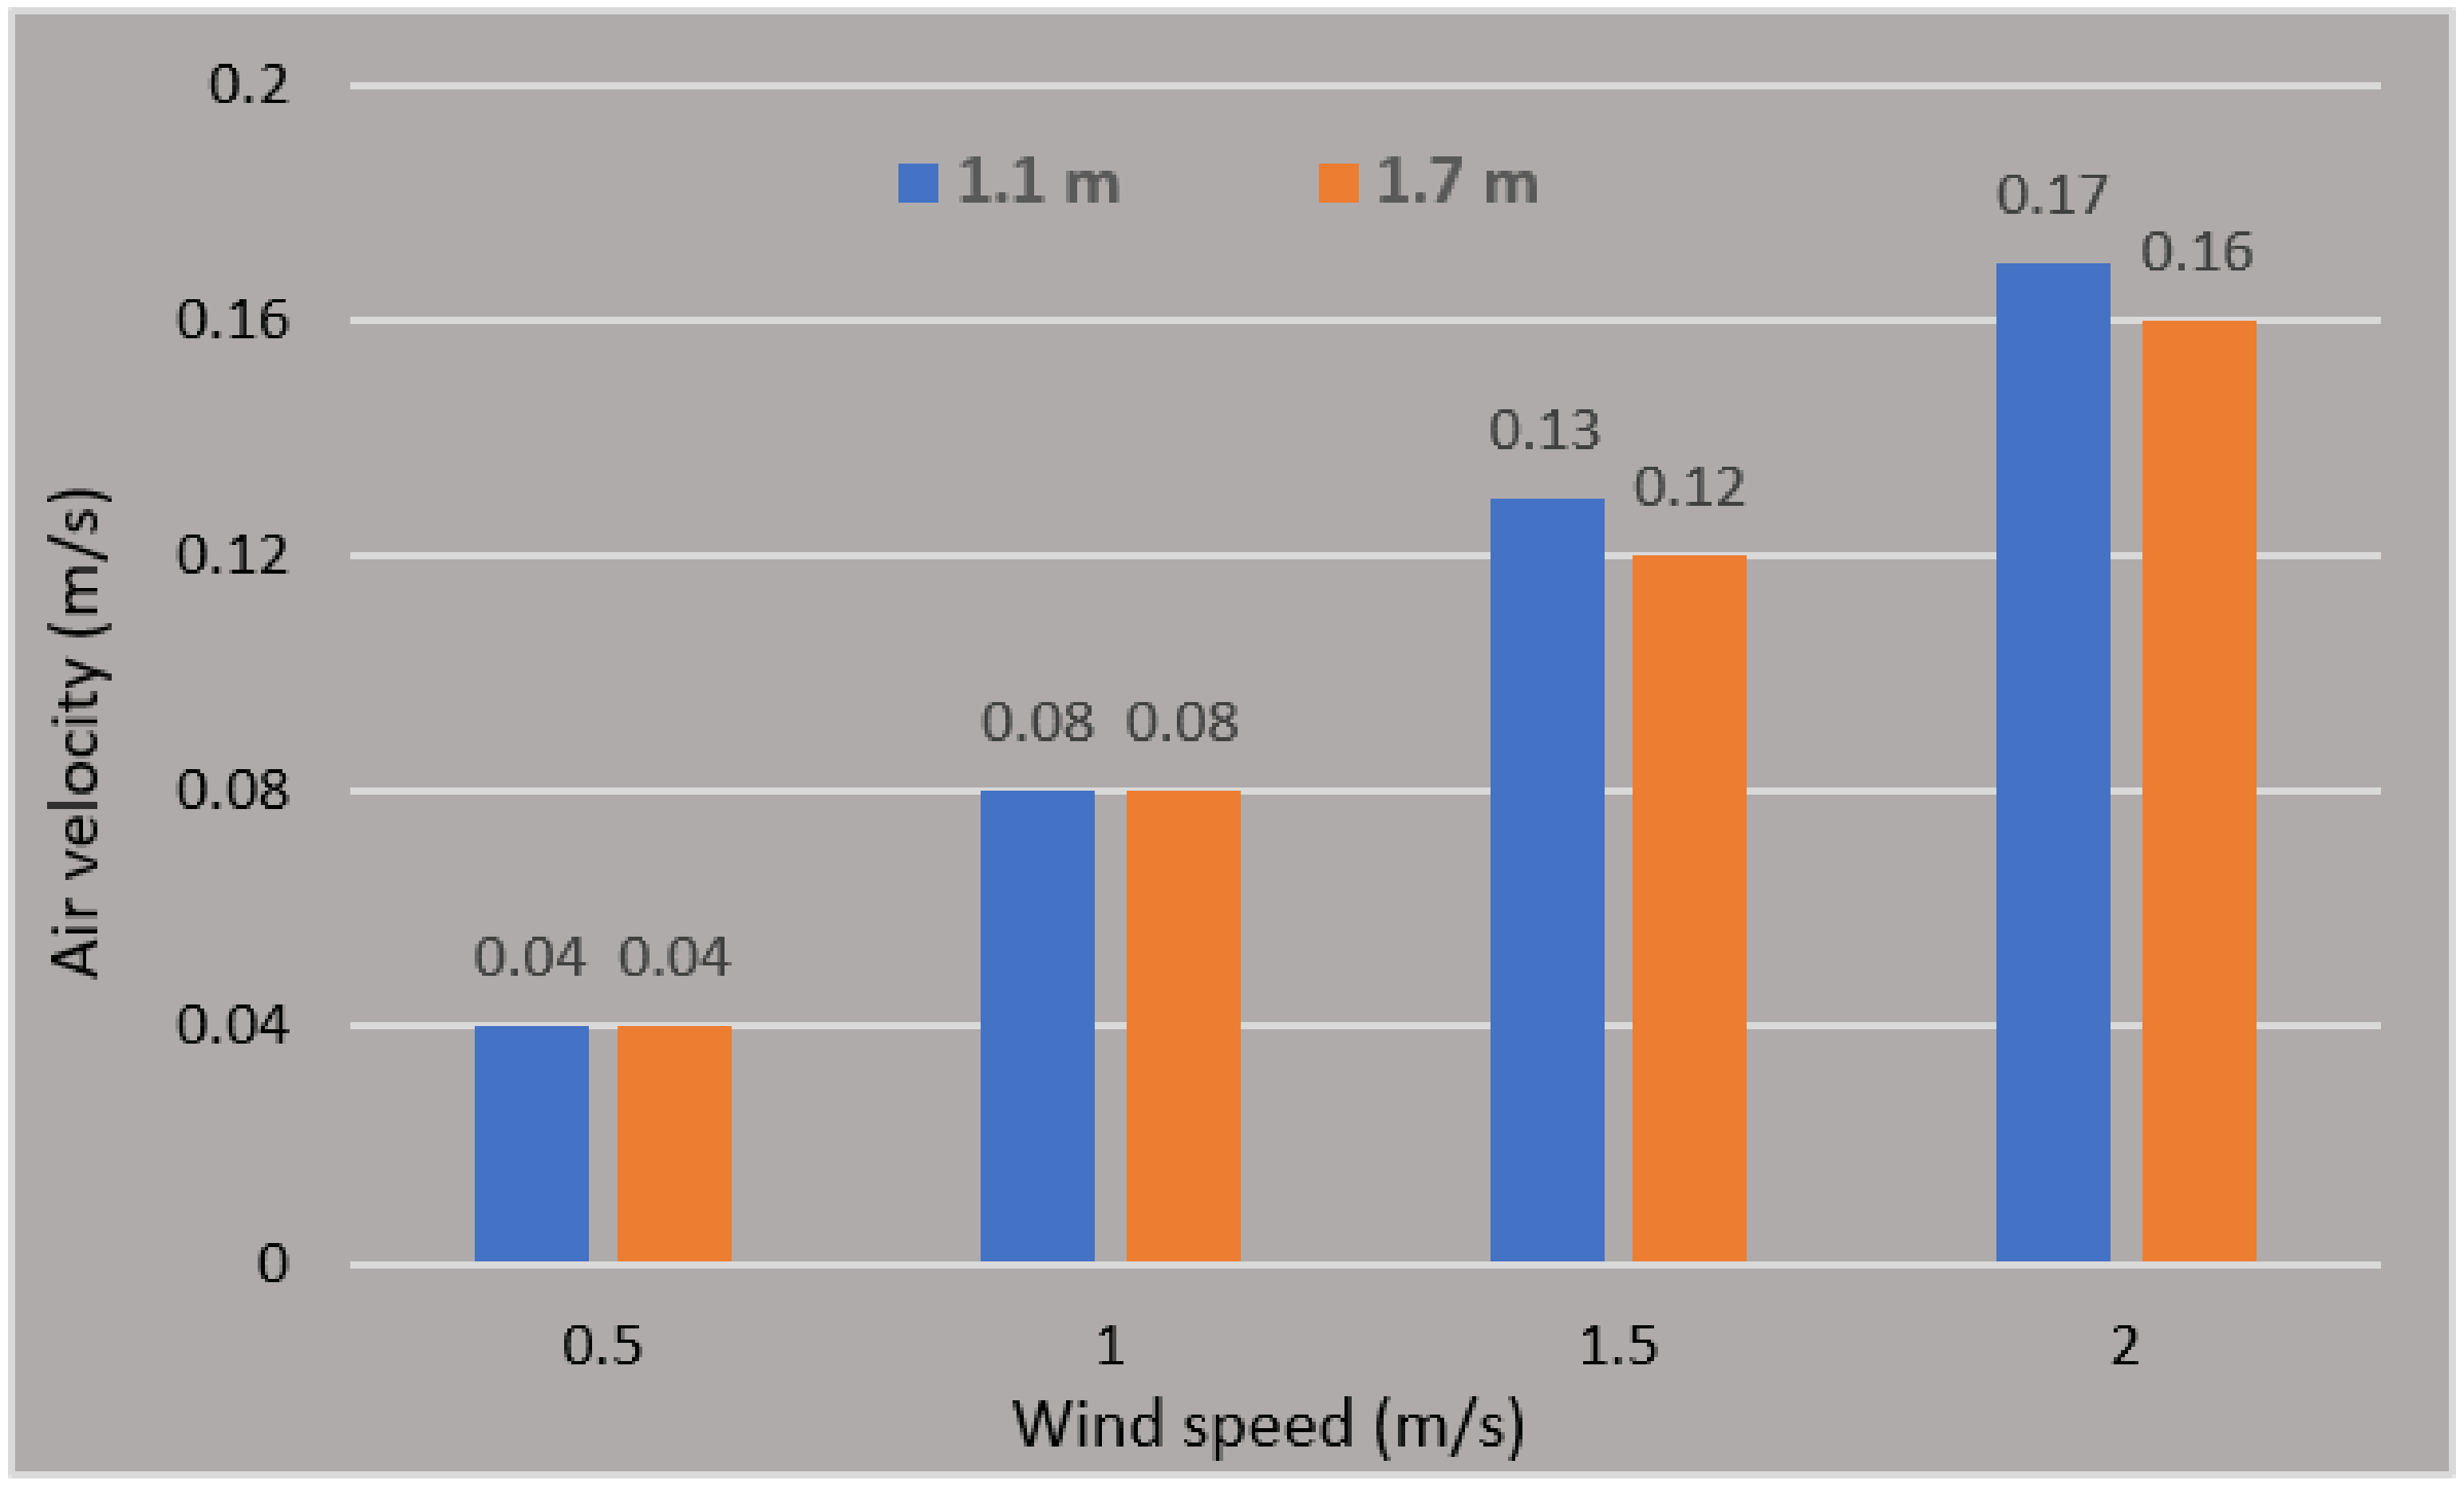
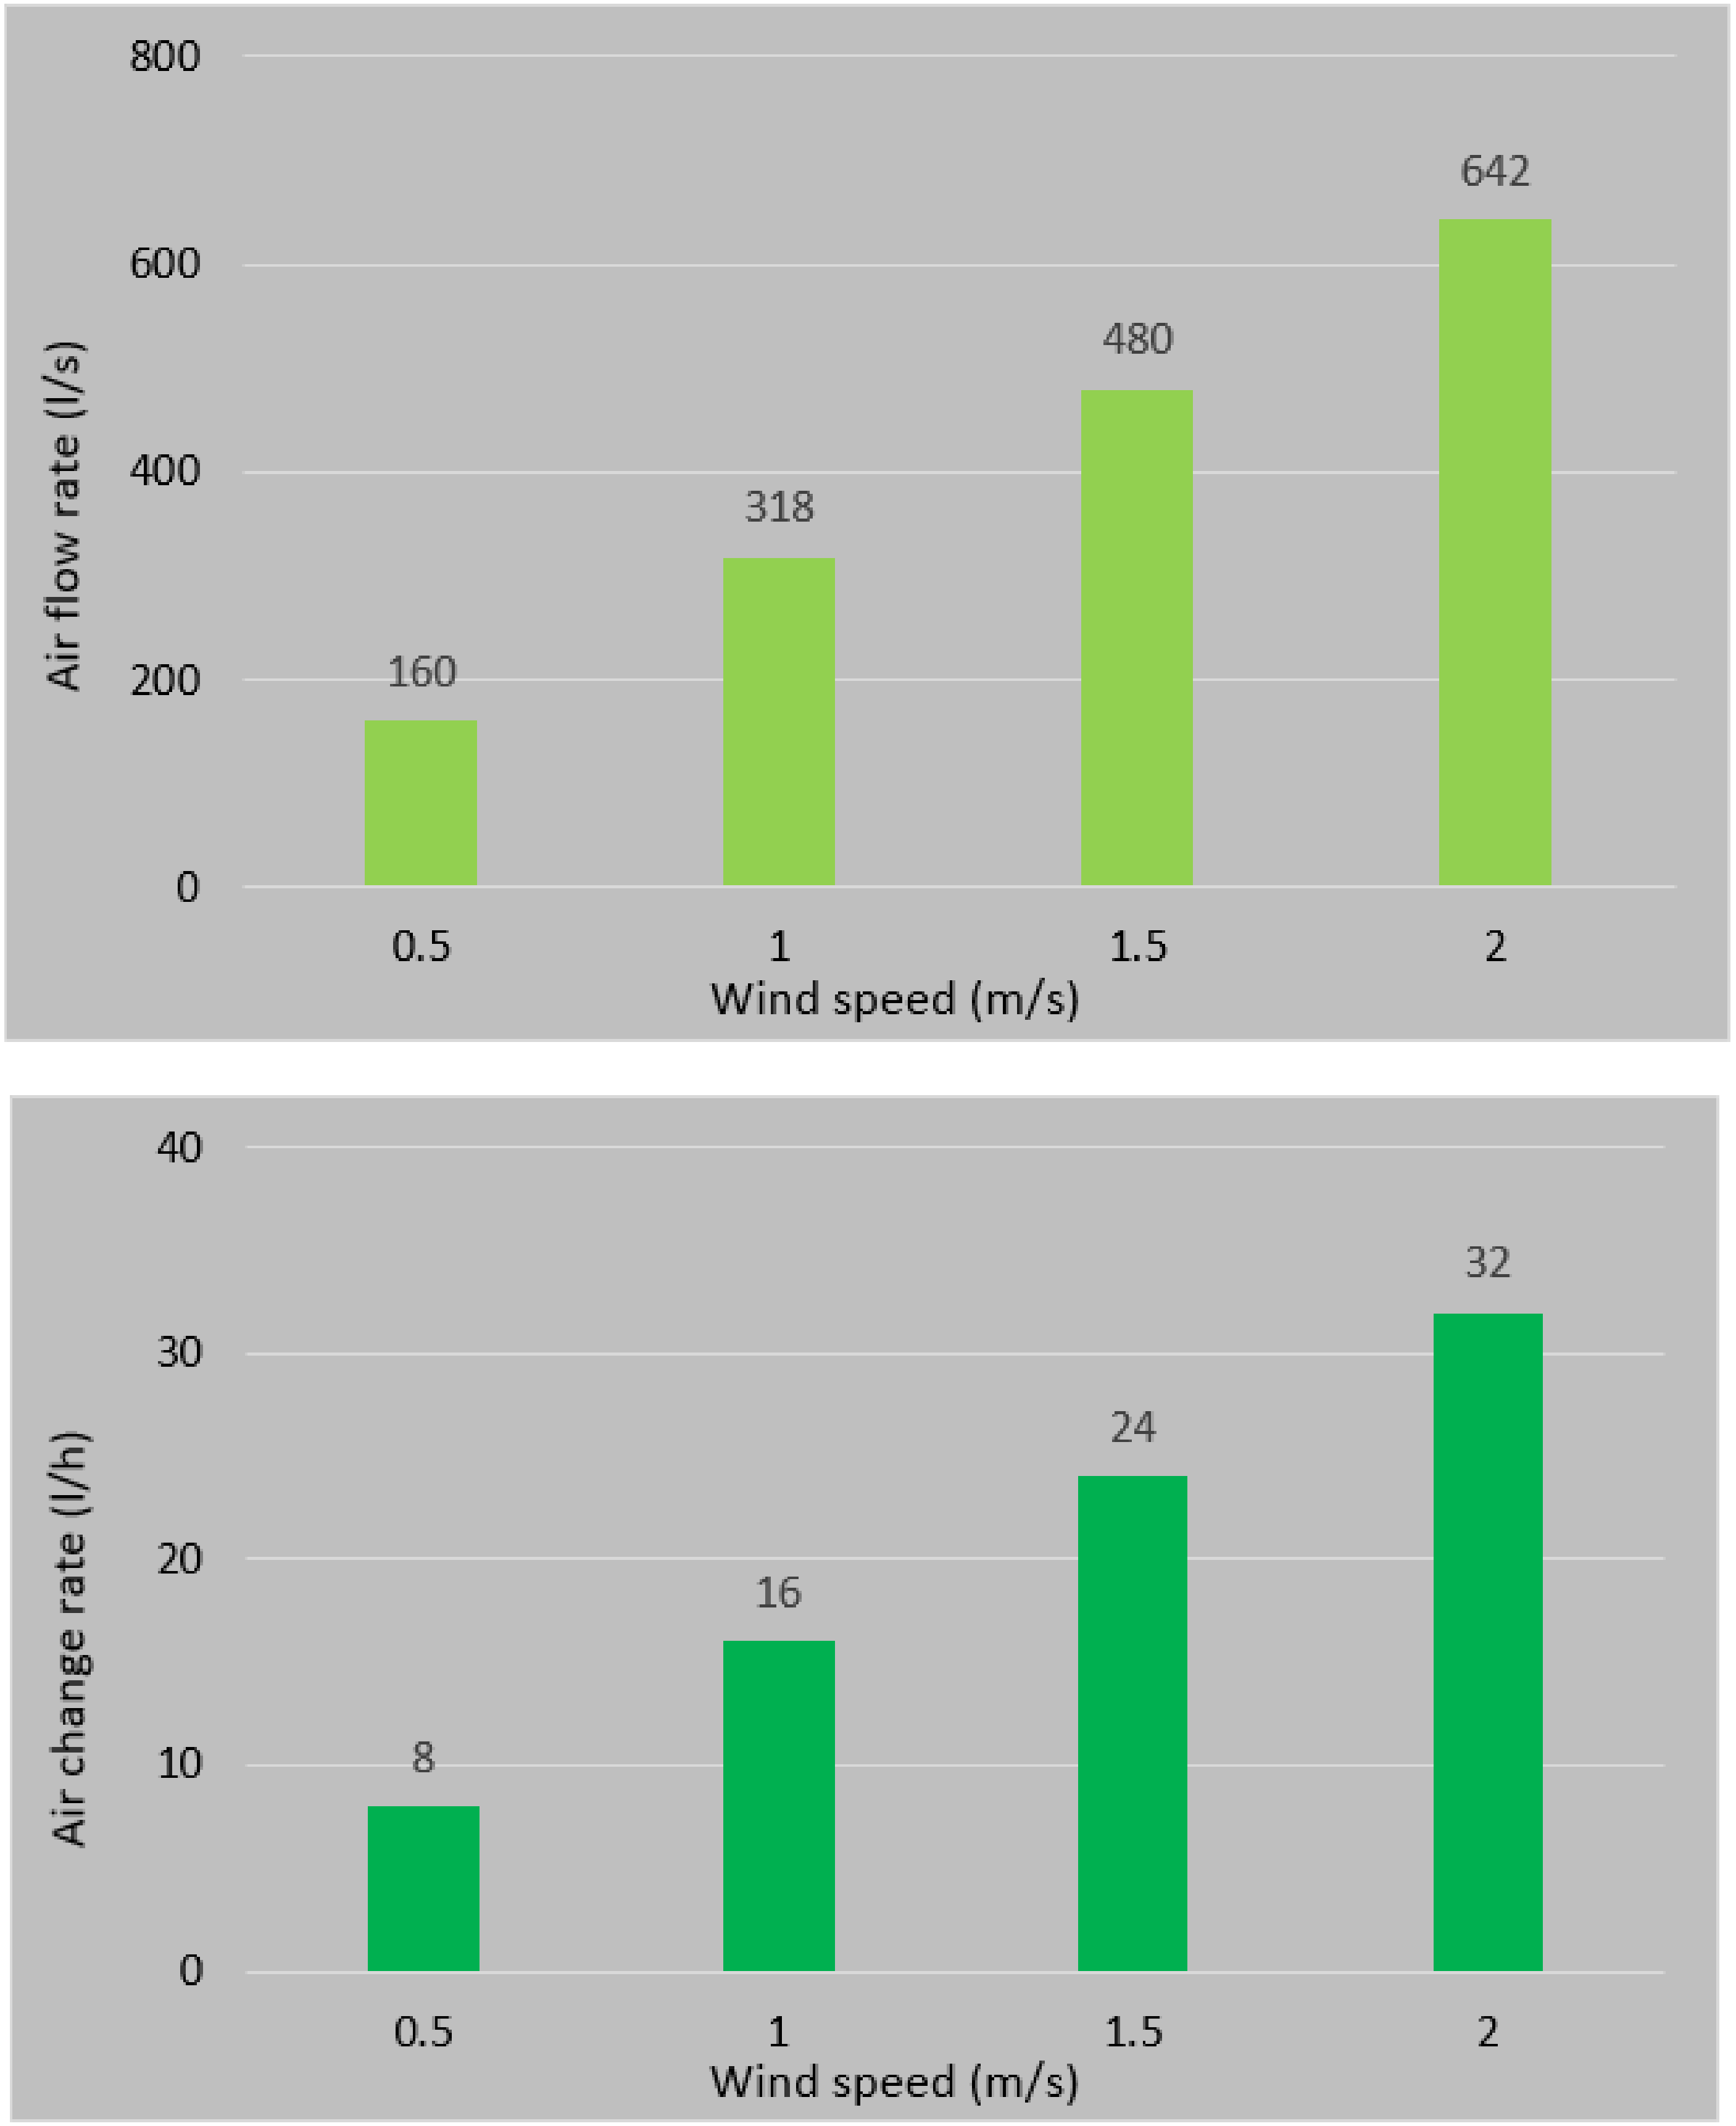
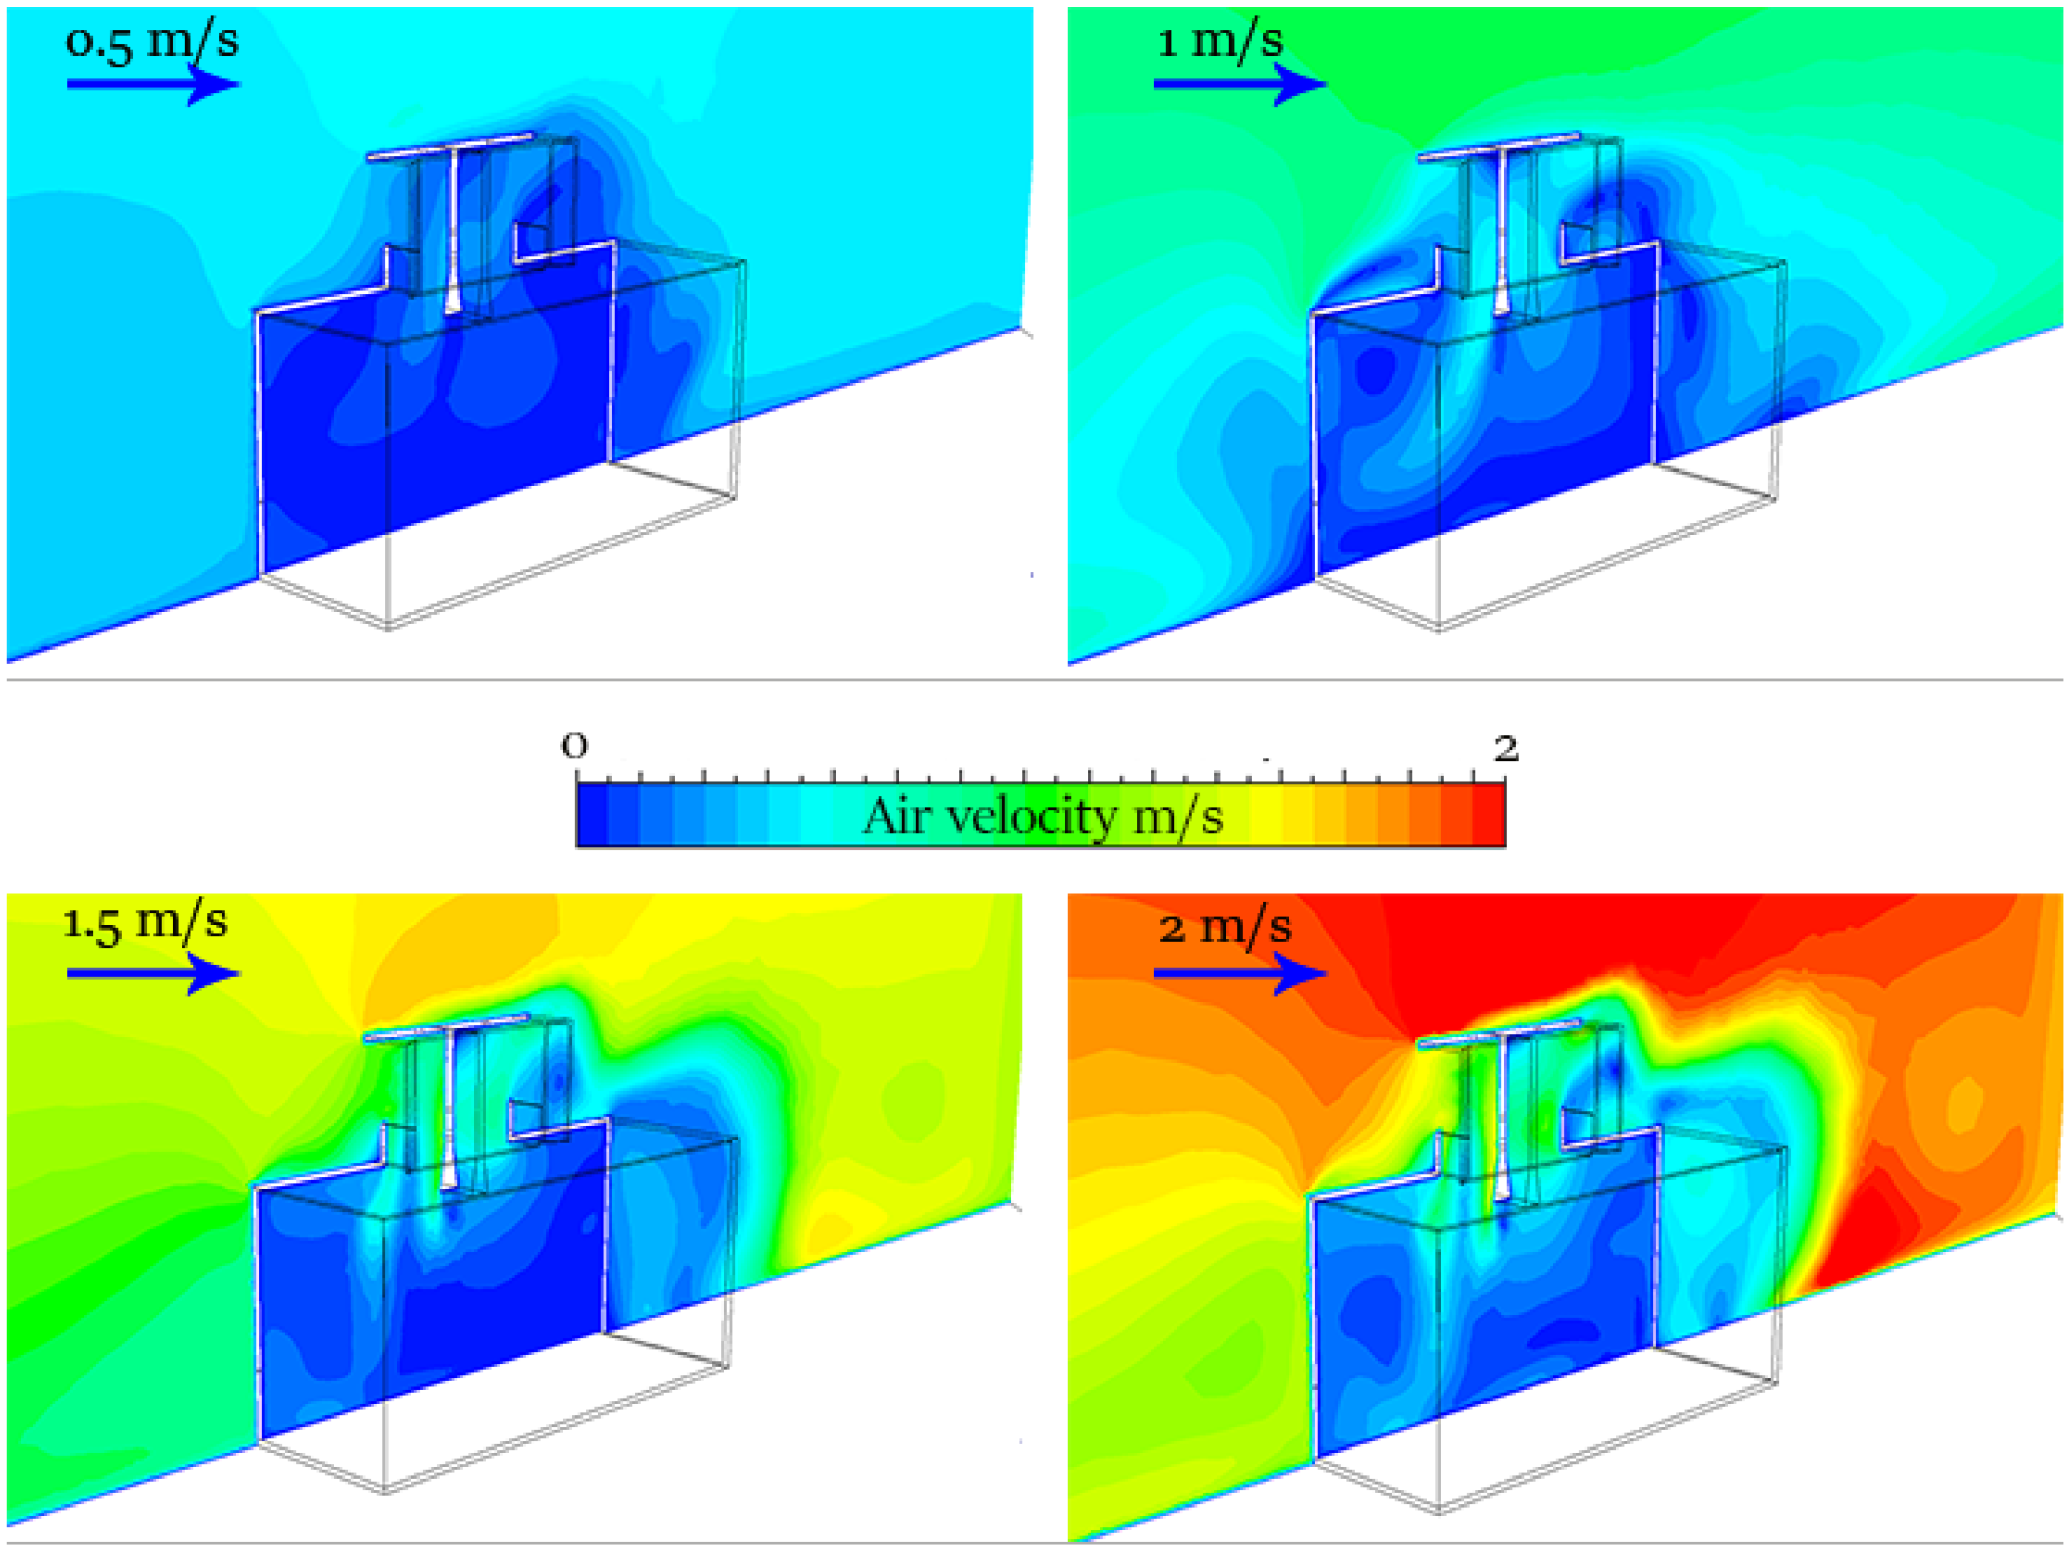
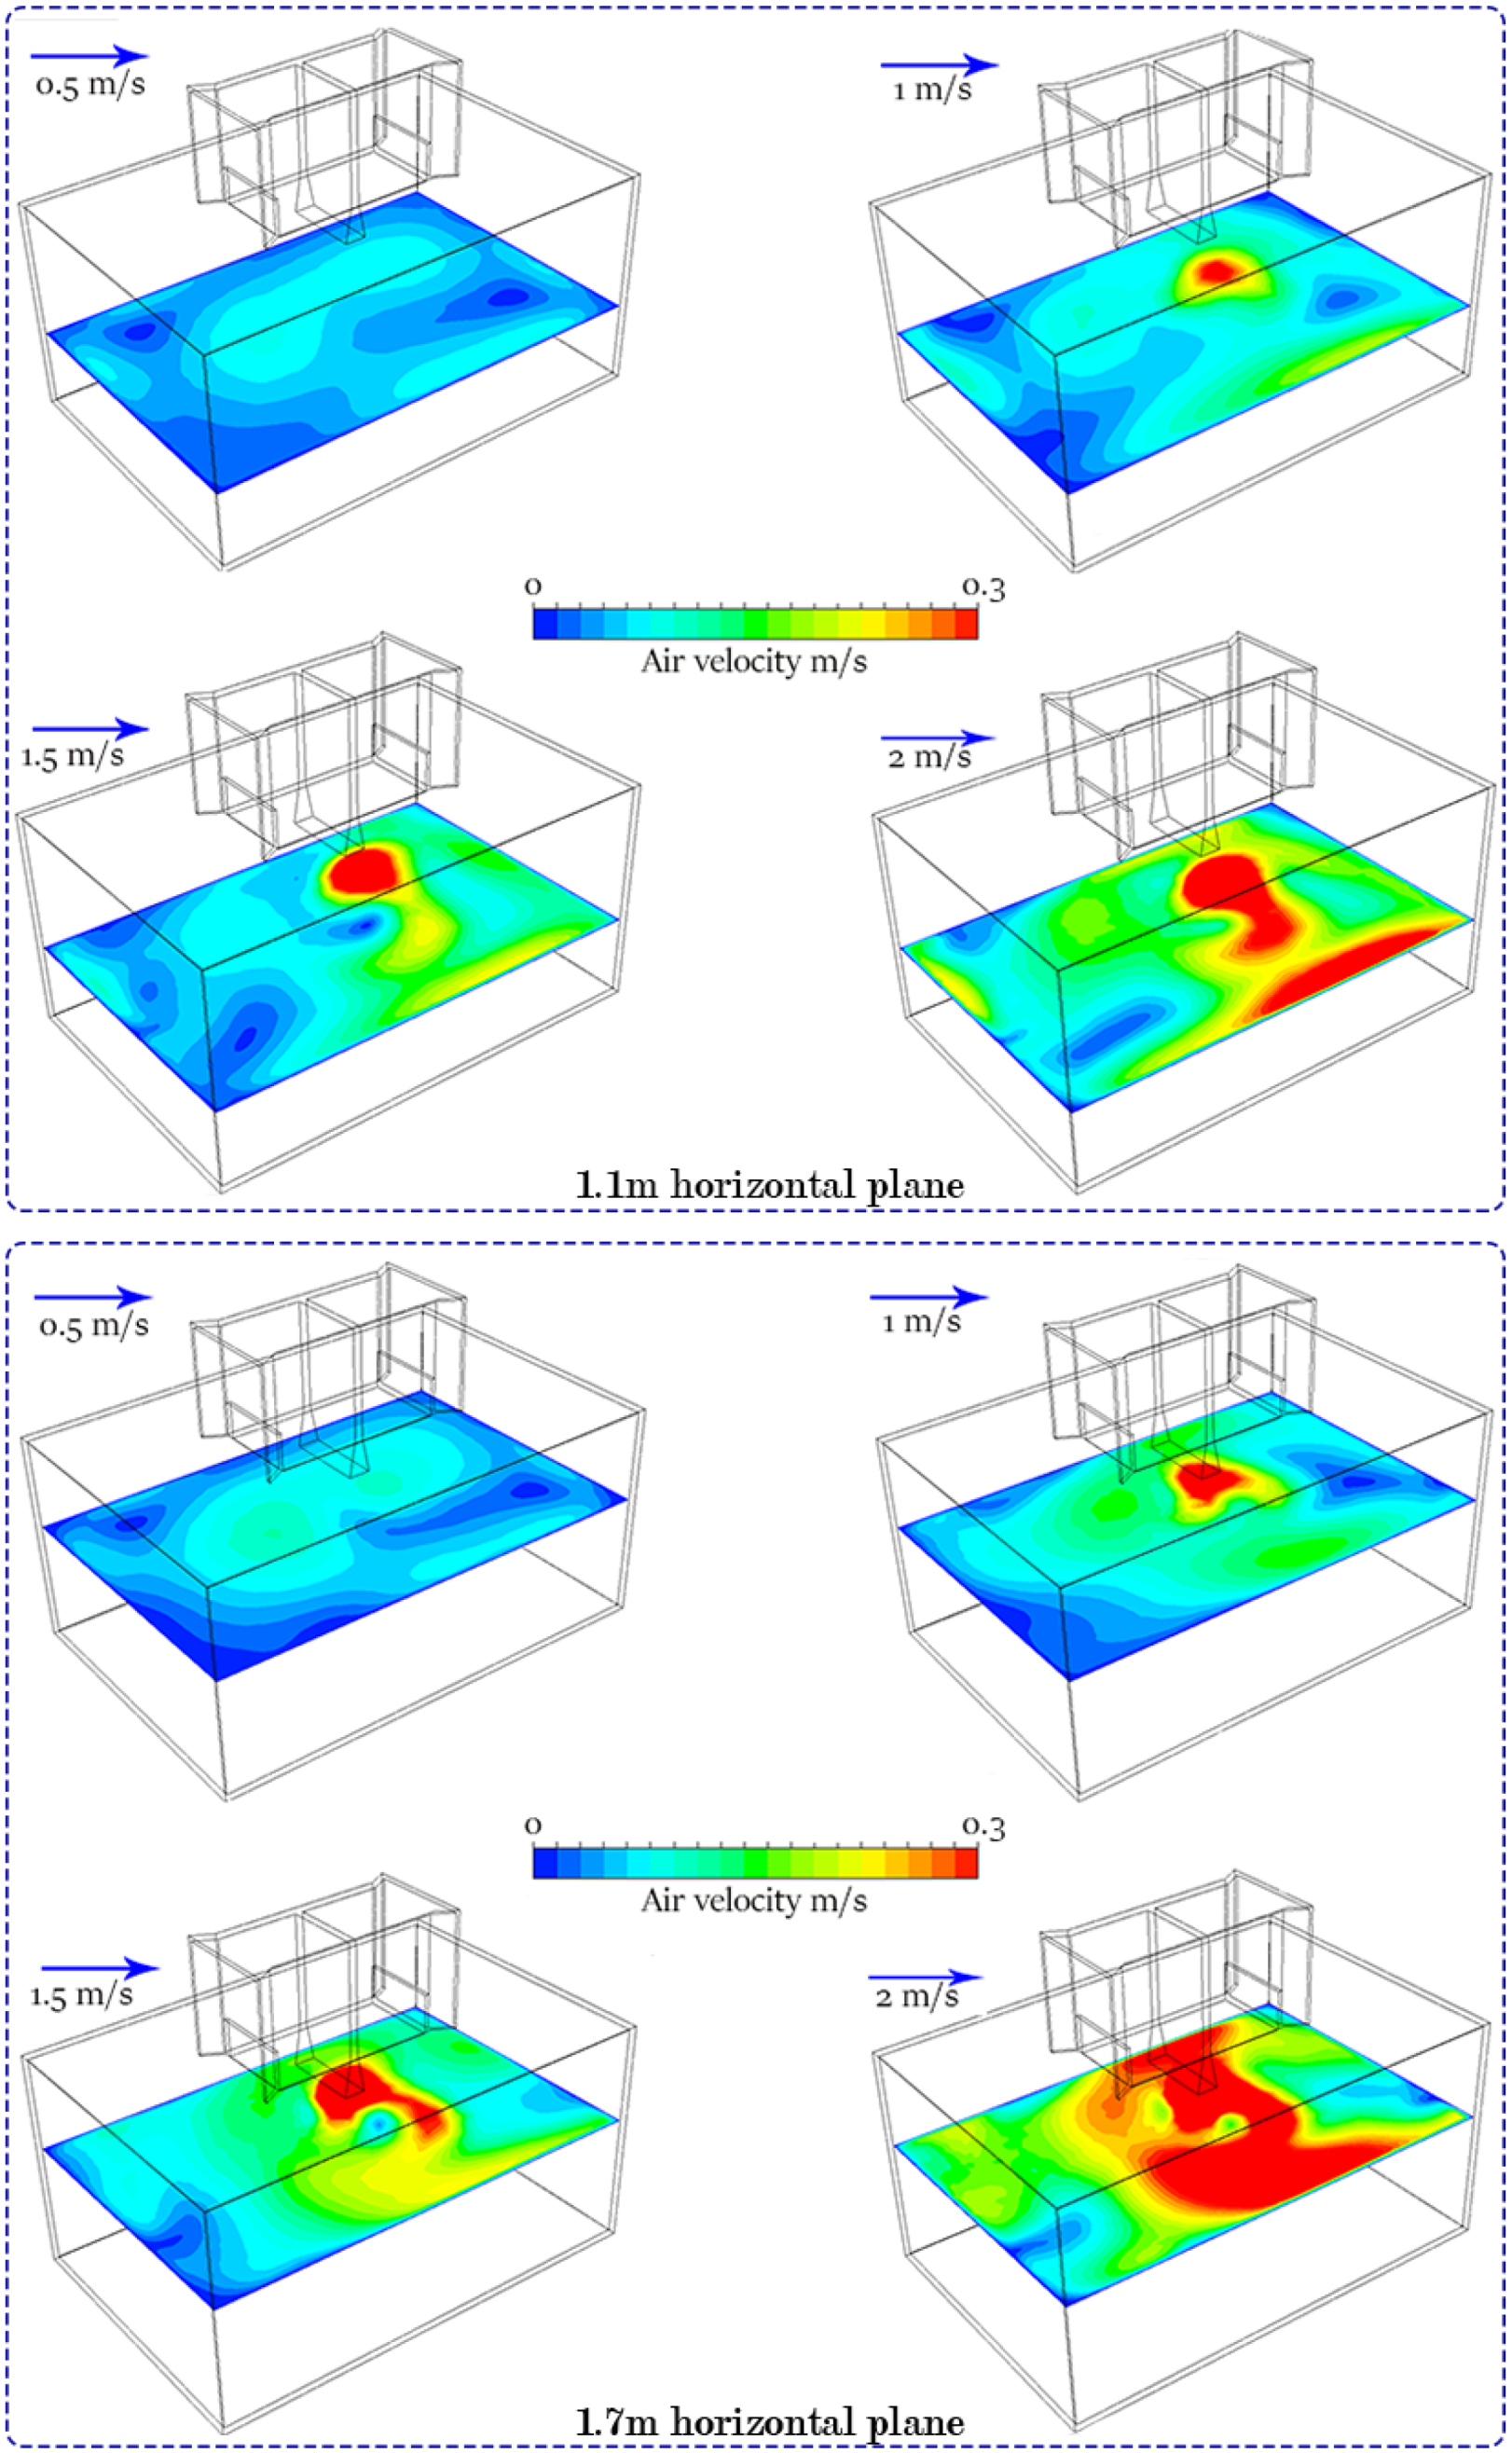
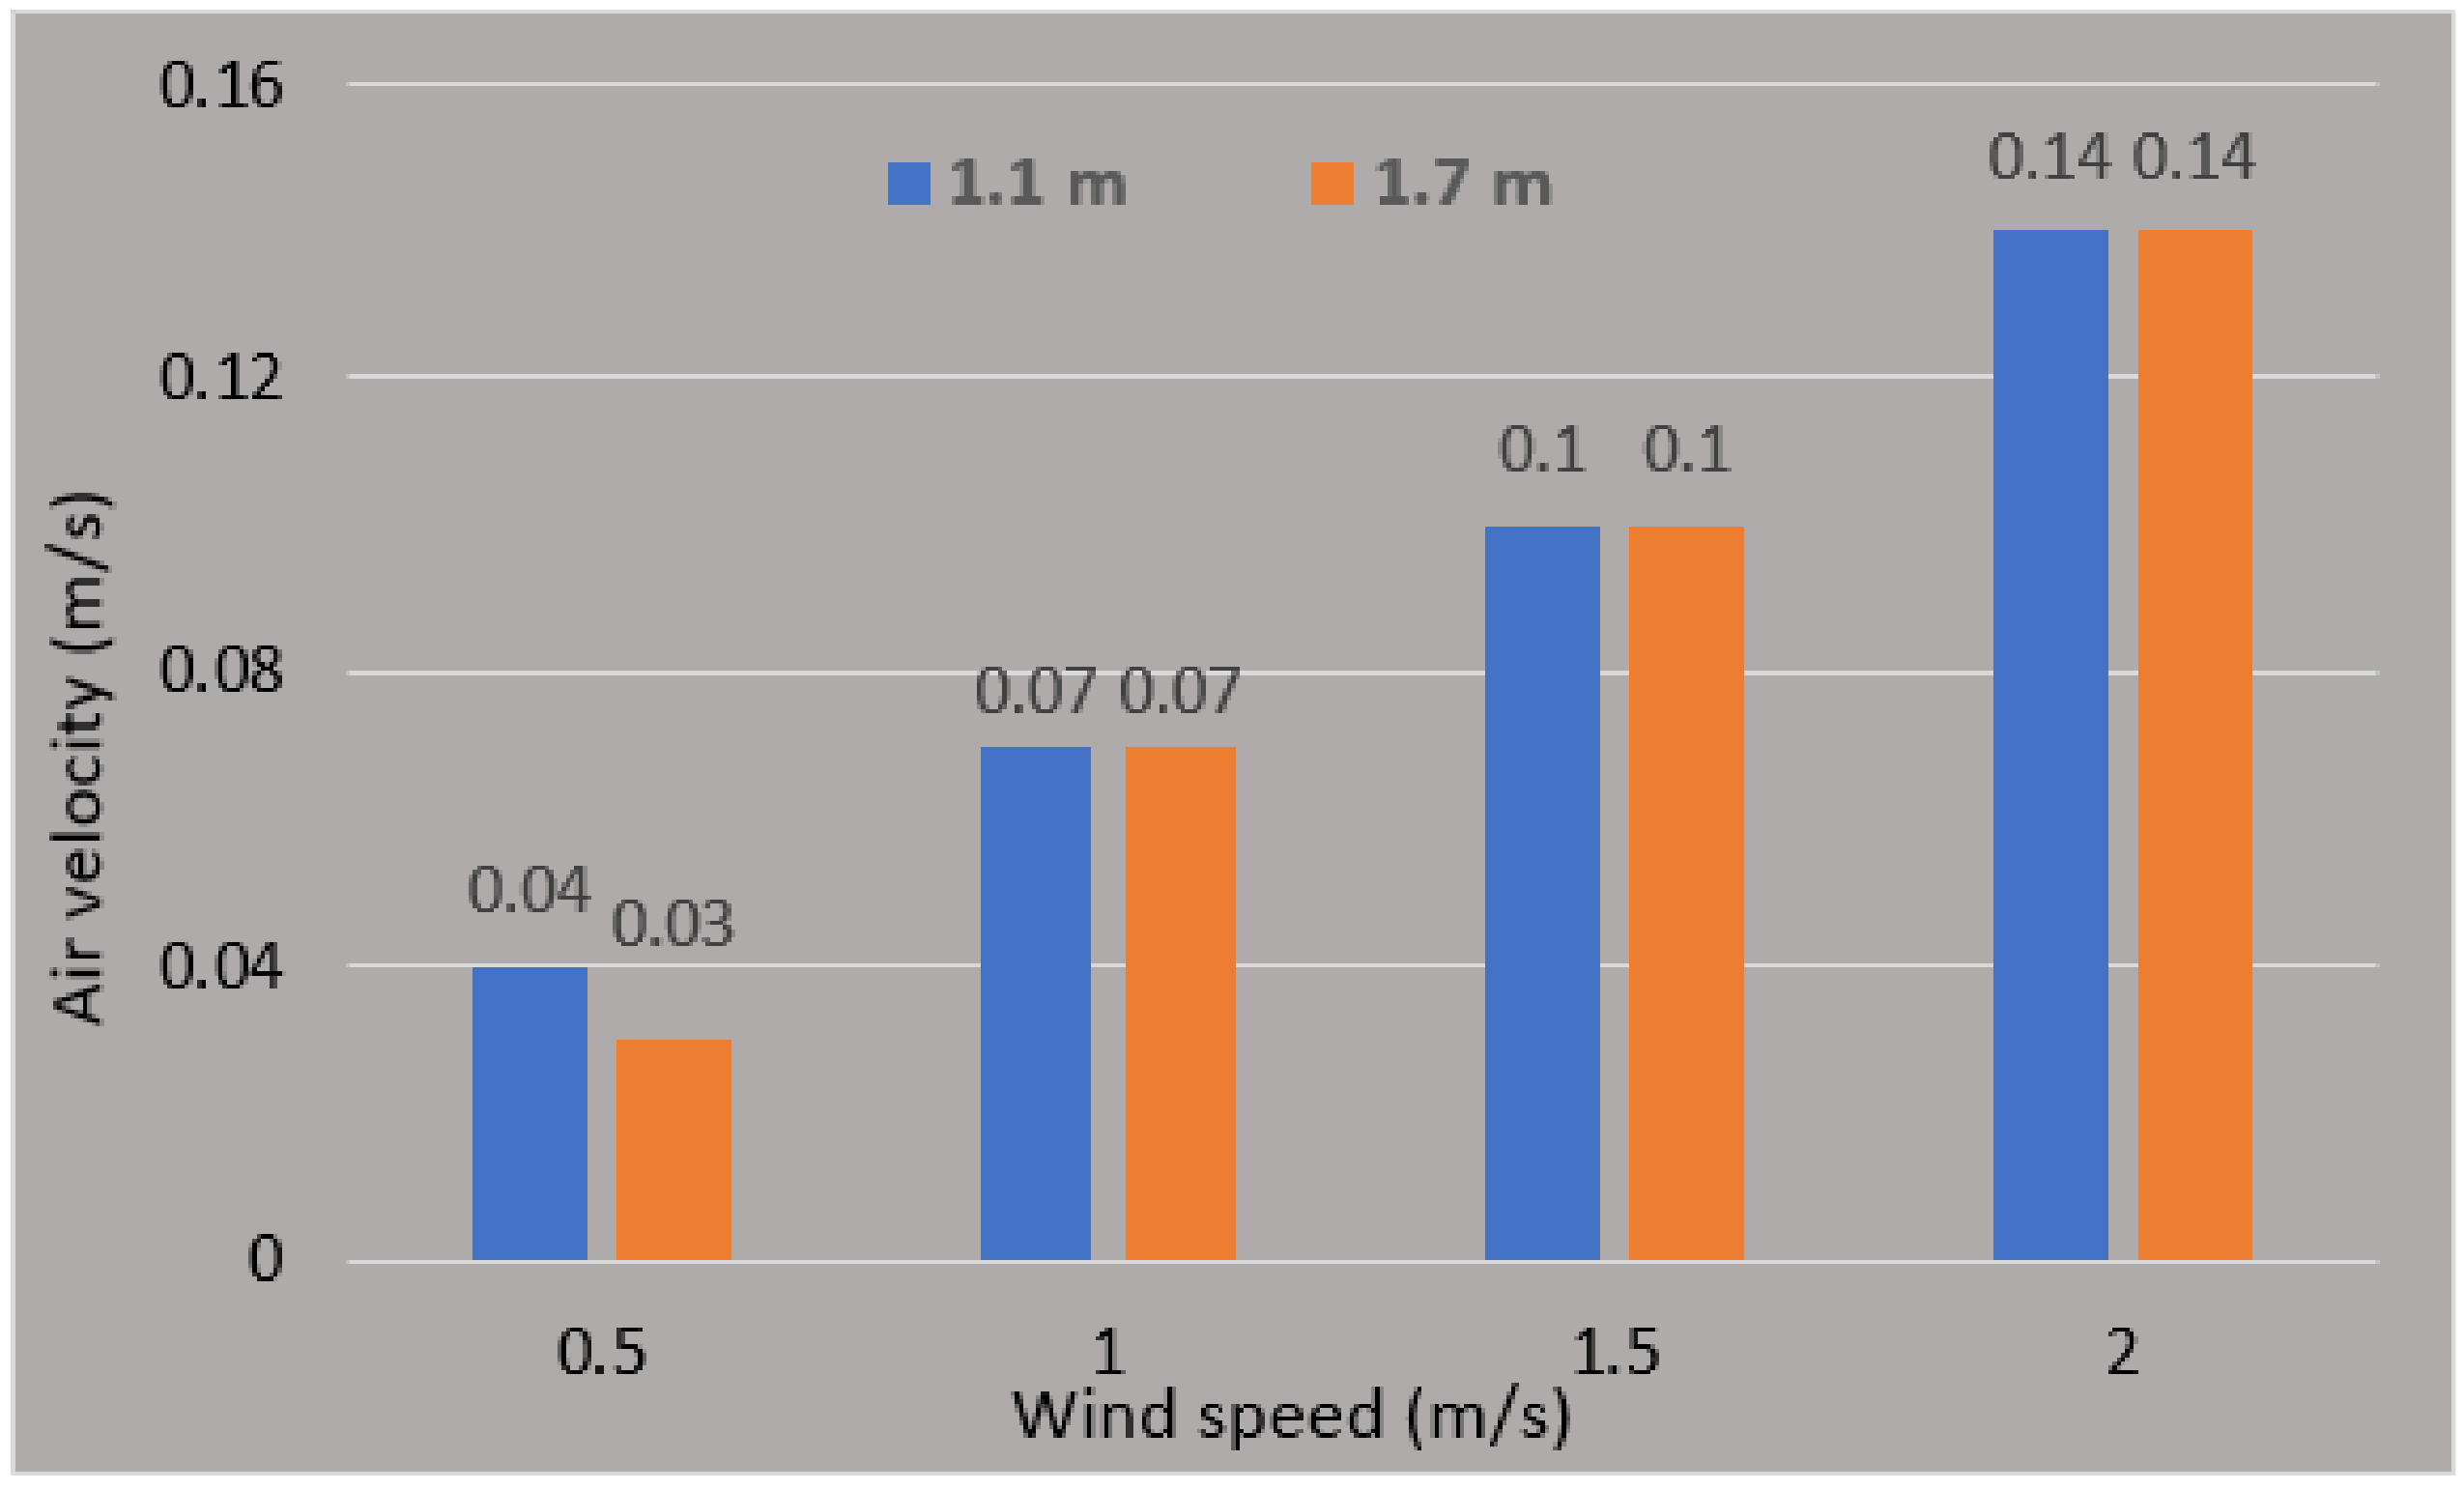
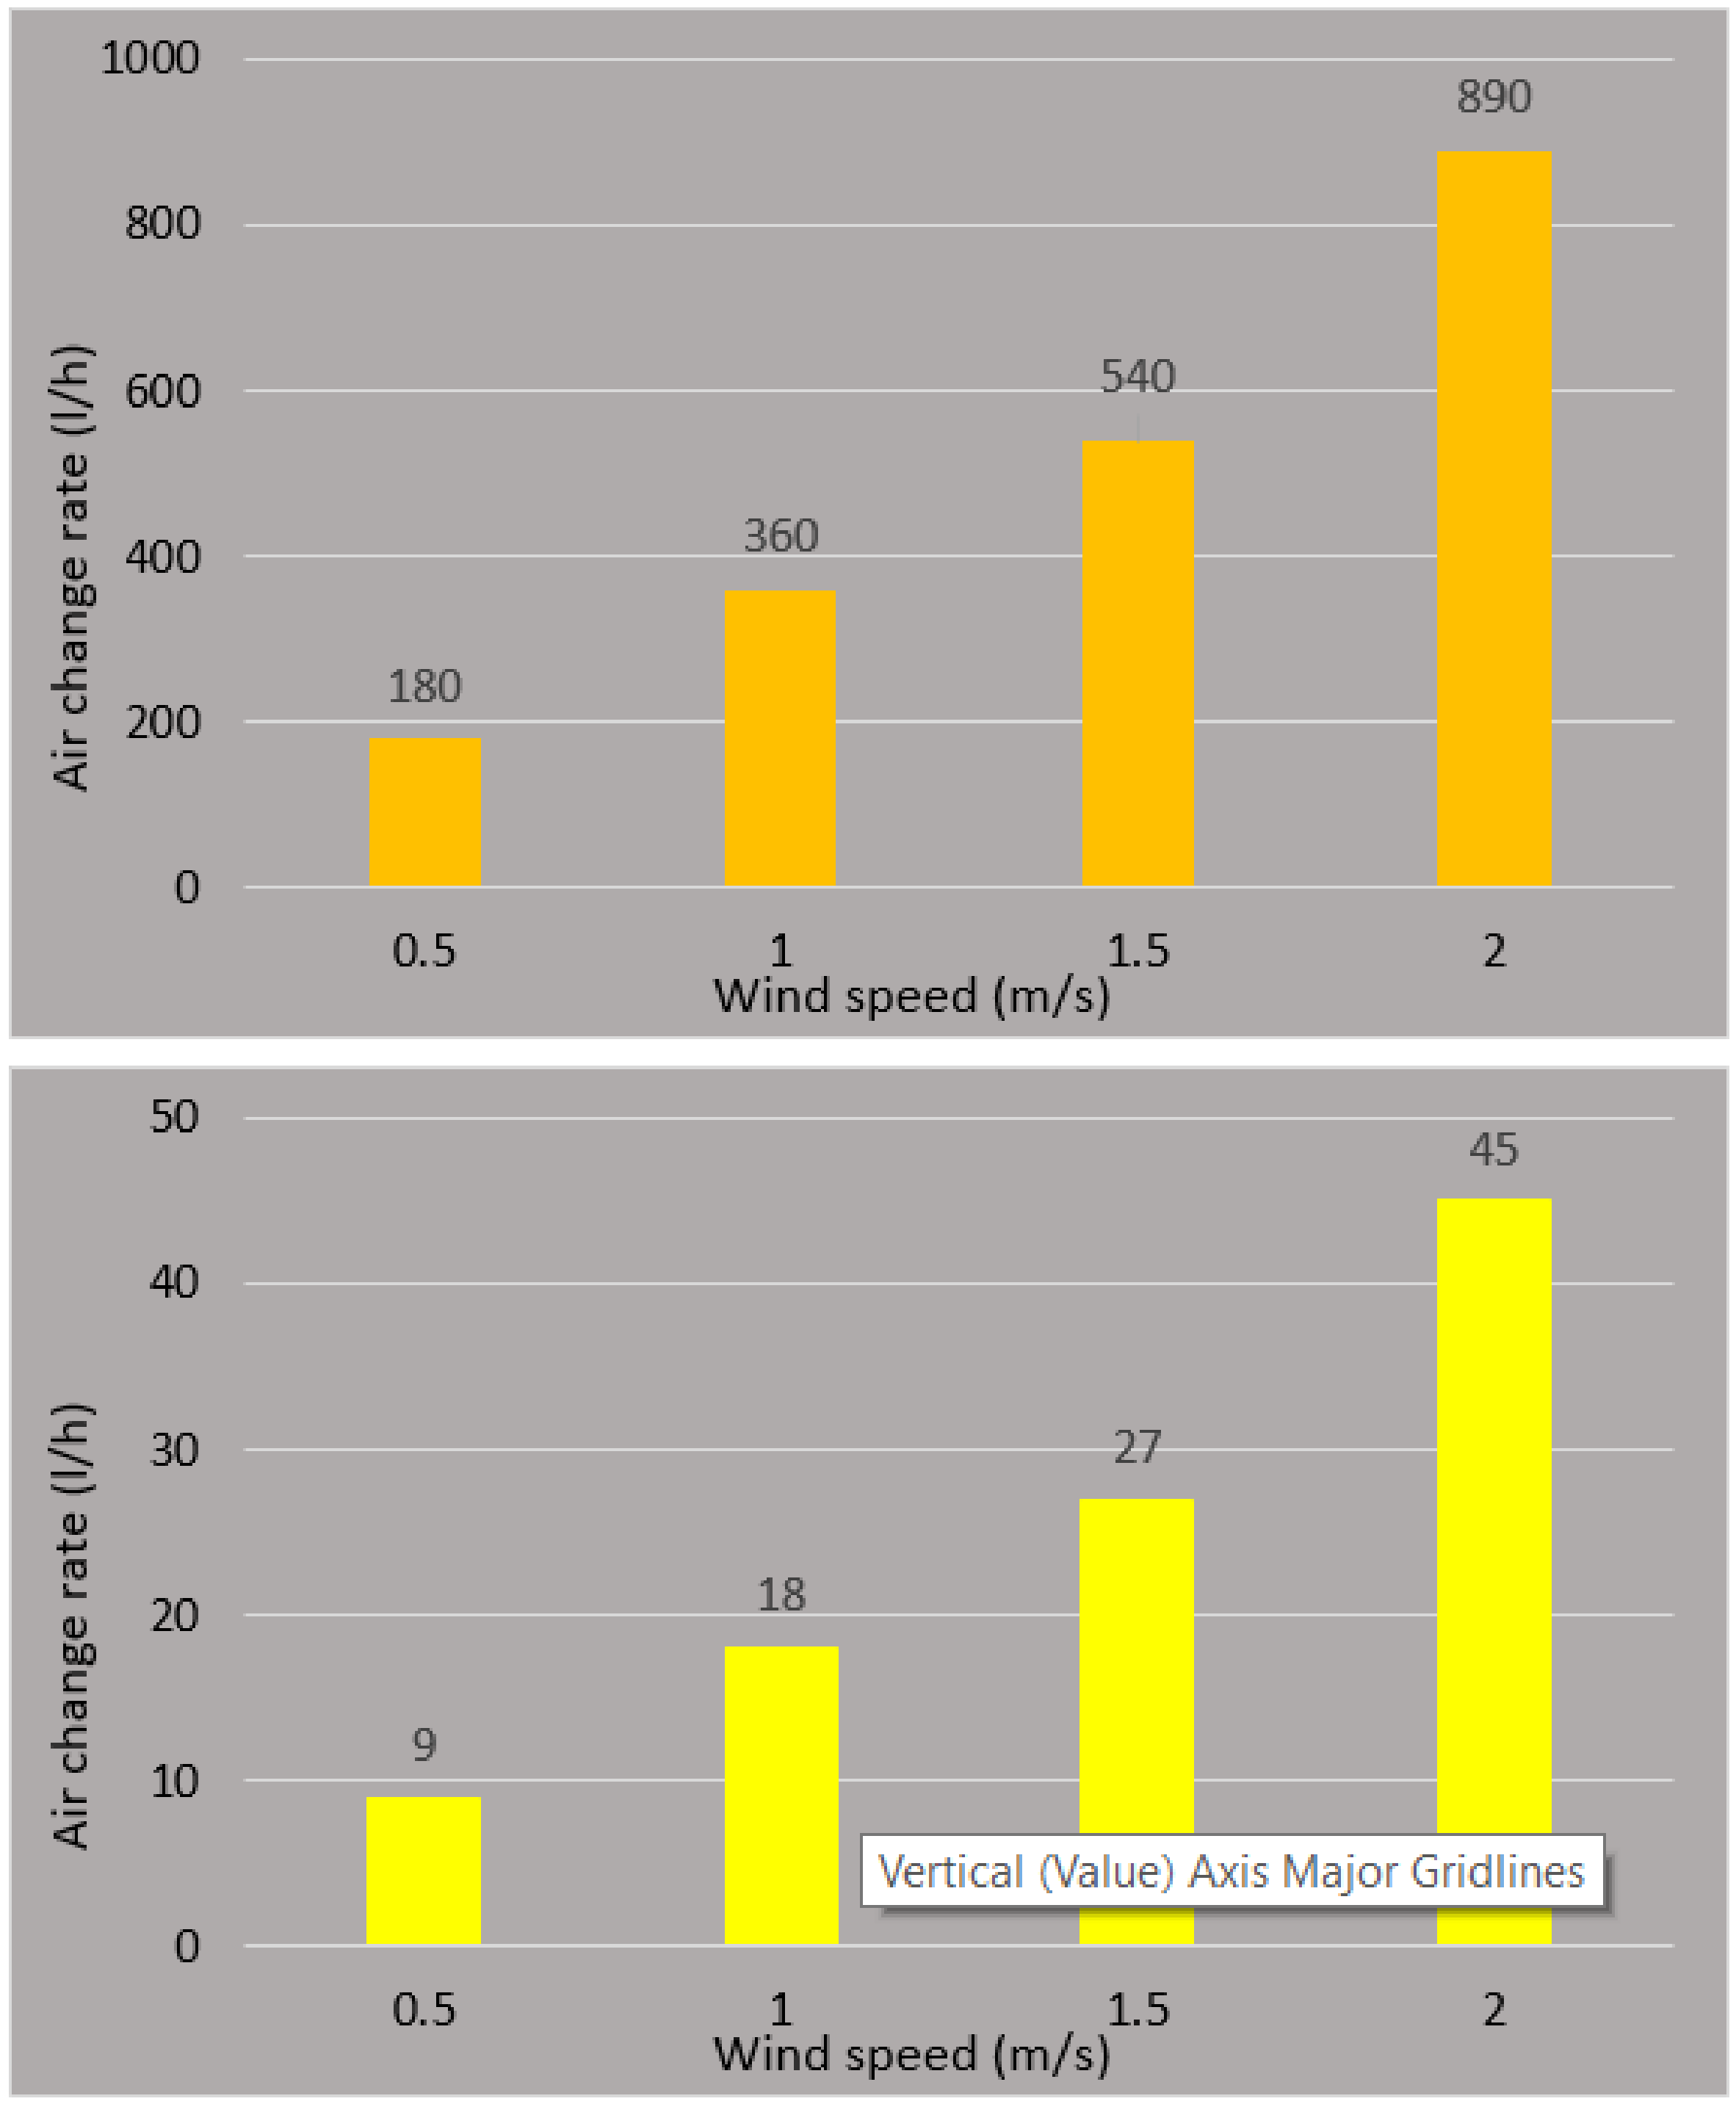
3.3. IEQ evaluation of Windcatcher with ASCD under Low Wind Speed Conditions

In this section, the natural ventilation performance of the windcatcher integrated with the ASCD (15 cm length, 80° angle) was assessed under low wind speed conditions, such as the ones experienced in Malaysia. The study will simulate wind speeds between 0.5–2 m/s and two predominant wind directions. In Malaysia, the North and South wind directions are the most predominant wind directions followed by the North-East and South-West wind directions [39,40]. Since the two-sided windcatcher design is symmetrical, both 0° and 45° wind incident angles can characterize the predominant wind directions and simplify the analysis. The ventilation performance criteria are the airflow velocity, supply rate, air change rate, distribution, and mean age of air. The overall aim is the evaluate the capabilities of the windcatcher in providing the required fresh air rates and enhancing the IEQ in low wind speed areas.
Figure 10 displays the airflow velocity contours in the vertical cross-sectional plane in the computational domain at different wind speed conditions, showing the airflow distribution within and around the test room and windcatcher channels. As observed, air recirculation was observed on the top edge of the roof of the test room (windward side), which affected the wind flow approaching the windcatcher. Large vortices were observed at the leeward side of the building and windcatcher. For the indoor space, a similar airflow pattern can be observed regardless of the wind speed. It can be seen that the ASCD device could redirect the supply airstream away from the exhaust airstream, minimizing or eliminating the airflow short-circuiting. At lower outdoor wind speeds, uneven airflow distribution was observed inside the space with very low air movement in the bottom region of the space. However, significant improvement was observed as the wind speed increased. In general, higher airflow speeds were observed in the windward side of the space where the supply or inflow jet was redirected by the ASCD device.
In Figure 11, air velocity in the windcatcher horizontal planes (1.1 m and 1.7 m height) is compared in various outdoor wind speeds ranging from 0.5 m/s to 2 m/s at 0° wind incident angle. As observed, good airflow distribution can be observed inside the space at 0.5 m/s outdoor wind; however, as the wind speed increased to 1–1.5 m/s, it was clear that the ASCD device redirected the supply airflow towards one corner of the space, which could potentially cause draft issues, particularly if the occupant is sitting directly below this area. Although the airspeeds observed in the space were still within acceptable levels, several design considerations should be considered in areas with higher outdoor wind speeds. A potential solution for high wind speeds locations could be to use ASCDs with lower angles, which could redirect the airflow towards the sidewall and reduce the supply speed. It should be noted that the same issue is faced by windcatchers without ASCD, but the high-speed airflow jet is directed towards the floor directly below the windcatcher. Volume control dampers are typically used to address this issue but are not suitable in areas with low wind speeds. An improved airflow distribution was observed at higher wind speeds (2 m/s and higher), which was due to the increased extraction of airflow from the exhaust side of the windcatcher. Figure 12 shows a comparison between the average airflow speed at 1.1 m and 1.7 m height.
The influence of the wind conditions (outdoor wind speed UH = 0.5 m/s to 2 m/, 0° wind angle) on the achieved airflow supply rate (L/s) and air change rate (1/h) are shown in Figure 13. Similarly, the effect was minimal, and the device was capable of providing the recommended fresh air rates (10 L/s), even at low wind speed conditions, assuming there are 15 occupants in the space. The mean supply air velocity was 0.16 m/s at UH = 0.5 m/s and increased to 0.64 m/s at UH = 2 m/s. With regard to the fresh air supply rates, the device was capable of providing the recommended fresh air rates (15 L/s per person) even at the low wind speed conditions (higher than UH = 1 m/s), assuming there are 15 occupants in the space. Specific air change rates (ACH) are necessary for building spaces to manage the internal air temperatures and bring in clean air while removing stale, humid air. The ACH was 8 at UH = 0.5 m/s and reached up to 32 at UH = 2 m/s. As compared to Haw et al.’s [41] field study, which used a similar windcatcher, the average ACH was 57 at 3 m/s wind speed, which was 40% more than maximum of the windcatcher in the present work but with larger size openings and higher wind speed.
Next, the windcatcher with ASCD was simulated at 45° wind incident angle. Figure 14 displays the airflow velocity contours in the vertical cross-sectional plane in the computational domain at different wind speeds, showing the airflow distribution within and around the test room and windcatcher channels. A slightly different outdoor airflow pattern was observed the air recirculation, particularly at the top of the roof (windward side), which was more prominent at 0° wind angle. Large vortices were still observed at the leeward side of the building and windcatcher, which generated negative pressure in this area. For the indoor space, the airflow pattern was observed to be variable depending on the wind speed. However, the ASCD device was able to redirect the supply airstream away from the exhaust airstream irrespective of the wind speed and direction. For the 0° wind angle, higher airflow speeds were observed in the windward side of the space, where the supply or inflow jet was redirected by the ASCD device.
In Figure 15, airflow velocity in the windcatcher horizontal planes (1.1 m and 1.7 m height) is compared in various outdoor wind speeds ranging from 0.5 m/s to 2 m/s at 45° wind incident angle. Similar to the result of 0° wind angle, good airflow distribution can be observed inside the space at 0.5 m/s outdoor wind, however as the wind speed increased to 1–2 m/s, it was clear that the ASCD redirected the high-speed supply airflow towards one corner of the space. As shown in Figure 16, both the horizontal plane heights showed nearly similar mean wind speed values; hence, an improved overall airflow distribution was observed when the wind direction was at 45°.
The influence of the wind conditions (outdoor wind speed UH = 0.5 m/s to 2 m/, 45° wind angle) on the achieved airflow supply rate (L/s) and air change rate (1/h) are shown in Figure 17. The overall trend of Figure 17 is comparable to the results of 0° wind direction (refer to Figure 13); nonetheless, the overall ventilation performance increased in 45° wind incident angle. These results are consistent with the findings of previous studies [42,43].
With respect to the American Society of Heating, Refrigerating and Air-Conditioning Engineers (ASHRAE) standard 62 [44], 15 L/s is suggested as the minimum ventilation rate for this room. The device was capable of providing the minimum requirements even at the low wind speed conditions (higher than UH = 1 m/s), assuming there are 15 occupants in the space. Comparing the performance of the windcatcher in the present work with other types of windcatcher can better show its merits. For example, Calautit and Hughes [17] found that a 1 m × 1 m commercial windcatcher at a wind speed of 2 m/s was able to provide 275 L/s fresh air supply rate. However, at the same wind speed, the windcatcher design proposed in the current study could supply more than 890 L/s.
Moreover, another study conducted by Hughes and Ghani [45] indicated that their commercial four-sided windcatcher could deliver airflow rate in the range of 90 L/s to 650 L/s at 1 m/s to 5 m/s wind speed, which was in the same range as in this study. Wing Jetter is a new natural ventilation device, which was invented in Japan. The device had a 1.5 m height and 1.5 m width and can provide 110 L/s airflow rate in a wind speed of 6 m/s which was much lower than in this study [46]. Hence, the proposed windcatcher can be operational in regions with low outdoor wind speed and can compete with other typical ventilation systems.

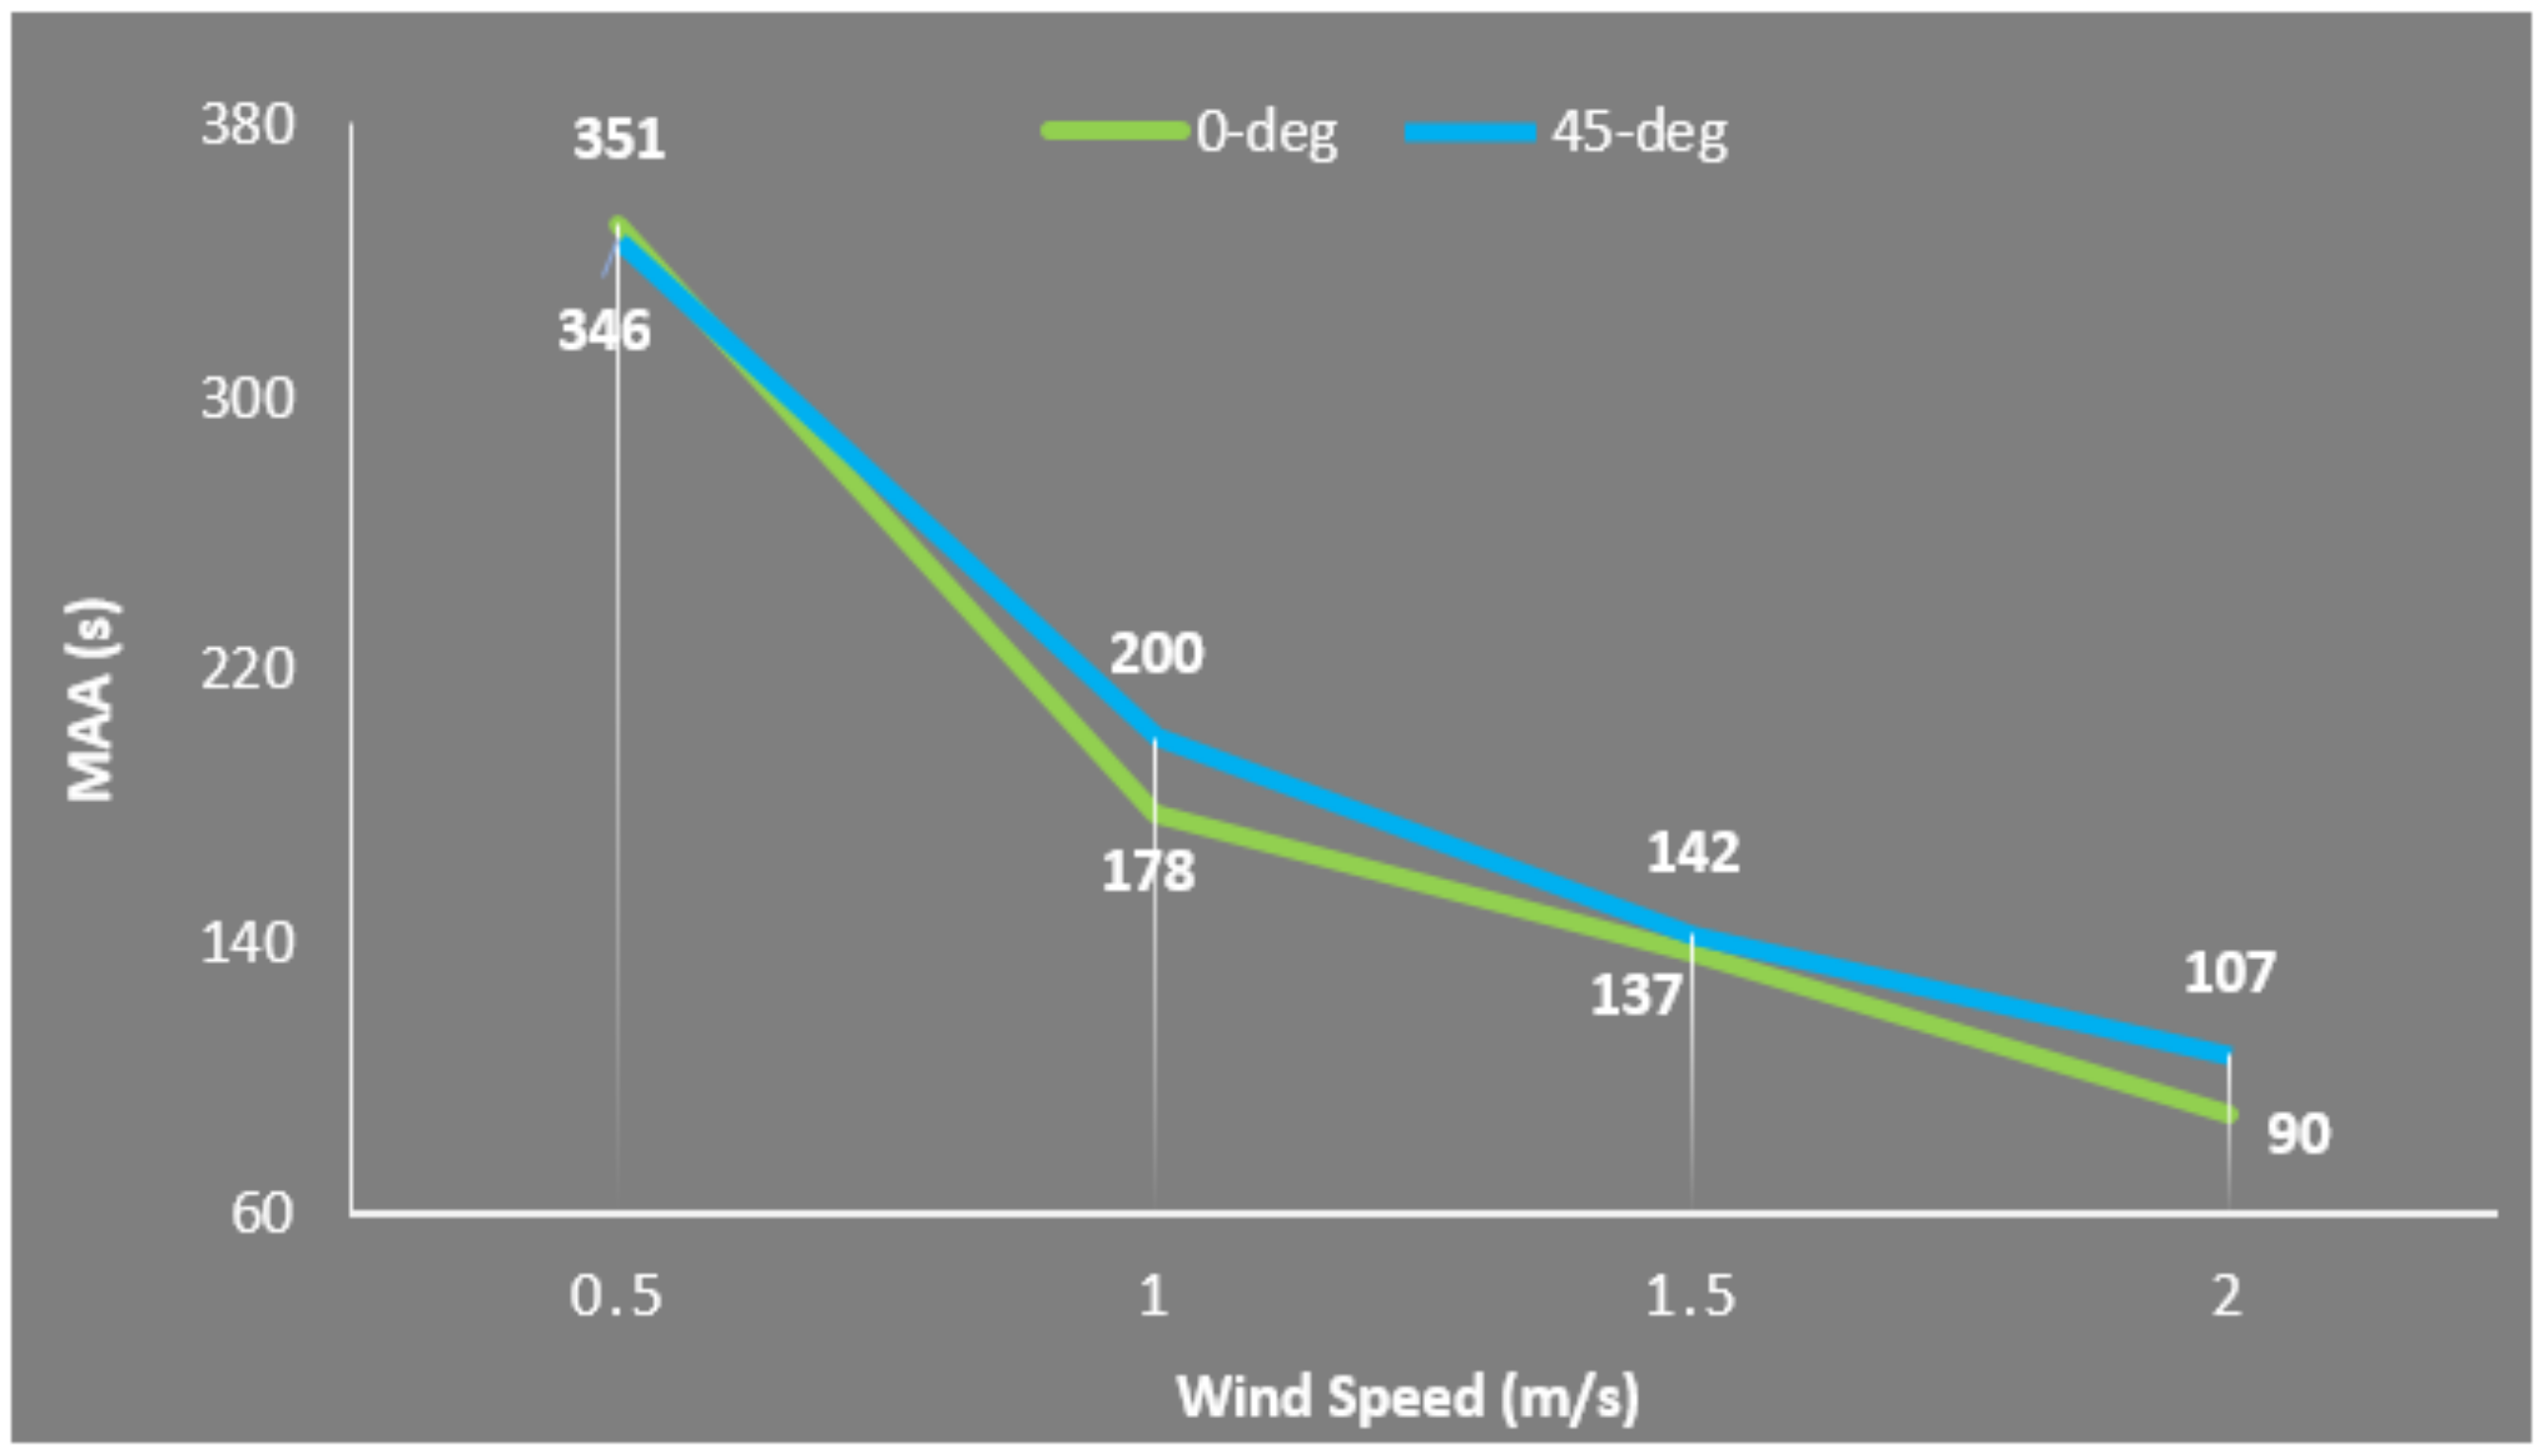
3.4. Mean Age of Air (MAA)
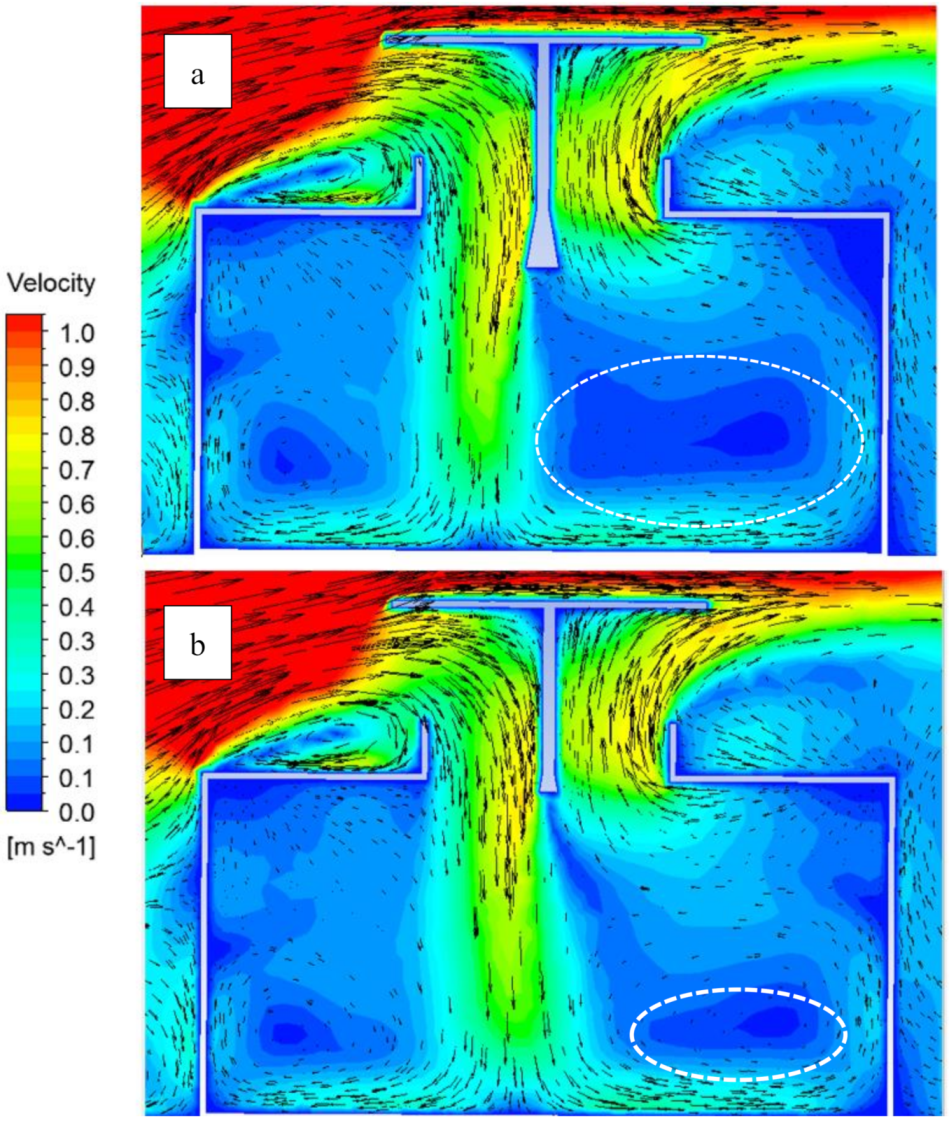
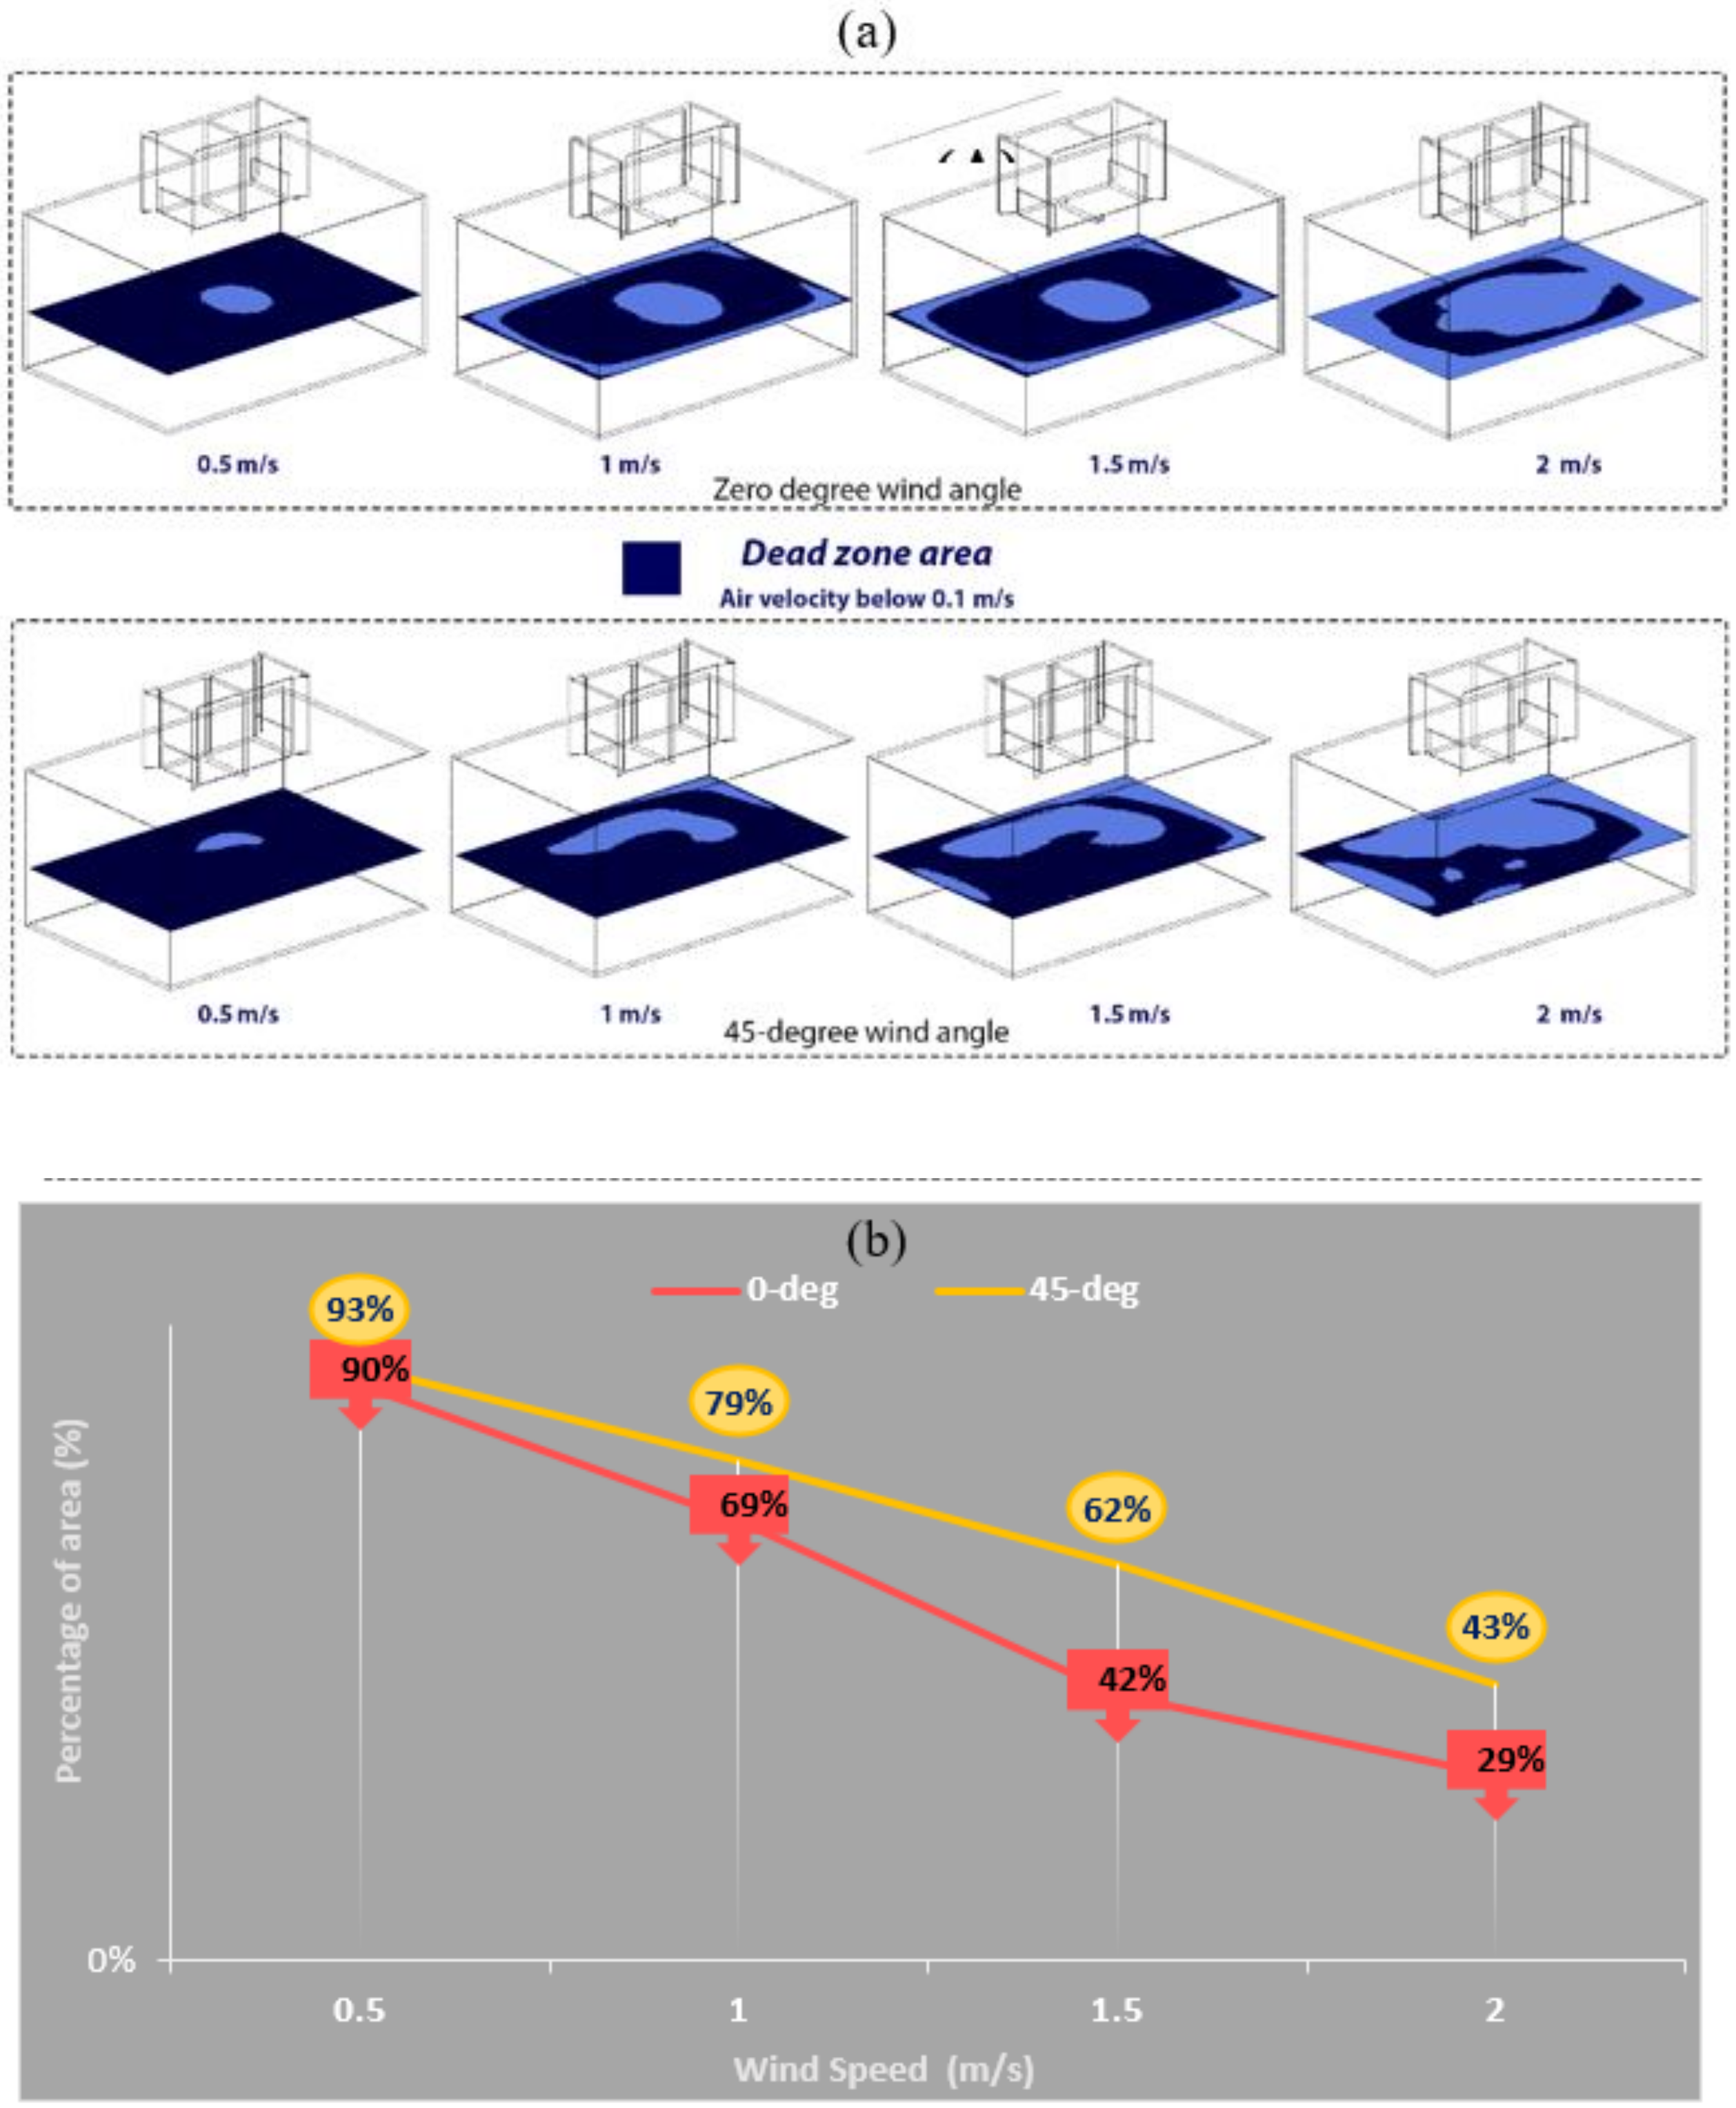
Another IEQ indicator which was evaluated in this research was the mean age of air (MAA) which is the average time of air displacing from supply point to any position in the ventilated space [47]. This parameter can help to evaluate the ventilation quality and recognize area with poor ventilation. To calculate MAA in Fluent, the method expressed in Reference [48] was utilized. MAA values of 1.1 horizontal plane were plotted in the line graph in Figure 18, with respect to different wind speeds.
It is noticeable that the increase in wind speed can reduce the MAA significantly because the MAA was influenced directly by the supply airflow. The MAA at 0.5 m/s wind speed was within the unacceptable range, as the MAA peaked at nearly 350 s. In other words, at wind speed below 1 m/s, the risk of stale air and related IEQ problems can significantly increase in the occupant space. Nevertheless, for a wind speed of 2 m/the MAA was below 107 s, which can provide a safety margin of related risk.

3.5. Dead Zone

Apart from MAA, the dead zone concept can assist to have better understanding of poor ventilations spots in living area, which can potentially augment the risk of low indoor air quality (IAQ). As Dehghan [43] defined, dead zones are points in the room where air is steady or having near zero velocity (less than 0.1 m/s). Thus, identifying these positions in the room can complete the role of MAA results. In this regard, ISO clip contours were plotted in CFD post environment, with condition of air velocity less than 0.1 m/s to illustrate the dead zone areas. Figure 19a displays a detailed view of dead zones, colored in dark in the 1.1 m horizontal plane, which is drawn in blue, and size of dead zone area falls as wind speed climbs.
To specify the area percentage of dead zone in 1.1 horizontal plane, the FLUENT function calculation was utilized, the finding of which are shown in Figure 19b. The results suggest that dead zone formed 90% to 70% in wind speed between 0.5 m/s and 1 m/s, which indicates a serious IAQ challenge in this range. However, wind speed rise can improve the conditions considerably when it reaches to 2 m/s, which leads to a steep fall in dead zone percentage from 29% in 0° wind direction.

4. Conclusions and Future Works

This study carried out extensive CFD simulations and evaluation of the ventilation performance of a two-sided windcatcher fitted with ASCD. The CFD method was validated, and the results indicated that the average difference between CFD results and experimental data was below 10%, therefore indicating good agreement. It should be noted that detailed validation of the model was carried out in our previous works [22,23,24] and was not included in the present work.
Building upon the findings of the previous research, the study focused on the length of ASCD to observe its impact on the achieved fresh air supply rates and air change rate. Ideally, a shorter and compact ASCD design, which requires smaller space for integration and lower cost, is preferred. However, it should still be able to prevent the air short-circuiting of the fresh air into the exhaust region. Hence, a detailed evaluation of ventilation performance is required before progressing on to the IEQ analysis. The length of the ASCD was varied between 5 cm to 50 cm, while the angle was maintained at 80°. The shorter ASCD was still able to minimize the fresh supply airflow short-circuiting to the exhaust stream, and, at the same time, it would also require a smaller ceiling space for installation and lower material cost. Hence, the 15 cm ASCD with 80° angle was selected for further analysis in this study.
Then, consideration of low wind speed and various directions were studied to evaluate the ventilation performance of windcatcher with ASCD. The study simulated wind speeds between 0.5–2 m/s and two predominant wind directions. The ventilation performance criteria are the airflow velocity, supply rate, air change rate, distribution, and mean age of air. The overall aim was the evaluate the capabilities of the windcatcher in providing the required fresh air rates and enhancing the IEQ in low wind speed areas, such as in Malaysia. It was revealed that the ventilation performance of the windcatcher in 45° wind incident angle was improved as compared to the 0° wind incident angle. The achieved fresh air supply rates ranged between 180 L/s to 890 L/s in 45° wind angle, while, for 0°, these values were from 160 L/s to 642 L/s. Likewise, the range of ACH was from 8 ACH to 32 ACH in the 0° wind angle and increased to 9 ACH and then to 45 ACH in the 45° wind angle. Consequently, it was concluded that the windcatcher could be effective in low wind speed conditions of Malaysia and other countries with similar wind conditions. Future works can focus on improving the thermal performance of the windcatcher and evaluation of the impact on the thermal comfort of occupants. Further wind tunnel and field testing are also necessary to further validate the numerical modeling.

Author Contributions

The contribution of each author is as below: Conceptualization, P.N.; Methodology, P.N.; Software, P.N., J.C.; Validation, P.N.; Investigation F.J.; Data Curation, P.N.; Writing-Original Draft Preparation, P.N. and F.J.; Writing-Review & Editing, J.C., F.J., H.M.H., F.F. and H.N.C.; Supervision, H.M.H. All authors have read and agreed to the published version of the manuscript.

Funding

This research received no external funding.

Acknowledgments

The authors would like to thank the Advanced Building and Environment Research (ABER) group to support to conduct this research, as well as the Academic Research Center (ARC).

Conflicts of Interest

The authors declare no conflict of interest.

References

  1. Izadyar, N.; Miller, W.; Rismanchi, B.; Garcia-Hansen, V. Impacts of façade openings’ geometry on natural ventilation and occupants’ perception: A review. Build. Environ. 2020, 170, 106613. [Google Scholar] [CrossRef]
  2. Boukhanouf, R.; Amer, O.; Ibrahim, H.; Calautit, J. Design and performance analysis of a regenerative evaporative cooler for cooling of buildings in arid climates. Build. Environ. 2018, 142, 1–10. [Google Scholar] [CrossRef]
  3. Calautit, J.K.; Chaudhry, H.N.; Hughes, B.R.; Ghani, S.A. Comparison between evaporative cooling and a heat pipe assisted thermal loop for a commercial wind tower in hot and dry climatic conditions. Appl. Energy 2013, 101, 740–755. [Google Scholar] [CrossRef]
  4. Moosavi, L.; Zandi, M.; Bidi, M.; Behroozizade, E.; Kazemi, I. New design for solar chimney with integrated windcatcher for space cooling and ventilation. Build. Environ. 2020. [Google Scholar] [CrossRef]
  5. Hosseini, S.H.; Shokry, E.; Ahmadian Hosseini, A.J.; Ahmadi, G.; Calautit, J.K. Evaluation of airflow and thermal comfort in buildings ventilated with wind catchers: Simulation of conditions in Yazd City, Iran. Energy Sustain. Dev. 2016, 35, 7–24. [Google Scholar] [CrossRef]
  6. Sheikhshahrokhdehkordi, M.; Khalesi, J.; Goudarzi, N. High-performance building: Sensitivity analysis for simulating different combinations of components of a two-sided windcatcher. J. Build. Eng. 2020, 28, 101079. [Google Scholar] [CrossRef]
  7. Farouk, M. Comparative study of hexagon & square windcatchers using CFD simulations. J. Build. Eng. 2020, 31, 101366. [Google Scholar] [CrossRef]
  8. Sadeghi, M.; Wood, G.; Samali, B.; de Dear, R. Effects of urban context on the indoor thermal comfort performance of windcatchers in a residential setting. Energy Build. 2020, 219, 110010. [Google Scholar] [CrossRef]
  9. Varela-Boydo, C.A.; Moya, S.L. Inlet extensions for wind towers to improve natural ventilation in buildings. Sustain. Cities Soc. 2020, 53, 101933. [Google Scholar] [CrossRef]
  10. Sadeghi, M.; Samali, B.; Wood, G.; de Dear, R. Comfort cooling by wind towers in the Australian residential context—Experimental wind tunnel study of comfort. J. Wind Eng. Ind. Aerodyn. 2020, 196, 104014. [Google Scholar] [CrossRef]
  11. Nejat, P.; Jomehzadeh, F.; Hussen, H.; Calautit, J.; Abd Majid, M. Application of Wind as a Renewable Energy Source for Passive Cooling through Windcatchers Integrated with Wing Walls. Energies 2018, 11, 2536. [Google Scholar] [CrossRef] [Green Version]
  12. Zaki, A.; Richards, P.; Sharma, R. Analysis of airflow inside a two-sided wind catcher building. J. Wind Eng. Ind. Aerodyn. 2019, 190, 71–82. [Google Scholar] [CrossRef]
  13. Nejat, P.; Jomehzadeh, F.; Majid, M.Z.A.; Yusof, M.B.M.; Zeynali, I. Windcatcher as sustainable passive cooling solution for natural ventilation in hot humid climate of Malaysia. In Proceedings of the IOP Conference Series: Materials Science and Engineering, Palembang, Indonesia, 15–16 October 2018; Volume 620. [Google Scholar]
  14. Montazeri, H.; Montazeri, F.; Azizian, R.; Mostafavi, S. Two-sided wind catcher performance evaluation using experimental, numerical and analytical modeling. Renew. Energy 2010, 35, 1424–1435. [Google Scholar] [CrossRef]
  15. Calautit, J.K.; Wenbin Tien, P.; Wei, S.; Calautit, K.; Hughes, B.R. Numerical and experimental investigation of the indoor air quality and thermal comfort performance of a low energy cooling windcatcher with heat pipes and extended surfaces. Renew. Energy 2020, 145, 744–756. [Google Scholar] [CrossRef]
  16. Calautit, J.K.; O’Connor, D.; Hughes, B.R. Determining the optimum spacing and arrangement for commercial wind towers for ventilation performance. Build. Environ. 2014, 82, 274–287. [Google Scholar] [CrossRef]
  17. Calautit, J.K.; Hughes, B.R. Measurement and prediction of the indoor airfolw in a room ventilated with a commercial wind tower. Energy Build. 2014, 84, 367–377. [Google Scholar] [CrossRef]
  18. Chaudhry, H.N.; Calautit, J.K.; Hughes, B.R. Computational analysis of a wind tower assisted passive cooling technology for the built environment. J. Build. Eng. 2015, 1, 63–71. [Google Scholar] [CrossRef]
  19. Montazeri, H. Experimental and numerical study on natural ventilation performance of various multi-opening wind catchers. Build. Environ. 2011, 46, 370–378. [Google Scholar] [CrossRef]
  20. Ghadiri, M.H.; Lukman, N.; Ibrahim, N.; Mohamad, M.F. Computational Analysis of Wind-Driven Natural Ventilation in a Two Sided Rectangular Wind Catcher. Int. J. Vent. 2013, 12, 51–61. [Google Scholar] [CrossRef]
  21. Afshin, M.; Sohankar, A.; Manshadi, M.D.; Esfeh, M.K. An experimental study on the evaluation of natural ventilation performance of a two-sided wind-catcher for various wind angles. Renew. Energy 2016, 85, 1068–1078. [Google Scholar] [CrossRef]
  22. Nejat, P.; Calautit, J.K.; Majid, M.Z.A.; Hughes, B.R.; Jomehzadeh, F. Anti-short-circuit device: A new solution for short-circuiting in windcatcher and improvement of natural ventilation performance. Build. Environ. 2016, 105, 24–39. [Google Scholar] [CrossRef] [Green Version]
  23. Nejat, P.; Calautit, J.K.; Majid, M.Z.A.; Hughes, B.R.; Jomehzadeh, F. Data on the natural ventilation performance of windcatcher with anti-short-circuit device (ASCD). Data Brief 2016, 9, 252–256. [Google Scholar] [CrossRef] [PubMed]
  24. Nejat, P.; Calautit, J.K.; Majid, M.Z.A.; Hughes, B.R.; Zeynali, I.; Jomehzadeh, F. Wind tunnel and numerical data on the ventilation performance of windcatcher with wing wall. Data Brief 2016, 9, 448–452. [Google Scholar] [CrossRef] [PubMed] [Green Version]
  25. Jomehzadeh, F.; Nejat, P.; Calautit, J.K.; Yusof, M.B.M.; Zaki, S.A. A review on windcatcher for passive cooling and natural ventilation in buildings, Part 1: Indoor air quality and thermal comfort assessment. Renew. Sustain. Energy Rev. 2017, 70, 736–756. [Google Scholar] [CrossRef]
  26. Ghoulem, M.; El Moueddeb, K.; Nehdi, E.; Zhong, F.; Calautit, J. Design of a Passive Downdraught Evaporative Cooling Windcatcher (PDEC-WC) System for Greenhouses in Hot Climates. Energies 2020, 13, 2934. [Google Scholar] [CrossRef]
  27. Calautit, J.; O’Connor, D.; Tien, T.; Wei, S.; Pantua, C.; Hughes, H. Development of a natural ventilation windcatcher with passive heat recovery wheel for mild-cold climates: CFD and experimental analysis. Renew. Energy 2020. [Google Scholar] [CrossRef]
  28. Hughes, B.R.; Calautit, J.K.; Ghani, S.A. The development of commercial wind towers for natural ventilation: A review. Appl. Energy 2012, 92, 606–627. [Google Scholar] [CrossRef]
  29. ANSYS Incorporated ANSYS 14.5 FLUENT Theory Guide. Available online: http://www.ansys.com (accessed on 13 July 2020).
  30. Calautit, J.K.; Hughes, B.R.; Chaudhry, H.N.; Ghani, S.A. CFD analysis of a heat transfer device integrated wind tower system for hot and dry climate. Appl. Energy 2013, 112, 576–591. [Google Scholar] [CrossRef] [Green Version]
  31. Franke, J.; Hellsten, A.; Schlünzen, H.; Carissimo, B. COST Action 732, Best Practice Guideline for the CFD Simulation of Flows in The Urban Environment; University of Hamburg: Brussels, Belgium, 2007. [Google Scholar]
  32. Tominaga, Y.; Mochida, A.; Yoshie, R.; Kataoka, H.; Nozu, T.; Yoshikawa, M.; Shirasawa, T. AIJ guidelines for practical applications of CFD to pedestrian wind environment around buildings. J. Wind Eng. Ind. Aerodyn. 2008, 96, 1749–1761. [Google Scholar] [CrossRef]
  33. Tominaga, Y.; Akabayashi, S.; Kitahara, T.; Arinami, Y. Air flow around isolated gable-roof buildings with different roof pitches: Wind tunnel experiments and CFD simulations. Build. Environ. 2015, 84, 204–213. [Google Scholar] [CrossRef]
  34. Launder, B.E.; Spalding, D.B. The numerical computation of turbulent flows. Comput. Methods Appl. Mech. Eng. 1974, 3, 269–289. [Google Scholar] [CrossRef]
  35. Cebeci, T.; Bradshaw, P. Momentum Transfer in Boundary Layers; Hemisphere Publishing Corp: New York, NY, USA, 1977. [Google Scholar]
  36. Zhang, Z.; Zhang, W.; Zhai, Z.J.; Chen, Q.Y. Evaluation of Various Turbulence Models in Predicting Airflow and Turbulence in Enclosed Environments by CFD: Part 2—Comparison with Experimental Data from Literature. Hvac R Res. 2011, 13, 871–886. [Google Scholar] [CrossRef]
  37. Calautit, J.K.; Hughes, B.R. Wind tunnel and CFD study of the natural ventilation performance of a commercial multi-directional wind tower. Build. Environ. 2014, 80, 71–83. [Google Scholar] [CrossRef] [Green Version]
  38. ASHRAE. ASHRAE Standard 55 Thermal Environmental Conditions for Human Occupancy; American Society of Heating, Refrigerating and Air-Conditioning Engineers: Atlanta, GA, USA, 2013. [Google Scholar]
  39. Kubota, T.; Supian, A. Wind Environment Evaluation of Neighborhood Areas in Major Towns of Malaysia. J. Asian Archit. Build. Eng. 2006, 5, 199–206. [Google Scholar] [CrossRef] [Green Version]
  40. Mozaffari, F. Indoor Natural Ventilation with Wing Wall in Balcony in Medium-Rise Building in Hot and Humid Climate; Universiti Teknologi Malaysia: Skudai, Malaysia, 2015. [Google Scholar]
  41. Haw, L.C.; Saadatian, O.; Sulaiman, M.Y.; Mat, S.; Sopian, K. Empirical study of a wind-induced 561 natural ventilation tower under hot and humid climatic conditions. Energy Build. 2012, 52, 28–562. [Google Scholar] [CrossRef]
  42. Mozaffari Ghadikolaei, F.; Remaz Ossen, D.; Farid Mohamed, M. Effects of wing wall at the balcony on the natural ventilation performance in medium-rise residential buildings. J. Build. Eng. 2020, 31, 101316. [Google Scholar] [CrossRef]
  43. Dehghani Mohamadabadi, H.; Dehghan, A.A.; Ghanbaran, A.H.; Movahedi, A.; Mohamadabadi, A.D. Numerical and experimental performance analysis of a four-sided wind tower adjoining parlor and courtyard at different wind incident angles. Energy Build. 2018, 172, 525–536. [Google Scholar] [CrossRef]
  44. ASHRAE. ASHRAE Standard 62.1: Ventilation for Acceptable Indoor Air Quality; American Society of Heating, Refrigerating and Air-Conditioning Engineers, Inc.: Atlanta, GA, USA, 2019. [Google Scholar]
  45. Hughes, B.R.; Ghani, S.A.A.A. Investigation of a windvent passive ventilation device against current fresh air supply recommendations. Energy Build. 2008, 40, 1651–1659. [Google Scholar] [CrossRef]
  46. Khan, N.; Su, Y.; Riffat, S.B. A review on wind driven ventilation techniques. Energy Build. 2008, 40, 1586–1604. [Google Scholar] [CrossRef]
  47. Shi, Z.; Lu, Z.; Chen, Q. Indoor airflow and contaminant transport in a room with coupled displacement ventilation and passive-chilled-beam systems. Build. Environ. 2019, 161, 106244. [Google Scholar] [CrossRef]
  48. Montazeri, H.; Montazeri, F. CFD simulation of cross-ventilation in buildings using rooftop wind-catchers: Impact of outlet openings. Renew. Energy 2018, 118, 502–520. [Google Scholar] [CrossRef]
Figure 1. Dimensions of the test room and windcatcher model integrated with the anti-short-circuit device (ASCD) in centimeter.
Processes 08 00840 g001
Figure 2. (a) Atmospheric boundary layer (ABL) profile of the approach flow and (b) schematic of the Computational Fluid Dynamics (CFD) domain.
Processes 08 00840 g002
Figure 3. Mesh at the surface of the windcatcher and building model, showing the key areas refined in the Mesh tool.
Processes 08 00840 g003
Figure 4. The inlet and outlet channel measurement points for the air velocity values; dimensions are in millimeters.
Processes 08 00840 g004
Figure 5. Comparison of airflow velocity between CFD results and the wind tunnel measurements of Reference [22] in the (a) inlet points (I1 to I6) and (b) outlet points (O1 to O6).
Processes 08 00840 g005
Figure 6. Mesh verification: sensitivity analysis of different mesh sizes (4 million, 8 million, and 12 million).
Processes 08 00840 g006
Figure 7. The average of air velocity in 1.1 m and 1.7 m horizontal plane of windcatcher with different ASCD lengths.
Processes 08 00840 g007
Figure 8. Contour plot of the airflow velocity magnitude in the vertical cross-sectional plane of (a) 50 cm ASCD and (b) 15 cm ASCD (UH = 1 m/s).
Processes 08 00840 g008
Figure 9. Impact of different ASCD lengths on the achieved airflow supply rate (L/s) and air change rate (1/h).
Processes 08 00840 g009
Figure 10. Air velocity contours of the vertical cross-sectional plane (outdoor wind speed UH = 0.5 m/s to 2 m/, 0° wind angle).
Processes 08 00840 g010
Figure 11. Air velocity contours of the indoor horizontal cross-sectional plane (outdoor wind speed UH = 0.5 m/s to 2 m/, 0° wind angle).
Processes 08 00840 g011
Figure 12. Comparison of the mean airflow velocity in 1.1 m and 1.7 m horizontal planes (outdoor wind speed UH = 0.5 m/s to 2 m/, 0° wind angle).
Processes 08 00840 g012
Figure 13. Impact of wind conditions (outdoor wind speed UH = 0.5 m/s to 2 m/, 0° wind angle) on the achieved airflow supply rate (L/s) and air change rate (1/h).
Processes 08 00840 g013
Figure 14. Air velocity contours of the vertical cross-sectional plane (outdoor wind speed UH = 0.5 m/s to 2 m/, 45° wind angle).
Processes 08 00840 g014
Figure 15. Air velocity contours of the indoor horizontal cross-sectional plane (outdoor wind speed UH = 0.5 m/s to 2 m/, 45° wind angle).
Processes 08 00840 g015
Figure 16. Comparison of the mean airflow velocity in 1.1 m and 1.7 m horizontal planes (outdoor wind speed UH = 0.5 m/s to 2 m/, 45° wind angle).
Processes 08 00840 g016
Figure 17. Impact of wind conditions (outdoor wind speed UH = 0.5 m/s to 2 m/, 0° wind angle) on the achieved airflow supply rate (L/s) and air change rate (1/h).
Processes 08 00840 g017
Figure 18. Mean age of air (MAA) values in different wind speeds and angles.
Processes 08 00840 g018
Figure 19. (a) The ISO plane contours which demonstrate the dead zone area in dark color (air velocity below 0.1 m/s) in different wind speeds and (b) the percentage of in 1.1 m horizontal plane with dead zone in different outdoor wind speeds.
Processes 08 00840 g019
Table 1. A summary of the computational setup and specified boundary conditions.
ParametersSetting
SimulationSteady-state, 3D with coupled indoor-outdoor
Solver typePressure-based
Indoor domain (volume)Fluid domain
Outdoor domain (volume)Fluid domain
Wall surfaces (domain)Top and side: Symmetry walls
Ground: Wall
Wall surfaces (model)Building: WallWindcatcher: WallASCD: Wall
Velocity inletAtmospheric boundary layer profile, UH = 0.5–2 m/s
Pressure outletAtmospheric 0 Pa
Turbulence modelk-epsilon (standard)
Near-Wall treatmentStandard wall functions

