Article

Modeling the Effect of Channel Tapering on the Pressure Drop and Flow Distribution Characteristics of Interdigitated Flow Fields in Redox Flow Batteries

by
Pablo A. García-Salaberri
1,*,
Tugba Ceren Gokoglan
2,
Santiago E. Ibáñez
1,3,
Ertan Agar
2 and
Marcos Vera
1
1
Departamento de Ingeniería Térmica y de Fluidos, Universidad Carlos III de Madrid, 28911 Leganés, Spain
2
Department of Mechanical Engineering, Energy Engineering Graduate Program, University of Massachusetts Lowell, Lowell, MA 01854, USA
3
Unidad de Procesos Electroquímicos, Instituto IMDEA Energía, Avda. Ramón de La Sagra 3, 28935 Móstoles, Spain
*
Author to whom correspondence should be addressed.
Processes 2020, 8(7), 775; https://doi.org/10.3390/pr8070775
Submission received: 4 June 2020 / Revised: 25 June 2020 / Accepted: 26 June 2020 / Published: 1 July 2020
(This article belongs to the Special Issue CFD Applications in Energy Engineering Research and Simulation)

Abstract

:
Optimization of flow fields in redox flow batteries can increase performance and efficiency, while reducing cost. Therefore, there is a need to establish a fundamental understanding on the connection between flow fields, electrolyte flow management and electrode properties. In this work, the flow distribution and pressure drop characteristics of interdigitated flow fields with constant and tapered cross-sections are examined numerically and experimentally. Two simplified 2D along-the-channel models are used: (1) a CFD model, which includes the channels and the porous electrode, with Darcy’s viscous resistance as a momentum sink term in the latter; and (2) a semi-analytical model, which uses Darcy’s law to describe the 2D flow in the electrode and lubrication theory to describe the 1D Poiseuille flow in the channels, with the 2D and 1D sub-models coupled at the channel/electrode interfaces. The predictions of the models are compared between them and with experimental data. The results show that the most influential parameter is γ , defined as the ratio between the pressure drop along the channel due to viscous stresses and the pressure drop across the electrode due to Darcy’s viscous resistance. The effect of R e in the channel depends on the order of magnitude of γ , being negligible in conventional cells with slender channels that use electrodes with permeabilities in the order of 10 12 m 2 and that are operated with moderate flow rates. Under these conditions, tapered channels can enhance mass transport and facilitate the removal of bubbles (from secondary reactions) because of the higher velocities achieved in the channel, while being pumping losses similar to those of constant cross-section flow fields. This agrees with experimental data measured in a single cell operated with aqueous vanadium-based electrolytes.

1. Introduction

The extensive use of fossil fuels in today’s lifestyle has led to climate change from greenhouse gas emissions and has increased the need for use of renewable energy [1]. The major issue limiting the wide-spread usage of intermittent renewable energy sources is the availability of efficient and cost-effective energy storage systems [2]. Recently, redox flow batteries (RFBs) have attracted significant attention due to their flexible design and ability to efficiently store large amounts of energy [3,4,5]. RFBs are composed of two differently charged electrolyte systems that convert electrical energy directly into chemical energy by means of reversible electrochemical reactions [6,7,8,9]. The electrolytes are stored in external tanks and pumped through an electrochemical redox cell, where the redox reactions take place, storing or producing electricity [9,10,11,12]. In the redox cell, a membrane separates the electrode and electrolyte of each half-cell. The role of the electrode is to allow for electrolyte transport and enable the reactions in each half-cell, while the membrane serves to prevent the mixing of the electrolytes and allow for the proton transfer between the two half-cells, to maintain electro-neutrality [13,14]. Once the charged electrolytes have participated in the reaction, they are circulated back to the electrolyte tanks for recharging. Unlike traditional batteries, the key advantage of RFBs is that power generation and energy storage are decoupled, such that the energy storage capacity is determined by the volume of electrolytes, whereas the power rating is dictated by the size of redox cells [3,4,5,6,7,8,9]. This makes them ideally suited for a wide range of applications, especially grid-scale energy storage. RFBs are typically categorized based on the redox active species that are used. Among various types of flow batteries, all-vanadium flow batteries (VRFBs), which employ the V 2 + / V 3 + and V 4 + / V 5 + redox couples in an aqueous solution as the negative and positive electrolytes, offer unique advantages [15,16]. The use of the same but differently charged species in both half-cells of VRFBs eliminates cross-contamination of electrolytes, which is considered to be one of the major problems that affect the life and durability of other RFBs [17]. Therefore, significant emphasis has been placed on all-vanadium systems since the invention of the flow battery technology [4,18].
The flow-assisted nature of RFBs presents many challenging issues, including but not limited to significant transport losses due to poor electrode and cell design and the related low power density [19,20,21,22,23,24,25,26]. It can be hypothesized that many of these challenges are primarily related to the concept of electrolyte utilization [27,28,29,30,31,32]. Electrolyte utilization is described as the most effective use of electrolyte circulation for the optimum charge and discharge of the RFB. The primary issues of concern regarding electrolyte utilization are gathered around (i) electrode design and (ii) electrolyte flow mechanisms in the cell. The primary role of the electrode is to enable transport of electrolytes, facilitate charge transfer and provide reaction sites for electrochemical reactions [21,33]. Therefore, the nature of the electrode is critically important as it directly governs the transport related losses [23,34,35], cell resistance [36,37], performance degradation [20,38] and many other issues. For instance, proper engineering of electrolyte circulation within the electrode can potentially increase the amount of electrode surface area used for reactions and charge transfer [39,40,41]. Failure to do so will increase the mass transport losses and the concentration overpotential, reducing overall battery performance.
Proper selection of electrolyte flow configuration is critical for the effective use of electrolyte. Two different flow configurations have been widely used in the field, namely flow-through and flow-by flow fields, which are defined based on how the electrolyte flows with respect to the electrode [19,29,42]. In a flow-through design, the electrolyte is forced to permeate through the porous electrodes, whereas in a flow-by design, the electrolyte is directed along the surface of the electrode (i.e., flows parallel to the electrode surface) in two ways: (i) through a flow frame placed between the electrode and the membrane, or (ii) through the flow channels in the current collector (similar to a fuel cell) [27,28,43]. Understanding the unique aspects of each flow scheme is critical for selecting the flow cell architecture that leads to minimum losses. While one flow configuration can minimize certain types of losses, it may inadvertently increase others. For instance, the flow-through design maximizes the contact between the electrolyte and the electrode; however, it increases the pressure drop and induces accelerated electrode degradation due to the high viscous forces. While the flow-by configuration eliminates the pressure drop losses, it suffers from poor electrolyte utilization.
Existing studies show the possibility of achieving higher performance ratings through the use of different flow-field geometries [23,27,28,42,43]. Among these studies, one promising solution is to use flow fields with non-uniform depth by adding channel obstructions and ramps. According to a recent study [28], integration of ramps (i.e., with tapered channels) into flow fields results in improvements in peak power densities for both open-ended (e.g., parallel flow field) and close-ended (e.g., interdigitated flow field) geometries. A reduction in the pressure drop has also been observed in interdigitated flow fields with tapered flow fields [28]. In this work, the pressure drop and flow characteristics of constant cross-section and tapered interdigitated flow fields used in RFBs (and related electrochemical devices) are investigated theoretically, numerically and experimentally. The organization of the paper is as follows. In Section 2, the formulation of the 2D CFD model used to analyze the problem is presented, along with a simplified 2D+1D model based on lubrication theory (Appendix A). In Section 3, the pressure drop experiments conducted in a single cell VRFB are described. The results are discussed in Section 4, including a comparison between both numerical models and the experimental data. Finally, the concluding remarks are given in Section 5.

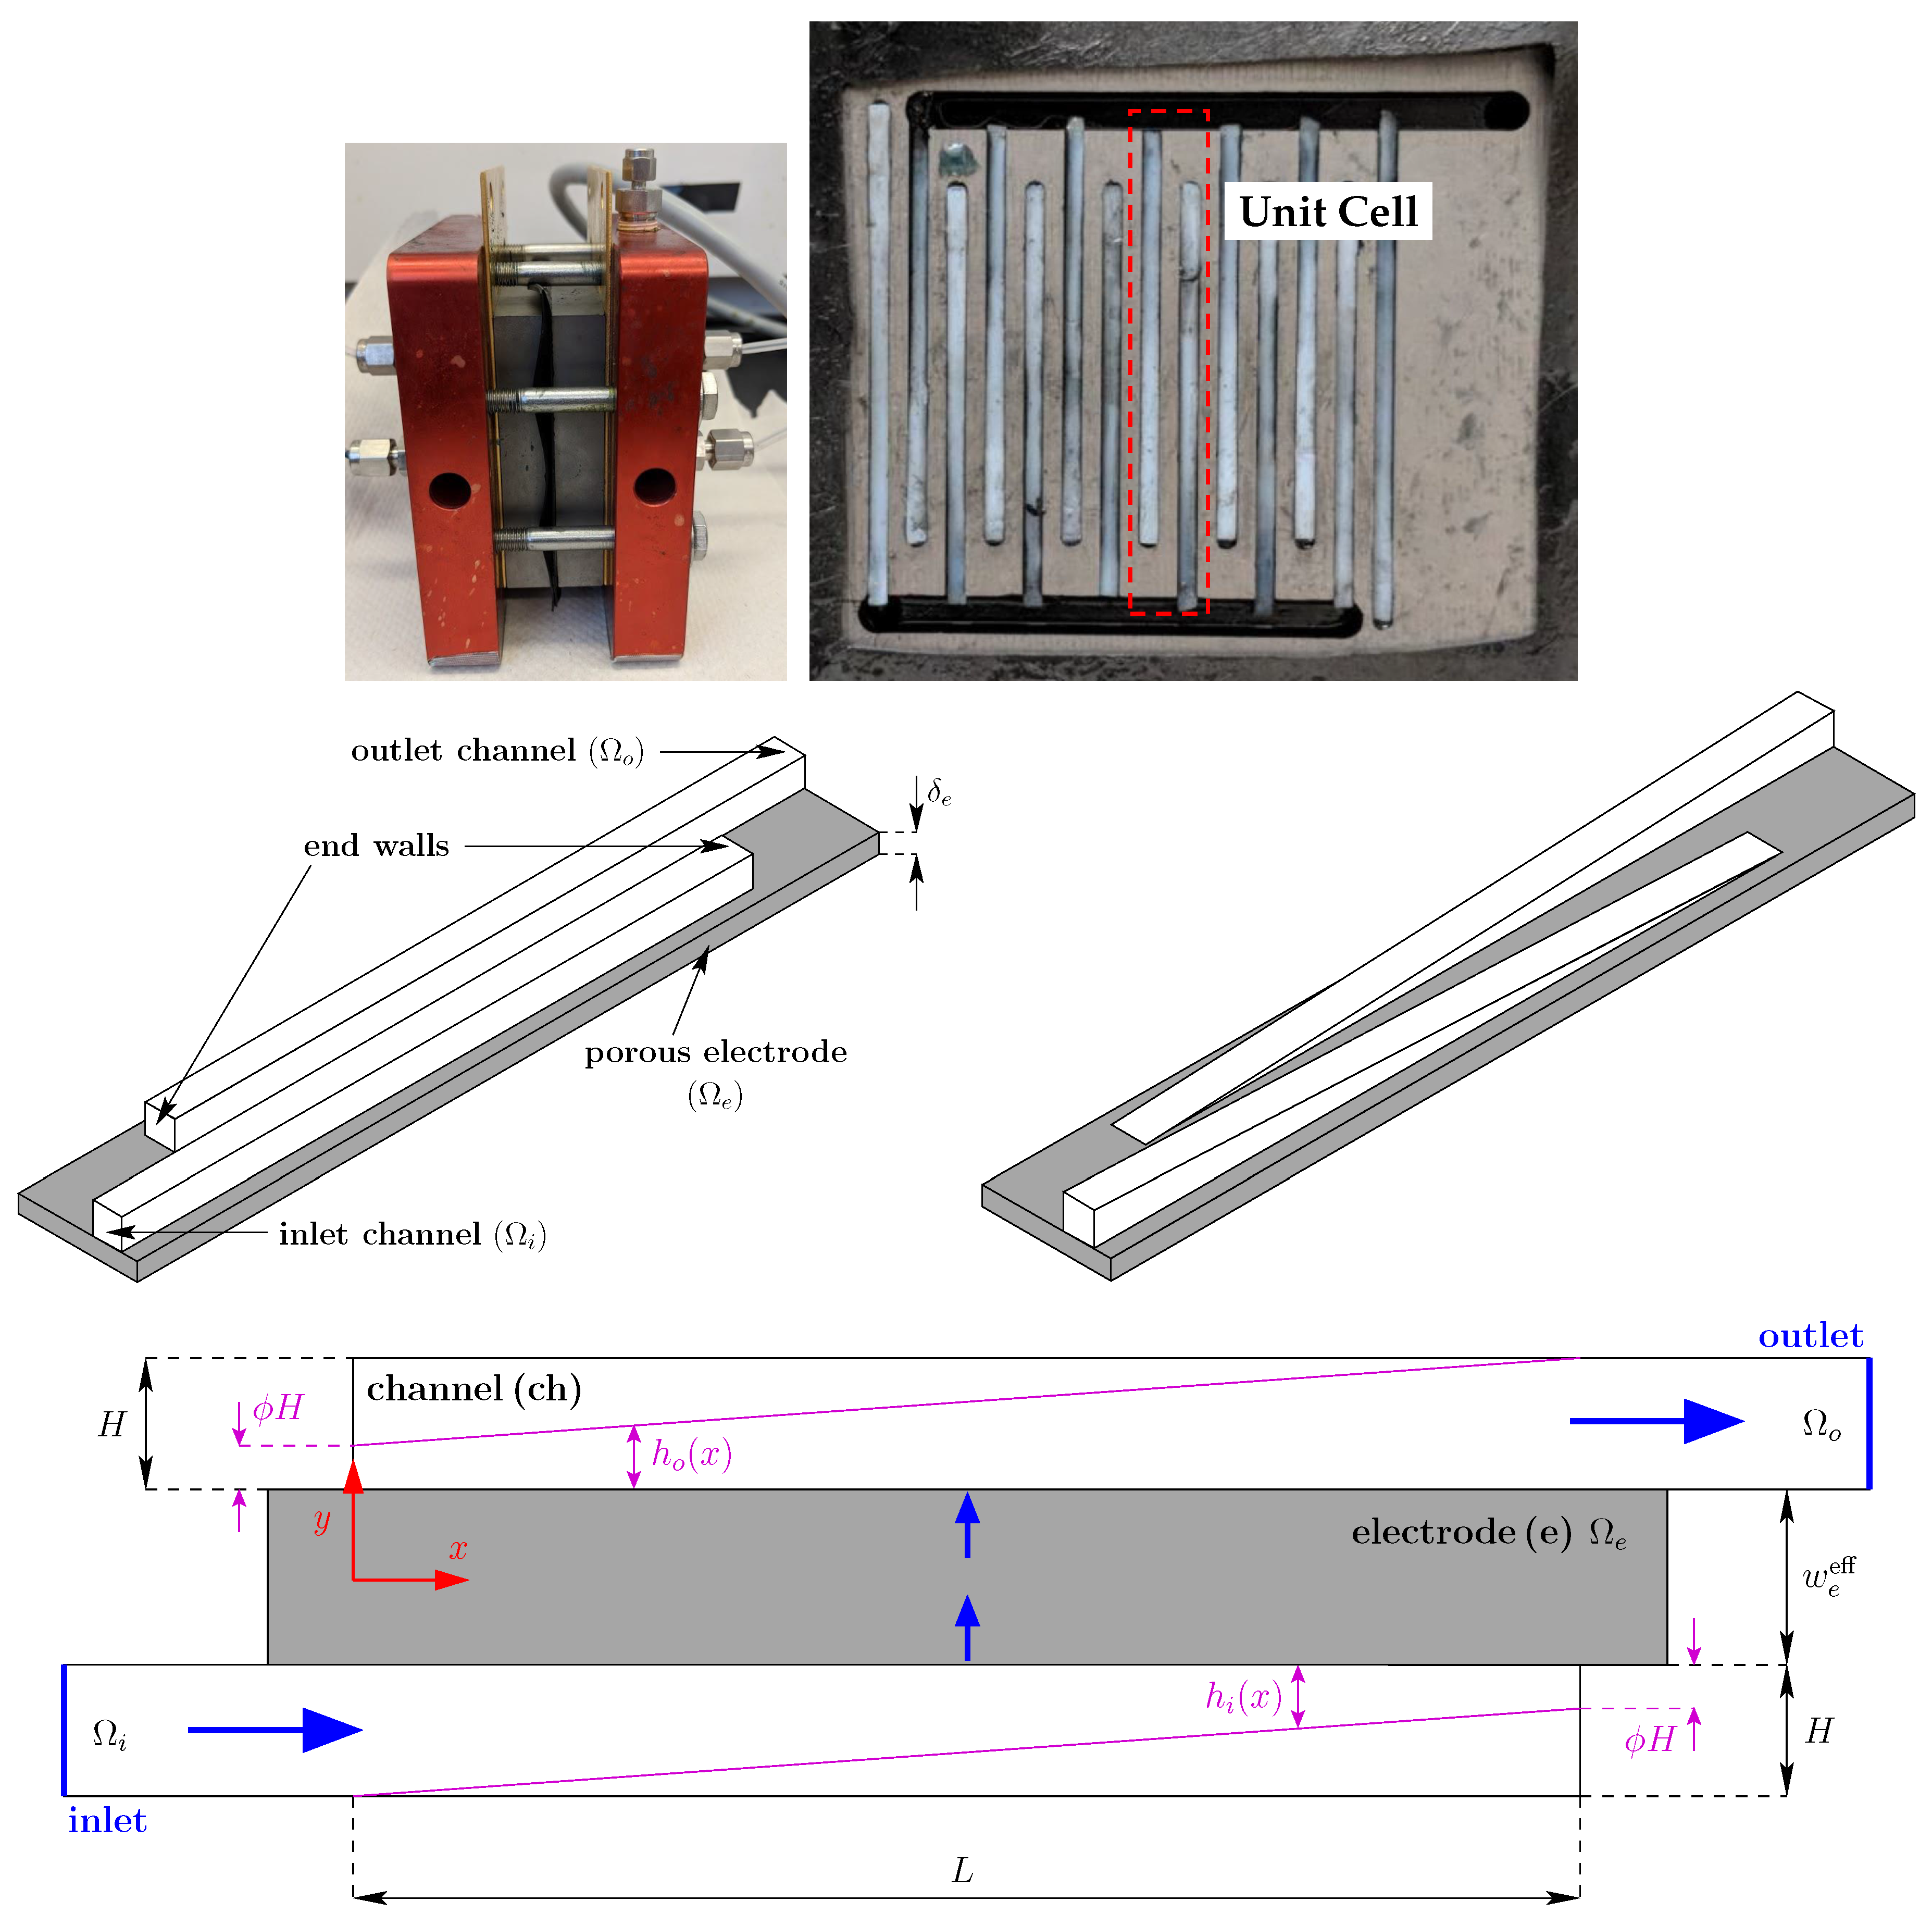
2. Mathematical Model

Figure 1 shows schematically the repeating unit cell of an interdigitated flow field typically used in electrochemical devices, such as RBFs or fuel cells. The liquid electrolyte enters the system with uniform velocity, U, continues through the inlet channel, Ω i , permeates through the porous electrode, Ω e , and is finally collected at the outlet channel, Ω o , before leaving the system. In typical cell designs, the height and width of the channels, H w ch 1 mm , are comparable to the characteristic, effective channel-to-channel distance, w e eff , and also to the electrode thickness, δ e , to provide a good balance between charge and mass transport. Note that the effective channel-to-channel distance includes the out-of-plane movement of the fluid as it travels around the rib, through the porous electrode. The characteristic, effective channel-to-channel distance is of the same order as the rib width and electrode thickness ( w e eff w rib δ e ). By contrast, the channel length, L, is much larger than the characteristic cross-sectional size, L H w ch w e eff δ e , which results in slender channel geometries. Hence, the flow in the channels is slender, or quasi-one-dimensional, with v / u H / L 1 , as implied by mass conservation. Here, u and v are the axial and transverse velocity components in the x and y directions, respectively.
Considering the above hierarchy of scales, a 2D CFD model is used here to facilitate the analysis and reduce computational cost, while still retaining the main physics of the problem. A detailed study would require the use of 3D geometries to account for the effective channel-to-channel distance, but this is out of the scope of this work, which seeks to understand the role of the main parameters governing the fluid-dynamic problem. The 2D geometry is shown in the bottom panel of Figure 1, where x = ( x , y ) , being x and y the Cartesian coordinates in theaxial and transverse direction, respectively. The fluid enters the system through the inlet channel, Ω i , which runs in the x-direction parallel to the porous electrode. In the domain of interest, 0 x L , hereafter referred to as the flow-through section, the height of the inlet channel decreases gradually from its initial value, h i ( 0 ) , to the dead-end height, h i ( L ) . Similarly, the height of the outlet channel, Ω o , located at the opposite side of the electrode, grows gradually from the dead-end height, h o ( 0 ) , to its final value, h o ( L ) . To facilitate the analytical treatment, the analysis is restricted to cases where the height of the inlet and outlet channels are equal, h i ( 0 ) = h o ( L ) = H , so that the pressure gradients in the channels upstream and downstream the flow-through section are equal. The inlet and outlet channels have a trapezoidal (i.e., tapered) geometry given by the following expressions
h i ( x ) = H 1 1 ϕ x L and h o ( x ) = H ϕ + 1 ϕ x L for 0 x L ,
with constant cross-section channels corresponding to ϕ = 1 , and tapered channels to 0 ϕ < 1 . The geometrical parameters and fluid properties used in the analysis are listed in Table 1. To remove the singularity that emerges at the closed end of ramped channels with ϕ = 0 , ramped profiles are truncated to a trapezoidal shape assuming a fixed taper ratio ϕ = 0.1 , which results in an end-wall height of 10% of the initial height H. In Section 4.3, a nearly triangular along-the-channel shape ( ϕ = 10 2 ) is also considered for comparison with a semi-analytical lubrication model that will help with the interpretation of the pressure drop results. The formulation of the lubrication model is presented in Appendix A. To ensure that the flow is fully developed in the electrode region, the inlet and outlet channels are provided with upstream and downstream extensions of constant height H to allow for the complete development of the flow and avoid any effect of the inlet and outlet boundary conditions. The length of these extensions, 20 H , is of the order of the flow development length for the highest Reynolds numbers considered in this study.
The density and viscosity of the fluid, ρ and μ , depend strongly on the type of electrolyte, state of charge and temperature [7,44,45]. Whereas the feed flow rate, Q, used in a cell with, e.g., 10 inlet and outlet channel segments and an active area of roughly 16 cm 2 does not usually exceed 200 ml / min , corresponding to 20 ml / min per channel segment [27,28,46,47]. This leads to a characteristic inlet velocity below U 0.33 m / s and a Reynolds number in the channel lower than R e = ρ U H / μ 300 , considering an inlet area of 1 × 1 mm 2 and the properties of liquid water at room temperature. However, aqueous and non-aqueous electrolytes often exhibit higher viscosities [48], so that R e < 100 is expected in most practical applications. In this exploratory work, liquid water is taken as working fluid, and the inlet velocity is conveniently varied (see Table 1) to investigate the role of inertia in an extended range of Reynolds numbers, R e = 1 800 .
The equations determining the flow and pressure drop are the steady-state Navier–Stokes equations for an incompressible fluid of uniform density and viscosity, written here in their generalized form for flow in porous media
· u = 0
ρ ε 2 u · u = p + μ ε 2 u + S u
where u = ( u , v ) is the superficial velocity (equal to the fluid velocity in the channels), ε is the porosity (equal to unity in the channels), and S u is the momentum sink term due to Darcy’s viscous resistance
S u = μ K e u , in Ω e 0 , in Ω i and Ω o ,
where K e is the (isotropic) electrode permeability.
Inertial effects (i.e., Forchheimer drag [46,49,50]) can be neglected in the porous electrode because the characteristic Reynolds number, R e e , based on the fiber diameter, d f , and the interstitial velocity, u e / ε , is usually of order unity or smaller. From mass conservation, the superficial velocity in the electrode can be estimated as u e [ H 2 / ( δ e L ) ] U ( H / L ) U , given that δ e H , which for the representative geometry considered here, H / L = 0.25 , with U 800 mm / s , results in u e 20 mm / s for the highest flow rates under study. Using the properties of liquid water, a characteristic fiber diameter d f 10 μ m , and a porosity ε 0.7 typical of carbon papers and felts [33,51,52,53,54], leads to
R e e = ρ u e d f ε μ = 10 3 2 × 10 2 10 5 0.7 10 3 0.3
R e e would be even lower for electrolytes more viscous than water.
Equations (2a) and (2b) can alternatively be written in the form
˜ · u ˜ = 0
1 ε 2 R e β Λ u ˜ · ˜ u ˜ = 12 γ ˜ p ˜ + β Λ ε ˜ 2 u ˜ 12 Λ γ u ˜ in Ω e 0 in Ω i and Ω o ,
where ˜ ( · ) = H ( · ) is the dimensionless nabla operator, associated with the dimensionless spatial variable
x ˜ = x H ,
while
u ˜ = ( u ˜ , v ˜ ) = u U and p ˜ = ( p p ref ) K e L μ H U w e eff
are the dimensionless velocity and pressure, the latter referred to a conveniently defined reference pressure, p ref . These are made non-dimensional using the average inlet velocity, U = Q / H , based on the volume flow rate Q per unit length in the spanwise direction (i.e., the out-of-plane direction), and the characteristic pressure drop across the porous electrode, Δ p e = ( μ / K e ) ( H / L ) U w e eff .
The dimensionless parameters that emerge in the problem are
R e = ρ U H μ , Λ = L w e eff , β = H w e eff , γ = 12 K e L 2 w e eff H 3 ,
which represent the characteristic Reynolds number of the flow in the channels, R e , the slenderness parameter, Λ 10 10 2 , the ratio between the channel height and the effective channel-to-channel distance, β 1 , and the ratio between the characteristic pressure drop along the channel due to viscous stresses, Δ p ch v = ( 12 μ / H 2 ) U L , and the pressure drop across the porous electrode due to Darcy’s viscous resistance, Δ p e = ( μ / K e ) ( H / L ) U w e eff , γ 10 2 –1. The former is estimated as the pressure drop of a planar Poiseuille flow in a flat channel of length L and uniform cross-section H (i.e., with an equivalent permeability K ch = H 2 / 12 ), while the latter is determined from Darcy’s law using the characteristic velocity in the porous electrode, u e ( H / L ) U .
No-slip boundary conditions are imposed at solid walls, while a prescribed uniform velocity is imposed at the inlet and a zero dimensionless pressure at the outlet
u ˜ · n = 1 at the inlet
p ˜ = p ˜ ref = 0 at the outlet
where n denotes the outward unit normal vector.
The above equations were integrated in ANSYS Fluent using the viscous solver with the SIMPLE algorithm to handle the pressure-velocity coupling, least square cell-based discretization for gradients, the standard pressure interpolation scheme, and second-order upwind discretization for the momentum conservation equation. Structured quadrilateral meshes with 0.5–2 million cells were used in the simulations, including a refinement near the channel-electrode interfaces to capture velocity gradients adequately. The grid independency study performed in the simulation campaign can be found in Appendix B. The convergence criterion of the residuals was set to 10 8 .

3. Experimental

Pressure drop measurements were performed in a 5 cm 2 flow cell with Nafion 212 membrane and impervious graphite bipolar plates with constant cross-section and ramped ( ϕ 0 ) interdigitated flow fields. The inlet and outlet channels had an inlet area of 0.8 × 0.8 mm 2 and a length L = 1.7 cm , and were separated by ribs with a width w rib = 0.8 mm . The feed flow rate was distributed among N ch = 7 channel segments. Two layers of AvCarb F250C (200 and 250 μ m ) carbon paper were used as electrodes. 25 mL of electrolyte (1.6 M vanadium dissolved in 2.5 M sulfuric acid) was placed in each external tank, and pumped through the cell with a peristaltic pump (Masterflex L/S, Cole-Parmer, Vernon Hills, IL, USA) at various flow rates ranging from 16 mL / min to 80 mL / min . Pressure drop measurements were performed when the cell was switched off using Honeywell board mount pressure sensors inserted into a T-junction tube between the peristaltic pump and the inlet of the flow cell. Pressure drop measurements were repeated 3 times and data recorded every 0.2 s for 10 min. Each dataset was averaged over time for analysis, observing a deviation lower than 1% in averaged pressure.

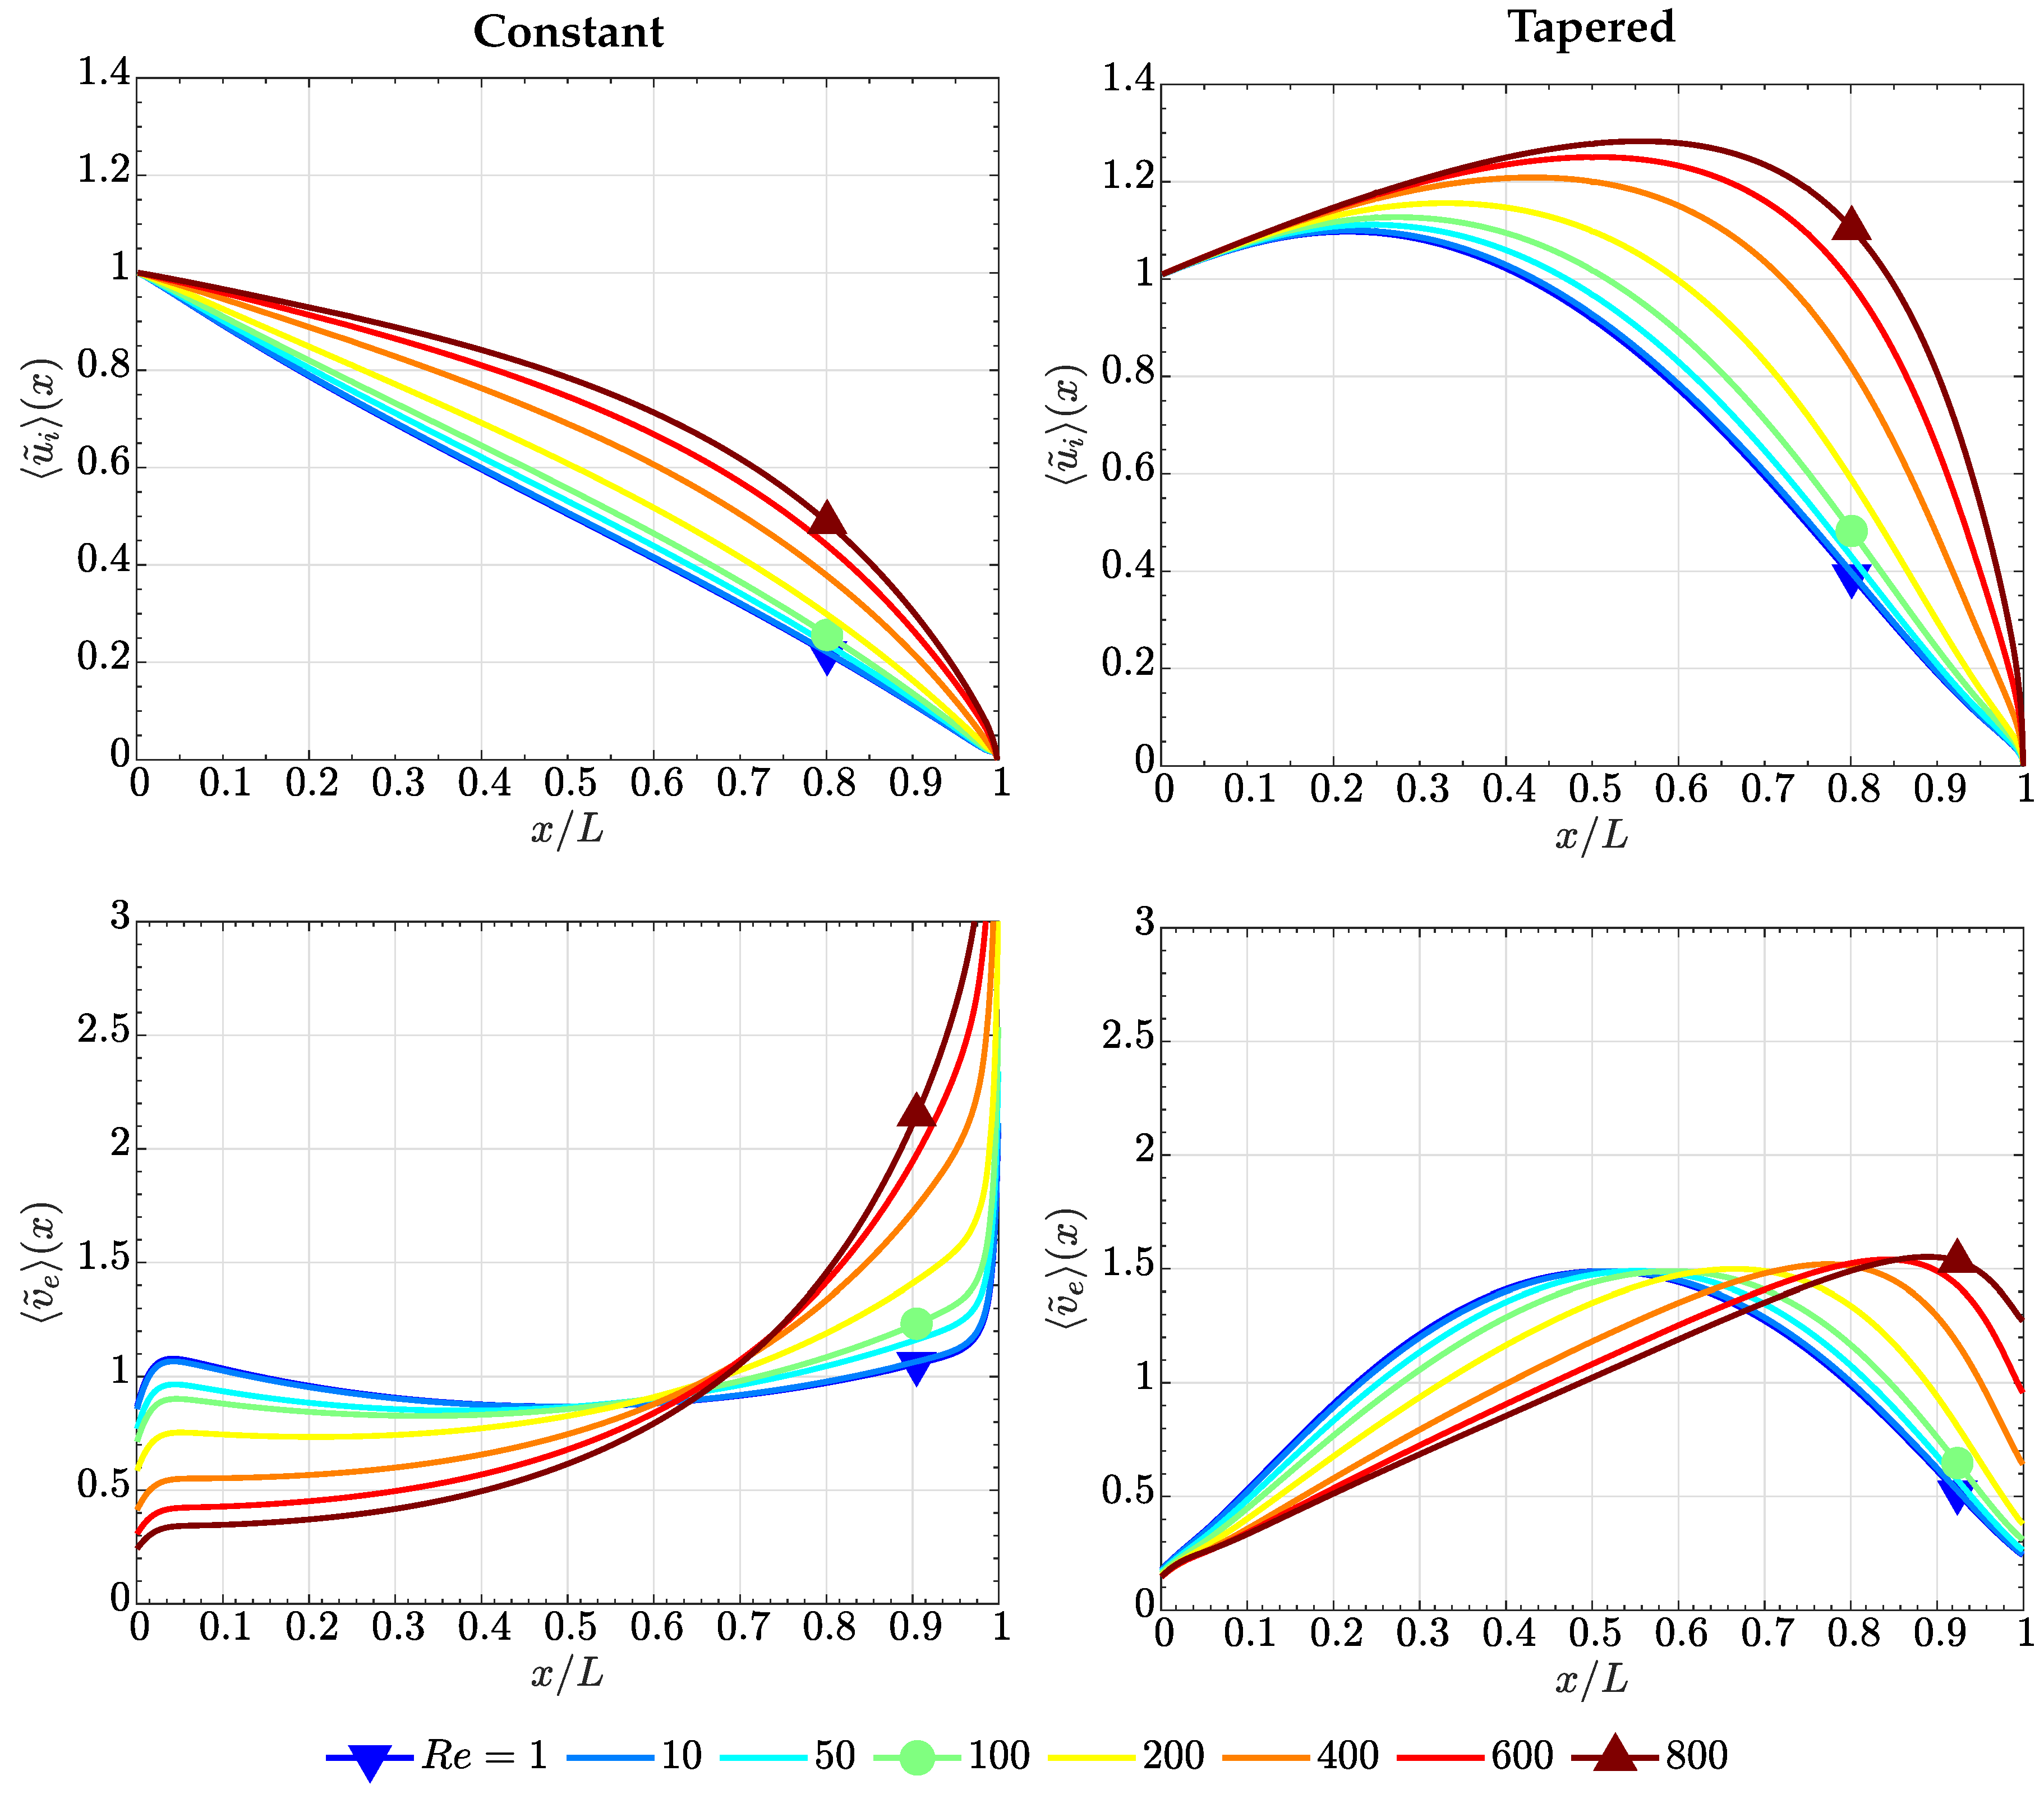
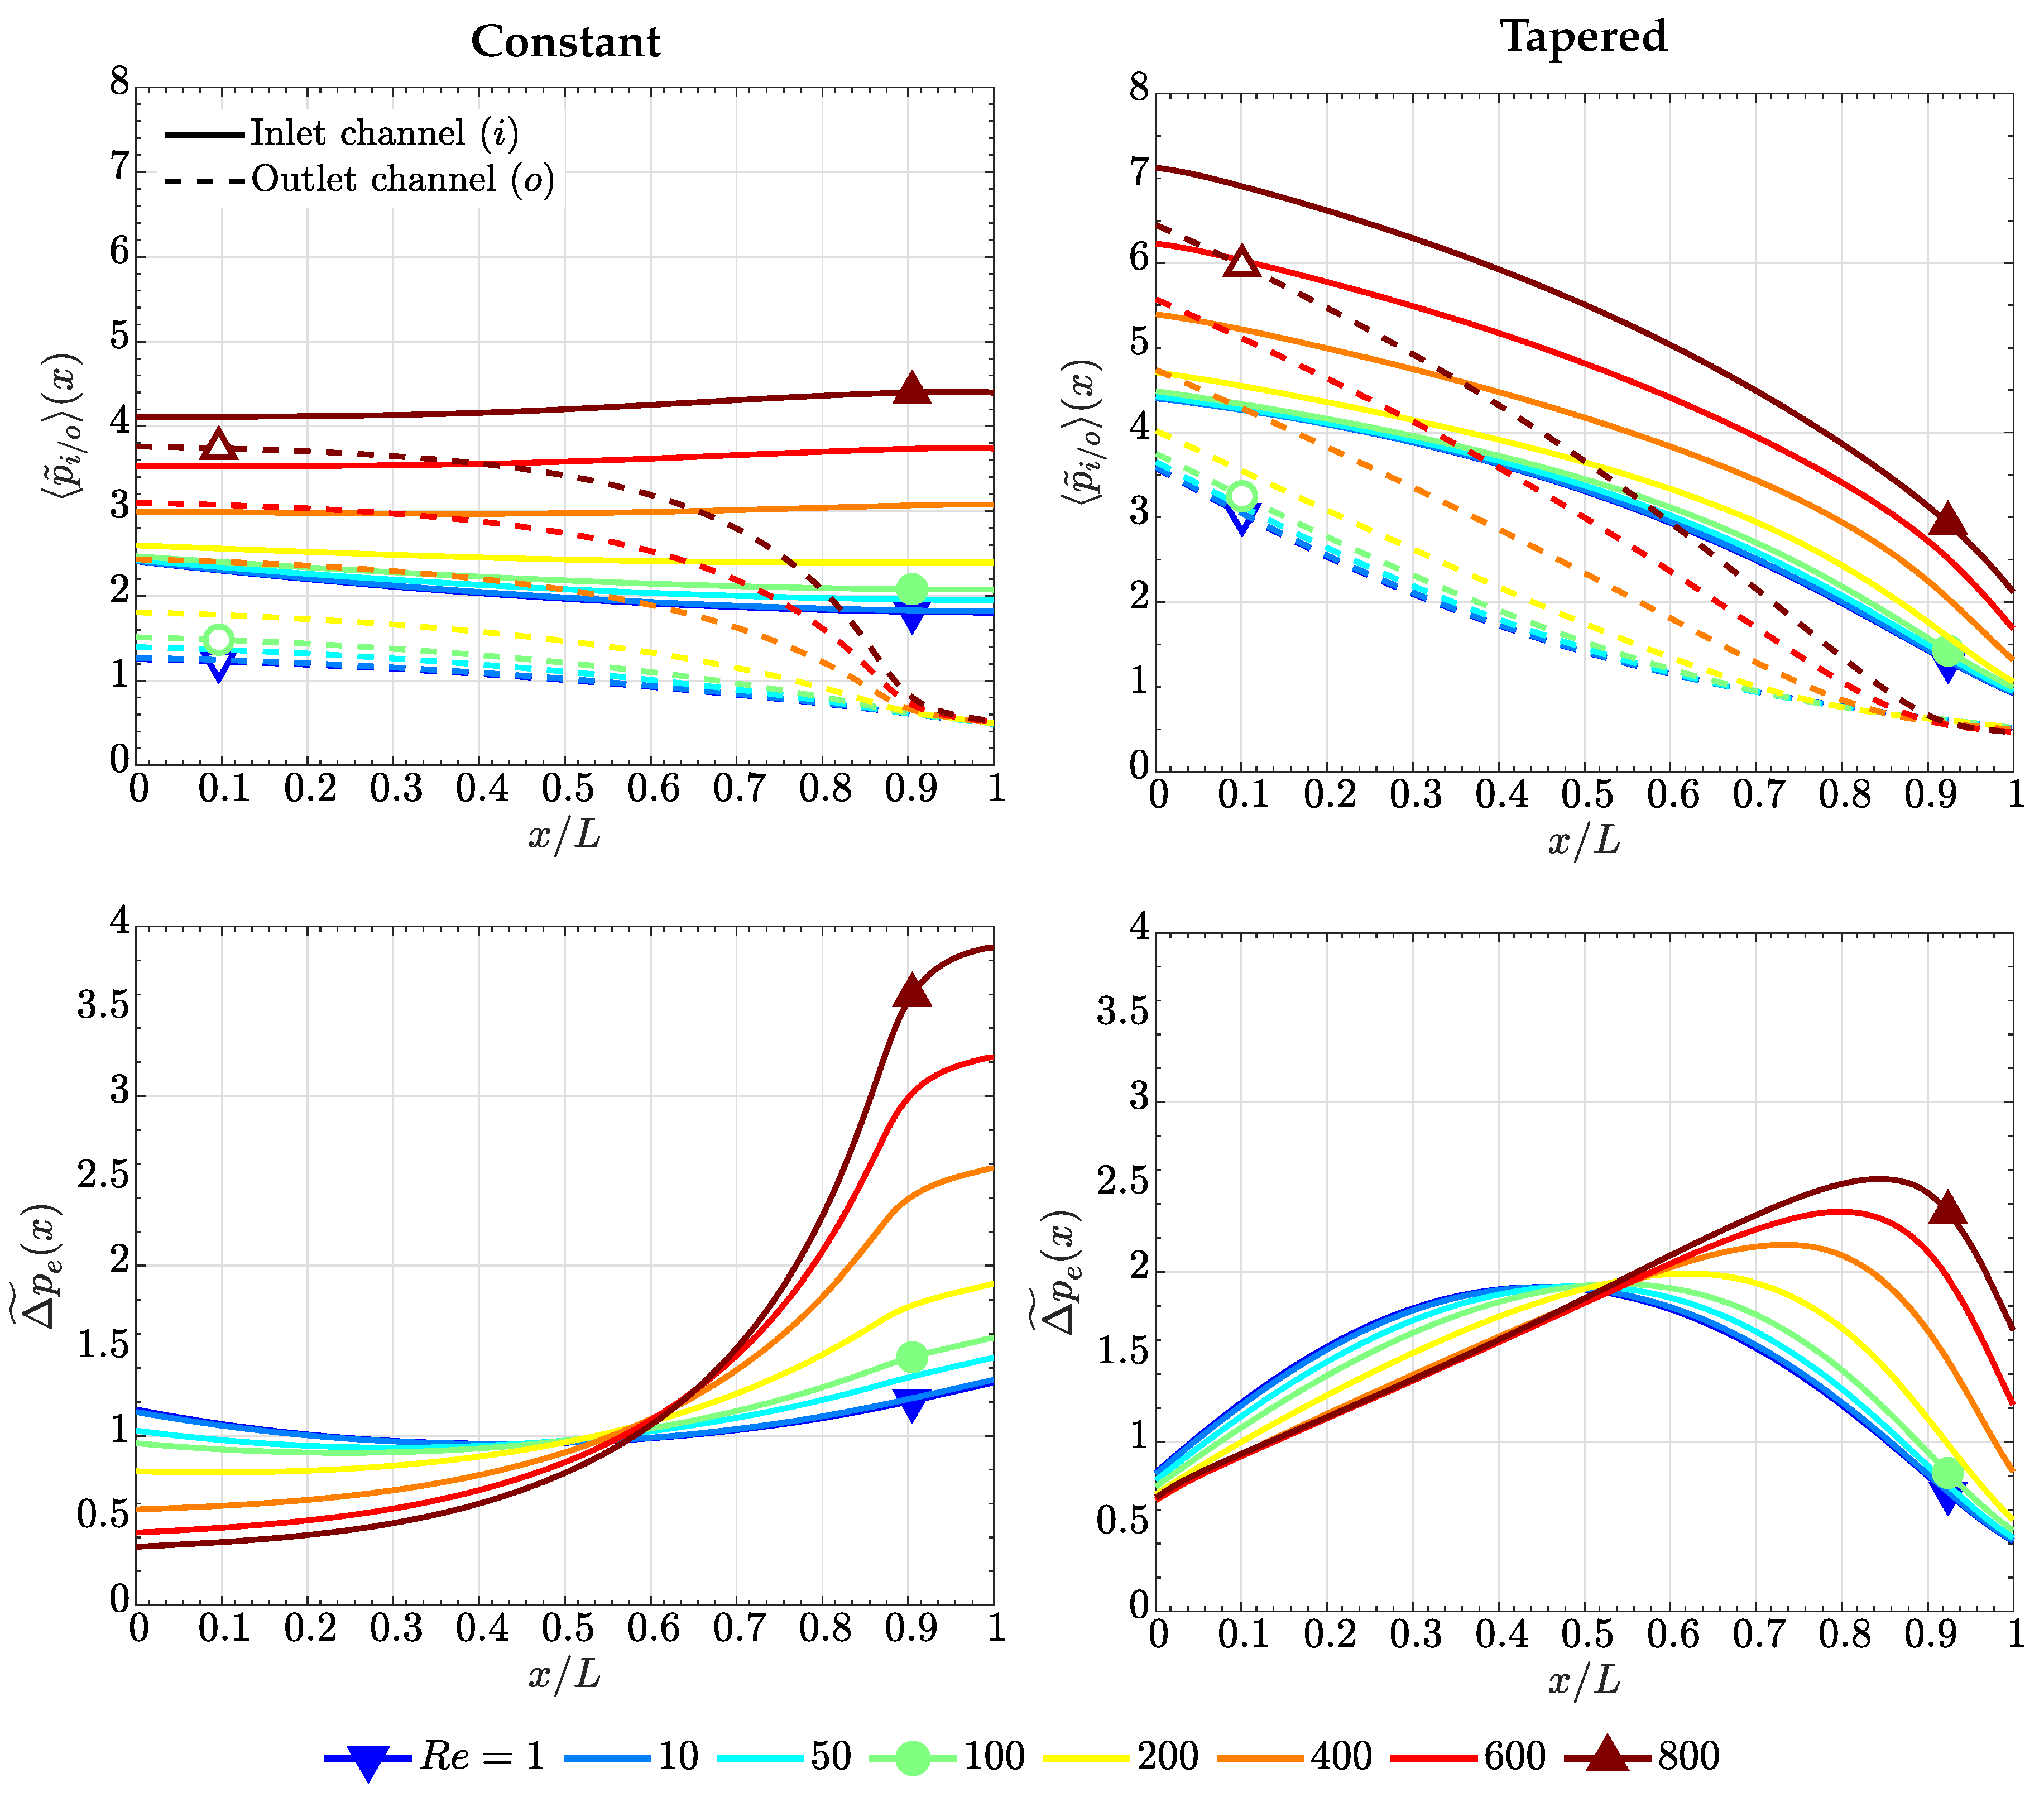
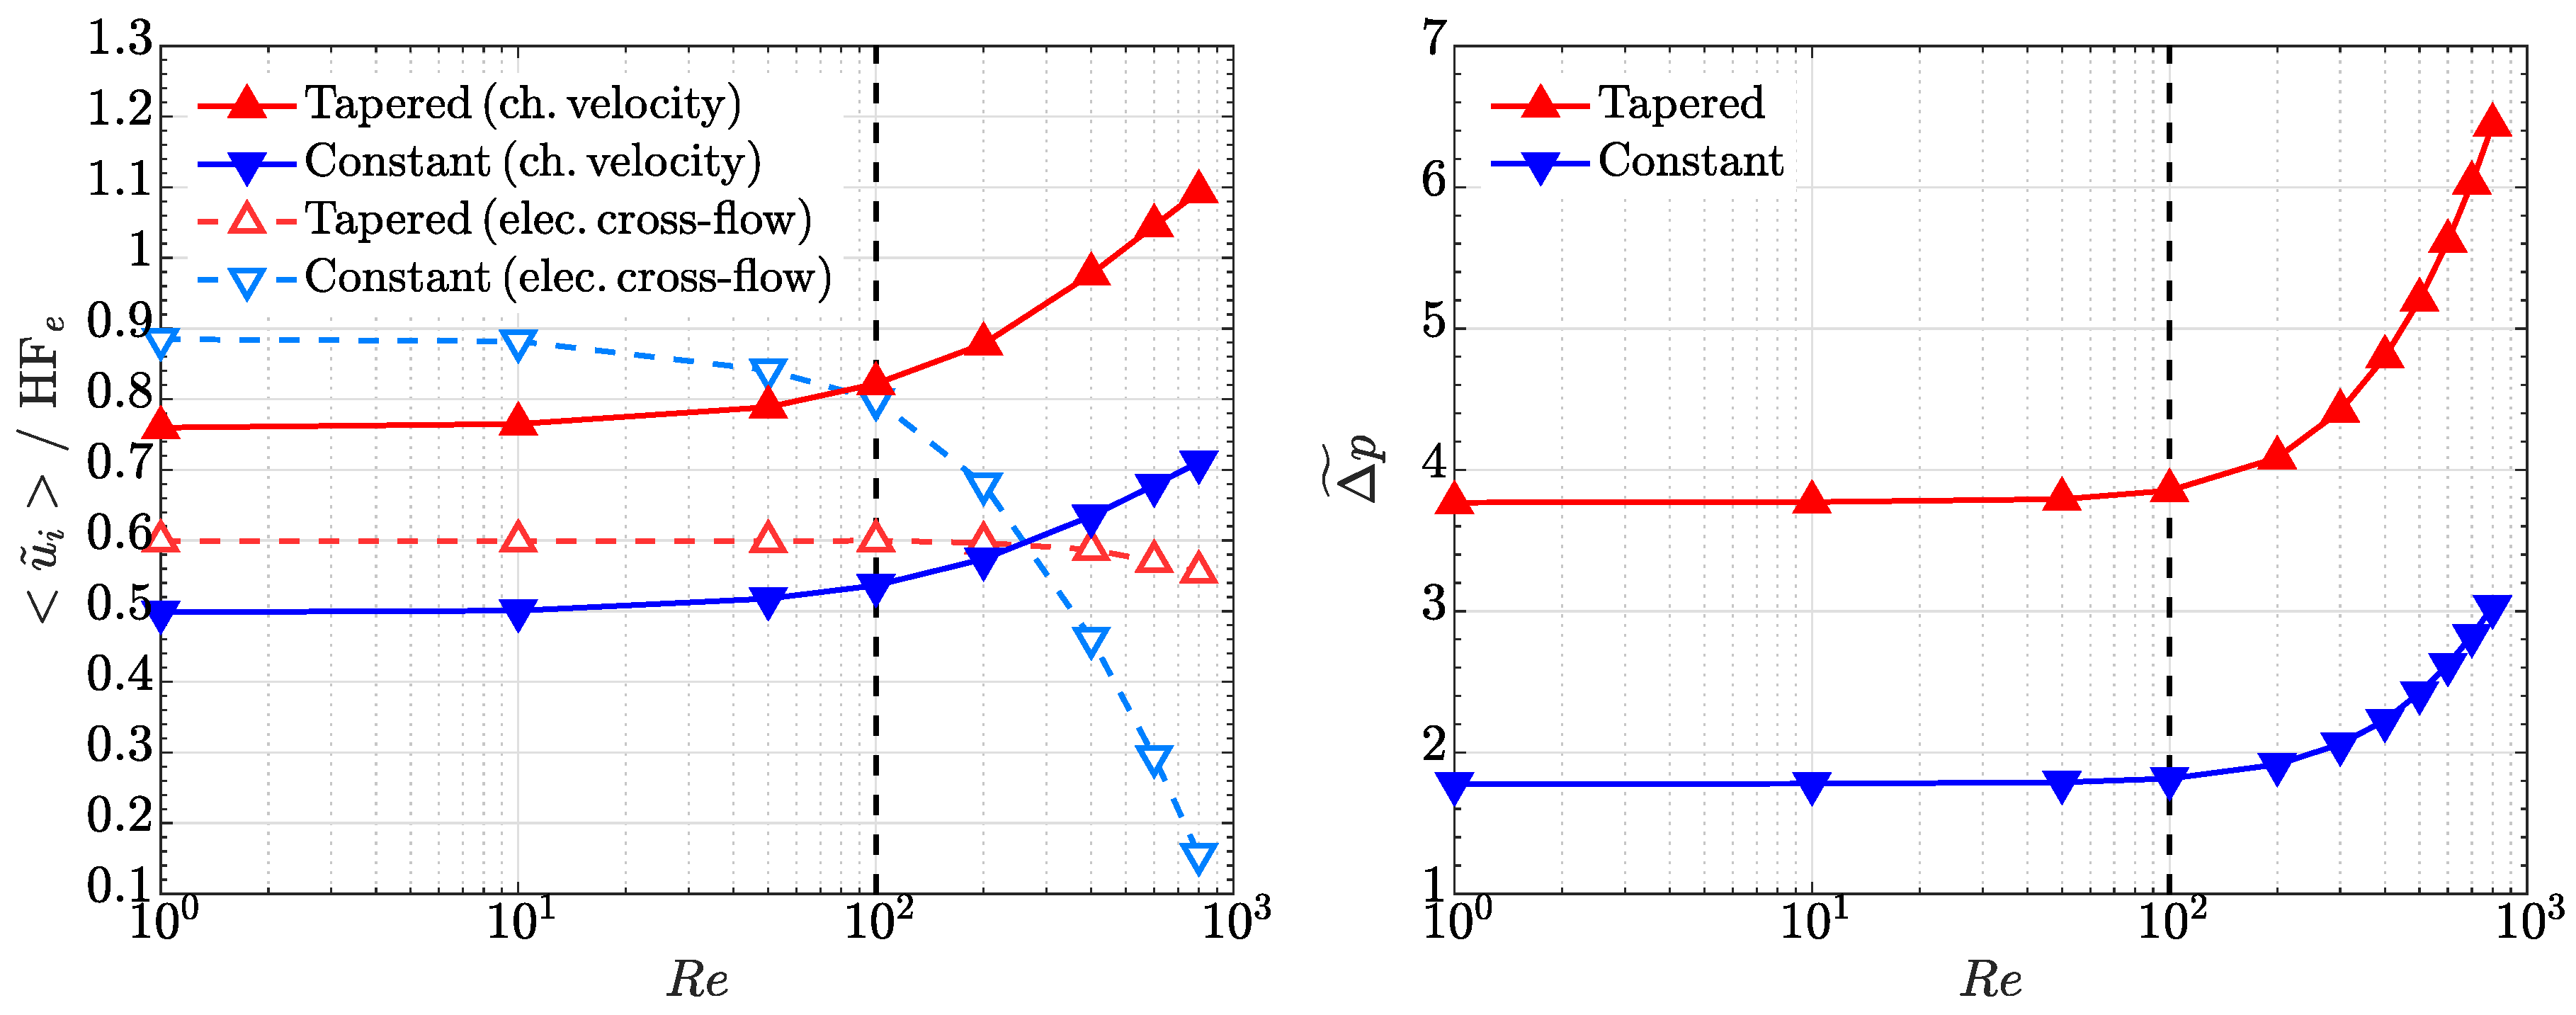
4. Discussion of Results

As previously discussed, the geometrical parameters β = H / w e eff 1 and Λ = L / w e eff 10 10 2 take reasonably uniform values in electrochemical cells, so they will be kept fixed in the study with the values presented in Table 1, β = 1 / 1.5 = 0.67 and Λ = 40 / 1.5 = 26.67 . Additionally, Λ = 100 / 1.5 = 66.67 is examined in Section 4.3. Larger variations are found in the Reynolds number in the channels, R e = ρ U H / μ , which changes with the feed flow rate and electrolyte properties, as well as the pressure drop ratio, γ = 12 K e L 2 / ( w e eff H 3 ) , which increases linearly with the electrode permeability. Here, the Reynolds number is varied in the range 1–800 to study the full range of variation of R e expected in practice ( R e 1 –100), along with the effect of inertia at higher Reynolds numbers ( R e 100 –800) that may appear in the operation of large cell designs, not accounted for in the lubrication model (see Appendix A). In addition, two different electrode permeabilities are examined, K e = 10 10 m 2 and K e = 10 12 m 2 , corresponding to γ = 1.28 and γ = 1.28 × 10 2 . The former is close to the upper limit of permeabilities found in uncompressed fibrous electrodes, while the latter is of the order of the permeability of compressed samples during operation [51,52,55,56,57,58]. Some extra permeabilities are analyzed in Section 4.3 to study the combined effect of γ and Λ on the pressure drop predicted by the CFD and the lubrication models.
Before proceeding further, it is convenient to examine the relative importance of the different terms in the along-the-channel momentum equation. Considering Equation (5b), we have that
ρ u · u = p + μ 2 u
ρ U 2 L = Δ p ch L + μ 12 U H 2
where the numerical factor that appears in the estimate of the viscous term is due to the use of the exact solution for a planar Poiseuille flow and is included here to increase the accuracy of the estimates. When convective effects are negligible, the pressure drop along the channel can be estimated by imposing that the longitudinal pressure gradient must be of the same order as the viscous term, leading to Δ p ch v = ( 12 μ / H 2 ) U L . Convective effects in the channel start to play a role when they become of the order of the viscous term, ρ U 2 / L 12 μ U / H 2 , or
R e 12 L H = 12 Λ β ,
which for H = 1 mm and L = 4 cm ( β = 0.67 , Λ = 26.67 ) yields R e 480 .
In addition, the relative importance of the terms in the across-the-electrode momentum equation is
p = μ K e u
Δ p e w e eff = μ K e U H L
Therefore, the pressure drop along the channel due to convective effects, Δ p ch c , becomes comparable to the pressure drop across the electrode due to Darcy’s viscous resistance, Δ p e , when ρ U 2 ( μ U H / K e ) ( w e eff / L ) , or
R e H 2 K e w e eff L = 12 Λ β γ 1
which for H = 1 mm , w e eff = 1.5 mm , L = 4 cm and K e = 10 12 m 2 , 10 10 m 2 ( β = 0.67 , Λ = 26.67 ) yields R e = 375 and R e = 3.75 × 10 4 for γ = 1.28 and γ = 1.28 × 10 2 , respectively.
In the discussion below, the analysis is focused on along-the-channel x-variations, so distributions are locally averaged in the transverse y-direction. The averaged axial velocity is only presented for the inlet channel, since the local crossflow across the porous electrode is almost 1D (see Appendix B). The 1D character of the flow in the electrode is explained by the higher local permeability of both the constant and tapered cross-section channels ( K ch ( x ) = h i / o 2 ( x ) / 12 = 10 9 10 7 m 2 ), which is at least one order of magnitude higher than the maximum electrode permeability considered in this study ( K e = 10 10 m 2 ). Therefore, the longitudinal velocity profile in the outlet channel is virtually the complementary of that in the inlet channel. The expressions of the y-averaged variables used in the analysis, i.e., dimensionless axial velocity in the channel, dimensionless transverse velocity in the electrode, and dimensionless pressure in the inlet and outlet channels, are as follows
u ˜ i ( x ) = Q i ( x ) / h i ( x ) U ; v ˜ e ( x ) = 1 w e eff w e eff / 2 w e eff / 2 L U H v e ( x , y ) d y ; p ˜ i ( x ) = 1 h i ( x ) w e eff / 2 h i ( x ) w e eff / 2 K e L μ H U w e eff p i ( x , y ) d y ; p ˜ o ( x ) = 1 h o ( x ) w e eff / 2 w e eff / 2 + h o ( x ) K e L μ H U w e eff p o ( x , y ) d y
Additionally, three overall variables are considered, i.e., overall pressure drop, overall average velocity in the inlet channel, and homogeneity factor of the flow across the electrode, which are defined as
Δ p ˜ = w e eff / 2 H w e eff / 2 p ˜ i ( 0 ) d y w e eff / 2 w e eff / 2 + H p ˜ o ( L ) d y ; u ˜ i = 1 L 0 L u ˜ i ( x ) d x ; HF e = 1 σ v ˜ e ( x ) 1 L 0 L v ˜ e ( x ) d x
where σ is the standard deviation of the transverse velocity distribution in the electrode v ˜ e ( x ) .

4.1. Case of High Electrode Permeability, K e = 10 10 m 2 ( γ = 1.28 1 )

When γ 1 , the pressure drop along the channel due to viscous stresses is comparable to the pressure drop across the electrode ( Δ p ch v Δ p e ), while convection in the channels becomes important for R e 100 . Please note that Equations (12) and (14) lead to the same order of magnitude estimation since γ 1 . This result can be seen in Figure 2, which shows the along-the-channel variation of the dimensionless axial velocity, u ˜ i ( x ) , and the dimensionless transverse velocity in the electrode, v ˜ e ( x ) , of the constant cross-section (left panel) and the tapered (right panel) flow fields.
In constant cross-section channels, the axial velocity decreases monotonously with x due to the gradual loss of mass caused by the crossflow towards the porous electrode [59,60]. For R e 12 H / L , the role of inertia is negligible, resulting in roughly uniform crossflow distributions and nearly linear longitudinal velocity profiles. However, for larger Reynolds numbers, R e 12 H / L , inertia becomes important and forces the fluid to continue straight towards the end of the channel. The axial velocity exhibits now a clearly non-linear behavior, decreasing more slowly at the inlet but falling more rapidly at the end. Therefore, higher pressure drops arise near the end of the channel, as required to sustain the larger crossflow velocities present there, which result in a reduction of the streamline spacing in this region (see Appendix B). Summarizing, inertia keeps the fluid moving in the streamwise direction, increases the axial and crossflow velocities near the end of the channel, and results in less uniform crossflow distributions and higher overall pressure drops.
Tapered channels exhibit higher axial velocities as a result of the gradual reduction of the cross-section, which tends to accelerate the flow and partially compensates for the deceleration caused by the crossflow. Consequently, as shown in Figure 3, higher pressure drops are found in the tapered flow field. For instance, Figure 2 shows that the axial velocity experiences significant overshoots with respect to the inlet velocity in a significant fraction of the channel close to the inlet. This result agrees with previous studies analyzing the effect of channel tapering on fuel cell performance [61,62,63,64]. The initial growth rate of the axial velocity can be estimated from the condition that the volume flow rate in the inlet channel must remain approximately constant, u ( x ) h i ( x ) U H = Q , at the beginning of the channel, namely
u ˜ = u ( x ) U H h i ( x ) = 1 1 ( 1 ϕ ) ( x / L ) 1 + ( 1 ϕ ) ( x / L ) for x L 1
This condition stems from the fact that the equivalent permeability of a flat channel is K ch = h 2 ( x ) / 12 , so that the ratio of the equivalent permeabilities of the inlet and outlet channels for x / L 1 is of order K ch , i / K ch , o h i 2 ( 0 ) / h o 2 ( 0 ) 1 / ϕ 2 = 100 for ϕ = 0.1 . As a result, a negligible volume flow rate is expected to cross the porous electrode at the beginning of the inlet channel, which motivates the assumption of roughly constant volume flow rate in this region leading to (17). Similar considerations apply for the dead-ended region of the inlet channel, where the small equivalent permeability strongly reduces the volume flow rate until it eventually vanishes at the end, thus resulting in a parabolic-like crossflow distribution along the channel. The location of the peak transverse velocity shifts towards the dead-ended region when R e is increased due to inertia, although the additional inhomogeneity introduced in the crossflow distribution is lower than that observed for the constant cross-section flow field.
The main global differences between both flow fields are shown in Figure 4. The left panel shows the variation of the average channel velocity and the homogeneity factor of the flow across the electrode as a function of R e , while the right panel shows the variation of the overall pressure drop as a function of R e . As can be seen, the dimensionless channel velocity and pressure drop in both flow fields remain approximately constant for R e 1 –100, and increase quadratically for R e 100 –800. The channel velocity and pressure drop are about 1.5 and 2 times higher in the tapered flow field in the full R e range. Two regimes are also differentiated for the homogeneity factor depending on R e . For R e 1 –100, the homogeneity factor remains almost constant, being significantly higher in the constant cross-section flow field ((constant) HF e = 0.9 vs. (tapered) HF e = 0.6 ). As discussed before, this is caused by the preferential crossflow accumulation towards the middle of the channel in the tapered flow field. However, for R e 100 , the homogeneity factor in the constant cross-section flow field drops strongly due to the effect of inertia, while it only varies slightly in the tapered flow field ( HF e 0.55 at R e = 800 ). As a result, the homogeneity factor of the constant cross-section flow field becomes lower than that of the tapered flow field for R e > 300 , reaching values as low as HF e 0.15 at R e 800 .

4.2. Case of Low Electrode Permeability, K e = 10 12 m 2 ( γ = 1.28 × 10 2 10 2 )

When γ 10 2 , the pressure drop along the channel due to viscous stresses is negligible compared to the pressure drop across the electrode ( Δ p ch v Δ p e ). In addition, according to Equation (14), convection in the channels introduce variations in the order of the pressure drop across the electrode ( Δ p ch c Δ p e ) when R e 10 4 , which exceeds the critical Reynolds number of the laminar regime. Hence, the high pressure drop across the electrode dominates the solution. This can be clearly seen in Figure 5 and Figure 6, where the pressure in the channels is virtually constant, so the overall pressure drop is concentrated in the electrode. The constant pressure difference across the electrode in turn leads to an even crossflow distribution, which is accompanied by a strong 1D local flow across the electrode (see streamlines in Appendix B).
The corresponding along-the-channel variations of the axial velocity can be obtained from Equations (A2) and (A3a)–(A3b) considering a constant transverse velocity across the electrode, v e ( x ) = v = cte . The analytical results for the constant cross-section and tapered flow fields are included in Figure 5.
Mass conservation for the inlet and outlet channels gives, respectively
d Q i ( x ) d x = v Q i ( x ) = C i v x
d Q o ( x ) d x = v Q o ( x ) = C o + v x
where the unknown constants C i , C o , and v must be determined so as to satisfy the boundary conditions Q i ( 0 ) = Q o ( L ) = U H and Q i ( L ) = Q o ( 0 ) = 0 . This leads to C i = U H , C o = 0 , and v = U H / L , which results in the average axial velocity profiles
u ˜ i ( x ) = Q i ( x ) / h i ( x ) U = 1 ( x / L ) h i ( x ) / H and u ˜ o ( x ) = Q o ( x ) / h o ( x ) U = x / L h o ( x ) / H
For constant cross-section channels, h i ( x ) = h o ( x ) = H , this leads trivially to
u ˜ i ( x ) = 1 x L and u ˜ o ( x ) = x L
showing a linear decrease of the average axial velocity along the inlet channel, and a linear increase along the outlet channel. For tapered channels, use of the expressions for h i ( x ) and h o ( x ) given in Equation (1) leads to the nontrivial results
u ˜ i ( x ) = 1 ( x / L ) 1 ( 1 ϕ ) ( x / L ) and u ˜ o ( x ) = x / L ϕ + ( 1 ϕ ) x / L
The analytical solution shows that, as ϕ 0 , the inlet channel velocity tends to u ˜ i = 1 almost everywhere along the channel length, except at distances of order ϕ from the dead-end wall, where the velocity drops suddenly to zero. The limit of uniform axial velocity thus corresponds to ramped channels with sharp corners, in which the linear acceleration created by the ramped geometry fully compensates for the deceleration caused by the uniform crossflow distribution along the channel. However, for ϕ = 0.1 , as considered here, the linear acceleration introduced by the tapered geometry is lower, leading to a parabolic-like variation of theaxial velocity along the channel. The channel velocity varies smoothly in most of the channel, and drops strongly in a region of size Δ x ϕ L close to the dead-ended wall. Similar considerations apply for the outlet channel, but in that case the crossflow coming from the electrode accelerates the flow in the channel and the tapered geometry tends to decelerate it.
Figure 7 shows a comparison between both flow fields, using a similar representation to that in Figure 4. As discussed earlier, all the variables of interest are independent of Re, except the channel velocity. The pressure drop and the crossflow distribution are dominated by the viscous resistance of the electrode, and the impact of the channel geometry is negligible [46,65,66]. As shown in Figure 8, the results for γ 10 2 are in agreement with the experimental data measured in a single cell VRFB with commercial AvCarb carbon-paper electrodes, whose permeability is in the order of 10 12 m 2 for mid-compressed samples (similar to Toray carbon paper) [52,67]. Minor variations are observed in the pressure drop of both channel types, which increases almost linearly with the feed flow rate because of the higher velocities reached in the electrode (i.e., Δ p ˜ ch 1 ). Indeed, the pressure drop across the electrode can be estimated as
Δ p = μ w e eff K e ( Q / 2 N ch ) δ e L
where L = 1.7 cm , δ e 0.45 mm , w e eff 2 mm (approximated as the rib width plus two times the channel half-width and the electrode half-thickness, w e eff w rib + w ch + δ e ), and μ = 3 × 10 3 Pa s (a typical viscosity found invanadium electrolytes [45]). The factor of 2 takes into account that the flow rate in each inlet channel is collected by two neighboring outlet channels. A good fit to the experimental data can be obtained with K e 6.5 × 10 12 m 2 , corresponding to γ 10 2 , which confirms the dominant role of the porous electrode on the overall pressure drop.
The properties of the electrode are further examined in Figure 9, which shows the variation of the electrode permeability and overall pressure drop (see Equation (23)) with porosity and fiber diameter as predicated by the Carman–Kozeny equation. This correlation has previously been successfully used to describe the permeability of fibrous porous layers by Gostick et al. [52]
K e = d f 2 ϵ 3 16 k c k ( 1 ε ) 2
In the calculations, the Carman–Kozeny constant was taken equal to k c k = 5 , while the variables in Equation (23) were kept the same as those used before, together with a flow rate Q = 30 mL / min .
As can be seen, the permeability and the pressure drop change around two orders of magnitude when the porosity and the fiber diameter are varied between ε = 0.5 –0.9 and d f 1 20 μ m , respectively. This result emphasizes the strong importance of porous media microstructure on the pressure drop and internal flow distribution across the electrode. As a matter of fact, strong channeling effects has been previously reported in RFB operation that can lead to significant distributed ohmic and mass transport losses, as well as reduced durability [50,68,69,70].

4.3. Comparison with the Lubrication Model

In this section, the results of the 2D CFD model and the semi-analytical lubrication model are compared. Non-linear channel shapes were considered in the lubrication model according to the expressions
h i = H 1 ( x / L ) α ; h o = H 1 [ 1 ( x / L ) ] α ,
so that α = 1 corresponds to a ramped geometry; α = 0.99 was used in practice to avoid the singularity introduced by a sharp corner. The constant cross-section geometry was reproduced by setting α = 100 , which led to virtually the same results as higher values of this parameter. N = 50 terms were used in Equation (A10), which resulted in negligible variations compared to N = 100 .
In the CFD model, ϕ = 10 2 was considered instead of ϕ = 10 1 to introduce a sharp dead-ended region. In addition, three values of γ were simulated, γ = 1.28 × 10 2 , γ = 1.28 × 10 1 and γ = 1.28 , for two different values of Λ , Λ = 26.67 and Λ = 66.67 . This corresponds to K e = 10 12 m 2 , K e = 10 11 m 2 and K e = 10 10 m 2 for L = 4 cm , and K e = 1.6 × 10 13 m 2 , K e = 1.6 × 10 12 m 2 and K e = 1.6 × 10 11 m 2 for L = 10 cm , which are in the expected range of variation of K e and L. The results computed with the CFD model as a function of R e / ( 12 Λ β 1 γ 1 ) are shown in Figure 10. In addition, a quantitative comparison between the CFD model and the lubrication model for R e / ( 12 Λ β 1 γ 1 ) 1 (i.e., R e = 1 ) is listed in Table 2.
As can be seen in Figure 10, the pressure drop of both flow fields depends on γ and R e / ( 12 Λ β 1 γ 1 ) , with an exceedingly small contribution of Λ (and β , which is fixed to β 1 ). The predictions of both models are in good agreement when convective effects in the channel are unimportant compared to Darcy’s viscous resistance (i.e., R e / ( 12 Λ β 1 γ 1 ) 1 ), being the relative error below 5%. Convective effects in the CFD model become significant when 12 Λ β 1 γ 1 1 , introducing variations of order unity in the overall pressure drop Δ p ˜ . These results show that the lubrication model can be used as a preliminary tool to examine the flow in interdigitated flow fields for small values of R e / ( 12 Λ β 1 γ 1 ) , as usually found in RFBs and other electrochemical devices.

5. Conclusions

In this work, the effect of channel tapering on the flow distribution and pressure drop characteristics of interdigitated flow fields used in vanadium redox flow batteries (VRFBs) and related electrochemical devices was examined. The description was simplified using two 2D along-the-channel models: (1) a laminar CFD model, which considers the flow in the channels and the porous electrode, including Darcy’s viscous resistance in the latter; and (2) a semi-analytical model, which considers lubrication theory to describe the 1D Poiseuille flow in the channels and Darcy’s law to describe the 2D flow in the electrode. The 2D and 1D sub-models are coupled at the channel/electrode interfaces.
The physical parameters that govern the problem are: (1) the slenderness parameter, Λ = L / w e eff , (2) the ratio between the characteristic channel height (or width) and the characteristic, effective channel-to-channel distance, β = H / w e eff , (3) the ratio between the pressure drop along the channel due to viscous stresses and the pressure drop across the electrode, γ = Δ p ch v / Δ p e , and (4) the Reynolds number in the channel, R e = ρ U H / μ . In conventional cells, β 1 and Λ 10 10 2 , so in the study β was fixed to 0.67 , while two values of Λ were considered, 26.67 and 66.67 . R e was varied in the range 1–800 to examine the effect of inertia in the laminar regime. The analysis has shown that the most influential parameters are γ and R e / ( 12 Λ β 1 γ 1 ) , where the latter measures the relative importance of the pressure drop along the channel due to convection compared to the pressure drop across the electrode due to Darcy’s viscous resistance. Therefore, convective effects in the channel are negligible when R e / ( 12 Λ β 1 γ 1 ) 1 and introduce variations in the order of the pressure drop across the electrode when R e / ( 12 Λ β 1 γ 1 ) 1 . For high permeability electrodes ( γ 1 ), tapered flow fields lead to higher pressure drops compared to constant cross-section flow fields owing to the higher channel velocities reached in the channel. Hence, the beneficial effect of channel tapering on the overall cell efficiency would depend on the relative importance of the enhancement of species transport versus the increase of pumping losses. In contrast, for low permeability electrodes ( γ 10 2 ), the influence of R e is negligible (i.e., R e / ( 12 Λ β 1 γ 1 ) 1 ), so that the overall pressure drop is dominated by the electrode permeability. Consequently, the tapered and the constant cross-section flow fields show similar pressure drops. This result agrees with experiments performed in a single cell VRFB with commercial carbon-paper electrodes. Hence, tapered channels can lead to a higher overall cell efficiency due to the larger velocities achieved in the channel and the similar pumping losses. The improvement of species mass transport and removal of bubbles from side reactions or surrounding air should explain the better performance previously reported in VRFBs with ramped channels.
The results of the semi-analytical lubrication model were similar to those of the CFD model for R e / ( 12 Λ β 1 γ 1 ) 1 , so this model provides a computationally efficient tool to perform preliminary estimations of the flow characteristics in interdigitated flow fields. Future work should consider the effects of assembly compression and electrode anisotropy using a 3D multiphysics CFD model to analyze cell performance and efficiency, and conduct a one-to-one comparison with experimental data.

Author Contributions

Conceptualization, P.A.G.-S., E.A. and M.V.; methodology, P.A.G.-S., T.C.G. and E.A.; software, P.A.G.-S. and M.V.; validation, P.A.G.-S. and T.C.G.; formal analysis, P.A.G.-S. and E.A.; investigation, P.A.G.-S., E.A. and M.V.; resources, P.A.G.-S., T.C.G. and E.A.; data curation, P.A.G.-S.; writing—original draft preparation, P.A.G.-S., E.A. and M.V.; writing—review and editing, P.A.G.-S., S.E.I. and E.A.; visualization, P.A.G.-S., T.C.G., S.E.I., E.A. and M.V.; supervision, P.A.G.-S. and E.A.; project administration, P.A.G.-S.; funding acquisition, P.A.G.-S. and E.A. All authors have read and agreed to the published version of the manuscript.

Funding

This work was supported by the research project PID2019-106740RB-I00 of the Spanish Ministry of Science, Innovation and Universities, the project PEM4ENERGY-CM-UC3M funded by the call “Programa de apoyo a la realización de proyectos interdisciplinares de I+D para jóvenes investigadores de la Universidad Carlos III de Madrid 2019-2020” under the frame of the “Convenio Plurianual Comunidad de Madrid-Universidad Carlos III de Madrid”, and the Energy and Environment Research Grant of the Spanish Iberdrola Foundation.

Conflicts of Interest

The authors declare no conflict of interest.

Nomenclature

Cdimensionless coefficient in Equation (A10)
Ddimensionless coefficient in Equation (A10)
hlocal channel height/ m
Hinitial height/ m
HF homogeneity factor defined in Equation (16)
I i / o integral defined in Equation (A13)
J i / o integral defined in Equation (A13)
Kabsolute permeability/ m 2
K i / o integral defined in Equation (A13)
Llength/ m
N ch number of channel segments
ppressure/ kg m 1 s 2
Qfeed flow rate/ m 3 s 1
Q flow rate per unit length in the spanwise direction/ m 2 s 1
R e Reynolds number of the flow in the channels
S u momentum source term/ kg m 2 s 2
uaxial velocity in x-direction/ m s 1
u superficial velocity vector/ m s 1
Uinlet velocity/ m s 1
vtransverse velocity in y-direction/ m s 1
wwidth/ m
xx-coordinate/ m
yy-coordinate/ m
Greek letters
α exponent in Equation (25)
β dimensionless governing parameter in Equation (8)
γ dimensionless governing parameter in Equation (8)
δ thickness/m
Δ variation
Δ e dimensionless parameter in Equation (Appendix A)
ε porosity
Λ dimensionless governing parameter in Equation (8)
μ dynamic viscosity/ kg m 1 s 1
π ˜ 0 dimensionless parameter defined in Equation (A14)
ρ density/ kg m 3
ϕ tapering parameter in Equation (1)
Ω spatial region
Subscripts
ch channel
eelectrode
ffiber
iinlet
nindex
ooutlet
ref reference
rib flow-field rib
Superscripts
cconvective
eff effective
vviscous

Appendix A. Lubrication Model

As discussed in Section 2, conventional cell designs involve slender channels, H / L = β Λ 1 1 , with effective channel-to-channel distances that are also small compared to the channel length, w e eff / L Λ 1 1 . As a result, the flow in the channels is slender and quasi-one-dimensional, i.e., the transverse velocities are much smaller than the axial velocities, u ( w e eff / L ) U = Λ 1 U U . If in addition the reduced Reynolds number that pre-multiplies the convective term in Equation (5b) is sufficiently small, R e H / L = R e β Λ 1 1 , then all the hypotheses of Reynolds’ lubrication theory are fulfilled, which enables an approximated semi-analytical treatment of the problem.
The momentum equation in the porous electrode reduces to Darcy’s law, u = ( K e / μ ) p , which introduced in the continuity equation, · u = 0 , yields Laplace’s equation for pressure
2 p x 2 + 2 p y 2 = 0 in Ω e
The flow in the electrode is coupled with the flow in the channels through the continuity of pressures p and transverse velocities v at the channel-electrode interfaces. According to lubrication theory, the local velocity profile in the channels is given by a planar Poiseuille flow with volume flow rates per unit length in the spanwise direction
Q i / o ( x ) = h i / o 3 12 μ d p i / o d x ,
circulating through the inlet and outlet channels.
Integrating the continuity equation across the inlet and outlet channels leads to Reynolds’ lubrication equations
d d x h i 3 12 μ d p i d x = v ( x , w e eff / 2 ) in Ω i
d d x h o 3 12 μ d p o d x = v ( x , w e eff / 2 ) in Ω o
which upon substitution of the transverse velocities appearing on the right-hand-side in terms of the transverse pressure gradients in the porous electrode, yields the boundary conditions to Equation (A1) at the channel-electrode interfaces
K e μ p y = d d x h i 3 12 μ d p d x at 0 < x < L , y = w e eff / 2
K e μ p y = d d x h o 3 12 μ d p d x at 0 < x < L , y = w e eff / 2
The longitudinal pressure gradient at the inlet and outlet sections of the flow-through region, x = 0 and x = L , must be compatible with the linear pressure drop imposed by the planar Poiseuille flows that emerge upstream and downstream the inlet and outlet channels (see, e.g., Equation (A2))
p x = 12 μ Q H 3 at x = 0 and x = L , w e eff / 2 < y < w e eff / 2
This pressure gradient induces an axial velocity in the porous electrode that results in an additional volume flow rate
Q e = K e μ 12 μ Q H 3 w e eff = 12 K e w e eff H 3 Q
flowing through the system. However, this volume flow rate is small compared to the one flowing through the channels and crossing the electrode
Q e Q = 12 K e L 2 w e eff H 3 w e eff L 2 = γ Λ 2 1
Hence, the flow in the inlet and outlet regions of the porous electrode, along with the additional flow rate Q e , are anticipated to have a negligible influence on the results.
To write the problem in dimensionless form, it is convenient to introduce the modified dimensionless coordinates x ^ = x / L = β x ¯ / Λ and y ^ = y / w e eff = β y ¯ , measured with the characteristic scales of the porous electrode, while keeping the same definition for the dimensionless pressure given in Equation (7). With these definitions, the problem reduces to
1 Λ 2 2 p ˜ x ^ 2 + 2 p ˜ y ^ 2 = 0 in 0 < x ^ < 1 , 0 < y ^ < 1
subject to the boundary conditions
p ˜ x ^ = γ at x ^ = 0 , x ^ = 1 , 0 < y ^ < 1
p ˜ y ^ = Δ e d d x ^ h ^ i 3 12 d p ˜ d x ^ at 0 < x ^ < 1 , y ^ = 1 / 2
p ˜ y ^ = Δ e d d x ^ h ^ o 3 12 d p ˜ d x ^ at 0 < x ^ < 1 , y ^ = 1 / 2
where h ^ i = h i / w e eff , h ^ o = h o / w e eff , Δ e = 12 / ( γ β 3 ) , and the dimensionless pressure gradient γ is given by the pressure drop ratio defined in Equation (8).
The solution of the problem stated above involves the integration of Laplace’s Equation (A8) in a square domain with linear boundary conditions. It is then possible to use separation of variables and express the solution as an infinite series of eigenfunctions of the form
p ˜ ( x ^ , y ^ ) = π ˜ 0 y ^ γ x ^ + n = 1 C n e n π y ^ / Λ + D n e n π y ^ / Λ cos ( n π x ^ ) ,
with the associated dimensionless pressure gradient
p ˜ x ^ ( x ^ , y ^ ) = γ n = 1 n π C n e n π y ^ / Λ + D n e n π y ^ / Λ sin ( n π x ^ ) , p ˜ y ^ ( x ^ , y ^ ) = 1 + n = 1 n π Λ C n e n π y ^ / Λ D n e n π y ^ / Λ cos ( n π x ^ ) ,
where the coefficients C n and D n must be chosen to satisfy the boundary conditions (A9b) and (A9c). The boundary condition (A9a) is automatically enforced by the choice of longitudinal eigenfunctions and the inclusion of the linear term γ x ^ in Equation (A10).
An approximated solution can be obtained by truncating the summation in (A10) to N terms and taking the inner product of Equations (A9b) and (A9c) with respect to the longitudinal eigenfunction cos ( m π x ^ ) . To this end, one must substitute the truncated series from (A10) into (A9b) and (A9c), multiply the resulting expressions by cos ( m π x ^ ) , and integrate from x ^ = 0 to x ^ = 1 . Repeating the operation for m = 1 , 2 , N yields 2 N equations for the 2 N coefficients C n and D n with the form
1 Δ e m π 2 Λ C m e m π 2 Λ D m e m π 2 Λ + n = 1 N n π C n e n π 2 Λ + D n e n π 2 Λ n π I i ( m , n ) + J i ( m , n ) = K i ( m ) Δ e m = 1 , N
1 Δ e m π 2 Λ C m e m π 2 Λ D m e m π 2 Λ + n = 1 N n π C n e n π 2 Λ + D n e n π 2 Λ n π I o ( m , n ) + J o ( m , n ) = K o ( m ) Δ e m = 1 , N
in terms of the integrals
I i / o ( m , n ) = 0 1 h ^ i / o 3 12 cos ( m π x ^ ) cos ( n π x ^ ) d x ^ J i / o ( m , n ) = 0 1 h ^ i / o 2 4 d h ^ i / o d x ^ cos ( m π x ^ ) sin ( n π x ^ ) d x ^ K i / o ( m ) = 0 1 h ^ i / o 2 4 d h ^ i / o d x ^ cos ( m π x ^ ) d x ^
These integrals can be evaluated a priori with any robust quadrature integration method, such as the adaptive Cash–Karp Runge–Kutta method with variable step size used here based on embedded Runge–Kutta formulas of fourth and fifth order. The use of an accurate integrator is particularly convenient if the functions h ^ i ( x ^ ) and h ^ o ( x ^ ) present discontinuities in their first derivatives, as may be the case in piecewise linear tapering geometries. The above linear system (A12) can be solved using any standard linear algebra package to yield the values of C n and D n . Finally, the value of π ˜ 0 is determined by the condition that the dimensionless pressure is zero at the outlet section
p ˜ ( 1 , 1 / 2 ) = 0 π ˜ 0 = 1 2 + γ n = 1 C n e n π / ( 2 Λ ) + D n e n π / ( 2 Λ ) cos ( n π )
The overall pressure drop between the inlet and outlet sections of the flow-through region is given by the dimensionless pressure at the inlet
p ˜ ( 0 , 1 / 2 ) = π ˜ 0 + 1 2 n = 1 C n e n π / ( 2 Λ ) + D n e n π / ( 2 Λ ) .

Appendix B. Mesh Independency Study and Streamlines

The results of the mesh independency study are shown in Figure A1. Structured meshes were used for the simulations with a spacing in x and y directions equal to Δ x = 50 μ m and Δ y = 5 μ m . For the tapered flow field, Δ y indicates the y spacing at the inlet section, so that the y spacing at the dead-ended wall is ten times smaller for a taper ratio ϕ = 0.1 ( Δ y = 0.5 μ m ). The study was performed at the highest Reynolds number ( R e = 800 ) and γ 1 , since this case requires capturing larger gradients; the same mesh resolution was used for other cases. The channel length was set to L = 4 cm ( Λ = 26.67 ), so that the number of cells increased proportionally in the simulations with L = 10 cm ( 66.67 ). The meshes used in the study led to a relative variation in the overall pressure drop lower than 1% compared to meshes with 4 times more cells ( Δ x = 25 μ m and Δ y = 2.5 μ m ), so this degree of precision was considered high enough.
Figure A1. Variation of the overall pressure drop, Δ p ˜ , as a function of the spacing in the x and y directions, Δ x and Δ y , of the structured meshes used in the simulations of the constant cross-section and tapered flow fields. The selected meshes ( Δ x = 50 μ m and Δ y = 5 μ m ) are shown at the bottom, together with a close-up view of the dead-ended region. Electrode permeability, K e = 10 10 m 2 ( γ 1 ) , Λ = 26.67 and R e = 800 .
Processes 08 00775 g0a1
Figure A2 and Figure A3 show the streamlines for the cases γ 1 and γ 10 2 ( Λ = 26.67 ), corresponding to the constant cross-section (left panel) and tapered (right panel) flow fields at different Reynolds numbers, R e .
Figure A2. Streamlines in (left) the constant cross-section and (right) the tapered flow fields at different Reynolds numbers, R e , corresponding to an electrode permeability, K e = 10 10 m 2 ( γ 1 ) , and Λ = 26.67 .
Processes 08 00775 g0a2
Figure A3. Streamlines in (left) the constant cross-section and (right) the tapered flow fields at different Reynolds numbers, R e , corresponding to an electrode permeability, K e = 10 12 m 2 ( γ 10 2 ) , and Λ = 26.67 .
Processes 08 00775 g0a3

References

  1. Williams, J.H.; DeBenedictis, A.; Ghanadan, R.; Mahone, A.; Moore, J.; Morrow III, W.R.; Price, S.; Torn, M.S. The Technology Path to Deep Greenhouse Gas Emissions Cuts by 2050: The Pivotal Role of Electricity. Science 2012, 335, 53–59. [Google Scholar] [CrossRef] [PubMed] [Green Version]
  2. Rugolo, J.; Aziz, M.J. Electricity Storage for Intermittent Renewable Sources. Energy Environ. Sci. 2012, 5, 7151–7160. [Google Scholar] [CrossRef] [Green Version]
  3. Dennison, C.R.; Vrubel, H.; Amstutz, V.; Peljo, P.; Toghill, K.E.; Girault, H.H. Redox Flow Batteries, Hydrogen and Distributed Storage. Chimia 2015, 69, 753–758. [Google Scholar] [CrossRef] [PubMed] [Green Version]
  4. Soloveichik, G.L. Flow Batteries: Current Status and Trends. Chem. Rev. 2015, 115, 11533–11558. [Google Scholar] [CrossRef] [PubMed]
  5. Li, B.; Liu, J. Progress and Directions in Low-Cost Redox-Flow Batteries for Large-Scale Energy Storage. Natl. Sci. Rev. 2017, 4, 91–105. [Google Scholar] [CrossRef] [Green Version]
  6. Perry, M.L.; Weber, A.Z. Advanced Redox-Flow Batteries: A Perspective. J. Electrochem. Soc. 2016, 163, A5064–A5067. [Google Scholar] [CrossRef]
  7. Knehr, K.W.; Agar, E.; Dennison, C.R.; Kalidindi, A.R.; Kumbur, E.C. A Transient Vanadium Flow Battery Model Incorporating Vanadium Crossover and Water Transport through the Membrane. J. Electrochem. Soc. 2012, 159, A1446–A1459. [Google Scholar] [CrossRef]
  8. Chen, D.; Hickner, M.A.; Agar, E.; Kumbur, E.C. Optimized Anion Exchange Membranes for Vanadium Redox Flow Batteries. ACS Appl. Mater. Interfaces 2013, 5, 7559–7566. [Google Scholar] [CrossRef]
  9. Weber, A.Z.; Mench, M.M.; Meyers, J.P.; Ross, P.N.; Gostick, J.T.; Liu, Q. Redox Flow Batteries: A Review. J. Appl. Electrochem. 2011, 41, 1137–1164. [Google Scholar] [CrossRef] [Green Version]
  10. Boettcher, P.A.; Agar, E.; Dennison, C.R.; Kumbur, E.C. Modeling of Ion Crossover in Vanadium Redox Flow Batteries: A Computationally-Efficient Lumped Parameter Approach for Extended Cycling. J. Electrochem. Soc. 2016, 163, A5244–A5252. [Google Scholar] [CrossRef] [Green Version]
  11. Gokoglan, T.C.; Pahari, S.K.; Hamel, A.; Howland, R.; Cappillino, P.J.; Agar, E. Operando Spectroelectrochemical Characterization of a Highly Stable Bioinspired Redox Flow Battery Active Material. J. Electrochem. Soc. 2019, 166, A1745–A1751. [Google Scholar] [CrossRef]
  12. Nourani, M.; Dennison, C.R.; Jin, X.; Liu, F.; Agar, E. Elucidating Effects of Faradaic Imbalance on Vanadium Redox Flow Battery Performance: Experimental Characterization. J. Electrochem. Soc. 2019, 166, A3844–A3851. [Google Scholar] [CrossRef]
  13. Benjamin, A.; Agar, E.; Dennison, C.R.; Kumbur, E.C. On the Quantification of Coulombic Efficiency for Vanadium Redox Flow Batteries: Cutoff Voltages vs. State-of-charge Limits. Electrochem. Commun. 2013, 35, 42–44. [Google Scholar] [CrossRef]
  14. Gandomi, Y.A.; Aaron, D.S.; Mench, M.M. Coupled Membrane Transport Parameters for Ionic Species in All-Vanadium Redox Flow Batteries. Electrochim. Acta 2016, 218, 174–190. [Google Scholar] [CrossRef]
  15. Sum, E.; Rychcik, M.; Skyllas-Kazacos, M. Investigation of the V(V)/V(IV) System for Use in the Positive Half-Cell of a Redox Battery. J. Power Sources 1985, 16, 85–95. [Google Scholar] [CrossRef]
  16. Sun, B.; Skyllas-Kazacos, M. Modification of Graphite Electrode Materials for Vanadium Redox Flow Battery Application-I. Thermal Treatment. Electrochim. Acta 1992, 37, 1253–1260. [Google Scholar] [CrossRef]
  17. Agar, E.; Benjamin, A.; Dennison, C.R.; Chen, D.; Hickner, M.A.; Kumbur, E.C. Reducing Capacity Fade in Vanadium Redox Flow Batteries by Altering Charging and Discharging Currents. J. Power Sources 2014, 246, 767–774. [Google Scholar] [CrossRef]
  18. Gentil, S.; Reynard, D.; Girault, H.H. Aqueous Organic and Redox-Mediated Redox Flow Batteries: A Review. Curr. Opin. Electrochem. 2020, 21, 7–13. [Google Scholar] [CrossRef]
  19. Darling, R.M.; Perry, M.L. The Influence of Electrode and Channel Configurations on Flow Battery Performance. J. Electrochem. Soc. 2014, 161, A1381–A1387. [Google Scholar] [CrossRef]
  20. Nourani, M.; Zackin, B.I.; Sabarirajan, D.C.; Taspinar, R.; Artyushkova, K.; Liu, F.; Zenyuk, I.V.; Agar, E. Impact of Corrosion Conditions on Carbon Paper Electrode Morphology and the Performance of a Vanadium Redox Flow Battery. J. Electrochem. Soc. 2019, 166, A353–A363. [Google Scholar] [CrossRef]
  21. Forner-Cuenca, A.; Penn, E.E.; Oliveira, A.M.; Brushett, F.R. Exploring the Role of Electrode Microstructure on the Performance of Non-Aqueous Redox Flow Batteries. J. Electrochem. Soc. 2019, 166, A2230–A2241. [Google Scholar] [CrossRef] [Green Version]
  22. Pezeshki, A.M.; Clement, J.T.; Veith, G.M.; Zawodzinski, T.A.; Mench, M.M. High Performance Electrodes in Vanadium Redox Flow Batteries through Oxygen-Enriched Thermal Activation. J. Power Sources 2015, 294, 33–338. [Google Scholar] [CrossRef] [Green Version]
  23. Houser, J.; Pezeshki, A.; Clement, J.T.; Aaron, D.; Mench, M.M. Architecture for Improved Mass Transport and System Performance in Redox Flow Batteries. J. Power Sources 2017, 351, 96–105. [Google Scholar] [CrossRef]
  24. Wei, L.; Zhao, T.S.; Xu, Q.; Zhou, X.L.; Zhang, Z.H. In-situ investigation of hydrogen evolution behavior in vanadium redox flow batteries. Appl. Energy 2017, 190, 1112–1118. [Google Scholar] [CrossRef]
  25. Ma, K.; Zhang, Y.; Liu, L.; Xi, J.; Qiu, X.; Guan, T.; He, Y. In situ mapping of activity distribution and oxygen evolution reaction in vanadium flow batteries. Nat. Commun. 2019, 10, 5286. [Google Scholar] [CrossRef] [PubMed] [Green Version]
  26. Bevilacqua, N.; Eifert, L.; Banerjee, R.; Köble, K.; Faragó, T.; Zuber, M.; Bazylak, A.; Zeis, R. Visualization of electrolyte flow in vanadium redox flow batteries using synchrotron X-ray radiography and tomography – Impact of electrolyte species and electrode compression. J. Power Sources 2019, 439, 227071. [Google Scholar] [CrossRef]
  27. Dennison, C.R.; Agar, E.; Akuzum, B.; Kumbur, E.C. Enhancing Mass Transport in Redox Flow Batteries by Tailoring Flow Field and Electrode Design. J. Electrochem. Soc. 2016, 163, A5163–A5169. [Google Scholar] [CrossRef]
  28. Akuzum, B.; Alparslan, Y.C.; Robinson, N.C.; Agar, E.; Kumbur, E.C. Obstructed Flow Field Designs for Improved Performance in Vanadium Redox Flow Batteries. J. Appl. Electrochem. 2019, 49, 551–561. [Google Scholar] [CrossRef]
  29. Ke, X.; Prahl, J.M.; Alexander, J.I.D.; Savinell, R.F. Redox Flow Batteries with Serpentine Flow Fields: Distributions of Electrolyte Flow Reactant Penetration into the Porous Carbon Electrodes and Effects on Performance. J. Power Sources 2018, 384, 295–302. [Google Scholar] [CrossRef]
  30. Zeng, Y.; Li, F.; Lu, F.; Zhou, X.; Yuan, Y.; Cao, X.; Xiang, B. A Hierarchical Interdigitated Flow Field Design for Scale-up of High-Performance Redox Flow Batteries. Appl. Energy 2019, 238, 435–441. [Google Scholar] [CrossRef]
  31. MacDonald, M.; Darling, R.M. Modeling Flow Distribution and Pressure Drop in Redox Flow Batteries. AIChE J. 2018, 64, 3746–3755. [Google Scholar] [CrossRef]
  32. Barton, J.L.; Milshtein, J.D.; Hinricher, J.J.; Brushett, F.R. Quantifying the Impact of Viscosity on Mass-Transfer Coefficients in Redox Flow Batteries. J. Power Sources 2018, 399, 133–143. [Google Scholar] [CrossRef]
  33. Greco, K.V.; Forner-Cuenca, A.; Mularczyk, A.; Eller, J.; Brushett, F.R. Elucidating the Nuanced Effects of Thermal Pretreatment on Carbon Paper Electrodes for Vanadium Redox Flow Batteries. ACS Appl. Mater. Interfaces 2018, 10, 44430–44442. [Google Scholar] [CrossRef] [PubMed]
  34. Lisboa, K.M.; Marschewski, J.; Ebejer, N.; Ruch, P.; Cotta, R.M.; Michel, B.; Poulikakos, D. Mass Transport Enhancement in Redox Flow Batteries with Corrugated Fluidic Networks. J. Power Sources 2017, 15, 322–331. [Google Scholar] [CrossRef]
  35. Zhou, X.L.; Zhao, T.S.; An, L.; Zeng, Y.K.; Wei, L. Critical Transport Issues for Improving the Performance of Aqueous Redox Flow Batteries. J. Power Sources 2017, 339, 1–12. [Google Scholar] [CrossRef]
  36. Milshtein, J.D.; Barton, J.L.; Carney, T.J.; Kowalski, J.A.; Darling, R.M.; Brushett, F.R. Towards Low Resistance Nonaqueous Redox Flow Batteries. J. Electrochem. Soc. 2017, 164, A2487–A2499. [Google Scholar] [CrossRef]
  37. Aaron, D.S.; Liu, Q.; Tang, Z.; Grim, G.M.; Papandrew, A.B.; Turhan, A.; Zawodzinski, T.A.; Mench, M.M. Dramatic Performance Gains in Vanadium Redox Flow Batteries through Modified Cell Architecture. J. Power Sources 2012, 206, 450–453. [Google Scholar] [CrossRef]
  38. Derr, I.; Przyrembel, D.; Schweer, J.; Fetyan, A.; Langner, J.; Melke, J.; Weinelt, M.; Roth, C. Electroless Chemical Aging of Carbon Felt Electrodes for the All-Vanadium Redox Flow Battery (VRFB) Investigated by Electrochemical Impedance and X-ray Photoelectron Spectroscopy. Electrochim. Acta 2017, 246, 783–793. [Google Scholar] [CrossRef]
  39. García-Salaberri, P.A.; Gostick, J.T.; Zenyuk, I.V.; Hwang, G.; Vera, M.; Weber, A.Z. On the limitations of volume-averaged descriptions of gas diffusion layers in the modeling of polymer electrolyte fuel cells. ECS Trans. 2017, 80, 133–143. [Google Scholar] [CrossRef]
  40. Liu, J.; García-Salaberri, P.A.; Zenyuk, I.V. The impact of reaction on the effective properties of multiscale catalytic porous media: A case of polymer electrolyte fuel cells. Transport Porous Med. 2019, 128, 363–384. [Google Scholar] [CrossRef]
  41. Liu, J.; García-Salaberri, P.A.; Zenyuk, I.V. Bridging Scales to Model Reactive Diffusive Transport in Porous Media. J. Electrochem. Soc. 2020, 167, 013524. [Google Scholar] [CrossRef]
  42. Xu, Q.; Zhao, T.S.; Leung, P.K. Numerical Investigations of Flow Field Designs for Vanadium Redox Flow Batteries. Appl. Energy 2013, 105, 47–56. [Google Scholar] [CrossRef]
  43. Jyothi, L.T.; Jayanti, S. Hydrodynamic Analysis of Flow Fields for Redox Flow Battery Applications. J. Appl. Electrochem. 2014, 44, 995–1006. [Google Scholar] [CrossRef]
  44. Qi, Z.; Koenig, G.M., Jr. A carbon-free lithium-ion solid dispersion redox couple with low viscosity for redox flow batteries. J. Power Sources 2016, 323, 97–106. [Google Scholar] [CrossRef] [Green Version]
  45. Xiao, S.; Yu, L.; Wu, L.; Liu, L.; Qiu, X.; Xi, J. Broad temperature adaptability of vanadium redox flow battery–Part 1: Electrolyte research. Electrochim. Acta 2016, 187, 525–534. [Google Scholar] [CrossRef]
  46. Gerhardt, M.R.; Wong, A.A.; Aziz, M.J. The Effect of Interdigitated Channel and Land Dimensions on Flow Cell Performance. J. Electrochem. Soc. 2018, 165, A2625–A2643. [Google Scholar] [CrossRef]
  47. Davies, T.J.; Tummino, J.J. High-Performance Vanadium Redox Flow Batteries with Graphite Felt Electrodes. J. Carbon Res. 2018, 4, 8. [Google Scholar] [CrossRef] [Green Version]
  48. Gong, K.; Fang, Q.; Gu, S.; Li, S.F.Y.; Yan, Y. Nonaqueous redox-flow batteries: Organic solvents, supporting electrolytes, and redox pairs. Energy Environ. Sci. 2015, 8, 3515–3530. [Google Scholar] [CrossRef] [Green Version]
  49. Xu, A.; Zhao, T.S.; Shi, L.; Shu, J.B. Lattice Boltzmann Simulation of Mass Transfer Coefficients for Chemically Reactive Flows in Porous Media. J. Heat Transf. 2018, 140, 052601. [Google Scholar] [CrossRef] [Green Version]
  50. Kok, M.D.R.; Jervis, R.; Tranter, T.G.; Sadeghi, M.A.; Brett, D.J.L.; Shearing, P.R.; Gostick, J.T. Mass transfer in fibrous media with varying anisotropy for flow battery electrodes: Direct numerical simulations with 3D X-ray computed tomography. Chem Eng. Sci. 2019, 196, 104–115. [Google Scholar] [CrossRef] [Green Version]
  51. García-Salaberri, P.A.; Zenyuk, I.V.; Shum, A.D.; Hwang, G.; Vera, M.; Weber, A.Z.; Gostick, J.T. Analysis of representative elementary volume and through-plane regional characteristics of carbon-fiber papers: Diffusivity, permeability and electrical/thermal conductivity. Int. J. Heat Mass Tran. 2018, 127, 687–703. [Google Scholar] [CrossRef]
  52. Gostick, J.T.; Fowler, M.W.; Pritzker, M.D.; Ioannidis, M.A.; Behra, L.M. In-plane and through-plane gas permeability of carbon fiber electrode backing layers. J. Power Sources 2006, 162, 228–238. [Google Scholar] [CrossRef]
  53. Wang, Q.; Qu, Z.G.; Jiang, Z.Y.; Yang, W.W. Experimental study on the performance of a vanadium redox flow battery with non-uniformly compressed carbon felt electrode. Appl. Energy 2018, 213, 293–305. [Google Scholar] [CrossRef]
  54. Hack, J.; García-Salaberri, P.A.; Kok, M.D.R.; Jervis, R.; Shearing, P.R.; Brandon, N.; Brett, D.J.L. X-ray Micro-Computed Tomography of Polymer Electrolyte Fuel Cells: What is the Representative Elementary Area? J. Electrochem. Soc 2020, 167, 013545. [Google Scholar] [CrossRef]
  55. García-Salaberri, P.A.; Vera, M.; Iglesias, I. Modeling of the anode of a liquid-feed DMFC: Inhomogeneous compression effects and two-phase transport phenomena. J. Power Sources 2014, 246, 239–252. [Google Scholar] [CrossRef]
  56. Goshtasbi, A.; García-Salaberri, P.A.; Chen, J.; Talukdar, K.; Sanchez, D.G.; Ersal, T. Through-the-membrane transient phenomena in PEM fuel cells: A modeling study. J. Electrochem. Soc. 2019, 166, F3154–F3179. [Google Scholar] [CrossRef]
  57. Zhou, X.L.; Zhao, T.S.; Zeng, Y.K.; An, L.; Wei, L. A highly permeable and enhanced surface area carbon-cloth electrode for vanadium redox flow batteries. J. Power Sources 2016, 329, 247–254. [Google Scholar] [CrossRef]
  58. Chen, L.; He, Y.; Tao, W.Q.; Zelenay, P.; Mukundan, R.; Kang, Q. Pore-scale study of multiphase reactive transport in fibrous electrodes of vanadium redox flow batteries. Electrochim. Acta 2017, 248, 425–439. [Google Scholar] [CrossRef]
  59. Marschewski, J.; Brenner, L.; Ebejer, N.; Ruch, P.; Michel, B.; Poulikakos, D. 3D-printed fluidic networks for high-power-density heat-managing miniaturized redox flow batteries. Energy Environ. Sci. 2017, 10, 780–787. [Google Scholar] [CrossRef]
  60. Reed, D.; Thomsen, E.; Li, B.; Wang, W.; Nie, Z.; Koeppel, B.; Sprenkle, V. Performance of a low cost interdigitated flow design on a 1 kW class all vanadium mixed acid redox flow battery. J. Power Sources 2016, 306, 24–31. [Google Scholar] [CrossRef] [Green Version]
  61. Wang, C.; Zhang, Q.; Lu, J.; Shen, S.; Yan, X.; Zhu, F.; Cheng, X.; Zhang, J. Effect of height/width-tapered flow fields on the cell performance of polymer electrolyte membrane fuel cells. Int. J. Hydrogen Energy 2017, 42, 23107–23117. [Google Scholar] [CrossRef]
  62. Mancusi, E.; Fontana, É.; Augusto Ulson de Souza, A.; Guelli Ulson de Souza, S.M.A. Numerical study of two-phase flow patterns in the gas channel of PEM fuel cells with tapered flow field design. Int. J. Hydrog. Energy 2014, 39, 2261–2273. [Google Scholar] [CrossRef]
  63. Liu, H.C.; Yan, W.M.; Soong, C.Y.; Chen, F.; Chu, H.S. Reactant gas transport and cell performance of proton exchange membrane fuel cells with tapered flow field design. J. Power Sources 2006, 158, 78–87. [Google Scholar] [CrossRef]
  64. Akhtar, N.; Kerkhof, P.J.A.M. Dynamic behavior of liquid water transport in a tapered channel of a proton exchange membrane fuel cell cathode. Int. J. Hydrog. Energy 2011, 36, 3076–3086. [Google Scholar] [CrossRef]
  65. Kok, M.D.R.; Khalifa, A.; Gostick, J.T. Multiphysics Simulation of the Flow Battery Cathode: Cell Architecture and Electrode Optimization. J. Electrochem. Soc. 2016, 163, A1408–A1419. [Google Scholar] [CrossRef]
  66. Tsushima, S.; Suzuki, T. Modeling and Simulation of Vanadium Redox Flow Battery with Interdigitated Flow Field for Optimizing Electrode Architecture. J. Electrochem. Soc. 2020, 167, 020553. [Google Scholar] [CrossRef]
  67. Zhao, J.; Shahgaldi, S.; Alaefour, I.; Xu, Q.; Li, X. Gas permeability of catalyzed electrodes in polymer electrolyte membrane fuel cells. Appl. Energy 2018, 209, 203–210. [Google Scholar] [CrossRef]
  68. Pezeshki, A.M.; Sacci, R.L.; Delnick, F.M.; Aaron, D.S.; Mench, M.M. Elucidating effects of cell architecture, electrode material, and solution composition on overpotentials in redox flow batteries. Electrochim. Acta 2017, 229, 261–270. [Google Scholar] [CrossRef] [Green Version]
  69. Wong, A.A.; Aziz, M.J.; Rubinstein, S. Direct Visualization of Electrochemical Reactions and Comparison of Commercial Carbon Papers in operando by Fluorescence Microscopy Using a Quinone-Based Flow Cell. ECS Trans. 2017, 77, 153–161. [Google Scholar] [CrossRef] [Green Version]
  70. Zhang, D.; Forner-Cuenca, A.; Oluwadamilola, O.T.; Vladimir, Y.; Brushett, F.R.; Brandon, N.P.; Gu, S.; Cai, Q. Elucidating effects of cell architecture, electrode material, and solution composition on overpotentials in redox flow batteries. J. Power Sources 2020, 447, 227249. [Google Scholar] [CrossRef]
Figure 1. (top) Cell fixture and constant cross-section interdigitated flow field used in the experiments, indicating the repeating unit cell, (middle) schematic representation of the 3D geometry of a unit cell of an interdigitated flow field with constant cross-section and tapered channels, and (down) the simplified 2D along-the-channel geometry used in the CFD model. The flow direction (blue arrows), the notation used for the geometrical parameters and the coordinate system are indicated.
Processes 08 00775 g001
Figure 2. Variation of (top) the y-averaged axial velocity in the inlet channel, u ˜ i ( x ) , and (down) the y-averaged transverse velocity in the electrode, v ˜ e ( x ) , as a function of the along-the-channel coordinate, x / L , for R e = 1 –800, corresponding to (left) the constant cross-section and (right) the tapered flow fields. Electrode permeability, K e = 10 10 m 2 ( γ 1 ) , and Λ = 26.67 .
Processes 08 00775 g002
Figure 3. Variation of (top) the y-averaged pressure in the inlet and outlet channels, p ˜ i / o ( x ) , and (down) the pressure drop across the electrode, Δ p ˜ e , as a function of the along-the-channel coordinate, x / L , for R e = 1 –800, corresponding to (left) the constant cross-section and (right) the tapered flow fields. Electrode permeability, K e = 10 10 m 2 ( γ 1 ) , and Λ = 26.67 .
Processes 08 00775 g003
Figure 4. Variation of (left) the average axial velocity in the inlet channel, u ˜ i , and the homogeneity factor of the transverse velocity in the electrode, HF e , and (right) the overall pressure drop, Δ p ˜ , as a function of the Reynolds number, R e , corresponding to the constant cross-section and tapered flow fields. Electrode permeability, K e = 10 10 m 2 ( γ 1 ) , and Λ = 26.67 .
Processes 08 00775 g004
Figure 5. Variation of (top) the y-averaged axial velocity in the inlet channel, u ˜ i ( x ) , and (down) the y-averaged transverse velocity in the electrode, v ˜ e ( x ) , as a function of the along-the-channel coordinate, x / L , for R e = 1 –800, corresponding to (left) the constant cross-section and (right) the tapered flow fields. Electrode permeability, K e = 10 12 m 2 ( γ 10 2 ) , and Λ = 26.67 .
Processes 08 00775 g005
Figure 6. Variation of (top) the y-averaged pressure in the inlet and outlet channels, p ˜ i / o ( x ) , and (down) the pressure drop across the electrode, Δ p ˜ e , as a function of the along-the-channel coordinate, x / L , for R e = 1 800 , corresponding to (left) the constant cross-section and (right) the tapered flow fields. Electrode permeability, K e = 10 12 m 2 ( γ 10 2 ) , and Λ = 26.67 .
Processes 08 00775 g006
Figure 7. Variation of (left) the average axial velocity in the inlet channel, < u ˜ i > , and the homogeneity factor of the transverse velocity in the electrode, HF e , and (right) the overall pressure drop, Δ p ˜ , as a function of the Reynolds number, R e , corresponding to the constant cross-section and tapered flow fields. Electrode permeability, K e = 10 12 m 2 ( γ 10 2 ) , and Λ = 26.67 .
Processes 08 00775 g007
Figure 8. Pressure drop, Δ p , as a function of the feed flow rate, Q, measured in a VRFB with constant cross-section and ramped interdigitated flow fields, including different AvCarb carbon-paper electrodes. The black dashed line shows the predicted pressure drop across the electrode for K e = 6.5 × 10 12 m 2 ( γ 10 2 ).
Processes 08 00775 g008
Figure 9. Variation of (left) the permeability of the electrode, K e , and (right) the overall pressure drop, Δ p , as a function of the porosity of the electrode, ε , for various fiber diameters, d f . The permeability is estimated according to the Carman–Kozeny equation (Equation (24)).
Processes 08 00775 g009
Figure 10. Variation of the overall pressure drop, Δ p ˜ , as a function of R e / ( 12 Λ β 1 γ 1 ) computed with the CFD model for different values of γ and Λ , corresponding to the constant cross-section and tapered flow fields. Tapered channels with ϕ = 10 2 were considered to introduce a sharp corner similar to that used in the lubrication model.
Processes 08 00775 g010
Table 1. Geometrical parameters, fluid properties and operating conditions used in the 2D CFD model.
ParameterSymbolValue
Characteristic channel lengthL4 cm, 10 cm
Reference inlet/outlet channel heightH1 mm
Effective channel-to-channel distance w e eff 1.5 mm
Electrode permeability K e 10 13 10 10 m 2
Density ρ 10 3 kg m 3
Dynamic viscosity μ 10 3 kg m 1 s 1
Inlet velocity (volume flow rate)U ( Q )1–800 mm s 1 (1–800 mm 2 s 1 )
† An additional channel length of L = 10 cm and various electrode permeabilities K e are explored in Section 4.3.
Table 2. Overall pressure drop, Δ p ˜ , predicted by the CFD model and the lubrication model for the constant cross-section and the tapered flow fields corresponding to different values of γ and Λ . Nearly ramped channels were considered for the tapered geometry in the CFD model ( ϕ = 10 2 ) and the lubrication model ( α = 0.99 ).
γ Λ CFD Model Constant/TaperedLubrication Model Constant/TaperedRelative Variation/%
1.28 26.67 1.80/4.641.84/4.692.22/1.08
66.67 1.78/4.621.84/4.693.37/1.51
1.28 × 10 1 26.67 1.05/1.511.08/1.552.86/2.65
66.67 1.03/1.491.08/1.554.85/4.00
1.28 × 10 2 26.67 1.01/1.031.01/1.050/1.94
66.67 1.00/1.001.01/1.051.00/5.00

