Ranking Factors of Infant Formula Milk Powder Using Improved Entropy Weight Based on HDT Method and Its Application of Food Safety

College of Information Science & Technology, Beijing University of Chemical Technology, Beijing 100029, China
*
Author to whom correspondence should be addressed.
Processes 2020, 8(6), 740; https://doi.org/10.3390/pr8060740
Submission received: 5 June 2020
/
Revised: 21 June 2020
/
Accepted: 22 June 2020
/
Published: 25 June 2020
(This article belongs to the Collection Sustainable Food Processing Processes)
Abstract
:Food safety is about everyone’s health. Through risk assessment and early warning of food safety, food-related safety issues can be identified as early as possible and take timely precautions. However, the detection data of food safety are complex and non-linear, so it is necessary to find the relationship and hierarchical representation of factors affecting food safety. This paper presents an improved entropy weight based on Hasse diagram technology (HDT) method to analyze the influencing factors of food safety. The entropy weight method was used to calculate the weight of each factor index, and the relationship matrix was obtained. Then, the data of infant milk powder in China were analyzed hierarchically by the HDT method. Thus, we can obtain the multi-level structure that affects food safety. It provides an effective basis for early warning of food safety, can help government regulators to strengthen management, and urge enterprises to produce food safely.
1. Introduction
With the development of the times, food safety has increasingly become the focus of attention in today’s society. Recently, food safety incidents have emerged, which have not only seriously damaged the interests of consumers, but also had a certain impact on social stability [1,2]. In 2017, there was a massive emergency recall of vegetables containing the deadly bacterium listeria in North America, and the stores involved were all supermarkets with high credibility [3]. At the end of July of the same year, an outbreak of Salmonella infection occurred in which 47 people in 12 states of the United States were infected with Salmonella due to eating contaminated papaya, where 12 patients were hospitalized and one died. In 2018, lettuce and carrot salads sold by McDonald’s were tested to contain the Cyclosporiasis virus, causing 476 infections in 15 states and 21 people being hospitalized in the United States [4]. There have also been outbreaks of E. coli from eating Roman lettuce in several parts of the United States and Canada that infected at least 58 people in 13 states, with one death each in California and Canada, two more with hemolytic uremic syndrome, and one with renal failure. In recent years, a series of food safety incidents such as Sudan Red have also occurred in China [5,6], melamine [7] and gutter oil [8]. Three batches of unqualified samples were found in 519 batches of seven categories of food in 2017 such as dairy products, food processed products, candy products, and beverages as organized by the State Administration of Food and Drug Administration [9]. In 2018, the inspection report of a batch of full-fat milk powder purchased by MingYi Dairy Company showed that the “protein/non-fat milk solid” was 33.77%, which did not meet the requirement of (>34%) stipulated in the product standard, but the conclusion was qualified [10]. Therefore, it is very important to find out the main factors that affect food safety.
In recent years, food safety incidents have occurred frequently around the world, making food safety research a hotspot of global research. Nowadays, Bayesian network (BN) and artificial neural network (ANN) are relatively mature research methods in the field of food safety [11,12]. The ANN model is usually applied to the classification of food types and quality and risk warning [13]. However, the neural network algorithm has limited modeling ability. BN, as a probability network, is widely used in the field of risk assessment and food fraud prediction [14,15]. However, due to the high dimension and complexity of food safety data, the analytical capability of BNs is limited.
The Hasse diagram technique (HDT) is an approach based on partially ordered sets that preserve important elements of the evaluation and decision-making process. Bruggemann et al. gave a comprehensive description of HDT, and Voigt et al. compared HDT with multivariate statistical methods [16,17]. According to the evaluation standard of chemical pollution, HDT is used to represent the comparison between the pollution levels of various chemicals, and then the harm of chemicals is ranked. Halfon et al. used HDT to show the comparative relationship between the pollution levels of various chemicals according to the chemical pollution assessment criteria, and then ranked the hazards of the chemicals [18]. Carlsen et al. used a Hasse diagram to study the financial system of 81 countries, obtained the evaluation criteria of a financial system design, and then clustered and ranked each country through a Hasse chart, which provided a new perspective for the quantitative study of the system [19]. Tsakovski et al. used the Hasse diagram technique for partial ordering to explain some specific relationships between the chemical indicators analyzed and ecotoxicity tests for acute and chronic toxicity [20]. More complete sediment risk assessment was realized and more reliable sediment pollution history information was extracted [21]. Voyslavov et al. used advanced multivariate data processing methods such as Kohonen self-organizing graph (SOM) and Hasse graph (HDT) to evaluate surface water quality [22]. Kudłak et al. discussed the new application of HDT in the ecotoxicity test of groundwater quality [23]. To determine the applicability of various ecotoxicity tests, HDT was used to rank samples at different monitoring levels according to the test used. Zhou et al. used the cloud model method with entropy weight to predict rock burst classification [24]. Xiao et al. proposed a matter-element evaluation algorithm based on fuzzy entropy weight [25]. The entropy weight method was used to determine the index weight, and the closeness of the matter-element matrix was calculated. This method avoids the shortcomings of the traditional matter-element method in the calculation of artificial eigenvalue and correlation degree. Aiming at the problems existing in regional informatization ecological environment construction, Xu et al. proposed a method of regional informatization ecological environment construction based on the entropy weight modified AHP hierarchical model [26]. To the best of the authors’ knowledge, it is the first time that HDT has been applied in the agro-food sciences.
Entropy is the measure of the disorder in a system. It can be widely used to evaluate the disorder degree and effectiveness of the information for a system [27]. This method is an objective weighting method, which can reflect the utility value of index information entropy. The weight value determined by this method is more accurate and credible than that of the subjective weighting method. Hence, the weights identified by entropy are also the measurement of the disorder degree of the evaluation system. Entropy weight represents useful information of the evaluation index. The bigger the entropy weight, the more useful the information of the index. In this paper, we used the entropy weight method to quantify the food data index and to determine the weights.
Therefore, in light of the high-dimensional and complex characteristics of food safety data, HDT based on the entropy weight method is proposed to analyze the factors affecting food safety.
2. Materials and Methods
2.1. Calculate the Entropy Weight
(1) Construct the evaluation matrix
According to Equation (1), the evaluation index factors are determined.
For n samples and m indicators, X(ij) is the value of the ith sample corresponding to the jth index.
(2) Calculate the normalization matrix
The normalized matrix can be obtained according to Equation (2).
(3) Calculate entropy for all criteria using Equation (5)
where is the weight of the jth sample value in the ith index.
The entropy value of the index (column) of item j is shown in Equation (5)
where k is the Boltzmann constant, .
(4) Calculate the entropy weight wj of the j indicator by Equation (6)
We can obtain .
2.2. Hasse Diagram Technology (HDT)
Hasse diagrams visualize partial order relations between objects described by a certain number of variables. HDT is well described and this study is only described here briefly [28,29].
Using the HDT method, the ranking of objects is done with respect to variables, which is called the information basis. The processed data matrix P(A × B) contains A objects and B variables. The entry p(x) is the numerical value of the r-th variable. The pr are variables by which the objects will be ranked. The two objects s and t are comparable if:
If there is only one for which , then the objects and y cannot be compared. By using the coverage relation matrix to collect the relations between objects, the partial order set can be easily established. The matrix is an (n, n) antisymmetric matrix, where the entry axes of each pair of elements and y are given:
Therefore, if there is no element “a” in E, for which: ≤ a ≤ y, a ≠ x, y and ≠ y, then is covered by y.
- (1)
- Hasse diagrams are used to represent the order relations in matrices and are constructed as follows:
- (2)
- If ≤ y, draw x below y, and all relationship lines should be drawn in the same direction. All up or down.
- (3)
- If y and x overlap each other, then a line is drawn between the corresponding objects and the elements are comparable.
- (4)
- If ≤ y and y ≤ z, the relationship between x and y can be obtained according to transitivity rules: ≤ y. The boundary between x and y is represented by a line between and y.
For the decision problem with m schemes and n indexes, Chen gave a simple implicit weighting method, that is, the weight rank of each index satisfies w1 > w2 > … > wn, the scheme decision problem containing weight information is expressed in matrix form [30]:
x is the evaluation matrix,
If the ith row in matrix D is greater than or equal to the jth row, then the ith scheme is better than or equal to the jth scheme. Therefore, a kind of partial order relation of implication weight information is constructed. The partial order relation can not only sort the scheme, but also analyze the structural relation of the scheme. On the basis of the cumulative transformation matrix, the comparison relation matrix is obtained by row by row comparison.
Transformation formula between relational matrix and Hasse matrix is:
where A is the original matrix; B is the multiply matrix; I is the unit matrix; R is the relation matrix; and S is the Hasse matrix.
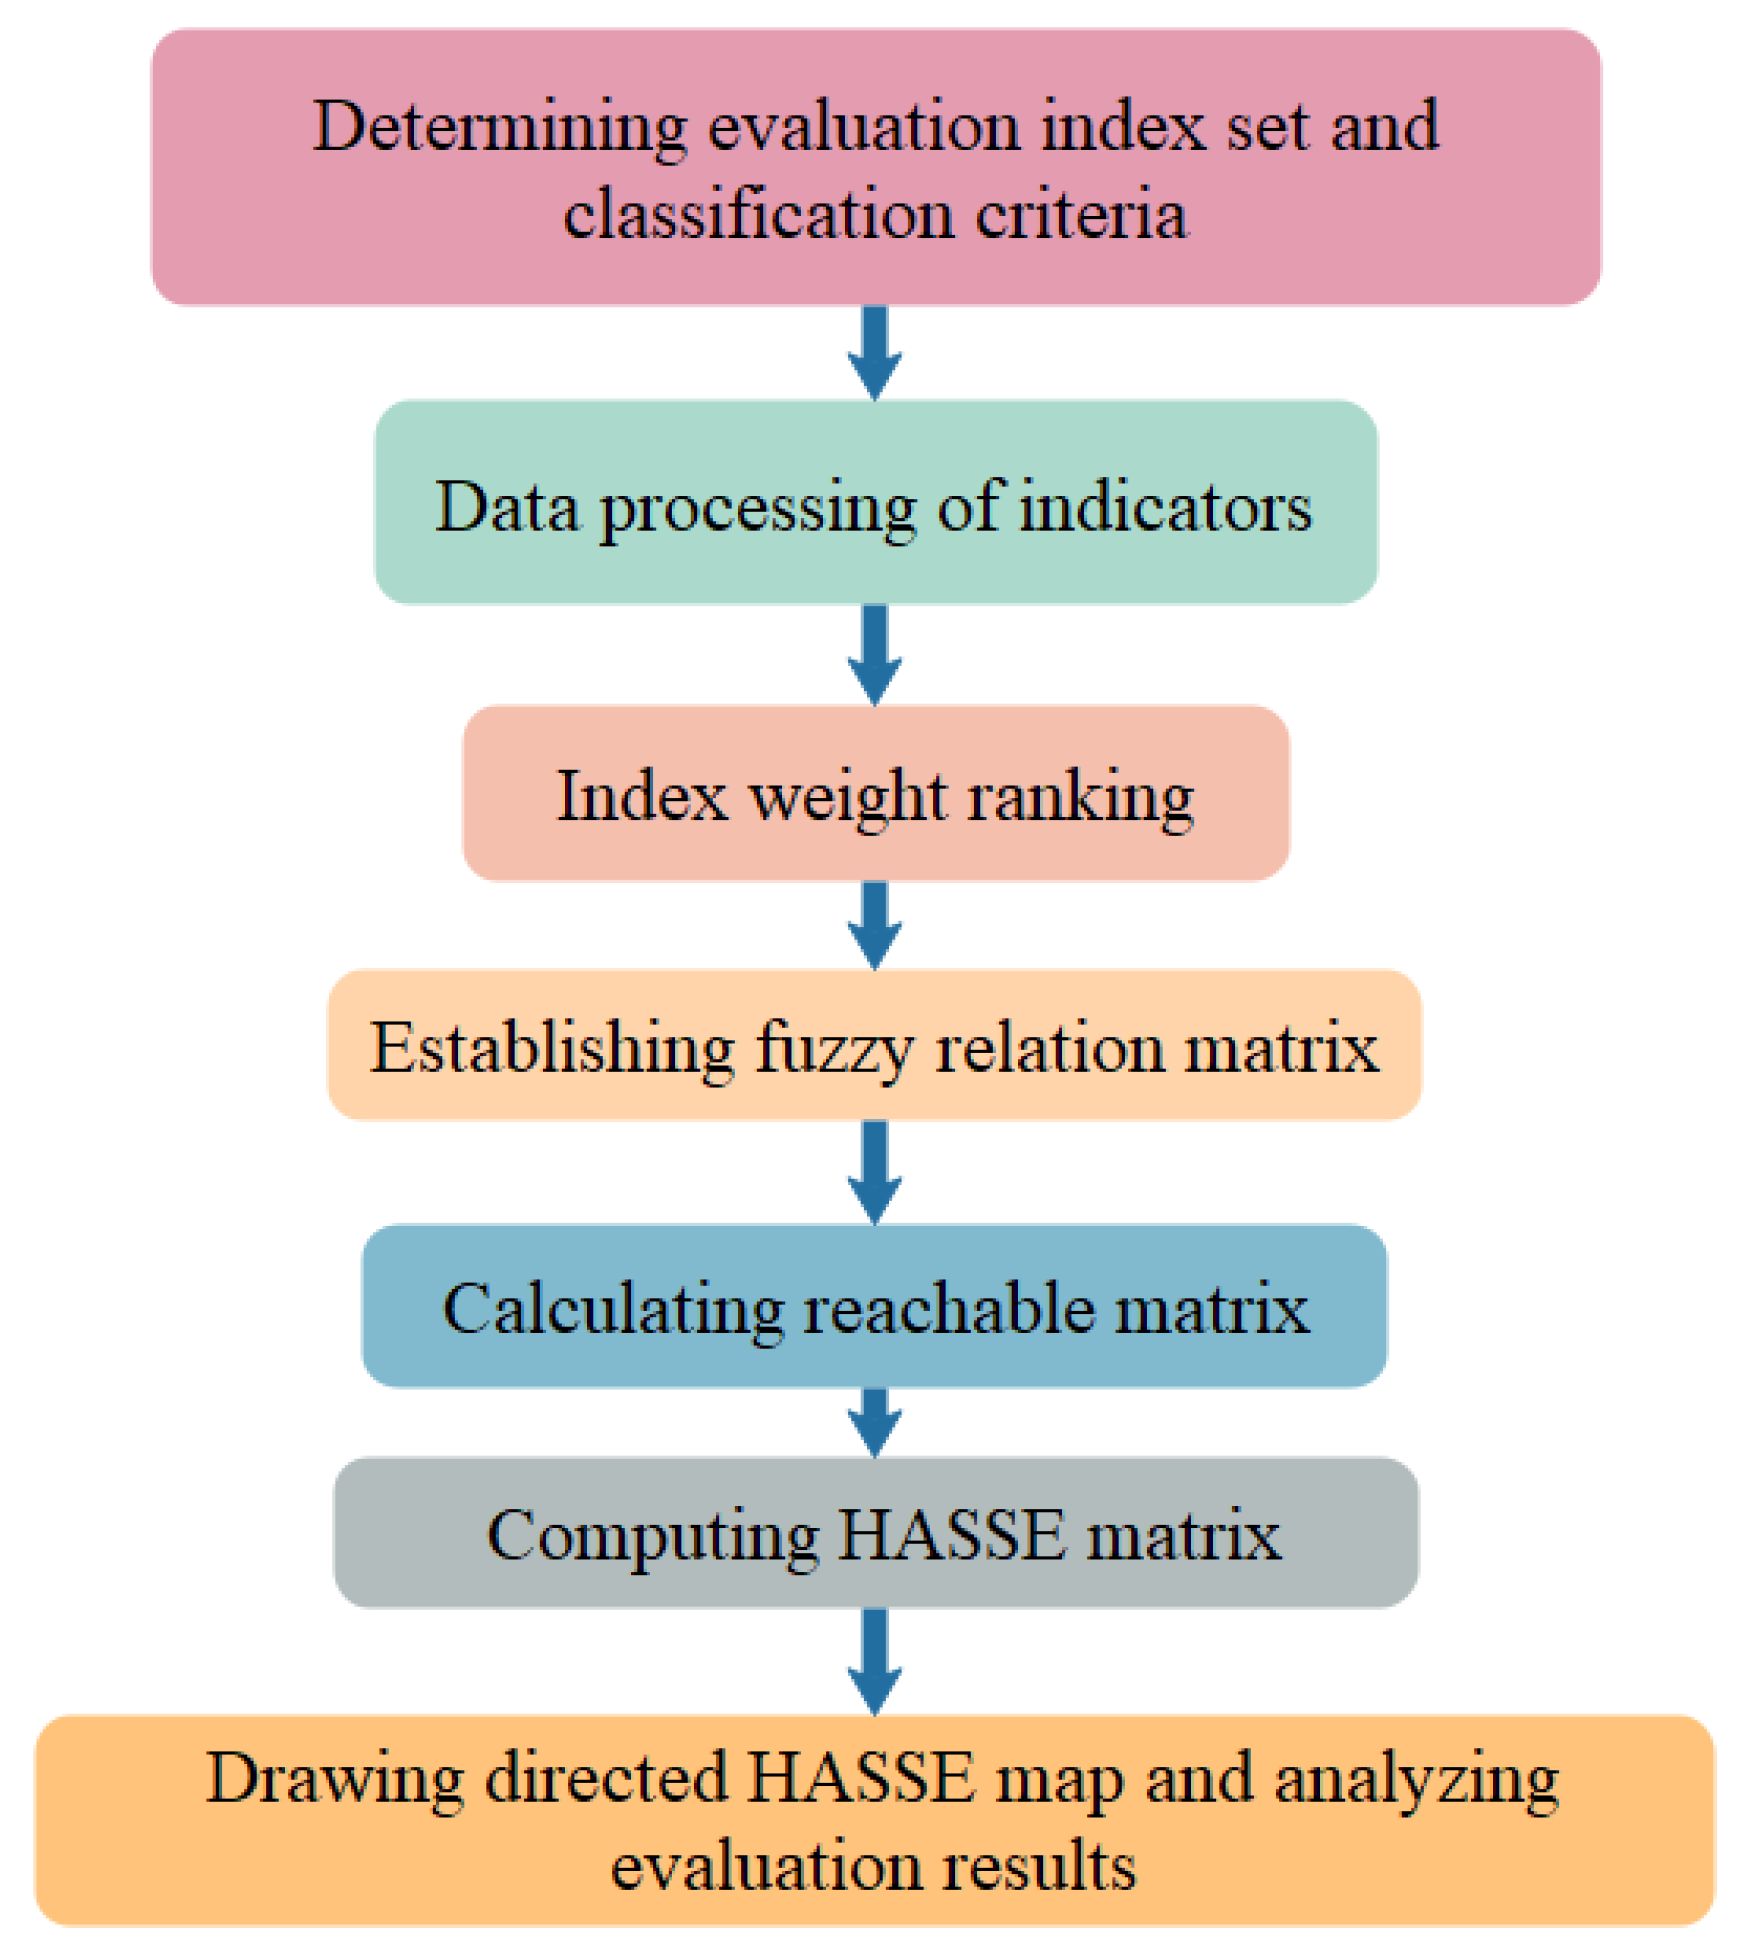
2.3. Entropy Weight-Hasse Diagram Technology (HDT) Method
The structural analysis steps of the entropy weight-HDT method are shown in Figure 1.
3. Case Study
This paper analyzed the ranking of the factors affecting food safety. The detection data were provided by China’s food inspection agency.
First, the weight of each factor was analyzed by the method of entropy weight, and the relationship matrix was obtained by directed-Hasse diagram technology (D-HDT). Then, the influencing factors were stratified and the multi-level structure of influencing food safety factors was established. This article used the test data of infant milk powder and infant formula for analysis.
3.1. Data Preprocessing
The original data collected by food inspection institutions were used. This paper selected the test data of infant milk powder for research. According to the National Food Safety Standard for infant milk powder (GB 10765–2010) [31], there are nine items including sensory requirements, raw material requirements, the physical and chemical indicators, pollutant limit, mycotoxin limit, and microbial requirements.
The collected test data contained a lot of information related to products. When processing the data, some properties that are not strongly correlated should be ignored to extract the key data. According to the above National Standards, the table of influencing factors of infant milk powder can be obtained, as shown in Table 1.
3.2. Data Integration
Due to the particularity of food data, where missing value data and outlier data will appear, it is necessary to re-integrate data when processing dairy product detection data.
Processing missing value data. These data are mainly used to monitor the chemical contaminants in food. When the contaminant content is lower than the detection limit and quantitative limit of the equipment, the measurement data are shown as “undetected”, and the data with missing values can be deleted, or the same mean interpolation, maximum likelihood estimation, regression, and other methods can be used to complete.
Handle abnormal data. The reasons for abnormal data include three parts: different data sources, wrong data collection methods, and data measurement methods. Outliers are typically handled in three ways:
- Delete records containing outliers.
- Treat the outliers as missing values and use the missing value handling method.
- Use the average to correct.
Part of the data after preprocessing of the infant milk powder is shown in Table 2.
3.3. Analytical Hierarchy of Food Safety Factors
1. Construct evaluation matrix
In this paper, 60 pre-processed infant milk powder test datasets were used. Each infant milk powder dataset contained many attributes. The normalized matrix can be obtained according to Equation (2), and is shown in Table 3.
2. Calculate the entropy weight wj of the j indicator by Equation (6) and the entropy weight is shown in Table 4.
3. Finding the relational matrix
The matrix was reordered according to the order of weight from large to small, as shown in Table 5. According to Equation (7), we can obtain the fuzzy accumulation matrix, as shown in Table 6.
4. Compare the row vectors of the cumulative transformation matrix
4. Discussion
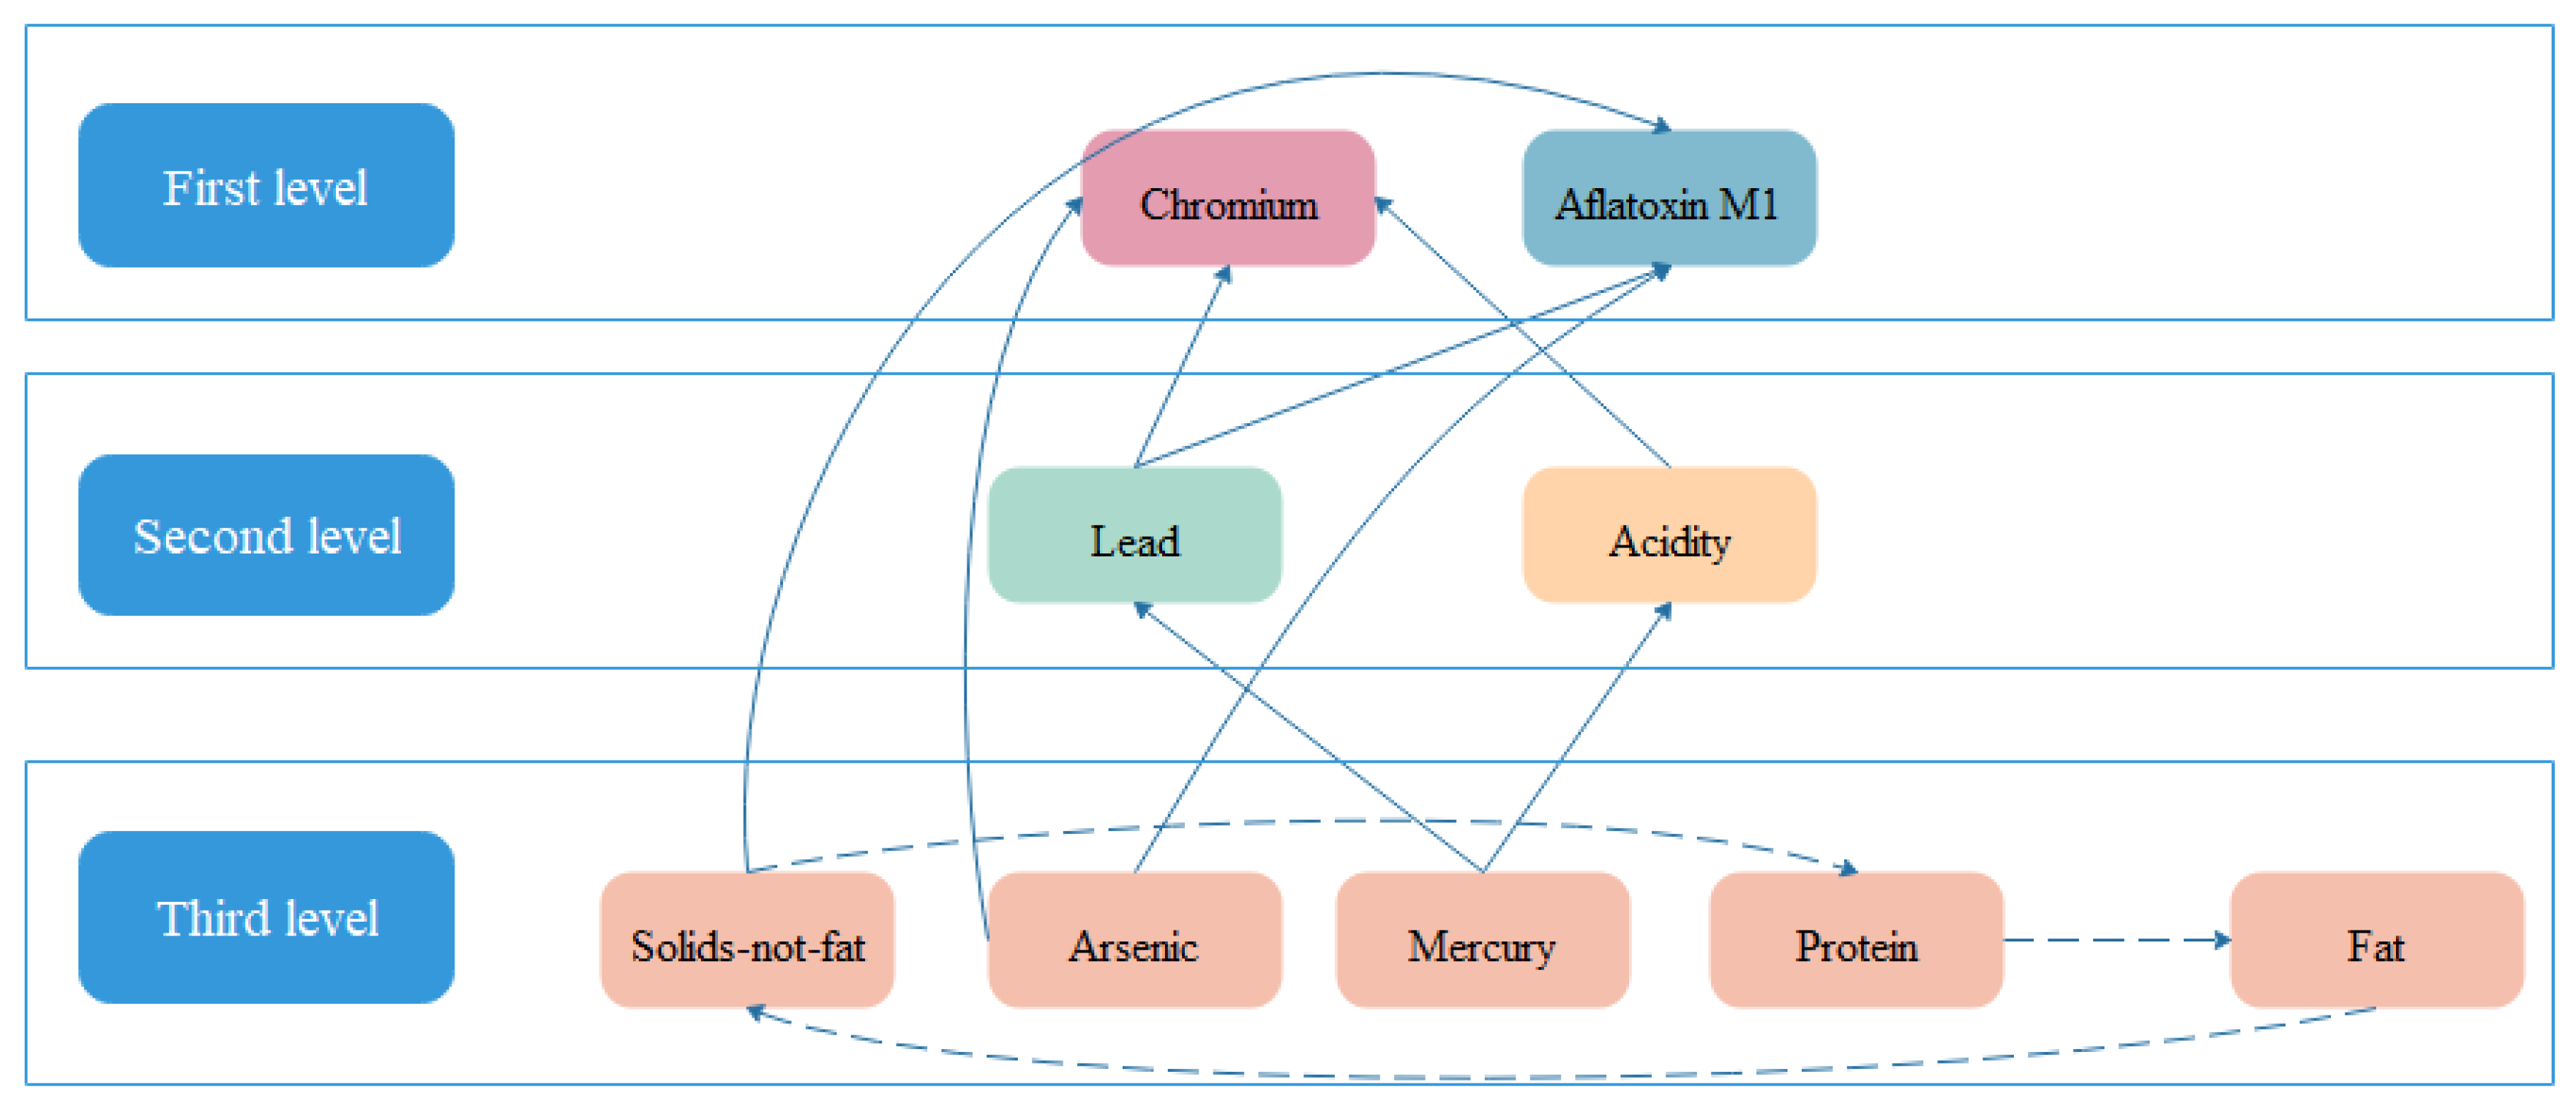
Figure 2 shows the hierarchical structure of the main factors that affect infant milk powder. The first level is chromium; protein, fat and solid-not-fat are in the second level, and these three factors are related to chromium; from the third level to the seventh level, the influencing factors are aflatoxin M1, acidity M1, lead, mercury, and arsenic. According to the hierarchy of the loop, the final hierarchy can be obtained, as shown in Figure 3. Lead and acidity in the second level are connecting factors.
The basic factors affecting the safety of infant milk powder were solids-not-fat, arsenic, mercury, protein, and fat, and the major influencing factors were chromium and aflatoxin M1, which play a key role. By analyzing the hierarchical structure of infant milk powder data, it was found that the important indicators for evaluating the quality of infant milk powder were the chromium and mycotoxin limiting factors in heavy metal pollution. The reasons for the residual heavy metal pollution in infant milk powder are described below. First of all, due to natural or man-made reasons, the environment contains heavy metals, which leads to the pollution of animal feed, and the content of heavy metals in raw milk is relatively high. The second reason is that dairy products have been contaminated during procurement, production, and transportation. Chromium pollution was the most serious heavy metal pollution, followed by acidity and lead. Mycotoxin contamination in pasteurized milk is due to aflatoxin M1 contamination in dairy cow feed. Aflatoxin M1 in dairy products mainly comes from the feed of dairy cows. Aflatoxin M1 is found in milk and dairy products when cows are fed aflatoxin B1. According to the above analysis results, the quality of raw milk should be strictly controlled during the production of sterile milk. By monitoring the planting environment, it can be ensured that the air, soil, water, and feed are not contaminated, thereby ensuring the quality of raw milk.
5. Conclusions
First, the entropy weight based on the HDT method was proposed. The entropy weight method was used to calculate the weight of each factor index, and the relationship matrix was obtained. Then, the data of infant milk powder in China were analyzed hierarchically by the HDT method.
The proposed method can focus on the main factors affecting food safety, strengthen supervision of relevant departments, and supervise the safe production of such enterprises.
Second, this method can effectively analyze the main factors affecting the safety of infant milk powder. After basic hierarchical analysis and loop optimized hierarchical structure analysis, the evaluation indexes of infant milk powder were divided into three levels. The first level consisted of the main influencing factors. By analyzing the main factors affecting the quality of infant milk powder, we found the main reasons that affected the quality of infant milk powder. At the same time, a comparative analysis of different milk powder data was performed to obtain similar influencing factors, which proved the validity of the research results. This provides a data basis for risk assessment and early warning, and can effectively reduce the occurrence of food safety incidents.
Third, the proposed method has some shortcomings. The method of artificial neural network and machine learning can be considered for optimization when determining the fuzzy matrix. An improved analytic hierarchy process for influencing factors of food safety is proposed. Selecting the test data of infant milk powder as examples, the entropy weight method was used to calculate the weight of each factor. Then, the HDT method was used to analyze the influencing factors, and a multi-level structure of influencing factors was established.
Finally, using aseptic milk data as a sample set, nine key factors that affect the safety of aseptic milk were analyzed. Through the analysis of the main influencing factors, combined with the actual production situation, an improved plan to improve the quality of infant formula milk and aseptic milk was proposed. At the same time, this method can be used as a basis for risk assessment and early warning.
In future work, we will use the ANN method and machine learning to optimize our proposed method so that it can be applied to other food safety fields.
Author Contributions
L.L. designed the study, and wrote the paper. Q.Z. reviewed and edited the manuscript. All authors have read and agreed to the published version of the manuscript.
Funding
This research received no external funding.
Conflicts of Interest
The authors declare no conflict of interest.
References
- Chiou, J.; Leung, A.H.; Lee, H.W.; Wang, W.-T. Rapid testing methods for food contaminants and toxicants. J. Integr. Agric. 2015, 14, 2243–2264. [Google Scholar] [CrossRef] [Green Version]
- Lam, H.M.; Remais, J.; Fung, M.C.; Xu, L.; Sun, S.S.M. Food Supply and Food Safety Issues in China. Lancet 2013, 381, 2044–2053. [Google Scholar] [CrossRef] [Green Version]
- Liu, G. The enlightenment of the “poisonous eggs” in Europe. Chin. J. Anim. Sci. 2017, 18, 64–65. (In Chinese) [Google Scholar]
- Tutu, B.O.; Anfu, P.O. Evaluation of the food safety and quality management systems of the cottage food manufacturing industry in Ghana. Food Control 2019, 101, 24–28. [Google Scholar] [CrossRef]
- Liu, R.; Hei, W.; He, P.; Li, Z. Simultaneous determination of fifteen illegal dyes in animal feeds and poultry products by ultra-high performance liquid chromatography tandem mass spectrometry. J. Chromatogr. B 2011, 879, 2416–2422. [Google Scholar] [CrossRef] [PubMed]
- Wang, J.; Wang, Z.; Liu, J.; Li, H.; Li, X.Q.; Li, J.; Xu, T. Nanocolloidal gold-based immuno-dip strip assay for rapid detection of Sudan red I in food samples. Food Chem. 2013, 136, 1478–1483. [Google Scholar] [CrossRef]
- Xiu, C.; Klein, K. Melamine in milk products in China: Examining the factors that led to deliberate use of the contaminant. Food Policy 2010, 35, 463–470. [Google Scholar] [CrossRef]
- Lu, F.; Wu, X. China food safety hits the “gutter”. Food Control 2014, 41, 134–138. [Google Scholar] [CrossRef]
- Guo, Z.; Bai, L.; Gong, S. Government regulations and voluntary certifications in food safety in China: A review. Trends Food Sci. Technol. 2019, 90, 160–165. [Google Scholar] [CrossRef]
- Yang, Y.; Wei, L.; Pei, J. Application of Bayesian modelling to assess food quality & safety status and identify risky food in China market. Food Control 2019, 100, 111–116. [Google Scholar]
- Geng, Z.; Shang, D.; Han, Y.; Zhong, Y. Early warning modeling and analysis based on a deep radial basis function neural network integrating an analytic hierarchy process: A case study for food safety. Food Control. 2019, 96, 329–342. [Google Scholar] [CrossRef]
- Greco, T.; Landoni, G.; Zoccai, G.B.; D’Ascenzo, F.; Zangrillo, A. A Bayesian network meta-analysis for binary outcome: How to do it. Stat. Methods Med. Res. 2016, 25, 1757–1773. [Google Scholar] [CrossRef] [PubMed]
- Koyuncugil, A.S.; Ozgulbas, N. Financial early warning system model and data mining application for risk detection. Expert Syst. Appl. 2012, 39, 6238–6253. [Google Scholar] [CrossRef]
- Williams, M.S.; Ebel, E.D.; Vose, D. Framework for Microbial Food-Safety Risk Assessments Amenable to Bayesian Modeling. Risk Anal. 2011, 31, 548–565. [Google Scholar] [CrossRef] [PubMed]
- Bouzembrak, Y.; Marvin, H.J. Prediction of food fraud type using data from Rapid Alert System for Food and Feed (RASFF) and Bayesian network modelling. Food Control. 2016, 61, 180–187. [Google Scholar] [CrossRef]
- Brüggemann, R.; Halfon, E.; Welzl, G.; Voigt, K.; Steinberg, C.E.W. Applying the Concept of Partially Ordered Sets on the Ranking of Near-Shore Sediments by a Battery of Tests. J. Chem. Inf. Comput. Sci. 2001, 41, 918–925. [Google Scholar] [CrossRef]
- Voigt, K.; Bruggemann, R.; Pudenz, S. A multi-criteria evaluation of environmental databases using the Hasse Diagram Technique (ProRank) software. Environ. Model. Softw. 2006, 21, 1587–1597. [Google Scholar] [CrossRef]
- Halfon, E.; Galassi, S.; Bruggemann, R.; Provini, A. Selection of priority properties to assess environmental hazard of pesticides. Chemosphere 1996, 33, 1543–1562. [Google Scholar] [CrossRef]
- Carlsen, L.; Bruggemann, R. Stakeholders’ Opinions: Food Sustainability as an Exemplary Case. Soc. Indic. Res. 2019, 1–14. [Google Scholar] [CrossRef]
- Tsakovski, S.; Kudlak, B.; Simeonov, V.; Wolska, L. Relationship between heavy metal distribution in sediment samples and their ecotoxicity by the use of the Hasse diagram technique. Anal. Chim. Acta 2012, 719, 16–23. [Google Scholar] [CrossRef]
- Marvin, H.J.; Bouzembrak, Y.; Janssen, E.M.; Fels-Klerx, H.J.V.D.; Van Asselt, E.D.; Kleter, G.A. A holistic approach to food safety risks: Food fraud as an example. Food Res. Int. 2016, 89, 463–470. [Google Scholar] [CrossRef] [PubMed]
- Kudlak, B.; Tsakovski, S.; Simeonov, V.; Sagajdakow, A.; Wolska, L.; Namiesnik, J. Ranking of ecotoxisity tests for underground water assessment using the Hasse diagram technique. Chemosphere 2014, 95, 17–23. [Google Scholar] [CrossRef] [PubMed]
- Voyslavov, T.; Tsakovski, S.; Simeonov, V. Surface water quality assessment using self-organizing maps and Hasse diagram technique. Chemom. Intell. Lab. Syst. 2012, 118, 280–286. [Google Scholar] [CrossRef]
- Zhou, K.-P.; Lin, Y.; Deng, H.-W.; Li, J.-L.; Liu, C.-J. Prediction of rock burst classification using cloud model with entropy weight. Trans. Nonferrous Met. Soc. China 2016, 26, 1995–2002. [Google Scholar] [CrossRef]
- Xiao, Q.; He, R.; Ma, C.; Zhang, W. Evaluation of urban taxi-carpooling matching schemes based on entropy weight fuzzy matter-element. Appl. Soft Comput. 2019, 81, 105493. [Google Scholar] [CrossRef]
- Xu, S.; Xu, D.; Liu, L. Construction of regional informatization ecological environment based on the entropy weight modified AHP hierarchy model. Sustain. Comput. Inform. Syst. 2019, 22, 26–31. [Google Scholar] [CrossRef]
- Shannon, C.E. A Mathematical Theory of Communication. Bell Syst. Tech. J. 1948, 27, 623–656. [Google Scholar] [CrossRef]
- Annoni, P.; Bruggemann, R.; Carlsen, L. A multidimensional view on poverty in the European Union by partial order theory. J. Appl. Stats. 2015, 42, 535–554. [Google Scholar] [CrossRef]
- Brtiggemann, R.; Zelles, L.; Bai, Q.Y.; Hartmann, A. Use of hasse diagram technique for evaluation of phospholipid fatty acids distribution as biomarkers in selected soils. Chemosphere 1995, 30, 1209–1228. [Google Scholar] [CrossRef]
- Chen, J.; Wang, J.; Yue, L. Evaluation model of coal spontaneous combustion probability in goaf based on partial sequence set. J. Saf. Sci. Technol. 2019, 15, 91–95. [Google Scholar]
- National Food Safety Standards of China (2010b). Infant Milk Powder (GB/10765-2010); The Ministry of Health People’s Republic of China: Beijing, China, 2010.
Figure 1.
The flowchart of the entropy weight-Hasse diagram technology (HDT).

Figure 2.
The hierarchical structure of the main influencing factors of infant milk powder.

Figure 3.
The final hierarchy structure of the main influencing factors of infant milk powder.


Table 1.
The evaluation index of infant milk powders.
| Item | Index | Test Method |
|---|---|---|
| Protein (g/100 g)≥ | 2.9 | GB5009.5 |
| Fat (g/100 g)≥ | 3.1 | GB5413.3 |
| Solid-non-fat (g/100 g)≥ | 8.1 | GB5413.39 |
| Acidity (°T) | 12–18 | GB5413.34 |
| Mercury (mg/kg) | 0.01 | GB2762 |
| Lead (mg/kg) | 0.05 | GB2762 |
| Arsenic (mg/kg) | 0.1 | GB2762 |
| Chromium (mg/kg) | 0.3 | GB2762 |
| Aflatoxin M1 (μg/kg) | 0.5 | GB2761 |
Table 2.
The data after preprocessing of the infant milk powder.
| Protein g/100 g | Fat g/100 g | Solids-Not-Fat g/100 g | Acidity °T | Mercury mg/kg | Lead mg/kg | Arsenic mg/kg | Chromium mg/kg | Aflatoxin M1 μg/kg | |
|---|---|---|---|---|---|---|---|---|---|
| x1 | 3.5 | 4.3 | 9.3 | 14 | 0.0075 | 0.01 | 0.04 | 0.006 | 0.5 |
| x2 | 3.54 | 4.1 | 9.98 | 14.16 | 0.0031 | 0.0131 | 0.0065 | 0.0002 | 0.005 |
| x3 | 3.55 | 4.07 | 9.9 | 13.72 | 0.0031 | 0.0131 | 0.0065 | 0.0002 | 0.005 |
| x4 | 3.4 | 4.3 | 9.31 | 15.2 | 0.00015 | 0.005 | 0.01 | 0.01 | 0.03 |
| x5 | 3.31 | 3.77 | 8.82 | 14.17 | 0.000899 | 0.005 | 0.01 | 0.0085 | 0.025 |
| x6 | 3.32 | 4 | 8.83 | 13.85 | 0.00015 | 0.01 | 0.01 | 0.015 | 0.025 |
| x7 | 3.24 | 3.62 | 8.87 | 15.8 | 0.00015 | 0.012 | 0.01 | 0.0069 | 0.0373 |
| x8 | 3.05 | 3.43 | 8.71 | 13.6 | 0.00015 | 0.005 | 0.01 | 0.011 | 0.03 |
| x9 | 3.45 | 3.93 | 9.54 | 14.9 | 0.00015 | 0.0054 | 0.01 | 0.0018 | 0.03 |
| x10 | 3.39 | 3.47 | 9.07 | 13.6 | 0.00015 | 0.005 | 0.01 | 0.011 | 0.03 |
Table 3.
The normalized matrix.
| Protein | Fat | Solids-Not-Fat | Acidity | Mercury | Lead | Arsenic | Chromium | Aflatoxin M1 | |
|---|---|---|---|---|---|---|---|---|---|
| x1 | 0.9000 | 1.0000 | 0.4646 | 0.1818 | 1.0000 | 0.6173 | 1.0000 | 0.3919 | 1.0000 |
| x2 | 0.9800 | 0.7701 | 1.0000 | 0.2545 | 0.4014 | 1.0000 | 0.0000 | 0.0000 | 0.0000 |
| x3 | 1.0000 | 0.7356 | 0.9370 | 0.0545 | 0.4014 | 1.0000 | 0.0000 | 0.0000 | 0.0000 |
| x4 | 0.7000 | 1.0000 | 0.4724 | 0.7273 | 0.0000 | 0.0000 | 0.1045 | 0.6622 | 0.0505 |
| x5 | 0.5200 | 0.3908 | 0.0866 | 0.2591 | 0.1019 | 0.0000 | 0.1045 | 0.5608 | 0.0404 |
| x6 | 0.5400 | 0.6552 | 0.0945 | 0.1136 | 0.0000 | 0.6173 | 0.1045 | 1.0000 | 0.0404 |
| x7 | 0.3800 | 0.2184 | 0.1260 | 1.0000 | 0.0000 | 0.8642 | 0.1045 | 0.4527 | 0.0653 |
| x8 | 0.0000 | 0.0000 | 0.0000 | 0.0000 | 0.0000 | 0.0000 | 0.1045 | 0.7297 | 0.0505 |
| x9 | 0.8000 | 0.5747 | 0.6535 | 0.5909 | 0.0000 | 0.0494 | 0.1045 | 0.1081 | 0.0505 |
| x10 | 0.6800 | 0.0460 | 0.2835 | 0.0000 | 0.0000 | 0.0000 | 0.1045 | 0.7297 | 0.0505 |
Table 4.
Entropy weight of the evaluation indicators.
| Protein | Fat | Solids-Not-Fat | Acidity | Mercury | Lead | Arsenic | Chromium | Aflatoxin M1 | |
|---|---|---|---|---|---|---|---|---|---|
| Wij | 0.0091 | 0.0366 | 0.0595 | 0.0931 | 0.2292 | 0.1238 | 0.1521 | 0.0497 | 0.2469 |
| Rank | 9 | 8 | 6 | 5 | 2 | 4 | 3 | 7 | 1 |
Table 5.
Reordering the matrix according to the order of weight.
| Aflatoxin M1 | Mercury | Arsenic | Lead | Acidity | Solids-Not-Fat | Chromium | Fat | Protein | |
|---|---|---|---|---|---|---|---|---|---|
| x1 | 1.0000 | 1.0000 | 1.0000 | 0.6173 | 0.1818 | 0.4646 | 0.3919 | 1.0000 | 0.9000 |
| x2 | 0.0000 | 0.4014 | 0.0000 | 1.0000 | 0.2545 | 1.0000 | 0.0000 | 0.7701 | 0.9800 |
| x3 | 0.0000 | 0.4014 | 0.0000 | 1.0000 | 0.0545 | 0.9370 | 0.0000 | 0.7356 | 1.0000 |
| x4 | 0.0505 | 0.0000 | 0.1045 | 0.0000 | 0.7273 | 0.4724 | 0.6622 | 1.0000 | 0.7000 |
| x5 | 0.0404 | 0.1019 | 0.1045 | 0.0000 | 0.2591 | 0.0866 | 0.5608 | 0.3908 | 0.5200 |
| x6 | 0.0404 | 0.0000 | 0.1045 | 0.6173 | 0.1136 | 0.0945 | 1.0000 | 0.6552 | 0.5400 |
| x7 | 0.0653 | 0.0000 | 0.1045 | 0.8642 | 1.0000 | 0.1260 | 0.4527 | 0.2184 | 0.3800 |
| x8 | 0.0505 | 0.0000 | 0.1045 | 0.0000 | 0.0000 | 0.0000 | 0.7297 | 0.0000 | 0.0000 |
| x9 | 0.0505 | 0.0000 | 0.1045 | 0.0494 | 0.5909 | 0.6535 | 0.1081 | 0.5747 | 0.8000 |
| x10 | 0.0505 | 0.0000 | 0.1045 | 0.0000 | 0.0000 | 0.2835 | 0.7297 | 0.0460 | 0.6800 |
Table 6.
The accumulation matrix D.
| D9 | D2 | D3 | D4 | D5 | D6 | D7 | D8 | D1 | |
|---|---|---|---|---|---|---|---|---|---|
| x1 | 1.0000 | 2.0000 | 2.0000 | 1.6173 | 0.7991 | 0.6464 | 0.8565 | 1.3919 | 1.9000 |
| x2 | 0.0000 | 0.4014 | 0.4014 | 1.0000 | 1.2545 | 1.2545 | 1.0000 | 0.7701 | 1.7501 |
| x3 | 0.0000 | 0.4014 | 0.4014 | 1.0000 | 1.0545 | 0.9916 | 0.9370 | 0.7356 | 1.7356 |
| x4 | 0.0505 | 0.0505 | 0.1045 | 0.1045 | 0.7273 | 1.1997 | 1.1346 | 1.6622 | 1.7000 |
| x5 | 0.0404 | 0.1423 | 0.2064 | 0.1045 | 0.2591 | 0.3457 | 0.6474 | 0.9516 | 0.9108 |
| x6 | 0.0404 | 0.0404 | 0.1045 | 0.7218 | 0.7309 | 0.2081 | 1.0945 | 1.6552 | 1.1952 |
| x7 | 0.0653 | 0.0653 | 0.1045 | 0.9687 | 1.8642 | 1.1260 | 0.5787 | 0.6711 | 0.5984 |
| x8 | 0.0505 | 0.0505 | 0.1045 | 0.1045 | 0.0000 | 0.0000 | 0.7297 | 0.7297 | 0.0000 |
| x9 | 0.0505 | 0.0505 | 0.1045 | 0.1539 | 0.6403 | 1.2445 | 0.7617 | 0.6828 | 1.3747 |
| x10 | 0.0505 | 0.0505 | 0.1045 | 0.1045 | 0.0000 | 0.2835 | 1.0132 | 0.7757 | 0.7260 |
Table 7.
The comparison matrix of the cumulative index.
| A1 | A2 | A3 | A4 | A5 | A6 | A7 | A8 | A9 | |
|---|---|---|---|---|---|---|---|---|---|
| A1 | 0 | 1 | 1 | 0 | 0 | 0 | 0 | 1 | 0 |
| A2 | 1 | 0 | 0 | 0 | 0 | 0 | 0 | 1 | 0 |
| A3 | 0 | 1 | 0 | 0 | 0 | 0 | 0 | 1 | 0 |
| A4 | 0 | 0 | 0 | 0 | 0 | 0 | 0 | 0 | 1 |
| A5 | 0 | 0 | 0 | 1 | 0 | 1 | 0 | 1 | 1 |
| A6 | 0 | 0 | 0 | 0 | 0 | 0 | 0 | 1 | 1 |
| A7 | 0 | 0 | 0 | 0 | 0 | 0 | 0 | 1 | 1 |
| A8 | 0 | 0 | 0 | 0 | 0 | 0 | 0 | 0 | 0 |
| A9 | 0 | 0 | 0 | 0 | 0 | 0 | 0 | 0 | 0 |
Table 8.
The reachable matrix.
| A1 | A2 | A3 | A4 | A5 | A6 | A7 | A8 | A9 | |
|---|---|---|---|---|---|---|---|---|---|
| A1 | 1 | 1 | 1 | 0 | 0 | 0 | 0 | 1 | 0 |
| A2 | 1 | 1 | 0 | 0 | 0 | 0 | 0 | 1 | 0 |
| A3 | 0 | 1 | 1 | 0 | 0 | 0 | 0 | 1 | 0 |
| A4 | 0 | 0 | 0 | 1 | 0 | 0 | 0 | 0 | 1 |
| A5 | 0 | 0 | 0 | 1 | 1 | 1 | 0 | 1 | 1 |
| A6 | 0 | 0 | 0 | 0 | 0 | 1 | 0 | 1 | 1 |
| A7 | 0 | 0 | 0 | 0 | 0 | 0 | 1 | 1 | 1 |
| A8 | 0 | 0 | 0 | 0 | 0 | 0 | 0 | 1 | 0 |
| A9 | 0 | 0 | 0 | 0 | 0 | 0 | 0 | 0 | 1 |
© 2020 by the authors. Licensee MDPI, Basel, Switzerland. This article is an open access article distributed under the terms and conditions of the Creative Commons Attribution (CC BY) license (http://creativecommons.org/licenses/by/4.0/).
Share and Cite
MDPI and ACS Style
Zhu, Q.; Liu, L. Ranking Factors of Infant Formula Milk Powder Using Improved Entropy Weight Based on HDT Method and Its Application of Food Safety. Processes 2020, 8, 740. https://doi.org/10.3390/pr8060740
AMA Style
Zhu Q, Liu L. Ranking Factors of Infant Formula Milk Powder Using Improved Entropy Weight Based on HDT Method and Its Application of Food Safety. Processes. 2020; 8(6):740. https://doi.org/10.3390/pr8060740
Chicago/Turabian StyleZhu, Qunxiong, and Lu Liu. 2020. "Ranking Factors of Infant Formula Milk Powder Using Improved Entropy Weight Based on HDT Method and Its Application of Food Safety" Processes 8, no. 6: 740. https://doi.org/10.3390/pr8060740
Note that from the first issue of 2016, this journal uses article numbers instead of page numbers. See further details here.