Article

An Improved Artificial Electric Field Algorithm for Multi-Objective Optimization

Department of Computer Science and Engineering, Thapar Institute of Engineering and Technology, Patiala 147004, Punjab, India
*
Author to whom correspondence should be addressed.
Processes 2020, 8(5), 584; https://doi.org/10.3390/pr8050584
Submission received: 28 February 2020 / Revised: 26 March 2020 / Accepted: 12 April 2020 / Published: 14 May 2020
(This article belongs to the Collection Multi-Objective Optimization of Processes)

Abstract

:
Real-world problems such as scientific, engineering, mechanical, etc., are multi-objective optimization problems. In order to achieve an optimum solution to such problems, multi-objective optimization algorithms are used. A solution to a multi-objective problem is to explore a set of candidate solutions, each of which satisfies the required objective without any other solution dominating it. In this paper, a population-based metaheuristic algorithm called an artificial electric field algorithm (AEFA) is proposed to deal with multi-objective optimization problems. The proposed algorithm utilizes the concepts of strength Pareto for fitness assignment and the fine-grained elitism selection mechanism to maintain population diversity. Furthermore, the proposed algorithm utilizes the shift-based density estimation approach integrated with strength Pareto for density estimation, and it implements bounded exponential crossover (BEX) and polynomial mutation operator (PMO) to avoid solutions trapping in local optima and enhance convergence. The proposed algorithm is validated using several standard benchmark functions. The proposed algorithm’s performance is compared with existing multi-objective algorithms. The experimental results obtained in this study reveal that the proposed algorithm is highly competitive and maintains the desired balance between exploration and exploitation to speed up convergence towards the Pareto optimal front.

1. Introduction

Most realistic problems in science and engineering consist of diverse competing objectives that require coexisting optimization to obtain a solution. Sometimes, there are several distinct alternatives [1,2] solutions for such problems rather than a single optimal solution. Targeting objectives are considered the best solutions as they are superior to other solutions in decision space. Generally, realistic multiple objective problems (MOOPs) require a long time to evaluate each objective function and constraint. In solving such realistic MOOPs, the stochastic process shows more competence and suitability than conventional methods. The evolutionary algorithms (EA) that mimic natural biological selection and evolution process are found to be an efficient approach to solve MOOPs. These approaches evidence their efficiency to solve solutions simultaneously and explore an enormous search space with adequate time. Genetic algorithm (GA) is an acclaimed approach among bio-inspired EA. In recent years, GA has been used to solve MOOPs, called non-dominated sorting genetic algorithm (NSGA-II) [3]. NSGA II is recognized as a recent advancement in multi-objective evolutionary algorithms. Besides, particle swarm optimization is another biologically motivated approach which is extended to multi-objective particle swarm optimization (MOPSO) [4,5], bare-bones multi-objective particle swarm optimization (BBMOPSO) [6], and non-dominated sorting particle swarm optimization (NSPSO) [7] to solve multi-objective optimization problems. These multi-objective approaches in one computation can produce several evenly distributed candidate solutions rather than a single solution.
However, based on Coulomb’s law of attraction electrostatic force and law of motion principle, a new algorithm called an artificial electric field algorithm [8] (AEFA) was proposed. AEFA mimics the interaction of charged particles under the attraction electrostatic force control and follows an iterative process. In a multi-dimensional search space, charged particles move towards heavier charges and converge to the heaviest charged particle. Due to the strong capability of exploration and exploitation, AEFA proved to be more robust and effective than artificial bee colony (ABC) [8], ant colony optimization (ACO) [8], particle swarm optimization (PSO) [8], and bio-geography based optimization (BBO) [8]. AEFA received growing attention from researchers in the development of a series of algorithms in several areas, such as parameter optimization [9], capacitor bank replacement [10], and scheduling [11]. There have been no research contributions found in recent years that have extended AEFA to solve MOOPs. In this paper, a modest contribution for improving AEFA to solve MOOP is made. The proposed algorithm (1) adopted the concept of “strength Pareto” for the fitness refinement of the charged particles, (2) introduced a fine-grained elitism selection mechanism based on the shift-based density estimation (SDE) approach to improve population diversity and manage the external population set, (3) utilized SDE with “strength Pareto” for density estimation, and (4) utilized bounded exponential crossover (BEX) [12] and polynomial mutation operator (PMO) [13,14] to improve global exploration, the local exploitation capability, and the convergence rate.
This paper is organized in the following way: Section 2 covers an overview of the existing literature on multi-objective optimization, Section 3 describes the preliminaries and background algorithms, Section 4 describes the proposed multi-objective method in detail, Section 5 presents results and performance of the proposed algorithm in comparison to existing optimization techniques, and Section 6 sums up the findings of this research in concluding remarks.

2. Related Work

Since a single solution cannot optimize multiple objectives at once, the problem is formulated as multi-objective optimization. Nobahari et al. [1] proposed a non-dominated sorting based gravitational search algorithm (NSGSA). Several multi-objective evolutionary algorithms (MOEAs) [15,16,17,18] are proposed in the past years. These algorithms have proven their ability to find various Pareto-optimal solutions in one single computation. Srinivas and Deb [19] proposed a non-dominated Sorting genetic algorithm (NSGA) where elitism was used to achieve a better convergence. Zitzler and Thiele [20] introduced the concept strength Pareto evolutionary algorithm (SPEA) with elitism selection. They proposed to maintain an external population to keep all the non-dominated solutions obtained in each generation. In each generation, the external and internal population were combined as a set, then based on the number of dominated solutions, all the non-dominated solutions in the combined set were assigned a fitness value. The fitness value decided the rank of the solutions that directed the exploration process towards the nondominated solution. Rudolph [21] proposed a simple elitist [22] multi-objective EA based on a comparison between the parent population and the child population. At each iteration, the candidate parent solutions were compared with the child non-dominated solution, and a final non-dominated solution set was formed to participate as the parent population for the next iteration. Although the proposed algorithm ensured the convergence to the Pareto-optimal front, it suffered from population diversity loss. All population-based evolutionary algorithms help in maintaining population diversity and convergence for multi-objective optimization [23]. In recent years, many significant contributions have been made that centered around the development of hybrid [24] algorithms and many-objective optimization algorithms [25,26]. Zhao and Cao [27] proposed an external memory-based particle swarm optimization (MOPSO) algorithm in which, besides the initial search population, two external memories were used to store global and local best individuals. Also, a geographic-based technique was utilized to maintain population diversity. Zhang and Li [28] combined traditional mathematical approaches with EA and introduced a decomposition-based MOEA, MOEA/D [29]. Martinez and Coello [30] extended MOEA/D and proposed a constraint-based selection mechanism to solve constrained MOPs. Gu et al. [31] proposed a dynamic weight design method based on the projections of non-dominated solutions to produce evenly distributed non-dominated solutions. Zhang [32] introduced a novel and efficient approach for non-dominated sorting to solve MOEAs. Chong and Qiu [33] proposed a novel opposition-based self-adaptive hybridized differential evolution algorithm to handle the continuous MOPs. Cheng et al. [34] proposed a many-objective optimization for high-dimensional objective space in which a reference vector guided an evolutionary algorithm introduced to maintain balance between diversity and convergence of the solutions. Hassanzadeh and Rouhani [35] proposed a multi-objective gravitational search algorithm (MOGSA). Yuan et al. [36] extended the gravitational search algorithm (GSA) to strength Pareto based multi-objective gravitational search algorithm (SPGSA). A review of existing literature is presented in Table 1.

Our Contribution

In this paper, an improved artificial electric field algorithm is proposed to solve multi-objective optimization problems. The concept of strength Pareto is used in the optimization process of the proposed algorithm to refine fitness assignment. The shift-based density estimation (SDE) technique with fine-grained elitism selection approach and SDE with strength Pareto are applied to improve the population diversity and density estimation, respectively. The bounded exponential crossover (BEX) operator and polynomial mutation operator (PMO) are used to reduce the possibility of the solution trapping in local optima. The proposed algorithm is validated using different benchmark functions and compared with existing multi-objective optimization techniques.

3. Preliminaries and Background

This section briefly discusses the basic concepts of multi-objective optimization, artificial electric field algorithm, shift-based density estimation technique, and recombination and mutation operators.

3.1. Multi-Objective Optimization

In general, a multiple-objective problem (MOOP) involving m diverse objectives is mathematically defined as
P = { P 1 ;   P 2 ;     ;   P d }
where P represents the solution to MOOP, and d represents the dimension of the decision boundary. A MOOP can be a minimization problem, a maximation problem, and a combination of both. The target objectives in MOOP are defined as
Minimize/Maximize:
F ( P ) = [ F i ( P ) ,   i = 1 ,   2 . m ]
Subject to the constraints:
{   G a ( P ) 0 ,   a = 1 , 2 , . A   and , H b ( P )   0 ,   b = 1 , 2 , . B
where F i ( P ) represents the i th objective function of P t h solution. An MOOP either can have no or more than one constraint, e.g., G a ( P ) and H b ( P ) are considered as the a t h and b t h optional inequality and equality constraints, respectively. A and B represent the total number of inequality and equality constraints, respectively. The MOOP is then processed to calculate the value of the solution ( P ) for which F ( P ) satisfies the desired optimization. Unlike single-objective optimization (SOO), MOOP considers multiple conflicting objectives and produces a set of solutions in the search space. These solutions are processed by the concept of Pareto dominance theory [36], defined as follows:
Considering an MOOP, a vector x = x 1 ;   x 2 ;     ;   x m shows domination on vector y = y 1 ;   y 2 ;     ;   y m , if and only if
  i   { 1 . m } ,   x i y i       i     { 1 . m }   :   x i < y i
where m represents the objective space dimension. A solution x   X (Universe) is called Pareto optimal if and only if no other solution y Y dominates it. In such a case, solutions ( x   ) are said to be non-dominated solutions. All these non-dominated solutions are composed to a set called Pareto-optimal set.

3.2. Artificial Electric Field Algorithm (AEFA)

Artificial electric field algorithm (AEFA) is a population-based meta-heuristic algorithm, which mimics the Coulomb’s law of attraction electrostatic force and law of motion. In AEFA, the possible candidate solutions of the given problem are represented as a collection of the charged particles. The charge associated with each charged particle helps in determining the performance of each candidate solution. Attraction electrostatic force causes each particle to attract towards one another resulting in global movement towards particles with heavier charges. A candidate solution to the problem corresponds to the position of charged particles and fitness function, which determines their charge and unit mass. The steps of AEFA are as follows:
Step 1. Initialization of Population.
A population of P candidate solutions (charged particles) is initialized as follows:
C P i = ( C P i 1 , C P i 2 , C P i k C P i D   ) ,     i = 1 , 2 , 3 p
where C P i k represents the position of i th charged particle in the k th dimension, and D is the dimensional space.
Step 2. Fitness Evaluation.
A fitness function is defined as a function that takes a candidate solution as input and produces an output to show how well the candidate solution fits with respected to the considered problem. In AEFA, the performance of each charged particle depends on the fitness value during each iteration. The best and worst fitness are computed as follows:
B e s t   ( T ) = m i n i = 1 n   F i t n e s s   ( T )
W o r s t   ( T ) = m a x i = 1 n   F i t n e s s   ( T )  
where F i t n e s s i   ( T ) and n represent the fitness value of i th charged particle and total number of charged particles in the population, respectively. B e s t   ( T ) , W o r s t   ( T ) represent the best fitness and the worst fitness respectively of all charged particles at time T.
Step 3. Computation of Coulomb’s Constant.
At time t, Coulomb’s constant is denoted by K ( t ) and computed as follows:
K ( t ) = K 0 exp ( α i t e r m a x i t e r )
Here, K 0 represents the initial value and is set to 100. α is a parameter and is set to 30. i t e r and m a x i t e r represent current iteration and maximum number of iterations, respectively.
Step 4. Compute the Charge of Charged Particles.
At time T , the charge of i th charged particle is represented by Q i ( T ) . It is computed based on the current population’s fitness as follows:
Q i ( T ) = q i ( T )   i = 1 n q i ( T )
where
q i ( T ) = e x p ( f i t n e s s c p i ( T ) W o r s t   ( T ) B e s t   ( T ) W o r s t ( T ) )
Here, F i t n e s s c p i is the fitness of the i th charged particle. q i ( T ) helps in determining the total charge Q i ( T ) acting on the i th charged particle at time T .
Step 5. Compute the Electrostatic Force and Acceleration of the Charged Particles.
  • The electrostatic force exerted by the j t h charged particle on the i th charged particle in the D t h dimension at time T is computed as:
    F i j D ( T ) = K ( t ) ( Q i ( T ) Q j ( T ) ) ( P j D ( T ) X j D ( T ) ) R i j ( T ) + ε
    F i D ( T ) = j = 1 ,   j i   N r a n d   ( )   F i j D ( T )
    where Q i ( T ) and Q j ( T ) are the charges of i th and j th charged particles at any time T . ε is a small positive constant, and R i j ( T ) is the distance between two charged particles i and j . P j D ( T ) and X j D ( T ) are the global best and current position of the charged particle at time T . F i D ( T ) is the net force exerted on i th charged particle by all other charged particles at time T . r a n d   ( ) is uniform random number generated in the [0, 1] interval.
  • The acceleration a i D ( T ) of i th charged particle at time T in D t h dimension is computed using the Newton law of motion as follows:
    a i D ( T ) = Q i ( T ) E i D ( T ) M i D ( T ) ,   E i D ( T ) = F i D ( T ) Q i ( T )
    where E i D ( T ) and M i D ( T ) represent respectively the electric field and unit mass of i th charged particle at time T and in D t h dimension.
Step 6. Update velocity and position of charged particles.
At time T , the position and velocity of i th charged particle in D t h dimension ae updated as follows:
v e l i D ( T + 1 ) = r a n d i   v e l i D ( T ) + a i D ( t )
C P i D ( T + 1 ) = C P i D ( T ) + v e l i D ( t )
where v e l i D ( T ) and C P i D ( T ) represent the velocity and position of the i th charged particle in D t h dimension at time T , respectively. r a n d ( ) is a uniform random number in the interval [0, 1].

3.3. Shift-Based Density Estimation

In order to maintain good convergence and population diversity, the shift-based density estimation (SDE) [37] was introduced. While determining the density of an individual ( P i ) , unlike traditional density estimation approaches, SDE shifts other individuals in the population P to a new position. The SDE utilizes the convergence comparison between current and other individuals for each objective. For example, if P j P outperforms P k   P on any objective, the corresponding objective value of P J is shifted to the position of P k on the same objective. In contrast, the value (position) of the objective remains unchanged. The process is described as
F i s d ( P j ) = { F i ( P k ) ,   if   F i ( P j ) < F i ( P k )   F i ( P j )   ,   o t h e r w i s e  
where F i s d ( P j ) represent the shifted objective value of F i ( P j ) , and F   s d ( P j ) = ( F 1 s d ( P j ) ,   F 2 s d ( P j ) ,   F 3 s d ( P j ) , F m s d ( P j ) ) represents shifted objective vector of F ( P j ) . The steps followed in density estimation are explained in Algorithm 1.
Algorithm 1 Density Estimation for Non-Domination Solutions
Input: Non-dominated solutions ( P I c 1 ,   P I c 1 , . P I c n )
Output: Density of each solution
  • Shift the position of non-dominated solutions using Equation (12)
  • Calculate the distance between two adjacent non-dominated solutions as follows:
        d P I c i ,   P I c i + 1   = j = 1 n ( F i t ( P I c i , j ) F i t ( P I c i + 1 , j ) ) 2
  • Find the k t h minimum value ( σ P I c k   ) in { d P I c i , d P I c i + 1 ,   P I c i   P   P I c i P I c i + 1 }
  • Compute S D E   ( P I c i ) = 1 σ P I c k + 2

3.4. Recombination and Mutation Operators

In AEFA, movement (acceleration) of one charged particle towards another is determined by the total electrostatic force exerted by other particles on it. In this paper, bounded exponential crossover (BEX) [12] and polynomial mutation operator (PMO) [13,14] are used with AEFA to enhance the acceleration in order to increase convergence speed further.

3.4.1. Bounded Exponential Crossover (BEX)

The performance of MOOP highly depends upon the solution generated by the crossover operator. A crossover operator produces solutions that reduce the possibility of being trapped in local optima. Bounded exponential crossover (BEX) is used to generate the offspring solutions in the interval [ P i l ,   P i u   ] . BEX involves an additional factor α that depends on the interval [ P i l ,   P i u   ] and the parent solution position. The steps to generate offspring solutions in the interval [ P i l ,   P i u   ] and related to each pair of the parent x i and y i are given in Algorithm 2.

3.4.2. Polynomial Mutation Operator (PMO)

In order to avoid premature convergence in MOOP, the mutation operator is used. In this paper, the polynomial mutation operator (PMO) is used with the proposed algorithm. PMO includes two control parameters: mutation probability of a parent solution ( p m ) and the magnitude of the expected solution ( η m ). For an individual P i ( t ) = ( P 1 ( t ) ,   P 2 ( t ) P m ( t ) ), PMO is computed as follows:
P i ( t + 1 ) = P i ( t ) + δ ( y u y d )
where P i ( t + 1 ) represents the decision variable after the mutation, and P i ( t ) represents the decision variable before the mutation. y u and y d represent the lower and upper bounds of the decision variable, respectively. δ represents a small variation obtained by
δ = { [ 2 r 2 + ( 1 2 r 2 )   ( max ( y u x i t   ,   x i t y d )   y u y d ) η m + 1 ] 1 η m + 1 1   if   r 2 0.5 1 [ 2 r 2 + ( 1 2 r 2 )   ( max ( y u x i t   ,   x i t y d )   y u y d ) η m + 1 ] 1 η m + 1 , otherwise
Here, r 2 is a random number in [0, 1] interval, which is compared with a predefined threshold value ( 0.5 ) , and η m represents the mutation distribution index.
Algorithm 2 Bounded Exponential Crossover (BEX)
Input: Parent solutions x = x 1 ,   x 2 , . x m and y = y 1 ,   y 2 , . y m   a n d   scaling   parameter   λ > 0
Output: Offspring solutions
While i m   d o
  • Generate uniformly distributed random number u i     U ( 0 , 1 )
  • Compute β i x   and   β i y which is derived by inverting the bounded exponential distribution,
      β i x   = { λ log { exp ( x i l x i   λ ( y i x i ) ) + u i   ( 1 exp ( x i l x i λ ( y i x i ) ) ) } ,   if   r i 0.5   λ   log { 1 u i   ( 1 exp ( x i l x i λ ( y i x i ) ) ) } ,   if   r i > 0.5  
    β i y   =   { λ log { exp ( x i l y i λ ( y i x i ) ) + u i   ( 1 exp ( x i l y i λ ( y i x i ) ) ) } ,   if   r i 0.5   λ   log { 1 u i   ( 1 exp ( y i l x i   λ ( y i x i ) ) ) } ,   if   r i > 0.5
    where r i     U ( 0 , 1 ) represents uniformly distributed random variable and x i l ,   x i u are the lower and upper bounds of the i t h decision variable.
  • Offspring solutions are generated using
    ε i = x i + β i x   ( y i x i ) ,   η i = y i + β i x   ( y i x i )
end while

4. Proposed Algorithm

In this section, the proposed multi-objective optimization method is described in detail. The algorithm starts with parameter initialization. Then, a population of candidate solutions is generated. Further, by computing fitness values for each candidate solution, the best solution is selected. The population is iteratively updated until the termination conditions are satisfied and the optimal solution is returned. The proposed algorithm is presented in Algorithm 3. The explanation of the symbols used in the proposed algorithm is presented in Table 2. The steps followed in the proposed algorithm are as follows.

4.1. Population Generation

In the proposed algorithm, there are two populations, i.e., searching population ( P n ) and the external population ( P I c * ) . The searching population, which contains initial candidate solutions, computes the non-dominated solutions and stores them in the external population. The process is performed iteratively.
Algorithm 3 Proposed Multi-Objective Optimization Algorithm
Input: Searching population of size ( n ) , External Population of size ( m )
Output: Non-dominated set of charged particles ( N D C p )
Begin
  • Initialize searching   population   (   P n   ) of charged particles C P .
  • Initialize external population P * ¯ = and set iteration counter I c = 1
While ( I c < I c m a x )
        For each C P   P I c   U   P I c * ¯  
  • Compute the fitness F ( C P ) using Equation (15)
  • Computer the density using shift-based density estimation (Section 3.3)
        end for
        For each C P   P I c   U   P I c * ¯ do
      If F ( C P ) < 1 then
       P I c + 1 * = P I c + 1 *   U   { C P }
     end if
        end for
        If ( P I c + 1 * < m ) then
      P I c + 1 ¯ = P I c + 1 ¯   U   ( ( P I c U   P I c * ) [ 1 : m | P I c + 1 ¯ | ] )
        else
            delete non-dominated solution from P I c * using Equation (17) as described in Section 4.3
          end if
  • Select charged particles (CP) into the mating pool P I c + 1 from P I c     U   P I c + 1 *
  • Evaluate charge, update the velocity and position of P I C + 1 as defined in Section 3.2 and obtain the new position of C P
  • Apply crossover and mutation operator (using Section 3.4) on population P I c + 1
        end while
        For each C P   P t + 1 ¯ do
           If C P is a non-dominated solution then
      N D C p = N D C p * { C P }   ;
           end if
         end for

4.2. Fitness Evaluation

The traditional AEFA is not suitable for the MOOPs due to the definition of charge. According to Equations (7) and (8), the charge of a particle is related to fitness value. Thus, the multi-objective fitness assignment used in the SPEAII [38] is introduced to evaluate the charge of the AEFA algorithm for two or more objectives in MOOPs. The multi-objective fitness assignment of the proposed algorithm is calculated by using the formula as follows:
F ( i ) = R ( i ) + D ( i ) ,   R ( i ) = j   P t U   P t s ( j )   and   s ( j ) |   {   i | i   P t U   P t *   } |
where F ( i ) is the fitness value of the charged particle i . R ( i ) means the raw fitness value of the charged particle i , and D ( i ) represents the additional density information of the charged particle i . The raw fitness exhibits the strength of each charged particle by assigning a rank to each charged particle. In MOOP, to avoid such conditions where more than more solution (charged particle) shows a similar rank, an additional density measure is used for distinguishing the difference between them. The SDE technique is used to describe the additional density (crowding distance) of i .

4.3. A Fine-Grained Elitism Selection Mechanism

Elitism selection is a critical process in multi-objective optimization. It helps in the determination of the best fit solution for the next generation. The selection process affects the Pareto front output. If a better solution is lost in the selection, it cannot be found again. The selection of a better solution that dominates other solutions helps in removing worse solutions. In this study, a modified fine-grained elitism selection method that utilizes the shift-based density estimation (SDE) approach is proposed to improve population diversity. Similarly, to the non-dominated solution selection mechanism, the proposed method also selects the non-dominated solution as follows:
P I C + 1 * = {   C P | C P   P n   U   P I C + 1 * }   F ( C P ) < 1
As the external population size ( m ) is fixed, the non-dominated solutions are copied to the external population set ( P I C + 1 * ) until the current size of the external population is less than m . In contrast, the non-dominated solutions ( P I C + 1 * m ) are discarded from the external population set. In order to discard solutions and maintain diversity, the proposed method deletes the solution with the most crowded region computed using the SDE approach, as described in Section 3.3. The steps used to compute the shared crowding distance are as follows.
  • The distance between two adjacent particles P I c and P I C + 1 * is computed as Algorithm 1.
  • For each particle, an additional density estimation (shared crowding distance) is computed as follows:
    σ c r o w d   = S D E   ( P I c * ) | m |
When the size of the non-dominated solution size exceeds external population size (i.e., P I c * > m ) , the proposed method selects the k t h charged particle from the external population ( P I c * ) using Equation (17) and deletes it. This process is performed iteratively until | P I c * | = m .
σ k c r o w d   > i = 1 | P I c * | σ c r o w d ( P I c * ) i | m |  
Here, the solution (charged particle) whose density is greater than the average shared crowing distance of all non-dominated solutions in the external population is considered as the worst solution and is deleted from the external population set. Then, the average crowding distance is recomputed and used in a similar manner until P I c * = m .

5. Experimental Results and Discussion

This section is further divided into three sub-sections. Section 5.1 discusses the performance comparison of the AEFA with existing evolutionary approaches. Section 5.2 gives a performance comparison of the proposed algorithm with existing multi-objective optimization algorithms, and Section 5.3 presents a sensitivity analysis of the proposed algorithm.

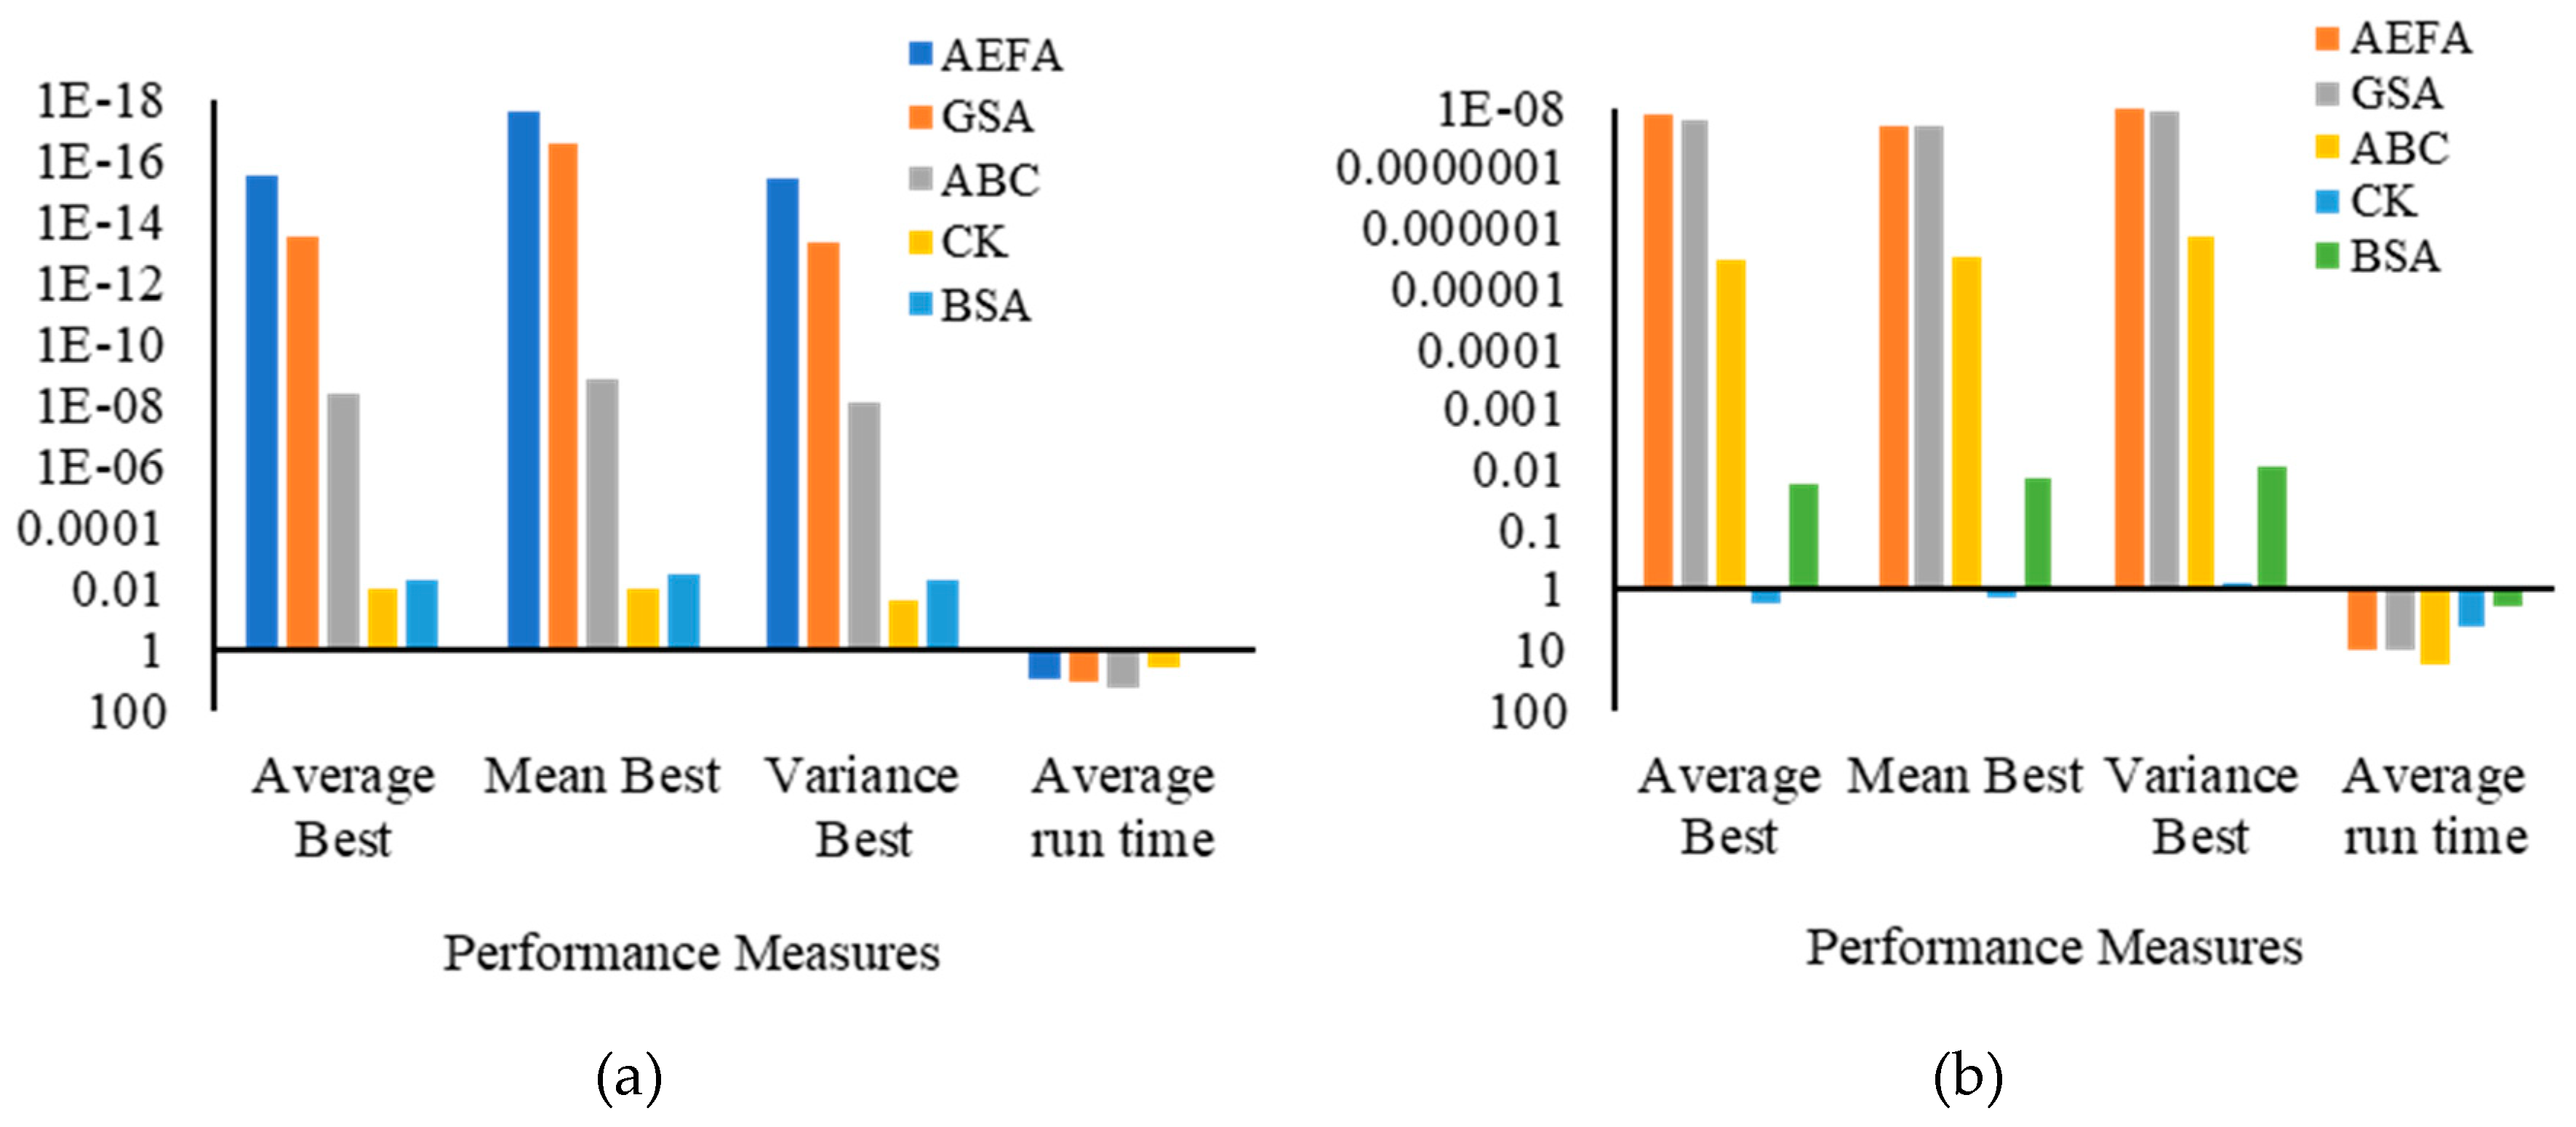
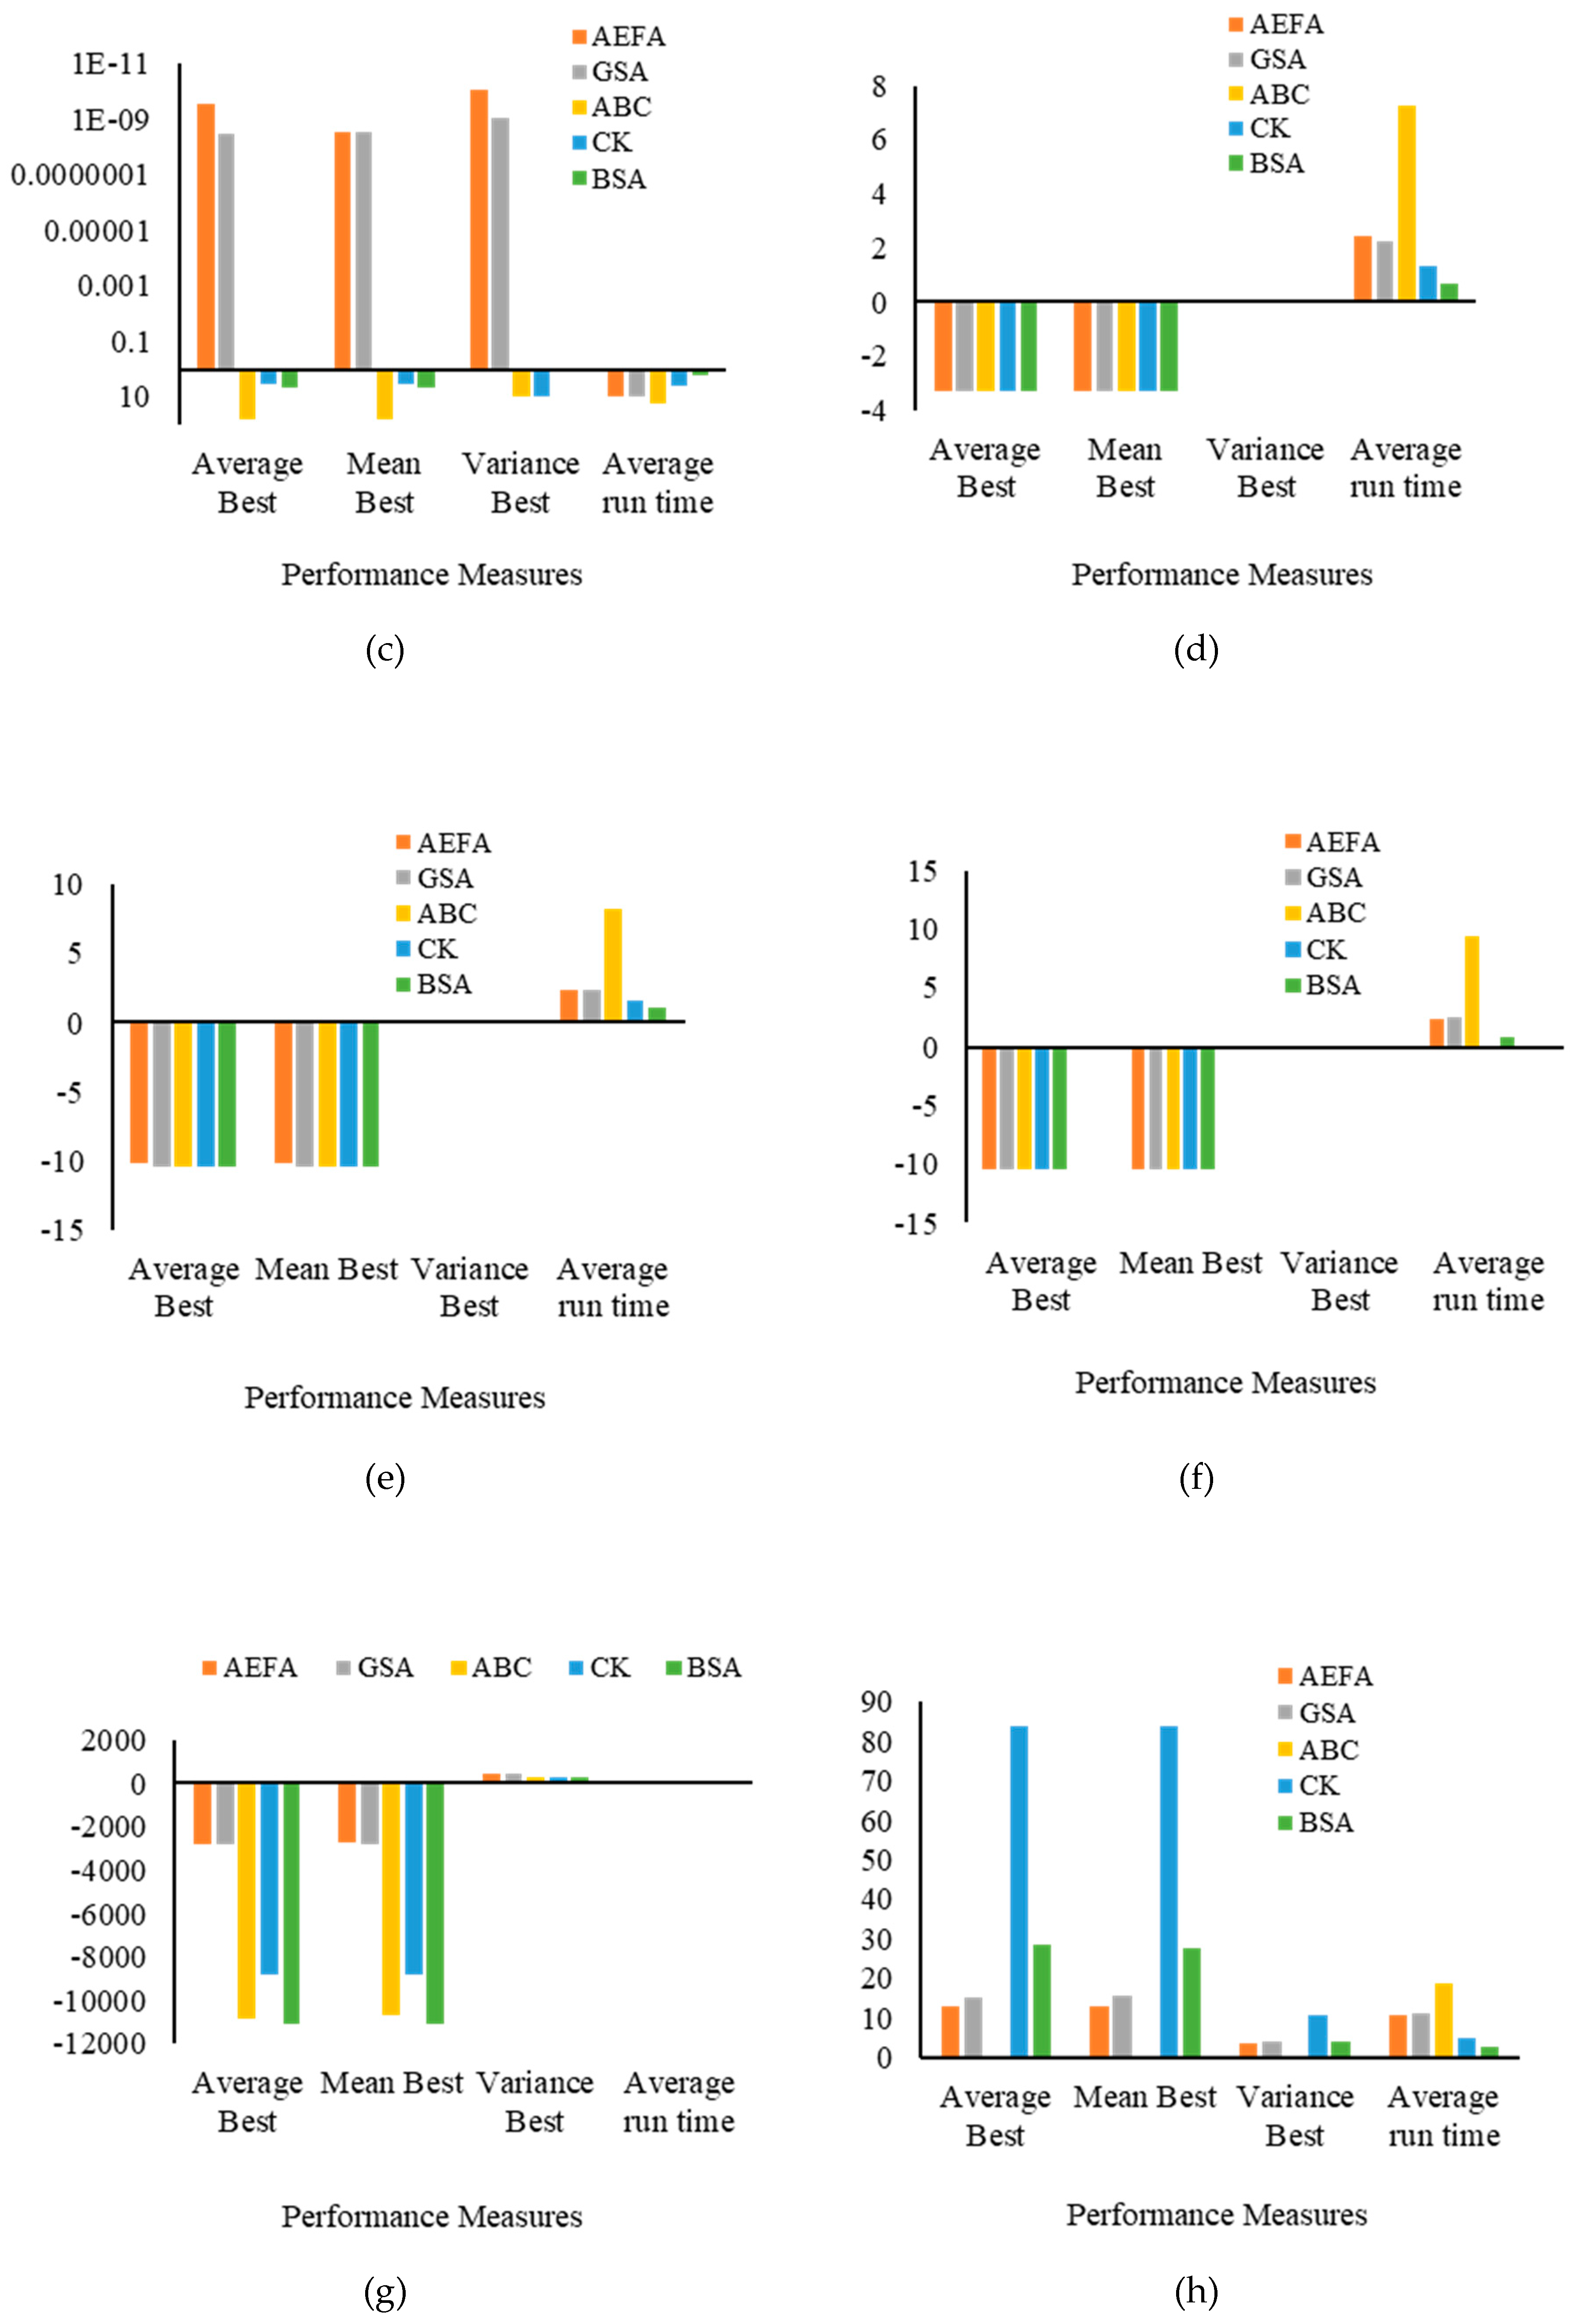
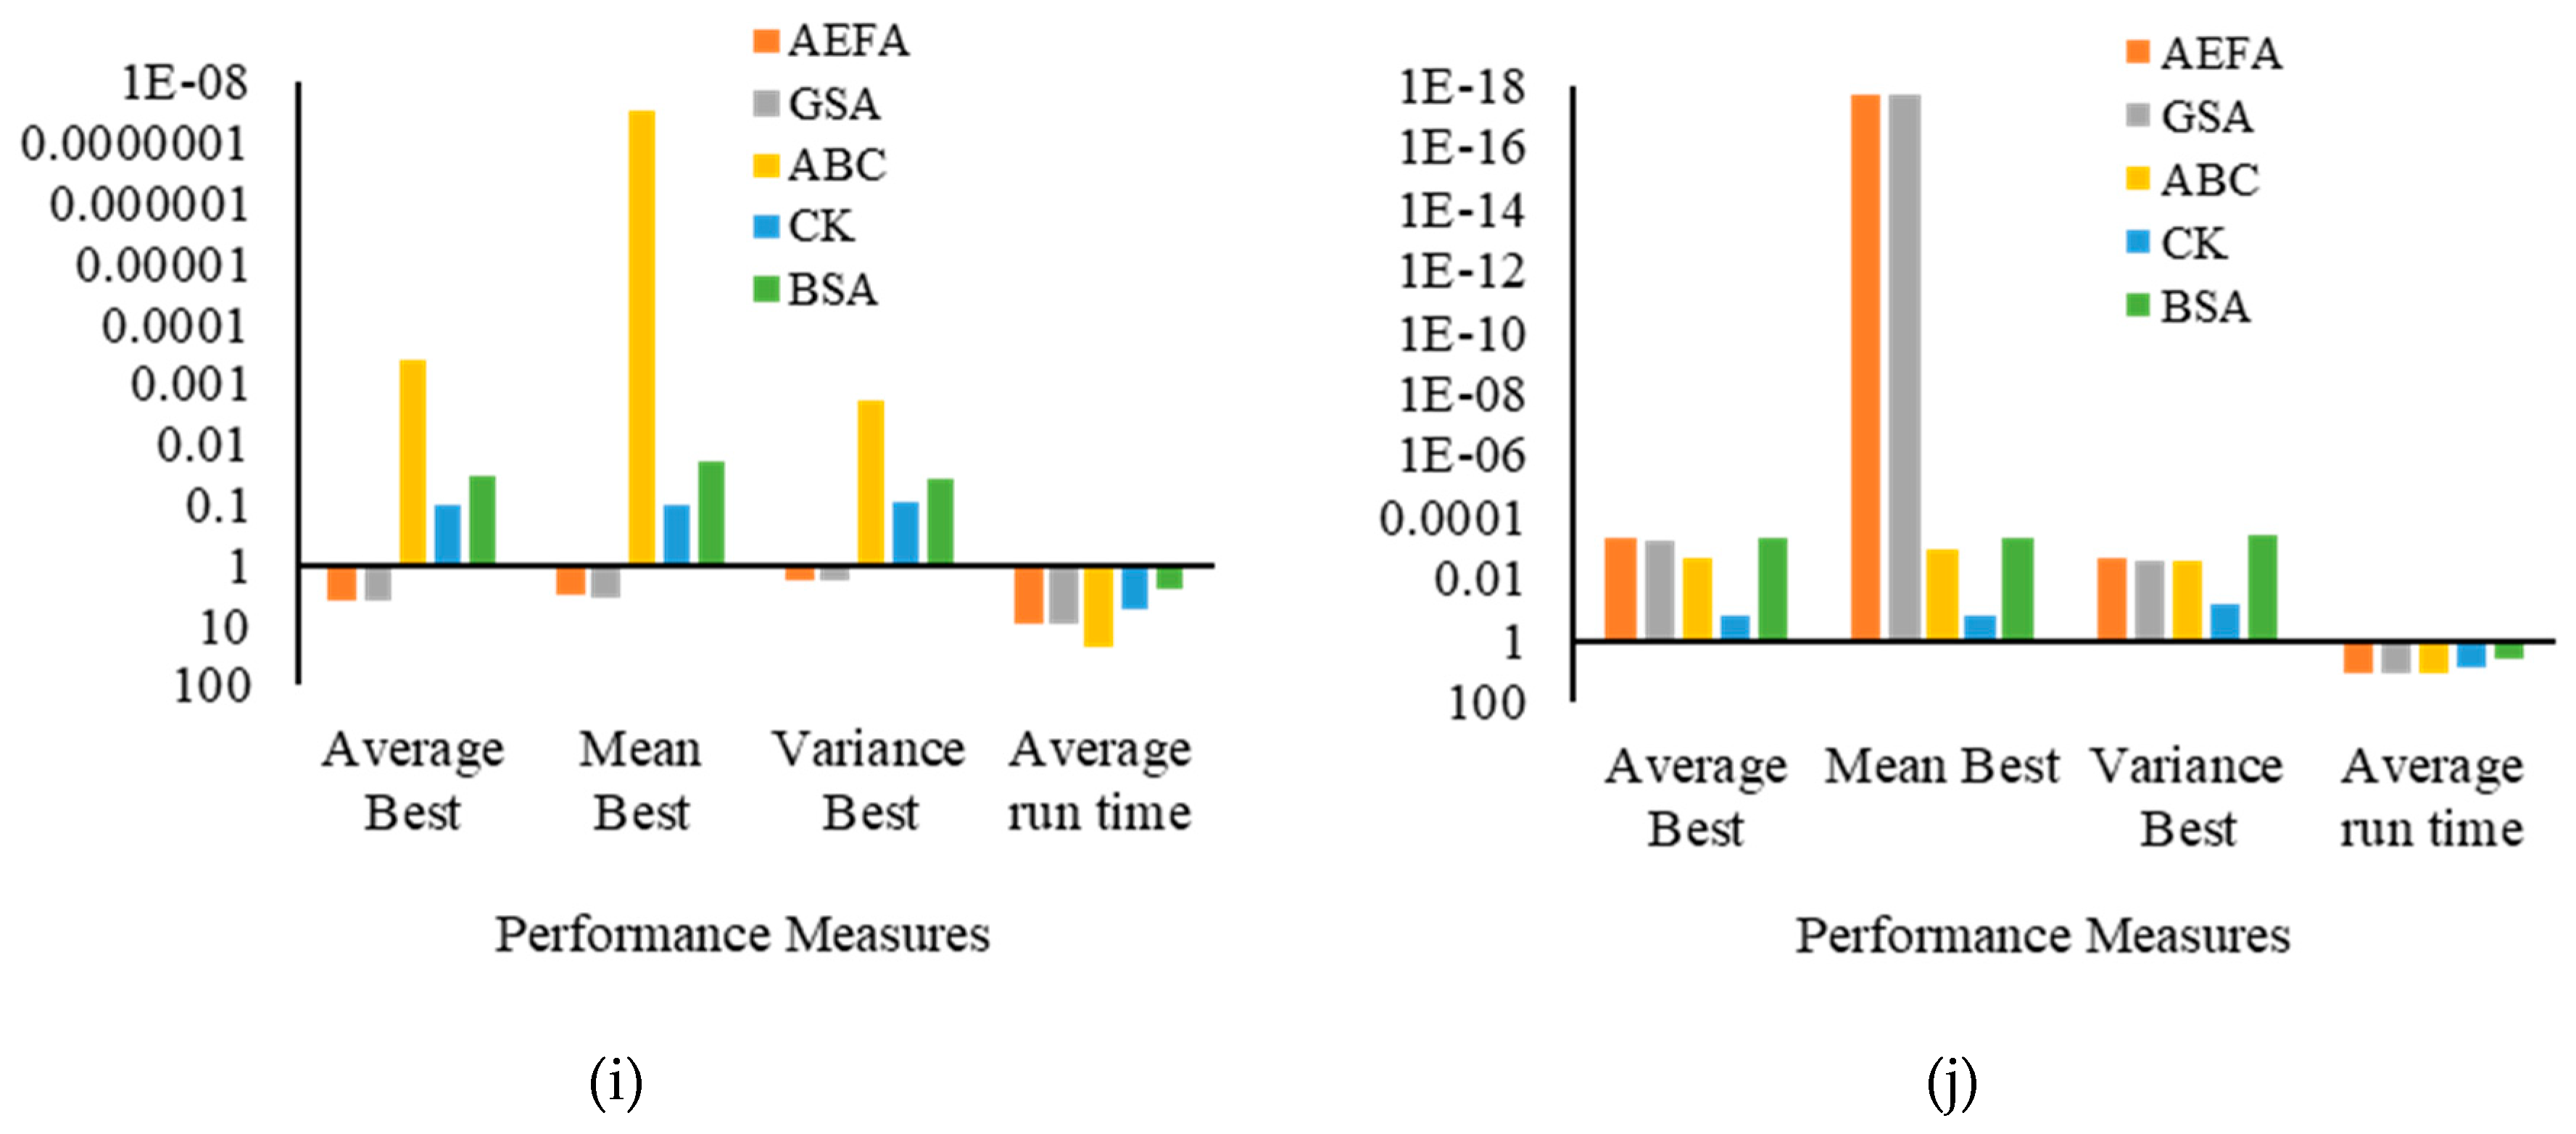
5.1. Performance Comparison of the AEFA With Existing Evolutionary Approaches

At first, the performance of AEFA is evaluated on 10 benchmark functions. These benchmarks are taken as three unimodal (UM), three low-dimensional multimodal (LDMM), and four high-dimensional multimodal (HDMM) functions. All these functions belong to the minimization problem. The description of the benchmark functions is given in Table 3. Then, the performance of the AEFA is compared with existing evolutionary approaches. For performance comparison, four statistical performance indices are considered: average best-so-far solution, mean best-so-far solution, the variance of the best-so-far solution, and average run-time. During each iteration, the algorithm updates the best-so-far solution and records running time. The performance indices are computed by analyzing the obtained best-so-far solution and running time.

5.1.1. Parameter Setting

For experimental analysis, the parameters, i.e., population size ( P n , P m ), the maximum Coulomb’s constant ( K 0 ) , and the maximum number of iterations ( I c m a x ) , are initialized in Table 4.

5.1.2. Results and Discussion

The performance of AEFA is compared with existing evolutionary optimization algorithms: backtracking search algorithm (BSA) [36], cuckoo search algorithm (CK) [36], artificial bee colony (ABC) algorithm [36], and gravitational search algorithm (GSA) [36]. The results are demonstrated in Table 5 and Figure 1. Figure 1 presents the difference between the AEFA and other existing algorithms based on the values obtained by performance measures on benchmark functions. For a better representation, all the results (except Figure 1d–h) are formulated in logarithm scale (base 10). A larger logarithmic value represents the minimum values of performance measures obtained for different functions. The results in Table 5 and Figure 1 demonstrate that the AEFA obtained minimum values for all UM and LDMM functions. The obtained values competed with the values of GSA and outperformed the value of ABC, CK, and BSA, which reveals that AEFA maintains a balance between exploration and exploitation and performs better in comparison to existing approaches. However, for HDMM (except benchmark F10) functions, AEFA performs worse as compared to ABC, and BSA, which implies that the AEFA suffers from the loss of diversity resulting in premature convergence in solving complex HDMM problems. It is concluded from results that the original AEFA faces challenges in solving higher-dimensional multimodal problems.

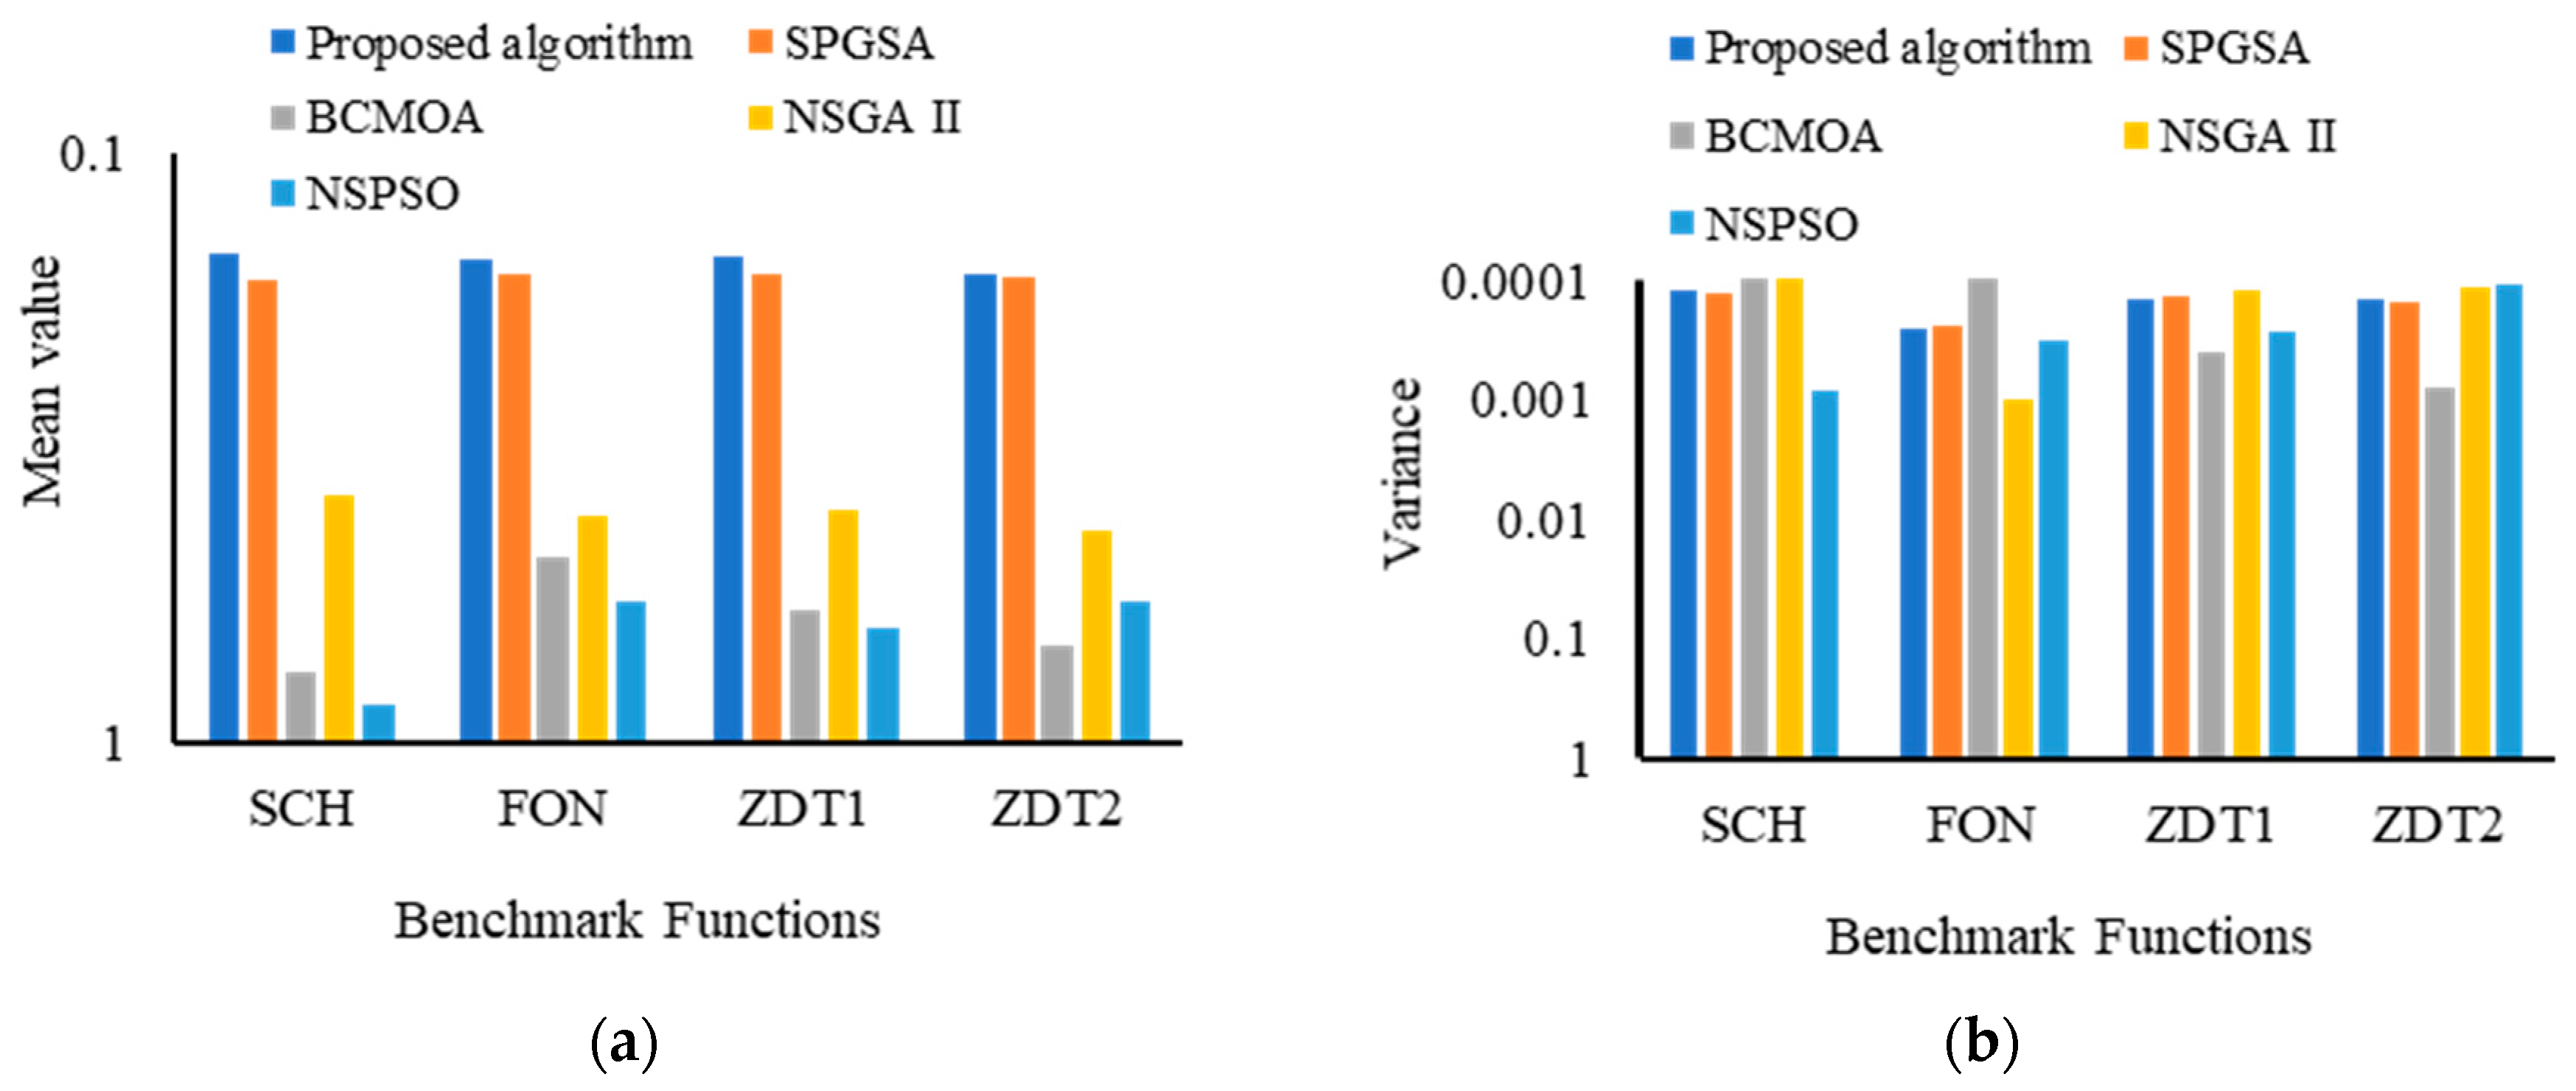
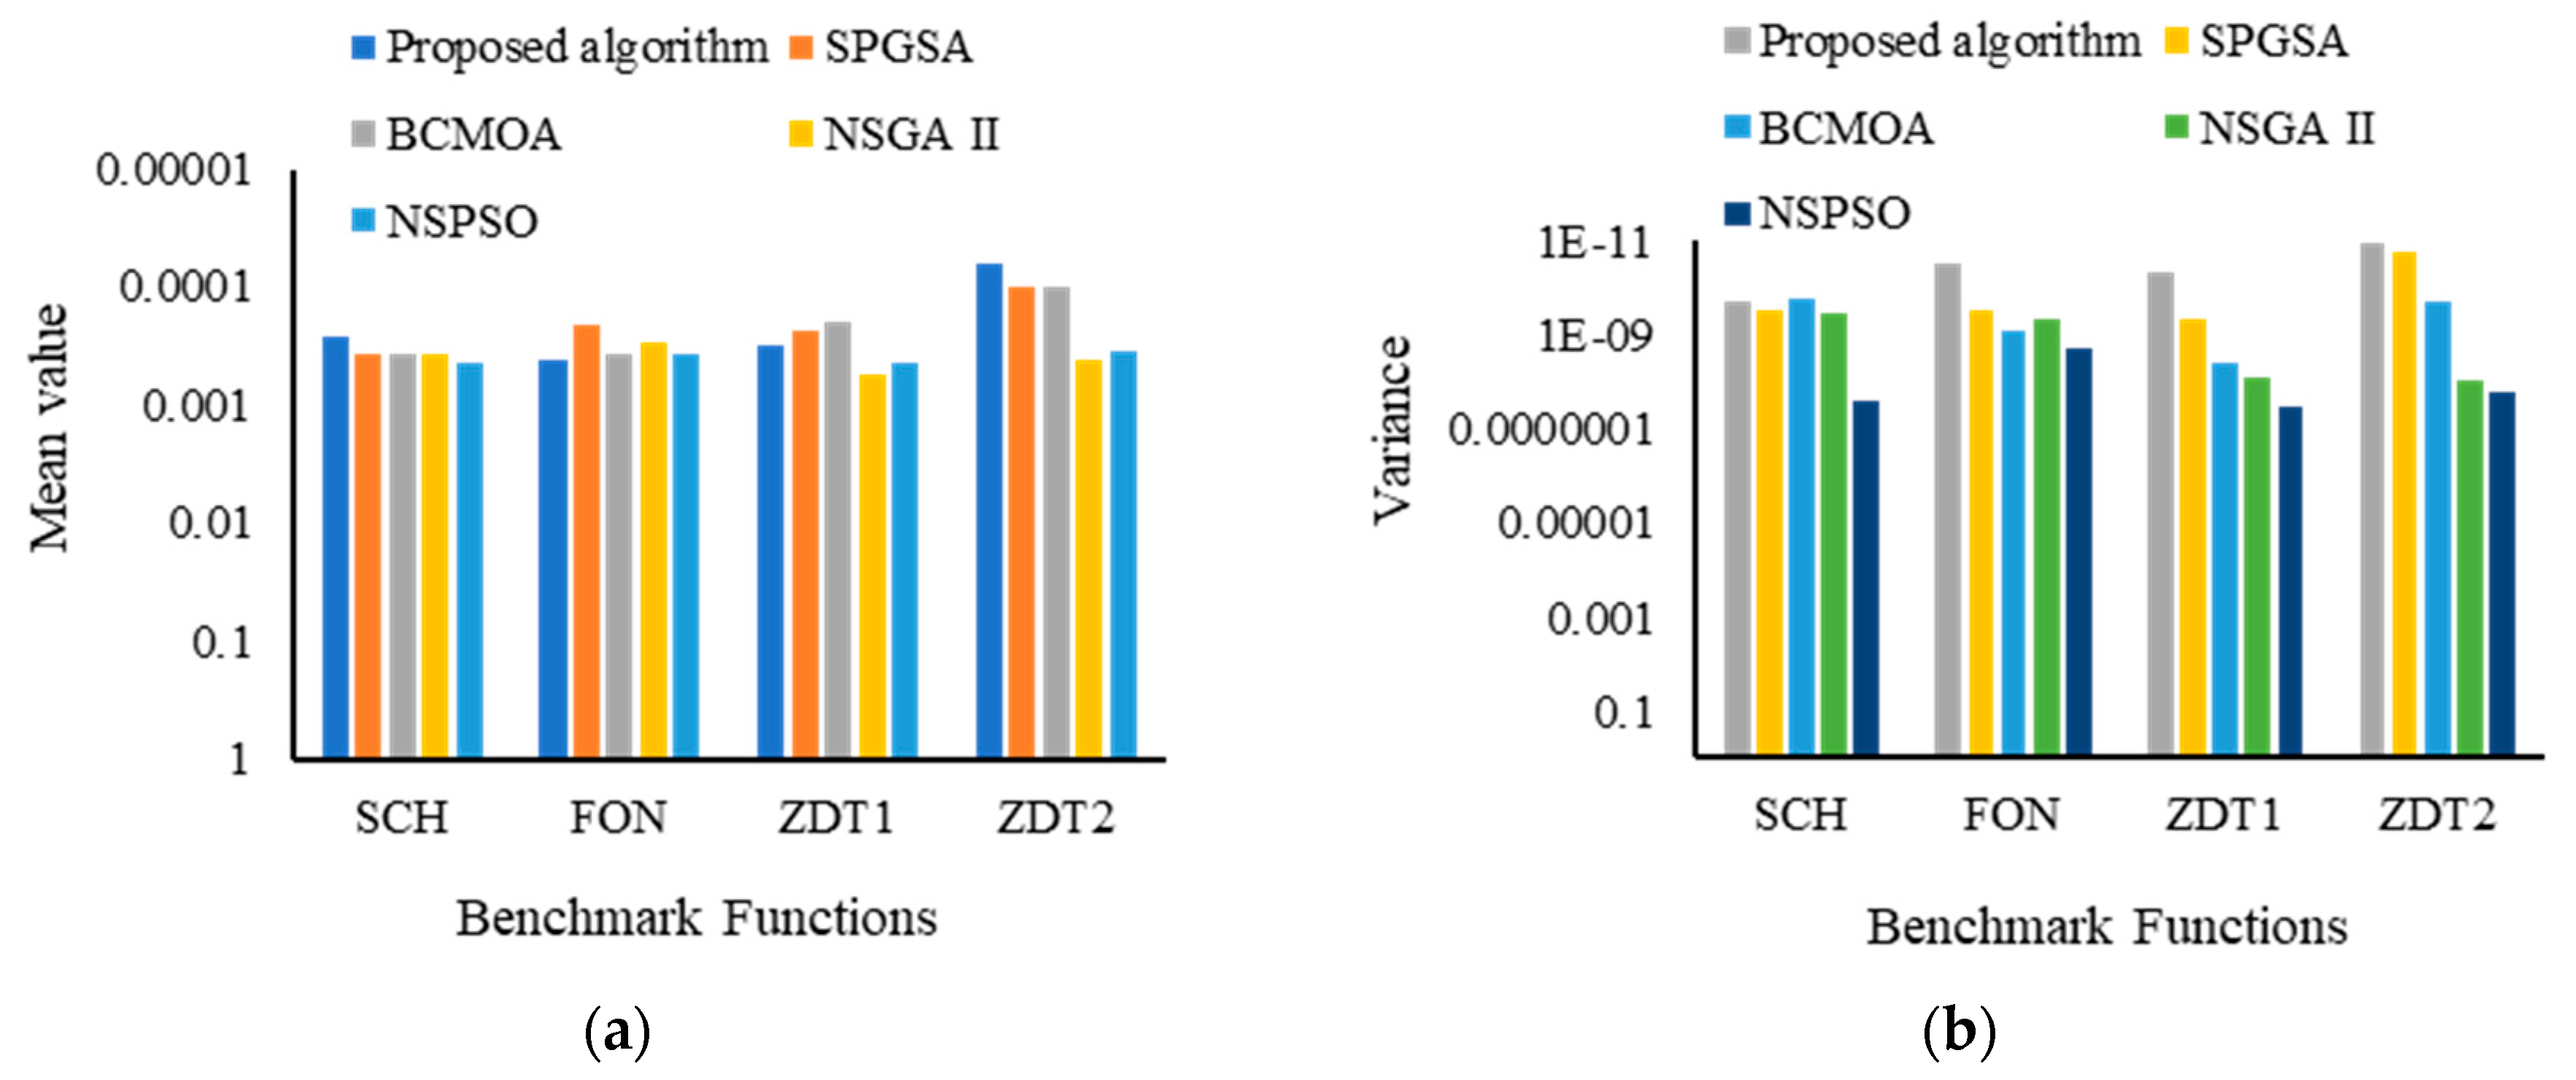
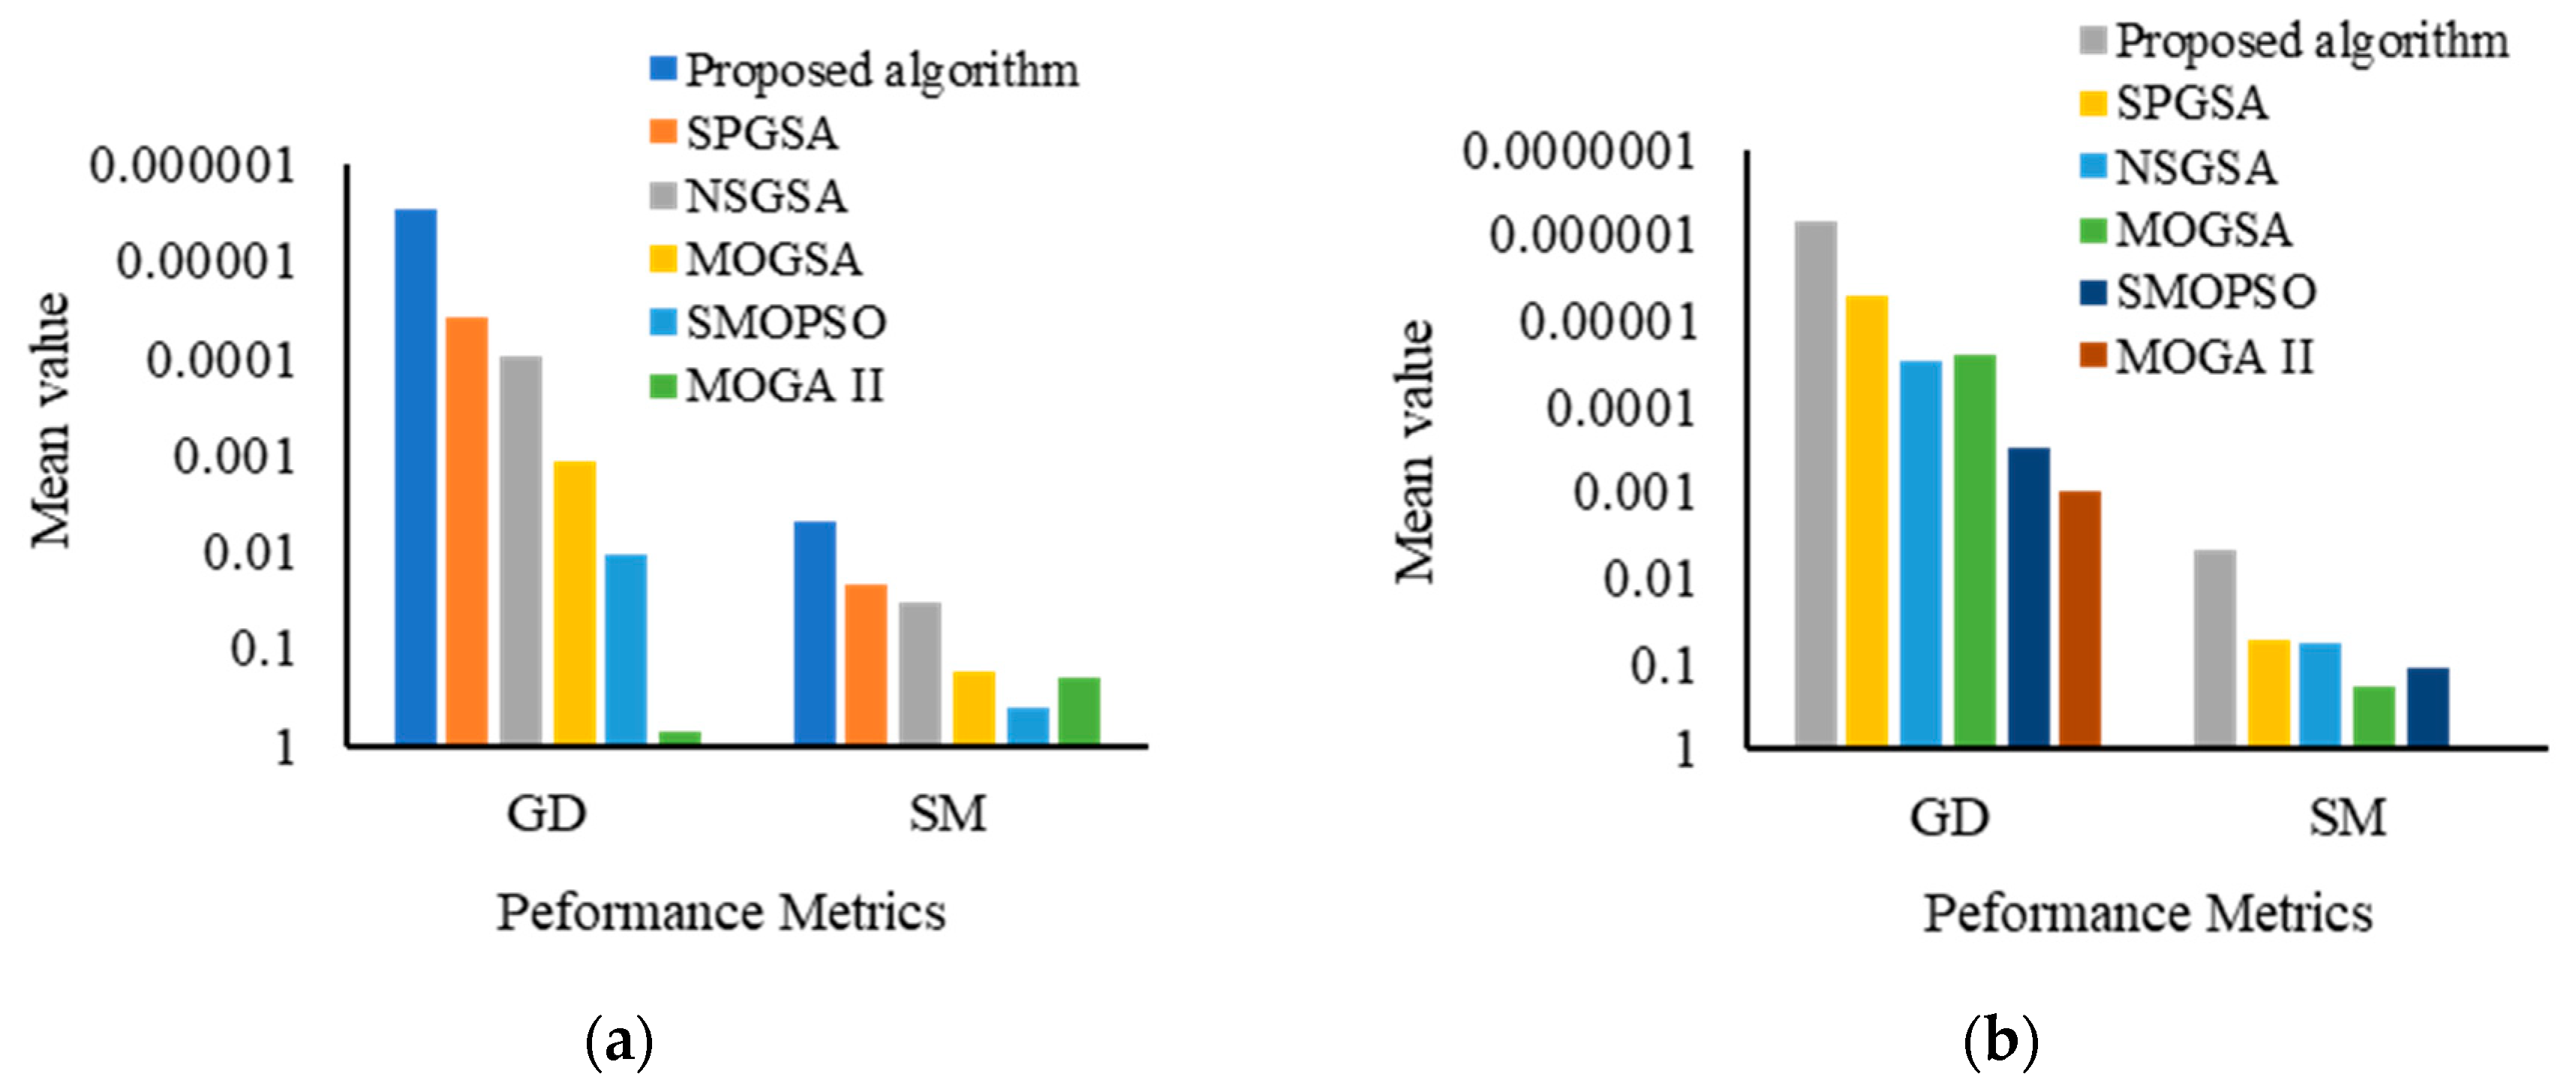
5.2. Performance Comparison of the Proposed Algorithm with Existing Multi-Objective Optimization Algorithms

As shown in Table 5, the AEFA faces challenges in solving MOOP. These challenges are addressed through the proposed algorithm. The proposed algorithm is evaluated with six benchmark functions. The description of benchmark functions is presented in Table 6. The performance of the proposed algorithm is compared with the existing MOOP based on four performance measures: generational distance metric (GD) [2], diversity metric (DM) [3], converge metric (CM) [3], and spacing metric (SM) [39]. DM measures the extent of spread attained in the obtained optimal solution. CM measures the convergence to the obtained optimal Pareto front. GD measures the proximity of the optimal solution to the Pareto optimal front. SM demonstrates how evenly the optimal solutions are distributed among themselves. Further, the performance of the proposed algorithm is compared with existing MOOPs in terms of recombination and mutation operators.

5.2.1. Parameter Setting

For experimental analysis, the parameters, i.e., initial population size ( P n ), external population size ( P m ) , the maximum Coulomb’s constant ( K 0 ) , the maximum number of iterations ( I c m a x ) , initial crossover probability ( P c o ) , final crossover probability ( P c 1 ) , initial mutation probability ( P m 0 ), and final mutation probability ( P m 1 ) , are initialized and presented in Table 7.

5.2.2. Results and Discussion

The performance of the proposed algorithm is analyzed in three steps: (1) the proposed algorithm is evaluated on SCH, FON, and ZDT benchmarks and then compared with NSGA II [3], NSPSO [7], BCMOA [40], and SPGSA [36] based on CM, DM, and GD metrics; the (2) proposed algorithm is evaluated on MOP5 and MOP6 benchmarks and then compared with NSGSA [36], MOGSA [36], SMOPSO [36], MOGA II [36], and SPGSA [36] based on GD and SM metrics; and (3) the efficacy of using the recombination operator is validated by evaluating the proposed algorithm on six benchmarks and then compared with the existing MOOPs. Experiments are performed 10 times on each benchmark function, and results are recorded in terms of mean and variance, contributing to the robustness of the algorithm. The results are presented in Table 8, Table 9, Table 10, Table 11 and Table 12 and Figure 2, Figure 3, Figure 4, Figure 5 and Figure 6. For better representation, all the results in Figure 2, Figure 3, Figure 4, Figure 5 and Figure 6 are prepared using logarithmic scale, where a high logarithmic value corresponds to a minimum output value (mean and variance). Results in Table 8 and Figure 2 demonstrate that the proposed algorithms obtained minimum values of CM metric as compared to NSGSA [36], MOGSA [36], SMOPSO [36], MOGA II [36], and SPGSA [36] which proves that the proposed algorithm ensures better convergence and keeps a good balance between exploration and exploitation of low-dimensional as well as high-dimensional problems. Figure 3 and Table 9 show that the proposed algorithm obtained the minimum value of variance (in DM metric) for all the benchmark functions as compared to NSGA II, NSPSO, BCMOA, and SPGSA, which validates the efficacy and robustness of the proposed algorithm. Results in Table 10 (GD metric) and Figure 4 demonstrate that the proposed algorithm performed better in comparison to existing NSGA II, NSPSO, BCMOA, and SPGSA. GD metric validates the proximity of obtained optimal solution to the optimal Pareto front, thereby ensuring the effectiveness of the proposed algorithm. Table 11 and Figure 5 demonstrate that the proposed algorithm achieves better values for GD and SM metrics than the compared algorithm. GD values of the proposed algorithm show more accurate results than the compared algorithm, and SM values show that the proposed algorithm attains a better convergence accuracy for all benchmark functions, which shows that the proposed algorithm can produce uniformly distributed, non-dominated optimal solutions. Table 12 and Figure 6a–c show that the proposed algorithm is compared with SPEA2, SPGSA, SPGSA_NRM, and a self-variant of MOOP without utilizing BEX and PMO operators. Results indicate that involving BEX and PMO operators in the proposed algorithm significantly improves the algorithm optimization performance in comparison to the compared algorithm. Contrary, in the absence of these operators, the proposed algorithm suffers from premature convergence. So, it is concluded from all four metrics (Table 8, Table 9, Table 10 and Table 11) and Table 12 that the proposed algorithm shows better efficacy, accuracy, and robustness in searching true Pareto fronts across the global search space in comparison to the existing MOOP algorithm. Further, involving BEX and PMO operators, the proposed algorithm maintains desirable diversity in searching the true Pareto front.

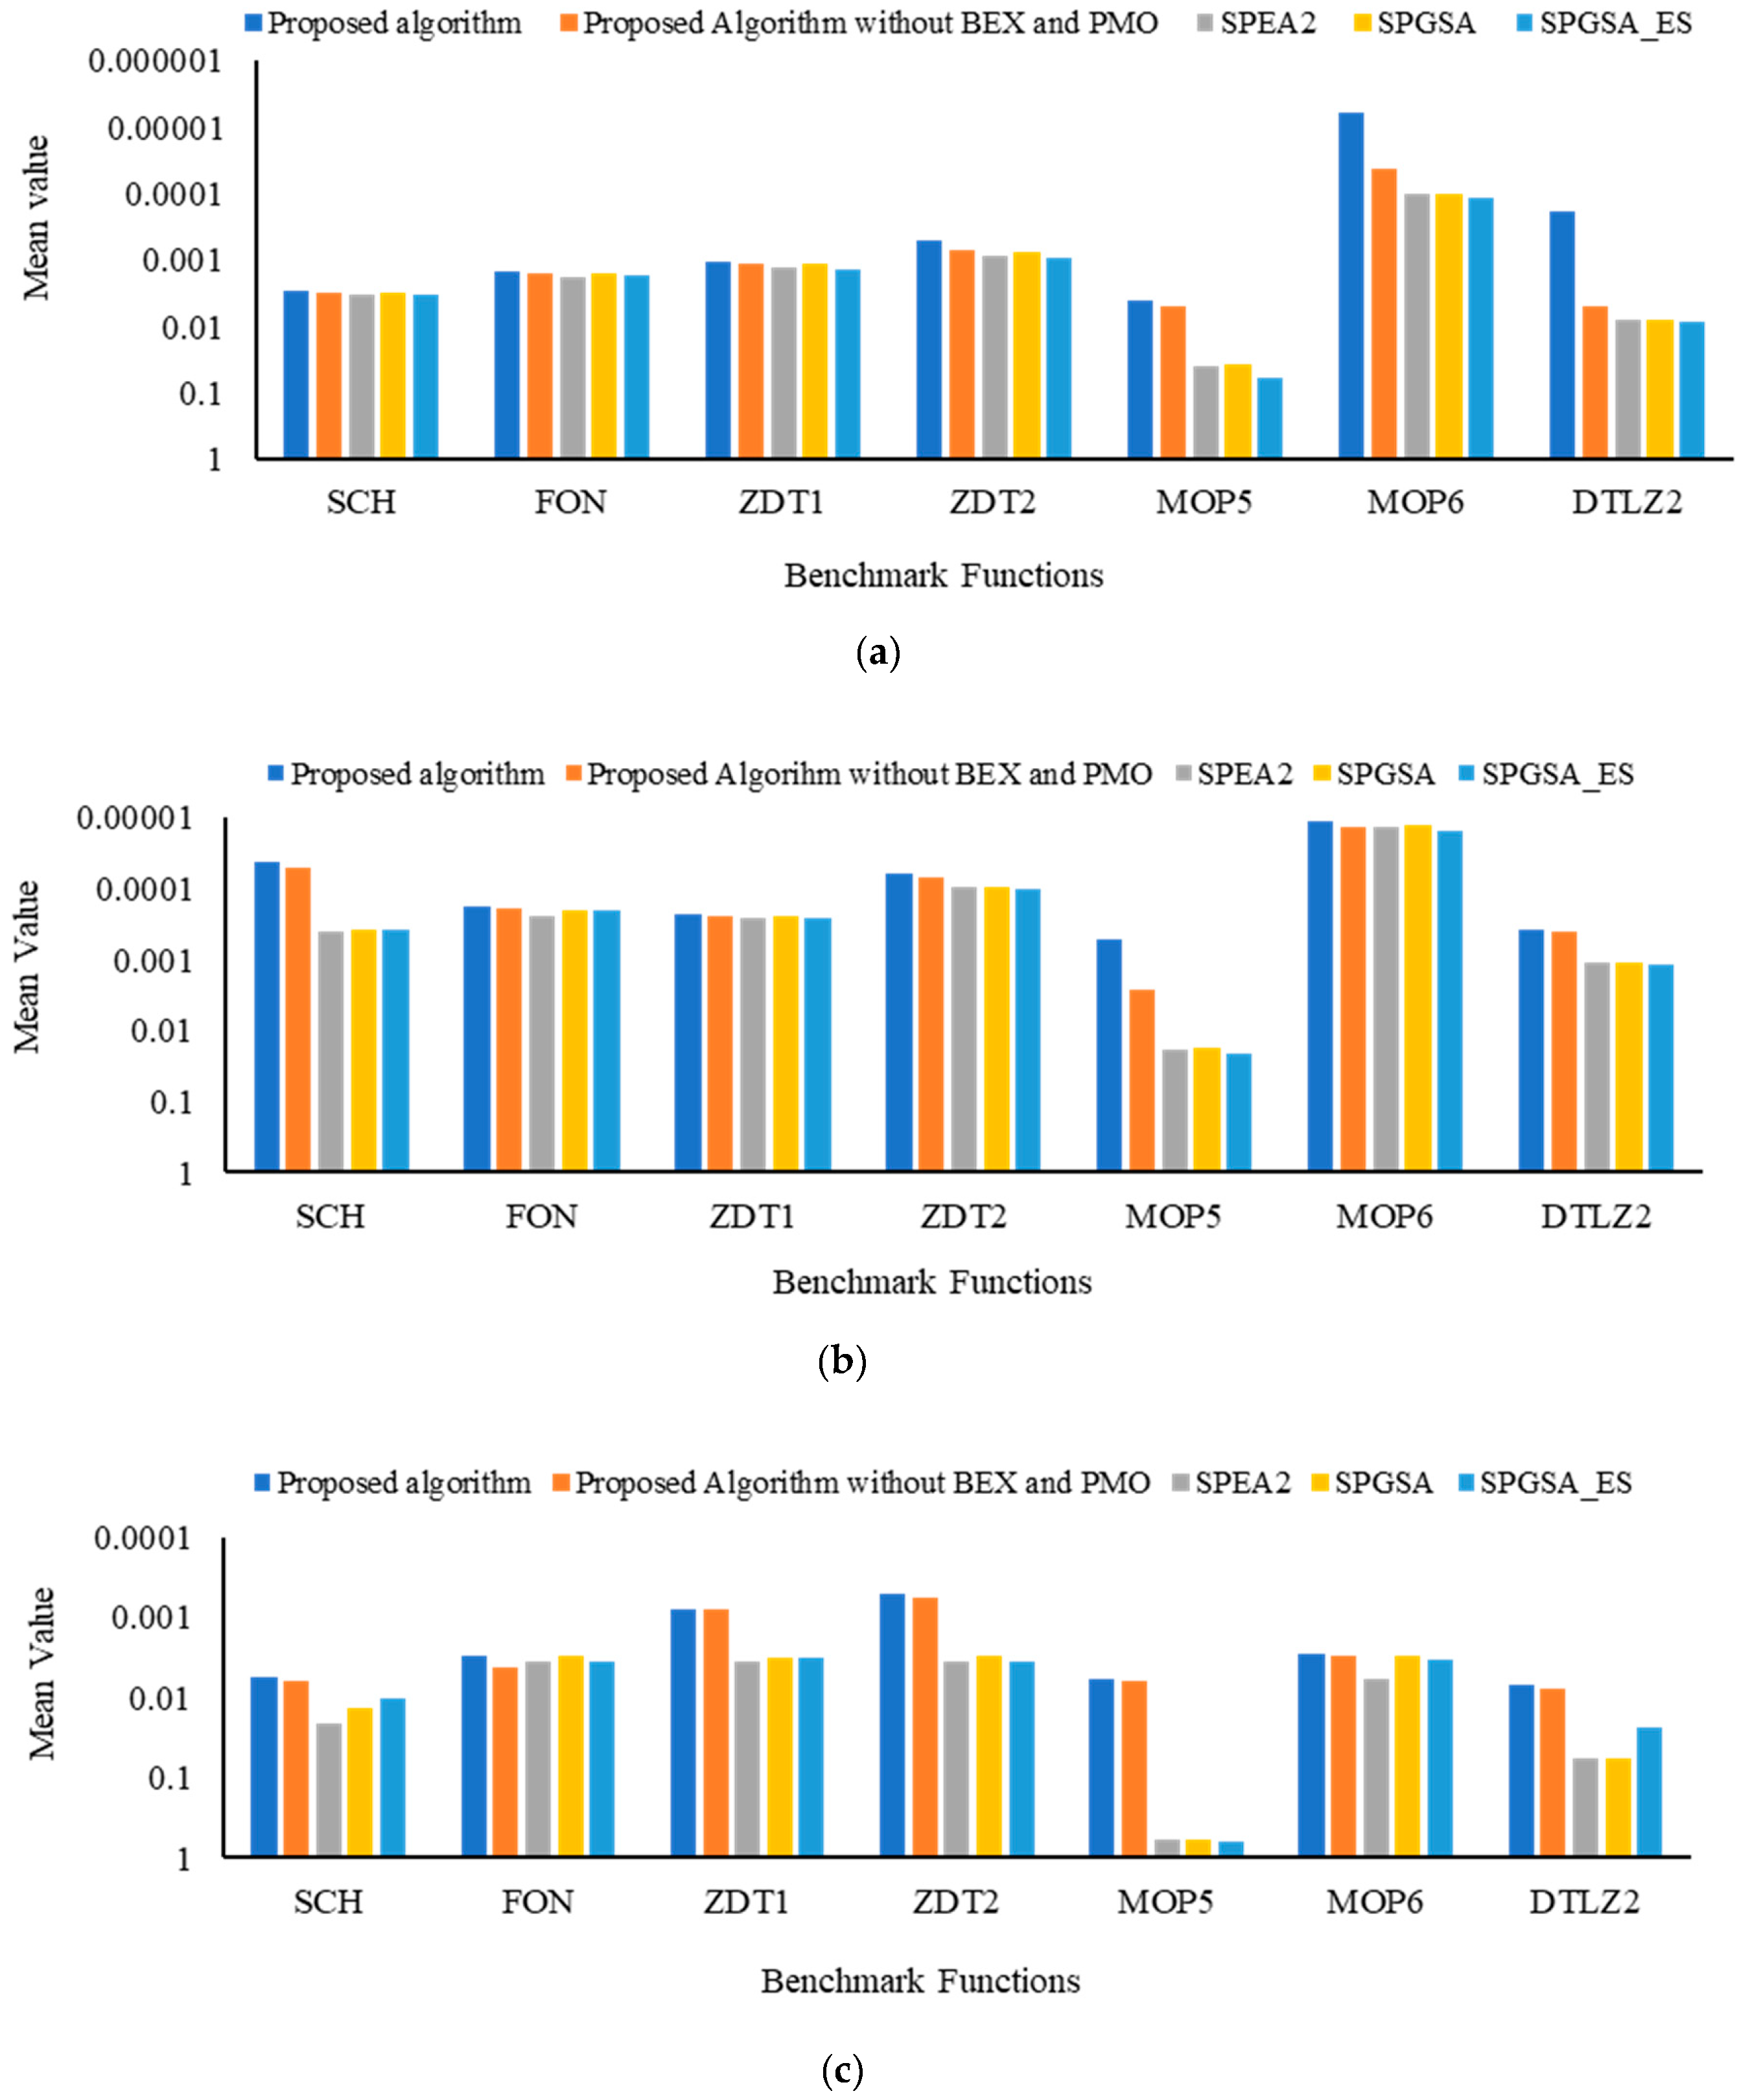
5.3. Sensitivity Analysis of the Proposed Algorithm

Sensitivity analysis is defined as the process that determines the influences of change in input variable on the robustness of outcome. In this paper, the robustness of the proposed algorithm is evaluated in two steps: (1) sensitivity analysis 1 and (2) sensitivity analysis 2. Sensitivity analysis 1 is performed for the different values of crossover operator (BEX), mutation operator (PMO), and initial value of coulomb’s constant ( K 0 ) . Sensitivity analysis 2 is performed for the different values of initial population size and maximum number of iterations. The detailed description of the sensitivity analysis and related parameter settings is described in Table 13. Further, a combined performance score, described in Table 14, is used measure the performance of the proposed algorithm.

Results and Discussion

Sensitivity of mutation operator (PMO), crossover operator (BEX), initial population size, maximum number of iterations, and initial value of coulomb’s constant ( K 0 ) are analyzed using GD and SM metrics, and results are presented in Table 15, Table 16, Table 17, Table 18 and Table 19, respectively. Table 15 shows that performance of the PMO varied from “Average” to “Good”, which means that selection of suitable values for mutation is required to achieve optimum results. Table 16 demonstrates that performance of the BEX varied from “Average” to “Very Good”, which means that the sensitivity of BEX is low for the proposed algorithm. Table 17 demonstrates that performance of the population size varied from “Average” to “Very Good”, which means that the sensitivity of the population is moderate for the proposed algorithm. Table 18 demonstrates that performance of maximum no. of iterations is “Good” for all experiments, which means that the proposed algorithm is less sensitive to maximum number of iterations. Table 19 demonstrates that performance of the initial value of Coulomb’s constant ( K 0 ) varies from “Good” to “Very Good”, which means that the proposed algorithm is less sensitive to ( K 0 ) . It is concluded from all the tables (Table 15, Table 16, Table 17, Table 18 and Table 19) that the proposed algorithm works efficiently in all given scenarios, which shows its robustness.

6. Conclusions and Future Work

In this paper, an improved population-based meta-heuristic algorithm, AEFA, is proposed to handle the multi-objective optimization problems. The proposed algorithm used strength Pareto dominance theory to refine fitness assignment and an improved fine-grained elitism selection based on the SDE mechanism to maintain population diversity. Further, the proposed algorithm used the SDE technique with strength Pareto dominance theory for density estimation, and it implemented bounded exponential crossover (BEX) and polynomial mutation operator (PMO) to avoid solutions trapping in local optima and enhance convergence. The experiments were performed in two steps. In the first step, the AEFA was evaluated on different low-dimensional and high-dimensional benchmark functions, and then the performance of the AEFA was compared with the existing evolutionary optimization algorithms (EOAs) based on four parameters: average best-so-far solution, mean best-so-far solution, the variance of the best-so-far solution, and average run-time. Experimental results show that for low-dimensional benchmark functions, AEFA performed better in comparison to existing EOAs, but for complex high-dimensional benchmark functions, AEFA suffered from loss of diversity and performed worse. In the second step, the proposed algorithm was evaluated on different benchmark functions, and then the performance of the proposed algorithm was compared with the existing evolutionary multi-objective optimization algorithms (EMOOPs) based on diversity, converge, generational distance, and spacing metrics. Experimental results prove that the proposed algorithm is not only able to find the optimal Pareto front (non-dominated solutions), but it also shows better performance than the existing multi-objective optimization techniques in terms of accuracy, robustness, and efficacy. In the future, the proposed work can be explored in various directions. One direction is to extend the proposed algorithm to solve various real-word multi-objective optimization problem. The proposed work can also be used to solve complex problems by hybridization of the proposed algorithm with another existing algorithm.

Author Contributions

Conceptualization, Methodology, Formal analysis, Validation, Writing—Original Draft Preparation, H.P.; Supervision, R.R. All authors have read and agreed to the published version of the manuscript.

Funding

This research received no external funding.

Conflicts of Interest

The authors declare no conflicts of interest.

References

  1. Nobahari, H.; Nikusokhan, M.; Siarry, P. Non-dominated sorting gravitational search algorithm. In Proceedings of the 2011 International Conference on Swarm Intelligence, Cergy, France, 14–15 June 2011; pp. 1–10. [Google Scholar]
  2. Van Veldhuizen, D.A.; Lamont, G.B. On measuring multiobjective evolutionary algorithm performance. In Proceedings of the 2000 Congress on Evolutionary Computation, La Jolla, CA, USA, 16–19 July 2000; Volume 1, pp. 204–211. [Google Scholar]
  3. Deb, K.; Pratap, A.; Agarwal, S.; Meyarivan, T. A fast and elitist multiobjective genetic algorithm: NSGA-II. IEEE Trans. Evol. Comput. 2002, 6, 182–197. [Google Scholar] [CrossRef] [Green Version]
  4. Zhao, B.; Cao, Y.J. Multiple Objective Particle Swarm Optimization Technique for Economic Load Dispatch. J. Zhejiang Univ. Sci. A 2005, 6, 420–427. [Google Scholar]
  5. Cagnina, L. A Particle Swarm Optimizer for Multi-Objective Optimization. J. Comput. Sci. Technol. 2005, 5, 204–210. [Google Scholar]
  6. Zhang, Y.; Gong, D.W.; Ding, Z. A bare-bones multi-objective particle swarm optimization algorithm for environmental/economic dispatch. Inf. Sci. 2012, 192, 213–227. [Google Scholar] [CrossRef]
  7. Li, X. A non-dominated sorting particle swarm optimizer for multiobjective optimization. In Genetic and Evolutionary Computation Conference; Springer: Berlin/Heidelberg, Germany, 2003; pp. 37–48. [Google Scholar]
  8. Yadav, A. AEFA: Artificial electric field algorithm for global optimization. Swarm Evol. Comput. 2019, 48, 93–108. [Google Scholar]
  9. Demirören, A.; Hekimoğlu, B.; Ekinci, S.; Kaya, S. Artificial Electric Field Algorithm for Determining Controller Parameters in AVR system. In Proceedings of the 2019 International Artificial Intelligence and Data Processing Symposium (IDAP), Malatya, Turkey, 21–22 September 2019; pp. 1–7. [Google Scholar]
  10. Abdelsalam, A.A.; Gabbar, H.A. Shunt Capacitors Optimal Placement in Distribution Networks Using Artificial Electric Field Algorithm. In Proceedings of the 2019 the 7th International Conference on Smart Energy Grid Engineering (SEGE), Oshawa, ON, Canada, 12–14 August 2019; pp. 77–85. [Google Scholar]
  11. Shafik, M.B.; Rashed, G.I.; Chen, H. Optimizing Energy Savings and Operation of Active Distribution Networks Utilizing Hybrid Energy Resources and Soft Open points: Case Study in Sohag, Egypt. IEEE Access 2020, 8, 28704–28717. [Google Scholar] [CrossRef]
  12. Thakur, M.; Meghwani, S.S.; Jalota, H. A modified real coded genetic algorithm for constrained optimization. Appl. Math. Comput. 2014, 235, 292–317. [Google Scholar] [CrossRef]
  13. Gong, M.; Jiao, L.; Du, H.; Bo, L. Multiobjective immune algorithm with nondominated neighbor-based selection. Evol. Comput. 2008, 16, 225–255. [Google Scholar] [CrossRef]
  14. Liu, Y.; Niu, B.; Luo, Y. Hybrid learning particle swarm optimizer with genetic disturbance. Neurocomputing 2015, 151, 1237–1247. [Google Scholar] [CrossRef]
  15. Fonseca, C.M.; Fleming, P.J. Genetic algorithms for multi-objective optimization: Formulation, discussion and generalization. In Proceedings of the 5th International Conference on Genetic Algorithms, San Mateo, CA, USA, 1 June 1993; pp. 416–423. [Google Scholar]
  16. Horn, J.; Nafploitis, N.; Goldberg, D.E. A niched Pareto genetic algorithm for multi-objective optimization. In Proceedings of the 1st IEEE Conference on Evolutionary Computation, Orlando, FL, USA, 27–29 June 1994; pp. 82–87. [Google Scholar]
  17. Tan, K.C.; Goh, C.K.; Mamun, A.A.; Ei, E.Z. An evolutionary artificial immune system for multi-objective optimization. Eur. J. Oper. Res. 2008, 187, 371–392. [Google Scholar] [CrossRef]
  18. Zitzler, E. Evolutionary Algorithms for Multiobjective Optimization: Methods and Applications; Ithaca: Shaker, OH, USA, 1999; Volume 63. [Google Scholar]
  19. Srinivas, N.; Deb, K. Multi-Objective function optimization using non-dominated sorting genetic algorithms. Evol. Comput. 1995, 2, 221–248. [Google Scholar] [CrossRef]
  20. Zitzler, E.; Thiele, L. Multiobjective optimization using evolutionary algorithms—A comparative case study. In International Conference on Parallel Problem Solving from Nature; Springer: Berlin/Heidelberg, Germany, 1998; pp. 292–301. [Google Scholar]
  21. Rudolph, G. Technical Report No. CI-67/99: Evolutionary Search under Partially Ordered Sets; Dortmund Department of Computer Science/LS11, University of Dortmund: Dortmund, Germany, 1999. [Google Scholar]
  22. Rughooputh, H.C.; King, R.A. Environmental/economic dispatch of thermal units using an elitist multiobjective evolutionary algorithm. In Proceedings of the IEEE International Conference on Industrial Technology, Maribor, Slovenia, 10–12 December 2003; Volume 1, pp. 48–53. [Google Scholar]
  23. Deb, K. Multi-Objective Optimization Using Evolutionary Algorithms; John Wiley & Sons: New York, NY, USA, 2001; Volume 16. [Google Scholar]
  24. Vrugt, J.A.; Robinson, B.A. Improved evolutionary optimization from genetically adaptive multimethod search. Proc. Natl. Acad. Sci. USA 2007, 104, 708–711. [Google Scholar] [CrossRef] [PubMed] [Green Version]
  25. Deb, K.; Jain, H. An evolutionary many-objective optimization algorithm using reference-point-based nondominated sorting approach, part I: Solving problems with box constraints. IEEE Trans. Evol. Comput. 2013, 18, 577–601. [Google Scholar] [CrossRef]
  26. Jain, H.; Deb, K. An evolutionary many-objective optimization algorithm using reference-point based nondominated sorting approach, part II: Handling constraints and extending to an adaptive approach. IEEE Trans. Evol. Comput. 2013, 18, 602–622. [Google Scholar] [CrossRef]
  27. Zhao, B.; Guo, C.X.; Cao, Y.J. A multiagent-based particle swarm optimization approach for optimal reactive power dispatch. IEEE Trans. Power Syst. 2005, 20, 1070–1078. [Google Scholar] [CrossRef]
  28. Zhang, Q.; Li, H. MOEA/D: A multiobjective evolutionary algorithm based on decomposition. IEEE Trans. Evol. Comput. 2007, 11, 712–731. [Google Scholar] [CrossRef]
  29. Ma, X.; Liu, F.; Qi, Y.; Li, L.; Jiao, L.; Liu, M.; Wu, J. MOEA/D with Baldwinian learning inspired by the regularity property of continuous multiobjective problem. Neurocomputing 2014, 145, 336–352. [Google Scholar] [CrossRef]
  30. Martinez, S.Z.; Coello, C.A.C. A multi-objective evolutionary algorithm based on decomposition for constrained multi-objective optimization. In Proceedings of the 2014 IEEE Congress on Evolutionary Computation (CEC), Beijing, China, 6–11 July 2014; pp. 429–436. [Google Scholar]
  31. Gu, F.; Liu, H.L.; Tan, K.C. A multiobjective evolutionary algorithm using dynamic weight design method. Int. J. Innov. Comput. Inf. Control 2012, 8, 3677–3688. [Google Scholar]
  32. Zhang, X.; Tian, Y.; Cheng, R.; Jin, Y. An efficient approach to nondominated sorting for evolutionary multiobjective optimization. IEEE Trans. Evol. Comput. 2014, 19, 201–213. [Google Scholar] [CrossRef] [Green Version]
  33. Chong, J.K.; Qiu, X. An Opposition-Based Self-Adaptive Differential Evolution with Decomposition for Solving the Multiobjective Multiple Salesman Problem. In Proceedings of the 2016 IEEE Congress on Evolutionary Computation (CEC), Vancouver, BC, Canada, 24–29 July 2016; pp. 4096–4103. [Google Scholar]
  34. Cheng, R.; Jin, Y.; Olhofer, M.; Sendhoff, B. A reference vector guided evolutionary algorithm for many-objective optimization. IEEE Trans. Evol. Comput. 2016, 20, 773–791. [Google Scholar] [CrossRef] [Green Version]
  35. Hassanzadeh, H.R.; Rouhani, M. A multi-objective gravitational search algorithm. In Proceedings of the 2010 2nd International Conference on Computational Intelligence, Communication Systems and Networks, Liverpool, UK, 28–30 July 2010; pp. 7–12. [Google Scholar]
  36. Yuan, X.; Chen, Z.; Yuan, Y.; Huang, Y.; Zhang, X. A strength pareto gravitational search algorithm for multi-objective optimization problems. Int. J. Pattern Recognit. Artif. Intell. 2015, 29, 1559010. [Google Scholar] [CrossRef]
  37. Li, M.; Yang, S.; Liu, X. Shift-based density estimation for Pareto-based algorithms in many-objective optimization. IEEE Trans. Evol. Comput. 2013, 18, 348–365. [Google Scholar] [CrossRef] [Green Version]
  38. Zitzler, E.; Laumanns, M.; Thiele, L. TIK report 103: SPEA2: Improving the Strength Pareto Evolutionary Algorithm; Computer Engineering and Networks Laboratory (TIK), ETH Zurich: Zurich, Switzerland, 2001. [Google Scholar]
  39. Schott, J.R. Fault Tolerant Design Using Single and Multicriteria Genetic Algorithm Optimization; Air force inst of tech Wright-Patterson AFB: Cambridge, MA, USA, 1995. [Google Scholar]
  40. Guzmán, M.A.; Delgado, A.; De Carvalho, J. A novel multiobjective optimization algorithm based on bacterial chemotaxis. Eng. Appl. Artif. Intell. 2010, 23, 292–301. [Google Scholar] [CrossRef]
Figure 1. Difference among algorithms based on the values obtained by performance measures on benchmark functions. (a) Performance measurement for F1 benchmark function. (b) Performance measurement for F2 benchmark function. (c) Performance measurement for F3 benchmark function. (d) Performance measurement for F4 benchmark function. (e) Performance measurement for F5 benchmark function. (f) Performance measurement for F6 benchmark function. (g) Performance measurement for F7 benchmark function. (h) Performance measurement for F8 benchmark function. (i) Performance measurement for F9 benchmark function. (j) Performance measurement for F10 benchmark function.
Processes 08 00584 g001aProcesses 08 00584 g001bProcesses 08 00584 g001c
Figure 2. Performance comparison of the proposed algorithm with existing MOOPs based on SCH, FON, and ZDT functions using the CM metric. (a) Performance measurement based on mean value; (b) performance measurement based on variance.
Processes 08 00584 g002
Figure 3. Performance comparison of the proposed algorithm with existing MOOPs based on SCH, FON, and ZDT functions using the DM metric (a). Performance measurement based on mean value; (b) performance measurement based on variance.
Processes 08 00584 g003
Figure 4. Performance comparison of the proposed algorithm with existing MOOPs based on SCH, FON, and ZDT functions using the GD metric. (a) Performance measurement based on mean value; (b) performance measurement based on variance.
Processes 08 00584 g004
Figure 5. Performance comparison of the proposed algorithm with existing MOOPs based on MOP5 and MOP6 functions using the GD/SM metric. (a) Performance measurement for MOP5 benchmark function; (b) performance measurement for MOP6 benchmark function.
Processes 08 00584 g005
Figure 6. Performance comparison of the proposed algorithm with existing MOOPs based on recombination and mutation operators. (a) Performance comparison of the proposed algorithm with existing MOOPs based on recombination and mutation operators on the CM metric. (b) Performance comparison of the proposed algorithm with existing MOOPs based on recombination and mutation operators on the GD metric. (c) Performance comparison of the proposed algorithm with existing MOOPs based on recombination and mutation operators on the SM metric.
Processes 08 00584 g006
Table 1. Summary of existing MOOPs.
Author(s)Objective/Work DoneTechnique Proposed/UsedPerformance ParametersResearch Gap(s) Identified
Nobahari, et.al. [1]Proposed a multi-objective gravitational search based on non-dominated sorting for power transformer designNon-dominated sorting gravitational search algorithm (NSGSA)Normalized arithmetic meanThe Algorithm lacks scalability when dealing with complex cases of power transformer design.
Srinivas, and Deb [19]Proposed a multi-objective genetic algorithm based on non-dominated sortingNon-dominated sorting genetic algorithm (NSGA)Chi-square testThe proposed algorithm shows a slow convergence rate.
Deb and Jain [25]Proposed an evolutionary approach for solving many-objective optimizationReference-based non dominated sorting approach (NSGA3)
  • Benchmark functions
  • Mean
  • Standard deviation
  • Inverted generational distance (IGD)
Recombination operator can be improved to enhance population diversity
Zhang and Li [28]Proposed a multi-objective evolutionary algorithm based on decompositionThe multi-objective evolutionary algorithm based on decomposition (MOEA/D)
  • C-metric
  • D-metric
The penalty parameter used in the proposed algorithm is statically initialized. For an extremely lower or higher value, the performance of the penalty method decreases
Martinez and Coello [30]Proposed a decomposition-based multi-objective evolutionary algorithm (eMOEA/D-DE) for constraint MOOPA new selection mechanism based on ε -constraint method
  • Hypervolume
  • Feasibility ratio
Constraint parameters ( ε ,   δ ) used in the algorithm are statically initialized. It can be initialized dynamically.
Gu et.al. [31] Proposed a multi-objective evolutionary algorithm based on the projection of the current non-dominated solutions and equidistance interpolationDynamic weight design method with MOEA/D
  • Benchmark functions
  • Mean
  • Standard deviation
  • Inverted generational distance (IGD)
The algorithm lacks efficacy to solve complex higher-dimensional problems.
Zhang, et al. [32]Proposed a novel and computationally efficient approach to non-dominated sortingEfficient non-dominated sort (ENS)
  • Number of dominance comparison
  • Execution time
The efficiency of the algorithm decreases with an increase in the number of objectives
Chong and Qiu [33]Proposed MOO algorithm to solve multi-objective traveling salesman problemSelf-adaptive differential algorithm with a decomposition-based framework (D-OSADE)
  • Benchmark functions
  • Mean
  • Standard deviation
  • Inverted generational distance (IGD)
The algorithm becomes less effective as the number of salesmen increases
Cheng et al. [34]Proposed an evolutionary algorithm for many-objective optimizationReference vector guided evolutionary algorithm (RVEA)
  • Benchmark functions
  • Mean
  • Standard deviation
  • Wilcoxon rank-sum test
The reference vector is static. The selection type of reference vector to be used in many-objective optimization is not considered
Hassanzade and Rouhani [35]Proposed a multi-objective algorithm based on gravitational forceMulti-objective gravitational search algorithm (MOGSA)
  • Spacing metric
  • Generational distance metric
The algorithm suffers premature convergence in solving complex higher-dimensional problems.
Yuan et al. [36]Proposed a multi-objective gravitational search based on the concept of strength ParetoStrength Pareto gravitational search (SPGSA)
  • Convergence metric
  • Space metric
  • Generational distance metric
  • Diversity metric
Population diversity can be further improved.
Table 2. Symbols used in the proposed algorithm.
SymbolDefinition
n Initial searching population size
P n Searching population
m External population size
P m External population
C P i D   ( T ) Position of i th charged particle (candidate solution) in D t h dimension at time T
v e l i D   ( T ) velocity of i th charged particle in D t h dimension at time T
N D C p Non-dominated set of charged particles (candidate solution)
F i t n e s s   ( T ) Objective fitness function
B e s t   ( T ) Charged particle with best fitness at time T
W o r s t   ( T ) Charged particle with worst fitness at time T
K Coulomb’s constant
Q i ( T ) Total charge on a i th charged particle at time T
q i ( T ) Small charge of i th charged particle to determine the total charge acting on i th charged particle
F i j Force exerted by j th charge particle on i th charge particle
S D E Shift based density estimation
I c m a x Maximum number of iterations
d P I c i , P I c i + 1 Distance between two non-dominated solutions ( P I c i and P I c i + 1 )
σ c r o w d Shared crowding distance for each C P
σ k c r o w d Shared crowding distance of k t h   C P chosen for deletion from the external population set
Table 3. Benchmark functions used for performance comparison of evolutionary algorithms.
Benchmark
Function
TypeVariable BoundObjective FunctionDimension(s)
F1UM 100 x i 100 F ( x ) = i = 1 n x i 2 30
i = 1 , 2 , 3 n
F2UM 10 x i 10 F ( x ) = i = 1 n | x i | + i = 1 n x i 30
i = 1 , 2 n
F3UM 100 x i 100 F ( x ) = max   { | x i | ,   1 i n } 30
i = 1 , 2 n
F4LDMM 0 x i 1 F ( x ) = i = 1 4 c i   exp ( j = 1 6 a i j   ( x j p i j ) 2 ) 6
i = 1 , 2 n
F5LDMM 0 x i 100 F ( x ) = i = 1 7 [ ( X a i ) ( X a i ) T + c i ] 1 4
i = 1 , 2 n
F6LDMM 0 x i 100 F ( x ) = i = 1 10 [ ( X a i ) ( X a i ) T + c i ] 1 4
i = 1 , 2 n
F7HDMM 500 x i 500 F ( x ) = i = 1 n x i   sin ( | x i | ) 30
i = 1 , 2 n
F8HDMM 5.12 x i 5.12 F ( x ) = i = 1 n [ x i 2 10 c o s ( 2 π x i ) + 10 ] 30
i = 1 , 2 n
F9HDMM 600 x i 600 F ( x ) = 1 40000 i = 1 n x i 2 i = 1 n cos ( x i i ) + 1 30
i = 1 , 2 n
F10HDMM 50 x i 50
i = 1 , 2 n
F ( x ) = 0.1 { sin ( 3 π x i ) + i = 1 n ( x i 1 ) 2 + 1
+ sin 2 ( 3 π x i + 1 ) ]   + ( x n 1 ) 2
[ 1 + sin 2 ( 2 π x n ) ] } + i = 1 u u ( x i , 10 , 100 , 4 ) ,
u ( x i , a , k , m ) = { k ( x i a ) m     x i > a   k ( x i a ) m   x i < a
30
Table 4. Parameters used to evaluate AEFA.
DescriptionParameterValue
Population size P n ,   P m 50
Initial value used in Coulomb’s constant K 0 100
Maximum number of iterations I c m a x 300 for F 4 F 6 and 1000 for the rest of the benchmark functions
Table 5. Performance comparison between AEFA and existing evolutionary optimization algorithms.
BenchmarkOptimization AlgorithmStatistical Performance Indices
Average BestMean BestVariance BestAverage Run Time
F1AEFA 3.21 × 10 16 2.54 × 10 18 3.98 × 10 16 9.48 × 10 0
GSA 3.33 × 10 14 2.68 × 10 17 4.79 × 10 14 9.71 × 10 0
ABC 4.20 × 10 9 1.52 × 10 9 8.40 × 10 9 1.63 × 10 1
CK 9.26 × 10 3 9.44 × 10 3 2.35 × 10 2 3.88 × 10 0
BSA 4.87 × 10 3 3.28 × 10 3 4.53 × 10 3 1.28 × 10 0
F2AEFA 1.26 × 10 8 2.00 × 10 8 1.10 × 10 8 9.72 × 10 0
GSA 1.55 × 10 8 2.08 × 10 8 1.16 × 10 8 9.95 × 10 0
ABC 3.22 × 10 6 2.99 × 10 6 1.35 × 10 6 1.75 × 10 1
CK 1.62 × 10 0 1.30 × 10 0 8.15 × 10 1 4.12 × 10 0
BSA 1.73 × 10 2 1.49 × 10 2 9.11 × 10 3 1.98 × 10 0
F3AEFA 2.68 × 10 10 2.98 × 10 9 8.78 × 10 11 9.01 × 10 0
GSA 3.34 × 10 9 3.13 × 10 9 9.05 × 10 10 8.98 × 10 0
ABC 6.02 × 10 1 6.15 × 10 1 9.39 × 10 0 1.71 × 10 1
CK 3.21 × 10 0 3.22 × 10 0 9.39 × 10 0 3.92 × 10 0
BSA 4.52 × 10 0 4.65 × 10 0 1.05 × 10 0 1.74 × 10 0
F4AEFA 3.30 × 10 0 3.30 × 10 0 4.38 × 10 16 2.44 × 10 0
GSA 3.32 × 10 0 3.32 × 10 0 4.08 × 10 16 2.24 × 10 0
ABC 3.32 × 10 0 3.32 × 10 0 2.33 × 10 9 7.24 × 10 0
CK 3.32 × 10 0 3.32 × 10 0 4.80 × 10 5 1.32 × 10 0
BSA 3.32 × 10 0 3.32 × 10 0 1.48 × 10 4 6.74 × 10 1
F5AEFA 1.02 × 10 1 1.02 × 10 1 2.68 × 10 16 2.34 × 10 0
GSA 1.04 × 10 1 1.04 × 10 1 2.97 × 10 15 2.29 × 10 0
ABC 1.04 × 10 1 1.04 × 10 1 1.38 × 10 3 8.23 × 10 0
CK 1.04 × 10 1 1.04 × 10 1 2.69 × 10 3 1.57 × 10 0
BSA 1.04 × 10 1 1.04 × 10 1 3.50 × 10 2 1.04 × 10 0
F6AEFA 1.05 × 10 1 1.05 × 10 1 1.28 × 10 15 2.40 × 10 0
GSA 1.05 × 10 1 1.05 × 10 1 1.47 × 10 15 2.46 × 10 0
ABC 1.05 × 10 1 1.05 × 10 1 7.06 × 10 4 9.34 × 10 0
CK 1.05 × 10 1 1.05 × 10 1 2.97 × 10 3 2.97 × 10 3
BSA 1.05 × 10 1 1.05 × 10 1 6.17 × 10 2 9.07 × 10 1
F7AEFA 2.79 × 10 3 2.68 × 10 3 4.18 × 10 2 2.98 × 10 0
GSA 2.84 × 10 3 2.84 × 10 3 4.22 × 10 2 3.01 × 10 0
ABC 1.08 × 10 4 1.07 × 10 4 2.97 × 10 2 5.86 × 10 0
CK 8.77 × 10 3 8.79 × 10 3 2.44 × 10 2 4.60 × 10 0
BSA 1.11 × 10 4 1.11 × 10 4 2.49 × 10 2 2.57 × 10 0
F8AEFA 1.28 × 10 1 1.28 × 10 1 3.56 × 10 0 1.06 × 10 1
GSA 1.53 × 10 1 1.54 × 10 1 4.01 × 10 0 1.10 × 10 1
ABC 1.06 × 10 1 2.24 × 10 6 3.05 × 10 1 1.89 × 10 1
CK 8.38 × 10 1 8.40 × 10 1 1.05 × 10 1 4.80 × 10 0
BSA 2.84 × 10 1 2.77 × 10 1 4.18 × 10 0 2.62 × 10 0
F9AEFA 4.08 × 10 0 3.19 × 10 0 1.80 × 10 0 9.70 × 10 0
GSA 4.15 × 10 0 3.56 × 10 0 1.81 × 10 0 9.74 × 10 0
ABC 4.01 × 10 4 2.81 × 10 8 1.79 × 10 3 2.44 × 10 1
CK 1.03 × 10 1 9.68 × 10 2 9.6 × 10 2 5.32 × 10 0
BSA 3.21 × 10 2 1.87 × 10 2 3.65 × 10 2 2.42 × 10 0
F10AEFA 5.00 × 10 4 1.96 × 10 18 2.30 × 10 3 1.12 × 10 1
GSA 5.49 × 10 4 2.10 × 10 18 2.46 × 10 3 1.07 × 10 1
ABC 2.10 × 10 3 1.17 × 10 3 2.45 × 10 3 1.27 × 10 1
CK 1.50 × 10 1 1.49 × 10 1 6.82 × 10 2 7.82 × 10 0
BSA 4.98 × 10 4 4.37 × 10 4 3.60 × 10 4 4.35 × 10 0
Table 6. Benchmark functions used for MOOP performance comparison.
Benchmark FunctionTypeVariable BoundObjective FunctionDimension(s)
SCH [3]Bi-Objective (Low dimension) 3 x i 3 Minimize F 1 ( x ) = x 2 1
Minimize F 2 ( x ) = ( x 2 ) 2
FON [3]Bi-Objective (Low dimension) 4 x i 4
i = 1 , 2 n
Minimize F 1 ( x ) = 1 exp ( i = 1 n ( x i 1 n ) 2   ) 3
Minimize F 2 ( x ) = 1 exp ( i = 1 n ( x i + 1 n ) 2   )
ZDT1 [3]Bi-Objective (High dimension) 0 x i 1
i = 1 , 2 n
Minimize F 1 ( x ) = x 1 30
Minimize F 2 ( x ) = g ( 1 f 1 g ) , g = 1 + 9 i = 2 n ( x i n 1 )
ZDT2 [3]Bi-Objective (High dimension) 0 x i 1
i = 1 , 2 n
Minimize F 1 ( x ) = x 1 30
Minimize F 2 ( x ) = g ( 1 ( f 1 g ) 2 ) , g = 1 + 9 i = 2 n ( x i n 1 )  
MOP5 [5]Tri-Objective (Low dimension) 30 x , y <=30 Minimize F 1 ( x , y ) = 1 2 ( x 2 + y 2 )   S i n ( x 2 + y 2 ) 2
Minimize F 2 ( x , y ) = 1 8 ( 3 x 2 y + 4 ) + ( x y + 1 ) 2   27 +15
Minimize F 3 ( x , y ) = 1 x 2 + y 2 + 1 1.1 e ( x 2 + y 2 )
MOP6 [5]Bi-Objective (Low dimension) 0 x , y <=1 Minimize F 1 ( x , y ) = x 2
Minimize F 2 ( x , y ) = ( 1 + 10 y )
[ 1 ( x 1 + 10 y ) 2 ( x 1 + 10 y ) s i n ( 8 π x ) ]
DTLZT2 [13]Tri-Objective (High dimension) 0 x i 1
i = 1 , 2 n
Minimize F 1 ( x ) = C o s ( π 2 x 1 ) C o s ( π 2 x 2 ) ( 1 + g ( x ) ) 12
Minimize F 2 ( x ) = C o s ( π 2 x 1 ) S i n ( π 2 x 2 ) ( 1 + g ( x ) )
Minimize F 3 ( x ) = S i n ( π 2 x 2 ) ( 1 + g ( x ) ) ,
where g = i = 3 n ( x i 0.5 ) 2
Table 7. Parameters used in the proposed algorithm.
DescriptionParameterValue
Population (charged particles) size P n 100
External Population size P m 100 for SCH, FON, ZDT
800 for MOP functions
Initial value used in Coulomb’s constant K 0 100
The maximum number of iterations I c m a x 100 for SCH and FON functions
250 for ZDT and MOP functions
Initial crossover probability P c o 1.0
Final crossover probability P c 1 0.0
Initial mutation probability P m 0 0.01
Final mutation probability P m 1 0.001
Table 8. Performance comparison of the proposed algorithm with existing MOOPs based on SCH, FON, and ZDT functions using the CM metric.
Benchmark FunctionParametersAlgorithm
Proposed AlgorithmSPGSABCMOANSGA IINSPSO
SCHMean 1.48 × 10 1 1.65 × 10 1 7.60 × 10 1 3.8 × 10 1 8.6 × 10 1
Variance 1.22 × 10 4 1.3 × 10 4 1.00 × 10 3 1.00 × 10 3 8.60 × 10 4
FONMean 1.52 × 10 1 1.61 × 10 1 4.85 × 10 1 4.14 × 10 1 5.81 × 10 1
Variance 2.52 × 10 4 2.4 × 10 4 1.00 × 10 4 9.80 × 10 4 3.16 × 10 2
ZDT1Mean 1.5 × 10 1 1.61 × 10 1 5.98 × 10 1 4.06 × 10 1 6.38 × 10 1
Variance 1.42 × 10 4 1.4 × 10 4 4.10 × 10 3 1.26 × 10 3 2.69 × 10 3
ZDT2Mean 1.61 × 10 1 1.63 × 10 1 6.89 × 10 1 4.39 × 10 1 5.80 × 10 1
Variance 1.46 × 10 4 1.5 × 10 4 8.13 × 10 3 1.19 × 10 3 1.08 × 10 3
Table 9. Performance comparison of the proposed algorithm with existing MOOPs based on SCH, FON, and ZDT functions using the DM metric.
Benchmark FunctionParametersAlgorithm
Proposed AlgorithmSPGSABCMOANSGA IINSPSO
SCHMean 2.75 × 10 3 3.24 × 10 3 3.28 × 10 3 3.14 × 10 3 3.40 × 10 1
Variance 1.89 × 10 8 2.98 × 10 8 2.16 × 10 8 4.64 × 10 8 7.40 × 10 4
FONMean 1.55 × 10 3 1.72 × 10 3 2.77 × 10 3 2.36 × 10 3 2.84 × 10 1
Variance 1.30 × 10 8 1.10 × 10 8 3.41 × 10 8 1.24 × 10 8 9.04 × 10 2
ZDT1Mean 1.02 × 10 3 1.17 × 10 3 1.19 × 10 3 4.02 × 10 3 3.81 × 10 1
Variance 1.98 × 10 9 2.66 × 10 9 3.41 × 10 8 3.14 × 10 7 3.22 × 10 3
ZDT2Mean 7.90 × 10 5 8.06 × 10 4 8.37 × 10 4 2.71 × 10 3 4.59 × 10 1
Variance 4.22 × 10 11 6.37 × 10 10 1.25 × 10 8 7.69 × 10 8 3.24 × 10 3
Table 10. Performance comparison of the proposed algorithm with existing MOOPs based on SCH, FON, and ZDT functions using the GD metric.
Benchmark FunctionParametersAlgorithm
Proposed AlgorithmSPGSABCMOANSGA IINSPSO
SCHMean 2.69 × 10 4 3.78 × 10 4 3.78 × 10 4 3.68 × 10 4 4.5 × 10 4
Variance 2.02 × 10 10 3.06 × 10 10 1.57 × 10 10 3.4 × 10 10 2.6 × 10 8
FONMean 4.05 × 10 5 2.13 × 10 4 3.62 × 10 4 2.94 × 10 4 3.6 × 10 4
Variance 3.12 × 10 11 3.06 × 10 10 8.03 × 10 10 4.2 × 10 10 1.8 × 10 9
ZDT1Mean 3.12 × 10 5 2.4 × 10 4 2.02 × 10 4 5.56 × 10 4 4.3 × 10 4
Variance 4.37 × 10 11 4.76 × 10 10 3.64 × 10 9 7.95 × 10 9 3.4 × 10 8
ZDT2Mean 6.16 × 10 5 9.71 × 10 5 1.00 × 10 4 4.18 × 10 4 3.5 × 10 4
Variance 1.14 × 10 11 1.56 × 10 11 1.97 × 10 10 9.64 × 10 9 1.6 × 10 8
Table 11. Performance comparison of the proposed algorithm with existing MOOPs based on MOP5 and MOP6 functions using the GD/SM metric.
Benchmark FunctionMetricAlgorithm
Proposed AlgorithmSPGSANSGSAMOGSASMOPSOMOGA II
MOP5GD 2.86 × 10 6 3.9 × 10 5 1.0 × 10 4 1.2 × 10 3 1.11 × 10 2 7.2 × 10 1
SM 4.86 × 10 3 2.18 × 10 2 3.4 × 10 2 1.8 × 10 1 3.96 × 10 1 2.0 × 10 1
MOP6GD 7.02 × 10 7 5.01 × 10 6 3.0 × 10 5 2.45 × 10 5 2.98 × 10 4 1.00 × 10 3
SM 4.86 × 10 3 5.34 × 10 2 5.7 × 10 2 1.80 × 10 1 1.16 × 10 1 9.42 × 10 1
Table 12. Performance comparison of the proposed algorithm with existing MOOPs based on recombination and mutation operators.
Performance MetricBenchmark FunctionsProposed Algorithm Proposed   Algorithm   ( without   B E X   and   P M O   Operator ) SPEA2SPGSASPGSA_ES
CM metricSCH 2.87 × 10 3 3.11 × 10 3 3.31 × 10 3 3.21 × 10 3 3.23 × 10 3
FON 1.45 × 10 3 1.58 × 10 3 1.86 × 10 3 1.60 × 10 3 1.67 × 10 3
ZDT1 1.07 × 10 3 1.17 × 10 3 1.31 × 10 3 1.17 × 10 3 1.43 × 10 3
ZDT2 5.08 × 10 4 7.28 × 10 4 8.68 × 10 4 7.84 × 10 4 9.37 × 10 4
MOP5 4.18 × 10 3 5.11 × 10 3 4.01 × 10 2 3.65 × 10 2 6.16 × 10 2
MOP6 6.18 × 10 6 4.11 × 10 5 9.86 × 10 5 9.84 × 10 5 1.19 × 10 4
DTLZ2 1.88 × 10 4 5.01 × 10 3 7.97 × 10 3 8.01 × 10 3 8.33 × 10 3
GD metricSCH 4.08 × 10 5 4.98 × 10 5 4.03 × 10 4 3.76 × 10 4 3.78 × 10 4
FON 1.81 × 10 4 1.95 × 10 4 2.37 × 10 4 1.98 × 10 4 2.01 × 10 4
ZDT1 2.31 × 10 4 2.43 × 10 4 2.63 × 10 4 2.50 × 10 4 2.60 × 10 4
ZDT2 6.25 × 10 5 7.11 × 10 5 9.41 × 10 5 9.36 × 10 5 9.78 × 10 5
MOP5 5.28 × 10 4 2.70 × 10 3 1.90 × 10 2 1.76 × 10 2 2.13 × 10 2
MOP6 1.12 × 10 5 1.32 × 10 5 1.32 × 10 5 1.30 × 10 5 1.55 × 10 5
DTLZ2 3.77 × 10 4 4.01 × 10 4 1.09 × 10 3 1.10 × 10 3 1.18 × 10 3
SM metricSCH 5.48 × 10 3 6.11 × 10 3 2 0.08 × 10 2 1.36 × 10 2 1.05 × 10 2
FON 3.12 × 10 3 4.22 × 10 3 3.66 × 10 3 3.00 × 10 3 3.51 × 10 3
ZDT1 7.81 × 10 4 8.11 × 10 4 3.66 × 10 3 3.18 × 10 3 3.21 × 10 3
ZDT2 5.23 × 10 4 5.89 × 10 4 3.61 × 10 3 3.11 × 10 3 3.58 × 10 3
MOP5 6.08 × 10 3 6.28 × 10 3 6.09 × 10 1 6.10 × 10 1 6.15 × 10 1
MOP6 2.90 × 10 3 3.09 × 10 3 6.01 × 10 3 3.10 × 10 3 3.47 × 10 3
DTLZ2 7.16 × 10 3 8.01 × 10 3 5.74 × 10 2 5.87 × 10 2 2.3 × 10 2
Table 13. Parameter settings for sensitivity analysis.
AnalysisSensitivity Analysis Performed onParameter SettingSetting of Variable ParametersNumber of Parameter Setting Combinations
Sensitivity Analysis 1
  • BEX Cross over
  • PMO Mutation
  • Initial value of Coulomb’s constant ( K 0 )
  • Initial population size ( P n ) = 100
  • External population ( P m ) = 100
  • Maximum no. of iterations = 2000
  • Mutation = 0.01; 0.7; 0.9; 0.001
  • Crossover Rate = 0.7; 0.8; 0.9; 1.0
  • K 0 = 100, 300, 500
30
Sensitivity Analysis 2Initial population SizeMutation probability = 0.001Population Size = 50; 100; 200; 400; 50020
Maximum no. of IterationsCrossover probability = 1.0Maximum no. of Iterations = 500; 1000; 200050
Table 14. Performance measure for sensitivity analysis.
Performance MeasuresOverall Performance of Parameter Setting Combinations
Very GoodGoodAveragePoorVery Poor
Combined performance Score5.0–4.04.0–3.03.0–2.02.0–1.01.0–0.0
Table 15. Sensitivity analysis of mutation parameter (PMO).
Value of Mutation ParameterValue of Constant ParametersMetricsCombined Performance ScoreOverall Performance
GDSM
0.01
  • Initial population size = 100
  • External population size = 100
  • Maximum no. of iterations = 2000
  • Crossover value = 0.8
389924.62.9Average
0.076732.33.6Good
0.098633.53.0Average
0.00113528.41.8Very Poor
0.01
  • Population Size = 100
  • Maximum no. of iterations = 2000
  • Crossover value = 0.9
11,085223.3Good
0.0755323.8Good
0.098328.72.6Average
0.00171323.4Good
Table 16. Sensitivity analysis of crossover parameter (BEX).
Value of Crossover ParameterValue of Constant ParametersMetricsCombined Performance ScoreOverall Performance
GDSM
0.7
  • Initial population size = 100
  • External population size = 100, 800
  • Maximum no. of iterations = 2000
  • Mutation value = 0.001
112394.2Very Good
0.845283.2Good
0.960353.0Average
1.036302.6Average
0.7
  • Initial population size = 100
  • External population size = 100, 800
  • Maximum no. of iterations = 2000
  • Mutation value = 0.09
4454263.8Good
0.810,121233.6Good
0.93632213.2Good
1.011,068243Good
Table 17. Sensitivity analysis of initial population size.
Initial Population SizeValue of Constant ParametersMetricsCombined Performance ScoreOverall Performance
GDSM
100
  • External population size = 100, 800
  • Maximum no. of iterations = 1000
  • Mutation value = 0.005
  • Crossover Value = 0.9
225283.0Average
20032343.1Good
40036394.0Very Good
50038303.6Good
100
  • External population size = 100, 800
  • Maximum no. of iterations = 1000
  • Mutation value = 0.005
  • Crossover Value = 0.9
60303.5Good
200105343.9Good
40021363.5Good
50021353.2Good
Table 18. Sensitivity analysis of maximum no. of iterations.
Maximum No of IterationsValue of Constant ParametersMetricsCombined Performance ScoreOverall Performance
GDSM
500
  • Initial population size = 200
  • External population size = 100, 800
  • Mutation value = 0.09
  • Crossover Value = 0.7
65303.4Good
100021333.2Good
200030343.2Good
500
  • Initial population size = 500
  • External population size = 100, 800
  • Mutation value = 0.09
  • Crossover Value = 1.0
50323.3Good
100051343.6Good
200024343.8Good
Table 19. Sensitivity analysis of Coulomb’s constant initial value.
Initial Value of Coulomb’s ConstantValue of Constant ParametersMetricsCombined Performance ScoreOverall Performance
GDSM
100
  • Initial population size = 200
  • External population size = 100, 800
  • Maximum number of iterations = 1000
  • Mutation value = 0.09
  • Crossover Value = 0.7
85313.6Good
30030403.3Good
500403324.2Very Good
100
  • Initial population size = 500
  • External population size = 100, 800
  • Maximum number of iterations = 2000
  • Mutation value = 0.09
  • Crossover Value = 1.0
62353.3Good
30048393.9Good
50038314.0Very Good

