Article

Influence of Selected Parameters and Different Methods of Implementing Vacuum Impregnation of Apple Tissue on Its Effectiveness

1
Department of Food Engineering and Machinery, University of Life Sciences in Lublin, Głęboka 28, 20-612 Lublin, Poland
2
Department of Biological Bases of Food and Feed Technologies, University of Life Sciences in Lublin, Głęboka 28, 20-612 Lublin, Poland
*
Author to whom correspondence should be addressed.
Processes 2020, 8(4), 428; https://doi.org/10.3390/pr8040428
Submission received: 10 March 2020 / Revised: 26 March 2020 / Accepted: 30 March 2020 / Published: 3 April 2020
(This article belongs to the Collection Sustainable Food Processing Processes)

Abstract

:
The study provides comprehensive information on the vacuum impregnation process applied to plant materials. It aims (in traditional applications) to ensure impermeability and elimination of porosity of various materials. The process substantially accelerates mass transfer in the liquid–solid system. The study describes the course of the process and accompanying phenomena as well its effects on plant tissues. The aim of the investigations was to determine the impact of some impregnation parameters (pressure, pressure change rate, vacuum maintenance time, relaxation time, and the coefficient of impregnating liquid viscosity) and the mode of impregnation (wet, dry, cyclic wet) on the degree of filling the plant tissue with the impregnating solution. Jonagold apples were used as the study material. The investigations have revealed that changes in the vacuum impregnation parameters (vacuum maintenance time, relaxation time, pressure change rate in the system) and the impregnation method do not exert a significant impact on the effectiveness of the process as expressed by the degree of permeation of the impregnating solution into the tissue. The pressure value and the viscosity coefficient were the only parameters that had a significant effect on the impregnation yield.

1. Introduction

Each type of impregnation under reduced pressure, referred to as vacuum impregnation, accelerates mass transfer in the liquid–solid system, reduces porosity, and improves material permeability; hence, the process is widely applied in the production of engine blocks and heads, power and brake systems, and aircraft undercarriage elements [1]. It facilitates engineering of the structure (Food Matrix Engineering) [2,3,4,5] and functional features of materials, simultaneously enhancing their physicochemical stability [6,7]. Impregnation, which contributes to shortening the time of unit operations without disturbing the original structure of tissues [8], is applied in the production of food for modification, enrichment, or improvement of its quality [9].
Vacuum impregnation consists of the following phases: reduction of the pressure in the system (up to over 3 kPa), maintenance of the pressure for a specified time, restoration of the atmospheric pressure in the system, and maintenance of this pressure in the system during relaxation. In a porous food raw material-liquid system, there are coupled phenomena of material deformation and relaxation induced by expansion of gas escaping from pores and the outflow of liquids from free spaces [10,11,12] as well as the impact of the impregnating liquid on the material structure. Deformation–Relaxation Phenomena (DRP) dominatein the first and second phase of the process and the Hydrodynamic Mechanism (HDM) dominates in the last two phases when the impregnating liquid permeates the structure of the material. This is accompanied by deformation and opposite-direction relaxation of the material (compression) [13]. The pore volume decreases until establishment of equilibrium [14]. The process is determined by synergistic external factors (process conditions including pressure and temperature, properties of the impregnating liquid, time of vacuum maintenance, time of relaxation, viscosity and concentration of the impregnation solution, the size and shape of the material, and the ratio of material mass to the solution mass) and internal factors (properties of the impregnated material and its three-dimensional architecture) [4].
Processes occurring on the plant material-surrounding liquid surface are examined with an assumption of cylindricity of the material pores. Determination of the process parameters is difficult, hence the discrepancies in the results of different investigations [14,15].
Application-targeted research is focused on the process itself and impregnating liquids, which together with their functions, e.g., protection against rupture and disintegration of material cells during the drying, canning, or freezing processes, may constitute the “know-how” [16]. A reduced process temperature decreases the likelihood of thermal damage to organic tissue and sustains its structure, whereas the use of a sugar solution prevents loss of the volatile aroma of fresh fruit and discoloration caused by enzymaticoxidative browning [17].
Impregnation often precedes heat treatment [18], and partial removal of water, reduction of pH, and introduction of additional components to the material intended for freezing do not affect the integrity of the material and contribute to prolongation of shelf life at low temperatures [16]. This distinguishes impregnation from other methods of acquisition of new products [19]. The modification of the structure of fruits and vegetables does not destroy their cellular structure, but ensures mass transfer during osmotic dehydration of the material [20] and changes the physical properties of the material, e.g., thermal conductivity and dielectric properties, which have a great impact on the technological processing of fruits and vegetables [21].
The aim of the study was to determine the impact of selected impregnation parameters on the degree of permeation of the model material tissue by the impregnating solution. The degree of permeation of the model plant tissue by an impregnation staining solution was a measure of the effectiveness of the impregnation process. The impact of the method of impregnation process, pressure, pressure change rate, vacuum maintenance time, relaxation time, and the coefficient of impregnating liquid viscosity on the effectiveness of the vacuum impregnation process was investigated.

2. Materials and Methods

A cylinder with diameter d = 17 mm and height h = 20 mm was cut out from the model material, i.e., Jonagold apple tissue. The height of the cylinder was greater than the diameter (h>d), because further research was carried out on its cross-section.
Water stained with a 2% Tris(4-(dimethylamino)phenylo)methylium chloride solution (2% methylene violet, (Avantor Performance Materials Poland) was the impregnating liquid [22,23]. The viscosity coefficient of this solution was 1 mPa·s.Additionally, water and starch syrup solutions stained with 2% methylene violet with a calibrated viscosity coefficient η [mPa·s] of 1, 50, 100, 200, and 400mPa·s were used to determine the impact of the viscosity coefficient on the degree of permeation of the apple tissue by the impregnation solution.
The viscosity coefficient of the impregnating liquid was controlled with a Brookfield viscometer: model LVDV-II+PRO (Brookfield Engineering Laboratories Inc. Middleboro, MA, USA). Temperature was stabilized with a water bath. The viscosity coefficient was determined with the use of an S-62 spindle at a rotational speed value ranging from 6 to 60 min−1. Computer software Rheocal v3.1 (Brookfield Engineering Laboratories Inc. Middleboro, MA, USA) was used to record the data and control the viscometer.Measurements took place at 20 °C.
The present investigations were based on both wet and dry impregnation methods as well as a cyclic wet impregnation method, which was not included in the classification mentioned above.
The impregnation process was carried out in a 2dm3 chamber connected to a vacuum pump regulating the pressure in the chamber in the range of 5kPa–atmospheric pressure (pATM).The experiments were conducted at a temperature of 20 °C, which was the same as the temperature of the impregnating liquid. The volume of the impregnating solution was 0.5dm3. The course of the subsequent experiments varied depending on the type of the impregnation process employed. Figure 1 describes the process of vacuum impregnation and its individual phases.

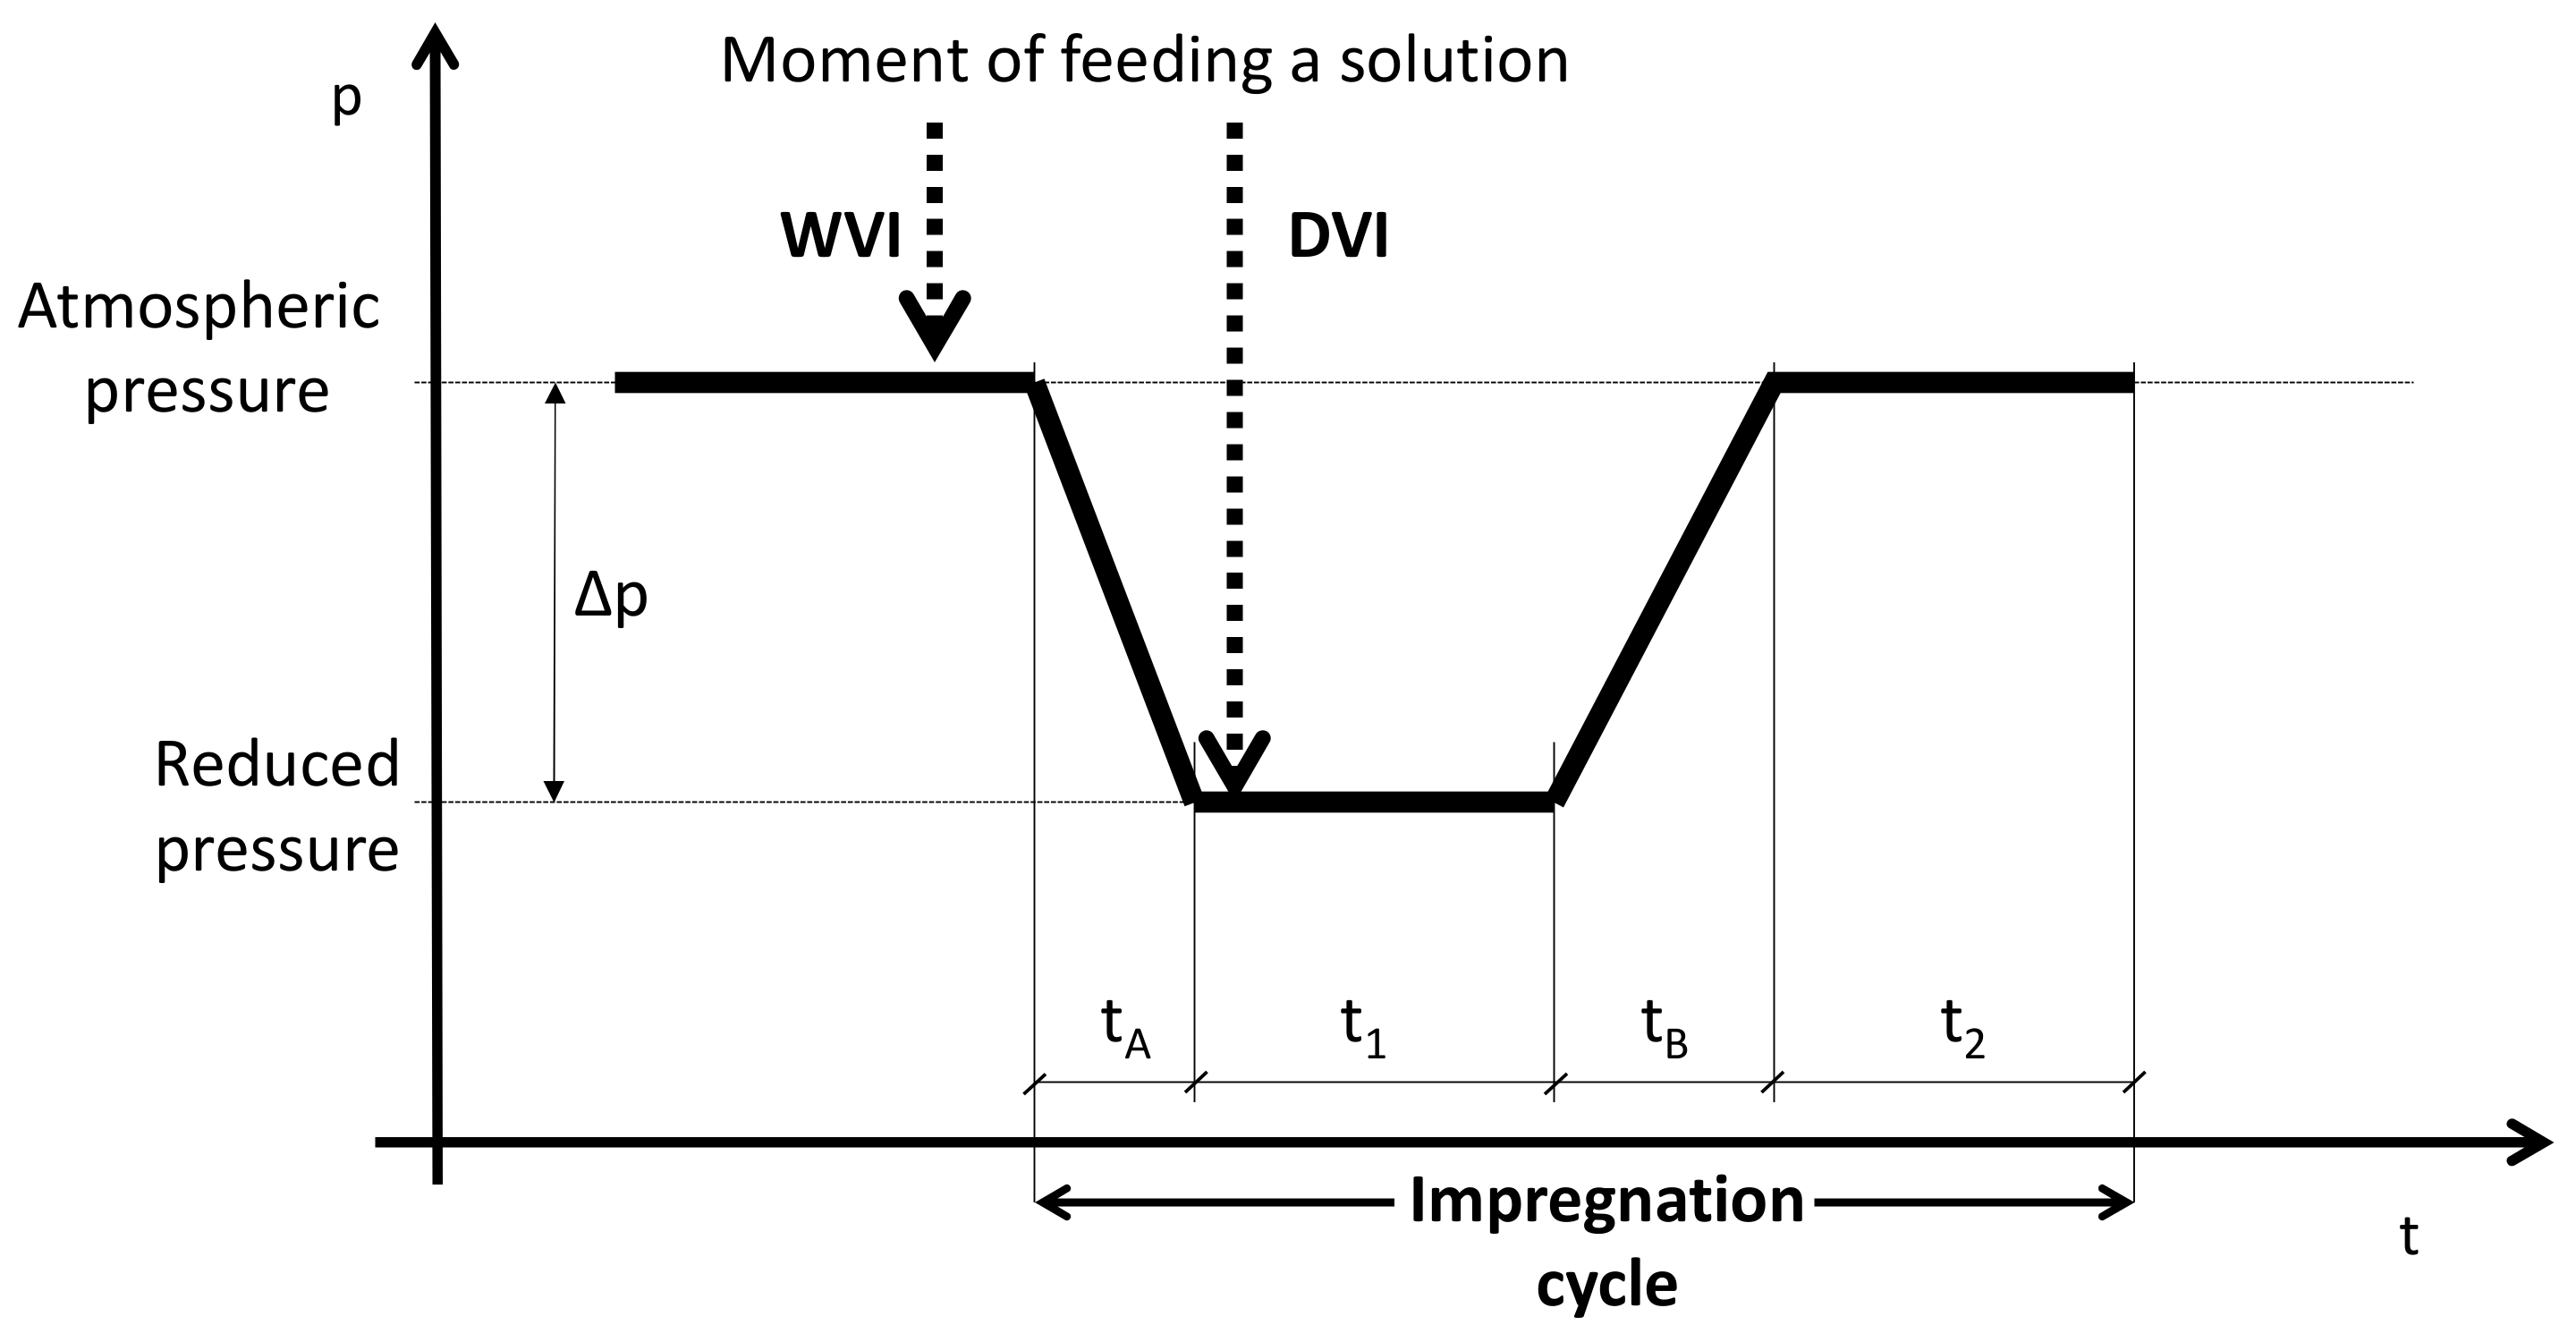
2.1. Wet Vacuum Impregnation (WVI)

In the case of wet vacuum impregnation (WVI), apple tissue samples were placed in a liquid-filled chamber. The pressure was reduced to 5 kPa after sealing the chamber. The programmed pressure changerates Δ p t A were 5, 10, and 30kPa·s−1 respectively. Then, the chamber remained under vacuum for 0, 100, 300, 600, and 900 s. Later, the chamber pressure returned to atmospheric pressure at a speed Δ p t B of 5, 10, and 30 kPa·s−1. The last impregnation phase was carried out at atmospheric pressure and lasted 0 to 900 s.

2.2. DryVacuum Impregnation (DVI)

During dry impregnation, the material was placed in an empty chamber, in which the pressure was reduced to 5 kPa. Under such conditions, the impregnation liquid was injected into the chamber. Then, the system maintained a vacuum in the chamber for time t1. After the atmospheric pressure was restored in the chamber, the system was maintained over time t2 after the impregnation. All impregnation parameters in the DVI method were the same as in the WVI method.

2.3. Cyclic Wet Vacuum Impregnation

In the cyclic WVI experiments, the impregnation cycle was repeated 5 and 10 times without disrupting the contact of between the impregnating liquid and the impregnated material.

2.4. Control

The control was impregnation at atmospheric pressure. It was (pATM) carried out concurrently with the other experiments, serving as a reference system. In the case of WVI, impregnation at atmospheric pressure was carried out by immersing the material in the liquid in the chamber. In the DVI impregnation setup, the impregnating liquid was poured over the analyzed material placed in an empty chamber. The impregnation workbench is presented in Figure 2.

2.5. Image Analysis

After the process of apple tissue impregnation with the staining solutions, cross-sections of the samples were prepared for analyses. Cylindrical samples with diameter d = 17 mm and height h = 20 mm were cut at the midheight. Each cross-section was photographed with an OLYMPUS C5060 digital camera (Olympus Europe, Germany). To determine the degree of tissue staining with the impregnating solution (uS), the image was analyzed using the PHOTOSHOP CS5graphics program (Adobe Inc. San Jose, CA, USA). The histogram function was used, in which, in the first step, the percentage of the entire sample surface extracted from the background was calculated. The second step was to calculate the percentage of the surface stained with the impregnation solution. The penetration rate of the impregnating substance was calculated as the ratio of the percentage of colored surface to the percentage of the entire surface of the sample.
These experiments were carried out in five replications(fivecylindrical apple tissue samples excised from different parts thereof were placed into the vacuum chamber at one time). The arithmetic mean and standard deviation were calculated in all cases.
The subjects of analysis in the study werethe impregnation method, the pressure change rate in various stages of the time to maintain the vacuum (t1) and the time of relaxation (t2).
All results were analyzed for significance by means of Tukey’s honest significant difference test (HSD) at a significance level of α = 0.05using the STATISTICA 13.3 package.

3. Results

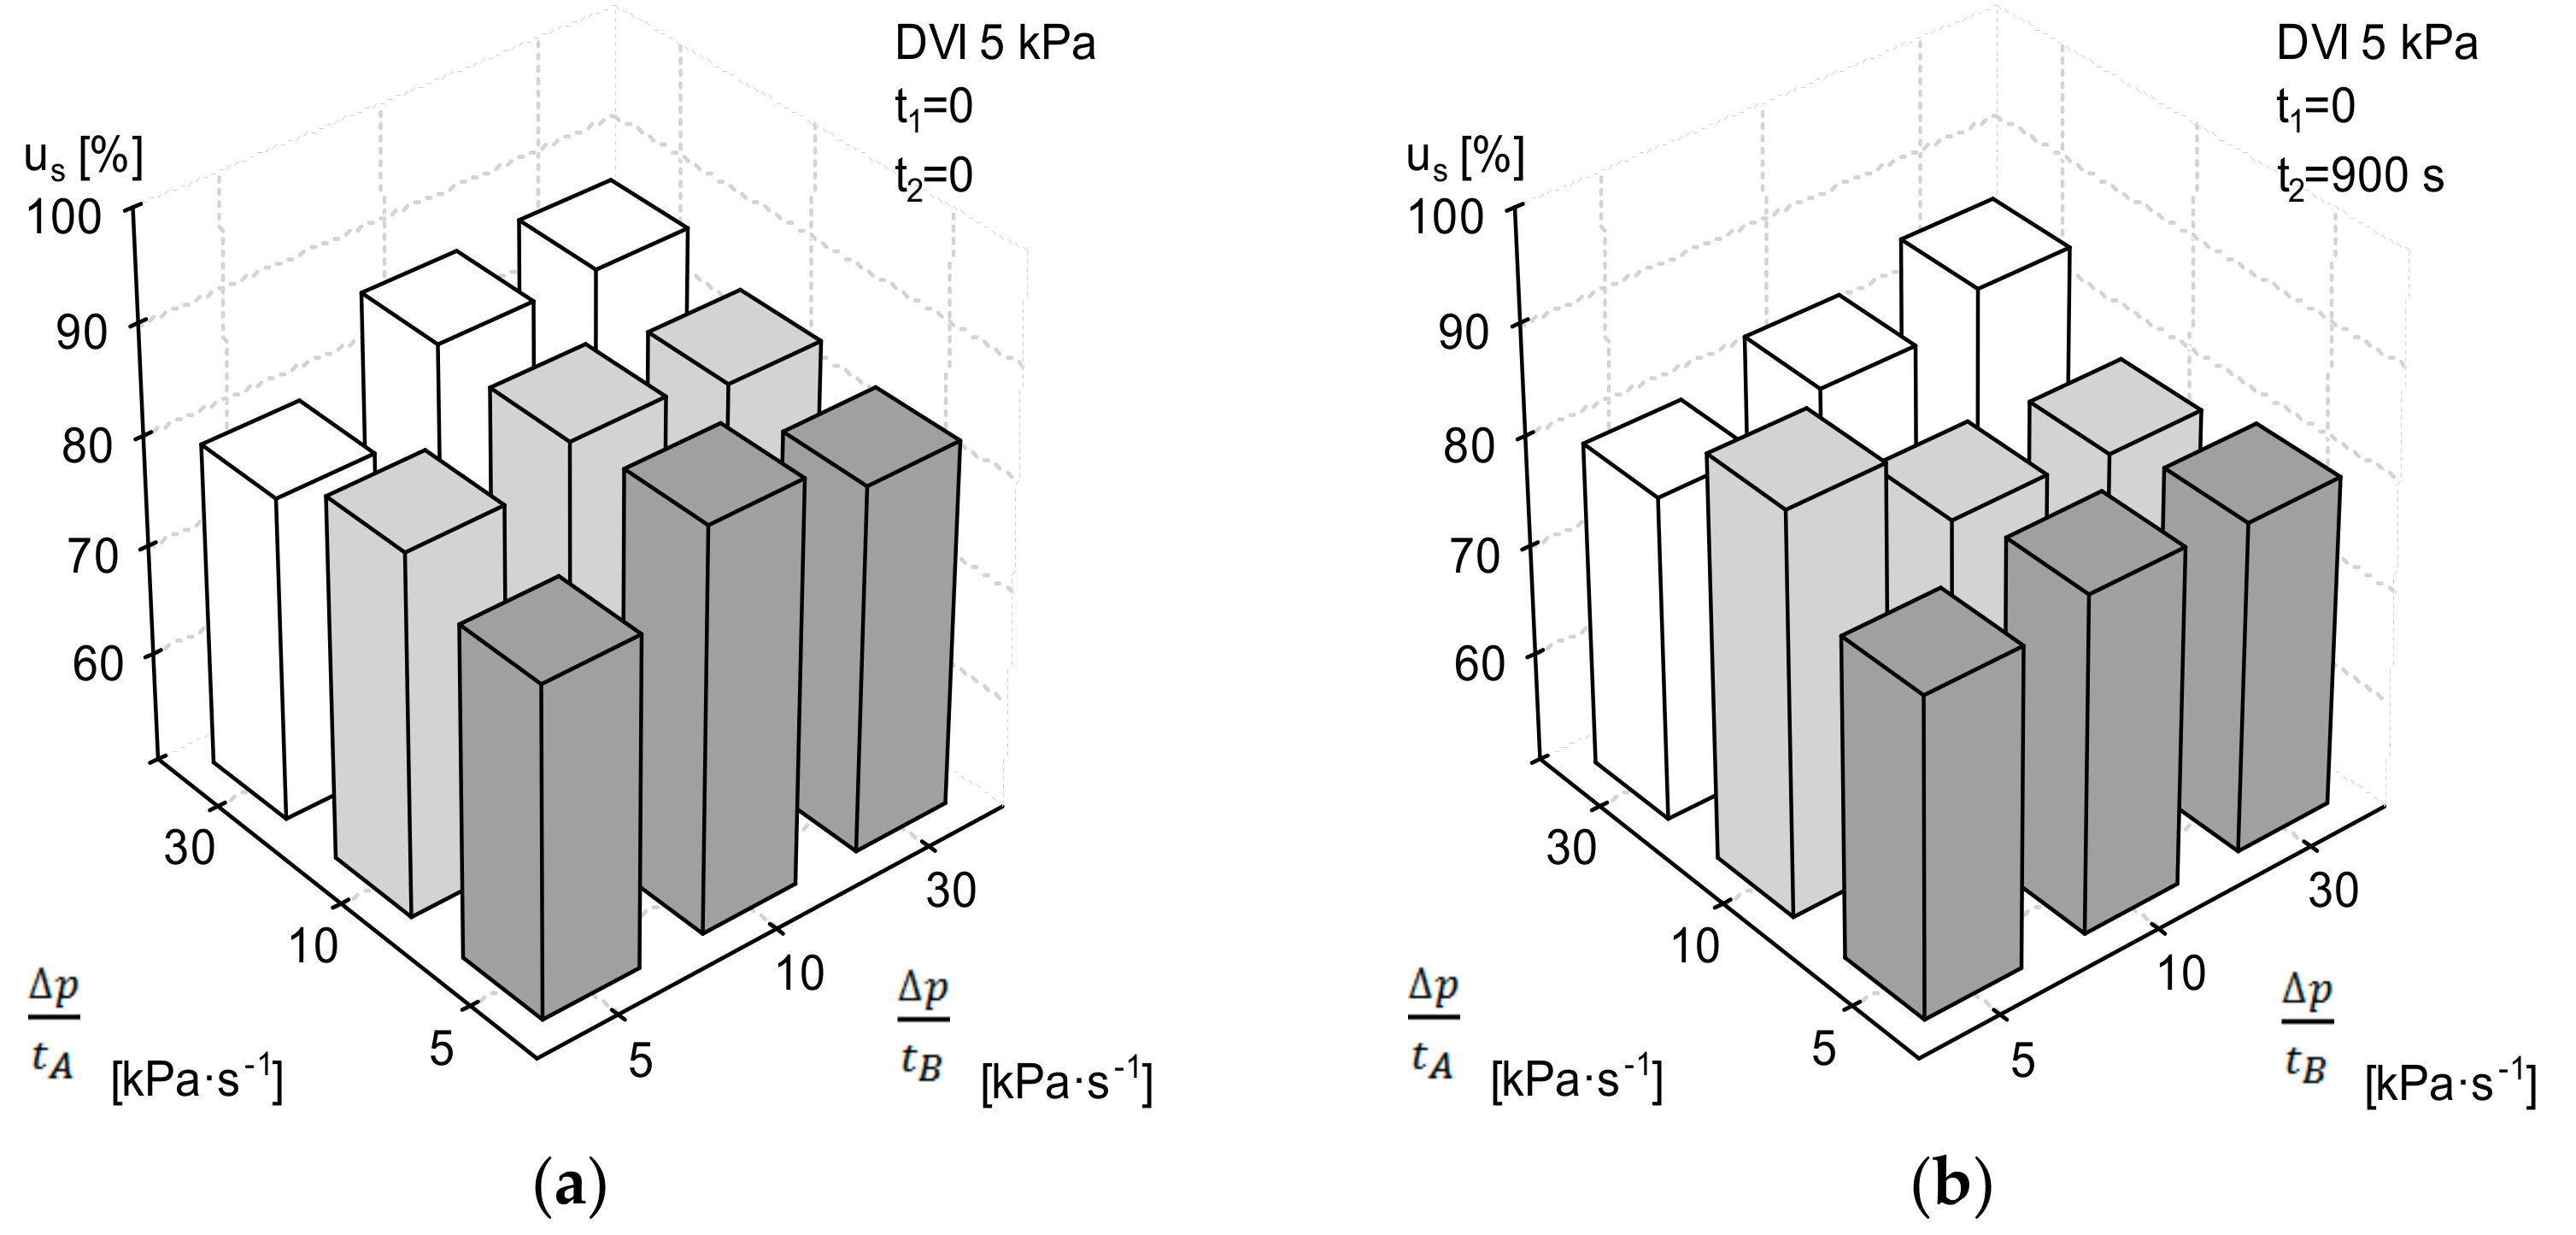
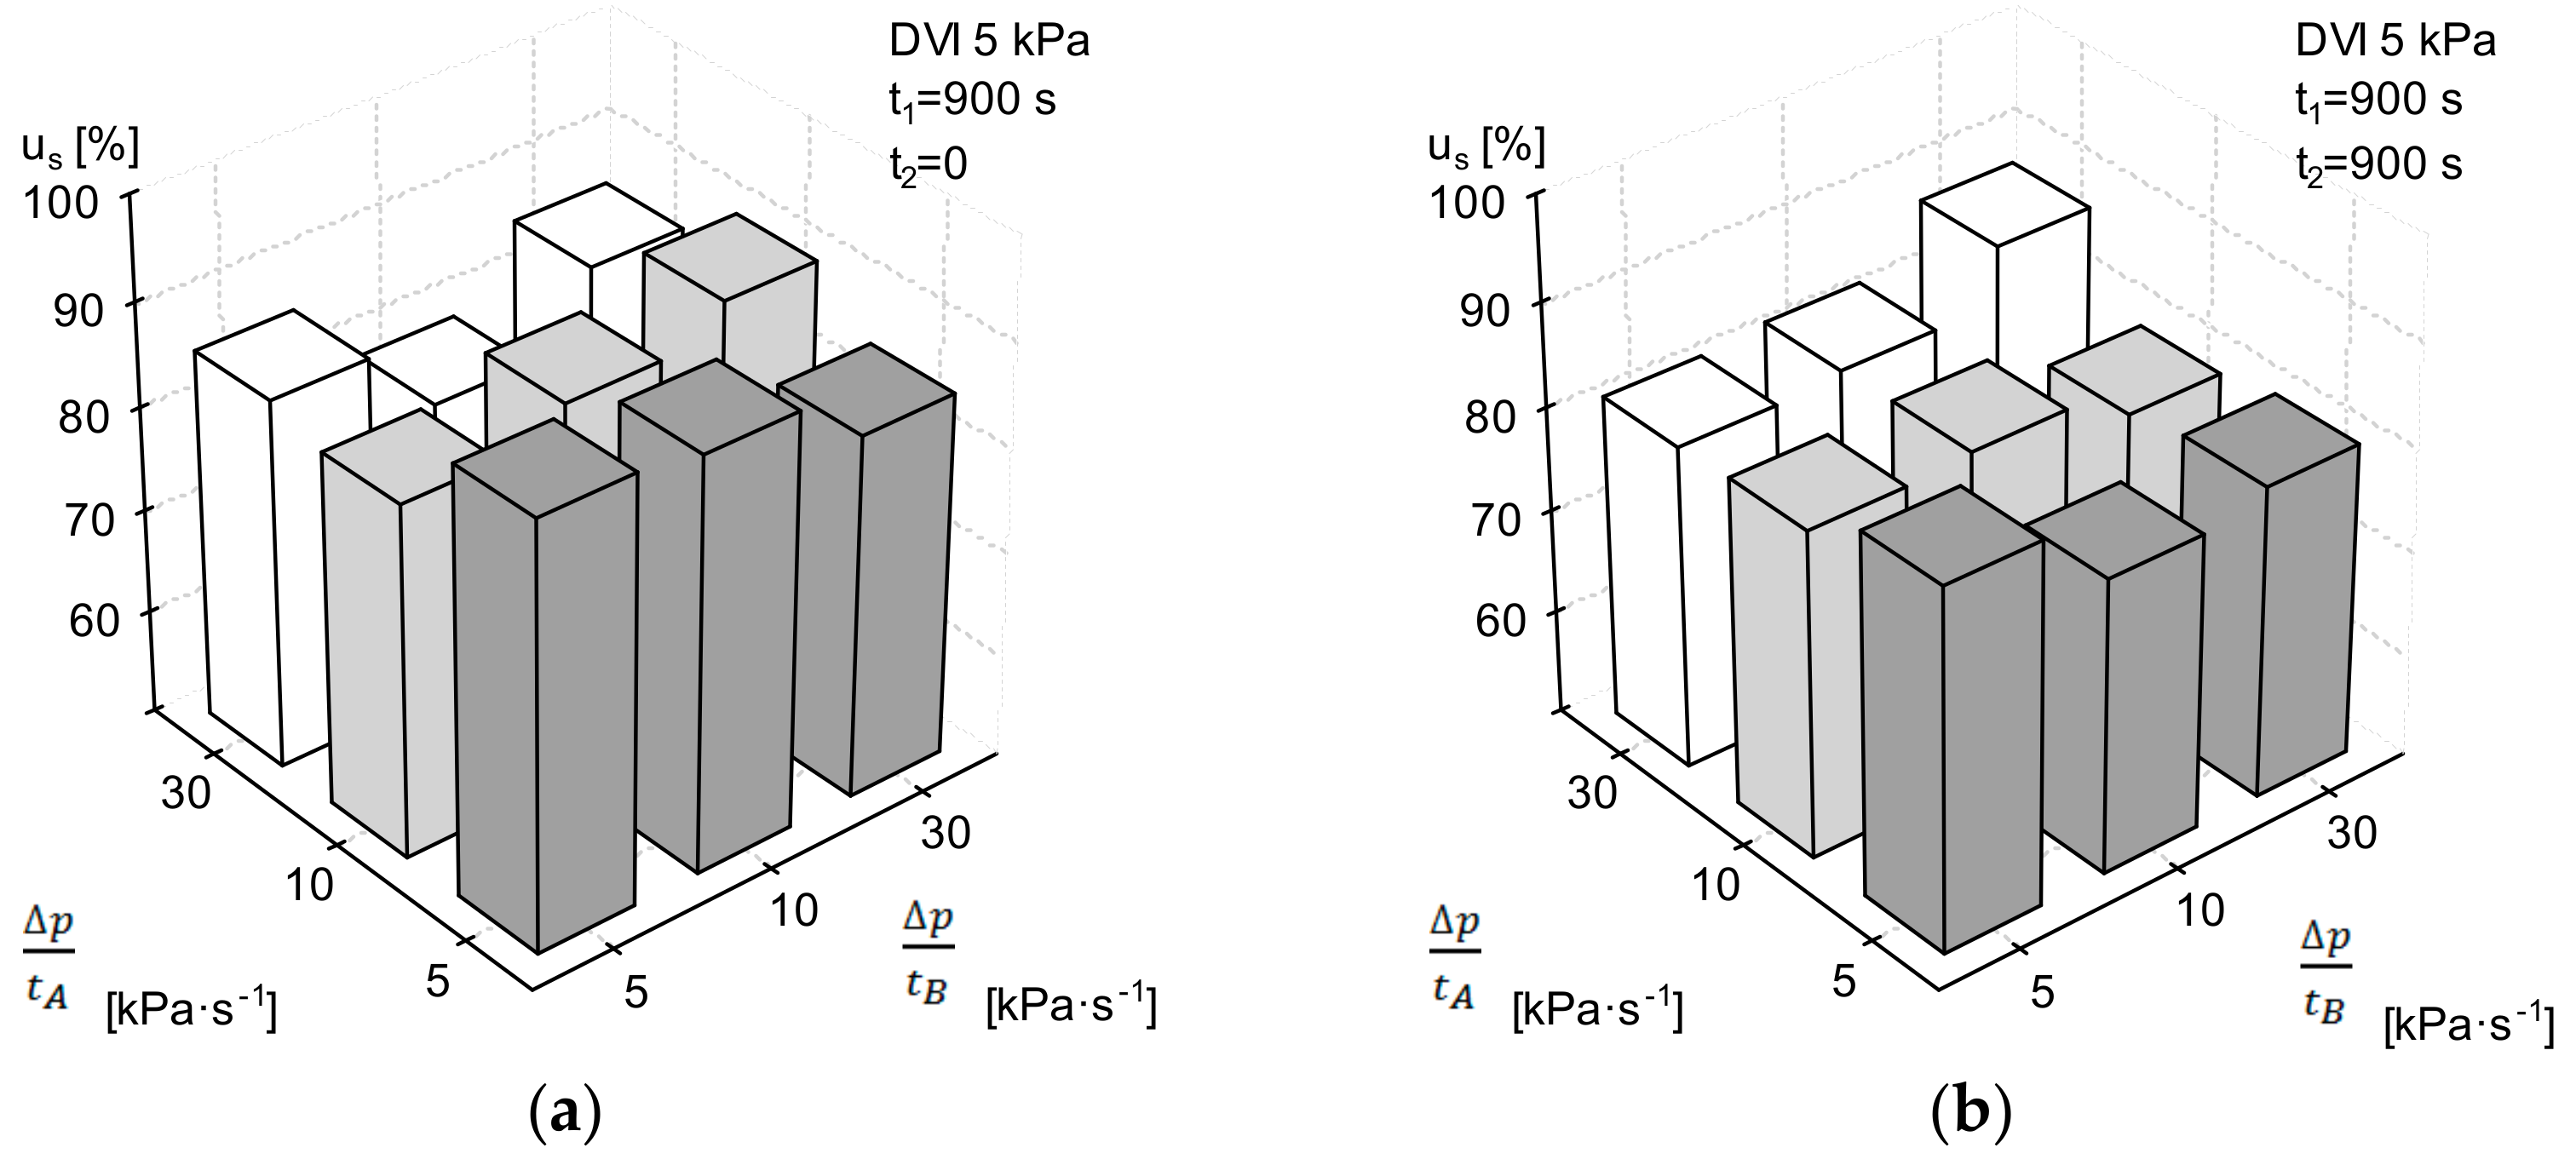
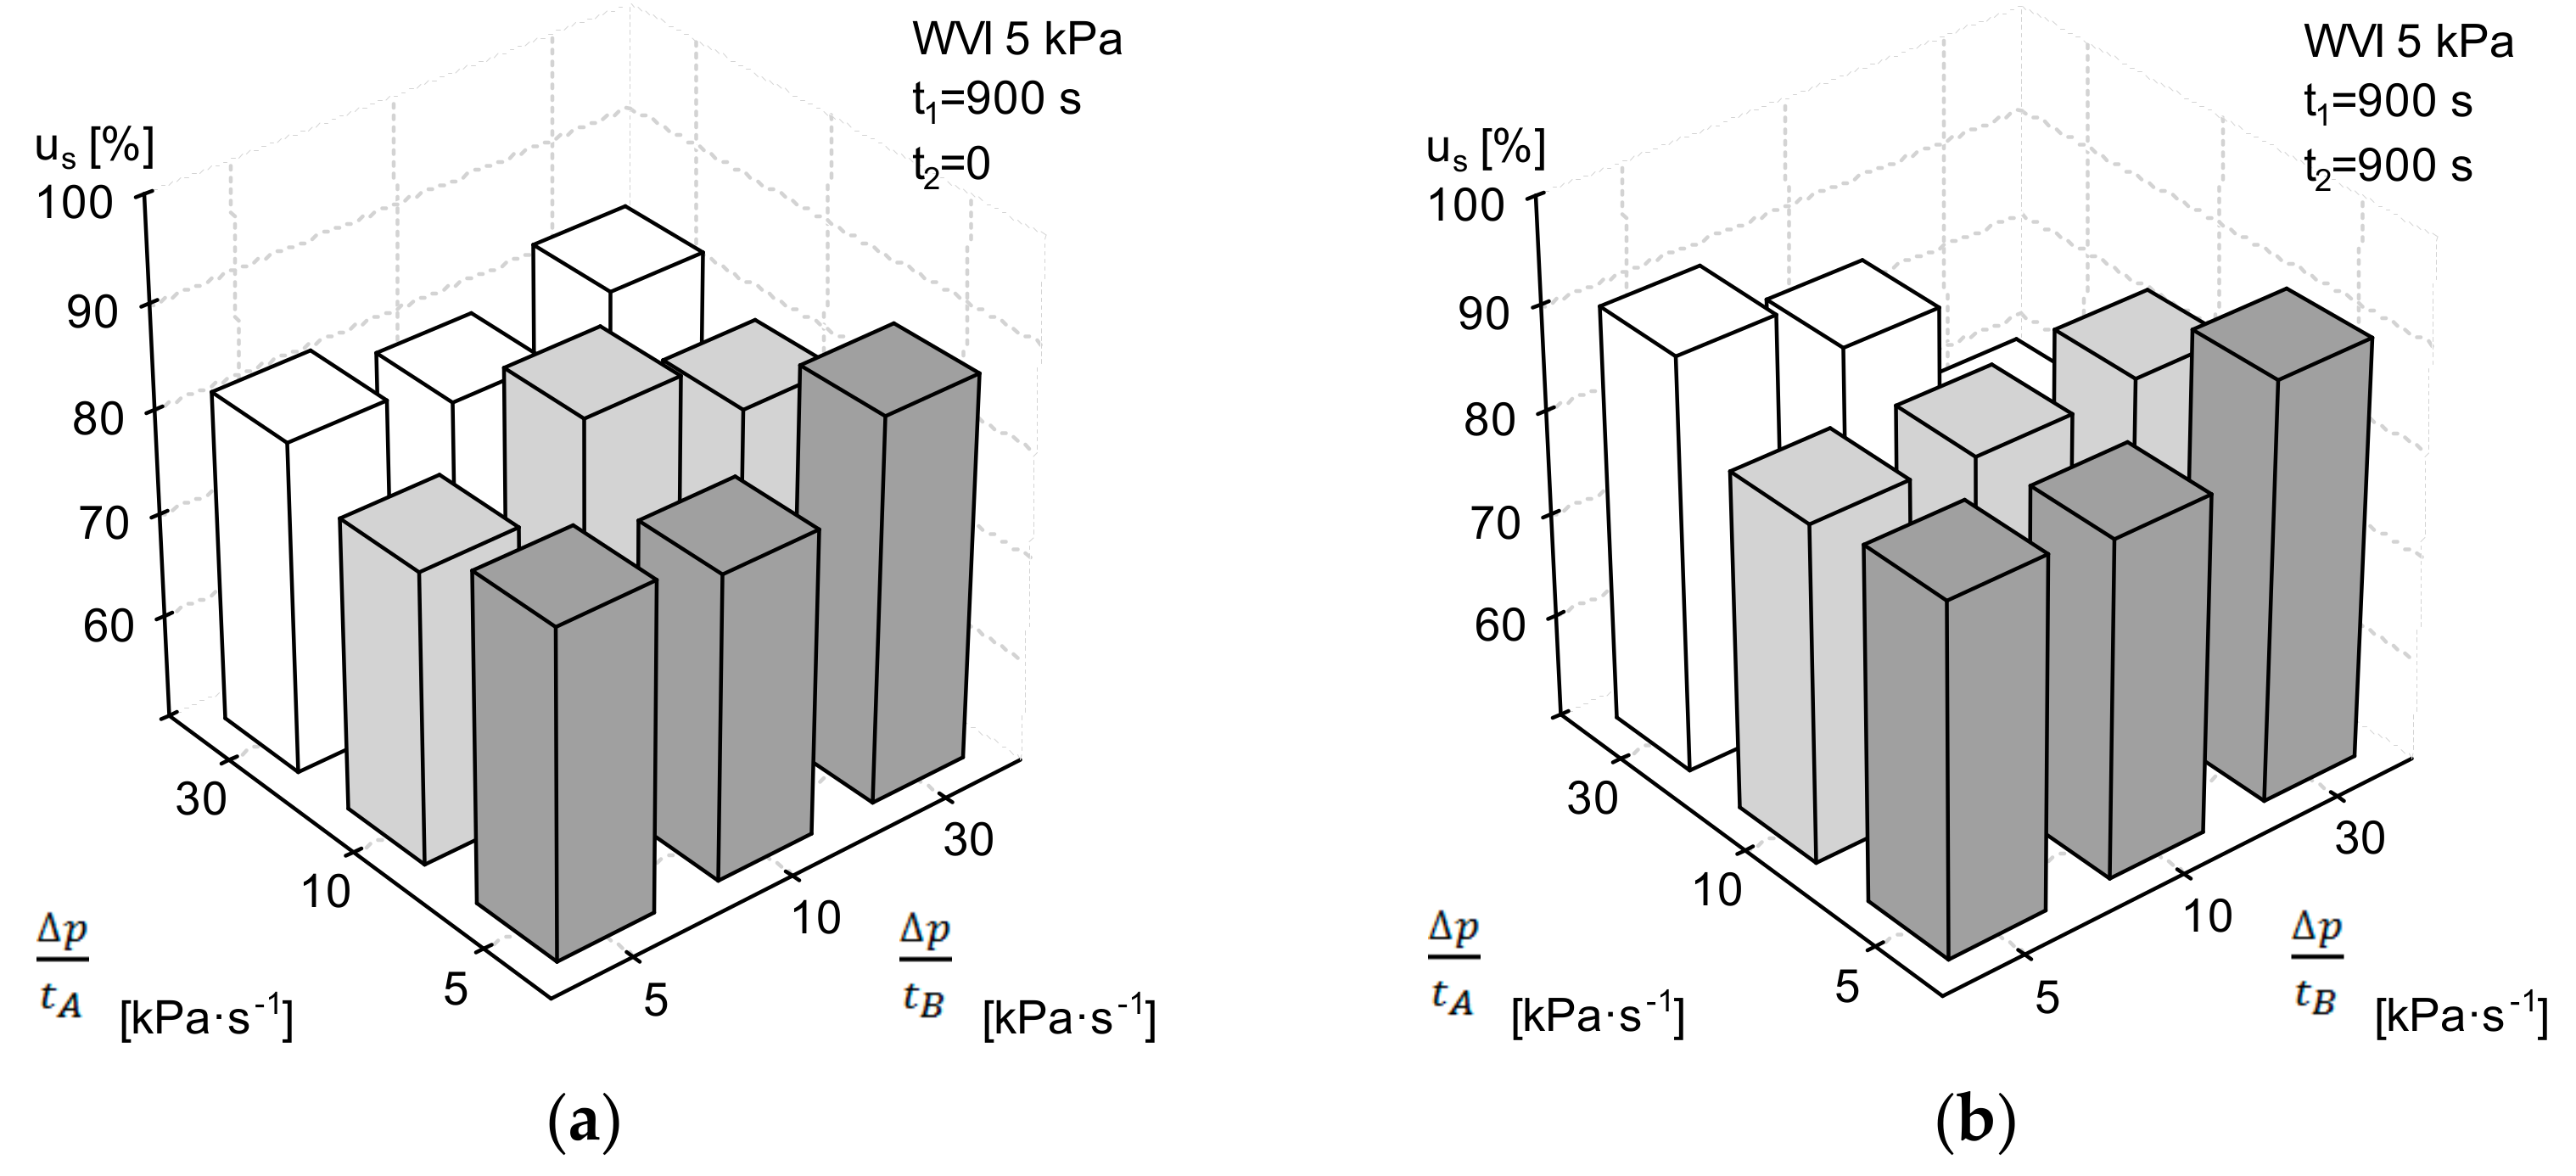
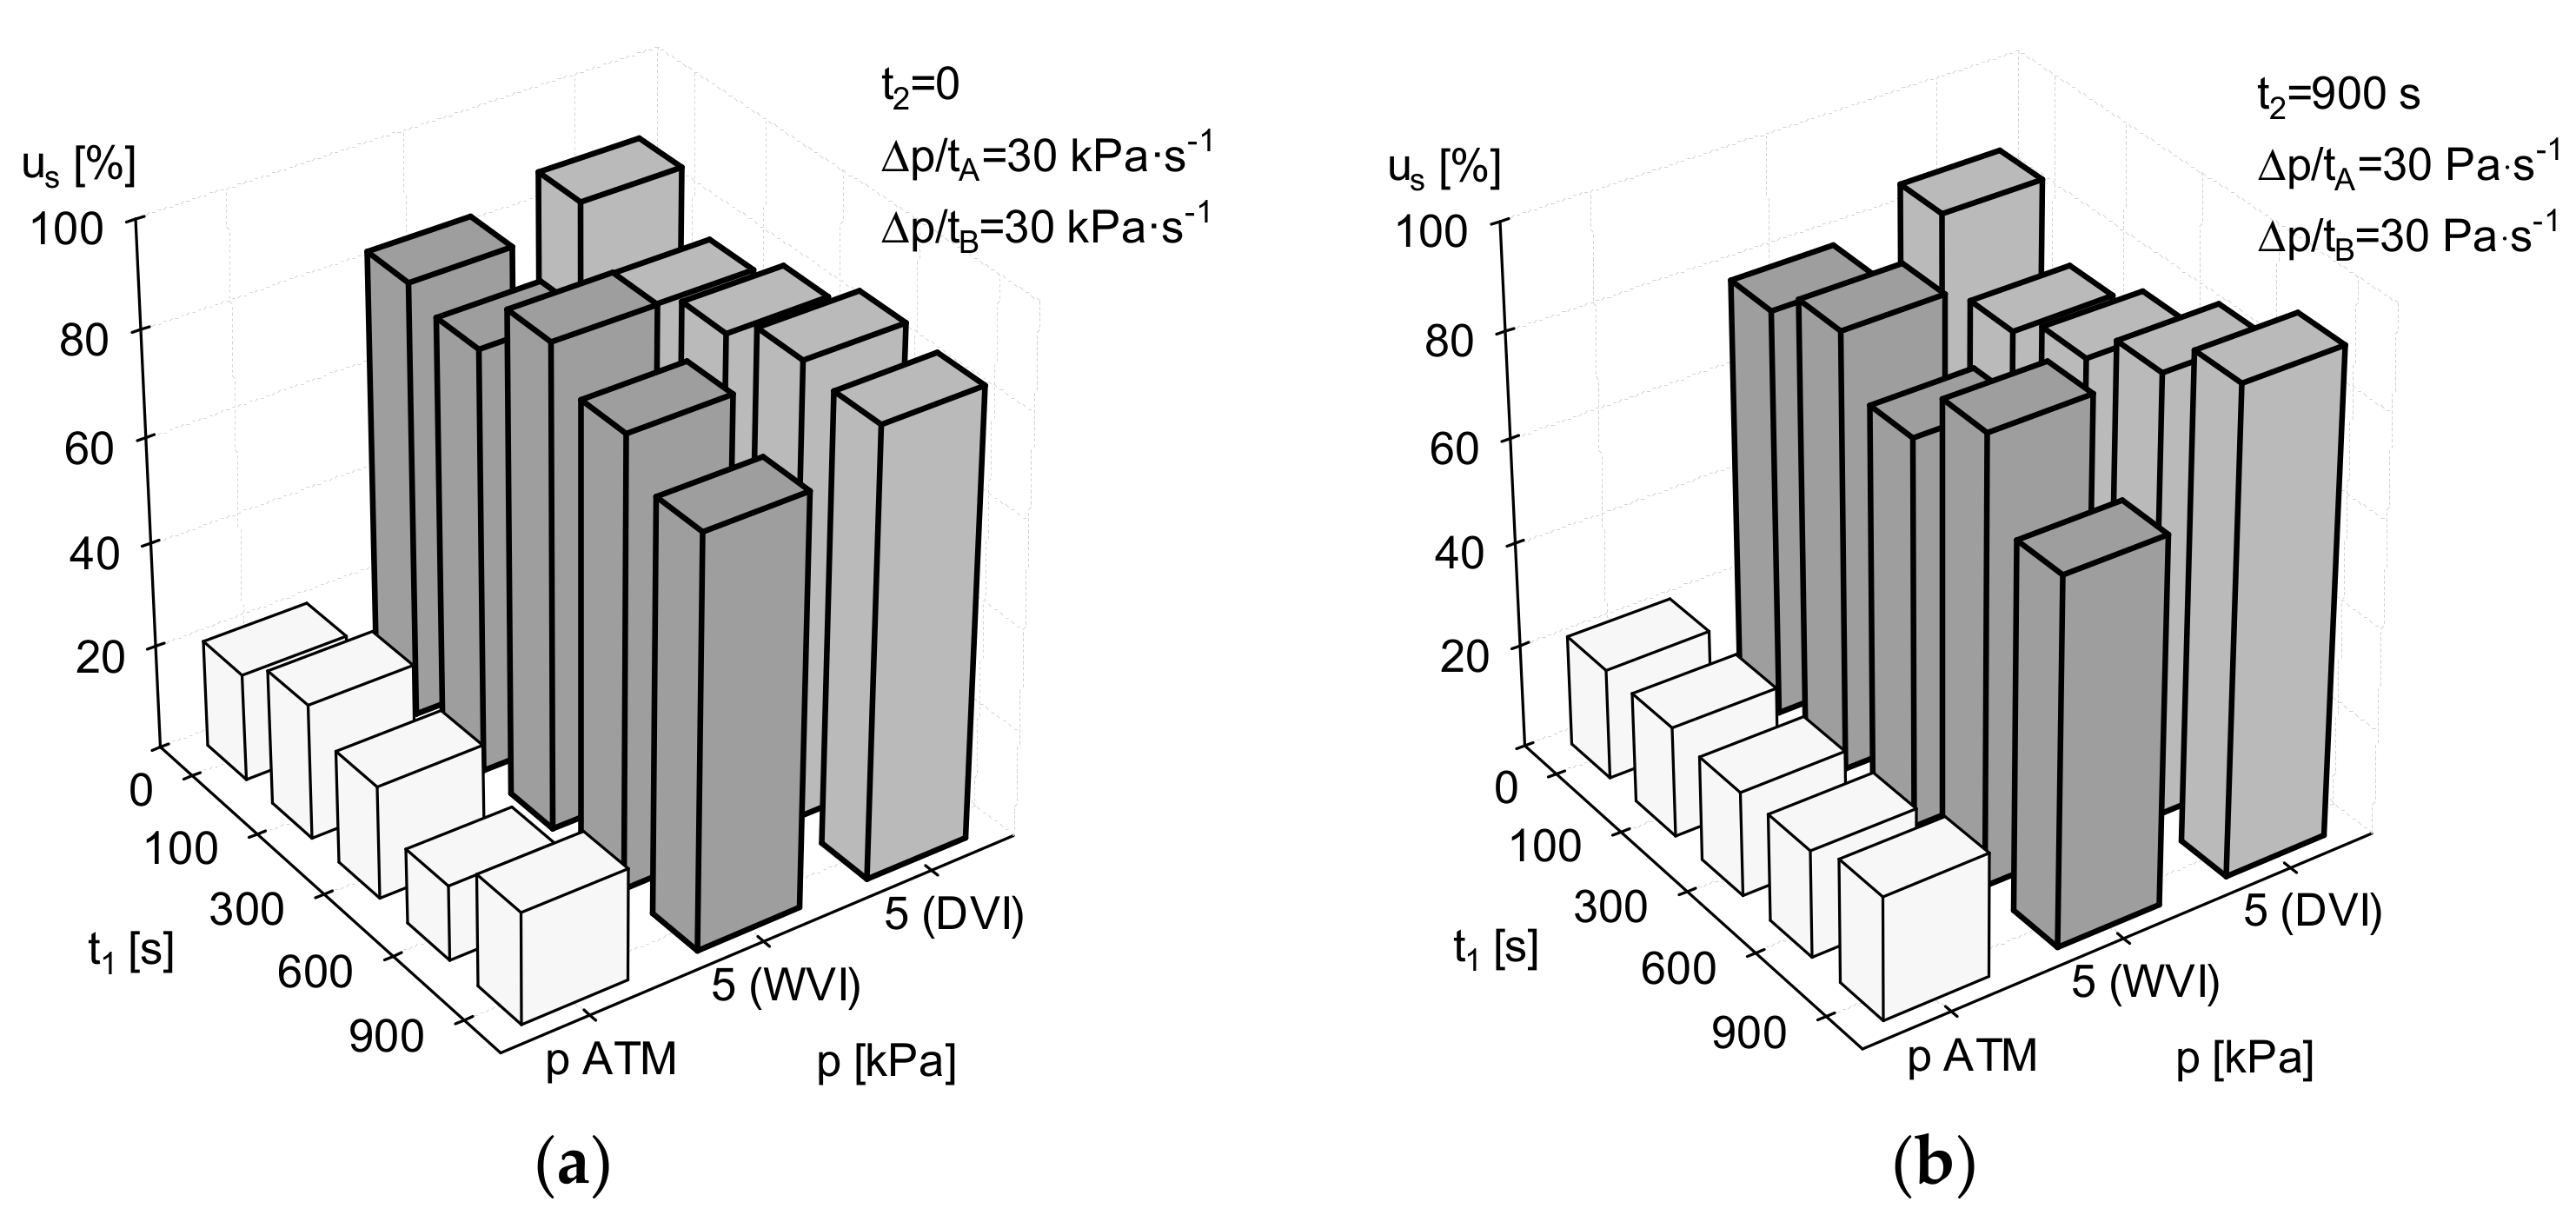
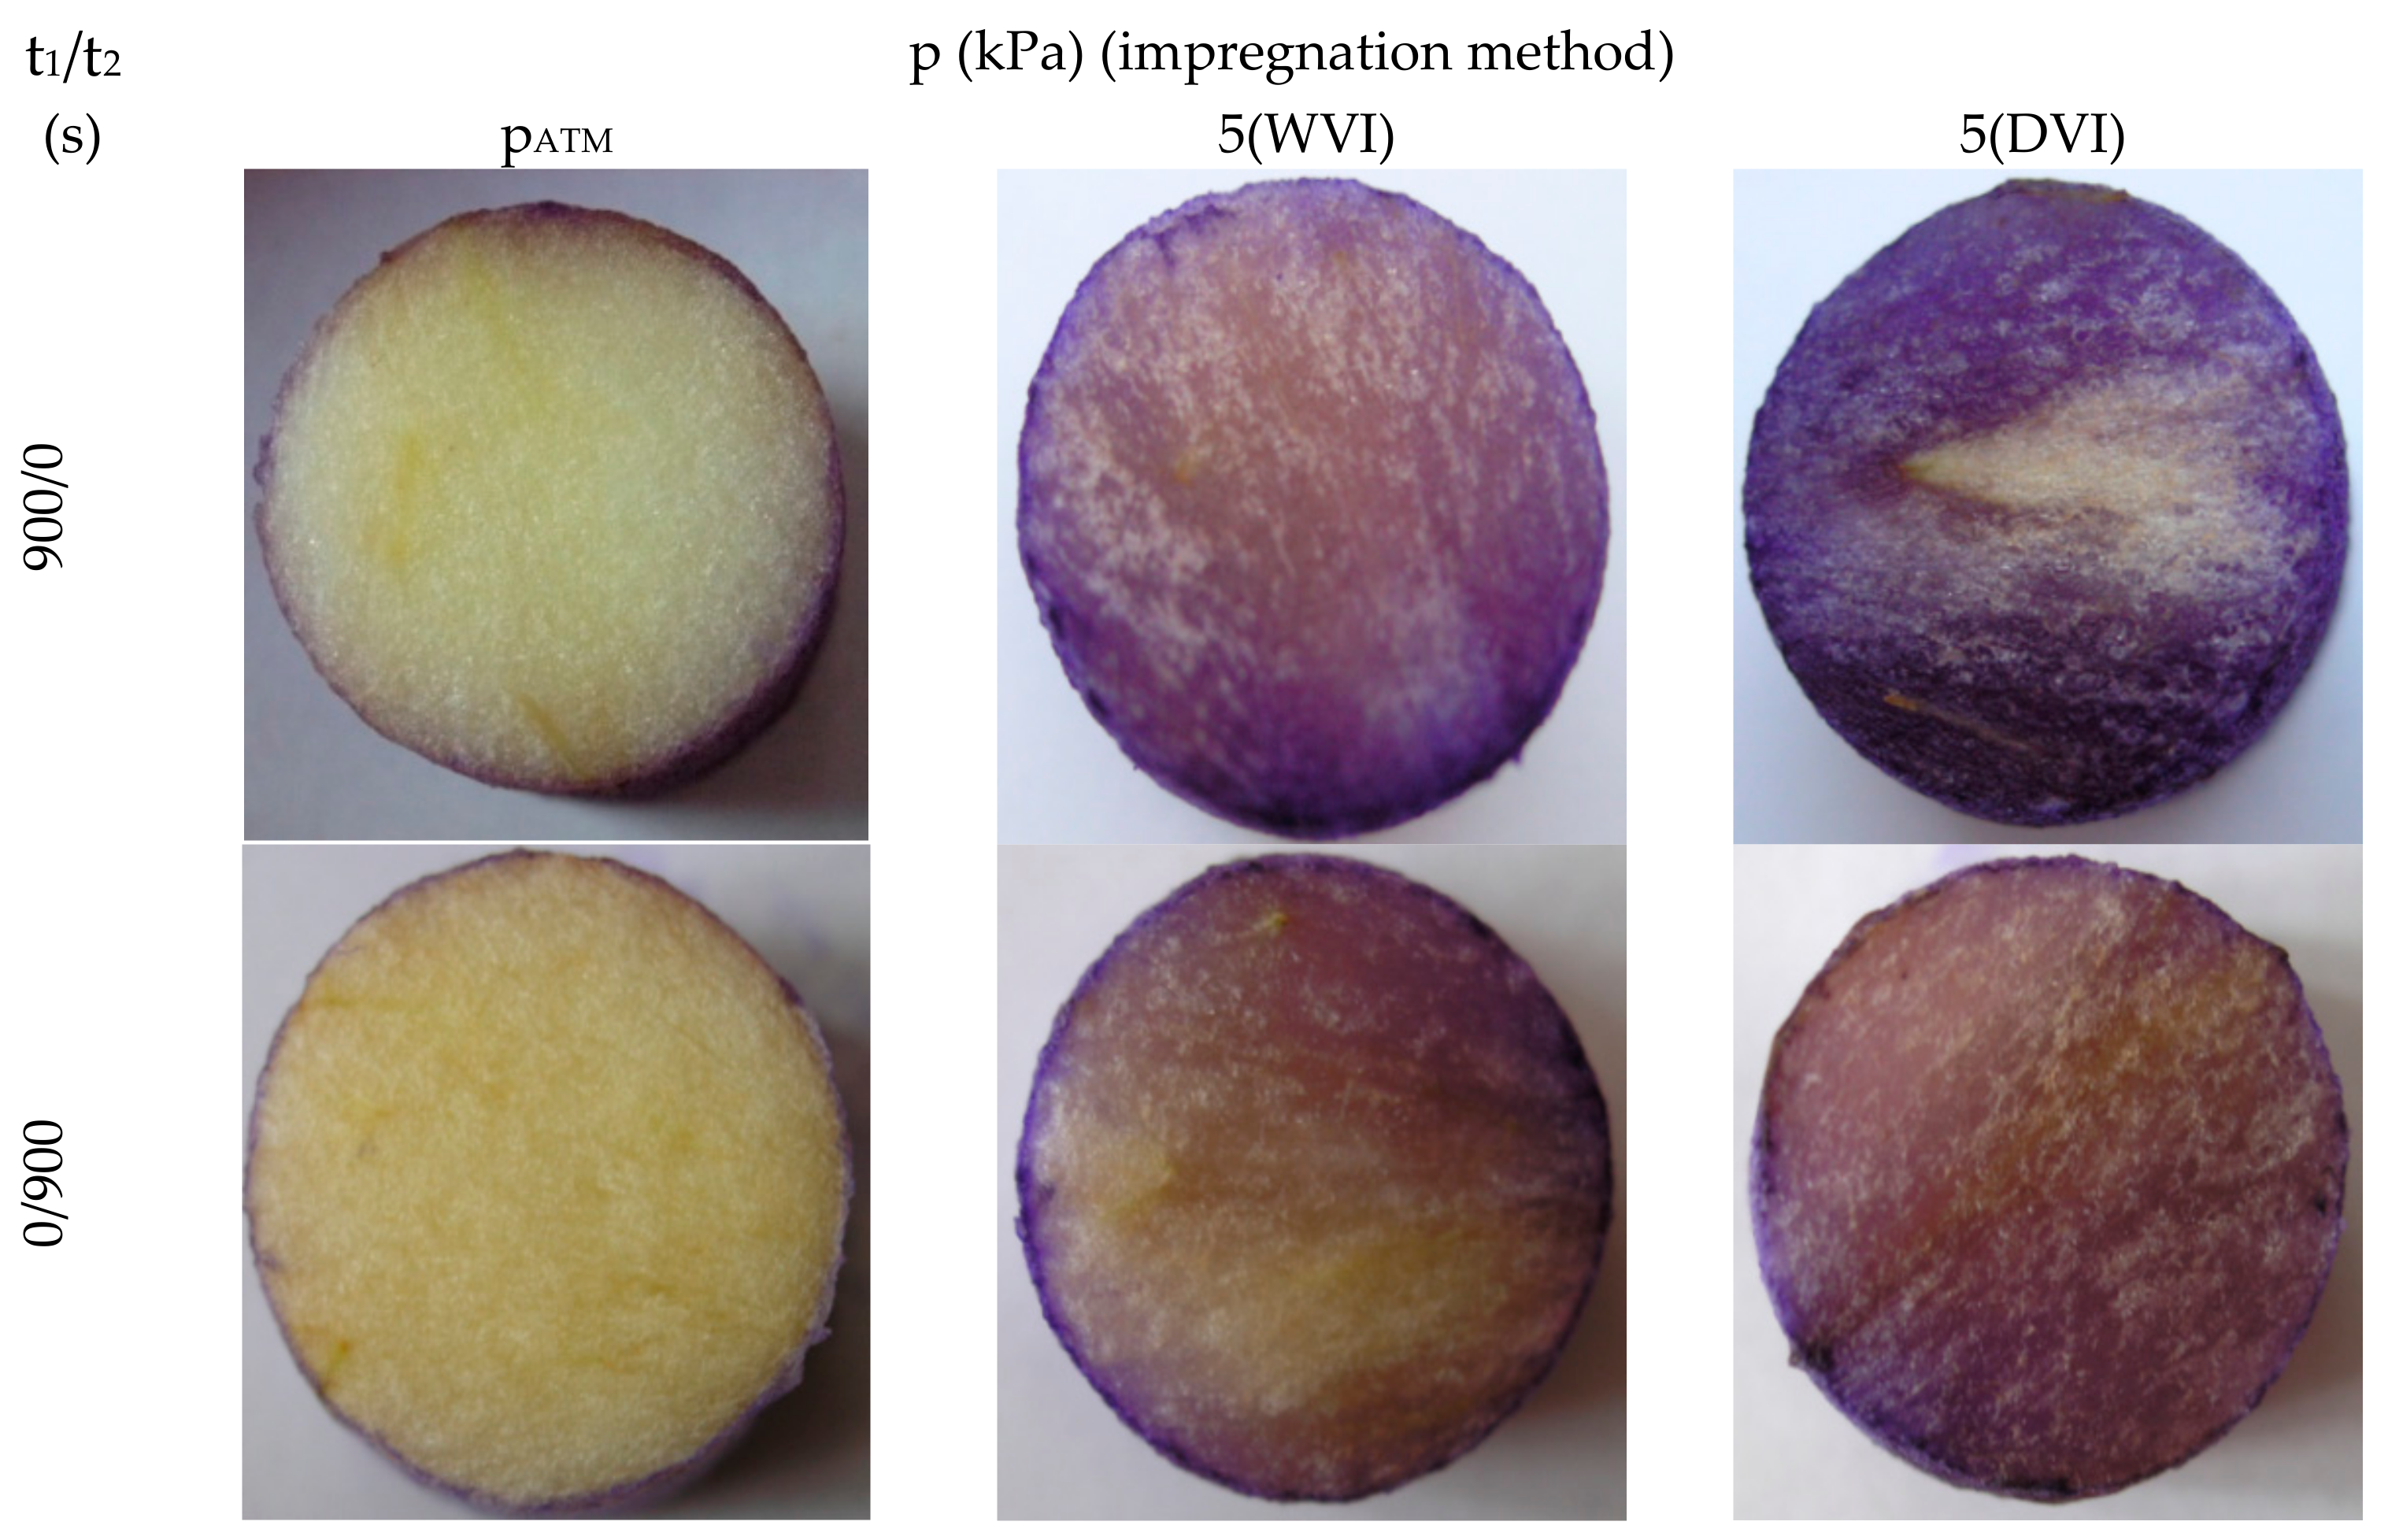
3.1. Influence of Pressure Change Rate, Vacuum Maintenance Time, and Relaxation Time

Figure 3 and Figure 4 present the dependence of the percentage of apple tissue staining uS on the dynamics of pressure changes in phases 1 and 3 of dry vacuum impregnation (DVI) for the selected values of vacuum maintenance time t1 and relaxation time t2.
For time values t1 = t2 = 0, the percentage of apple tissue staining in the dry impregnation process (DVI) ranged from 79.5% for Δ p t A = 30 kPa·s−1 and Δ p t B = 5 kPa·s−1 to 86.8% for Δ p t A = 30 kPa·s−1 and Δ p t B = 30kPa·s−1 (Figure 3 and Figure 4). The standard deviations of the tested value in this experimental cycle ranged from 3.7% to 17.5%. The highest degree of apple tissue staining, i.e., 87.4%, was noted at the maximum values of t1 and t2 and for Δ p t A = Δ p t B = 30 kPa·s−1.
Figure 5 and Figure 6 present the dependence of the percentage of apple tissue staining uS on the dynamics of pressure changes in phases 1 and 3 of wet vacuum impregnation (WVI) for the selected values of vacuum maintenance time t1 and relaxation time t2.
Similar results were obtained in the wet impregnation process (WVI). In this case, the highest percentage of apple tissue staining (90.5%) was recorded at Δ p t A = 30 kPa·s−1 and Δ p t B = 5 kPa·s−1 and at a time value of t1 = t2 = 900 s (Figure 5 and Figure 6). The standard deviations for the impact of the dynamics of pressure changes in the wet impregnation (WVI) process were similar to those calculated for the dry impregnation treatment (DVI). Summing up this investigation cycle, it can be concluded there are no clear trends in the impact of the dynamics of pressure changes in phases 1 and 3 on the impregnation result. Therefore, further investigations of the dynamics of pressure changes were carried out in the maximum value system, i.e., Δ p t A = Δ p t B = 30 kPa·s−1.

3.2. Influence of Vacuum Impregnation Method

Figure 7 present graphs of changes in the percentage of apple tissue staining uS at time t1, at different impregnation methods, and different relaxation time values t2 and for the 30kPa·s−1 pressure change rate in the system in phases 1 and 3.
The impregnation was carried out at atmospheric pressure (pATM) and 5kPa with the dry (DVI) and wet (WVI) method.
Figure 8 presents selected photographs of apple tissue impregnated with water and stained with a 2% methylene violet solution.
The pictures show a strong vacuum impregnation effect, regardless of the method employed. Impregnation of the apple tissue at atmospheric pressure resulted in staining of merely the outer layers of its tissues. Nevertheless, this experimental cycle allowed exclusion of another factor from the research. Since there was no impact of the pressure change rate in the previous step, the investigations were narrowed in terms of the impregnation method. It was noted that the results of the wet (WVI) and dry (DVI) methods did not differ; therefore, the dry impregnation (DVI) mode, which was more complicated, was discarded.

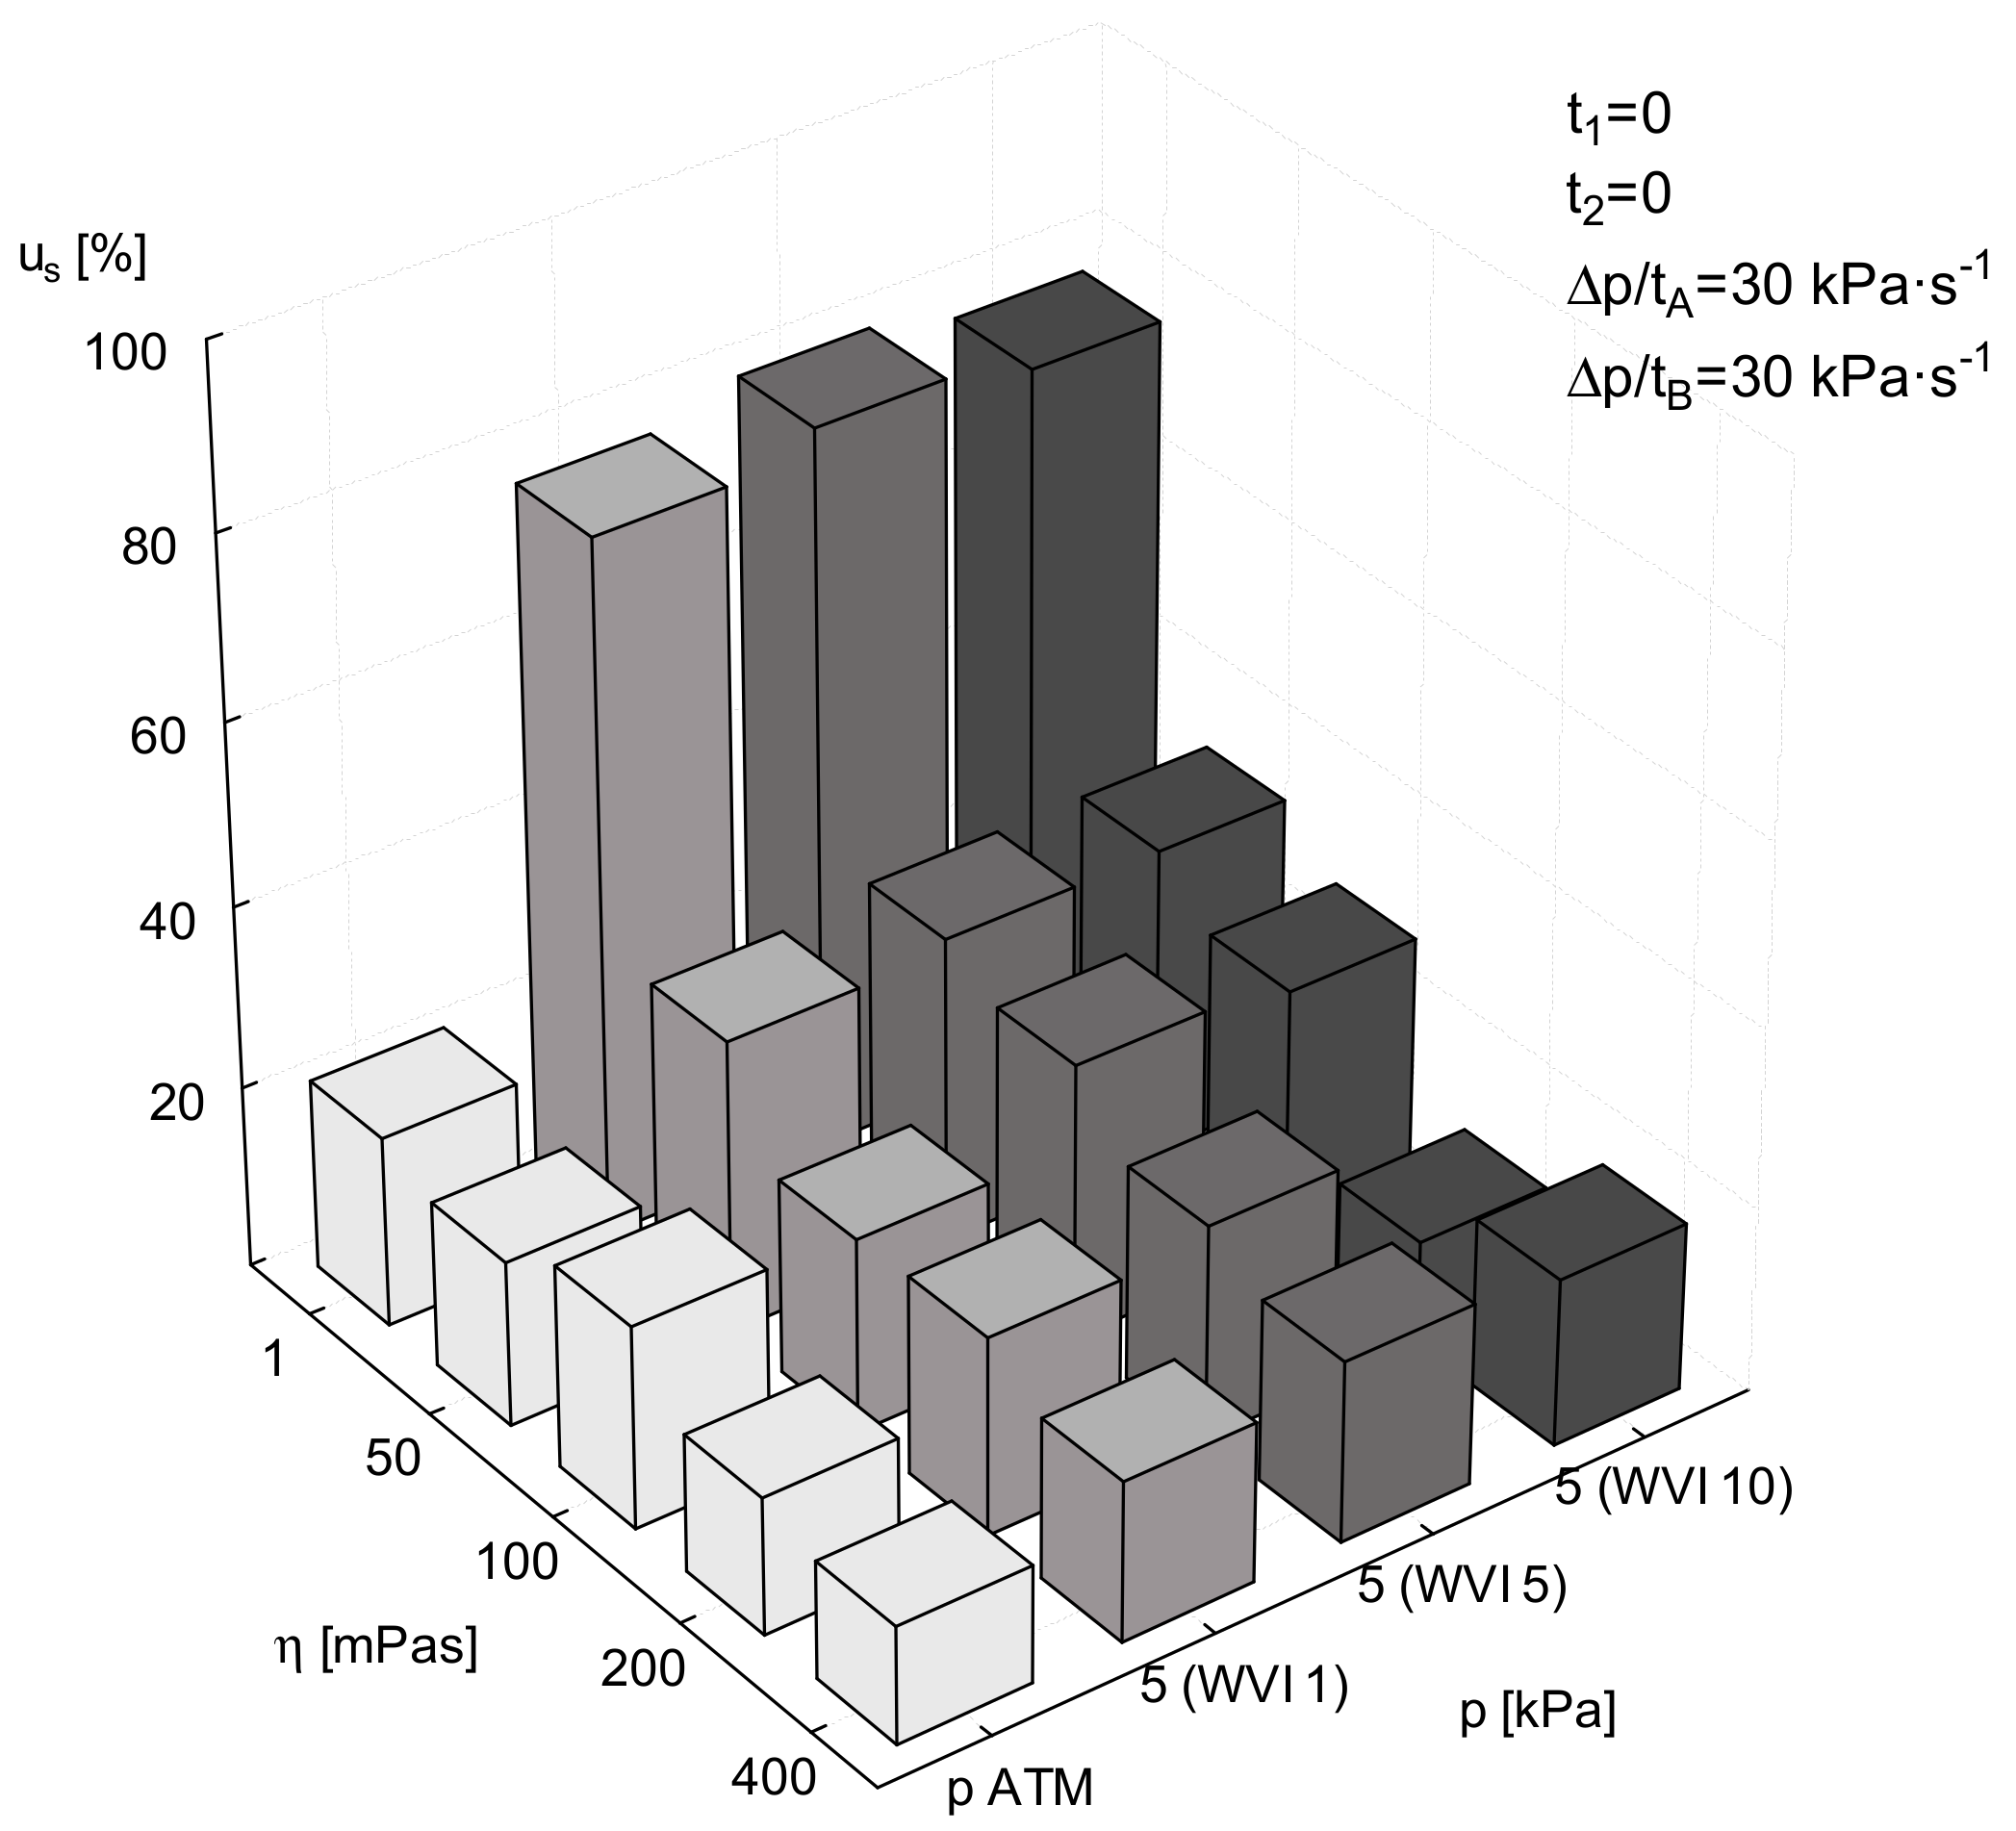
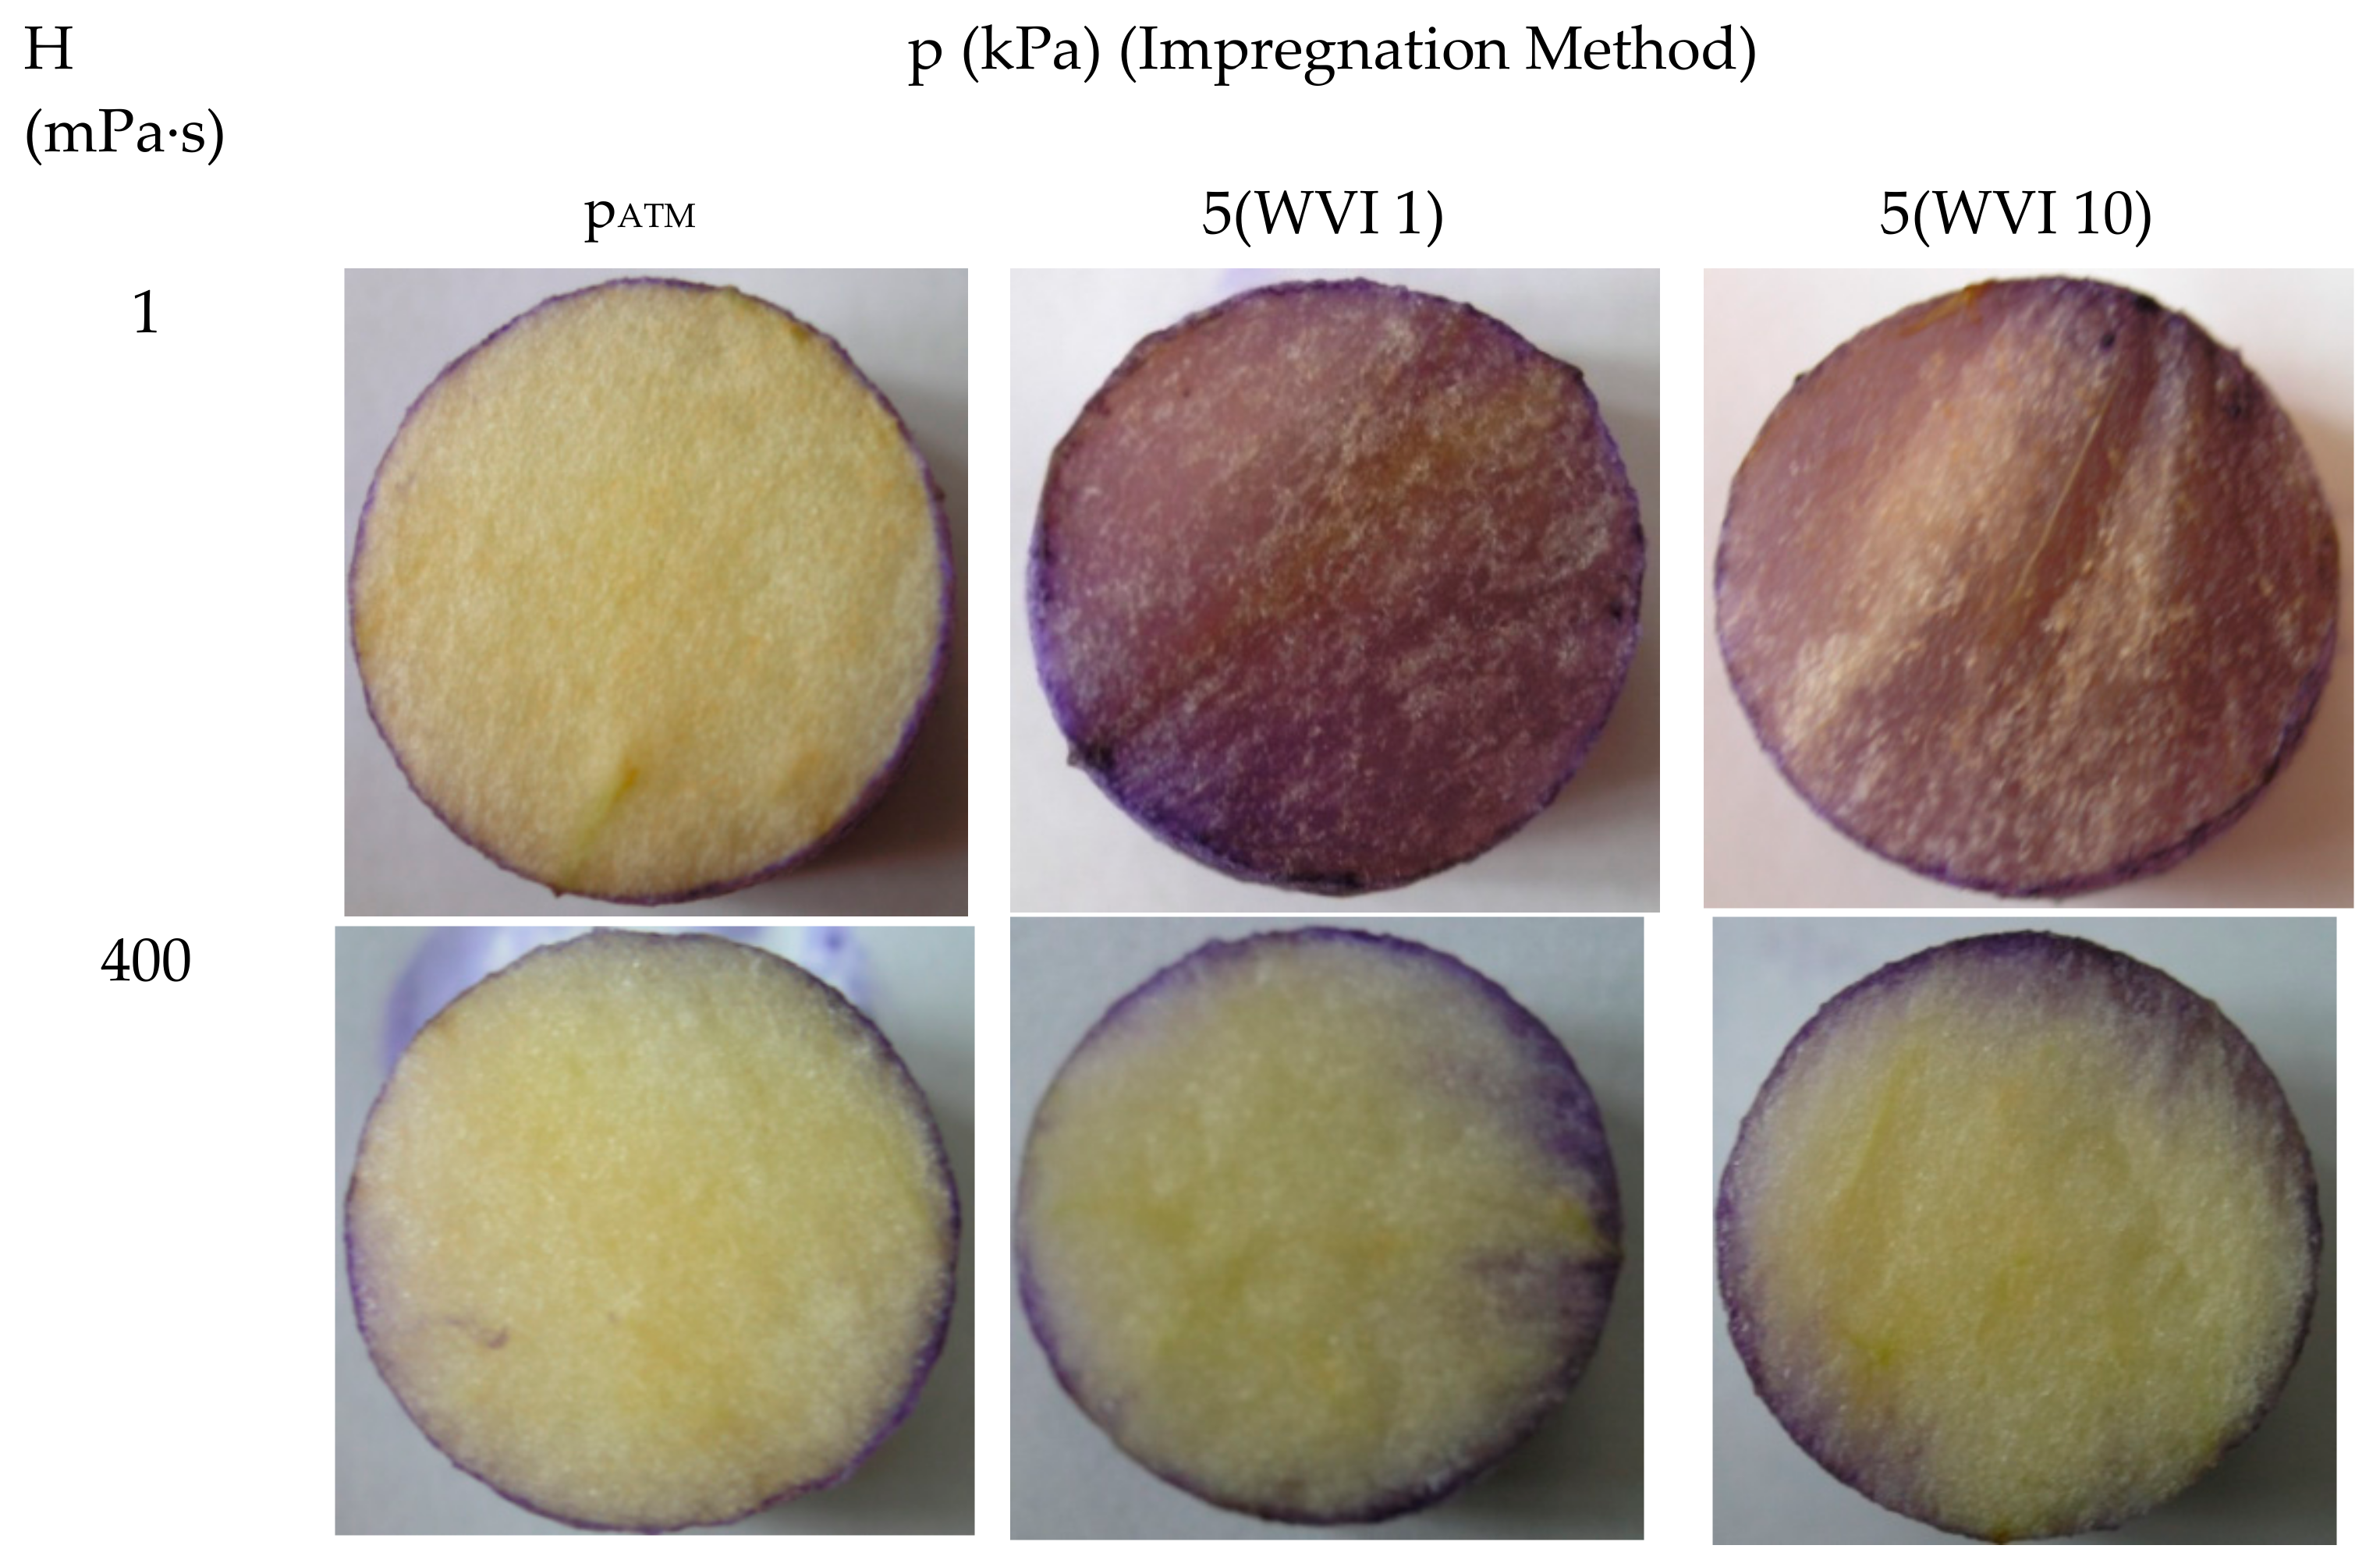
3.3. Influence of Solution Viscosity Coefficient

Figure 9 shows a graph of the changes in the percentage of apple tissue staining uS depending on the solution viscosity coefficient in the different impregnation treatments. The impregnation at atmospheric pressure yielded below 20% of apple tissue staining, with standard deviations in the range from 2.8 to 8.3%. When thepressure was reduced to 5kPa, the impregnation contributed to a sharp increase in the percentage of apple tissue staining (uS). It ranged from 75.2% in the case of the 1 wet impregnation cycle treatment 5 (WVI 1) to 79.7% in the fivecycles of WVI.As the viscosity of the liquid increased, a decrease of apple tissue staining occurred. The standard deviations in the percentage of staining in the vacuum impregnated apple tissue were higher, i.e., from 1.9 to 12.9%, than the values noted for impregnation at atmospheric pressure. As in the previous cycle, there were no trends in the impact of the vacuum maintenance time (t1) and the relaxation time (t2) on the impregnation results.
In the case of impregnation carried out at atmospheric pressure, the tissue staining was low, regardless of the viscosity of the impregnating liquid (Figure 10). Repeating vacuum impregnation with a low viscosity liquid (η = 1 mPa⋅s) resulted in increased penetration of the impregnating liquid into the fruit tissue. After using higher viscosity liquids (η = 400 mPa⋅s), liquid diffusion in the fruit tissue was difficult. Repeated impregnation did not increase the amount of liquid diffusing into the fruit tissue.

3.4. Statistical Analysis

The statistical analysis of the investigation results performed using Tukey’s reasonable significant difference (HSD) test at a significance level of α =0.05 provides a comprehensive picture of the findings of the research focused on optimization of the process parameters used in consecutive steps of the experimental design.
Table 1 shows the results of statistical analysis of the impact of the analyzed factors, i.e., the pressure change rate in impregnation phase 1 and 3, vacuum maintenance time, relaxation time, impregnation method, pressure, and impregnating liquid viscosity coefficient on the results reflected by the percentage of apple tissue staining.

4. Discussion

Apple tissues exhibit medium susceptibility to impregnation. In previous studies, staining solutions were used as an indicator of the effectiveness of the vacuum impregnation process [22,23]. Such solutions served only for visualization of the process effectiveness, but the degree of tissue staining was not a source of empirical data for researchers. A comparison of the images taken in previous reports with the results obtained in this study demonstrates their similarity. However, since the images were not analyzed in the previous studies, this statement does nothave a scientific background based on numerical data. Furthermore, each of the reports of food investigations cited in the present paper werebased on wet vacuum impregnation, which is only one of many methods for implementation of the process. Therefore, the results of the present study cannot be fully compared with those reported by other authors [24,25,26,27,28,29,30,31,32,33,34].
During vacuum impregnation, plant tissues exhibit different types of behavior. In apple tissue, there is strong gas expansion in the pores in the vacuum phase, which is explained by the natural outflow of the liquid from pores induced by the pressure gradient [35]. Mango, peach, and orange tissues exhibit strong deformation of the porous structure during the vacuum phase and after restoration of atmospheric pressure in the system [36,37]. Diced carrots, zucchini, and beetroot impregnated in isotonic sucrose maintain the increased pore volume [15].
Impregnation treatment of vegetables and fruits is usually carried out at pressure values from 5 to 60kPa. Reduction of the impregnation pressure increases the effect of this process [38]. The effectiveness of impregnation is enhanced with increasing process time in the range from 0 to 120min. Increased viscosity of the impregnating liquid reduces the efficiency of the process [22], while low viscosity eliminates deformation of the material [11,24]. There is a strict correlation between the efficiency of the process and the impregnated material and its structure [15].
Fruit and vegetables are particularly susceptible to impregnation, which is applied for intensification of mass transfer in the solid–liquid system [38].
The most common measure of susceptibility of various raw materials and food products is effective porosity, εe [%], defined as m3 of gas inside the pores/m3 of sample [27].
In general, all researchers try to provethat the greater the effective porosity, i.e., the more gases there are in the free spaces of the material, the more susceptible this material is to vacuum impregnation.
The most susceptible raw materialsare eggplant (εe=64%), mushroom (εe=36%), and cherry (εe=30%). Apple (εe=23%–27%), mandarina pills (εe=25%) or orange pills (εe=21%) are slightly less susceptible, while the smallest are banana (εe=4%), plum (εe=2%), apricot (εe=2%), and kiwi fruit (εe=2%). It is worth noting the large discrepancies in the results of effective porosity tests obtained for different varieties of apple and zucchini [14,26,28,39,40,41,42].
On the other hand, the vacuum impregnation process model published by Fito [27] shows that not all the porous structure of the material is filled with the surrounding liquid. Gases still occupy part of thestructure. This means that the porosity of raw materials is not an excellent measure of its susceptibility to vacuum impregnation. In addition, the widespread use of wet vacuum impregnation (WVI) in existing food materials research creates a barrier to the escape of gases from pores in the form of the liquid surrounding thematerial. In this method of performing vacuum impregnation, the liquid is in contact with the raw material before reducing the pressure. Dry vacuum impregnation (DVI) was used in this work. In this method, the liquid is introduced into the vacuum chamber after removing the gases from the pores and the escaping gases do not find resistance in the form of the surrounding liquid.
Research on the effectiveness of the vacuum impregnation process carried out by the authors by image analysis method indicates that about 80% of the apple tissue is filled with impregnating liquid. Meanwhile, the porosity of the apple is about 25%. Such a result means that the results of tests based on porosity cannot be compared with those based on image analysis.
Thus, when assessing the effectiveness of the impregnation process, one should also provide the method of assessment next to the chosen indicator.
This fact is also indicated by earlier research of the authors regarding the process of vacuum impregnation of wheat in order to facilitate the separation of bran from endosperm in the process of milling into flour. The indicator of the effectiveness of impregnation was grain moisture. The moisture content increases obtained during vacuum impregnation were much higher than theporosity. The increase in moisture content reached 15% [43,44].

5. Conclusions

The tests conducted during this experiment and the statisticalanalysis of theresults led to the following conclusion:
Pressure and impregnating liquid viscosity coefficient are the only parameters that have a significant effect on the impregnation result, as reflected by the degree of filling of the tissue with the impregnating solution. The other parameters examined in the study did not induce significant changes in the analyzedparameter.
The process of vacuum impregnation may find application as a support for other processes found in food technology that involve mass exchange in a liquid–solid system, such as osmotic drying or extraction. It can be used in the production of sausages, cheeses, and vegetable and fruit products. The largest potential applications of vacuum impregnation, however, result from the fact that this process allows the structure of many solid food materials to be modified by filling them with ingredients that do not naturally occur in them, such as probiotics or vitamins [43,44].

Author Contributions

T.G.—Methodology, L.R.—Investigations, M.D.—Validation. All authors have read and agreed to the published version of the manuscript.

Funding

This research received no external funding.

Conflicts of Interest

The authors declare no conflict of interest.

References

  1. Shantz, T.; Versmold, R. Types of Vacuum Impregnation Processes. 2013. Available online: https://www.godfreywing.com/hs-fs/hub/107598/file-29521638-pdf/ (accessed on 15 January 2019).
  2. Datta, A.K. Porous media approaches to studying simultaneous heat and mass transfer in food processes. I: Problem formulations. J. Food Eng. 2007, 80, 80–95. [Google Scholar] [CrossRef]
  3. Datta, A.K. Porous media approaches to studying simultaneous heat and mass transfer in food processes. II: Property data and representative results. J. Food Eng. 2007, 80, 96–110. [Google Scholar] [CrossRef]
  4. DeRossi, A.; De, T.; Severini, C. The Application of Vacuum Impregnation Techniques in Food Industry. In Scientific, Health and Social Aspects of the Food Industry; IntechOpen Ltd.: London, UK, 2012. [Google Scholar]
  5. Mebatsion, H.; Verboven, P.; Ho, Q.; Verlinden, B.; Nicolaï, B.M. Modelling fruit (micro)structures, why and how? Trends Food Sci. Technol. 2008, 19, 59–66. [Google Scholar] [CrossRef]
  6. Guillemin, A.; Guillon, F.; Degraeve, P.; Rondeau, C.; Devaux, M.-F.; Huber, F.; Badel, E.; Saurel, R.; Lahaye, M.; Rondeau-Mouro, C. Firming of fruit tissues by vacuum-infusion of pectin methylesterase: Visualisation of enzyme action. Food Chem. 2008, 109, 368–378. [Google Scholar] [CrossRef] [Green Version]
  7. Vargas, M.; Chiralt, A.; Albors, A.; González-Martínez, C. Effect of chitosan-based edible coatings applied by vacuum impregnation on quality preservation of fresh-cut carrot. Postharvest Boil. Technol. 2009, 51, 263–271. [Google Scholar] [CrossRef]
  8. Chiralt, A.; Fito, P.; Andres, A.; Barat, J.M.; Martinez-Monzo, J.; Martinez-Navarrete, N. Vacuum impregnation: A tool in minimally processing of foods. In Processing of Foods: Quality Optimization and Process Assessment; Oliveira, F.A.R., Oliveira, J.C., Eds.; CRC Press: Boca Raton, FL, USA, 1999; pp. 341–356. ISBN 13-978-0-8493-7905. [Google Scholar]
  9. Betoret, E.; Betoret, N.; Arilla, A.; Bennár, M.; Barrera, C.; Codoñer, P.; Fito, P. No invasive methodology to produce a probiotic low humid apple snack with potential effect against Helicobacter pylori. J. Food Eng. 2012, 110, 289–293. [Google Scholar] [CrossRef]
  10. Atarés, L.; Chiralt, A.; González-Martínez, C. Effect of solute on osmotic dehydration and rehydration of vacuum impregnated apple cylinders (cv. Granny Smith). J. Food Eng. 2008, 89, 49–56. [Google Scholar] [CrossRef]
  11. Barat, J.M.; Fito, P.; Chiralt, A. Modeling of simultaneous mass transfer and structural changes in fruit tissues. J. Food Eng. 2001, 49, 77–85. [Google Scholar] [CrossRef]
  12. Del Valle, J.; Aránguiz, V.; Diaz, L. Volumetric procedure to assess infiltration kinetics and porosity of fruits by applying a vacuum pulse. J. Food Eng. 1998, 38, 207–221. [Google Scholar] [CrossRef]
  13. Fito, P.; Pastor, R. Non-diffusional mechanisms occurring during vacuum osmotic dehydration. J. Food Eng. 1994, 21, 513–519. [Google Scholar] [CrossRef]
  14. Fito, P.; Andrés, A.; Chiralt, A.; Pardo, P. Coupling of hydrodynamic mechanism and deformation-relaxation phenomena during vacuum treatments in solid porous food-liquid systems. J. Food Eng. 1996, 27, 229–240. [Google Scholar] [CrossRef]
  15. Gras, M.L.; Fito, P.; Vidal, D.; Albors, A.; Chiralt, A.; Andres, A. The effect of vacuum impregnation upon some properties of vegetables. In Proceedings of the ICEF8 2001; Technomic Publishing Company: Lancanster, UK, 2001; ISBN 1566769515. [Google Scholar]
  16. Cruz, R.; Vieira, M.; Silva, C.L. The response of watercress (Nasturtium officinale) to vacuum impregnation: Effect of an antifreeze protein type I. J. Food Eng. 2009, 95, 339–345. [Google Scholar] [CrossRef]
  17. Perez-Cabrera, L.; Cháfer, M.; Chiralt, A.; González-Martínez, C. Effectiveness of antibrowning agents applied by vacuum impregnation on minimally processed pear. LWT 2011, 44, 2273–2280. [Google Scholar] [CrossRef]
  18. Phoon, P.Y.; Galindo, F.G.; Vicente, A.A.; Dejmek, P. Pulsed electric field in combination with vacuum impregnation with trehalose improves the freezing tolerance of spinach leaves. J. Food Eng. 2008, 88, 144–148. [Google Scholar] [CrossRef] [Green Version]
  19. Schulze, B.; Peth, S.; Hubbermann, E.M.; Schwarz, K. The influence of vacuum impregnation on the fortification of apple parenchyma with quercetin derivatives in combination with pore structures X-ray analysis. J. Food Eng. 2012, 109, 380–387. [Google Scholar] [CrossRef]
  20. Moreno, J.; Simpson, R.; Baeza, A.; Morales, J.; Muñoz, C.; Sastry, S.; Almonacid, S. Effect of ohmic heating and vacuum impregnation on the osmodehydration kinetics and microstructure of strawberries (cv. Camarosa). LWT 2012, 45, 148–154. [Google Scholar] [CrossRef]
  21. Martínez-Monzó, J.; Barat, J.M.; González-Martínez, C.; Chiralt, A.; Fito, P. Changes in thermal properties of apple due to vacuum impregnation. J. Food Eng. 2000, 43, 213–218. [Google Scholar] [CrossRef]
  22. Hironaka, K.; Kikuchi, M.; Koaze, H.; Sato, T.; Kojima, M.; Yamamoto, K.; Yasuda, K.; Mori, M.; Tsuda, S. Ascorbic acid enrichment of whole potato tuber by vacuum-impregnation. Food Chem. 2011, 127, 1114–1118. [Google Scholar] [CrossRef]
  23. Hofmeister, L.; Souza, J.; Laurindo, J. Use of dyed solutions to visualize different aspects of vacuum impregnation of Minas cheese. LWT 2005, 38, 379–386. [Google Scholar] [CrossRef]
  24. Barat, J.M.; Chiralt, A.; Fito, P.J. Effect of Osmotic Solution Concentration, Temperature and Vacuum Impregnation Pretreatment on Osmotic Dehydration Kinetics of Apple Slices. Food Sci. Technol. Int. 2001, 7, 451–456. [Google Scholar] [CrossRef]
  25. Guillemin, A.; Degraeve, P.; Noel, C.; Saurel, R. Influence of impregnation solution viscosity and osmolarity on solute uptake during vacuum impregnation of apple cubes (var. Granny Smith). J. Food Eng. 2008, 86, 475–483. [Google Scholar] [CrossRef]
  26. Mujica-Paz, H.; Valdez-Fragoso, A.; López-Malo, A.; Palou, E.; Welti-Chanes, J. Impregnation and osmotic dehydration of some fruits: Effect of the vacuum pressure and syrup concentration. J. Food Eng. 2003, 57, 305–314. [Google Scholar] [CrossRef]
  27. Barrera, C.; Betoret, N.; Betoret, E.; Fito, P. Calcium and temperature effect on structural damage of hot air dried apple slices: Nonlinear irreversible thermodynamic approach and rehydration analysis. J. Food Eng. 2016, 189, 106–114. [Google Scholar] [CrossRef]
  28. Carciofi, B.A.; Prat, M.; Laurindo, J.B. Dynamics of vacuum impregnation of apples: Experimental data and simulation results using a VOF model. J. Food Eng. 2012, 113, 337–343. [Google Scholar] [CrossRef] [Green Version]
  29. Castagnini, J.M.; Betoret, N.; Betoret, E.; Fito, P. Vacuum impregnation and air drying temperature effect on individual anthocyanins and antiradical capacity of blueberry juice included into an apple matrix. LWT 2015, 64, 1289–1296. [Google Scholar] [CrossRef]
  30. Flores-Andrade, E.; Pineda, L.A.P.; Alarcón-Elvira, F.; Rascón-Díaz, M.P.; Pimentel, D.; Beristain, C. Effect of vacuum on the impregnation of Lactobacillus rhamnosus microcapsules in apple slices using double emulsion. J. Food Eng. 2017, 202, 18–24. [Google Scholar] [CrossRef]
  31. Petersen, B.; Egert, S.; Bosy-Westphal, A.; Müller, M.J.; Wolffram, S.; Hubbermann, E.M.; Rimbach, G.; Schwarz, K. Bioavailability of quercetin in humans and the influence of food matrix comparing quercetin capsules and different apple sources. Food Res. Int. 2016, 88, 159–165. [Google Scholar] [CrossRef]
  32. Panarese, V.; Dejmek, P.; Rocculi, P.; Galindo, F.G. Microscopic studies providing insight into the mechanisms of mass transfer in vacuum impregnation. Innov. Food Sci. Emerg. Technol. 2013, 18, 169–176. [Google Scholar] [CrossRef]
  33. Moreno, J.; Espinoza, C.; Simpson, R.; Petzold, G.; Nuñez, H.; Gianelli, M. Application of ohmic heating/vacuum impregnation treatments and air drying to develop an apple snack enriched in folic acid. Innov. Food Sci. Emerg. Technol. 2016, 33, 381–386. [Google Scholar] [CrossRef]
  34. Dellarosa, N.; Laghi, L.; Ragni, L.; Rosa, M.D.; Galante, A.; Ranieri, B.; Florio, T.M.; Alecci, M. Pulsed electric fields processing of apple tissue: Spatial distribution of electroporation by means of magnetic resonance imaging and computer vision system. Innov. Food Sci. Emerg. Technol. 2018, 47, 120–126. [Google Scholar] [CrossRef]
  35. Gras, M.; Vidal-Brotóns, N.; Betoret, A.; Chiralt, A.; Fito, P. The response of some vegetables to vacuum impregnation. Innov. Food Sci. Emerg. Technol. 2002, 3, 263–269. [Google Scholar] [CrossRef]
  36. Fito, P.; Chiralt, A.; Betoret, N.; Gras, M.; Chafer, M.; Martínez-Monzó, J.; Andrés, A.; Vidal, D. Vacuum impregnation and osmotic dehydration in matrix engineering. J. Food Eng. 2001, 49, 175–183. [Google Scholar] [CrossRef]
  37. Fito, P.; Chiralt, A.; Barat, J.M.; Andrés, A.; Martínez-Monzó, J.; Martínez-Navarrete, N. Vacuum impregnation for development of new dehydrated products. J. Food Eng. 2001, 49, 297–302. [Google Scholar] [CrossRef]
  38. Zhao, Y.; Xie, J. Practical applications of vacuum impregnation in fruit and vegetable processing. Trends Food Sci. Technol. 2004, 15, 434–451. [Google Scholar] [CrossRef]
  39. Mujica-Paz, H.; Valdez-Fragoso, A.; López-Malo, A.; Palou, E.; Welti-Chanes, J. Impregnation properties of some fruits at vacuum pressure. J. Food Eng. 2003, 56, 307–314. [Google Scholar] [CrossRef]
  40. DeRossi, A.; De Pilli, T.; Penna, M.P.; Severini, C. pH reduction and vegetable tissue structure changes of zucchini slices during pulsed vacuum acidification. LWT 2011, 44, 1901–1907. [Google Scholar] [CrossRef]
  41. Vursavuş, K.; Kelebek, H.; Selli, S. A study on some chemical and physico-mechanic properties of three sweet cherry varieties (Prunus avium L.) in Turkey. J. Food Eng. 2006, 74, 568–575. [Google Scholar] [CrossRef]
  42. Igual, M.; Castelló, M.L.; Ortolá, M.D.O.; Andrés, A. Influence of vacuum impregnation on respiration rate, mechanical and optical properties of cut persimmon. J. Food Eng. 2008, 86, 315–323. [Google Scholar] [CrossRef]
  43. Rydzak, L.; Andrejko, D. Vacuum impregnation process as a method used to prepare the wheat grain for milling in flour production. TEKA Kom. Mot. Energ. Roln. OL PAN 2008, 8, 134–141. [Google Scholar]
  44. Rydzak, L.; Sagan, A.; Andrejko, D.; Starek, A.; Ślaska-Grzywna, B.; Blicharz-Kania, A.; Natoniewski, M.; Kobus, Z. Changes in Particle Size Distribution of Bran and Flour Obtained from Vacuum Impregnated and Infra-red Heated Wheat Grain. Food Bioprocess Technol. 2017, 10, 1997–2004. [Google Scholar] [CrossRef]
Figure 1. The process of vacuum impregnation and its individual phases: Phase 1—pressure change during time tA, phase 2—vacuum maintenance during time t1, pressure change during time tB, phase 4—relaxation during time t2.
Processes 08 00428 g001
Figure 2. Scheme of the stand for vacuum impregnation process implementation: 1—vacuum chamber, 2—water bath, 3—cover, 4—vacuum pump, 5—reservoir for liquid, 6—reservoir for raw material.
Processes 08 00428 g002
Figure 3. Dependence of the percentage of apple tissue staining uS on the pressure change rate in the dry vacuum impregnation (DVI) cycle for t1 = 0 and different values of t2: (a) t2 = 0 s, (b) t2 = 900 s.
Processes 08 00428 g003
Figure 4. Dependence of the percentage of apple tissue staining uS on the pressure change rate in the DVI cycle, for t1 = 900 s and different values of t2: (a) t2 = 0 s, (b) t2 = 900 s.
Processes 08 00428 g004
Figure 5. Dependence of the percentage of apple tissue staining uS on the pressure change rate in the wet vacuum impregnation (WVI) cycle, for t1 = 0 s and different values of t2: (a) t2 = 0 s, (b) t2 = 900 s.
Processes 08 00428 g005
Figure 6. Dependence of the percentage of apple tissue staining uS on the pressure change rate in the WVI cycle, for t1 = 900 s and different values of t2: (a) t2 = 0 s, (b) t2 = 900 s.
Processes 08 00428 g006
Figure 7. Changes in the percentage of apple tissue staining uSat time t1 and different impregnation methods: (a) t2 = 0 s, (b) t2 = 900 s. Pressure change rate in the system 30 kPa·s−1.
Processes 08 00428 g007
Figure 8. Apple tissue impregnated in different conditions using a staining solution with a viscosity coefficient η = 1 mPa·s for the selected values of parameters t1 and t2.
Processes 08 00428 g008
Figure 9. Percentage of apple tissue staining us depending on the solution viscosity coefficient in the different impregnation treatments, t1 = t2 = 0; pressure change rate—30kPa·s−1. 5(WVI 1)—onecycle of WVI at 5 kPa, 5(WVI 5)—fivecycles of WVI at 5 kPa, 5(WVI 10)—10 cycles of WVI at 5 kPa.
Processes 08 00428 g009
Figure 10. Apple tissue impregnated in different conditions using a staining solution with a viscosity coefficient η = 1 mPa·s andη = 400 mPa·s, 5(WVI 5)—fivecycles of WVI at 5 kPa, 5(WVI 10)—10 cycles of WVI at 5 kPa.
Processes 08 00428 g010
Table 1. Analysis of the significance of the impact of the analyzed factors on the us value. Mean values marked with the same letter in columns do not differ significantly (p ≤ 0.05).
FactorValueus(%)(SD)
Pressure change rate
Δ p t A (kPa·s−1)
580.5 (±15.2)a *
1084.4 (±16.3)a
3076.5 (±14.4)a
Pressure change rate
Δ p t B (kPa·s−1)
580.1 (±12.5)a
1088.7 (±14.7)a
3079.6 (±11.2)a
Time t1(s)084.1 (±13.1)a
10083.8 (±14.6)a
30080.7 (±12.8)a
60087.8 (±11.9)a
90082.8 (±14.5)a
Time t2(s)084.5 (±17.4)a
10083.6 (±15.5)a
30076.7 (±15.3)a
60082.5 (±12.2)a
90082.9 (±10.8)a
Impregnation methodWVI84.7 (±13.4)a
WVI 589.4 (±15.7)a
WVI 1088.4 (±16.2)a
DVI85.3 (±16.8)a
Pressurep (kPa)583.4 (±17.5)a
pATM21.1 (±3.5)b
Viscosity coefficient(mPa·s)168.3 (±0.8)a
5037.4 (±7.6)b
10027.0 (±8.3)c
20021.1 (±5.3)cd
40016.8 (±13.9)d
* Mean values marked with the same letter (a, b, c, d) in columns do not differ significantly (p≤0.05).

