Article

Effect of Dehydration on the Rheological Measurement of Surimi Paste in Cone-Plate Rheometry: Heat and Mass Transfer Simulation

1
Department of Food Science and Biotechnology, College of Agricultural and Life Science, Kangwon National University, Chuncehon 24341, Korea
2
OSU Seafood Research and Education Center, Oregon State University, Astoria, OR 9703, USA
3
Elderly-Friendly Food Research Center, Agriculture and Life Science Research Institute, Kangwon National University, Chuncheon 24341, Korea
*
Author to whom correspondence should be addressed.
Processes 2020, 8(2), 234; https://doi.org/10.3390/pr8020234
Submission received: 30 January 2020 / Revised: 12 February 2020 / Accepted: 14 February 2020 / Published: 19 February 2020
(This article belongs to the Special Issue Drying Kinetics and Quality Control in Food Processing)

Abstract

:
Moisture transfer characteristics of Alaska pollock (AP) surimi were investigated at various temperatures. The effective moisture diffusivity increased from 5.50 × 10⁻¹¹ to 2.07 × 10⁻⁹ m2/s as the temperature increased from 30 °C to 90 °C. In order to investigate the mass and heat transfer characteristics of AP surimi, the simulation model was developed and evaluated by root-mean-square error (RMSE) (<2.95%). Rheological properties of AP surimi were investigated at different heating rates (1 °C/min, 5 °C/min, 10 °C/min, 20 °C/min and 30 °C/min). As heating rate increased to 20 °C/min and 30 °C/min, elastic modulus (G’) significantly diminished. The diminished G’ could be explained by impaired gel during temperature sweep supported by the predicted temperature distribution in the simulation model. Changes in moisture content of AP surimi during temperature sweep were also measured and predicted by the simulation model. The results showed the decreased amount of moisture content significantly increased as heating rate increased.

1. Introduction

Generally, stress and strain are measured to assess the textural properties of surimi seafood products [1]. Oscillatory rheometry and small-strain analysis using small amplitude oscillatory shear (SAOS) techniques can be used to determine the nonfracture mechanical properties based on viscous modulus (G”) and elastic modulus (G’), which are ‘finger prints’ reflecting structural changes during gelation, while large-strain analysis including fracture analyses, such as texture profile analysis (TPA), torsion test, and ring tensile and punch tests of gel mechanical properties are correlated with sensory characteristics of surimi-based seafood products. Small-strain analysis has been widely used to elucidate the gelation mechanism of fish myofibrillar protein, i.e., the primary protein in surimi contributing to the texture properties of surimi seafood product [2,3,4].
The unique feature of small-strain analysis, such as SAOS, in surimi gelation is its ability to measure sol-gel transition properties in situ without disrupting the gel network structure of myofibrillar protein [2]. The SAOS test with cone-and-plate geometry is the most popular experimental method used to evaluate the sol-gel transition properties of surimi. The transitional properties are usually measured using a temperature sweep mode in which the stress or strain within a linear viscoelastic region is applied to the specimen at constant frequency while ramping the temperature at a constant heating rate. The heating rate used in SAOS is an important parameter because the reaction time for the sol-gel transition during the temperature sweep test is entirely dependent on the heating rate. Several studies reported that the texture of myofibrillar protein gels and surimi gels containing other ingredients depend on the heating rate. In extreme cases, the heating rate and the reaction time play a critical role in the gelation of Pacific whiting surimi containing proteases. Smyth and O’Neill [5] reported that the G’ value of chicken surimi at 1 °C/min of heating rate was nearly two-fold higher than those heated at a rate of 5 °C/min. Similar trends were found in the study investigating the effect of heating rate on the rheological properties of Pacific whiting [6] and Alaska pollock (AP) [7]. In the absence of protease in surimi, the longer heating time induces structural changes, i.e., unfolding and aggregation of proteins, which enhance the gel network structure [8,9,10]. However, it has also been reported that the sample may be subjected to a significant moisture loss due to evaporation during temperature sweep, and the degree of moisture loss may increase as the heating rate decreases [11,12]. Several studies have been conducted to investigate the effects of moisture content and thermal transition of surimi; however, most studies assumed that the moisture content of the surimi paste is unchanged and the temperature distribution within the surimi specimen is negligible. Moisture and heat transfer of surimi paste during the temperature sweep test should be investigated to analyze the effect of heating rate on the rheological properties of surimi during gelation. However, the moisture content and temperature of surimi paste during the temperature sweep might vary according to the position of sample under the specific rheometry, such as the cone-and-plate. The temperature and moisture distributions of surimi paste cannot be fully investigated via rheometry easily.
Computational fluid dynamics (CFD) has been successfully used to analyze numerous unit operations in thermal processing [13,14,15,16,17,18]. Several studies have been conducted to predict the moisture and temperature distribution within an object during heat treatment. Park and Yoon [19] developed a heat and moisture transfer simulation model for the analysis of moisture and temperature distribution in colored potato during drying. Hussain and Dincer [20] also investigated the changes in heat and moisture distributions of broccoli during hot-air drying. Therefore, CFD is very useful in identifying the temperature and moisture distributions in surimi paste during the temperature sweep test. The objectives of this study were: (1) to develop heat and mass transfer simulation models to investigate the temperature and moisture distribution of surimi paste under cone-and-plate geometry during the temperature sweep test, and (2) to assess the rheological properties of surimi during the temperature sweep test at different heating rates based on the effect of temperature distribution and moisture loss of surimi.

2. Materials and Methods

2.1. Surimi Paste Preparation

In this study, an A grade Alaska pollock surimi (Trident Seafoods, Seattle, WA, USA) was used for the experiment. Frozen surimi was thawed at room temperature for an hour. A vacuum cutter equipped with a temperature control system (UM5, Stephan Machinery, Columbus, OH, USA) was used to chop the surimi cubes. Based on the previous study [21], chopping of surimi was conducted to prepare surimi paste. Samples were chopped for 1 min at 1800 rpm, followed by the addition of salt and ice to control salt (3%) and moisture content (78%). Chopping was conducted at 1800 rpm for an additional 1 min. Subsequently, the final chopping was conducted for 3 min at 3600 rpm under vacuum.

2.2. Small Amplitude Oscillatory Shear (SAOS) Test: Temperature Sweep

The SAOS test was conducted at 0.1 Hz angular frequency using a dynamic rheometer (CVO-100, Malvern Instruments, Worcestershire, UK). Surimi paste was located under cone-and-plate geometry (4 cm in diameter and 4° in slope angle). Temperature sweep (10–90 °C) was performed at different heating rates while measuring the storage modulus (G’) and the loss modulus (G”) of the surimi paste during gelation. Once the temperature reached 90 °C, it was maintained for an additional 30 min at 90°C to allow adequate heat for unfolding and aggregation of myofibrillar proteins. To examine the effect of heating rate on the rheological properties of surimi paste, various heating rates (1–30 °C/min) were adopted. The sample was placed between the plate and cone leaving a gap of 150 μm and the sample thickness at the surface was 1550 μm. The moisture content of surimi paste was measured every 10 °C ranging from 10 to 90 °C to investigate the effect of differential heating rate on the changes in moisture content of surimi paste during the temperature sweep. All temperature sweeps were performed using the auto-strain function (strain  =  0.04) determined via preliminary tests. Samples were tested in triplicate.

2.3. Moisture Diffusion

The effective moisture diffusivity (Deff), which is affected by the porosity of material, temperature, and composition, is used to interpret the rate of moisture transfer [22]. In this study, the surimi paste was located between a flat plate (4 cm in diameter) and the plate leaving a gap of 1550 μm. In order to estimate the Deff of surimi paste at different temperatures, the moisture changes of surimi paste were measured via the AOAC method [23] every 10 min for a total of 50 min in the temperature range of 30 to 90 °C. The Deff at any given temperature is determined using Fick’s second law of diffusion [24]. Fick’s second law of diffusion and its application for an infinite cylinder are defined as follows:
For Fick’s second law of diffusion,
M t = 1 r [ r ( D eff r M r ) + z ( D eff r M z ) ] ,
for an infinite cylinder,
M R = M M e M i M e = n = 1 8 β n 2 × e x p ( β n 2 D eff r 2 t ) ,
where Deff is the effective moisture diffusivity (m2/s), r denotes the cylindrical radius (m), MR represents the moisture content, Me refers to equilibrium moisture content (% d.b.), Mi indicates the initial moisture content, and βn is the root of Bessel function.
The logarithmic form of solution can be easily obtained as follows:
ln ( M R ) = A B × t ,
where B is β n 2 D eff r 2 .
Generally, the Arrhenius-type relationship can be used to express the temperature dependence of the Deff as follows:
D e f f = D 0 e x p ( E a R T ) ,
ln D e f f = ln D 0 E a R T ,
where D0 is the frequency factor/pre-exponential of the Arrhenius equation (m2/s), R denotes the universal gas constant (kJ/mol K), Ea represents the activation energy (kJ/mol), and T refers to the absolute temperature (K).

2.4. Numerical Simulation

2.4.1. Modeling of Airflow

The partial differential equations governing the natural convection of air flow are represented by the energy, momentum, and mass conservation equations. Since an axial symmetric approach was used in this study, the equations for angular direction were not included. Thus, the Navier–Stokes equations are shown below.
The mass conservation equation:
1 r ( r · ρ · v r ) r + ( ρ · v z ) z = 0 ,
Energy equation:
T t + ( T · v r ) r + ( T · v z ) z = k ρ · C p [ 1 r r ( ( T · r ) r + 2 v r z 2 ) ] ,
The momentum equations:
ρ ( v r t + v r v r r + v z v r z ) = P r + μ [ r ( 1 r r ( r · v r ) ) + 2 v r z 2 ] ,
ρ ( v z t + v r v z r + v z v z z ) = P z + μ [ 1 r r ( r v z d r ) + 2 v z z 2 ] + ρ · g ,
where ρ denotes density (kg/m3), k represents thermal conductivity (W/(m·K)), g indicates gravitational acceleration (9.81 m/s2), and vz and vr are the velocity components (m/s) in vertical and radial directions.
In order to describe density variation of fluid during thermal processing, the Boussinesq approximation was used as follows:
ρ = ρ r e f [ 1 β ( T T r e f ) ] ,
where β is the thermal expansion coefficient of fluid, and ρref and Tref denote reference density and temperature, respectively.
Based on the temperature field simulation, the local heat transfer coefficient was obtained as follows:
k T n | s = h ( T s T d ) ,
where n is the normal to the surface and s is the coordinate along the surface.
Once the heat transfer coefficient is determined, the mass transfer coefficient can be determined as follows:
h m = h ( L e n D k ) ,
where Le is the Lewis number. Generally, the value of n is reasonably assumed as 1/3 in most applications [25].

2.4.2. Modeling of Temperature and Moisture Fields

In order to investigate the mass and heat transfer characteristics of surimi during the temperature sweep, a mass and heat transfer simulation model was developed in this study. It has been generally known that dimensional changes of surimi products during thermal treatments are considered insignificant since the immediate film formation of on the surface of surimi gel upon heating minimizes the moisture migration from inside to outside [26]. Therefore, our simulation model was developed based on the following assumptions: (1) no heat generation inside the sample, (2) negligible deformation or shrinkage of the sample during temperature sweep, and (3) negligible radiation effects.
Based on the assumptions above, the governing mass and heat transfer equations for heat conduction and molecular diffusion under unsteady state in cylindrical coordinates can be expressed as follows:
T t = α ( 2 T z 2 + 1 r T r ( r T r ) ) ,  
M t = D ( 2 M z 2 + 1 r M r ( r M r ) ) ,
The initial conditions are:
T ( z , r , 0 ) = T 0 ,
M ( z , r , 0 ) = M 0 ,  
and the boundary conditions are:
r = 0 ,     T r = 0   and   M r = 0 ,
The surface conditions of the objects are:
k ( T r ) = h ( T s T )   and   k ( T z ) = h ( T s T ) ,
D ( M r ) = h m ( M s M )   and   D ( M z ) = h m ( M s M ) ,
where D represents mass diffusivity (m2/s, α is thermal diffusivity (m2/s), and Ts and Ms denote temperature and moisture content at the surface of surimi paste, respectively. Open boundaries were applied for convective flux conditions at the surface of the computational domain.

2.5. Simulation

A commercial finite element analysis software (COMSOL Multiphysics 5.3, Stockholm, Sweden) was used to predict the heat and mass transfer of the surimi paste during temperature sweep. Density, specific heat, and thermal conductivity of Alaska pollock surimi were determined as a function of temperature and moisture content according to the highly cited work of Park et al. [27]. Park et al. [27] focused on the thermophysical properties of Alaska pollock surimi under different temperature, moisture, and salt content to develop accurate heat transfer simulation models. Moisture diffusivity of Alaska pollock surimi was determined based on the moisture diffusion experiments. The thermophysical properties and moisture diffusivity represent variables with respect to temperature and moisture content in the mass and heat transfer equations (Table 1).

2.6. Validation of Simulation Model

The simulation model was validated by comparing with the experimental data. Generally, the root-mean-square error (RMSE) is used to validate the simulation model.
RMSE is defined by:
RMSE = 1 N · i = 1 N ( M M s ) 2   ,
The volume-averaged moisture content predicted by the simulation model (Ms) was used to evaluate the RMSE. Moisture content of surimi was experimentally measured and compared with the values predicted via simulation to calculate the RMSE.

3. Results and Discussion

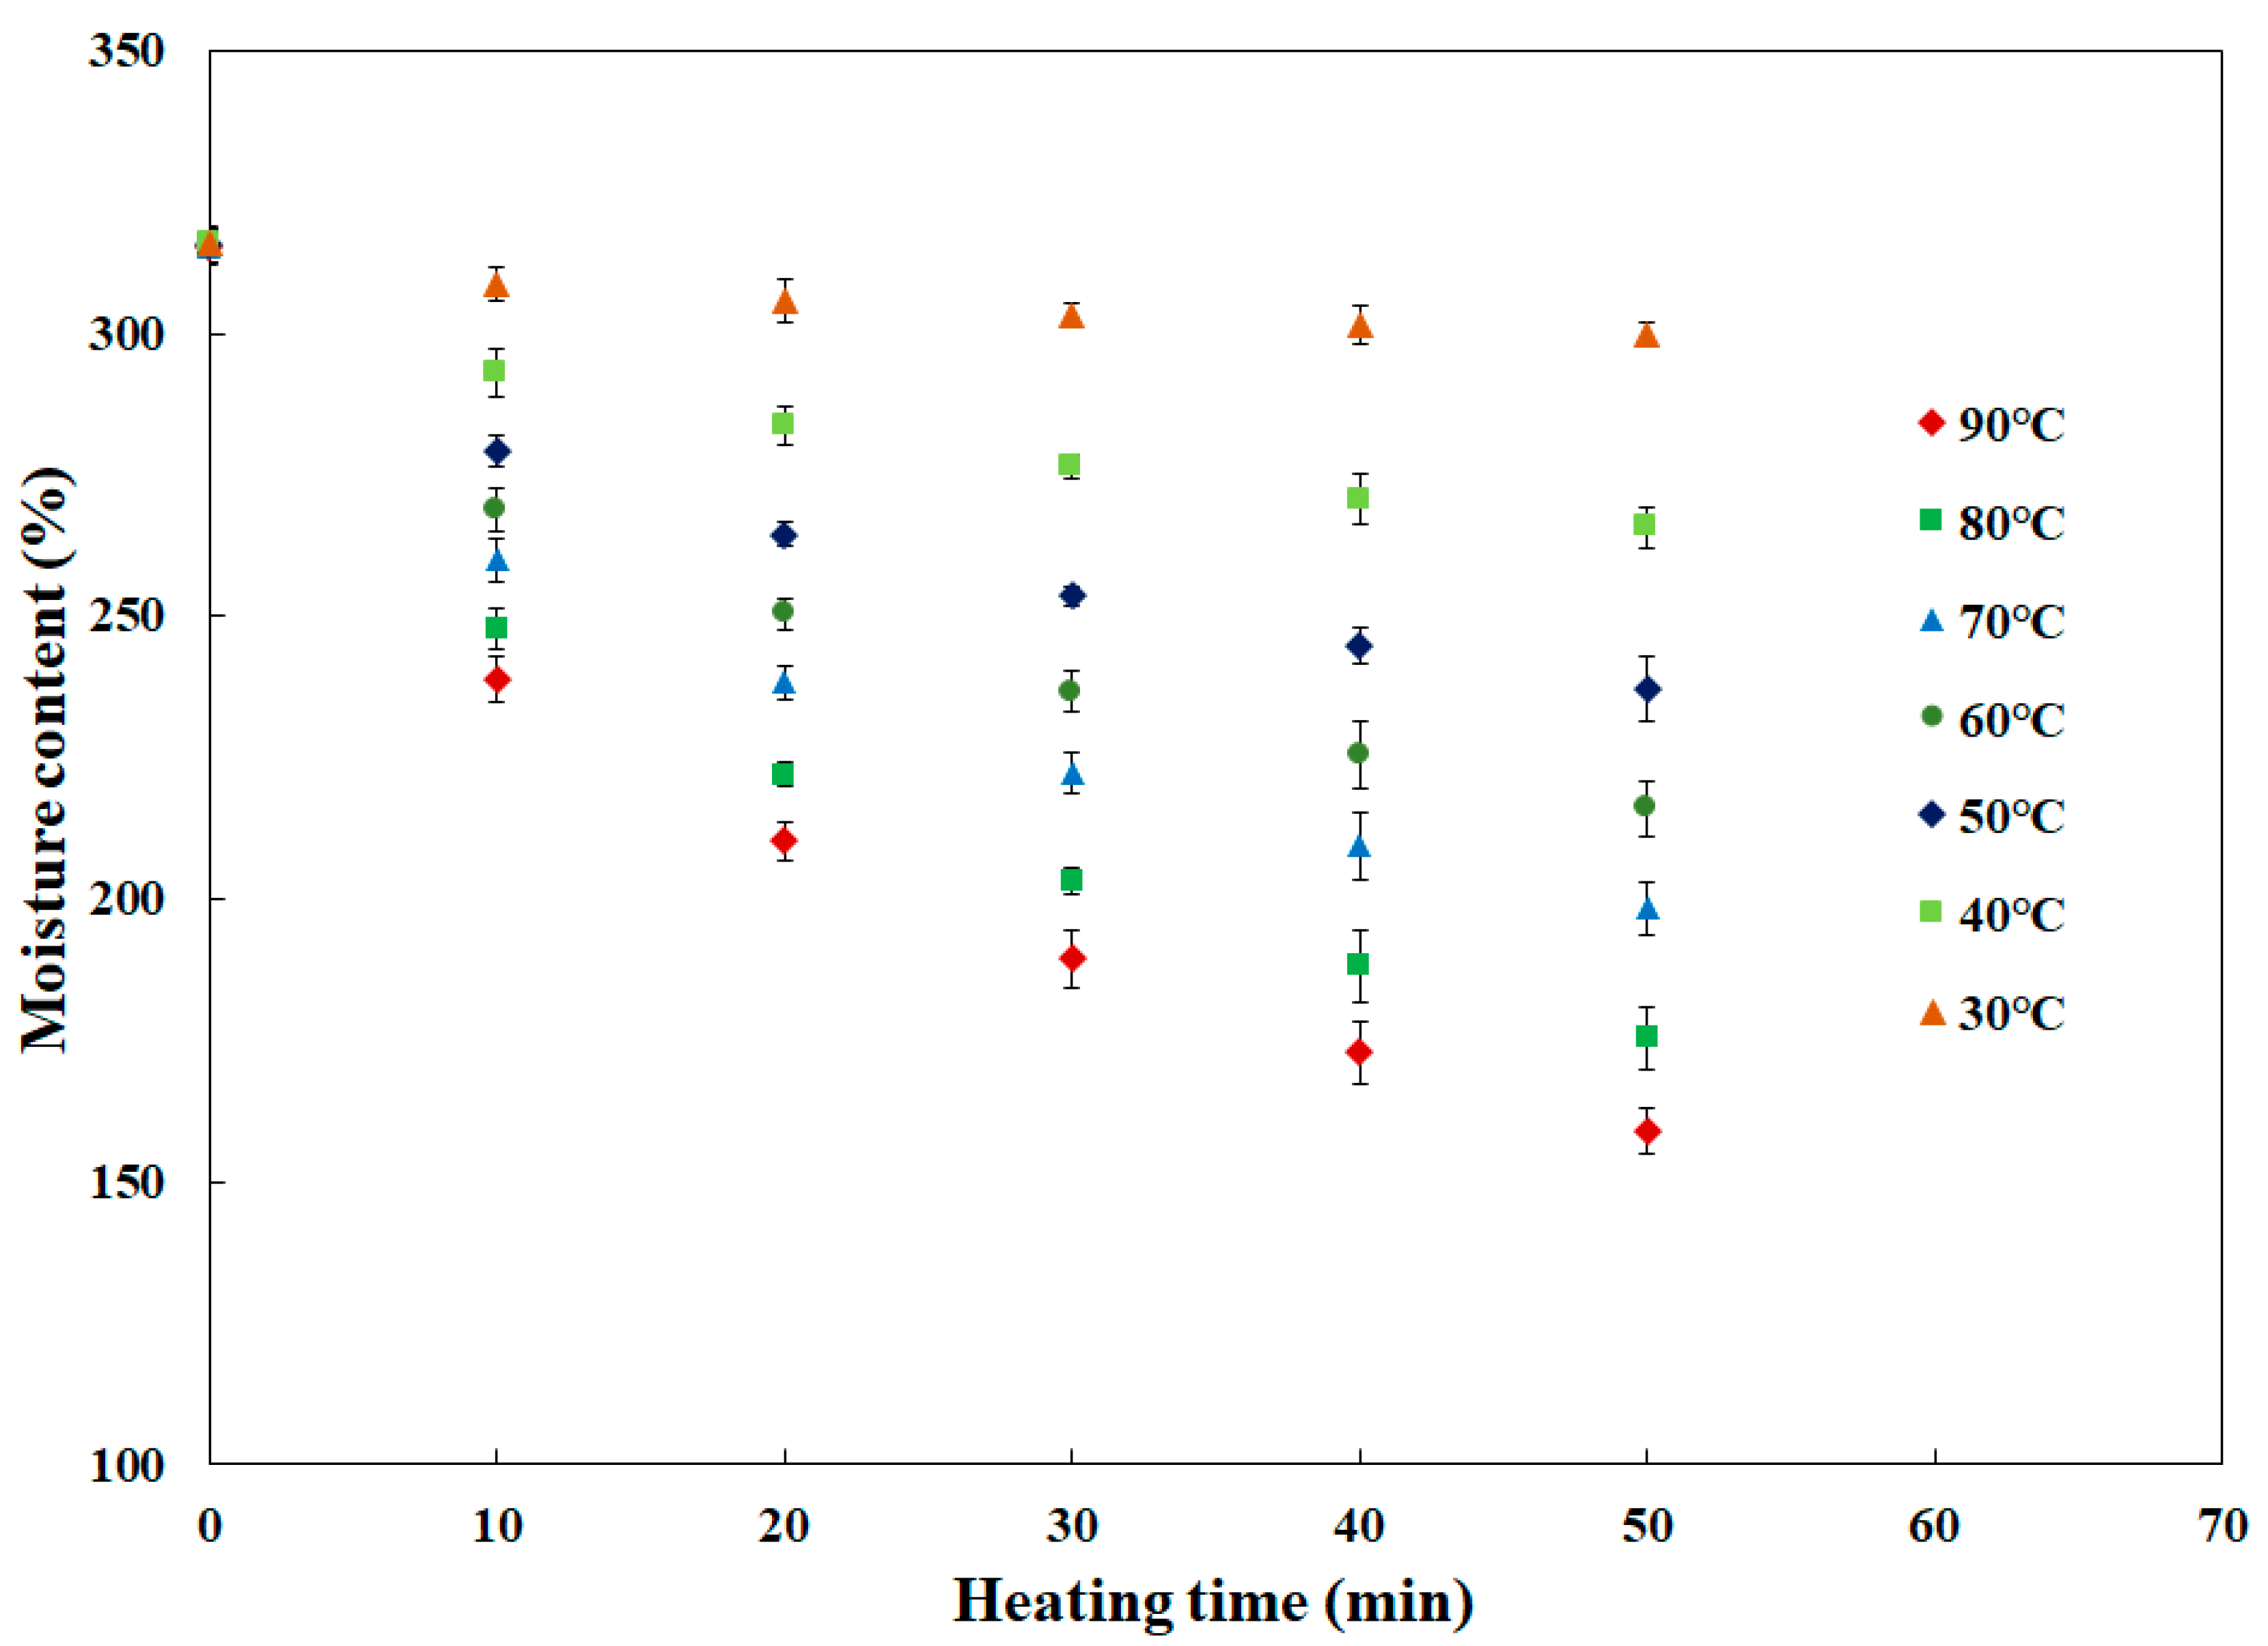
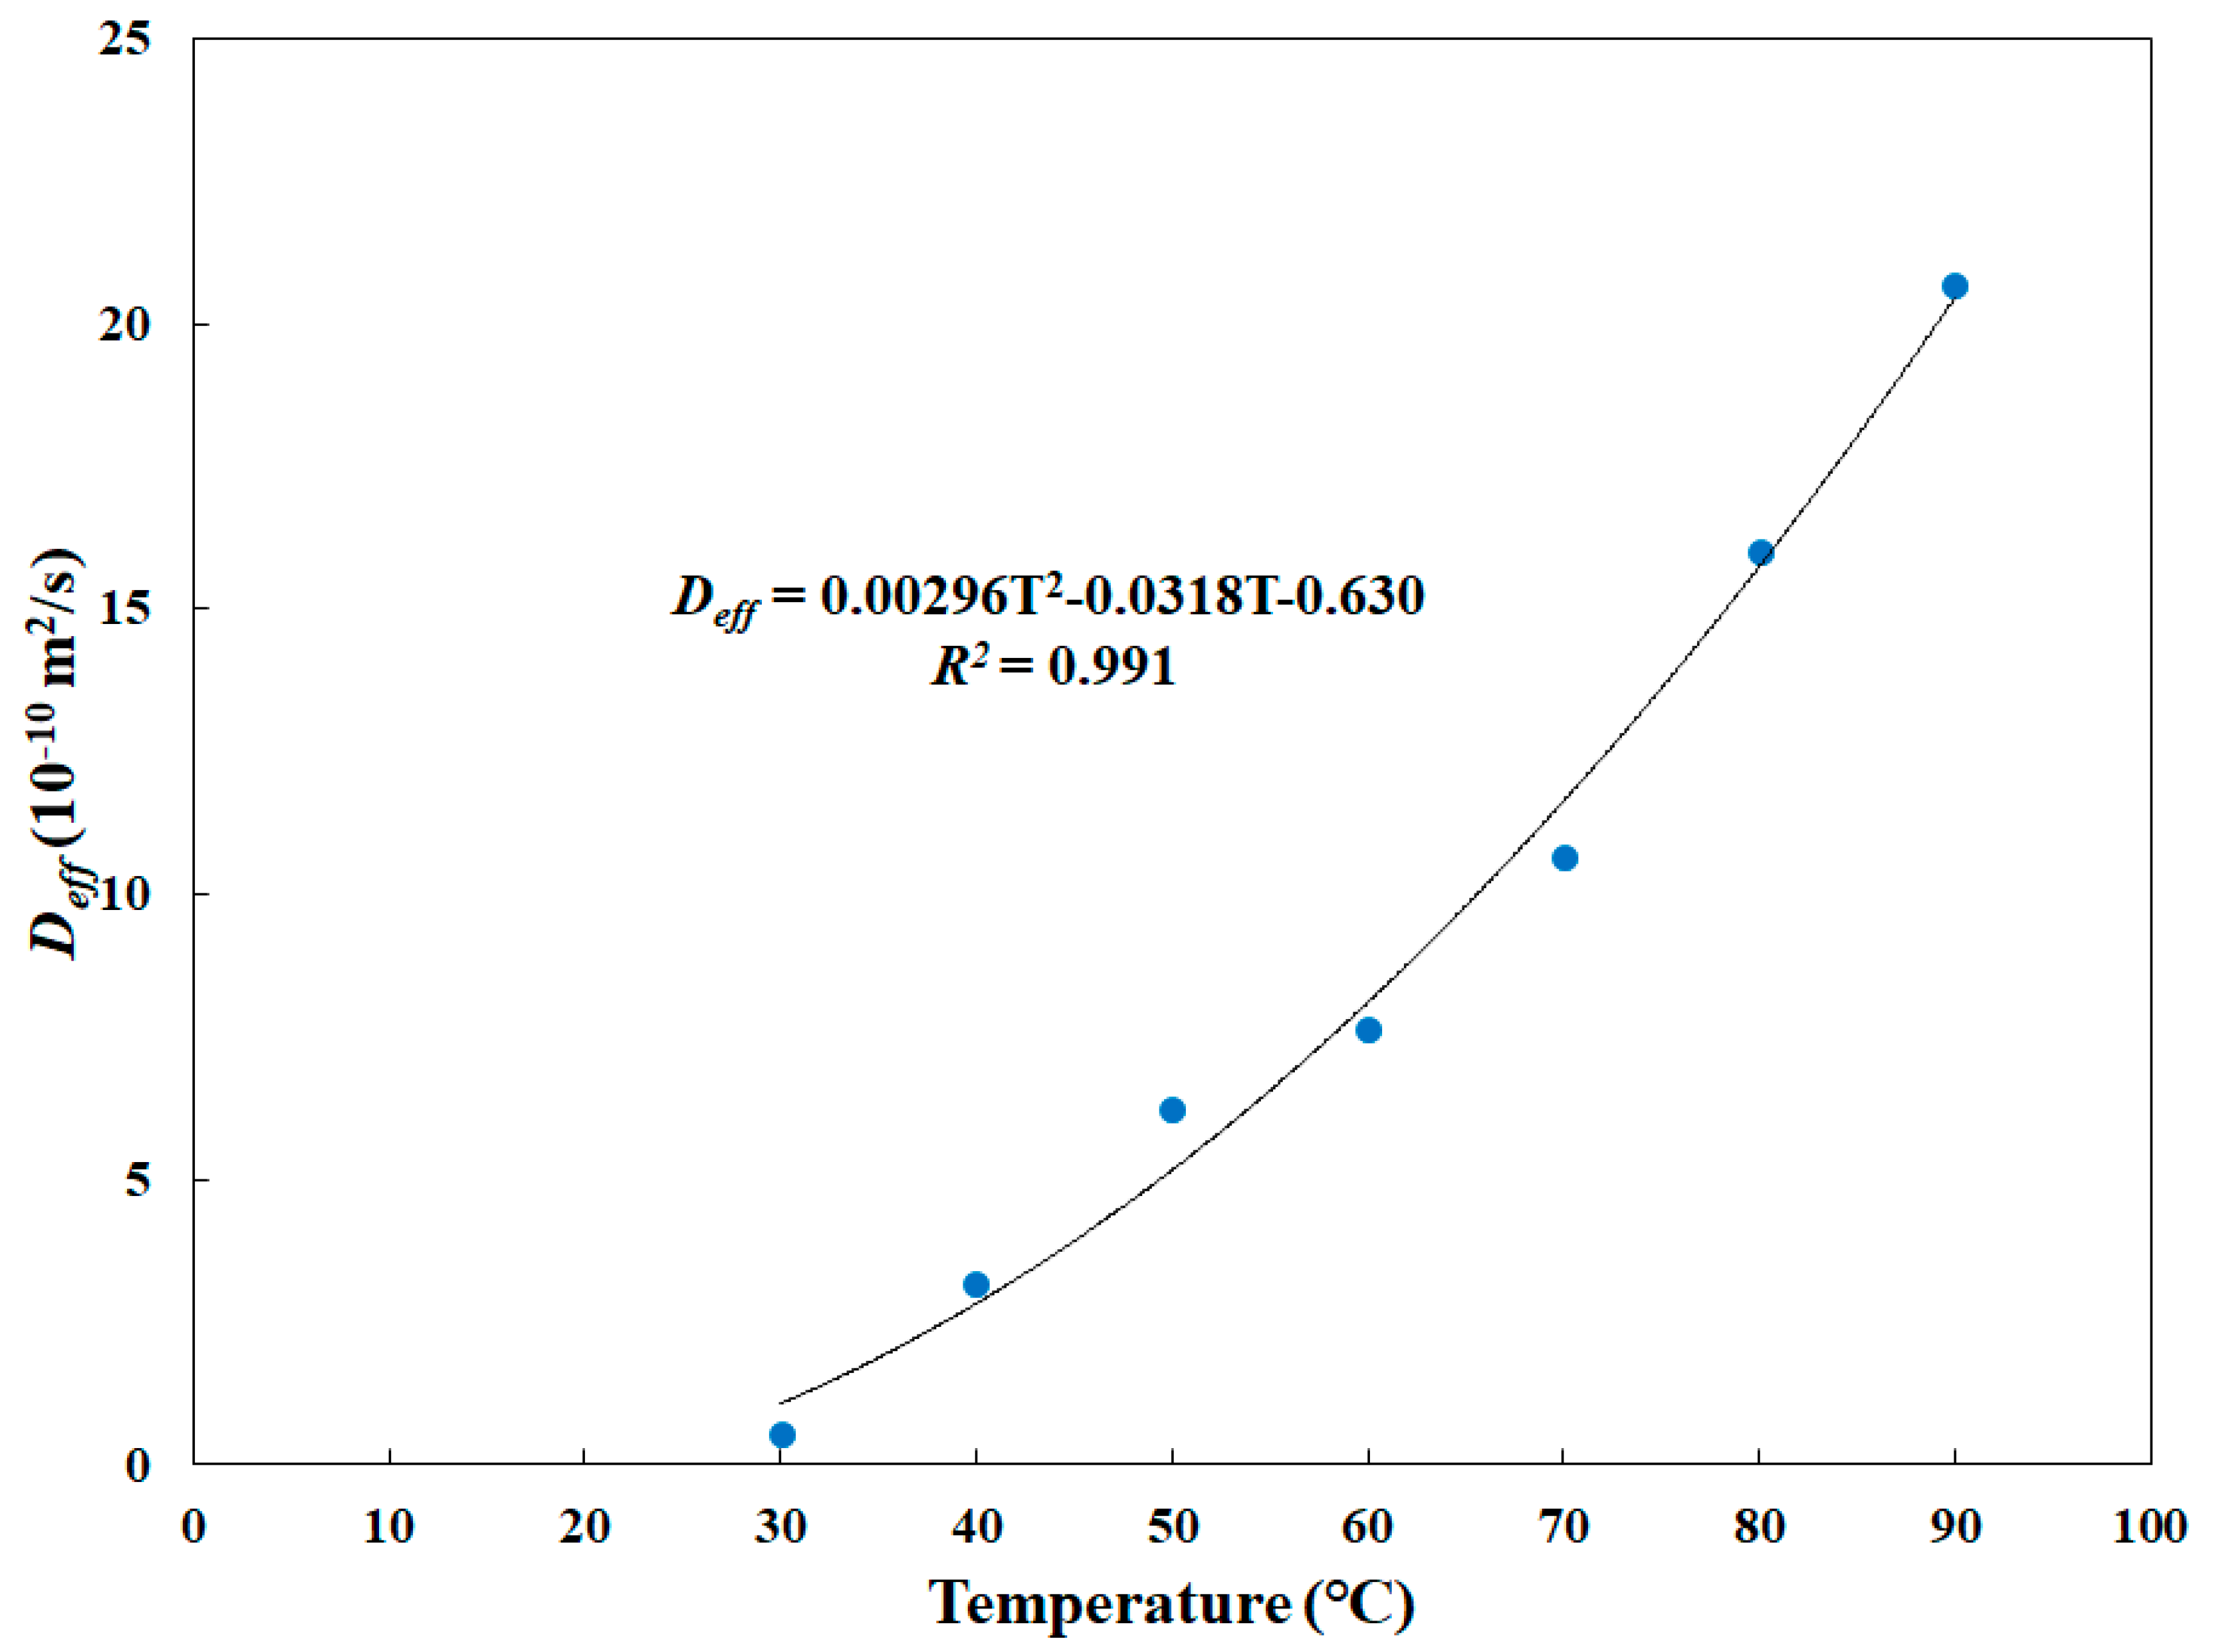
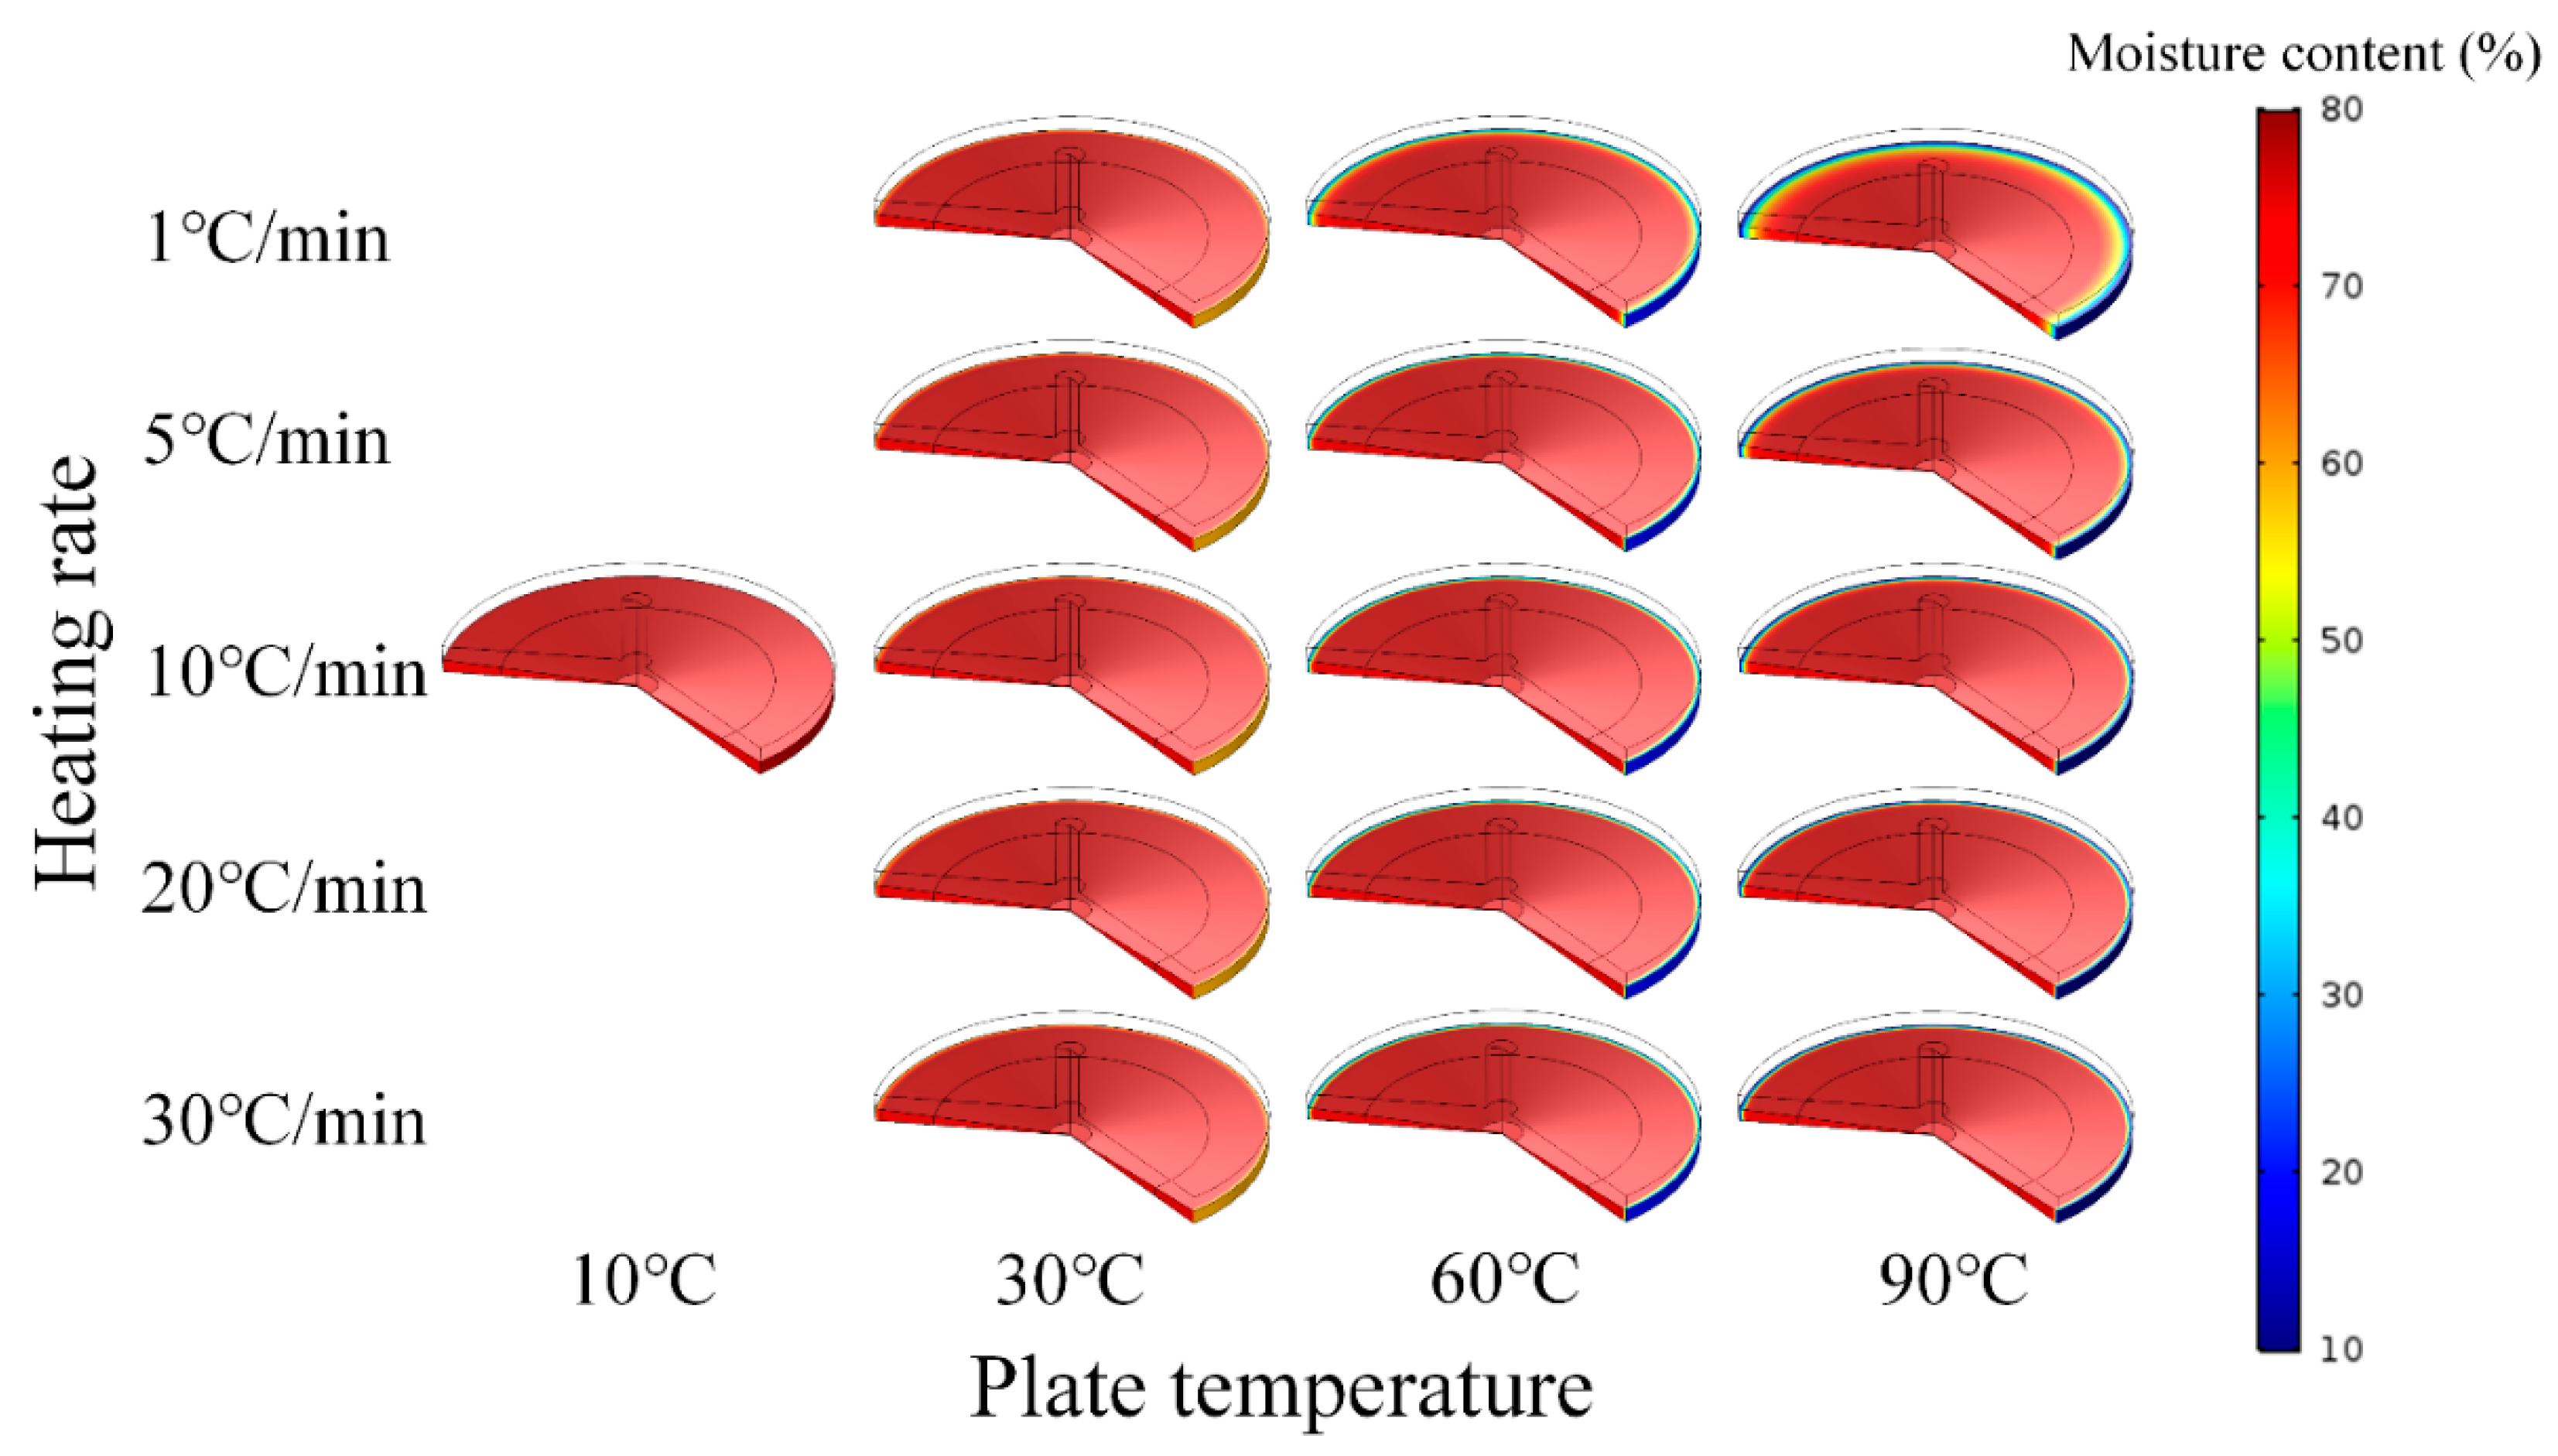
3.1. Mass Transfer Characteristics of Surimi Paste

Changes in moisture content (d.b.) of surimi paste at different temperatures (from 30 to 90 °C, every 10 °C) were measured to analyze the effect of temperature on moisture transfer of surimi paste during the temperature sweep. As expected, the rate of moisture reduction was increased significantly with the increase in the temperature of the heating plate (Figure 1). The amount of moisture content after 50 min of heating was increased from 16.27% to 156.27% as the heating temperature increased from 30 °C to 90 °C, which could be attributed to the increase in moisture diffusivity with the increase in temperature of surimi paste resulting in rapid moisture diffusion to the surface at elevated heating temperature. This temperature of surimi paste had a significant effect on the moisture diffusion of AP surimi during the temperature sweep.
The values of Deff of surimi paste at different temperatures were estimated via semi-log relationship expressed in Equation (3). Under the temperature range studied, the Deff values increased from 5.50 × 10⁻¹¹ m2/s to 2.07 × 10⁻⁹ m2/s as the temperature increased (Figure 2). The Deff values of AP surimi were in the similar range of cod loin [29]. A quadratic model representing the moisture diffusion of AP surimi as a function of temperature was fitted based on the experimental data utilizing the moisture diffusion data in the simulation model (Table 1). The activation energy (Ea) of surimi paste exposed to heat was calculated using the Arrhenius principle formulated in Equation (5). The Ea value was 48.66 kJ/mol. The physical significance of the Ea relates to the amount of energy required for moisture transfer through AP surimi.

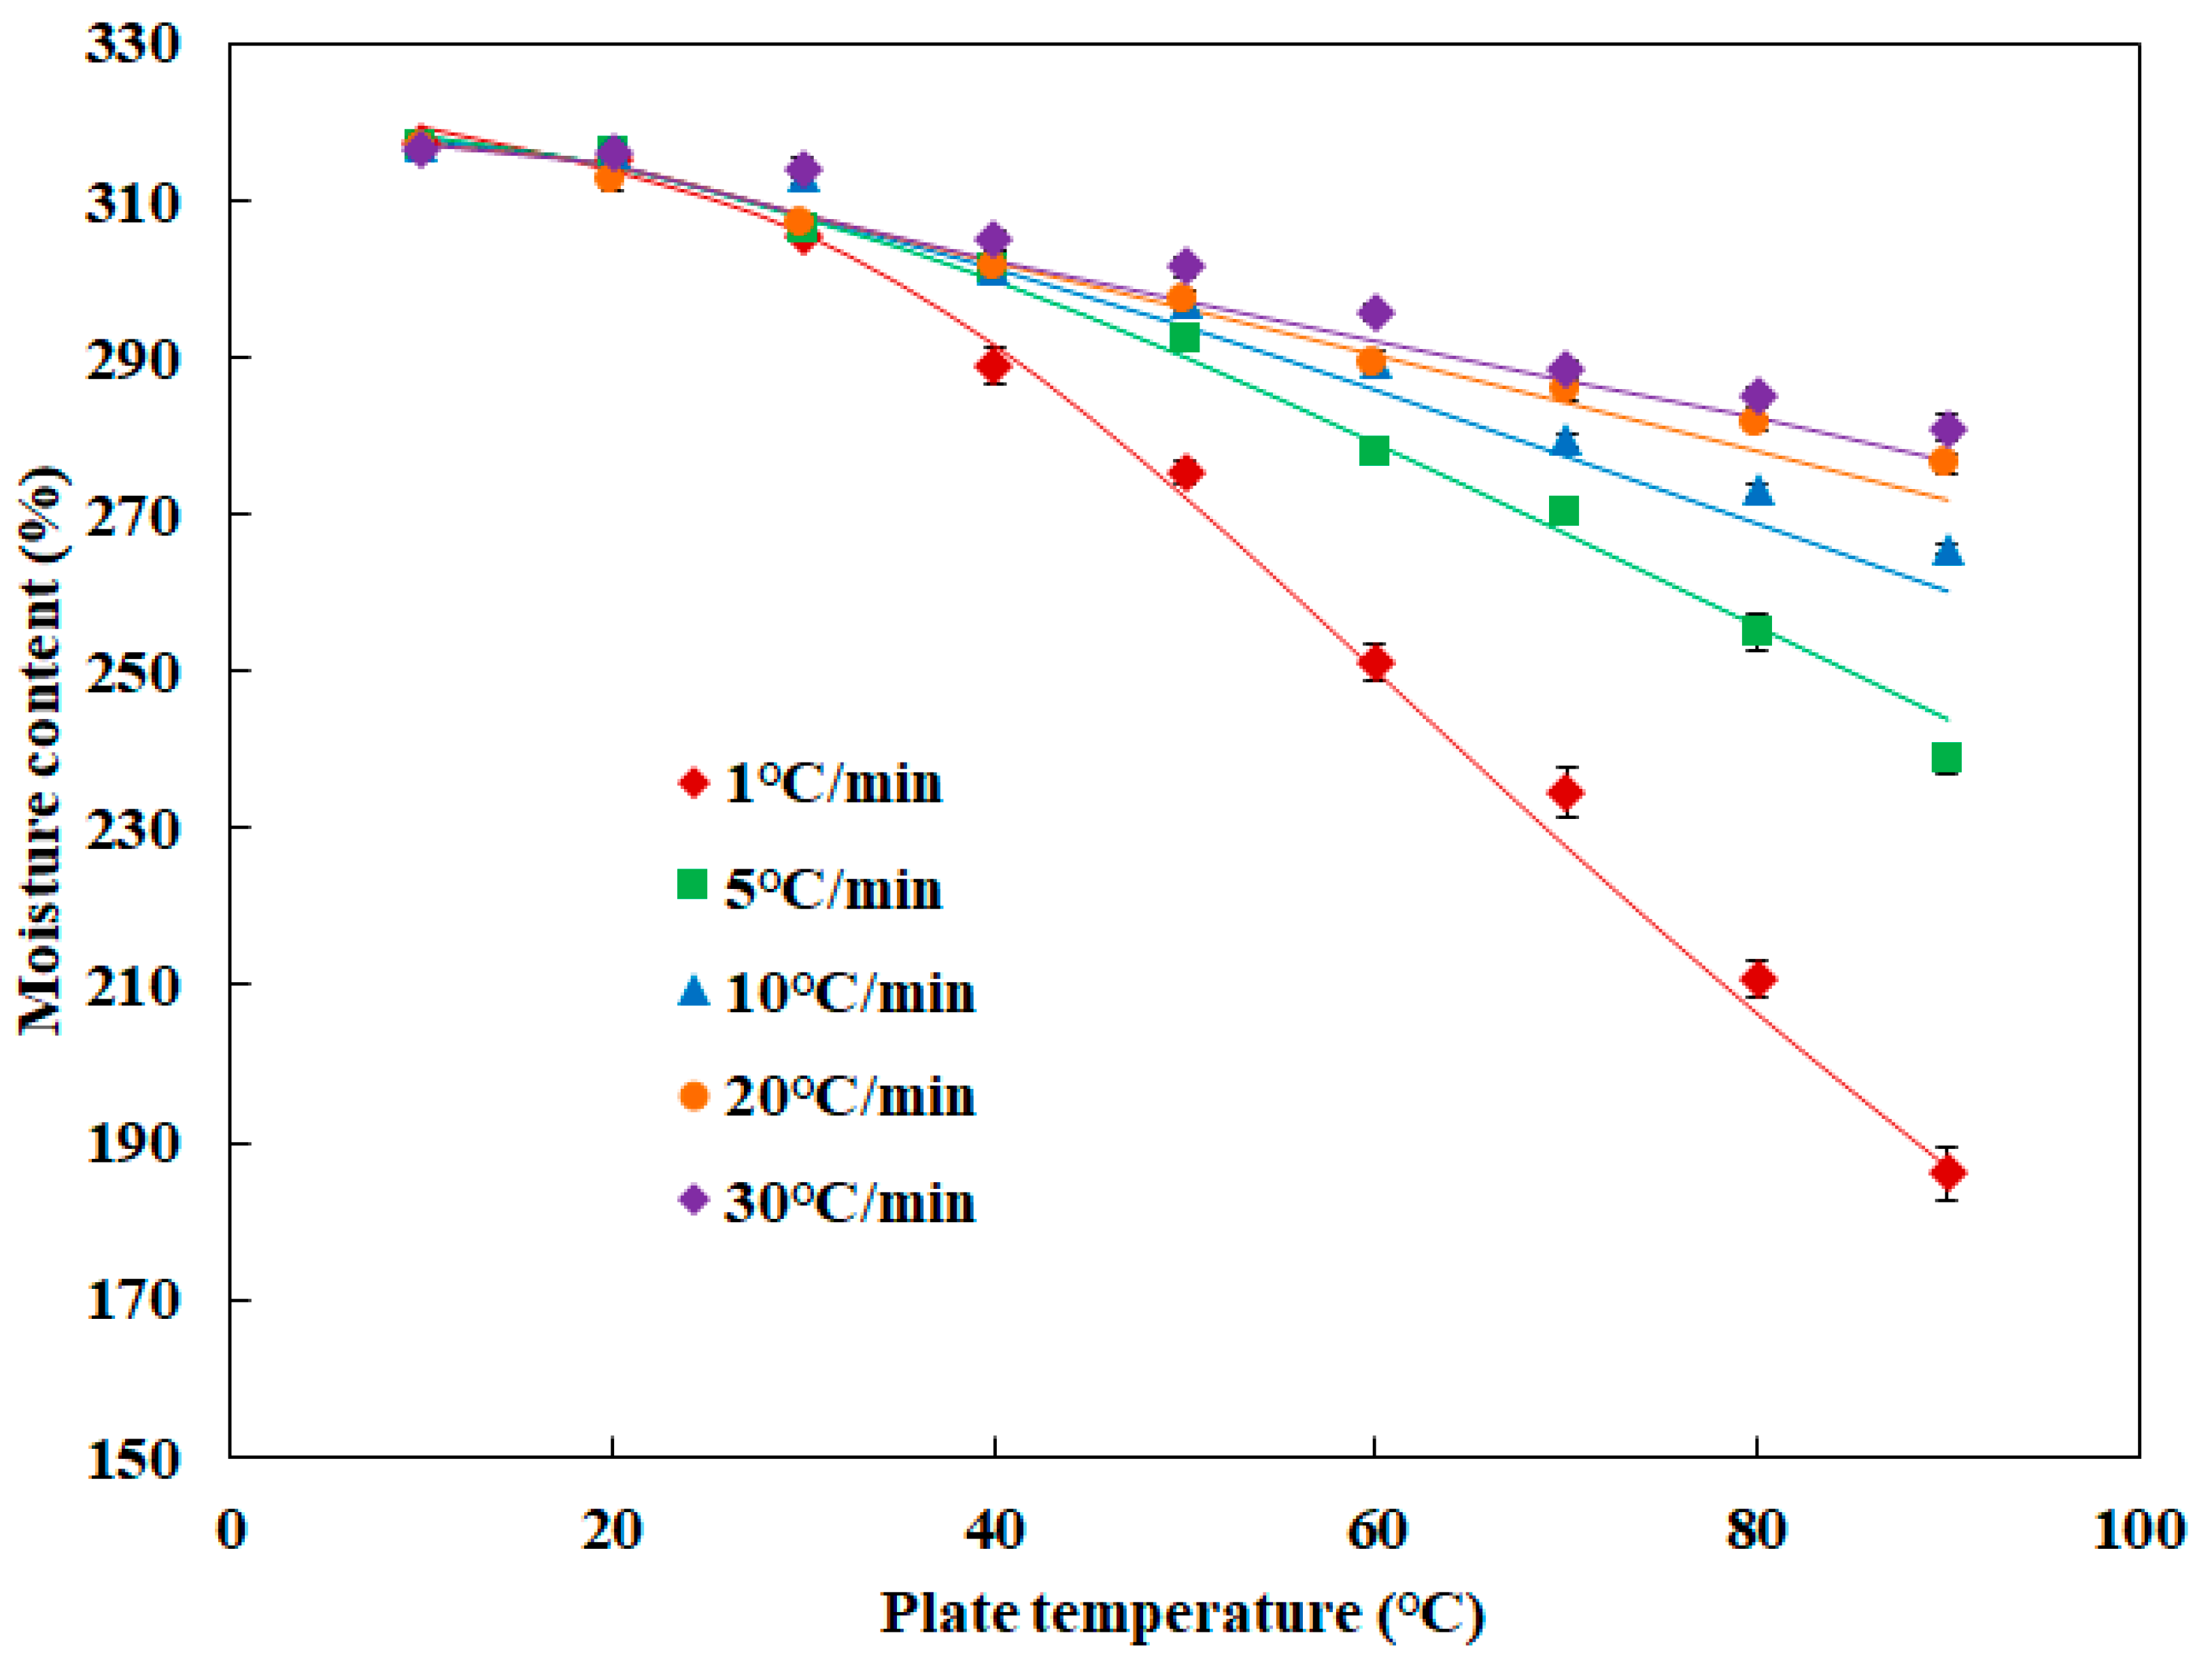
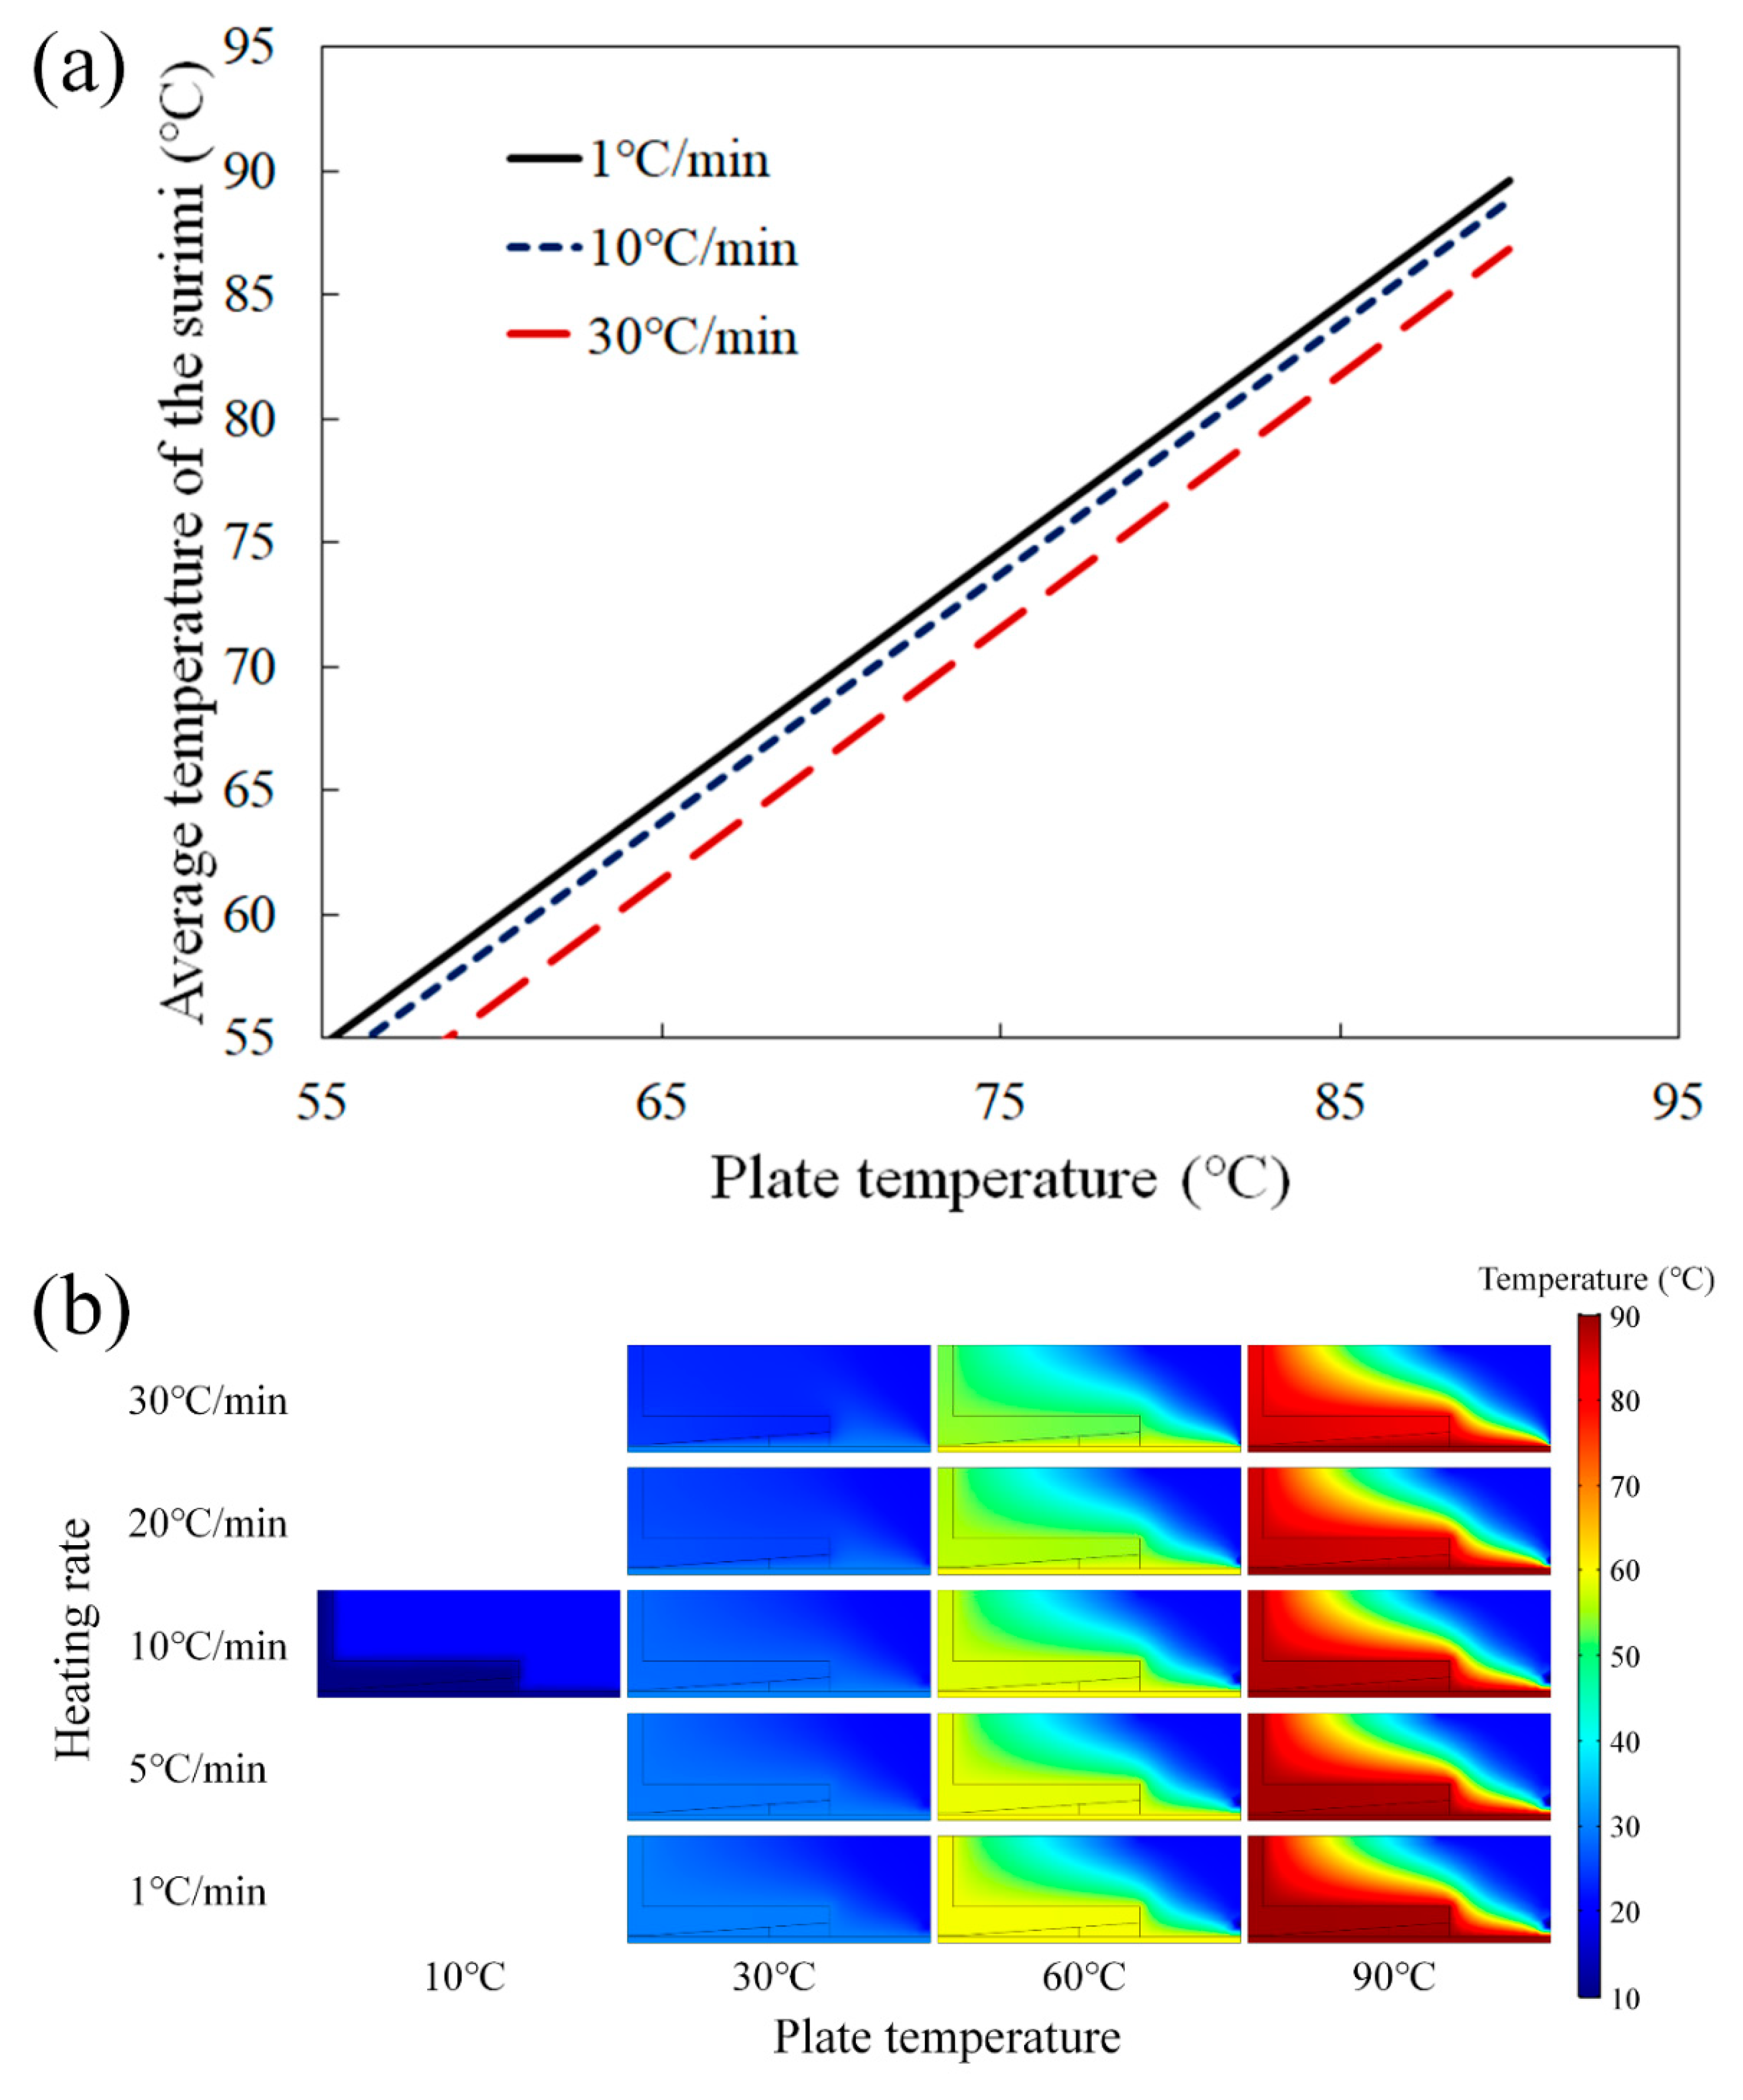
3.2. Changes in Moisture Content of Surimi during Heating and Validation of the Simulation Model

Changes in moisture content (w.b.) of AP surimi during temperature sweep at different heating rates were measured to investigate the extent of sample drying during the test. The results showed that the moisture content of AP surimi was significantly changed after the temperature sweep from 10 °C to 90 °C regardless of the heating rate (Figure 3). The moisture content was increased from 35.75% to 131.35% as the heating rate decreased from 30 to 1 °C/min because of the testing time at different heating rates, which only takes 160 s at 30 °C/min but 80 min at 1 °C/min. This result demonstrated that the heating rate during the temperature sweep of surimi significantly affects the moisture content of surimi, which may also affect the rheological properties of surimi.
For the mass and heat transfer simulation of AP surimi, an empirical model for the moisture diffusivity of AP surimi was developed and used in this study. The thermal diffusivity of AP surimi was determined from the highly referenced work of Park et al. [27] (Table 1). Changes in moisture content of AP surimi during the temperature sweep at different heating rates were simulated using the mass transfer simulation model and validated experimentally (Figure 3). Comparison of the simulated and experimental data at different heating rates indicated that the simulation model accurately predicted the changes in moisture of AP surimi during the temperature sweep (RMSE < 2.95%). Recently, a heat transfer simulation model of surimi during boiling [27] and a heat and mass transfer simulation model of cod lion during cooking [29] were developed to predict the heat transfer and moisture transfer during cooking. However, the results of the simulation models were not linked to the textural or rheological properties. Therefore, investigating the effect of heating rate on the rheological properties of surimi by using a computer simulation model could provide a better understanding of rheological properties of surimi during heating.

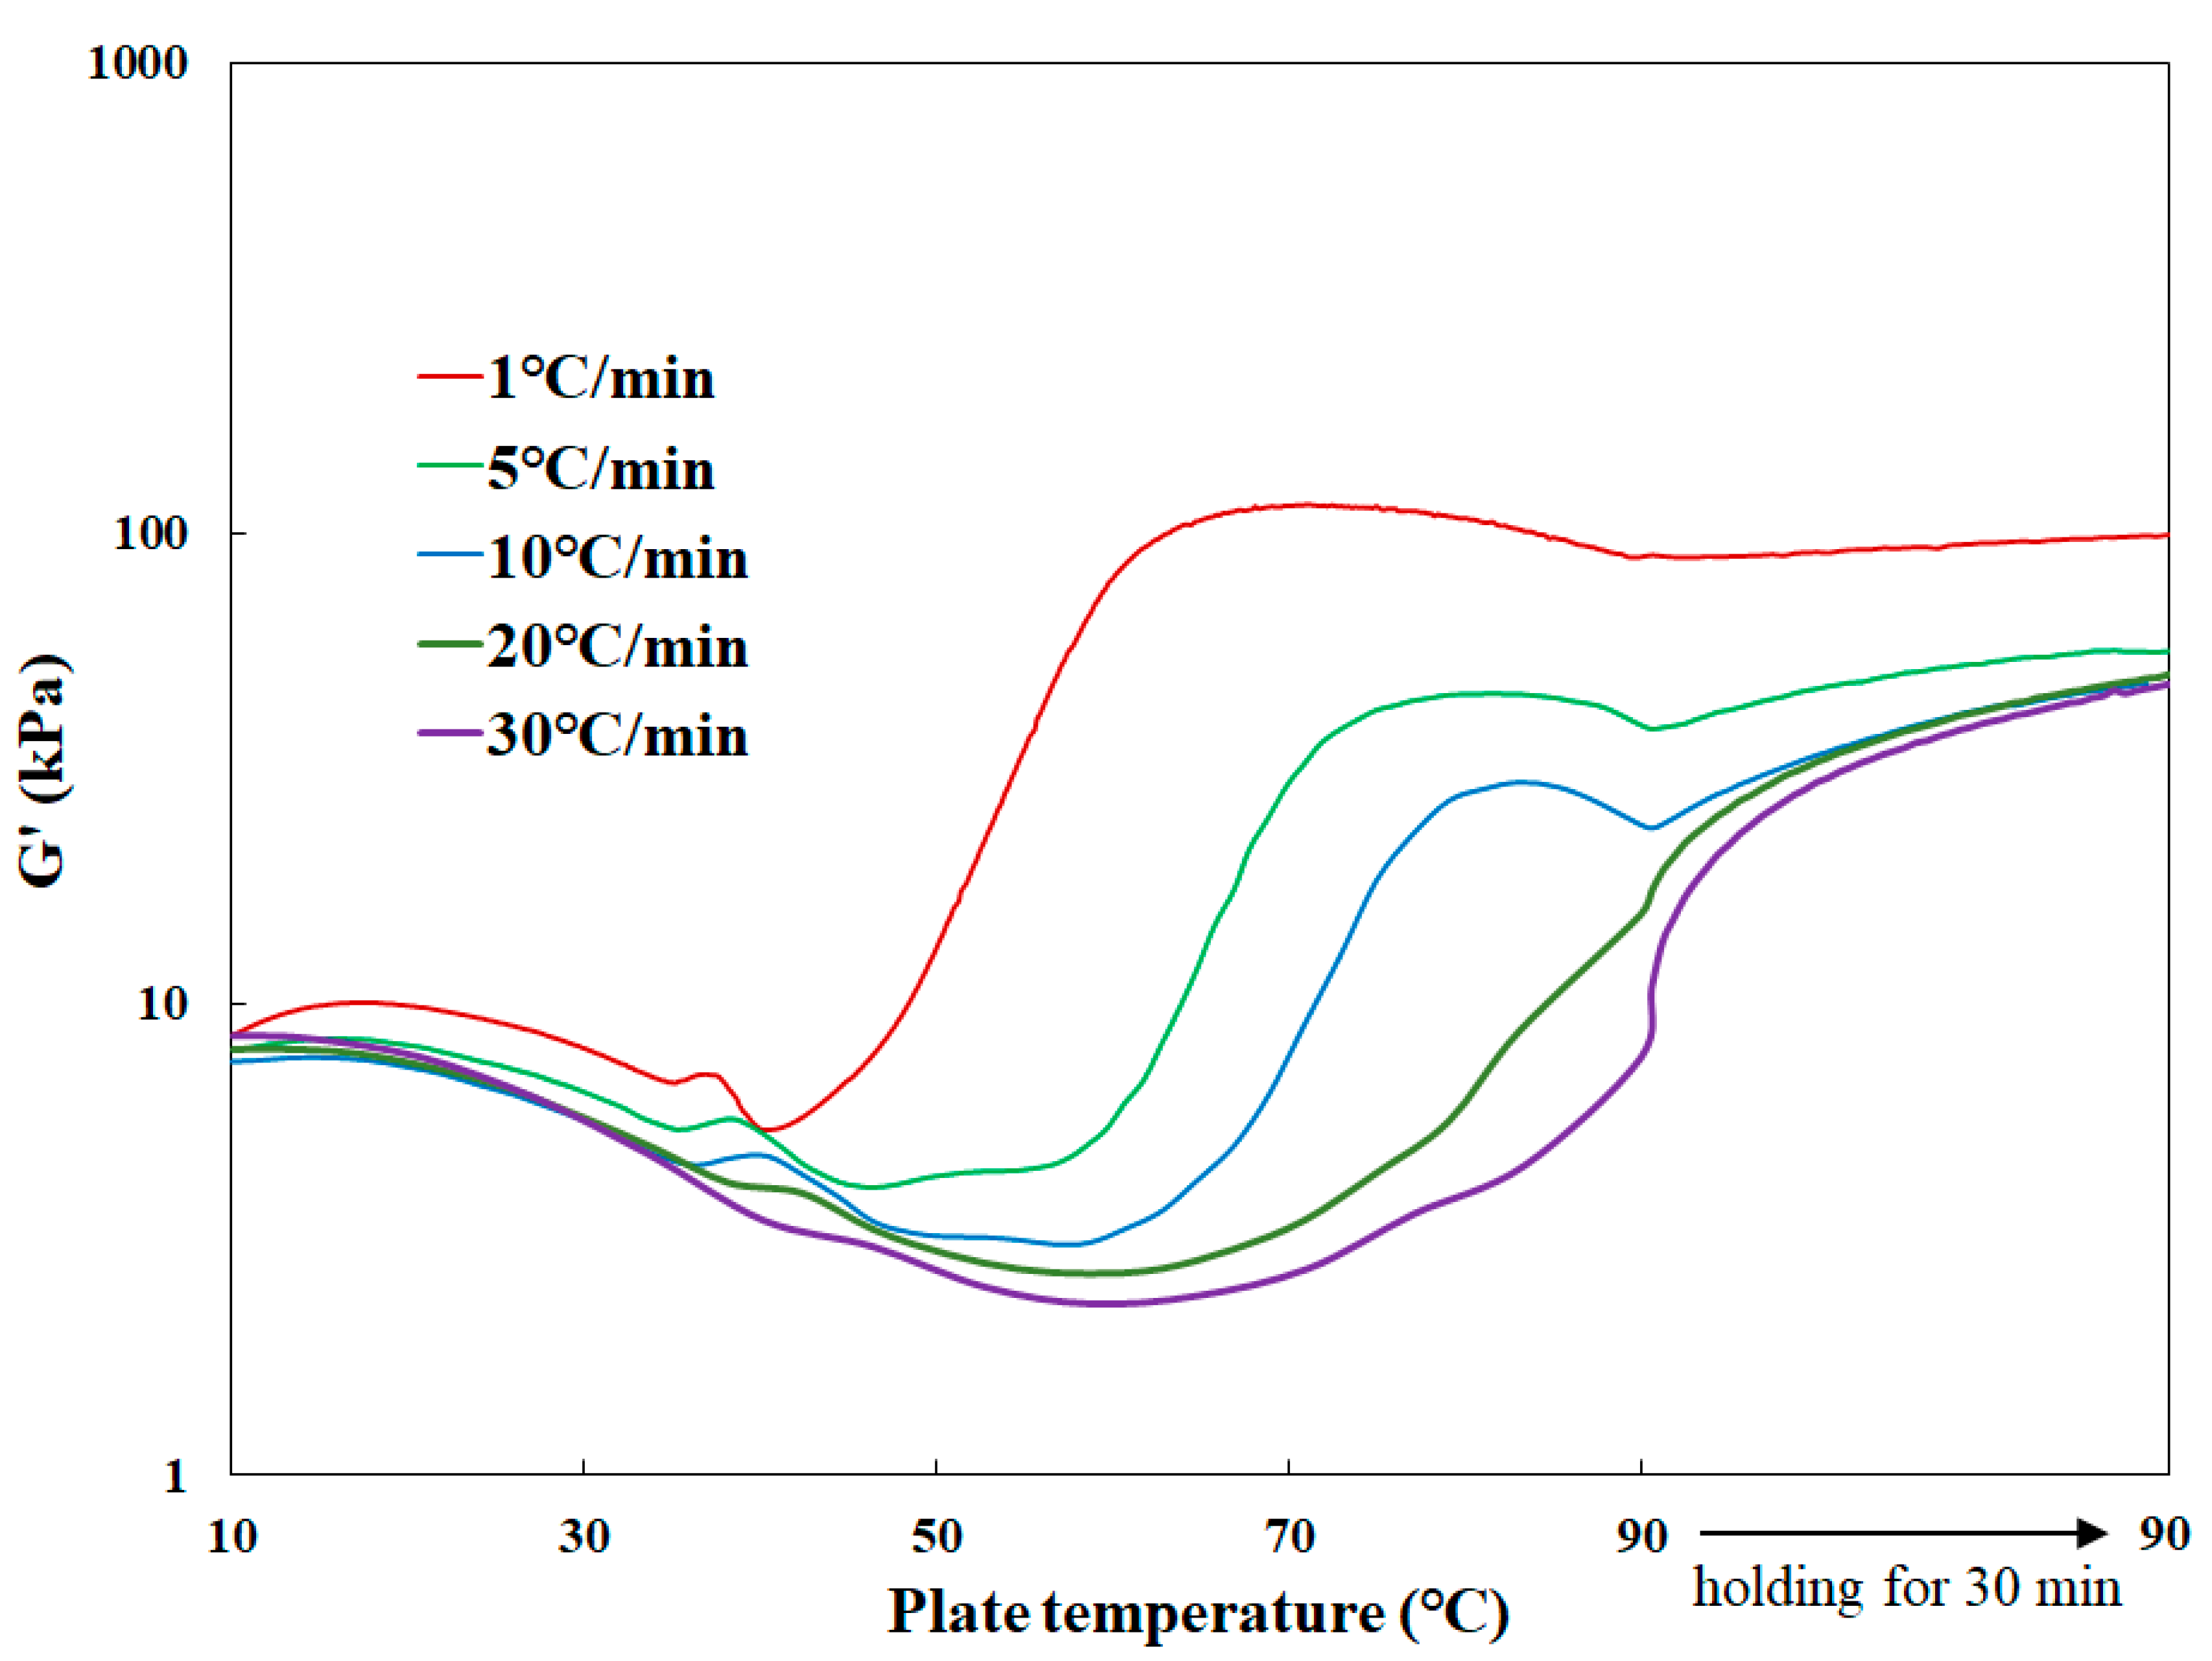
3.3. Effect of Heating Rate on Rheological Properties of Surimi

Heating rate strongly influenced the G’ of surimi paste during the temperature sweep. As heating rate increased, G’ significantly diminished (Figure 4). The results suggest that the surimi gel is impaired by heating the surimi paste at 30 °C/min, which was consistent with previous studies [6,29,30]. Since the heat transfer on the surface of surimi paste during temperature sweep was governed by natural convection, it is lower than the heat transfer coefficients reported in other studies or surimi products processing [29,31,32]. However, the temperature distribution of surimi paste would depend on the heating rate of heat plate since the heat transfer of surimi paste was strongly governed by the heat transfer from the heating plate. The results of the heat transfer simulation for surimi paste during heating were analyzed to determine the effect of heating rate on temperature distribution in the samples (Figure 5). When the temperature of plate reached 90 °C, the average temperature of the surimi was 86.8 °C at 30 °C/min while the temperature at 1 °C/min and 10 °C/min was 89.6 °C and 88.8 °C, respectively (Figure 5a). Complete gelation of fish myofibrillar proteins occurs around 75 °C under appropriate exposure to heat [33]. The results of heat transfer simulation clearly showed that the heat transfer within surimi was not uniform at 30 °C/min, which might result in impaired surimi gel formation during the temperature sweep at 20 °C/min and 30 °C/min (Figure 4).The temperature distribution of surimi during the temperature sweep is displayed in Figure 5b. The result showed that the temperature at the bottom of surimi was very close to the temperature of heating plate. However, the temperature at the edge of surimi was obviously lower than the temperature of heating plate, especially, at 20 °C/min and 30 °C/min. Such a temperature gradient within the sample significantly diminished at a slower heating rate because the time for thermal diffusion increased from 160 s to 4800 s as the heating rate decreased from 30 °C/min to 1 °C/min (Figure 5b). Notably, G’ of sample heated at 10 °C/min also significantly increased during 30 min holding after heating to 90 °C even though the temperature gradient within the sample at 10 °C/min was negligible, which indicates incomplete gelation of surimi (Figure 4). This result suggests rapid temperature sweep at 10 °C/min for gelation of surimi since it cannot ensure adequate heat supply to myofibrillar proteins.
As shown in Figure 4, minimum or no changes in G′ were detected at 90 °C for 30 min when the heating rates ranged between 1 °C/min and 5 °C/min, which indicate that the gelation of AP surimi was complete during the temperature sweep. However, as discussed above, the amount of moisture content was significantly increased as the heating rate decreased (Figure 4), which may affect the rheological properties of surimi. It is well known that G’ of surimi strongly depends on the moisture content of the sample [7,34]. As the moisture content of surimi decreased, the G’ value increased significantly. This result is in line with that reported for shear stress of surimi in which the shear stress of Alaska pollock surimi increased as the moisture decreased [35]. Although the surimi were properly heated during temperature sweep at 1 °C/min and 5 °C/min, the temperature sweep at 1 °C/min yielded a much higher G’ value than the temperature sweep at 5 °C/min, which might be attributed to the decreased moisture content during the temperature sweep. Generally, the myofibrillar proteins of Alaska pollock surimi fully form gel networks that contribute to the elastic properties of surimi gels following exposure to heat at 90 °C for 30 min [1]. However, after 30 min of holding time at 90 °C, G’ values at 1 °C/min and 5 °C/min were 99.63 kPa and 56.37 kPa, respectively, while G’ values at 10 °C/min, 20 °C/min and 30 °C/min did not vary significantly (49.00 kPa ± 1.22) (Figure 4). These findings can be explained by the moisture distribution within surimi during temperature sweep. The results of mass transfer simulation for temperature sweep of surimi are shown in Figure 6. At lower heating rates (1 °C/min and 5 °C/min), a significantly lower moisture content of surimi was observed near the surface when the temperature of surimi reached 90 °C while the moisture distribution of surimi at higher heating rates (30 °C/min, 20 °C/min and 10 °C/min) showed no significant difference. The effect of moisture content on the rheological properties of surimi in this study was consistent with previous studies [7,34]. Thus, it was clearly demonstrated that the heating rate during temperature sweep of surimi significantly affected the temperature and moisture distribution of surimi, which influence the rheological properties of surimi. Therefore, the heating rate should be determined by the heat and mass transfer conditions of surimi during the temperature sweep.

4. Conclusions

In this study, the effect of heating rates on the rheological properties of AP surimi was investigated using a heat and mass transfer simulation model. Moisture transfer characteristics of AP surimi were investigated, and the effective moisture diffusivity increased from 5.50 × 10⁻¹¹ to 2.07 × 10⁻⁹ m2/s as the temperature increased from 30 °C to 90 °C. The effective moisture diffusivity was modeled as a function of temperature and used in the simulation model. Based on the moisture diffusivity, a heat and mass transfer simulation model for AP surimi was successfully developed (RMSE < 0.17%). The rheological properties of AP surimi during temperature sweep were assessed at different heating rates (30 °C/min, 20 °C/min, 10 °C/min, 5 °C/min and 1 °C/min). As the heating rate increased to 20 °C/min and 30 °C/min, the G’ value was significantly diminished. The temperature distribution of AP surimi during temperature sweep was investigated using the simulation model developed. The results showed that no thermal equilibrium was reached during the temperature sweep at higher heating rates, especially, at 20 °C/min and 30 °C/min, which might impair the effect of gel on the rheological properties. Changes in moisture content of AP surimi during the temperature sweep were also studied to determine the effect of heating rate on the rheological properties of AP surimi. The results showed that the amount of moisture lost due to evaporation was significantly reduced by the short duration of gelation at higher heating rates. Moisture distribution of AP surimi determined using the simulation model showed a significantly lower moisture content of surimi near the surface, which also influenced the rheological properties of surimi paste during heating especially at 1 °C/min heating rate. Therefore, heating rate at 5–10 °C/min is suggested for SAOS test of surimi to investigate the rheological properties during temperature sweep. It clearly demonstrates that the heating rate used for the temperature sweep measurement significantly affected the rheological properties of surimi gels associated with drying and thermal equilibrium. This study provided a better understanding of the effect of heating rates that could assist the surimi seafood industry to develop various products with good texture properties.

Author Contributions

Conceptualization, H.W.P., W.B.Y., and J.W.P.; methodology, H.W.P., J.W.P., and W.B.Y.; investigation, H.W.P.; writing-original draft preparation, H.W.P.; writing-review and editing, H.W.P., J.W.P., and W.B.Y.; supervision, J.W.P. and W.B.Y.; project administration, W.B.Y. All authors have read and agreed to the published version of the manuscript.

Funding

Following are results of a study on the “Leaders in INdustry-university Cooperation +” Project, supported by the Ministry of Education and National Research Foundation of Korea. This research was supported by the Basic Science Research Program through the National Research Foundation of Korea (NRF) funded by the Ministry of Education (NRF-2018R1D1A3B064042501).

Conflicts of Interest

The authors declare no conflict of interest.

References

  1. Park, H.W.; Yoon, W.B. Measuring ring tensile stress and strain of surimi gels using a novel ring tensile test with image analysis. J. Food Sci. 2015, 163, 9–16. [Google Scholar] [CrossRef]
  2. Kim, B.Y.; Park, J.W.; Yoon, W.B. Rheology and texture properties of surimi gels. In Surimi and Surimi Seafood, 2nd ed.; Park, J.W., Ed.; Taylor & Francis: Boca Raton, FL, USA, 2015; pp. 491–582. [Google Scholar]
  3. Kobayashi, Y.; Mayer, S.G.; Park, J.W. Gelation properties of tilapia fish protein isolate and surimi pre- and post-rigor: Rigor condition of tilapia FPI and surimi. Food Biosci. 2017, 17, 17–23. [Google Scholar] [CrossRef]
  4. Zhou, X.; Lin, H.; Zhu, S.; Xu, X.; Lyu, F.; Ding, Y. Textural, rheological and chemical properties of surimi nutritionally-enhanced with lecithin. LWT-Food Sci. Tech. 2020, 122, 108984. [Google Scholar] [CrossRef]
  5. Smyth, A.B.; O’neill, E. Heat-induced gelation properties of surimi from mechanically separated chicken. J. Food Sci. 1997, 62, 326–330. [Google Scholar] [CrossRef]
  6. Yongsawatdigul, J.; Park, J.W. Thermal aggregation and dynamic rheological properties of Pacific whiting and cod myosins as affected by heating rate. J. Food Sci. 1999, 64, 679–683. [Google Scholar] [CrossRef]
  7. Poowakanjana, S.; Park, J.W.; Moon, J.H.; Yoon, W.B. Assessing the dynamic rheology at various frequencies of surimi paste as affected by heating rates and moisture contents. J. Texture Stud. 2015, 46, 302–311. [Google Scholar] [CrossRef]
  8. Camou, J.P.; Sebranek, J.G.; Olson, D.G. Effect of heating rate and protein concentration on gel strength and water loss of muscle protein gels. J. Food Sci. 1989, 54, 850–854. [Google Scholar] [CrossRef]
  9. Hermansson, A.M. Aggregation and denaturation involved in gel formation. In Functionality and Protein Structure; Pour-El, A., Ed.; American Chemical Society: Washington, DC, USA, 1979; pp. 81–103. [Google Scholar]
  10. Xiang, Y.L.; Blanchard, S.P. Myofibrillar protein gelation: Viscoelastic changes related to heating procedures. J. Food Sci. 1994, 59, 734–738. [Google Scholar] [CrossRef]
  11. Ditudompo, S.; Takhar, P.S.; Ganjyal, G.M.; Hanna, M.A. The effect of temperature and moisture on the mechanical properties of extruded cornstarch. J. Texture Stud. 2013, 44, 225–237. [Google Scholar] [CrossRef]
  12. Biswas, A.C.; Muthukumarappan, K.; Metzger, L.E. Dynamic rheological properties of process cheese: Effect of Ca and P content, residual lactose, salt-to-moisture ratio and cheese temperature. Int. J. Food Prop. 2008, 11, 282–295. [Google Scholar] [CrossRef]
  13. Norton, T.; Sun, D. Computational fluid dynamics (CFD)–An effective and efficient design and analysis tool for the food industry: A review. Trends Food Sci. Tech. 2006, 17, 600–620. [Google Scholar] [CrossRef]
  14. Park, H.W.; Yoon, W.B. Computational fluid dynamics (CFD) modelling and application for sterilization of foods: A review. Processes 2018, 6, 62. [Google Scholar] [CrossRef] [Green Version]
  15. Park, H.W.; Yoon, W.B. Development of a novel image analysis technique to detect the moisture diffusion of soybeans [Glycine max (L.)] during rehydration using a mass transfer simulation model. Food Bioprocess Tech. 2018, 11, 1887–1894. [Google Scholar] [CrossRef]
  16. Park, H.W.; Yoo, J.S.; Jung, H.; Yoon, W.B. Developing a sterilization processing and a grading system to produce a uniform quality of sterilized whole corn (Zea mays L. var. ceratina). J. Food Eng. 2019, 249, 55–65. [Google Scholar] [CrossRef]
  17. Park, H.W.; Yoon, W.B. Prediction of the intermittent drying behavior of soybeans [Glycine max (L.)] using novel multilayered mass transfer simulation with image analysis. Dry. Techol. 2019, 37, 1228–1238. [Google Scholar] [CrossRef]
  18. Park, H.W.; Yoon, W.B. A quantitative microbiological exposure assessment model for Bacillus cereus in pasteurized rice cakes using computational fluid dynamics and Monte Carlo simulation. Food Res. Int. 2019, 125, 108562. [Google Scholar] [CrossRef] [PubMed]
  19. Park, H.W.; Yoon, W.B. Effects of air movement in a hot air dryer on the drying characteristics of colored potato (Solanum tuberosum L.) using computational fluid dynamics. Int. J. Agric. Biologic. Eng. 2018, 11, 232–240. [Google Scholar]
  20. Hussain, M.M.; Dincer, I. Two-dimensional heat and moisture transfer analysis of a cylindrical moist object subjected to drying: A finite-difference approach. Int. J. Heat and Mass Trans. 2003, 46, 4033–4039. [Google Scholar] [CrossRef]
  21. Poowakanjana, S.; Park, J.W. Comminution process of surimi and surimi seafood paste. In Surimi and Surimi Seafood, 3rd ed.; Park, J.W., Ed.; CRC Press: Boca Raton, FL, USA, 2014. [Google Scholar]
  22. Park, H.W.; Han, W.Y.; Yoon, W.B. Drying characteristics of soybean (Glycine max) using continuous drying and intermittent drying. Int. J. Food Eng. 2018, 14, 1–14. [Google Scholar] [CrossRef]
  23. AOAC Official Methods of Analysis. Association of Official Analytical Chemists; Association of Official Analytical Chemists: Washington, DC, USA, 1990. [Google Scholar]
  24. Marinos-Kouris, D.; Maroulis, Z.B. Transfer properties in the drying of solids. In Handbook of Industrial Drying; Mujumdar, A.S., Ed.; Marcel Deker: New York, NY, USA, 1995; pp. 133–155. [Google Scholar]
  25. Incoperra, F.P.; De Witt, D.P. Fundamentals of Heat and Mass Transfer, 3rd ed.; Wiley: New York, NY, USA, 1990; p. 356. [Google Scholar]
  26. Supawang, S.; Park, J.W.; Thawornchinsombut, S. Fab blocking roles of fish proteins in fried fish cake. LWT-Food Sci. Technol. 2018, 97, 462–468. [Google Scholar] [CrossRef]
  27. Park, H.W.; Lee, M.G.; Park, J.W.; Yoon, W.B. Developing an accurate heat transfer simulation model of Alaska pollock surimi paste by estimating the thermal diffusivities at various moisture and salt contents. Int. J. Food Eng. 2020, in press. [Google Scholar] [CrossRef]
  28. Smolka, J.; Nowak, A.J.; Rybarz, D. Improved 3-D temperature uniformity in a laboratory drying oven based on experimentally validated CFD computation. J. Food Eng. 2010, 97, 373–383. [Google Scholar] [CrossRef]
  29. Blikra, M.J.; Skipnes, D.; Feyissa, A.H. Model for heat and mass transport during cooking of cod loin in a convection oven. Food Control 2019, 102, 29–37. [Google Scholar] [CrossRef]
  30. Cofrades, S.; Carballo, J.; Jiménez-colmenero, F. Heating rate effects on high-fat and low-fat frankfurters with a high content of added water. Meat Sci. 1997, 47, 105–114. [Google Scholar] [CrossRef] [Green Version]
  31. Leksrisompong, P.N.; Lanier, T.C.; Foegeding, E.A. Effects of heating rate and pH on fracture and water-holding properties of globular protein gels as explained by micro-phase separation. J. Food Sci. 2012, 77, E60–E67. [Google Scholar] [CrossRef]
  32. Cabrera, M.A.R.; Garcia, R.G.; Archila, M.A.; Lagunes, A.G. Elaboration of surimi-based products from Lisa blanca (Mugil curema) with different thermal treatments: Heat transfer modeling to determine cooking time and thermophysical properties. J. Aquat. 2019, 28, 107–116. [Google Scholar] [CrossRef]
  33. Kim, Y.S.; Yongsawatdigul, J.; Park, J.W.; Thawornchinsombut, S. Characteristics off sarcoplasmic proteins and their interaction with myofibrillar proteins. J. Food Biochem. 2005, 29, 517–532. [Google Scholar] [CrossRef]
  34. Yoon, W.B.; Gunasekaran, S.; Park, J.W. Characterization of thermorheological behavior of Alaska pollock and Pacific whiting surimi. J. Food Sci. 2004, 69, 338–343. [Google Scholar]
  35. Yoon, W.B.; Park, J.W.; Kim, B.Y. Linear programming in blending various components in surimi seafood. J. Food Sci. 1997, 62, 561–564. [Google Scholar] [CrossRef]
Figure 1. Changes in moisture content of Alaska pollock surimi paste during heating in the dynamic rheometer system under flat-plate geometry.
Processes 08 00234 g001
Figure 2. Effective moisture diffusivities of Alaska pollock surimi paste at different temperatures.
Processes 08 00234 g002
Figure 3. Changes in moisture content of Alaska pollock surimi paste during temperature sweep in the dynamic rheometer system under cone-plate geometry. Symbols and lines represent experimental data and simulation results, respectively.
Processes 08 00234 g003
Figure 4. Elastic modulus of Alaska pollock surimi paste measured under different heating rates.
Processes 08 00234 g004
Figure 5. (a) Average temperature and (b) temperature distributions of Alaska pollock surimi during temperature sweep at different heating rates.
Processes 08 00234 g005
Figure 6. Moisture distribution of Alaska pollock surimi during temperature sweep at different heating rates.
Processes 08 00234 g006
Table 1. Thermal and physical properties of air, steel, and Alaska pollock surimi.
PropertyAirSteelAlaska Pollock Surimi
Density (ρ) (kg/m3)Ideal-gas model78501466.63 − 2.93T − 4.24M *
Thermal Conductivity (kT) (W/m·K)7·× 10−5T + 0.023844.50.34 + 4.57·× 10−5T2 + 3.67·× 10−5M2 − 2.46·× 10−5TM *
Specific Heat (Cp) (J/kg·K)6·× 10−7T2 − 4·× 10−5T + 14752166.09 + 8.71T + 13.93M *
Moisture diffusivity (10−10 m2/s) −6.30·× 10−1 + 2.96·× 10−3T2 − 3.18·× 10−2M
Viscosity (μ) (Pa·s)4·× 10−8T + 2·× 10−5
Thermal Expansion Coefficient (β) (1/K)0.003325
SourceSmolka et al. [28]COMSOL 5.3* from Park et al. [27]

