1. Introduction
Ethanol level analysis is the most frequently performed toxicological assay in forensic laboratories. Several papers describe the post mortem ethanol distribution in different biological fluids and tissues, e.g., vitreous humor [
1,
2,
3,
4], kidney [
5], liver [
6], muscle [
7], brain [
8], and hematoma [
9,
10,
11]. Unfortunately, blood and other soft tissues are easily lost due to post mortem degradation. Additionally, ethanol is a volatile organic compound and we may observe differences in its post mortem redistribution depending on the sampling site [
12]. Additionally, ethanol distributes with body water as a hydrophilic compound, which has been demonstrated to be substantially site-dependent [
13]. The search for alternative post mortem sampling materials is both extremely important and complex.
Cartilage is a specialized type of connective tissue formed by chondrocytes present in an amorphous matrix rich in collagen and elastic fibers [
14]. Costal cartilage connects the ribs to the sternum and allows for rib cage flexibility. Unlike other types of cartilages, which are only a few millimeters thick, the costal cartilage can reach up to approximately 1 cm in diameter [
15]. The extracellular matrix contains collagen type IIAI (COL2A1), aggrecan, decorin, and biglycan [
15].
In clinical procedures, the costal cartilage can be used for the autologous reconstruction of the ear [
16,
17] or in rhinotherapy [
18,
19]. In forensic science, the costal cartilage is used to predict age by using computed tomography [
20], measuring the racemization of aspartic acid [
21] or estimating the ossification rate [
22]. Recently, Siriboonpiputtana et al. have demonstrated its usefulness as an alternative source for DNA typing in personal identification, enabling faster and cost-effective DNA isolation compared to hard tissues [
23]. Nonetheless, the costal cartilage has not been included in forensic toxicology guidelines for ethanol level analysis [
24], even though the penetration of ethanol into cartilage occurs, as the authors suspect, through the perichondrium and intercostal veins. According to the author’s hypothesis, costal cartilage could be treated as a new alternative material for ethanol analysis. Considering the characteristics of both costal cartilage and ethanol, the main purpose of this study was to establish correlations between blood and costal cartilage ethanol concentrations.
2. Materials and Methods
The samples of the costal cartilage, femoral blood, and urine were collected during medico-legal autopsies approved by the Bioethical Commission of Medical University of Silesia in Katowice (decision no. KNW/0022/KB/206/18, date of approval: 30 October 2018). All measurements were carried out in a certified forensic laboratory (GTFCH, Proficiency test—EtOH 2/19).
The studied group consisted of costal cartilage samples taken from cadavers (n = 50) with ethanol detected in their blood and urine, while the control group consisted of costal cartilage samples taken from cadavers (n = 50) with negative results for ethanol presence in their body fluids. In this study, we used two different cut-off points for ethanol level analysis. According to the legal nomenclature, blood alcohol concentration greater than 0.2 mg/mL (or mg/g) is defined as the ‘after use’ condition, whereas blood alcohol concentration greater than 0.5 mg/mL (or mg/g) is defined as the state of insobriety. In light of the Polish law, the subjects in the ‘after use’ condition commit a contravention and the subjects in the state of insobriety commit a crime, which has different legal implications.
2.1. Sample Preparation
Femoral blood and urine samples (0.2 mL) were collected to a glass vial as described in forensic guidelines [
25].
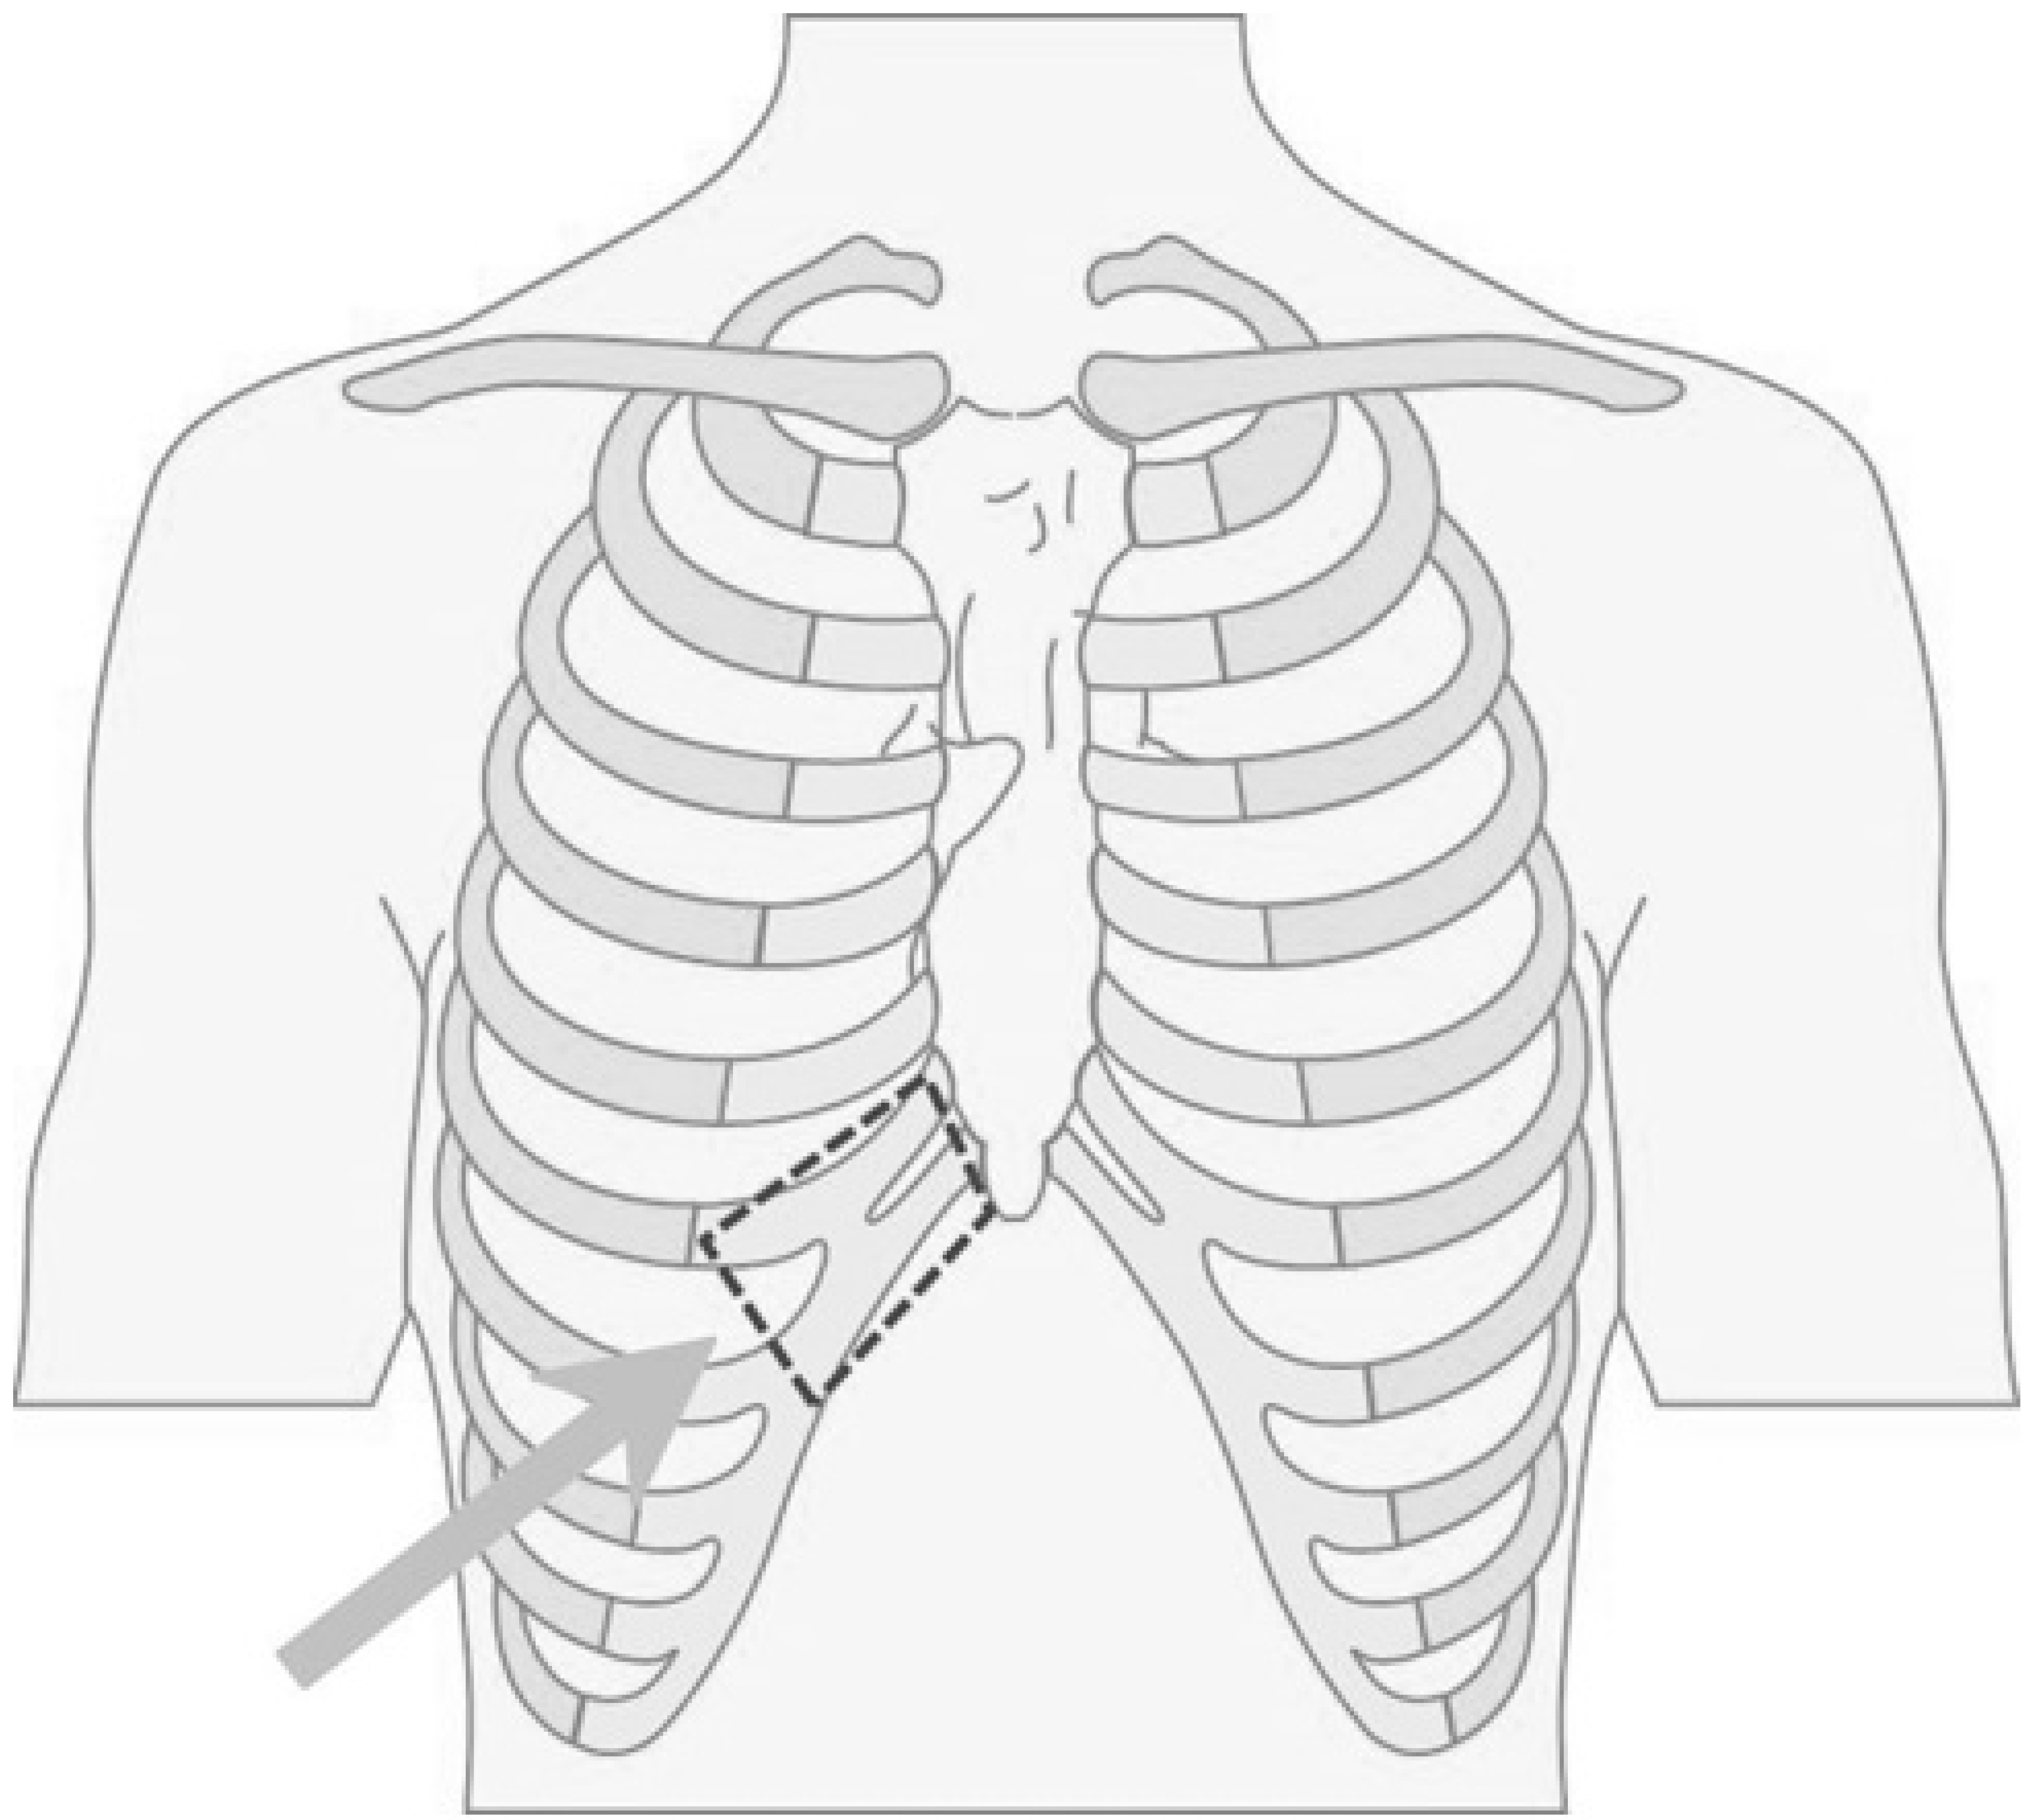
The costal cartilage fragment (dimensions 5 × 7 cm) was taken from the rib arch (
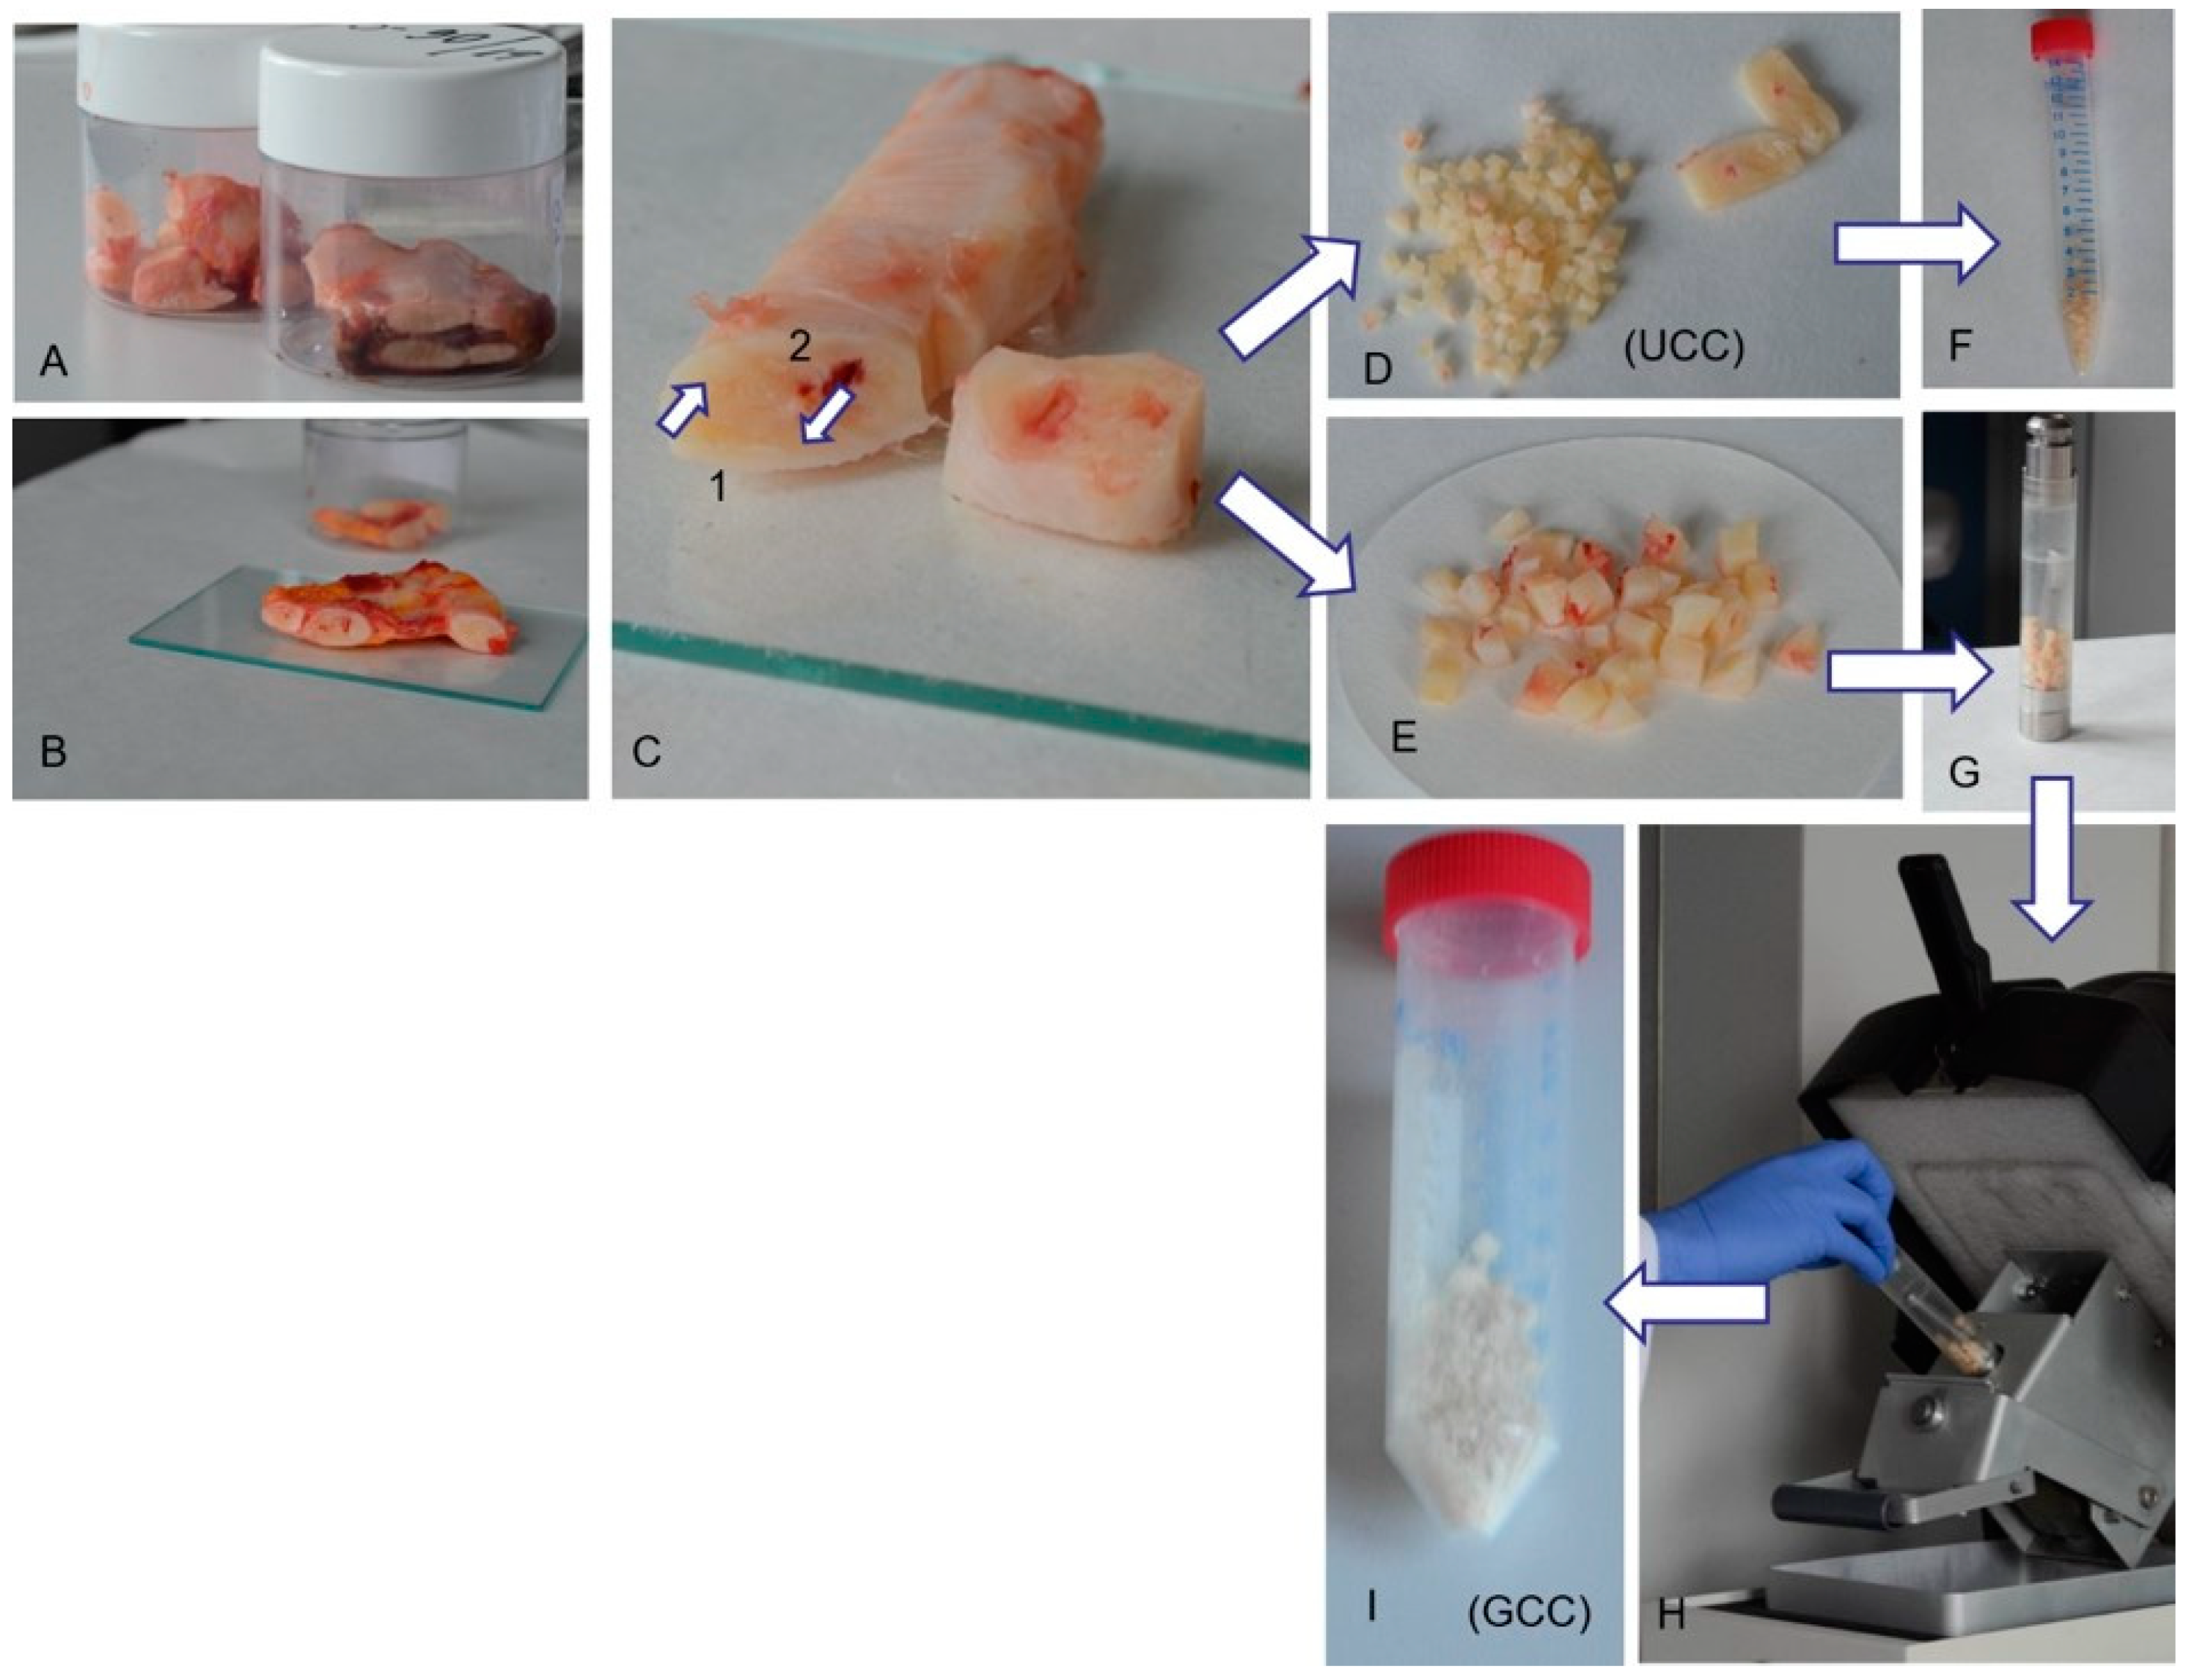
Figure 1). Each sample was divided into two subsamples that were stored at −20 °C and thawed overnight at 4 °C before further processing and analyses. Thawed cartilage was cleared from muscle tissue with sterile scalpels that were changed 3 times to avoid contamination. For each cadaver we prepared two costal cartilage samples differing in the degree of fragmentation: (1) unground costal cartilage (UCC), and (2) ground costal cartilage (GCC). UCC was obtained by manual scalpel fragmentation. GCC was ground in a cryogenic mill (6770 freezer/mill, SPEX
® SamplePrep, Stanmore, UK) in the presence of liquid nitrogen with 3 min precooling and 1 cycle of 2 min grinding at 12 CPS (cycles per second). In each case 0.2 g of costal cartilage was analyzed. The costal cartilage sample preparation protocol is shown in
Figure 2.
2.2. Ethanol Level Analysis with Gas Chromatography with a Flame Ionization Detector (GC-FID)
Ethanol level analysis was performed using procedures developed by Grellner and Iffland [
26] and modified accordingly.
The prepared samples (0.2 mL of blood or urine, 0.2 g of UCC or GCC) were mixed with 0.2 mL of the internal standard and analyzed.
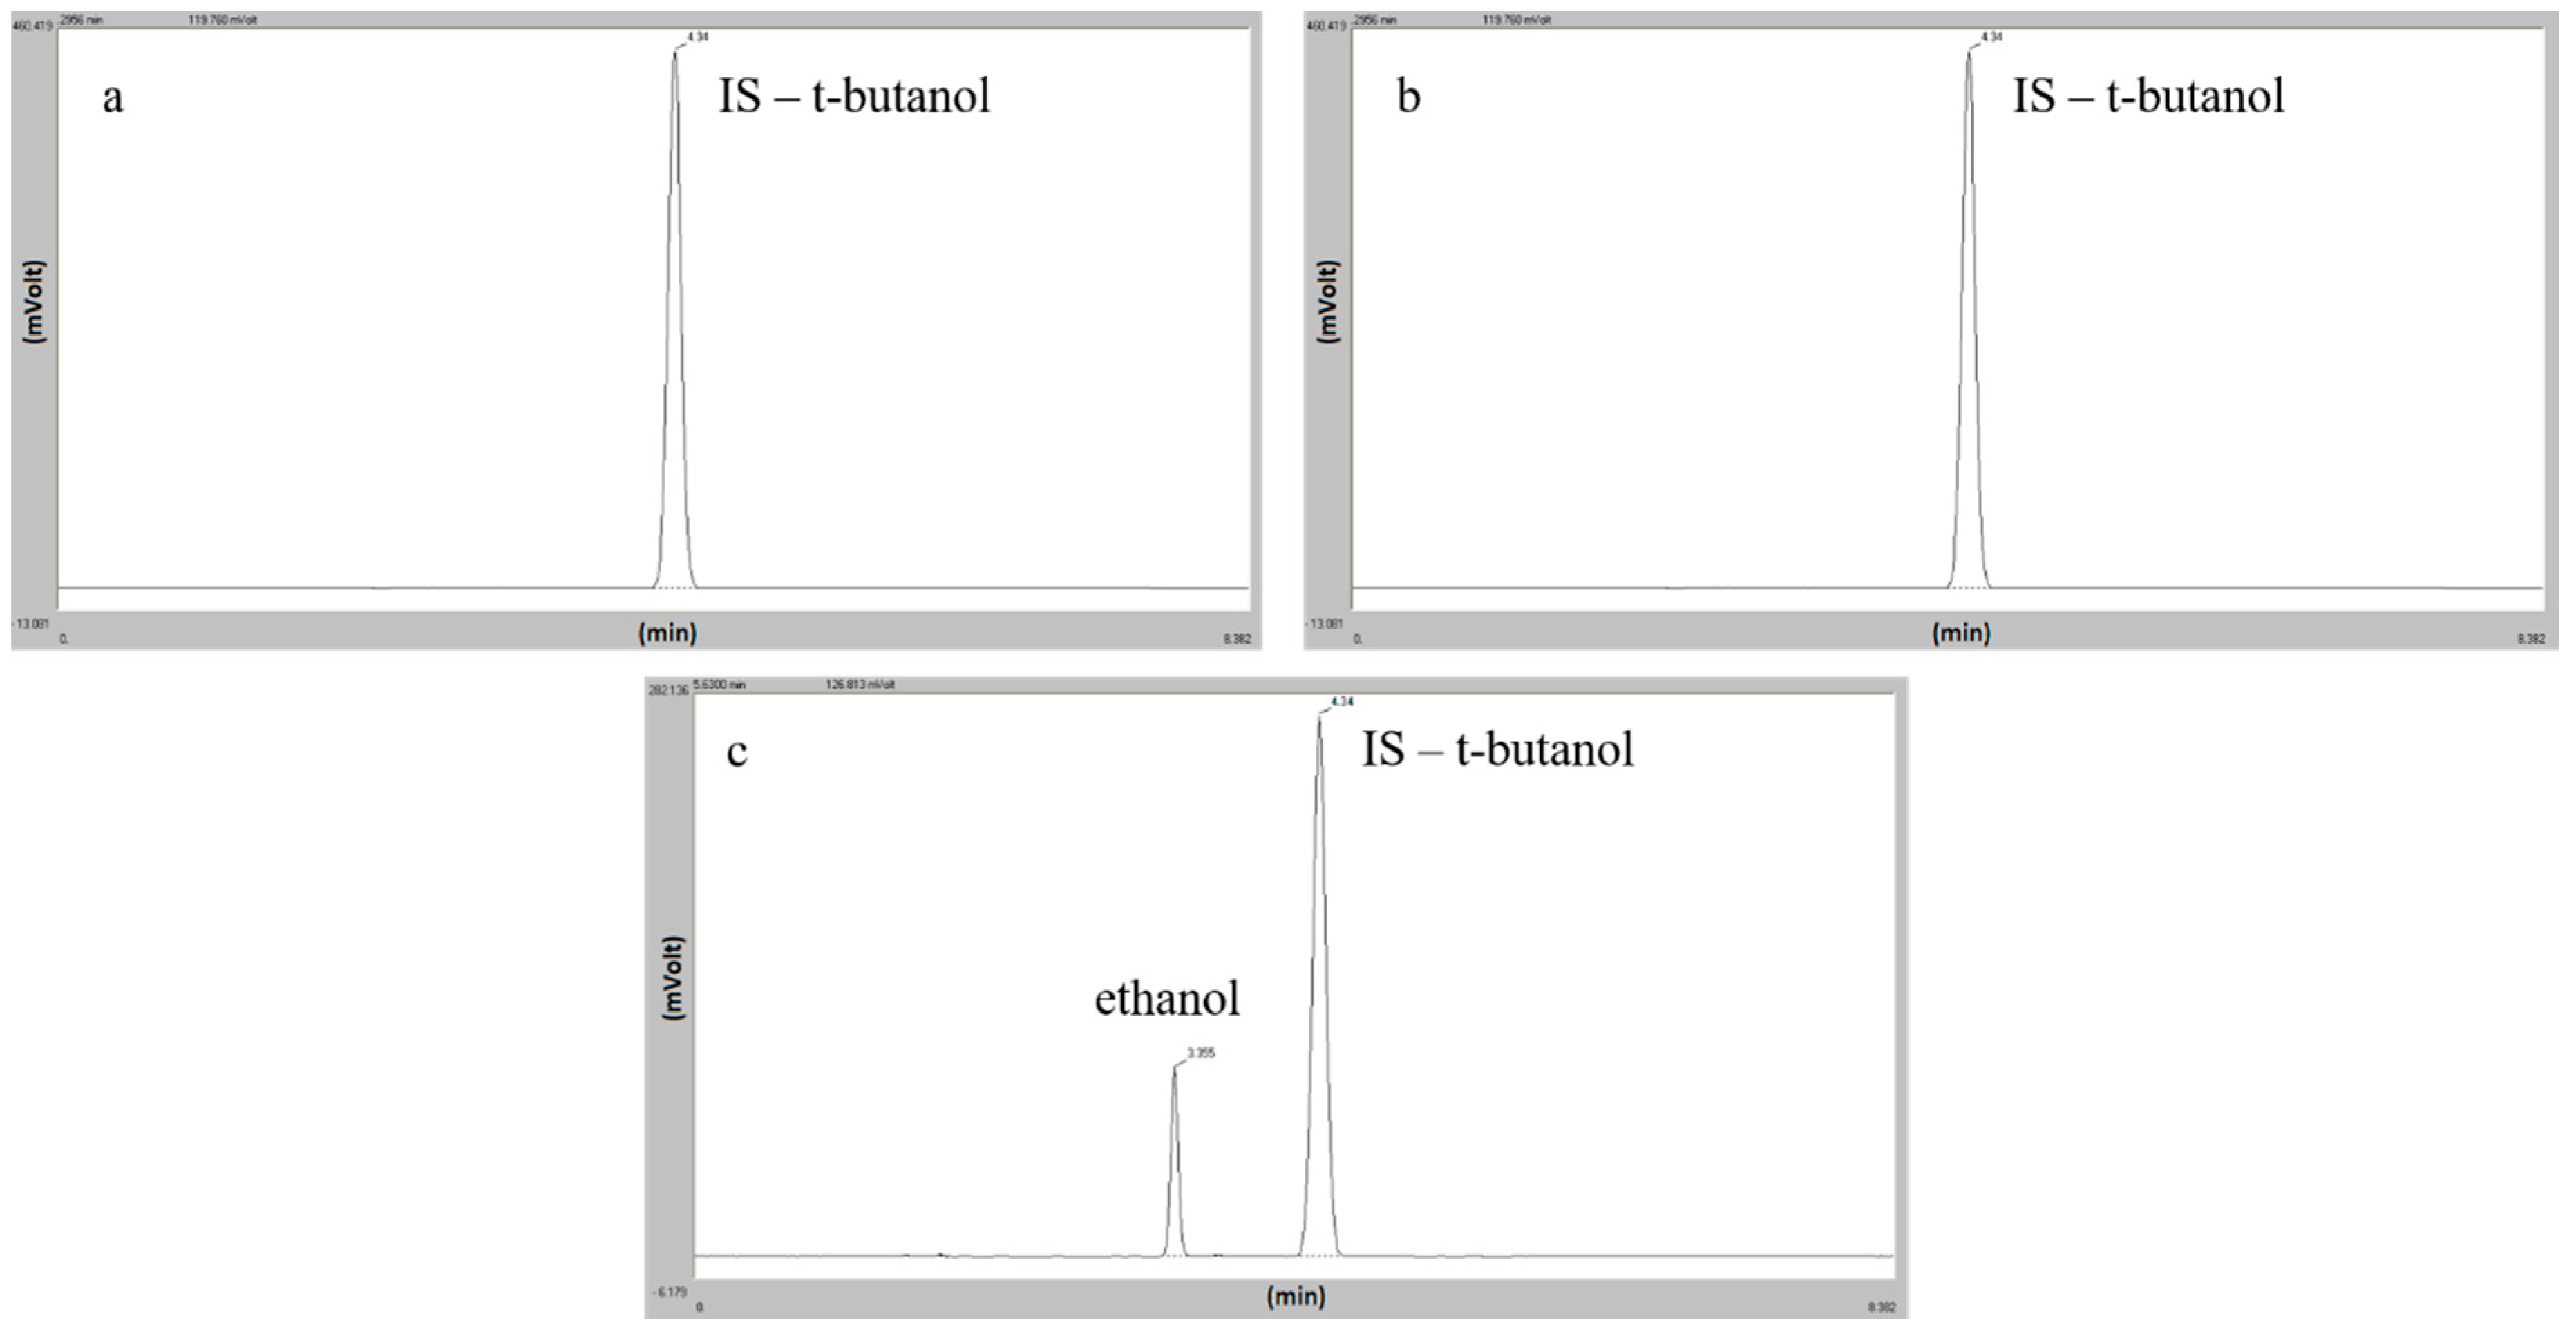
The headspace analysis was performed on a Focus GC gas chromatograph equipped with a Triplus autosampler, FID detector (Thermo Fisher Scientific Inc., Milan, Italy) and Rtx
®–BAC2 column (30 m × 0.53 mm ID × 2.0 μm) (Restek Corp., Bellefonte, PA, USA). The oven temperature program was 45 °C (5 min), 45–80 °C (10 °C/min), 80 °C (1 min). Injector and detector temperatures were 200 °C and 250 °C, respectively. The carrier gas was helium (5.0 mL/min) and t-butyl alcohol was used as an internal standard. An eight-point calibration curve for ethanol in mg/mL or mg/g (0; 0.1; 0.2; 0.5; 0.8; 1; 2; 3) was linear in the whole range. The limit of detection (LOD) was determined as 0.05 mg/mL or mg/g and limit of quantification (LOQ) as 0.1 mg/mL or mg/g for the entire tested material. Chromatograms for blank GCC and UCC samples and a real positive costal cartilage sample are presented in
Figure 3.
2.3. Data Processing
In our research, the diagnostic accuracy relates to the test’s ability to discriminate between sober and intoxicated subjects. This discriminative potential can be quantified by the measures of diagnostic accuracy such as sensitivity and specificity, predictive values, and the area under the ROC (Receiver Operating Characteristics) curve. The cut-off points allowing the creation of decision-making methods to distinguish between after use condition and insobriety state (blood alcohol concentration less than 0.2, and less than 0.5 mg/mL or mg/g, respectively) were set using the Youden Index. Additionally, to assess and compare both classification models of sobriety with the use of costal cartilage (UCC and GCC), the area under the ROC curve charts were calculated and marked as AUC (area under curve).
2.4. Statistical Analysis
Distribution of variables was evaluated by the Shapiro–Wilk test and quantile-quantile plot. The interval data were expressed as a mean value ± standard deviation in the case of a normal distribution or as a median (lower—upper quartiles) Me (Q1; Q3) in the case of data with skewed or non-normal distribution. The Mann–Whitney U test was used for data comparison, and regression analysis was used to determine the relationship between quantitative features. In the linear regression model, the existence of outliers data was verified with Cook’s distances based on the residuals. Statistical significance was set at a p-value below 0.05 and all tests were two-tailed. Statistical analysis was performed using Statistica (data analysis software system) version 13.3 (TIBCO Software Inc., Palo Alto, CA, USA, 2017).
3. Results
The median time of the autopsy was 3.0 (1.0; 5.0) days. The average age of the subject at the time of death was 47.1 ± 19.3 years, the body weight was 78.6 ± 23.5 kg, height was 174.8 ± 8.3 cm, and body mass index (BMI) was 24.6 ± 6.2 kg/m
2. In the study group, 83% of the subjects were men, which reflects the typical proportion of sex in medico-legal autopsies [
27]. The basic characteristics of quantitative variables are presented in
Supplementary Table S1.
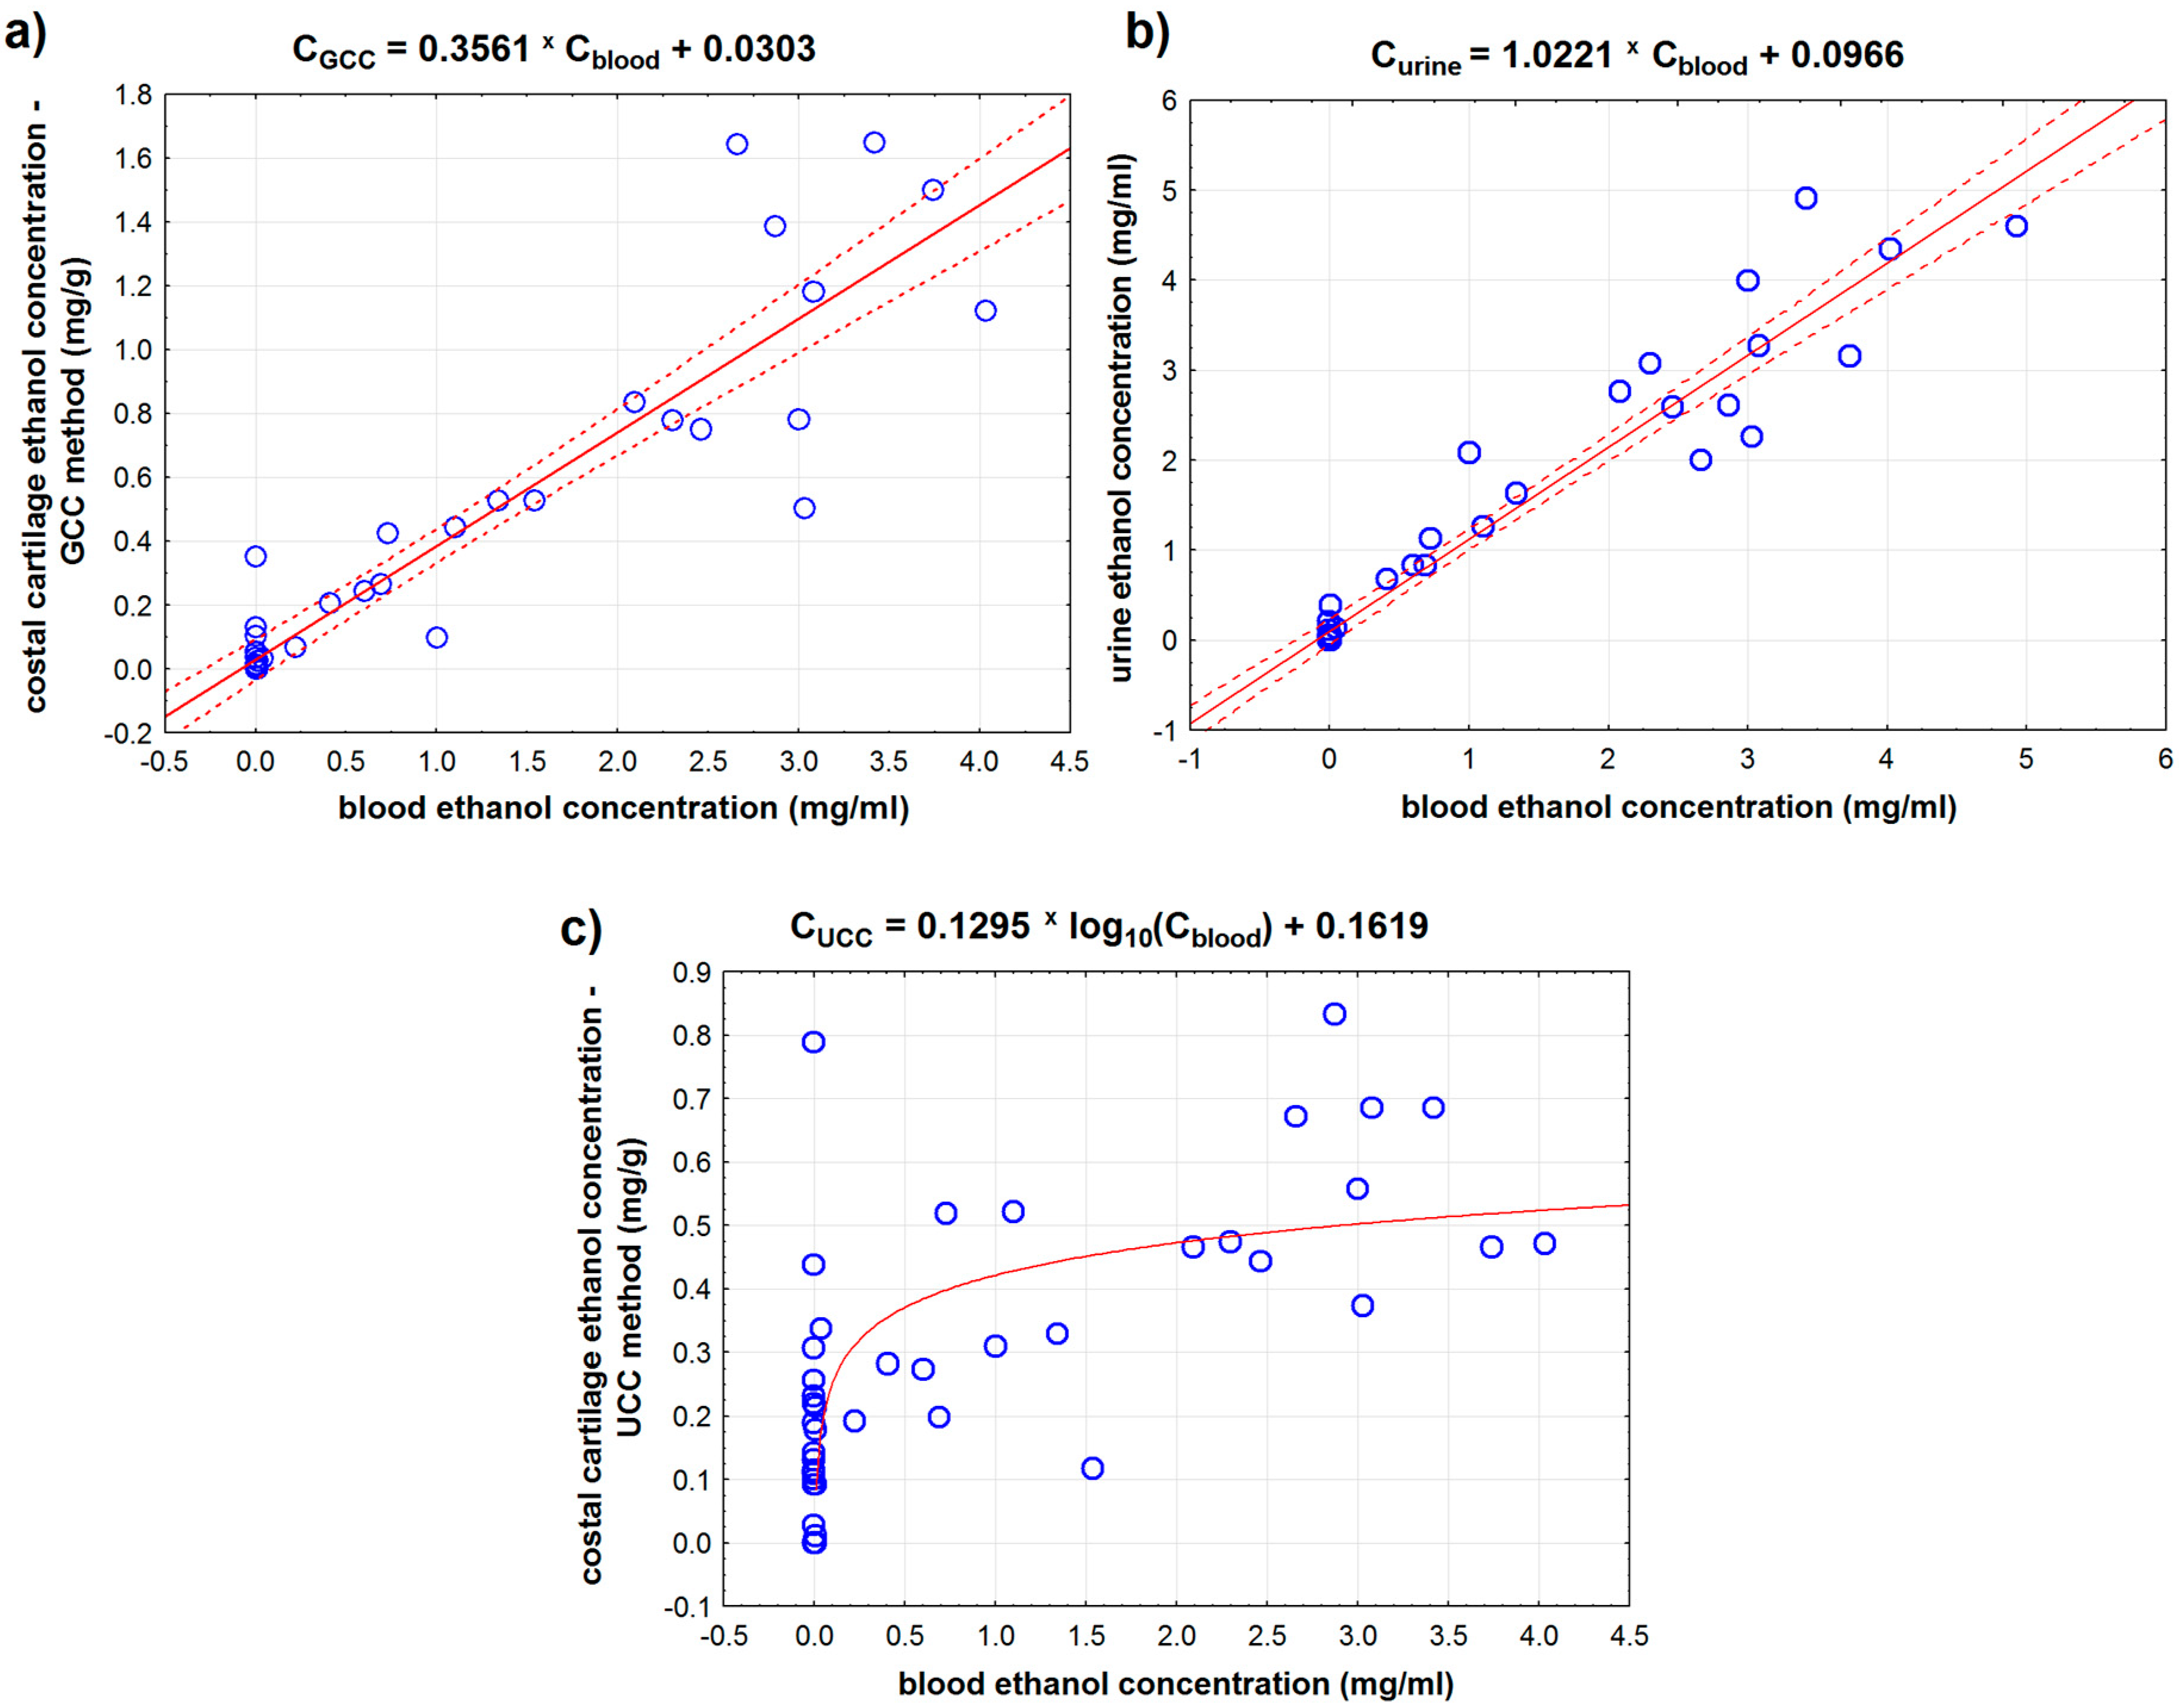
We compared the results for ethanol concentration in blood and urine with the results of ethanol concentration measured for the costal cartilage prepared using our methods. There was a strong positive correlation between the amount of ethanol in blood and in urine (r = 0.964,
p < 0.001) and between the ethanol concentration in blood and in GCC (ground costal cartilage) (r = 0.925,
p < 0.001) (
Table 1 and
Figure 4). 1 mg/mL increase in blood alcohol content corresponds to a 1.022 mg/mL increase in urinary alcohol concentration and to a 0.356 mg/g increase in GCC alcohol content. Linear regression methods explain up to 92.9% of the change in the ethanol concentration in urine and 85.6% of the ethanol concentration in GCC.
In the case of UCC (unground costal cartilage), the existence of a linear correlation could not be demonstrated due to a significant number of results indicating minimal alcohol content in cartilage (blood alcohol concentration: 0.0 mg/mL). In this case, we observed the logarithmic relationship between the ethanol concentration in blood and UCC (
p < 0.001) (
Figure 4c).
Additionally, we analyzed the relationship between ethanol concentration in samples of all tested materials and time elapsed between the cadaver’s death and remains discovery (post mortem interval, PMI). We found the average negative correlations between PMI and ethanol concentration in blood (Spearman’s rank correlation coefficient ρ = −0.454, p < 0.001) and in urine (ρ = −0.480, p < 0.001). We found that a long time from death is related to low ethanol concentration in GCC samples (average, negative correlation, ρ = −0.445, p < 0.01). However, we did not find any relationship between PMI and ethanol concentration in UCC samples (p = 0.159).
To compare methods of cartilage preparation for ethanol analysis, we focused on the two cut-off points, distinguishing between the ‘after use’ condition and the insobriety state. Based on the abovementioned legal regulations in Poland, two limits in the classification of sober people were adopted: variant 1 with blood ethanol concentration less than 0.2 mg/mL (Cblood < 0.2) and variant 2 with blood ethanol concentration less than 0.5 mg/mL (Cblood < 0.5), respectively. Blood concentration assays were adopted as the ‘gold standard.’
Based on the constructed ROC (receiver operating characteristics) curves, the optimal cut-off point for the first variant (C
blood < 0.2) for the UCC method was 0.273 mg/g and 0.069 mg/g for the GCC method. In the second variant (C
blood < 0.5), the optimal cut-off points were: 0.311 mg/g for UCC and 0.246 mg/g for GCC. The relationship between the sensitivity and specificity of both cartilage preparation methods for both variants of the cartilage blood alcohol concentration is shown in
Figure 5.
All determined areas under the ROC curve were significantly greater than 0.5 (
p < 0.001) (
Table 2). Analyzing the area under the ROC curve, it was shown that the GCC method has a larger area under the ROC curve (in both variants: C
blood < 0.2 and C
blood < 0.5); therefore, the sobriety determination model based on the GCC method is better than the one based on the UCC method.
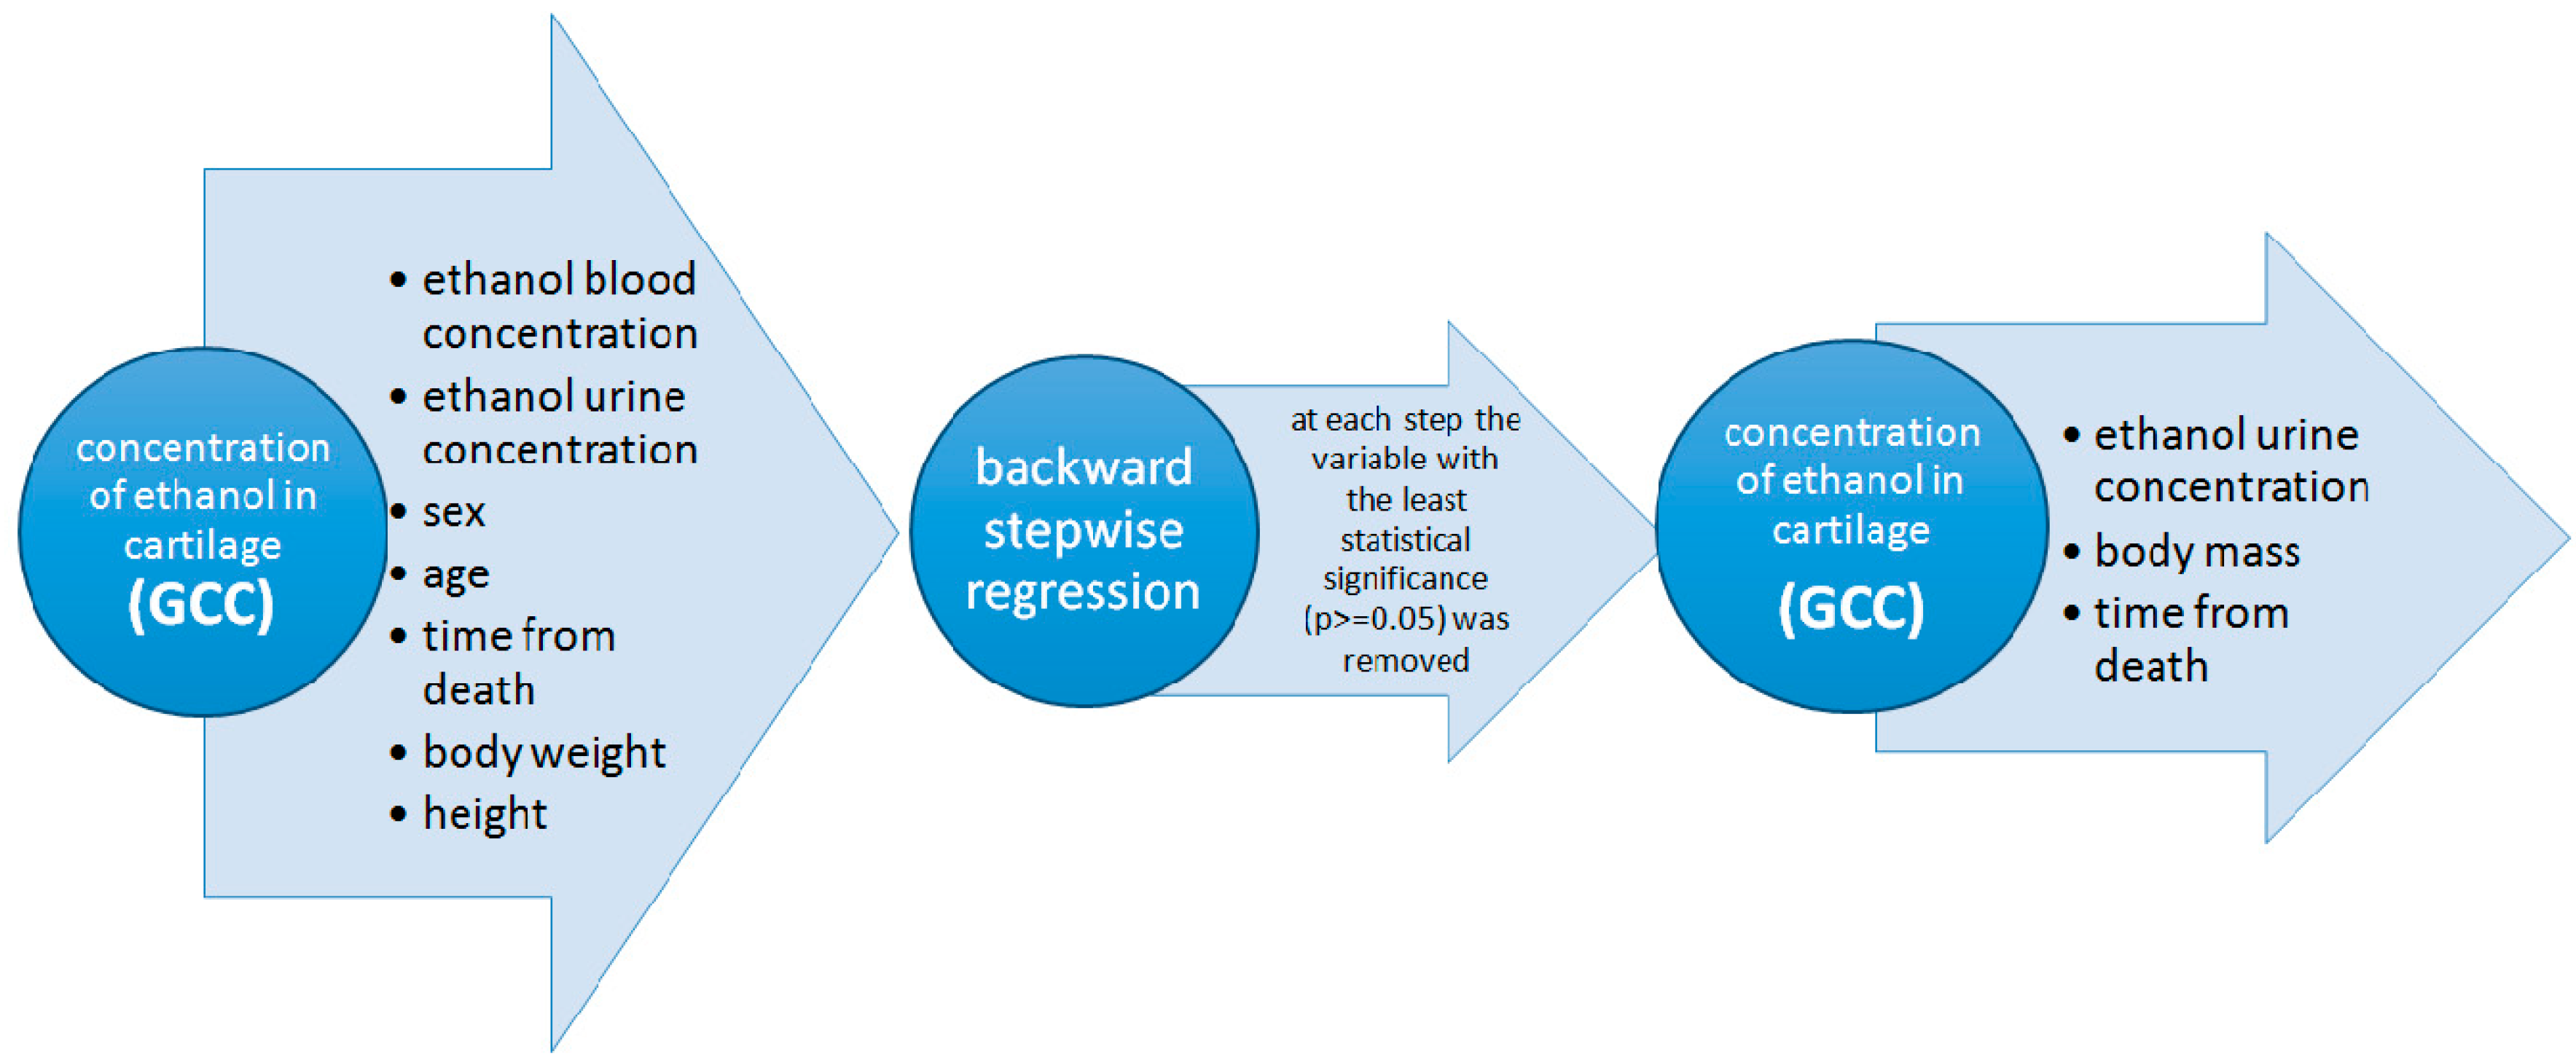
Since the regression analysis is limited only for continuous variables, we performed backward stepwise linear regression to take into account the effect of all analyzed quantitative and nominal variables. In the first stage, we considered all potential variables that might have had an impact on the ethanol concentration in cartilage measured by the GCC method. The following variables were selected for the first stage: blood ethanol concentration, urine ethanol concentration, sex, age, time from death, height, and body weight. In the next steps, we removed from the model, one by one, the variables that were the least affected by the dependent variable. In the end, we obtained the model, in which only variables that have had a statistically significant influence on the dependent variable were left. The diagram of the stepwise backward regression model is shown in
Figure 6.
A high positive correlation was obtained for GCC ethanol concentration and urine ethanol concentration and body mass and a very weak negative correlation for PMI (r = 0.6476,
p < 0.001). The concentration of ethanol in the urine and body mass was found to have the greatest influence on the concentration of alcohol in the cartilage (
Table 3). This regression model explains as much as 42% of the variability of cartilage ethanol concentration measured with the GCC method.
Additionally, we determined the partitioning ratios: blood ethanol concentration/ethanol concentration in a given analytical method for all discussed methods of ethanol concentration determination. The following results were obtained (Me (Q1; Q3)):
blood/urine: 1.22 (0.97; 1.5), n = 24;
blood/UCC: 0.27 (0.19; 0.71), n = 26;
blood/GCC: 0.40 (0.31; 0.50), n = 26.
4. Discussion
Costal cartilage is a neglected and underestimated material in forensic science and has not been elucidated in forensic medical guidelines. Recently, Siriboonpiputtana et al. have demonstrated its usefulness as an alternative source for DNA typing in personal identification and shown that using costal cartilage enables faster and cost-effective DNA isolation than using hard tissues [
23]. Our statistical analysis indicates a strong positive correlation between alcohol levels in UCC (unground costal cartilage) and GCC (ground costal cartilage) (r = 0.744,
p < 0.001). Based on the constructed ROC (curves, the optimal cut-off point that indicates sobriety (alcohol content in the cartilage; C
blood < 0.2) was 0.273 mg/g for the UCC method and 0.069 mg/g for the GCC method. In all cases we interpreted AUC (area under curve) value as excellent diagnostic accuracy (AUC
UCC = 0.903; AUC
GCC = 0.984). In the present study, we revealed a new biological source for ethanol detection, but we would like to stress out that the difference in UCC and GCC sample preparation may influence ethanol detection with the gas chromatography technique. Since UCC and GCC samples differ in the degree of fragmentation, the availability of the analyzed substances present in the cartilage matrix might be different for them. That may influence ethanol detection, especially in samples with low ethanol concentration. A significant number of results indicating minimal alcohol content in UCC samples seems to support this suggestion.
The average blood/GCC ethanol concentration ratio was 0.40 (0.31; 0.50) and the Pearson correlation coefficient was 0.925 which does not differ from the norm obtained for other alternative materials. Other studies have established that the muscle/blood alcohol ratio was on average 0.94–1.48 [
7], 0.47–0.85 for liver/blood [
6], 0.80–1.50 for brain/blood [
28], and 0.71–3.71 for blood/vitreous humor [
29]. Ethanol distribution ratios for blood/GCC obtained in this study demonstrate wide variation. One of the reasons for such wide results variation may be the costal cartilage macroscopic structure and its preparation method. As visible in
Figure 2 in
Section 2, when looking at costal cartilage it is possible to identify areas with and without macroscopic blood vessels. During cartilage preparation for gas chromatography analyses, we fragmented it roughly into small cubes and then either immediately submitted it to analyses (UCC samples) or grounded it in a cryogenic mill (GCC samples) and then submitted it to chromatography analyses. In either case, we pooled the small cubes without distinguishing between the areas with or without macroscopic blood vessels and the entire fragmented material was qualified for testing. The varying ratio of macroscopic blood vessels, most probably still containing some residual blood, in samples and the grinding process might be responsible for wide results variation for GCC. On the other hand, it couldn’t have been done differently, as a method of costal cartilage micro-cutting has not been developed yet. We suggest that forensic studies investigating ethanol concentration and using costal cartilage as source material should take into account possible sample contamination with blood residues from macroscopic blood vessels present in the cartilage or develop a sample preparation protocol that eliminates such contamination.
Backward stepwise linear regression for ethanol concentration in GCC showed that ethanol concentration in urine correlated with ethanol concentration in GCC samples. Using this analysis, we tried to find any relevant relationships between the results for ground costal cartilage, considered here as candidate forensic material, and standard forensic materials to check if costal cartilage analyses are equally representative. This way, we aimed to assess if costal cartilage might be considered as an alternative forensic material in ethanol analysis because so far it is not and the standard forensic materials, like blood and urine, are not always available for post mortem analyses due to post mortem degradation. We think that it is crucial to consider costal cartilage as an alternative forensic material and analyze it. Costal cartilage structure makes it resistant to many environmental conditions and, almost always, it is possible to sample it from cadavers, even those with long time-elapsed from death (post mortem interval) or at advanced stages of decomposition.
Costal cartilage as an alternative material has its limitations in the case of fresh corpses, such as time-consuming material preparation and cryogenic mill equipment. However, we think that costal cartilage prepared with the methods described in this paper could help to determine the ethanol concentration in cases of dismembered corpses.

 ,
, 


