Article

Experimental Study and Mathematical Modeling of Convective Thin-Layer Drying of Apple Slices

by
Mohammad Jafar Royen
1,2,
Abdul Wasim Noori
1,2 and
Juma Haydary
1,*
1
Department of Chemical and Biochemical Engineering, Slovak University of Technology in Bratislava, 812 37 Bratislava, Slovakia
2
Faculty of Chemical Technology, Kabul Polytechnic University, Kart-e Mamoorin, Kabul 1001, Afghanistan
*
Author to whom correspondence should be addressed.
Processes 2020, 8(12), 1562; https://doi.org/10.3390/pr8121562
Submission received: 1 October 2020 / Revised: 16 November 2020 / Accepted: 24 November 2020 / Published: 27 November 2020
(This article belongs to the Special Issue Drying Kinetics and Quality Control in Food Processing)

Abstract

:
This work represents an experimental study and mathematical modeling of convective apple slice drying. The influence of multiple process parameters such as temperature, air humidity, air velocity and slice thickness on process kinetics, product water activity and parameters of empirical models has been investigated. Drying characteristics of apple slices were monitored at temperatures of 40, 45 and 50 °C, air velocities of 0.6, 0.85 and 1.1 m/s., slice thicknesses of 4, 6, 8, 10 and 12 mm, and in relative air humidity ranges of 25–28, 35–38 and 40–45%. During the process, samples were dried from an initial moisture content of 86.7% to that of 20% (w.b), corresponding to product water activity of 0.45 ± 0.05. By increasing the temperature from 40 to 50 °C, the time for reaching the required product water activity decreased by about 300 min. Sample thickness is the most significant parameter; by increasing the slice thickness from 4 to 12 mm, the time required to achieve the required water activity increased by more than 500 min. For all experimental runs, parameters of five different thin-layer empirical models were estimated. A thin-layer model sensible to process conditions such as temperature, air velocity, layer thickness and air relative humidity was developed and statistically analyzed.

1. Introduction

Agricultural products such as fruits and vegetables are considered perishable foods because of their high moisture content [1]. Preservation for off seasonal time and prevention from microbial spoilage and enzymatic reactions can be accomplished by removing free water from the foods [2]. Drying is a well-known method of free water removal and preservation, extending shelf-life, and decreasing transportation weight and space requirements for storage [3,4,5,6]. Drying is, however, an energy-intensive process. Convective drying usually requires hot air circulation; however, high temperature and long times required in hot air-drying adversely affect the texture, flavor, and color of products [7,8]. Many parameters affect the drying process; temperature, air relative humidity, air velocity, and particle sizes of dried material can significantly influence the required drying time, cost as well as product quality.
Apples (Malus domestica) are a widely cultivated fruit consumed either fresh or as juices, jam or dried products. They are a good source of dietary fibers, pectin, potassium, vitamin C and vitamin A and phenolic compounds [9]. Dried apples can be used in snack food, as a weak seasoning and as a complimentary ingredient of special diets [10].
Drying of apples was the subject of study in a number of researches in recent years [11,12]. Several works deal with effect of process parameters on the drying rate and quality of the product. Lewicki and Jakubczyk [13] dried apple slices with irradiation at temperatures of 50, 60, 70 and 80 °C; the effect of hot air temperature on the rate of drying at 80 °C is twice that observed at 50 °C. Togrul [14] studied infrared drying of fresh apples by simple modeling in the temperature range of 50–80 °C; drying time decreased by 80 min when the temperature was increased from 50 to 80 °C; also the drying rate was almost doubled. Wang and Chao [15] dried apple slices by irradiation at three temperatures: 50, 60 and 75 °C; at the same dehydration time, the higher the air temperature for constant irradiation, the more water was lost. Fresh apples were conventionally dried by Velic et al. [16] at air velocities of 0.64, 1.00, 1.50, 2.00, 2.50 and 2.75 m/s and a drying temperature of 60 °C using rectangular-shaped (20 × 20 × 5 mm) apple slices; they reached a moisture content of 20% (wet base), then the dried samples were rehydrated with about 72% of the water that was removed by the drying process. Vega-Galvez et al. [17] studied the effect of temperature and air velocity on the drying kinetics and product quality; apples were dried at different temperatures and air velocity (40, 60 and 80 °C; 0.5, 1.0 and 1.5 m/s). The highest drying rate constant of 15.30 × 10⁻⁹ m2/s was obtained at maximum experimental temperature and air velocity (80 °C and 1.5 m/s), while the lowest drying rate constant of 3.22 × 10⁻⁹ m2/s was obtained at 40 °C and 0.5 m/s. Color attributes of apples change during their hot air drying, which was confirmed by Nadian et al. [18] when drying apple slices of 4 mm thickness at 60 °C and at a rate of 1.5 m/s.
Several empirical mathematical models were employed in many literature sources for modeling fruit drying. However, empirical-based models such as those of Lewis (Newton) [19], the Page model [20], the modified Page model [21], that of Henderson and Pabis [22], the logarithmic model, and the two-term model [23], are the most frequently used to model drying of different agricultural products.
Drying is an energy extensive process. The use of renewable energy sources, particularly solar energy, can significantly affect the economy of the process and reduce the carbon footprint. However, traditional open sun drying leads to the deterioration of quality parameters and contamination of the product. An alternative to open sun drying is active indirect cabinet solar drying [5,24]. Drying performance of a solar drying system is highly dependent on the climate conditions of the given geographical location. Geographical locations with dry climate and high altitude such as Afghanistan, where this research was done, provide ideal conditions for solar drying application.
Although convective drying of fruit including apple slices has been studied by numerous researches, a complete investigation of the influence of multiple process parameters, such as temperature, air humidity, air flow velocity and slice thickness, on process kinetics, parameters of empirical models, and particularly product water activity has not been published to our knowledge. In addition, available experimental data were typically obtained at conditions different than those typical for geographical locations with dry climate and high altitude.
This work aims to investigate convective thin-layer drying of apple slices at temperatures ranging from 40 to 50 °C, ambient air relative humidity from 25% to 45%, air velocity from 0.6 to 1.1 m/s, slice thickness from 4 to 12 mm at an average ambient pressure of 82 kPa, typical of geographical locations with an altitude of 1800 to 2000 m above sea level. The selected air velocities and temperatures correspond with values achievable in forced convective solar drying units [5], since the results are aimed to be used in the design of convective solar drying units. The effect of process parameters on the effective diffusion coefficient and kinetic parameters of different empirical models was observed in this work. Optimal drying time under each set of conditions was estimated by observing the change in water activity of the dried product during the process.

2. Materials and Methods

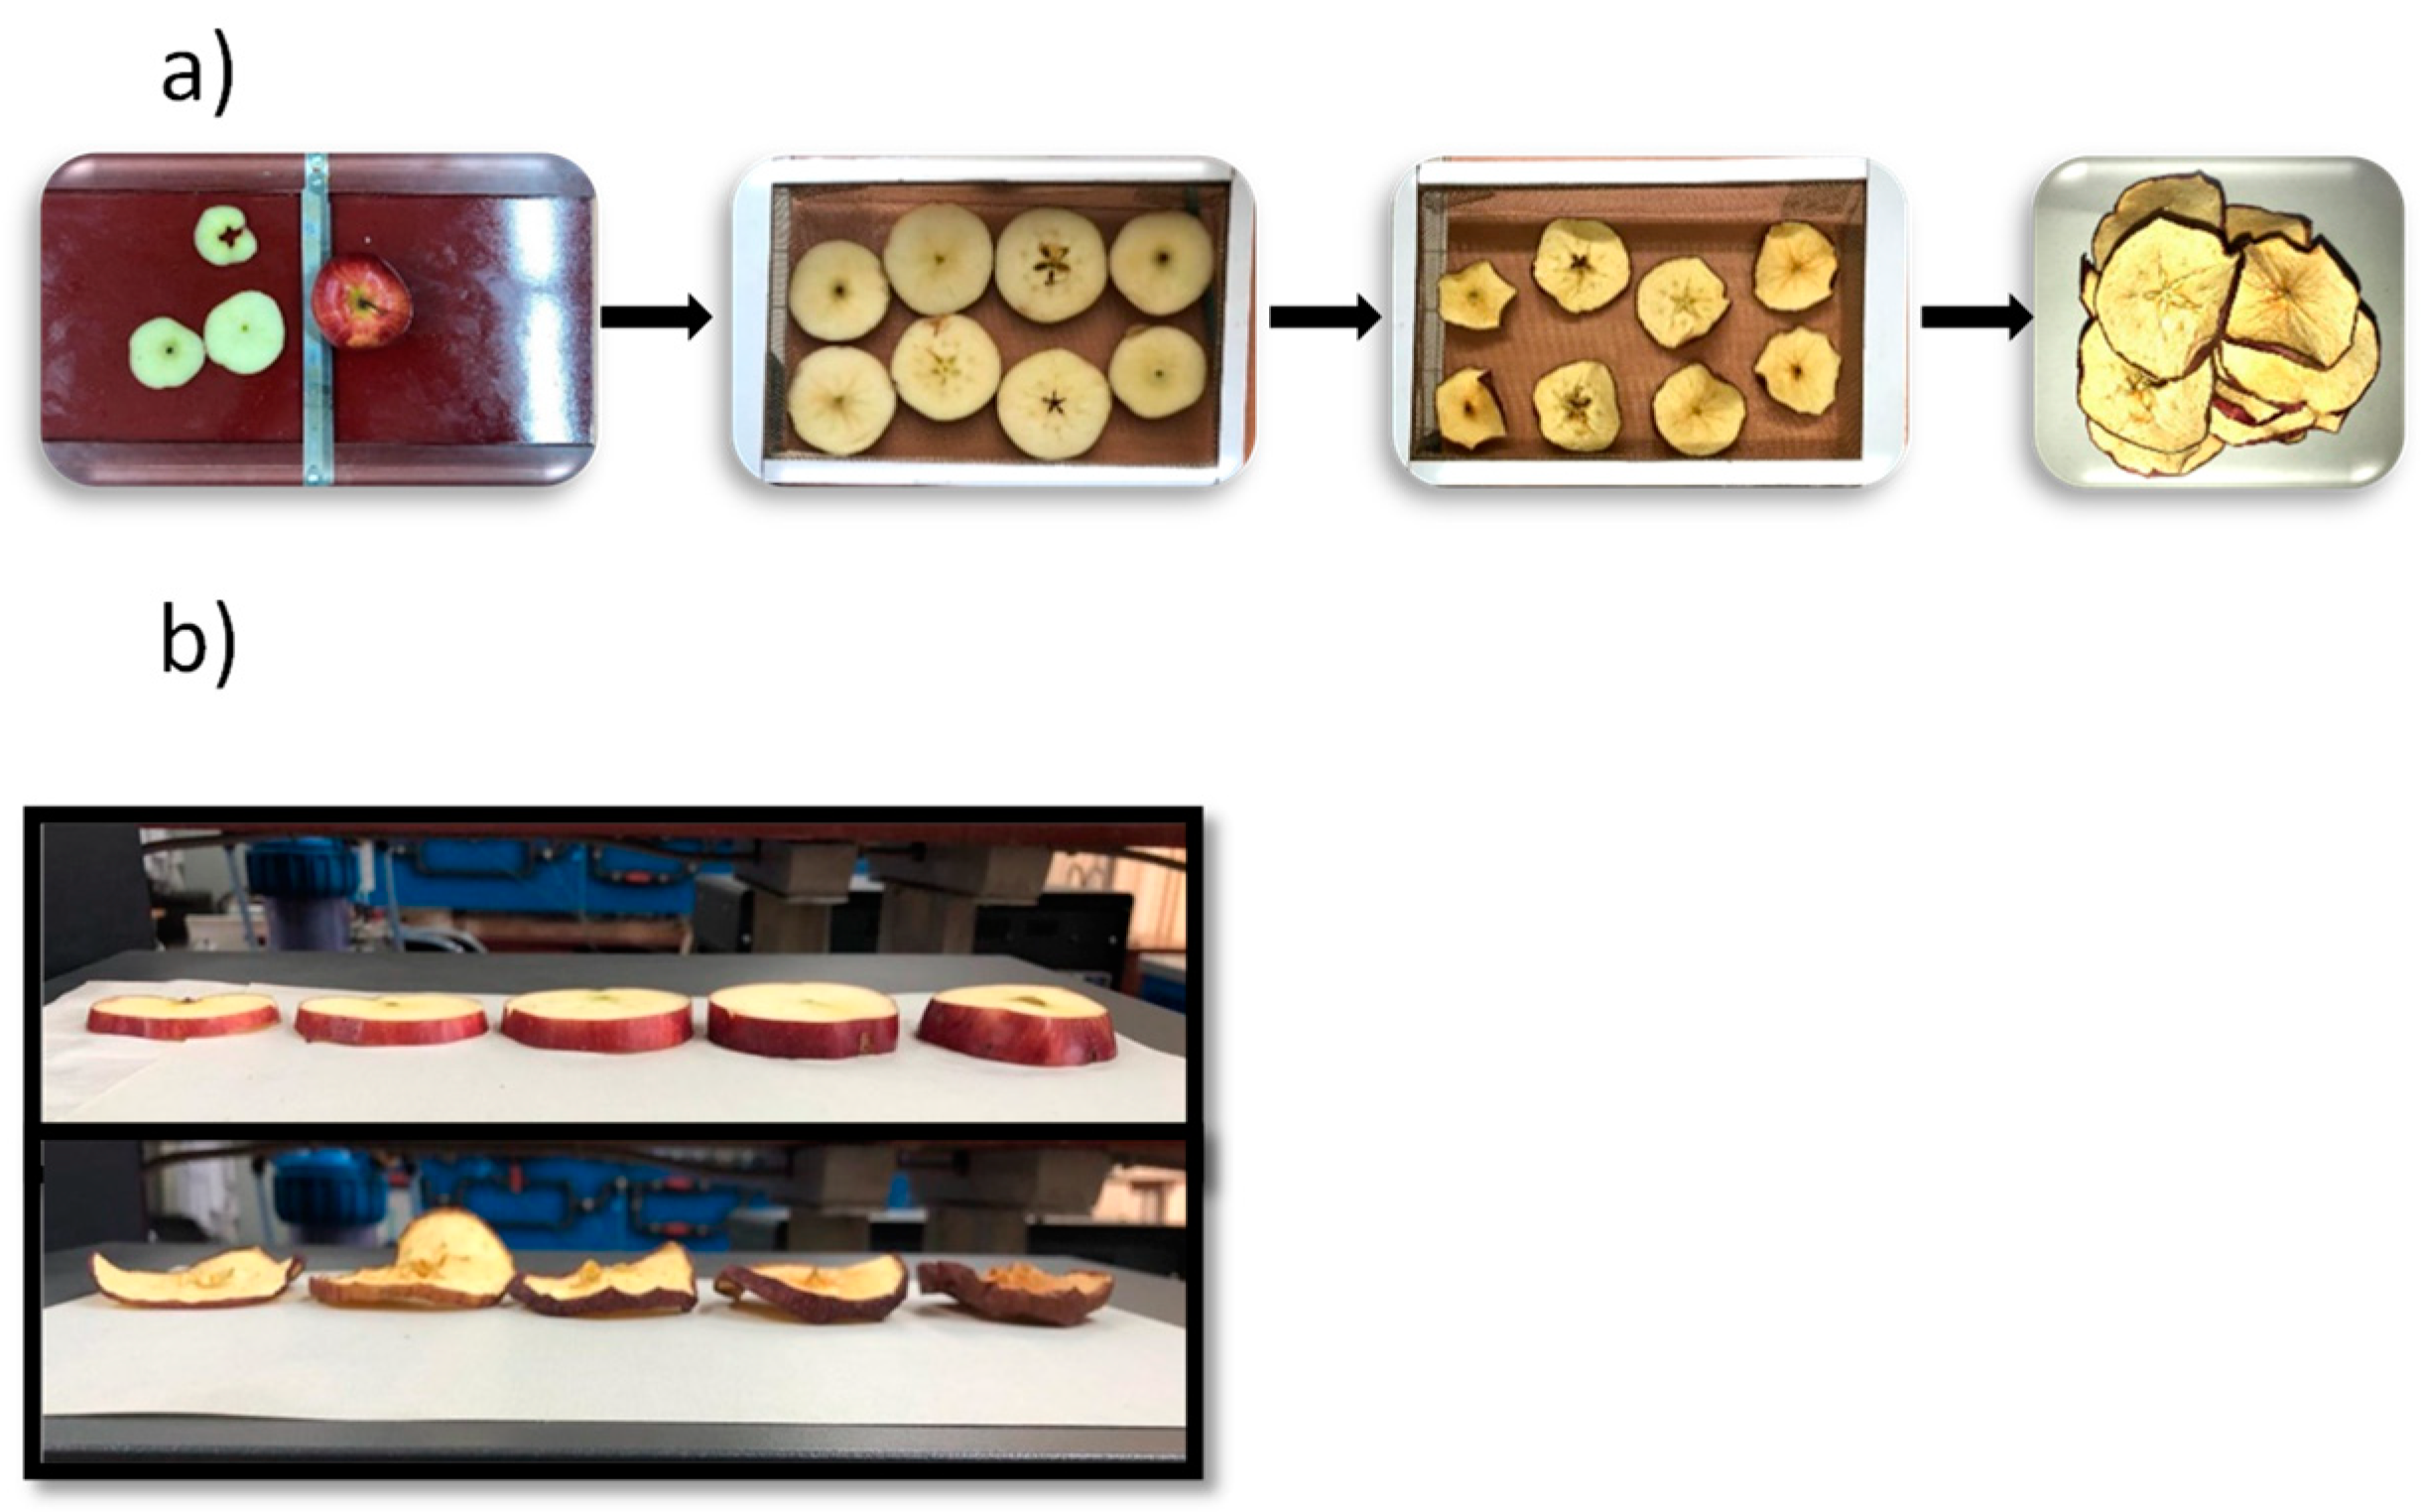
2.1. Sample Preparation

Red apples (Malus domestica) used in the study originated from the Maidan-Wardak province of Afghanistan and were obtained from a local supermarket in Kabul; they were then stored at +4 °C. Fresh red apples with diameters ranging from 60 to 80 mm were selected, washed with distilled water and cut horizontally along their axis (each piece was parallel to the main axis of the apple) with a manual cuter into cylindrical 6 ± 0.1 mm thick slices (Figure 1a); to analyze the effect of slice thickness, apples were cut into 4, 8, 10 and 12 ± 0.1 mm thick slices (Figure 1b).
Each batch comprised 300 ± 2 g of apples. The average initial moisture content of the apples was 86.7% (wet basis) which was determined in a laboratory moisture analyzer (VWR MBT160 moisture analyzer, number 611-2318, VWR International, Italy) equipped with an analytical moisture balance (capacity of 0.001–160 g), a heater power supply and stainless pan protection with a ventilation stopper.

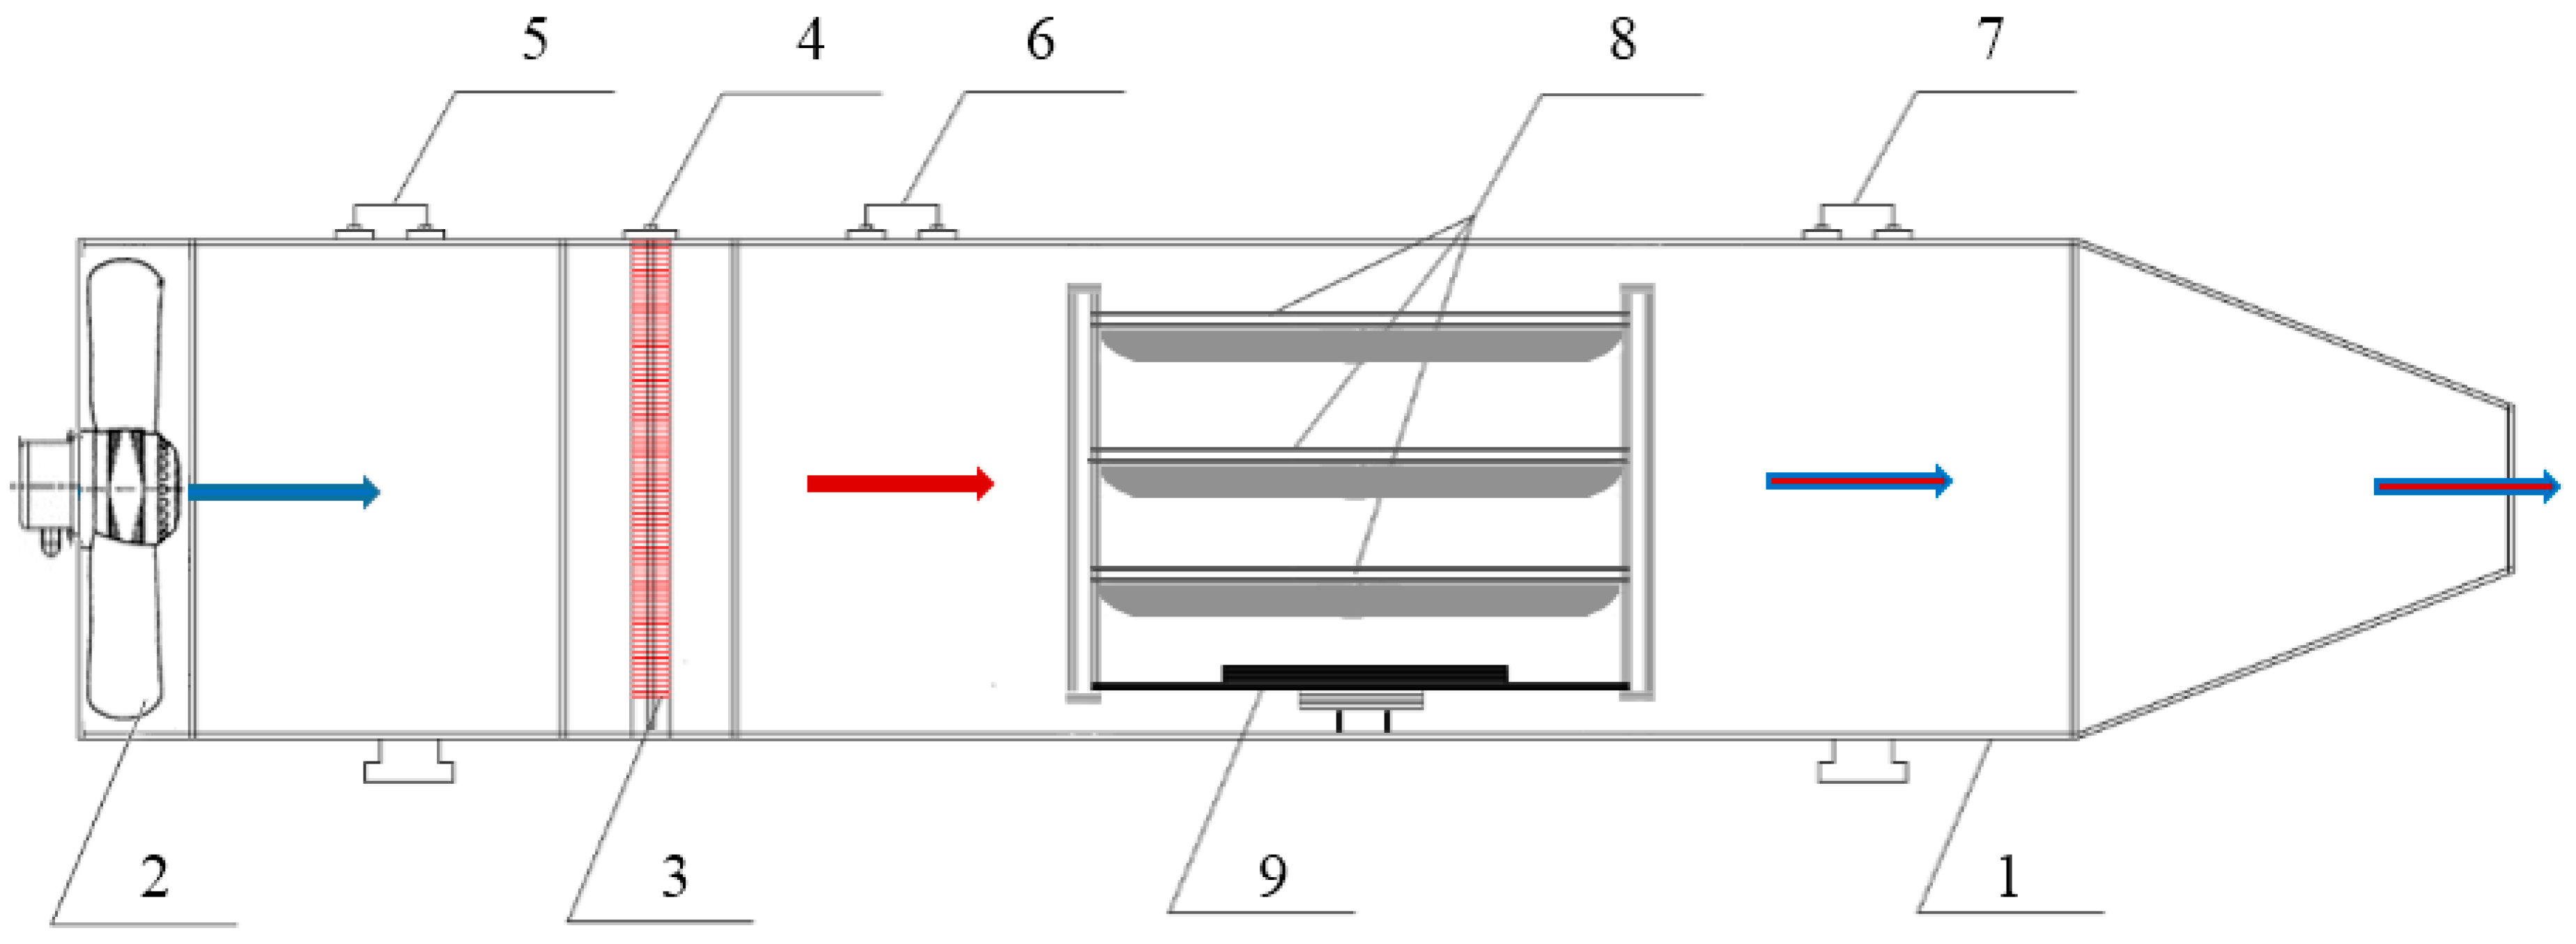
2.2. Experimental Procedure

Food and agriculture products can be dried by several methods, such as solar, freeze, infrared, microwave and convective drying. Convective drying is the most popular among these methods for moisture removal in a variety of industrial applications [25]. Therefore, a laboratory batch convective tray dryer shown in Figure 2 was used to dry apple slices. The unit is made of a stainless steel tunnel with the dimensions of 2000 × 450 × 400 mm (length, height and width, respectively), with aluminum on the outside and expanded polystyrene plates between the metal layers to minimize the heat transfer through the chamber walls. The unit was also equipped with heating elements (3 kW), an axial fan with angular frequency of 0 to 2500 rpm, three drying trays, a control system, a load cell-force sensor (range: 0–5 kg) with continuous mass balance, an air flow sensor (0–150 L/s), as well as temperature and pressure sensors. The axial-flow fan was located at the entrance of the drying tunnel to feed air into the tunnel. The air flow rate was set at the beginning of the process. Heating elements, which were placed next to the fan, heated the air and controlled the temperature. The unit has three strategically located hygrometers to ensure optimum humidity and temperature required for the system. Hygrometers consist of two temperature sensors (wet bulb) wrapped in an absorbing cover and the other (dry bulb) which is located directly in the tunnel. Sliced apples were placed on perforated trays in the tunnel of the load cell; the balance and load cell were connected to the control interface box and data acquisition software with balance calibration option. A more detailed description of the experimental set-up is given in our previous work [26].
The dryer was first run without the samples for about 10 to 15 min to set the desired conditions before each batch drying, samples, after being sliced, were placed on three trays and placed inside the chamber above the balance. The balance was set to record the sample mass every two minutes.
During the process, apple slices were dried starting from the initial moisture content of 86.7% to the final moisture content of 20% (w.b). The sample mass was recorded every two minutes. The experiments were carried out under average ambient temperatures of 15–20 °C, pressure of 82 kPa and an air average relative humidity of 25–45%. Drying characteristics of the apple slices were studied at three temperature levels: 40, 45 and 50 °C ± 1 before the drying chamber, which corresponded to 50, 60 and 70 °C ± 1 controlled close to the heater, and at three air velocities: 0.6, 0.85 and 1.1 m/s, for each temperature level. In these measurements, the apple slice thickness was 6 mm. The experimental runs at 40, 45 and 50 °C for air velocities of 0.85 m/s and 1.1 m/s were repeated to measure water activity of the samples. During the last mentioned series of experiments, about 10 g of dried material was taken from the device each 60 min to measure water activity.
In the next series of experiments, the effect of slice thickness was investigated. Slices with five different thicknesses: 4, 6, 8, 10 and 12 mm, were subjected to drying at 50 °C, ambient air relative humidity of 35 to 38% and air velocity of 1.1 m/s. Finally, experimental runs at three different ranges of ambient air relative humidity: 25–28, 35–38 and 40–45%, were carried out. For these experiments, the chamber temperature was 50 °C and air velocity was 1.1 m/s. The air relative humidity was not controlled; the experiments were carried out during different seasons from March to July when different ambient air relative humidities were recorded. In total, 23 runs of drying experiments were carried out, with the duration of each experiment between 5 and 15 h. Table 1 shows a list of experimental runs of this study.

2.3. Water Activity Measurement

Water activity of the samples was determined using a laboratory water activity analyzer (LabTouch-aw, Novasina, Switzerland). A sample was taken every 60 min, cut to approximately 5 × 5 × 5 mm and placed in a specific analyzer petri dish. Water activity of the sample at the three temperatures, 40, 45 and 50 °C, and air velocities of 0.85 and 1.1 m/s for each temperature was determined.

2.4. Mathematical Modeling

Process modeling and optimization of process parameters can significantly reduce the number of experiments required for process design. Drying processes modeling can be formally characterized by two different approaches: physical-based modeling and empirical modeling [27]. Physical models describe the fundamentals of heat and mass transfer during the drying process. This modeling approach requires the knowledge of heat and mass transfer parameters, such as effective diffusion coefficient in both solid and gas phases, thermal conductivity, specific heat capacity, density, etc. and the change caused by material shrinkage during the drying process.
An alternative to physical-based modeling is experimental-based empirical modeling. In literature, many empirical mathematical models applicable for the drying of food and agricultural products can be found; various authors have studied the modeling of the food drying process, e.g., drying of garlic slices [28], tomato slices [29], pepper [30] and apple slices [23].
In this study, parameters of five thin-layer models (Newton, Page, modified Page, logarithmic and Henderson and Pabis) were analyzed under different process conditions. The models are given in Table 2:
t is time, k is the drying rate constant, a, n and c are model coefficients and MR is moisture ratio defined by Equation (1), [25,39,40]
M R = ( X t X e q ) ( X 0 X e q )  
where Xt, X0 and Xeq represent the dry basis moisture content (kg water/ kg dry solid) at any time, initial and equilibrium, respectively. The dry basis moisture content of apple slices can be calculated based on Equation (2):
X = m H 2 O m d r y = m w e t m d r y m d r y
where mH2O is the actual mass of water in the wet solid, mwet is the total mass of the wet solid and mdry is the mass of dry matter [41,42].
A disadvantage of these simple thin-layer models is that different parameters of the model are required for different process conditions. This fact limits the use of such models to conditions for which the model parameters were estimated. For this reason, a new four-parametric model containing information on process conditions was developed. The presented model, referred to here as Haydary, is sensible to process conditions and works with four process parameters and four empirical parameters determined based on 3780 experimental points optimized for all process conditions. The process parameters included are temperature, air velocity, air relative humidity and layer thickness. The model is represented by Equation (3)
M R = E X P [ k ( T T m i n     v v m i n d d m i n   φ φ m i n ) p t n ( T T m i n     v v m i n d d m i n   φ φ m i n ) r ]
where k, p, r and n are empirical parameters, T is temperature, v air velocity, d sample thickness, φ is air relative humidity, Tmin, vmin, dmin and φmin are minimum values of parameters in their measurement ranges. The advantage of this model is its applicability as a single equation for all process conditions inside their defined ranges.
Thin-layer drying can be modeled also by simplification of Fick’s second law equation. The simplified equation has been applied by many authors [43,44,45] for the determination of the effective diffusion coefficient of water (Deff) in sliced materials:
M R = n = 0 8 ( 2 n + 1 ) 2 π 2   E x p   ( ( 2 n + 1 ) 2 π 2 D e f f t 4   l 2 )  
where MR is the moisture ratio defined by Equation (1), t is time and l is half of the slice thickness.
For long drying times, only one term of Equation (1) can be considered:
M R = 8 π 2   E x p   ( π 2 D e f f t 4   l 2 )  
The effective diffusion coefficient Deff can be determined from the slope of the linear dependence of ln(MR) versus time using experimental data:
ln ( M R ) = l n 8 π 2 + (   π 2 D e f f   4   l 2 ) t  

2.5. Statistical Analysis

For mathematical modeling, the thin-layer drying equations shown in Table 2 were used to select a suitable model for apple dying according to the experimental data. There are three important statistical parameters helpful for choosing the best model, such as the coefficient of determination (R2) (Equation (7)), reduced chi-square (X2) (Equation (8)) and root mean square error (RMES) (Equation (9)) [29,46,47]. For the calculation of empirical constants’ values, a solver from Microsoft Excel was used.
R 2 = 1 i 1 n ( M R e x p , i M R p r e , i ) 2 i 1 n ( M R e x p , i M R e x p ) 2    
X 2 = i 1 n ( M R e x p , i M R p r e , i ) 2 N Z  
R M S E   = [ 1 N i = 1 n ( M R e x p , i M R p r e , i ) 2 ] 1 / 2  
In these equations, MRexp,i represents the ith experimentally observed normalized moisture ratio, MRpre,i represents the ith predicted value, MRexp is average of normalized MR of experimental points, N is the number of observations and z is the number of constants in the models.
By statistical analysis of thin-layer mathematical modeling, the coefficient of determination (R2) is the main criterion for the selection of the most suitable model to describe the drying curve equation [36]. In addition, the mean square of the deviations (X2), according to the predicted and experimental values and the root mean square error analysis (RMSE), are also important for the selection of a suitable model [24,48].

3. Results and Discussion

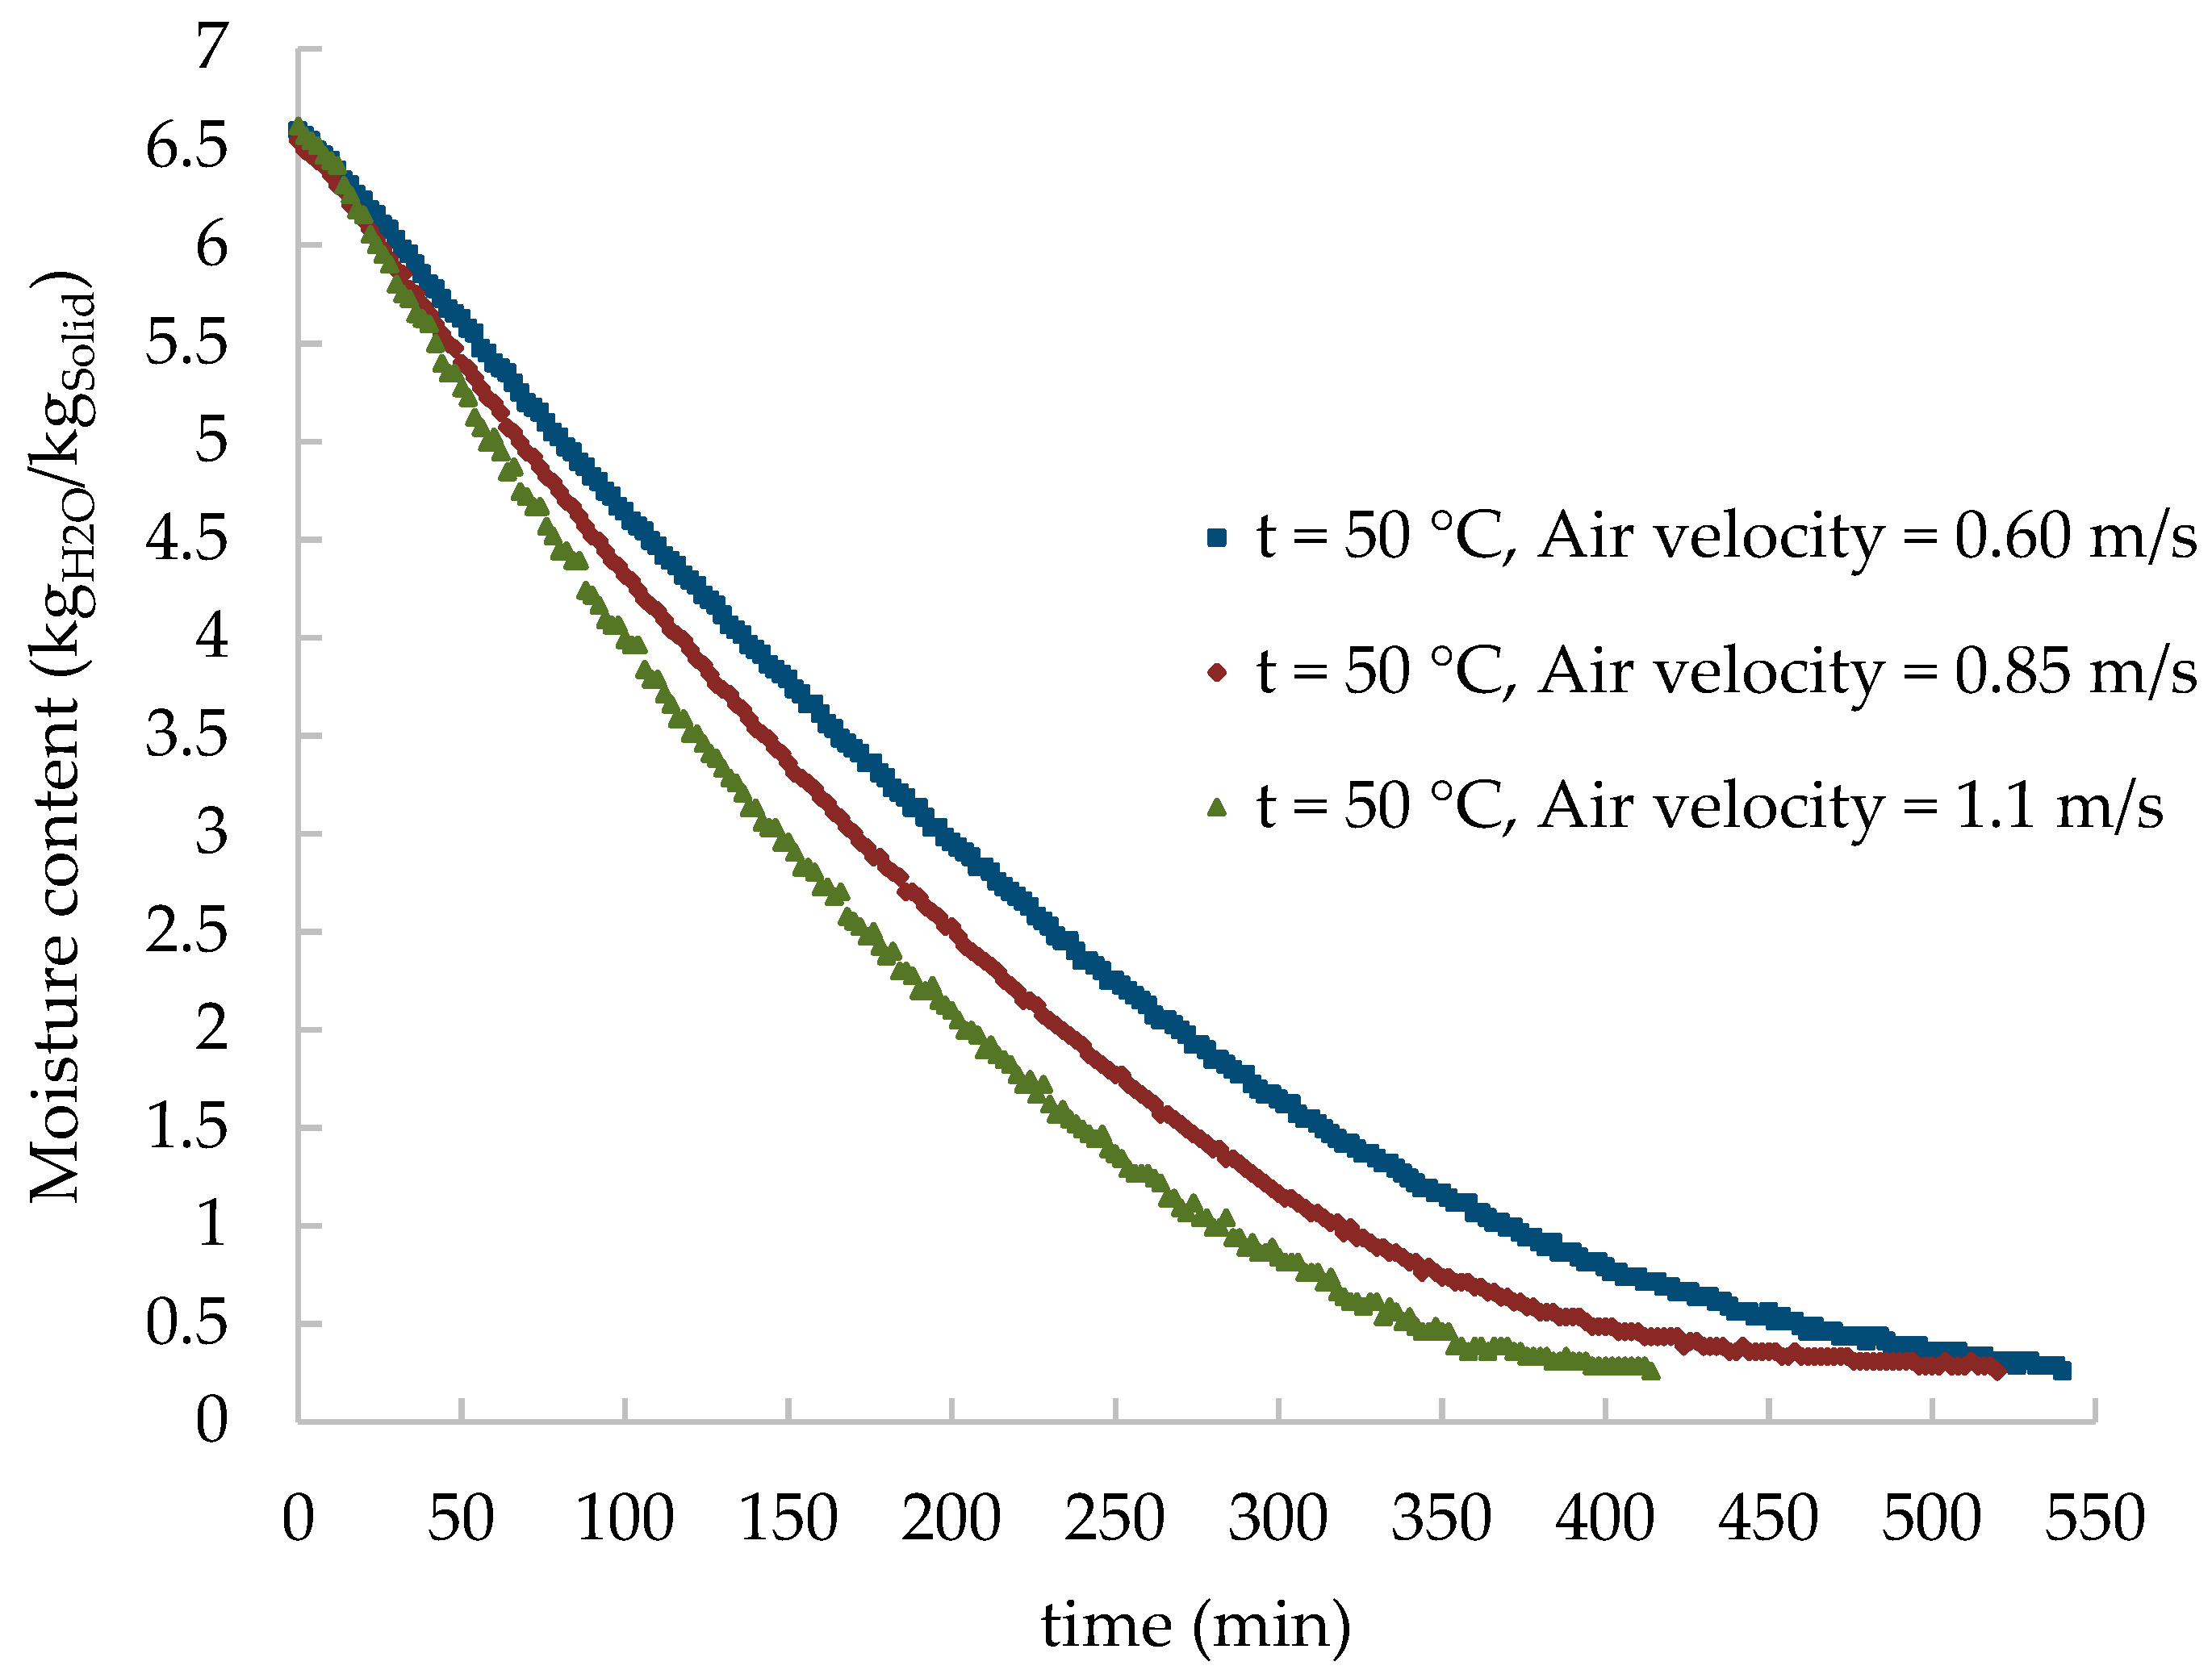
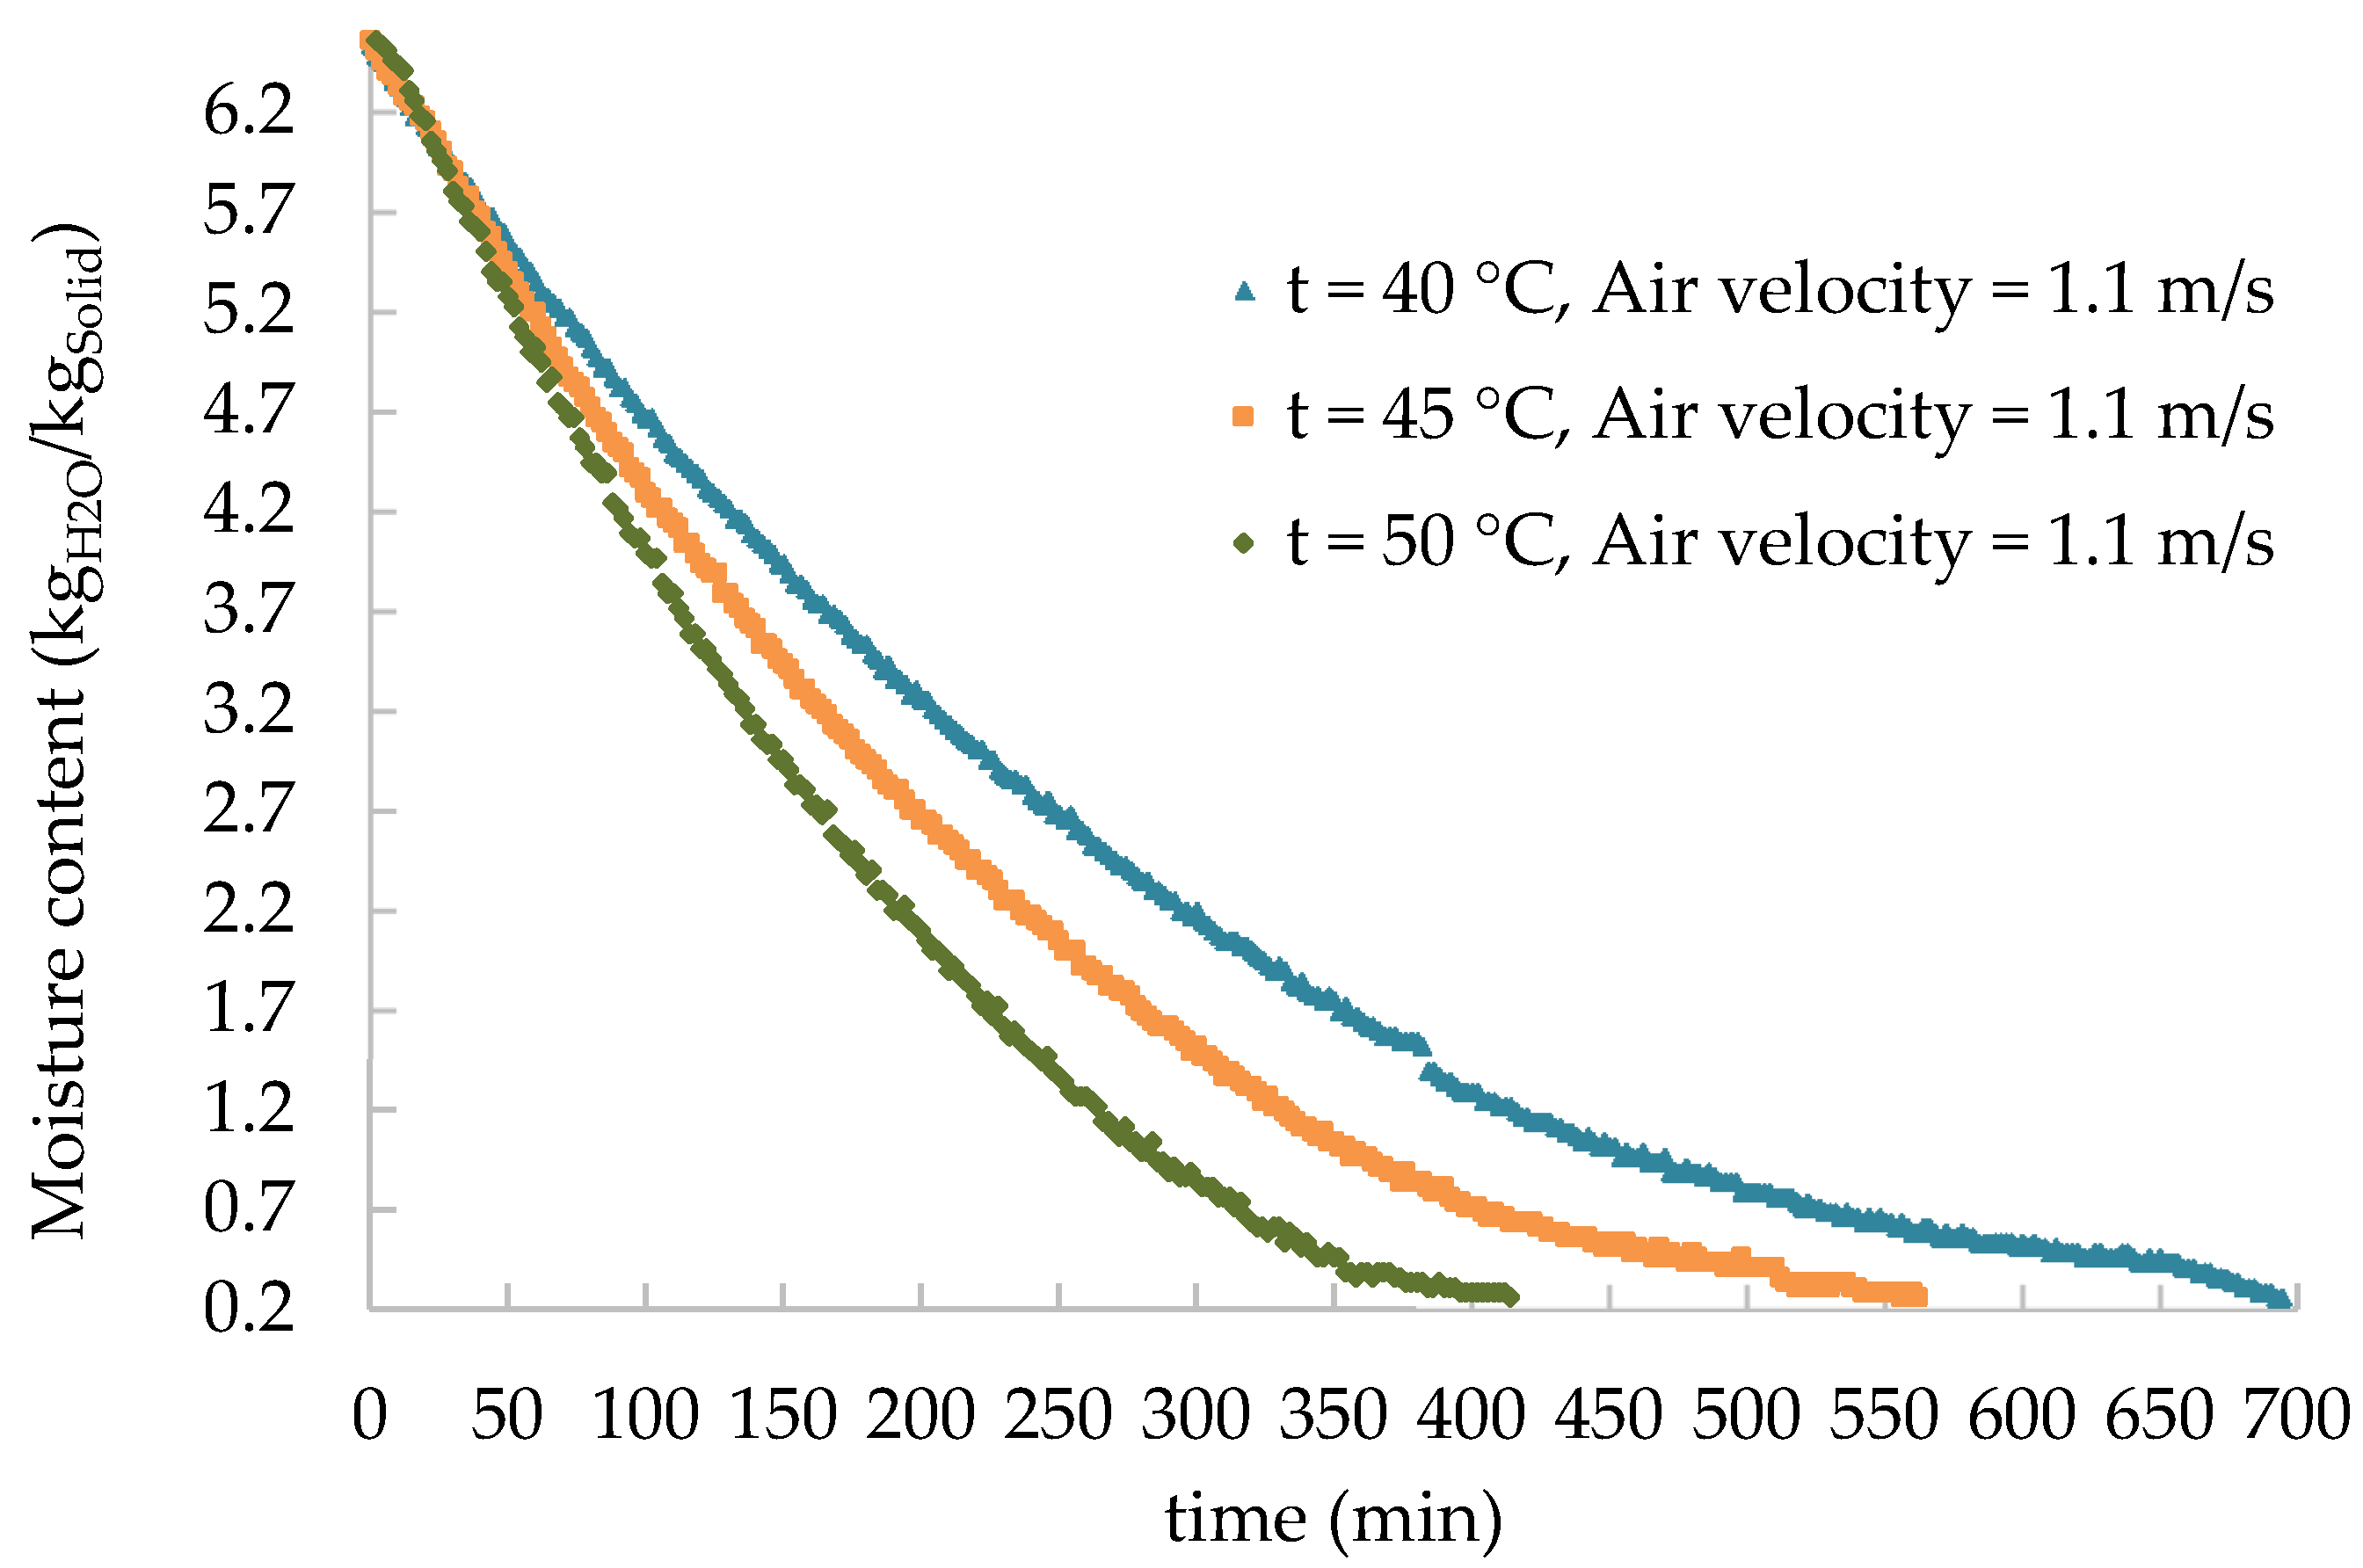
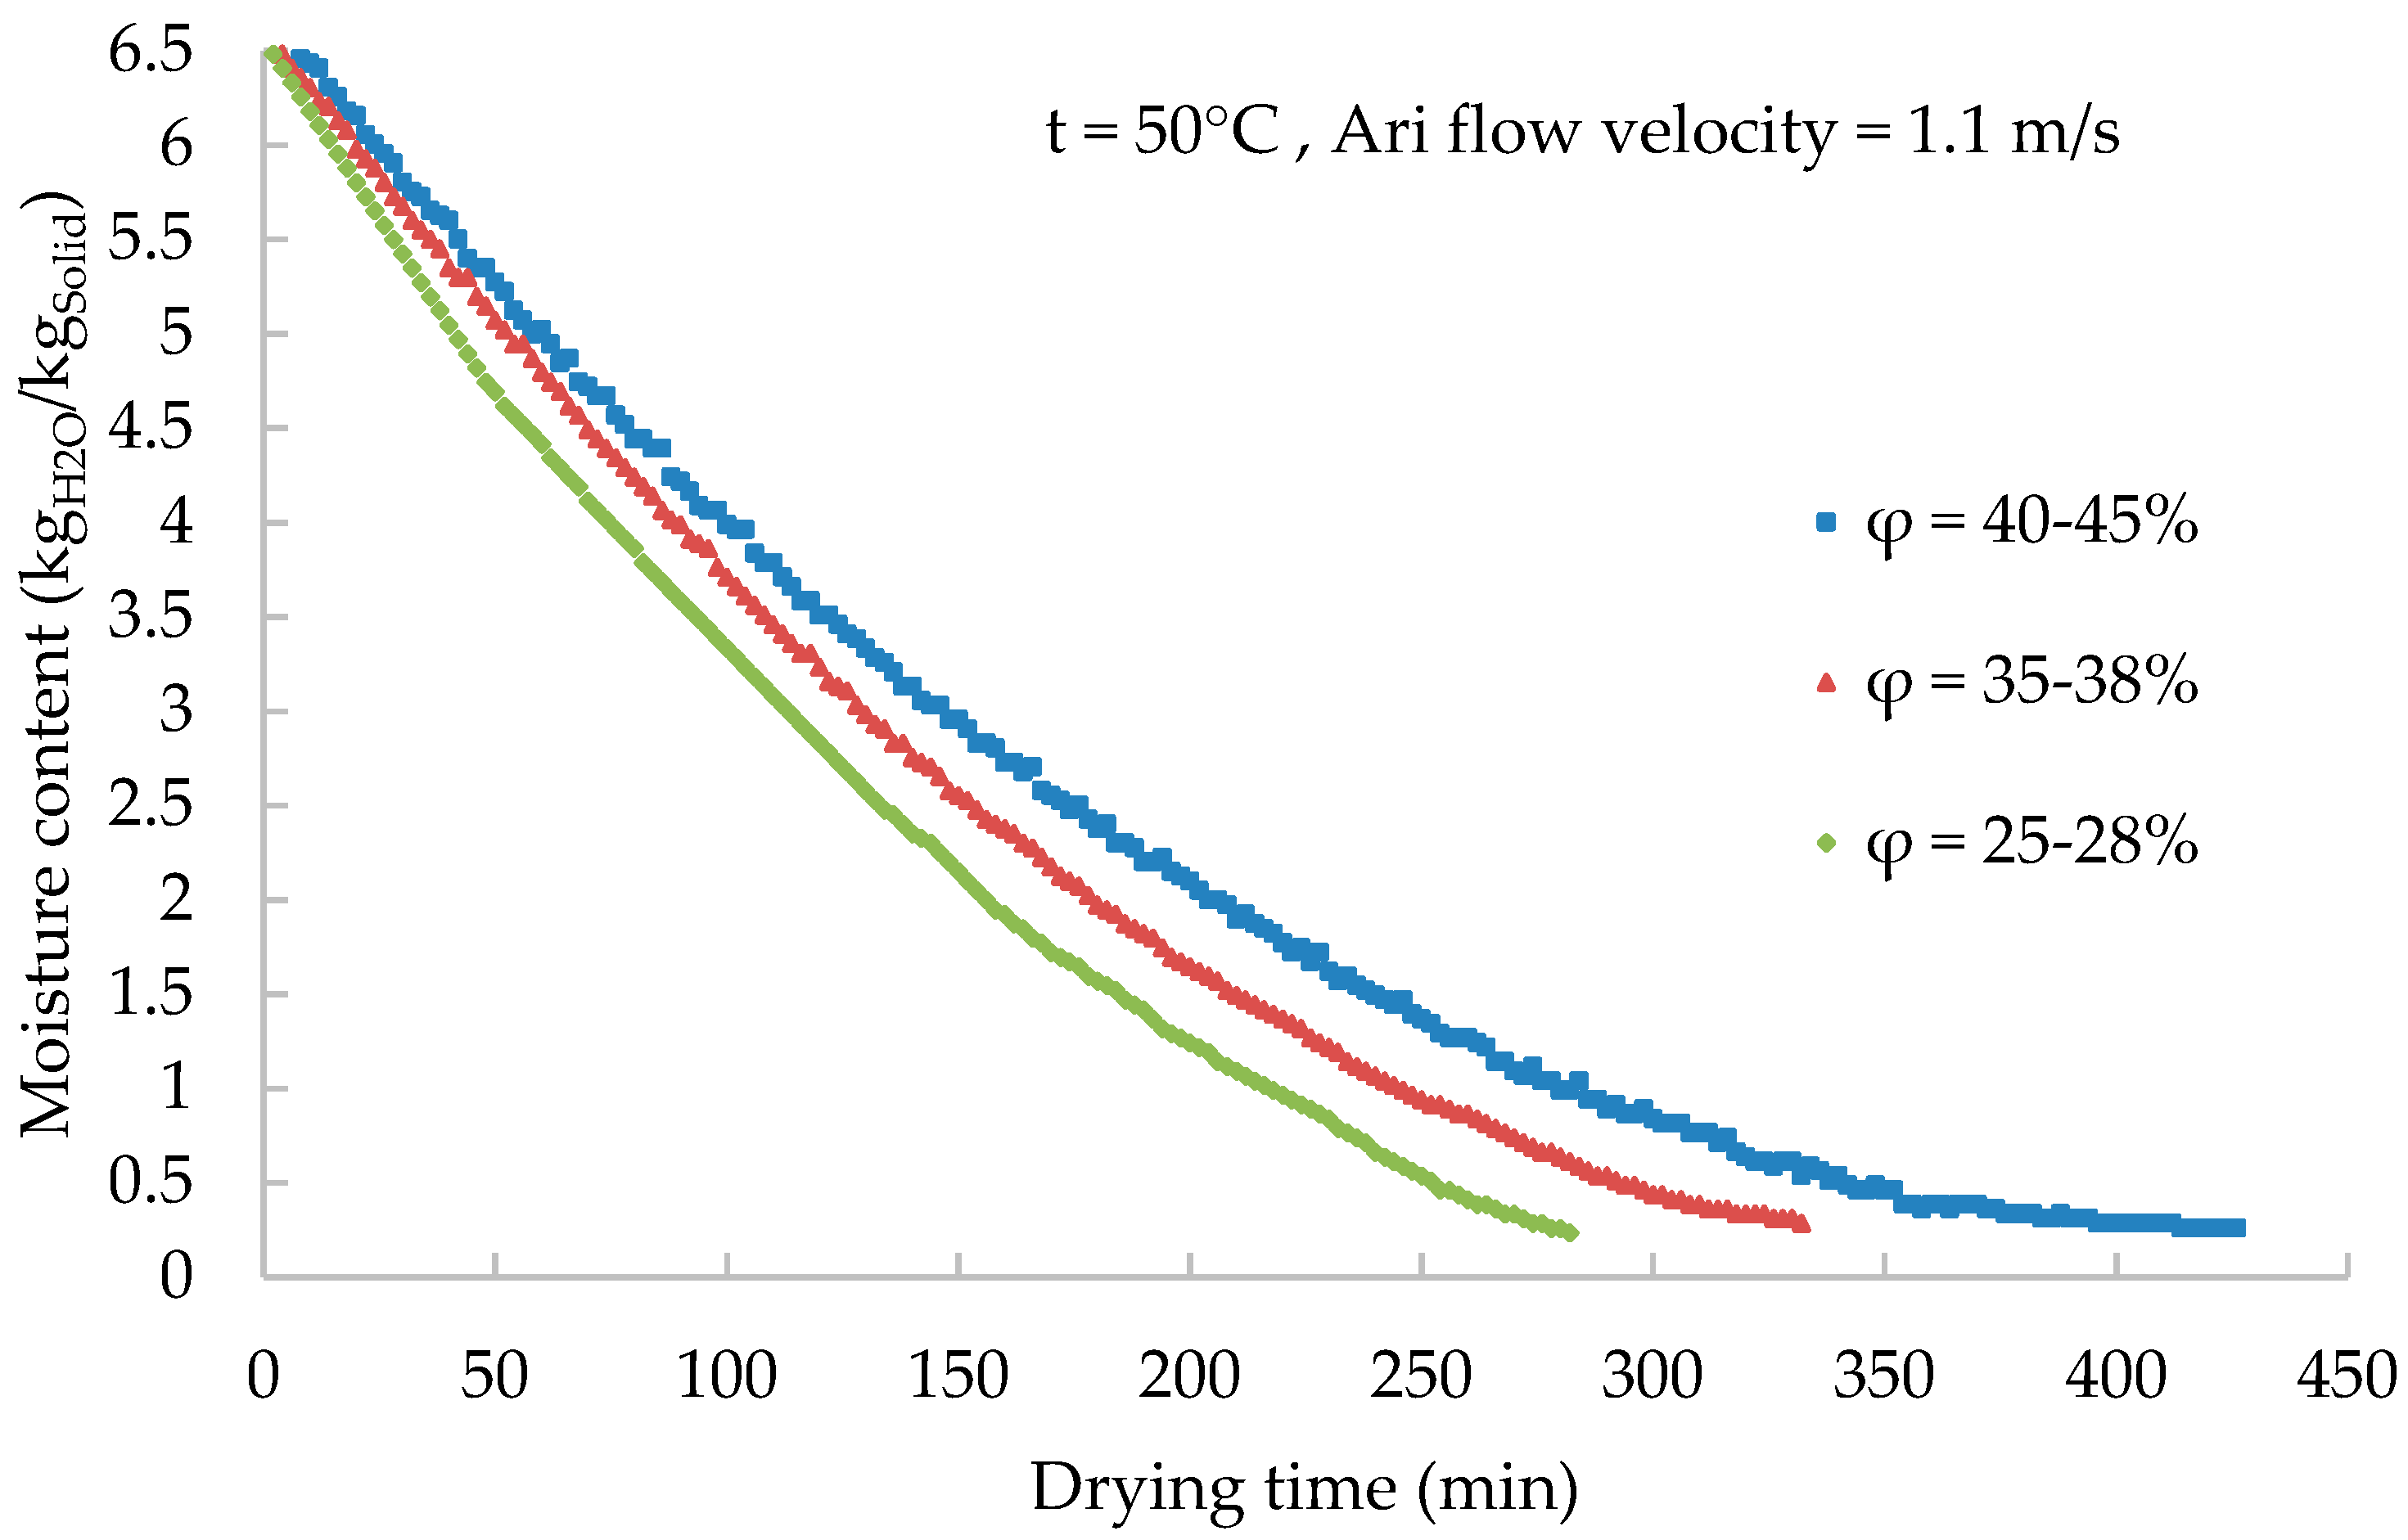
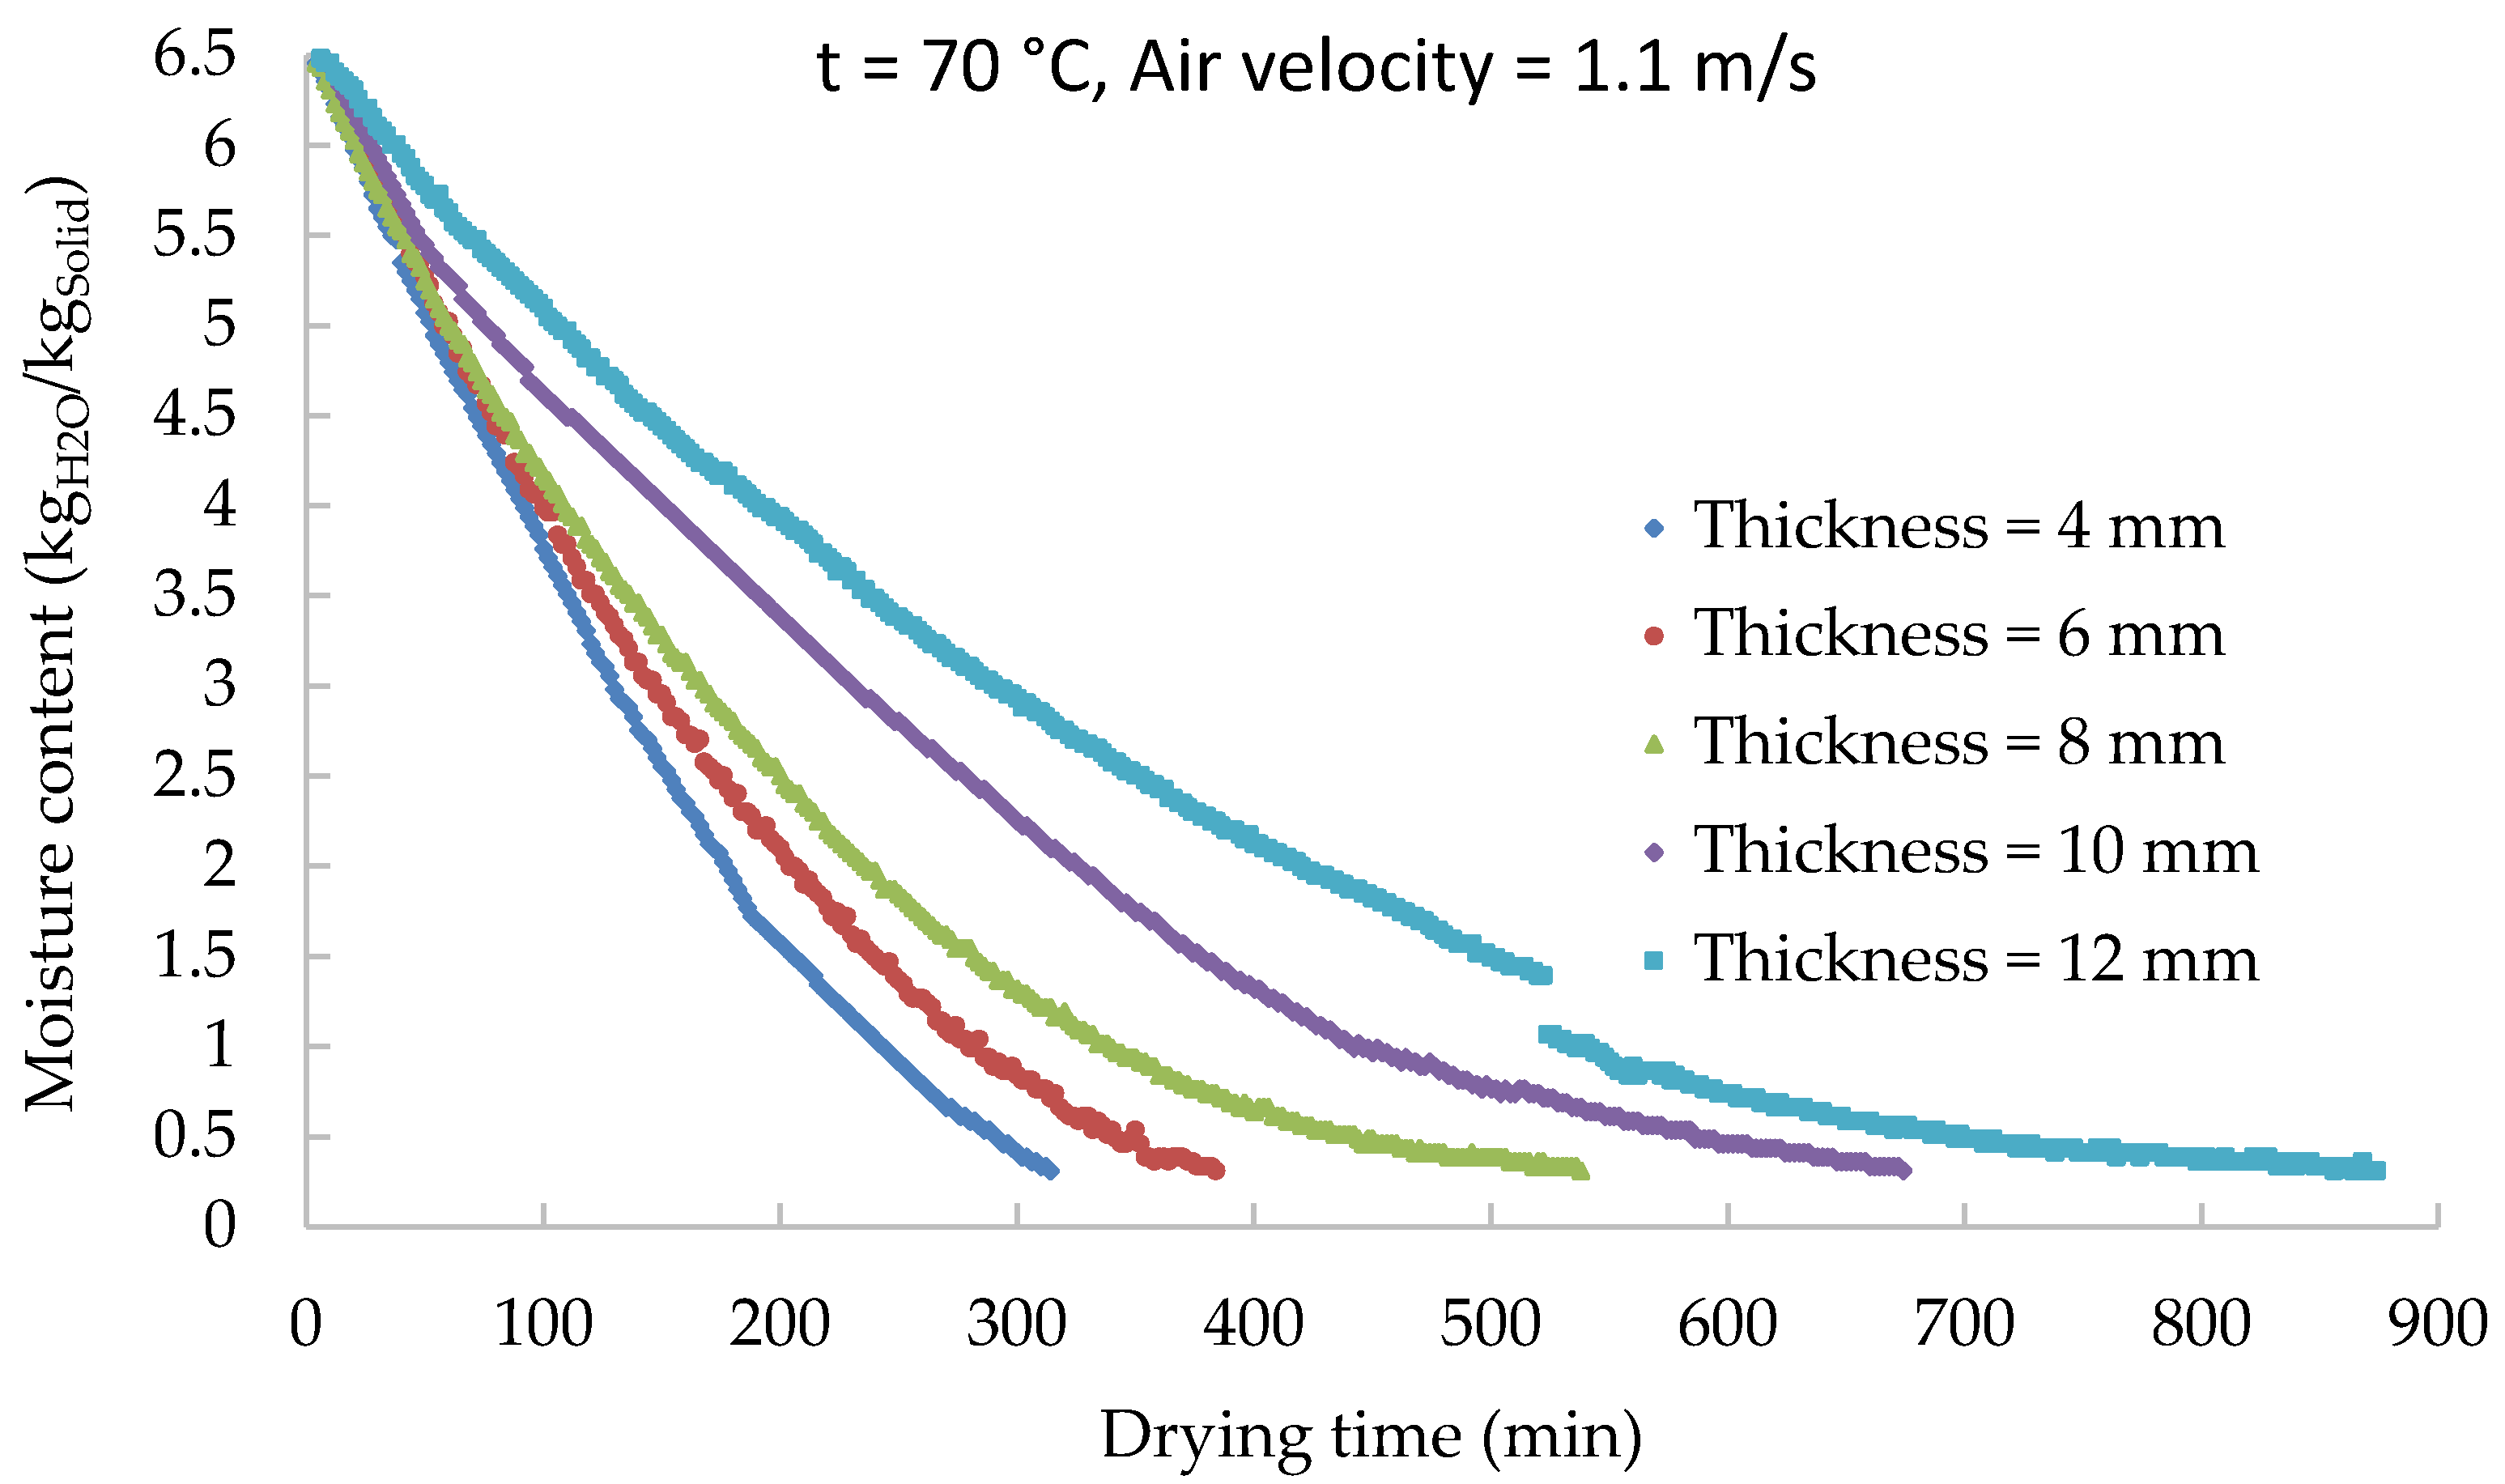
3.1. Effect of Conditions on Drying Kinetics

Substituting the experimentally obtained data of sample mass loss and Equations (1) and (2), the sample transient moisture content (d.b) and moisture ratio (MR) were calculated. Drying curves, given as variations of moisture content (d.b) with time measured at different conditions, were compared. In all cases, up to 96% of the total water content in apples evaporated during the experiment. Figure 3 shows the effect of air velocity at 50 °C. Air velocity has a significant effect on drying kinetics. Increasing the air velocity from 0.60 to 1.1 m/s, the drying time decreased by about 100 min; similar results were achieved at the other two temperatures.
The change of the moisture content with time at different temperatures, from 40 to 50 °C, at an air velocity of 1.1 m/s is shown in Figure 4. The effect of temperature is crucial. By increasing the temperature in the drying chamber from 40 to 50 °C at an air velocity of 1.1 m/s, the drying time decreased by about 300 min. A comparable effect of temperature and air velocity was also reported by other authors [13,14].
Ambient air relative humidity can also significantly affect the drying rate. To observe the effect of ambient air relative humidity, the experiments at constant temperature and air velocity were repeated during different seasons with ambient air relative humidity, 25–28%, 35–38% and 40–45%, respectively. Removal of the moisture content of apple slices was faster at lower ambient air relative humidity, as shown in Figure 5.
Slice thickness has a significant effect on drying kinetics. While for 4 mm slices, the required degree of drying was achieved after 300 min; for 12 mm slices, one working day (maximum 10 h) was not enough and measurement was stopped after 8.5 h and continued on the second day. This is the reason of the break on the curve for 12 mm slices in Figure 6. At high moisture content (at the beginning of the experiment) when free water from the apples is evaporated, the effect of slice thickness is not significant; however, by decreasing the moisture content, the drying rate is limited by water diffusion to the surface and the effect of slice thickness becomes crucial.

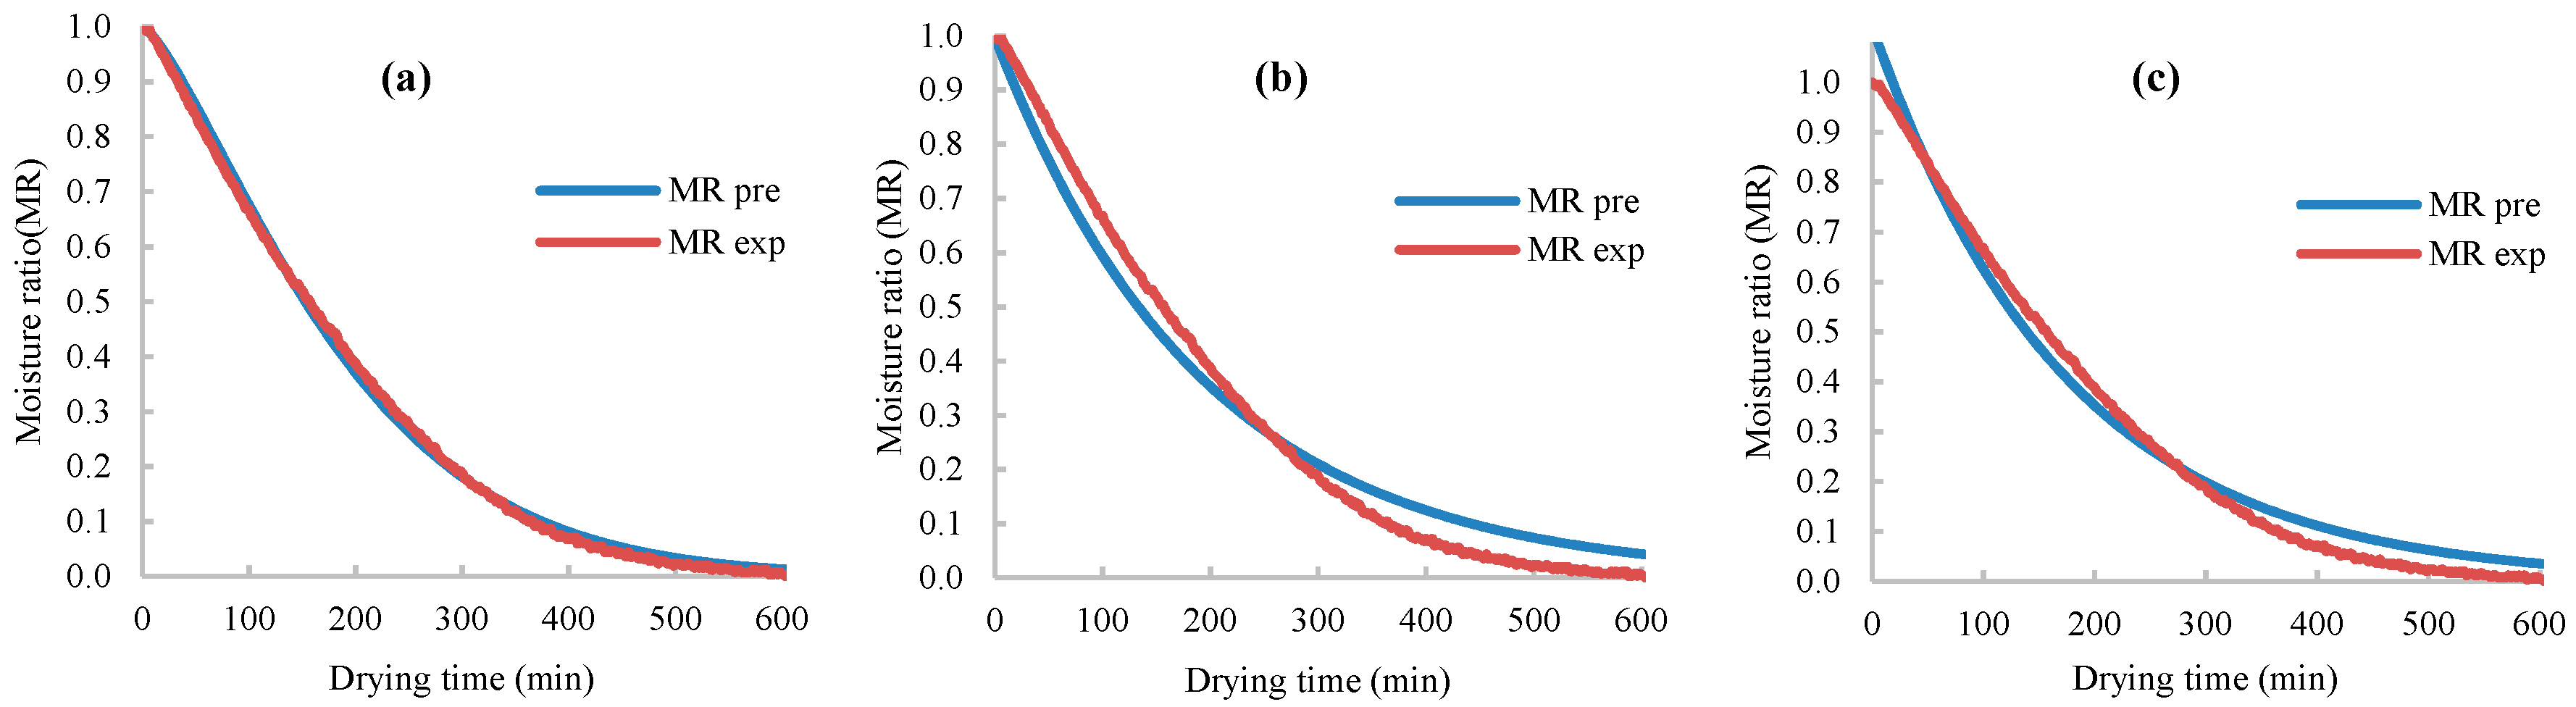
3.2. Mathematical Model Selection

Using thin-layer empirical models given in Table 2, parameters of all five (Newton, Page, modified Page, logarithmic and Henderson and Pabis) models were estimated by fitting the calculated data to the experimentally measured ones. An example of graphical comparison of calculated and measured data at 45 °C, air velocity of 0.85 m/s and sample thickness of 6 mm is given in Figure 7.
Statistical analysis was done to select the most appropriate thin-layer empirical model for drying apple slices at different conditions. The analysis was conducted to decide the most suitable model with the highest value of R2 (Equation (6)) and the lowest values of X2 (Equation (7)) and RMSE (Equation (8)). The model with the highest R2 and the lowest X2 and MRSE is best suitable to describe the drying process [28,49].
All five models were run at all conditions: three temperature levels: 40, 45 and 50 °C, three air velocity values: 0.60, 0.85 and 1.1 m/s with 6 mm apple slice thicknesses (Table 3) and as well for five additional thicknesses of 4, 6, 8, 10 and 12 mm (Table 4), and three ambient air relative humidity values at 50 °C, a 1.1 m/s rate and a thickness of 6 mm (Table 5).
Between these simple thin-layer models, in all cases, the Page model was identified as the most suitable model with the highest values of R2 and lowest values of X2 and RMSE. The other four models provided similar results, but their performance was less compared to the Page model. The Page empirical model is a simple model with two constants, k and n. As shown in Table 3, Table 4 and Table 5, the values of both constants were affected by the process conditions. Since both parameters are optimized simultaneously to fit experimental data, exact correlations between process conditions and model parameters were not found.
As mentioned above, a disadvantage of these simple thin-layer models is the requirement for different parameters of the model for different process conditions. The new model developed in this work (Haydary) is represented by a single equation valid for all process conditions. Table 6 shows parameters of the model, the range of process conditions and parameters of statistical analysis for this model. Compared to simple thin-layer models valid for only a single process condition, this model shows a slightly lower R2 and higher X2 and RMSE. However, considering its wide range of applicability, these differences do not represent a significant disadvantage.

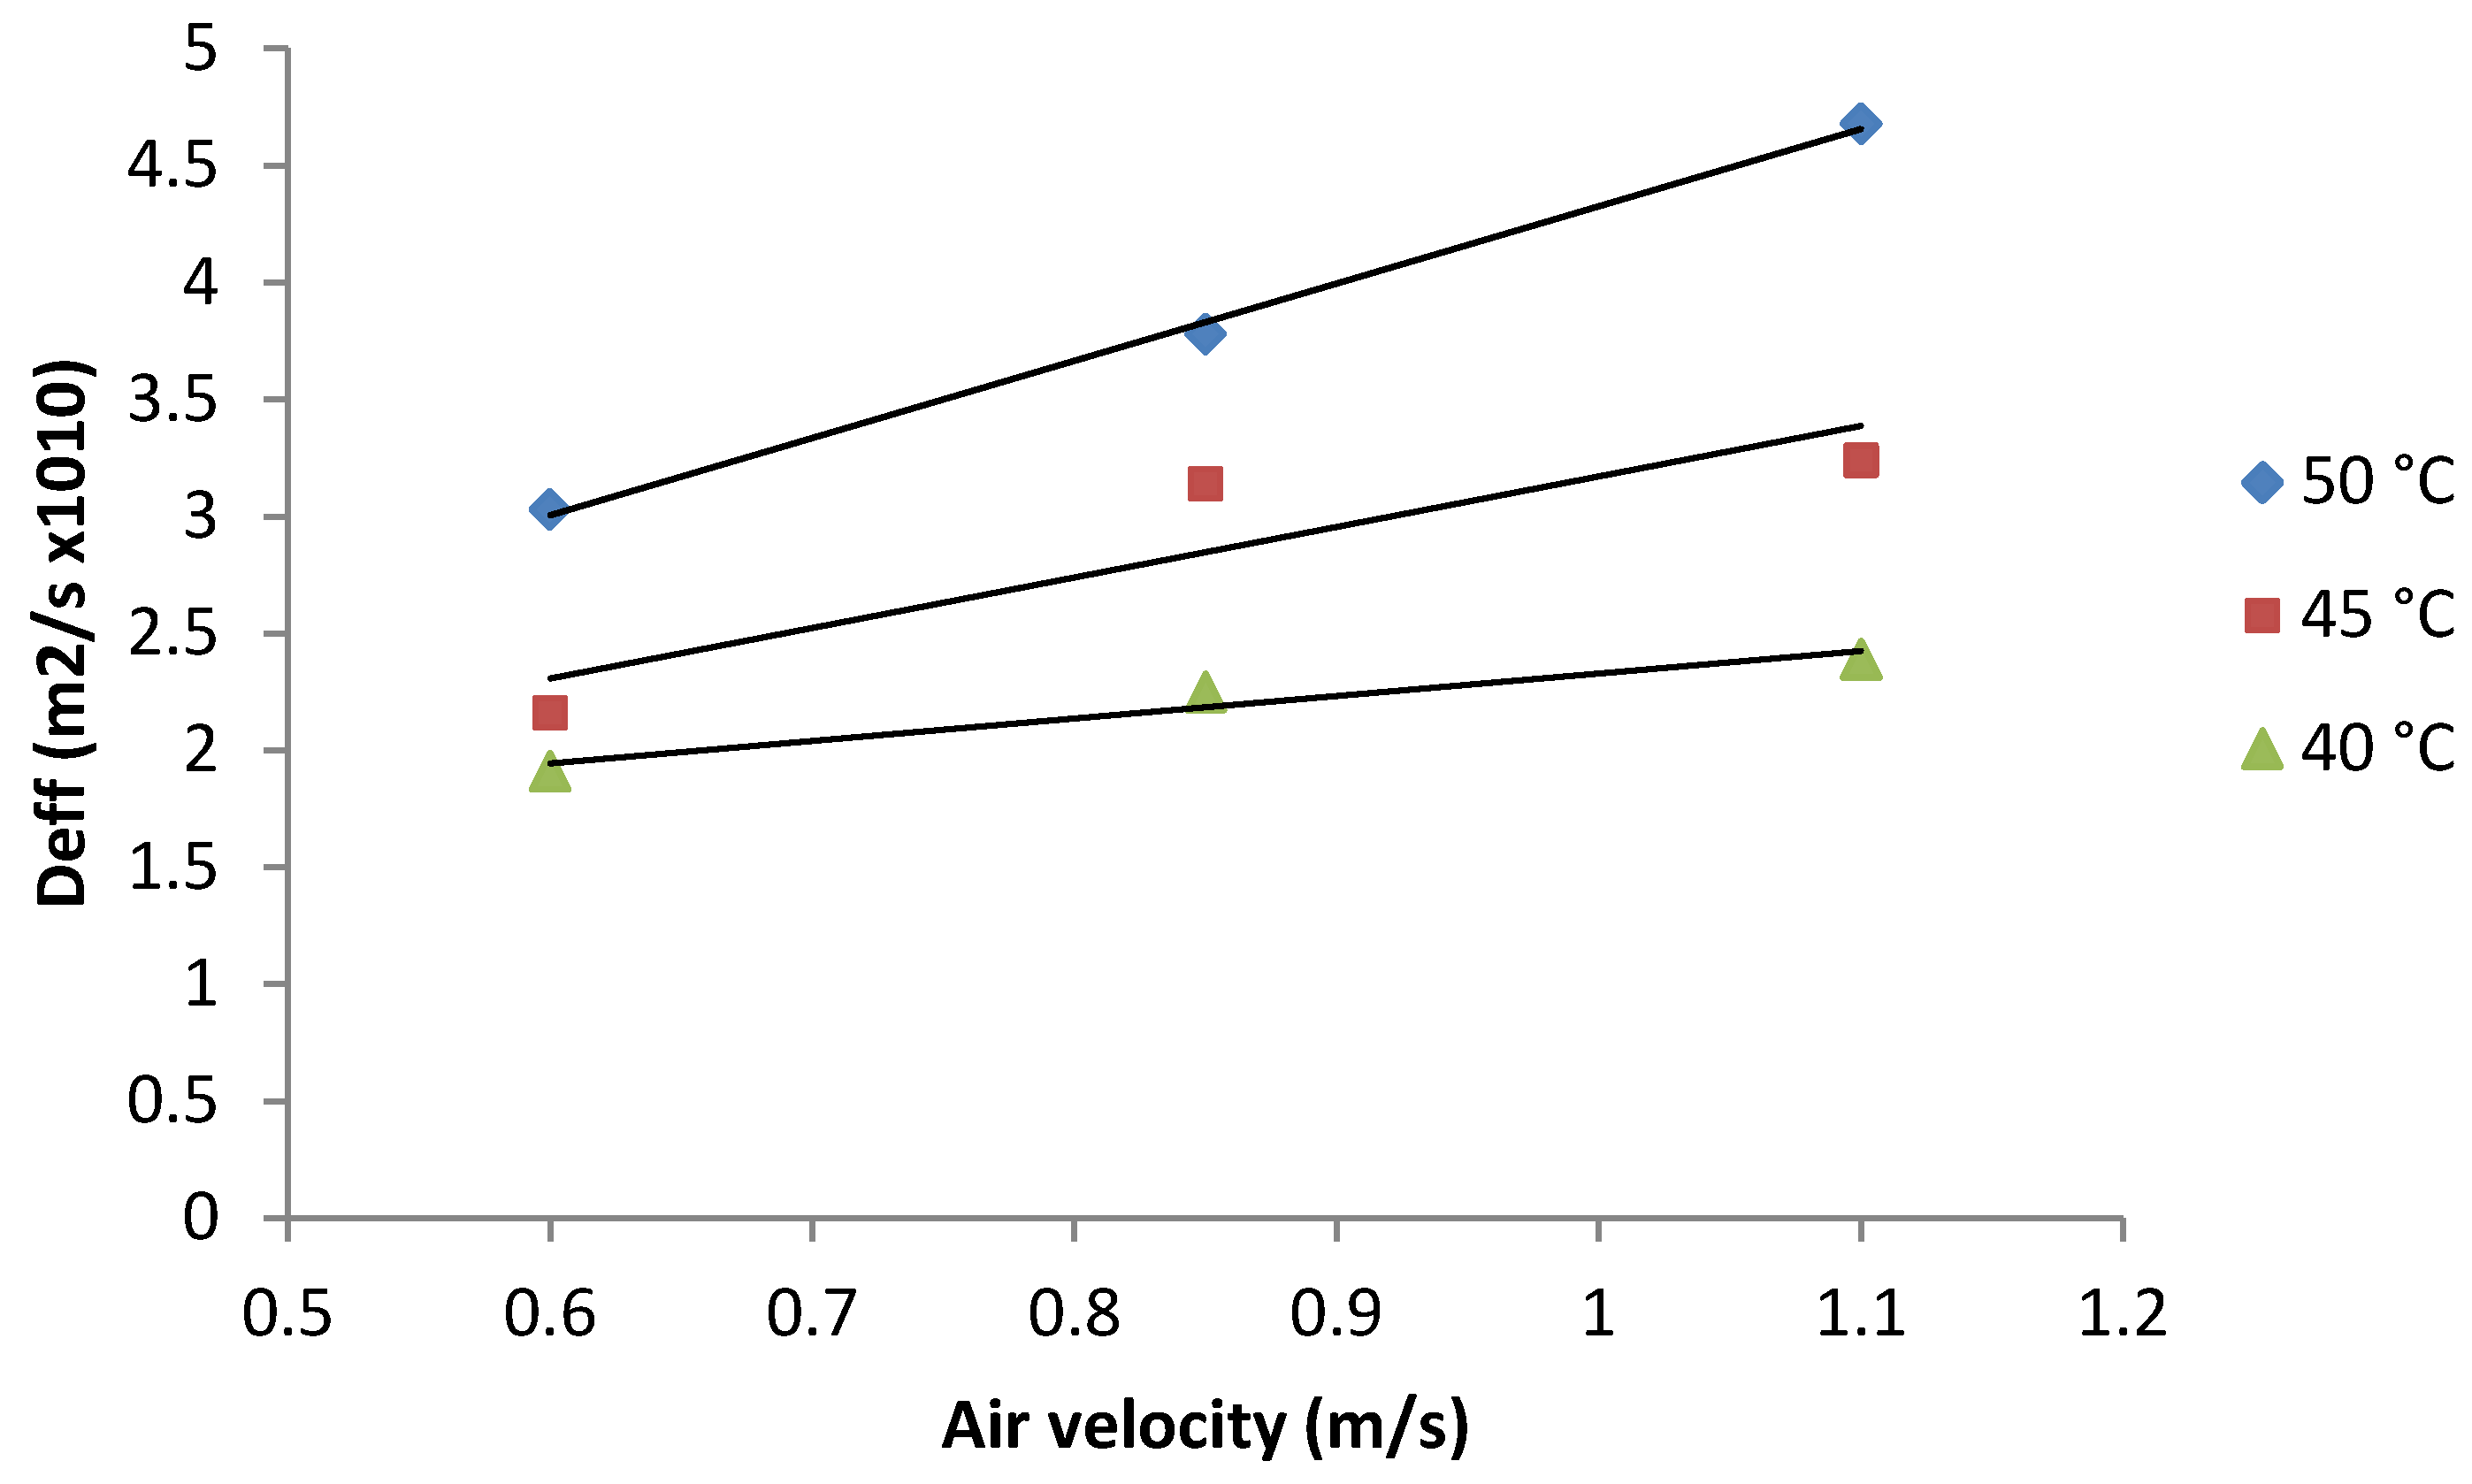
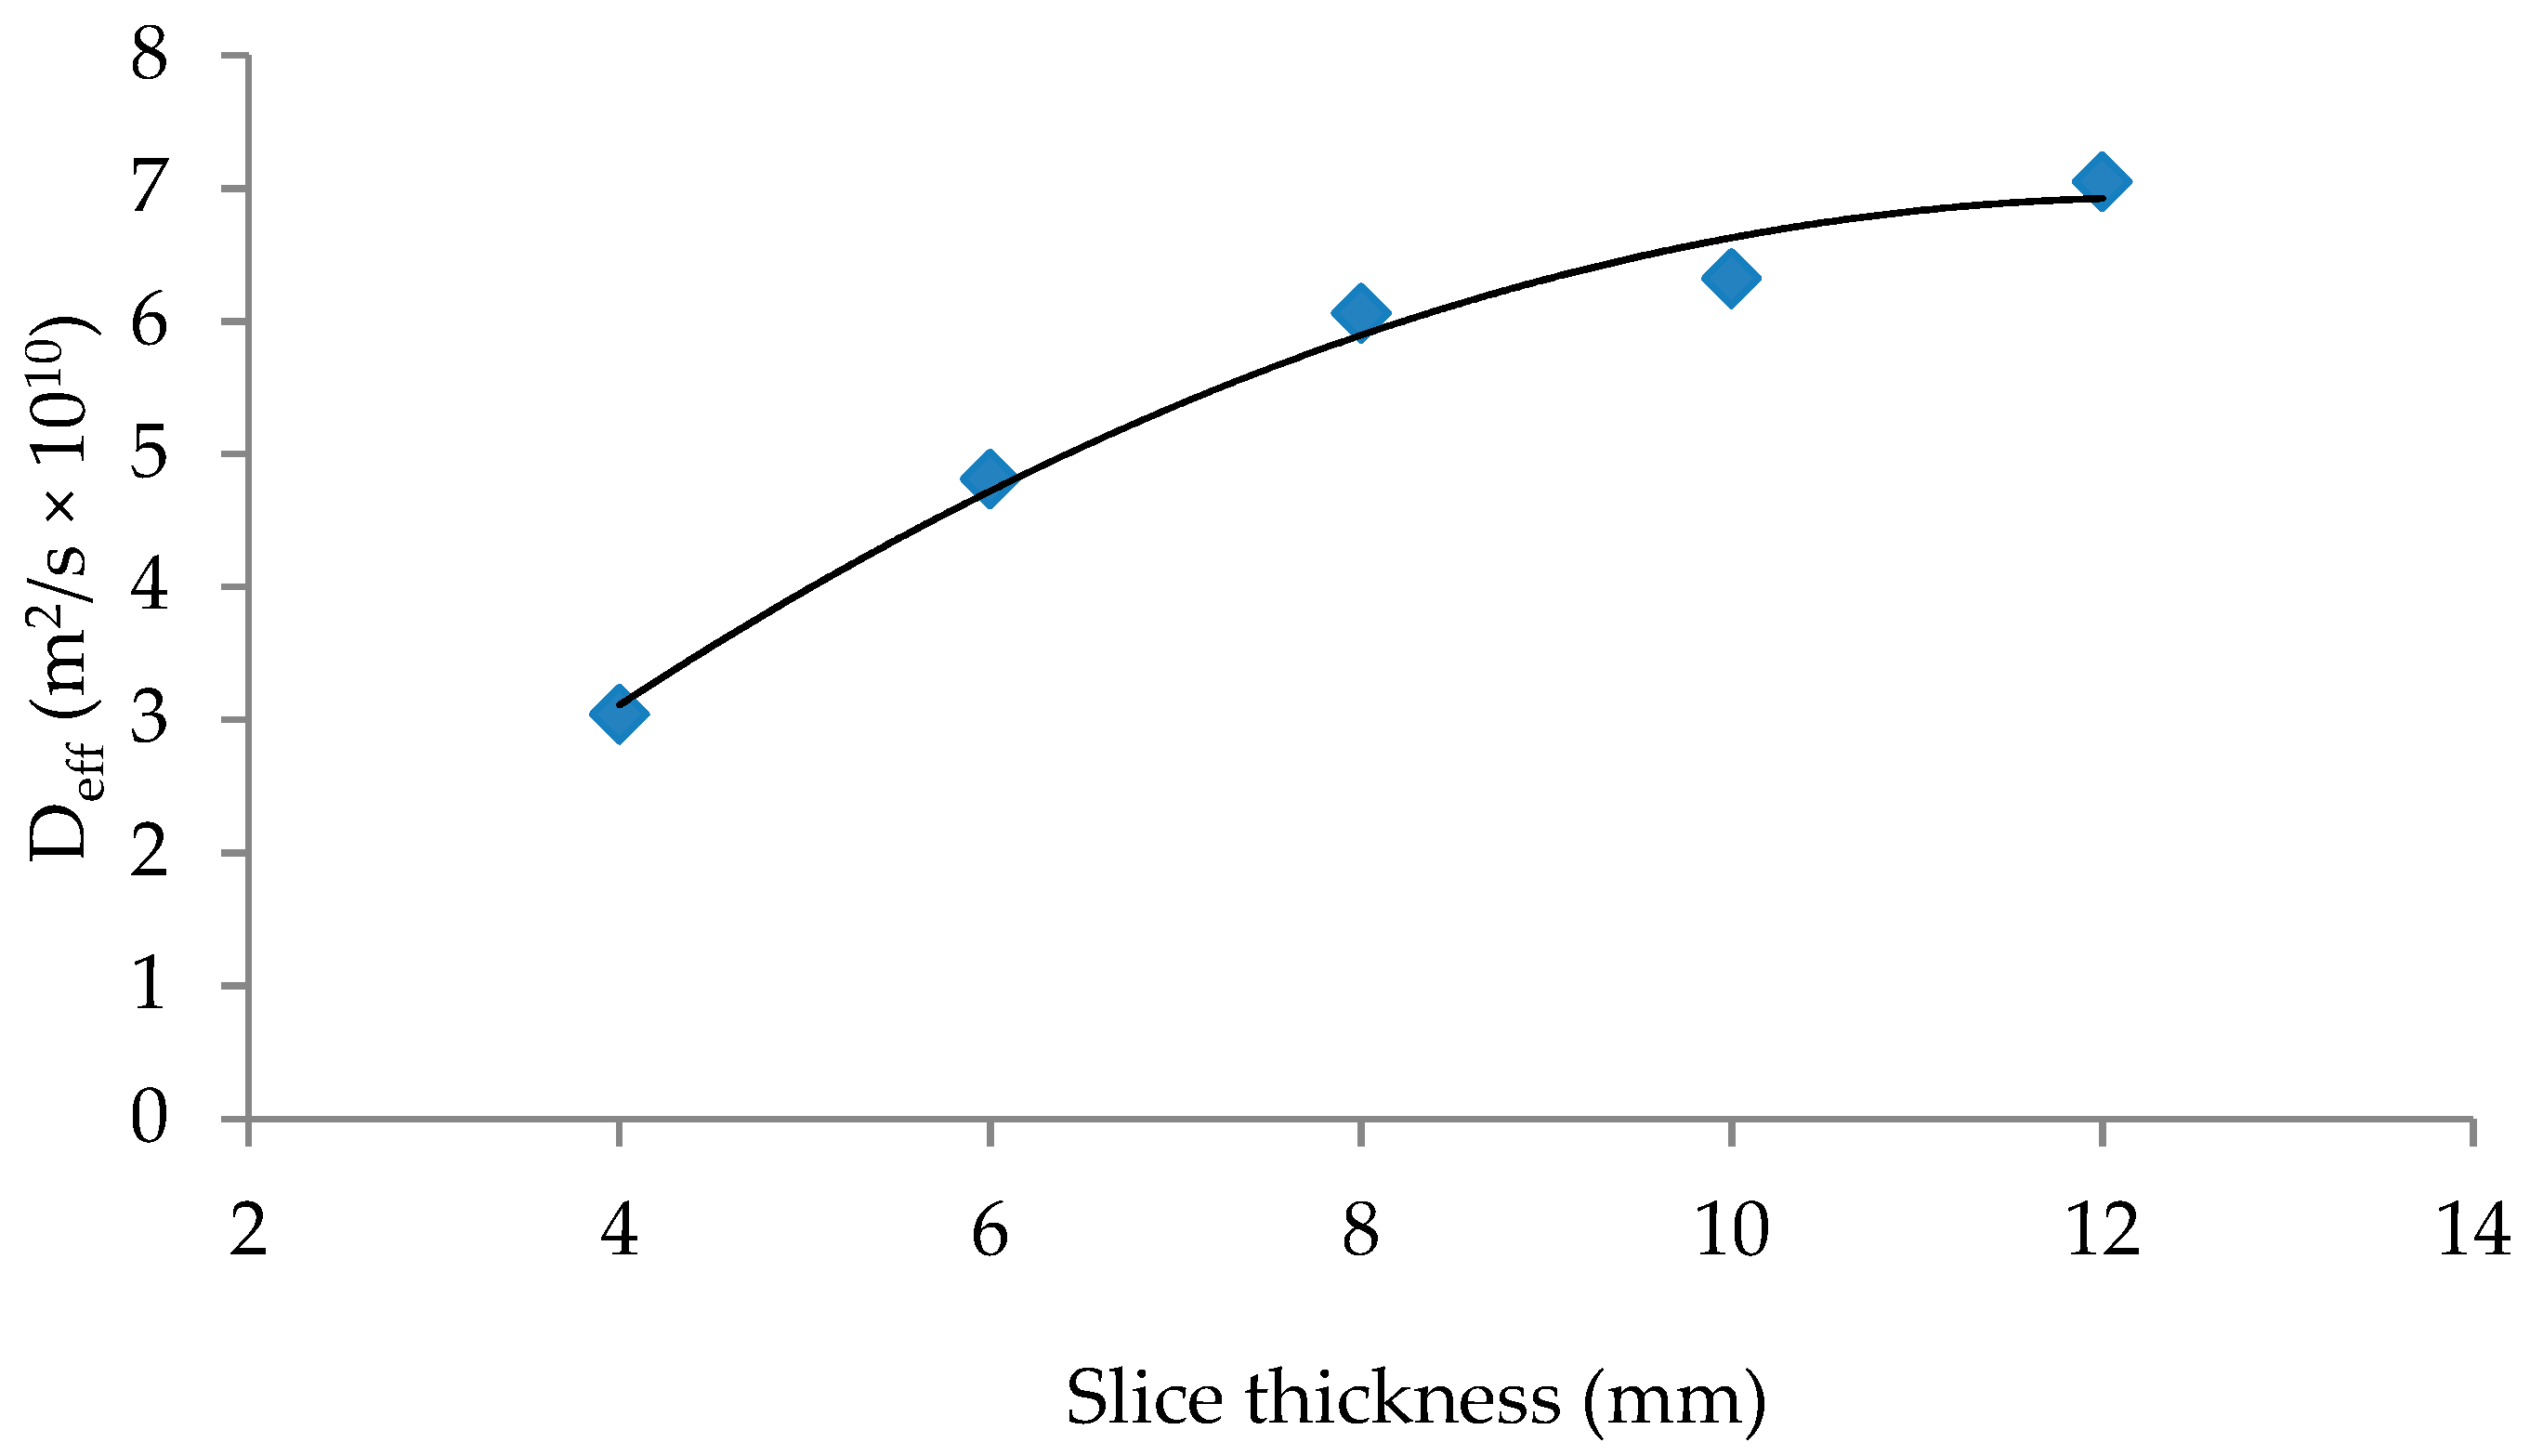
3.3. Effective Diffusion Coefficient Deff

The effective diffusion coefficient of water in an apple slice was estimated under all measurement conditions using only one term of the simplified Fick’s equation. The data recorded in the first 300 min were included in the calculation of Deff. The values of Deff varied between 1.9 × 10⁻¹⁰ and 7.0 × 10⁻¹⁰ m2/s. Sacilik et al. [50] reported values between 2.27 × 10⁻¹⁰ and 4.97 × 10⁻¹⁰ m2/s for drying apple slices under conditions similar to those in this work. Comparable value of Deff at 45 °C and air relative humidity of 40% was also measured by Kaya et al. [45]. Figure 8 shows the effect of temperature and air velocity on the effective diffusion coefficient. Increasing the temperature and air velocity leads to more intensive diffusion of water and a higher Deff. From Figure 8, results show that the effect of air velocity is more significant at higher temperatures. Similar correlations were found by other authors [16,37,51].
An increase in the slice thickness led to an increased effective diffusion coefficient. However, as shown in the results from Figure 9, this increase is not linear. The diffusion coefficient is an intrinsic property of the material and it is not expected to change with its thickness; however, the effective diffusion coefficient is influenced by the process conditions. Smaller effects of slice thickness on Deff can be related to less significant effects of process conditions at higher thicknesses.
At 50 °C, with air velocity of 1.1 m/s and air relative humidity of 40–45%, the value of Deff was 4.68 × 10⁻¹⁰ m2/s; it increased to 4.93 × 10⁻¹⁰ and 6.16 × 10⁻¹⁰ m2/s when the air relative humidity decreased to 35–40% and 25–28%, respectively.

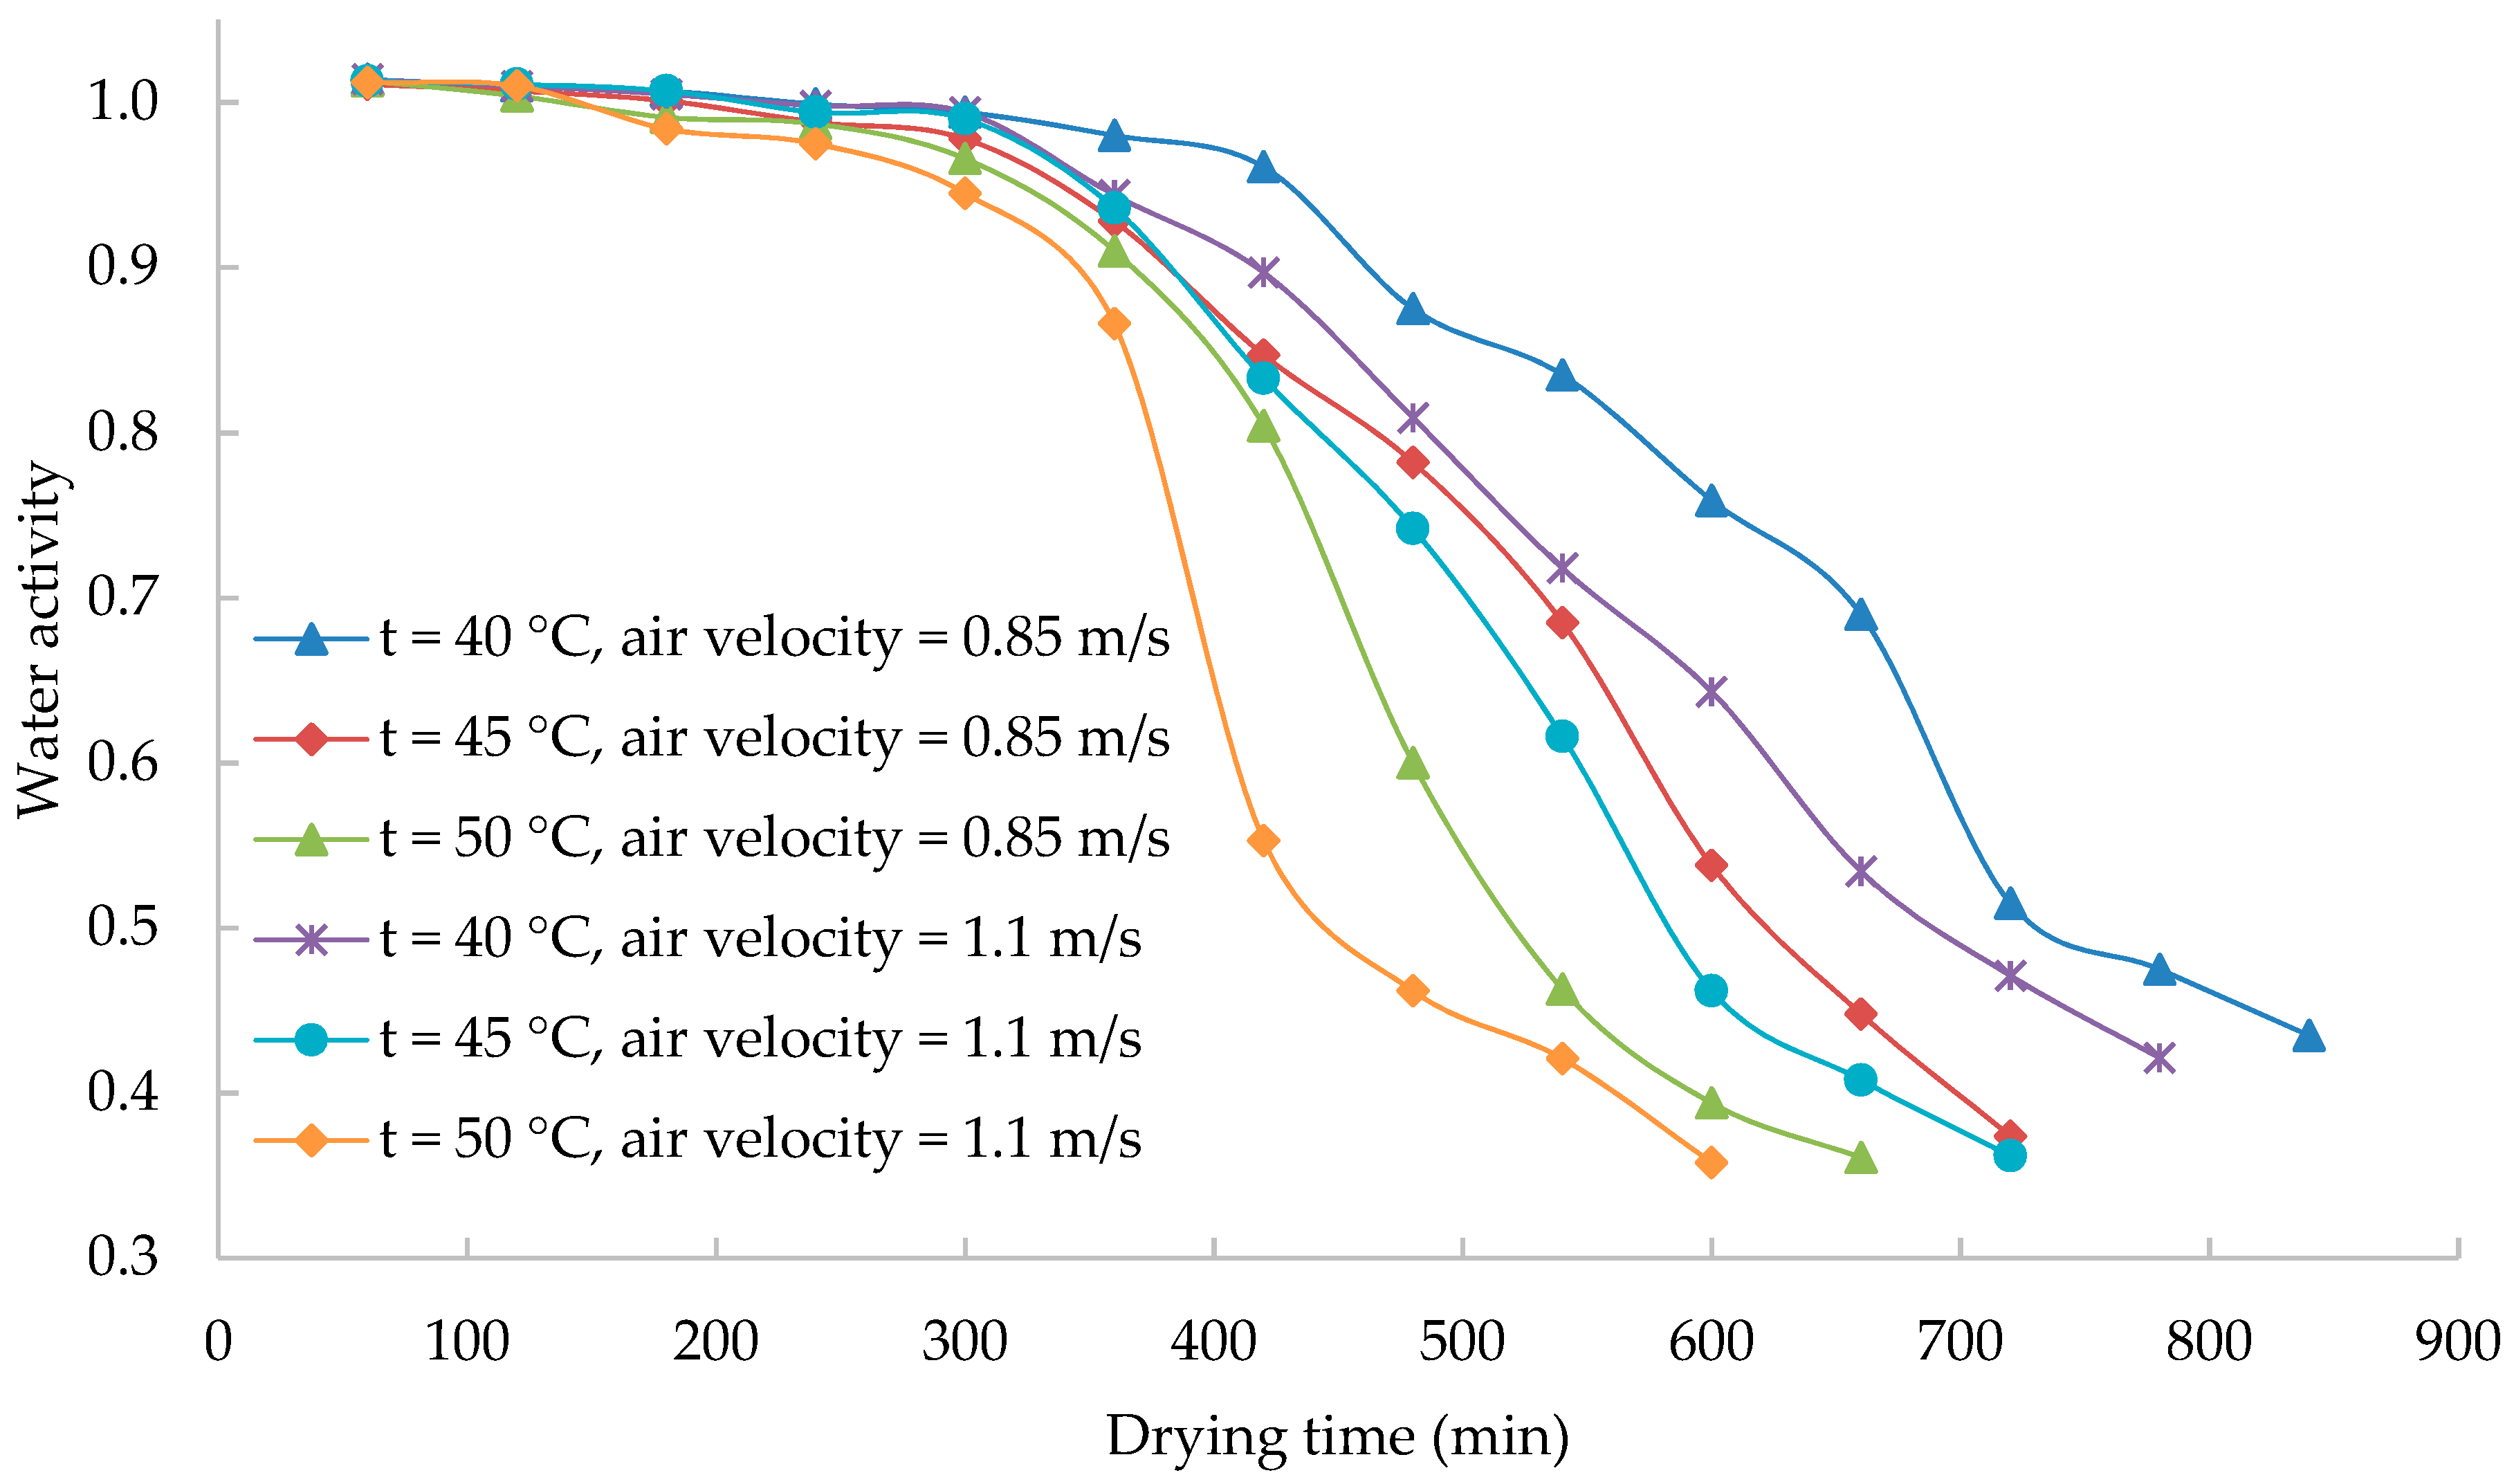
3.4. Water Activity Measurement

Water activity of the sample during the experiments at temperatures of 40, 45 and 50 °C and air velocities of 0.85 and 1.1 m/s for each temperature, was estimated. The measurements were done every 60 min during each experiment. As shown in Figure 10, during the initial drying phase when free water is evaporated from the slices, water activity remains practically constant. After the evaporation of the free water, the product water activity rapidly decreases. The rate of the value drop is higher at higher temperatures and higher air velocity because of faster water evaporation.
Water activity is an important parameter for drying time optimization and product preservation. Generally, water activity of 0.6 is considered to be a critical point with high potential for microbe growth [52]. Figure 10 shows that at high drying rates (high temperatures, high air velocities, low air relative humidity), a small change in the drying time can significantly influence the product water activity. Therefore, water activity of 0.45 was selected and the required drying time to reach the value of 0.45 ± 0.05 for all studied conditions was estimated. The results are presented in Table 7, Table 8 and Table 9. The shortest drying time (4.7 h) was recorded for 6 mm slices dried at 50 °C, with an air velocity of 1.1 m/s and an ambient air relative humidity range of 25–28%. The longest drying time with the same slice thickness was 13.33 h, which was recorded at 40 °C, with an air velocity 0.60 m/s and an air relative humidity range of 40–45%. Increasing of air temperature and air velocity leads to more intensive evaporation of water from the surface of apple slices; consequently it results in increased effective diffusion coefficient of water [15]. More intensive diffusion of water inside the slices and more intensive evaporation of water from the slice surface enables reaching the required water activity in a shorter time.
By increasing the slice thickness from 4 to 12 mm at 50 °C and with an air velocity of 1.1 m/s, the drying time increased from 5.23 to 14.3 h. A similar relation between drying time and slice thickness was found by [53]. Of course, the shortest drying time cannot be selected as the only objective function for process conditions optimization. The quality of the product, i.e., color, texture, taste etc., can be influenced by the process conditions [54]. However, optimal product water activity cannot only optimize the drying time but also many product quality parameters.

4. Conclusions

In the present study, apple slices were experimentally and mathematically studied under various conditions such as temperature, air flow rates, ambient air relative humidity, and slice thickness. The samples were dried from an initial moisture content of 86.7% to a moisture content of 20% (w.b), corresponding to product water activity of 0.45 ± 0.05. During the experiment, up to 96% of the total water content of apples was evaporated. By increasing the temperature in the drying chamber from 40 to 50 °C, at an air velocity of 1.1 m/s, the drying time decreased by about 300 min. By increasing the air velocity from 0.60 to 0.85 m/s, the drying time increased by about 100 min. The influence of the sample thickness was the most significant; by increasing the slice thickness from 4 to 12 mm, the time required to achieve 20% moisture content increased by more than 500 min. The effective diffusion coefficient of water in apple slices varied between 1.9 × 10⁻¹⁰ and 7.0 × 10⁻¹⁰ m2/s. During the initial drying phase when free water is evaporated, the water activity of the samples remains practically constant. After evaporation of free water, the water activity of the products rapidly decreases. At high drying rates, a small change in the drying time can significantly influence the value of the product’s water activity. A thin-layer model represented by a single equation valid for all process conditions described all 3780 experimental points with R2 = 0.9775, X2 = 0.002001 and MRSE = 0.04471.

Author Contributions

Conceptualization, M.J.R. and J.H.; methodology, M.J.R.; software, M.J.R.; validation, M.J.R., and A.W.N.; formal analysis, A.W.N.; investigation, M.J.R.; resources, J.H.; data curation, M.J.R.; writing—original draft preparation, M.J.R.; writing—review and editing, M.J.R. and J.H.; visualization, M.J.R. and A.W.N.; supervision, J.H.; project administration, J.H.; funding acquisition, J.H. All authors have read and agreed to the published version of the manuscript.

Funding

This work was supported by project APVV-15-0148 provided by the Slovak Research and Development Agency and it was realized thanks to the support of the SlovakAid projects SAMRS/AFG/2016/01/04 and SAMRS/AFG/2019/01/01.

Acknowledgments

The authors would like to thank the Kabul Polytechnic University, Faculty of Chemical Technology, Department of Food Technology for creating a suitable environment for this research to be realized.

Conflicts of Interest

The authors declare no conflict of interest. The funders had no role in the design of the study; in the collection, analyses, or interpretation of data; in the writing of the manuscript, or in the decision to publish the results.

References

  1. Pasban, A.; Sadrnia, H.; Mohebbi, M.; Shahidi, S.A. Spectral method for simulating 3D heat and mass transfer during drying of apple slices. J. Food Eng. 2017, 212, 201–212. [Google Scholar] [CrossRef]
  2. Tomic, N.; Djekic, I.; Zambon, A.; Spilimbergo, S.; Bourdoux, S.; Holtze, E.; Hofland, G.; Sut, S.; Dall’Acqua, S.; Smigic, N.; et al. Challenging chemical and quality changes of supercritical CO2 dried apple during long-term storage. LWT 2019, 110, 132–141. [Google Scholar] [CrossRef]
  3. Akharume, F.; Singh, K.; Jaczynski, J.; Sivanandan, L. Microbial shelf stability assessment of osmotically dehydrated smoky apples. LWT 2018, 90, 61–69. [Google Scholar] [CrossRef]
  4. Timoumi, S.; Mihoubi, D.; Zagrouba, F. Shrinkage, vitamin C degradation and aroma losses during infra-red drying of apple slices. LWT Food Sci. Technol. 2007, 40, 1648–1654. [Google Scholar] [CrossRef]
  5. Noori, A.W.; Royen, M.J.; Haydary, J. An active indirect solar system for food products drying. Acta Chim. Slovaca 2019, 12, 142–149. [Google Scholar] [CrossRef]
  6. Winiczenko, R.; Górnicki, K.; Kaleta, A.; Martynenko, A.; Janaszek-Mańkowska, M.; Trajer, J. Multi-objective optimization of convective drying of apple cubes. Comput. Electron. Agric. 2018, 145, 341–348. [Google Scholar] [CrossRef]
  7. Kwok, B.H.L.; Hu, C.; Durance, T.; Kitts, D.D. Dehydration techniques affect phytochemical contents and free radical scavenging activities of Saskatoon berries (Amelanchier alnifolia Nutt.). J. Food Sci. 2004, 69, SNQ122–SNQ126. [Google Scholar] [CrossRef]
  8. Wojdylo, A.; Figiel, A.; Oszmianski, J. Influence of temperature and time of apple drying on phenolic compounds content and their antioxidant activity. Pol. J. Food Nutr. Sci. 2007, 57, 601–605. [Google Scholar]
  9. Paunović, D.M.; Zlatković, B.P.; Mirković, D.D. Kinetics of drying and quality of the apple cultivars Granny Smith, Idared and Jonagold. J. Agric. Sci. Belgrade 2010, 55, 261–272. [Google Scholar] [CrossRef]
  10. Li, X.; Wu, X.; Bi, J.; Liu, X.; Li, X.; Guo, C. Polyphenols accumulation effects on surface color variation in apple slices hot air drying process. LWT 2019, 108, 421–428. [Google Scholar] [CrossRef]
  11. Antal, T.; Kerekes, B.; Sikolya, L.; Tarek, M. Quality and Drying Characteristics of Apple Cubes Subjected to Combined Drying (FD Pre-Drying and HAD Finish-Drying). J. Food Process. Preserv. 2015, 39, 994–1005. [Google Scholar] [CrossRef]
  12. Polat, A.; Taskin, O.; Izli, N.; Asik, B.B. Continuous and intermittent microwave-vacuum drying of apple: Drying kinetics, protein, mineral content, and color. J. Food Process Eng. 2019, 42, e13012. [Google Scholar] [CrossRef]
  13. Lewicki, P.P.; Jakubczyk, E. Effect of hot air temperature on mechanical properties of dried apples. J. Food Eng. 2004, 64, 307–314. [Google Scholar] [CrossRef]
  14. Toğrul, H. Simple modeling of infrared drying of fresh apple slices. J. Food Eng. 2005, 71, 311–323. [Google Scholar] [CrossRef]
  15. Wang, J.; Chao, Y. Drying characteristics of irradiated apple slices. J. Food Eng. 2002, 52, 83–88. [Google Scholar] [CrossRef]
  16. Velić, D.; Planinić, M.; Tomas, S.; Bilić, M. Influence of airflow velocity on kinetics of convection apple drying. J. Food Eng. 2004, 64, 97–102. [Google Scholar] [CrossRef]
  17. Vega-Gálvez, A.; Ah-Hen, K.; Chacana, M.; Vergara, J.; Martínez-Monzó, J.; García-Segovia, P.; Lemus-Mondaca, R.; Di Scala, K. Effect of temperature and air velocity on drying kinetics, antioxidant capacity, total phenolic content, colour, texture and microstructure of apple (var. Granny Smith) slices. Food Chem. 2012, 132, 51–59. [Google Scholar] [CrossRef] [Green Version]
  18. Nadian, M.H.; Rafiee, S.; Aghbashlo, M.; Hosseinpour, S.; Mohtasebi, S.S. Continuous real-time monitoring and neural network modeling of apple slices color changes during hot air drying. Food Bioprod. Process. 2015, 94, 263–274. [Google Scholar] [CrossRef]
  19. Celma, A.R.; Cuadros, F.; López-Rodríguez, F. Characterisation of industrial tomato by-products from infrared drying process. Food Bioprod. Process. 2009, 87, 282–291. [Google Scholar] [CrossRef]
  20. Aktaş, M.; Ceylan, İ.; Yilmaz, S. Determination of drying characteristics of apples in a heat pump and solar dryer. Desalination 2009, 239, 266–275. [Google Scholar] [CrossRef]
  21. Oforkansi, B.C.; Oduola, M.K. Mathematical model of thin-layer drying process in a plantain sample. Int. J. Eng. Res. 2016, 5, 364–366. [Google Scholar]
  22. Silva, F.P.D.; Siqueira, V.C.; Quinzani, G.A.; Martins, E.A.; Goneli, A.L. Drying kinetics of niger seeds. Eng. Agrícola 2017, 37, 727–738. [Google Scholar] [CrossRef] [Green Version]
  23. Seiiedlou, S.; Ghasemzadeh, H.R.; Hamdami, N.; Talati, F.; Moghaddam, M. Convective drying of apple: Mathematical modeling and determination of some quality parameters. Int. J. Agric. Biol. 2010, 12, 171–178. [Google Scholar]
  24. Akpinar, E.K. Drying of mint leaves in a solar dryer and under open sun: Modelling, performance analyses. Energy Convers. Manag. 2010, 51, 2407–2418. [Google Scholar] [CrossRef]
  25. Ando, Y.; Hagiwara, S.; Nabetani, H.; Sotome, I.; Okunishi, T.; Okadome, H.; Orikasa, T.; Tagawa, A. Effects of prefreezing on the drying characteristics, structural formation and mechanical properties of microwave-vacuum dried apple. J. Food Eng. 2019, 244, 170–177. [Google Scholar] [CrossRef]
  26. Royen, M.J.; Noori, A.W.; Haydary, J. Batch drying of sliced tomatoes at specific ambient conditions. Acta Chim. Slovaca 2018, 11, 134–140. [Google Scholar] [CrossRef] [Green Version]
  27. Shahari, N.A. Mathematical Modelling of Drying Food Products: Application to Tropical Fruits. Ph.D. Thesis, University of Nottingham, Nottingham, UK, 2012. [Google Scholar]
  28. Younis, M.; Abdelkarim, D.; El-Abdein, A.Z. Kinetics and mathematical modeling of infrared thin-layer drying of garlic slices. Saudi J. Biol. Sci. 2018, 25, 332–338. [Google Scholar] [CrossRef]
  29. Mariem, S.B.; Mabrouk, S.B.; Khan, M. Drying characteristics of tomato slices and mathematical modeling. Int. J. Energy Eng. 2014, 4, 17–24. [Google Scholar]
  30. Akpinar, E.K.; Bicer, Y. Mathematical modelling of thin layer drying process of long green pepper in solar dryer and under open sun. Energy Convers. Manag. 2008, 49, 1367–1375. [Google Scholar] [CrossRef]
  31. Sacilik, K.; Keskin, R.; Elicin, A.K. Mathematical modelling of solar tunnel drying of thin layer organic tomato. J. Food Eng. 2006, 73, 231–238. [Google Scholar] [CrossRef]
  32. Doymaz, İ. Effect of citric acid and blanching pre-treatments on drying and rehydration of Amasya red apples. Food Bioprod. Process. 2010, 88, 124–132. [Google Scholar] [CrossRef]
  33. Chen, Q.; Bi, J.; Wu, X.; Yi, J.; Zhou, L.; Zhou, Y. Drying kinetics and quality attributes of jujube (Zizyphus jujuba Miller) slices dried by hot-air and short-and medium-wave infrared radiation. LWT Food Sci. Technol. 2015, 64, 759–766. [Google Scholar] [CrossRef]
  34. Kaleta, A.; Górnicki, K.; Winiczenko, R.; Chojnacka, A. Evaluation of drying models of apple (var. Ligol) dried in a fluidized bed dryer. Energy Convers. Manag. 2013, 67, 179–185. [Google Scholar] [CrossRef]
  35. Lertworasirikul, S. Drying kinetics of semi-finished cassava crackers: A comparative study. LWT Food Sci. Technol. 2008, 41, 1360–1371. [Google Scholar] [CrossRef]
  36. Lahsasni, S.; Kouhila, M.; Mahrouz, M.; Jaouhari, J.T. Drying kinetics of prickly pear fruit (Opuntia ficus indica). J. Food Eng. 2004, 61, 173–179. [Google Scholar] [CrossRef]
  37. Atalay, H.; Coban, M.T.; Kıncay, O. Modeling of the drying process of apple slices: Application with a solar dryer and the thermal energy storage system. Energy 2017, 134, 382–391. [Google Scholar] [CrossRef]
  38. Wang, Z.; Sun, J.; Liao, X.; Chen, F.; Zhao, G.; Wu, J.; Hu, X. Mathematical modeling on hot air drying of thin layer apple pomace. Food Res. Int. 2007, 40, 39–46. [Google Scholar] [CrossRef]
  39. Babetto, A.C.; Freire, F.B.; Barrozo, M.A.S.; Freire, J.T. Drying of garlic slices: Kinetics and nonlinearity measures for selecting the best equilibrium moisture content equation. J. Food Eng. 2011, 107, 347–352. [Google Scholar] [CrossRef]
  40. Menlik, T.; Özdemir, M.B.; Kirmaci, V. Determination of freeze-drying behaviors of apples by artificial neural network. Expert Syst. Appl. 2010, 37, 7669–7677. [Google Scholar] [CrossRef]
  41. Assis, F.R.; Rodrigues, L.G.G.; Tribuzi, G.; de Souza, P.G.; Carciofi, B.A.M.; Laurindo, J.B. Fortified apple (Malus spp., var. Fuji) snacks by vacuum impregnation of calcium lactate and convective drying. LWT 2019, 113, 108298. [Google Scholar] [CrossRef]
  42. Haydary, J.; Steltenpohl, P. Chemical Engineering II, 1st ed.; Ministry of higher education of Afghanistan: Kabul, Afghanistan, 2015. [Google Scholar]
  43. Corzo, O.; Bracho, N.; Alvarez, C. Water effective diffusion coefficient of mango slices at different maturity stages during air drying. J. Food Eng. 2008, 87, 479–484. [Google Scholar] [CrossRef]
  44. Fernando, W.J.N.; Low, H.C.; Ahmad, A.L. Dependence of the effective diffusion coefficient of moisture with thickness and temperature in convective drying of sliced materials. A study on slices of banana, cassava and pumpkin. J. Food Eng. 2011, 102, 310–316. [Google Scholar] [CrossRef]
  45. Kaya, A.; Aydın, O.; Demirtaş, C. Drying kinetics of red delicious apple. Biosyst. Eng. 2007, 96, 517–524. [Google Scholar] [CrossRef]
  46. Gómez-Daza, J.C.; Ochoa-Martínez, C.I. Kinetic aspects of a dried thin layer carrot in a heat pump dryer. Dyna 2016, 83, 16–20. [Google Scholar] [CrossRef]
  47. Mohamed, L.A.; Kane, C.E.; Kouhila, M.; Jamali, A.; Mahrouz, M.; Kechaou, N. Thin layer modelling of Gelidium sesquipedale solar drying process. Energy Convers. Manag. 2008, 49, 940–946. [Google Scholar] [CrossRef]
  48. Akoy, E.O.M. Experimental characterization and modeling of thin-layer drying of mango slices. Int. Food Res. J. 2014, 21, 1911–1917. [Google Scholar]
  49. Doymaz, I. Air-drying characteristics of tomatoes. J. Food Eng. 2007, 78, 1291–1297. [Google Scholar] [CrossRef]
  50. Sacilik, K.; Elicin, A.K. The thin layer drying characteristics of organic apple slices. J. Food Eng. 2006, 73, 281–289. [Google Scholar] [CrossRef]
  51. Schössler, K.; Jäger, H.; Knorr, D. Effect of continuous and intermittent ultrasound on drying time and effective diffusivity during convective drying of apple and red bell pepper. J. Food Eng. 2012, 108, 103–110. [Google Scholar] [CrossRef]
  52. Zeuthen, P.; Bøgh-Sørensen, L. (Eds.) Food Preservation Techniques; Woodhead Publishing Limited: Cambridge, UK, 2003. [Google Scholar]
  53. Akpinar, E.K.; Bicer, Y.; Midilli, A.D.N.A.N. Modeling and experimental study on drying of apple slices in a convective cyclone dryer. J. Food Process Eng. 2003, 26, 515–541. [Google Scholar] [CrossRef]
  54. Nowak, D.; Lewicki, P.P. Quality of infrared dried apple slices. Dry. Technol. 2005, 23, 831–846. [Google Scholar] [CrossRef]
Figure 1. Sample preparation: (a) a sample batch with 6 mm apple slices, and (b) slices with different thicknesses.
Processes 08 01562 g001
Figure 2. Batch laboratory tray dryer scheme: 1—stainless steel tunnel, 2—axial-flow fan feeding air into the tunnel, 3—heating elements, 4—heating element temperature sensor, 5—temperature sensors before air heating, 6—temperature sensors after air heating, 7—temperature sensors for the air leaving the tunnel, 8—drying trays and 9—balance load cell-force.
Processes 08 01562 g002
Figure 3. Effect of air velocity on dry basis moisture content (X).
Processes 08 01562 g003
Figure 4. Effect of temperature on dry basis moisture content (X).
Processes 08 01562 g004
Figure 5. Effect of air relative humidity.
Processes 08 01562 g005
Figure 6. Effect of slice thickness.
Processes 08 01562 g006
Figure 7. Comparison of experimental and calculated MR (45 °C, 0.20 m/s 6 mm): (a)-Page model, (b)-Newton (Lewis) model and (c)-Henderson and Pabis model.
Processes 08 01562 g007
Figure 8. Effective diffusion coefficient vs. temperature and air velocity.
Processes 08 01562 g008
Figure 9. Effective diffusion coefficient vs. slice thickness.
Processes 08 01562 g009
Figure 10. Variation of water activity versus drying time at different temperatures and air velocities.
Processes 08 01562 g010
Table 1. List of experimental runs.
No. of Run Temperature (°C)Air Velocity (m/s)Thickness (mm)Air relative Humidity (%)
1400.60640–45
2400.85640–45
3401.10640–45
4450.60640–45
5450.85640–45
6451.10640–45
7500.60640–45
8500.85640–45
9501.10640–45
Effect of thickness
10501.10435–38
11501.10635–38
12501.10835–38
13501.101035–38
14501.101235–38
Effect of air relative humidity
15501.10625–28
16501.10635–38
17501.10640–45
Runs for water activity measurement
18400.85640–45
19450.85640–45
20500.85640–45
21401.10640–45
22451.10640–45
23501.10640–45
Table 2. Thin-layer empirical models considered in this work.
No.Model NameModelReference
1Newton (Lewis) M R = E x p ( k t ) [19,31]
2Page M R = E x p ( k t n ) [32,33]
3Modified Page M R = E x p [ ( k t ) n ] [34,35]
4Logarithmic M R = a   E x p ( k t ) + c [23,36]
5Henderson and Pabis M R = a   E x p ( k t ) [37,38]
Table 3. Summary of the regression analysis of apple slices with a 6 mm thickness.
ModelDrying Temperature (°C)Air flow Velocity
(m/s)
Drying Constant
(k)
Drying Coefficient
(n, a, c)
R2X2RMSE
Newton400.600.00336-0.972960.002420.04908
450.600.00382-0.962030.003510.05917
500.600.00479-0.965150.003130.05586
Page400.600.000491.328690.998170.000160.01278
450.600.000401.395380.995490.000420.02039
500.600.000601.378920.996430.000320.01788
Modified Page400.600.002891.163680.972960.002420.04908
450.600.003081.239680.962030.000980.05917
500.600.003451.388420.965150.003140.05586
Logarithmic400.600.003711.105630.984340.001410.03736
450.600.004231.111390.974980.002330.04803
500.600.005311.110410.977760.002010.04462
Henderson and Pabis400.600.003711.105650.984340.001400.03736
450.600.004231.111390.974980.002320.04803
500.600.005311.110410.977760.002010.04462
Newton400.850.00380-0.985400.066750.03117
450.850.00520-0.974070.002360.04846
500.850.00558-0.966170.003170.05619
Page400.850.001201.200960.998950.000070.00834
450.850.000831.337310.998480.000140.01174
500.850.000721.383140.996580.000320.01788
Modified Page400.850.003071.236180.805330.000980.03117
450.850.003591.446980.974070.002360.04846
500.850.003721.498870.966170.003180.05619
Logarithmic400.850.004061.069450.993040.000470.02152
450.850.005751.113110.985420.001330.03635
500.850.006181.114590.978400.002040.04490
Henderson and Pabis400.850.004061.069450.993040.000470.02152
450.850.005751.113110.985420.001330.03635
500.850.006181.114590.978400.002030.04490
Newton401.100.00412-0.984710.001250.03532
451.100.00521-0.979480.001770.04198
501.100.00642-0.968240.002660.05148
Page401.100.001051.252300.994420.000460.02133
451.100.001241.263710.996870.000270.01638
501.100.001091.341410.995220.000400.01998
Modified Page401.100.003281.318410.982450.001440.03785
451.100.003601.448490.979480.001780.04198
501.100.003991.607180.968240.002680.05148
Logarithmic401.100.004631.074140.986930.001080.03266
451.100.005641.083960.986520.001170.03403
501.100.007071.104810.979720.001720.04113
Henderson and Pabis401.100.004631.074120.986920.001070.03267
451.100.005641.083960.986520.001170.03403
501.100.007071.104800.979720.001710.04113
Table 4. Summary of the regression analysis of apple slices with 4, 6, 8, 10 and 12 mm thicknesses at 50 °C and air flow velocity 1.1 m/s.
ModelThickness
(mm)
Drying Constant
(k)
Drying Coefficient
(n, a, c)
R2X2RMSE
Newton40.00725-0.959700.003660.06029
60.00644-0.967970.002880.05355
80.00540-0.980940.001630.04036
100.00417-0.978790.001750.04172
120.00330-0.967460.002880.05362
Page40.000971.400990.994730.000480.02180
60.001101.341780.995340.000420.02042
80.001381.252620.996940.000260.01617
100.001181.223200.992100.000650.02546
120.000561.301520.988860.000990.03137
Modified Page40.004981.455330.959700.003680.06029
60.004001.610580.967970.002900.05355
80.003661.473810.980940.001640.04036
100.003221.295770.978790.001750.04172
120.002861.152240.967460.002890.05362
Logarithmic40.008041.106550.973040.002480.04931
60.007111.102730.979600.001860.04274
80.005821.082080.987480.001080.03270
100.004401.056940.982330.001460.03808
120.003571.085470.974690.002250.04729
Henderson and Pabis40.008041.106550.973040.002460.04931
60.007111.102730.979600.001850.04274
80.005821.082080.987480.001080.03270
100.004401.056940.982330.001460.03808
120.003571.085470.974690.002250.04729
Table 5. Summary of the regression analysis of apple slices at 50 °C and air flow velocity of 1.1 m/s and three ranges of ambient relative humidity.
ModelRelative Humidity (%)Drying Constant
(k)
Drying Coefficient
(n, a, c)
R2X2RMSE
Newton25–280.00823-0.971140.002480.04962
35–380.00668-0.975230.002200.04672
40–450.00642-0.968240.002660.05148
Page25–280.001981.290420.992310.000670.02561
35–380.001411.306520.997750.000200.01407
40–450.001091.341410.995220.000400.01998
Modified Page25–280.004521.820000.971140.002500.04962
35–380.004071.640220.975230.002210.04672
40–450.003991.607180.968240.002680.05148
Logarithmic25–280.008881.076750.978390.001880.04294
35–380.007321.090080.985030.001340.03631
40–450.007071.104810.979720.001720.04113
Henderson and Pabis25–280.008881.076760.978390.001870.04294
35–380.007321.090070.985030.001330.03631
40–450.007071.104800.979720.001710.04113
Table 6. Parameters and statistical analysis of the model developed in this work (Haydary).
ModelDrying
Temperature Range
(°C)
Air velocity Range
(m/s)
Thickness Range
(mm)
Air relative Humidity Range
(%)
Haydary40–500.6–1.14–1227.5–42.5
Tmin
(°C)
vmin
(m/s)
dmin
(mm)
φmin
(%)
400.6427.5
kpnr
0.0013571.2872930.722860.018861
R2X2RMSE-
0.9774960.0020010.044714-
Table 7. Effect of air temperature and air flow velocity on the drying time.
Exp. RunTemperature (°C)Air Velocity m/sThickness (mm)Relative Humidity (%)Drying Time (h)
1400.60640–4513.33
2450.60640–4511.10
3500.60640–459.00
4400.85640–4512.20
5450.85640–4510.07
6500.85640–458.67
7401.10640–4511.57
8451.10640–459.36
9501.10640–456.90
Table 8. Effect of thickness on the drying time.
Exp. RunTemperature (°C)Air Velocity m/sThickness (mm)Relative Humidity (%)Drying Time (h)
1501.101235–3814.57
2501.101035–3811.23
3501.10835–389.40
4501.10635–386.40
5501.10435–385.23
Table 9. Effect of air relative humidity on the drying time.
No.Temperature (°C)Air Velocity m/sThickness (mm)Relative Humidity (%)Drying Time (h)
1501.10640–456.90
2501.10635–385.53
3501.10625–284.70
Publisher’s Note: MDPI stays neutral with regard to jurisdictional claims in published maps and institutional affiliations.

