Modeling and Optimization for Konjac Vacuum Drying Based on Response Surface Methodology (RSM) and Artificial Neural Network (ANN)

Abstract
:1. Introduction
2. Materials and Methods
2.1. Sample Preparation
2.2. Equipment and Procedure Description
2.3. The Key Indexes of the Konjac Vacuum Drying
2.3.1. Drying Time
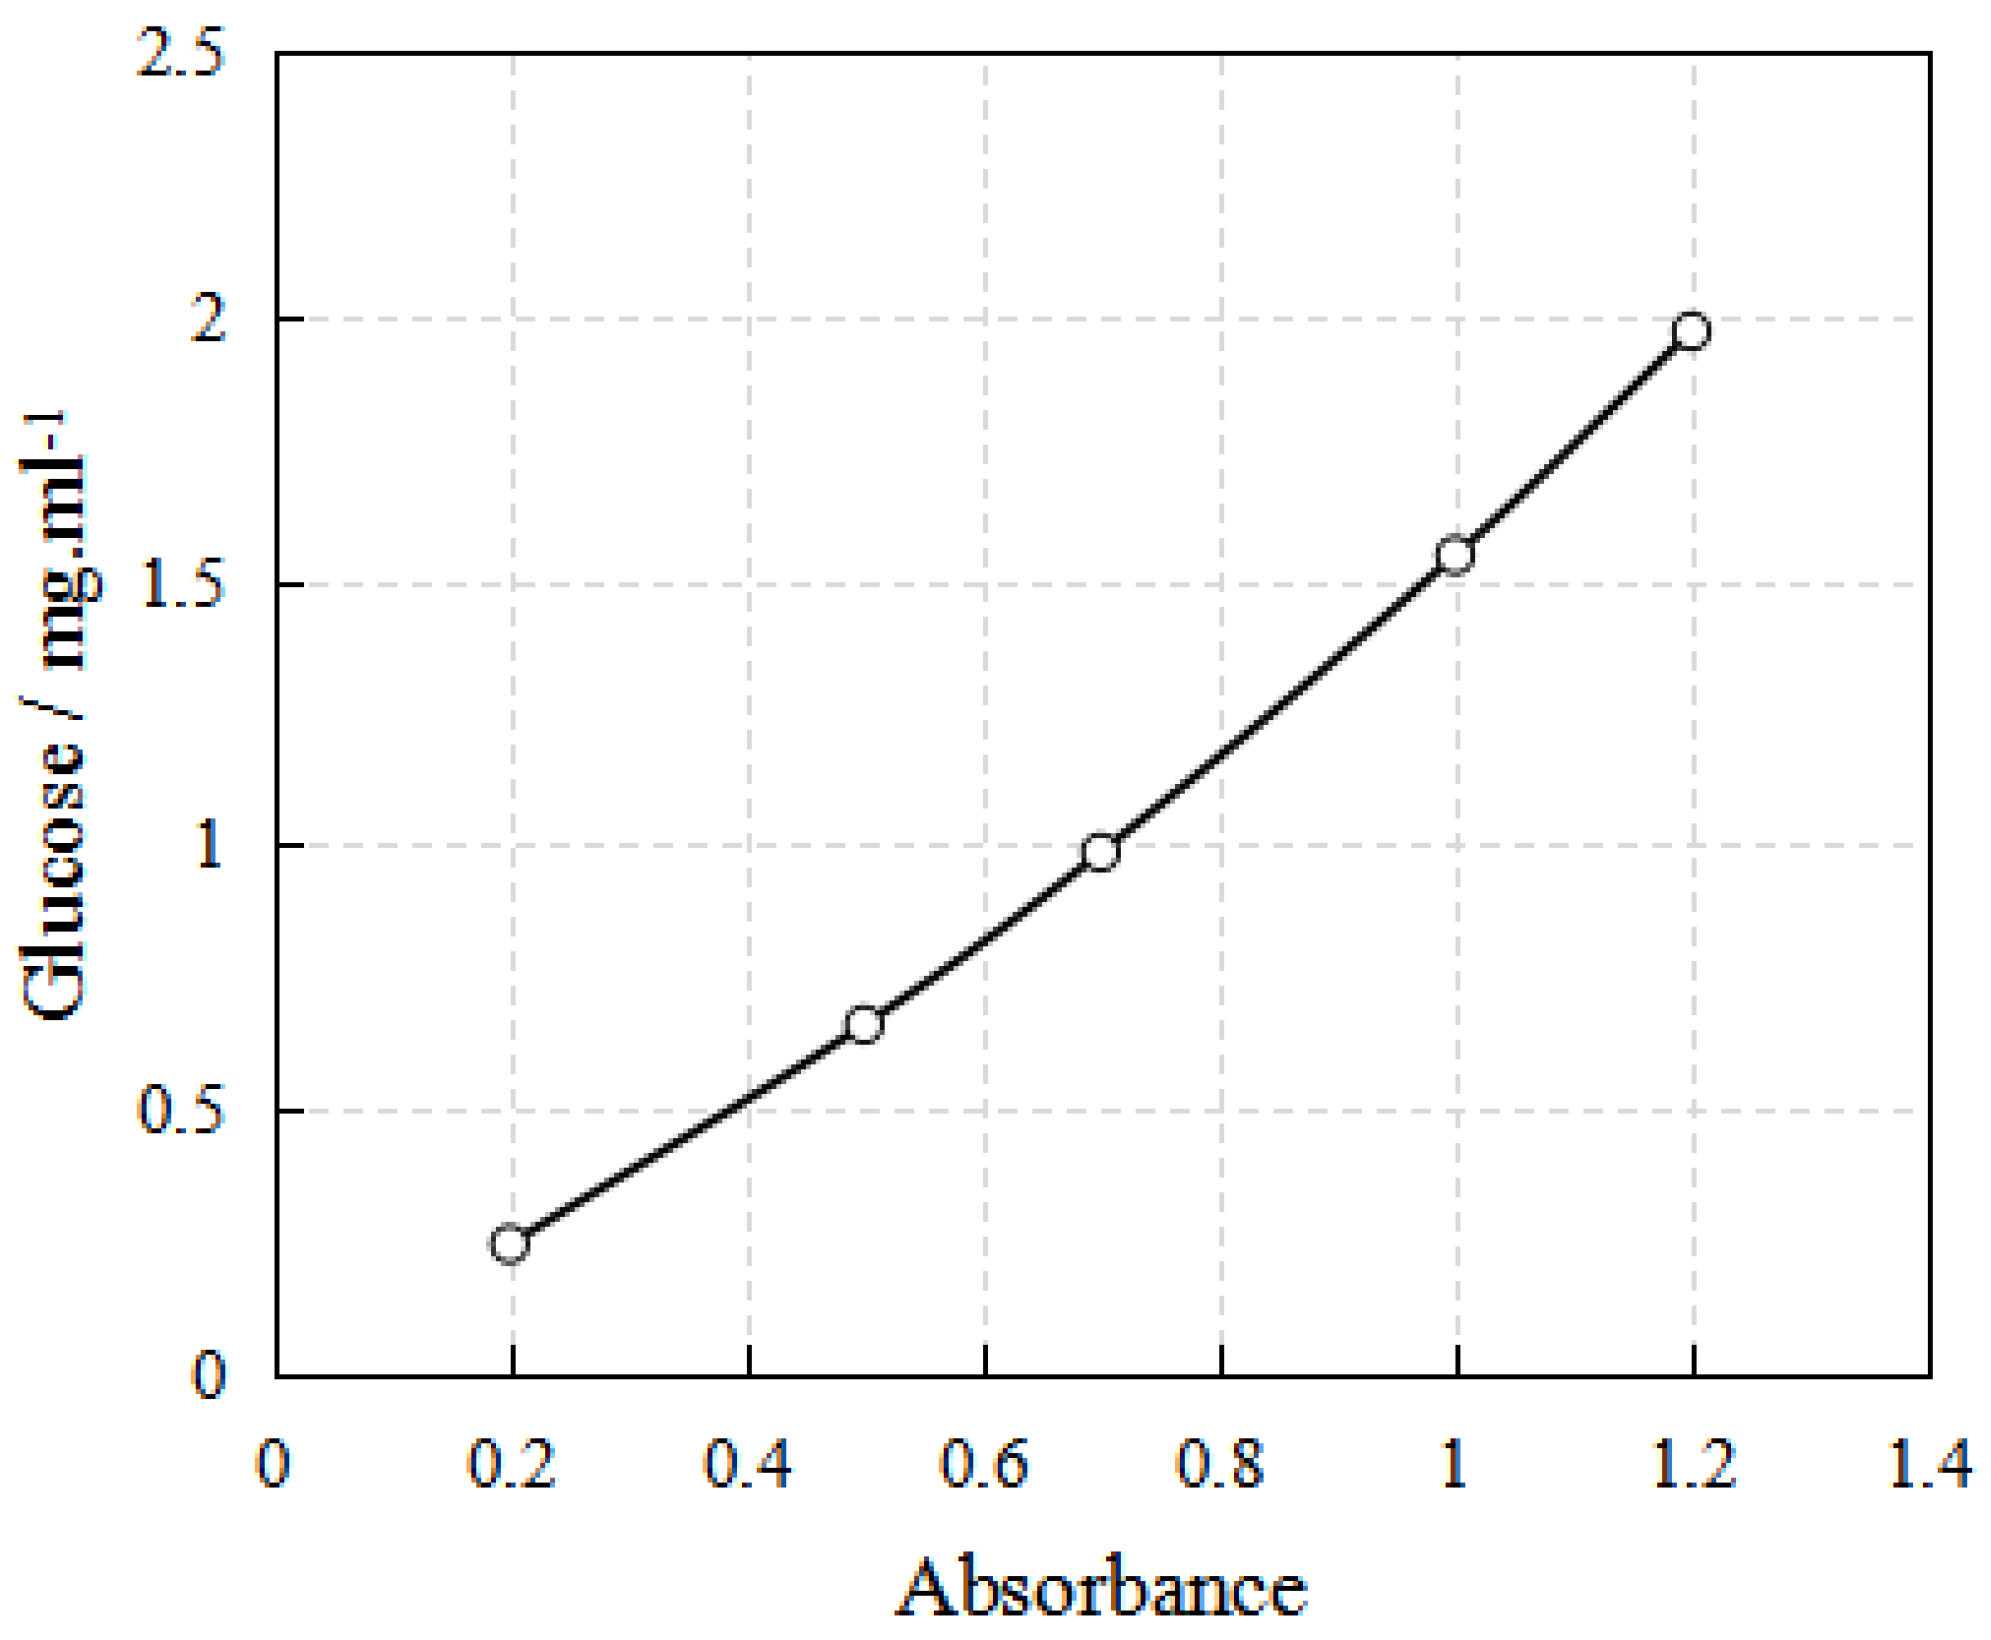
2.3.2. Konjac Glucomannan
2.3.3. Whiteness Index
2.4. Experimental Design
2.4.1. Response Surface Methodology
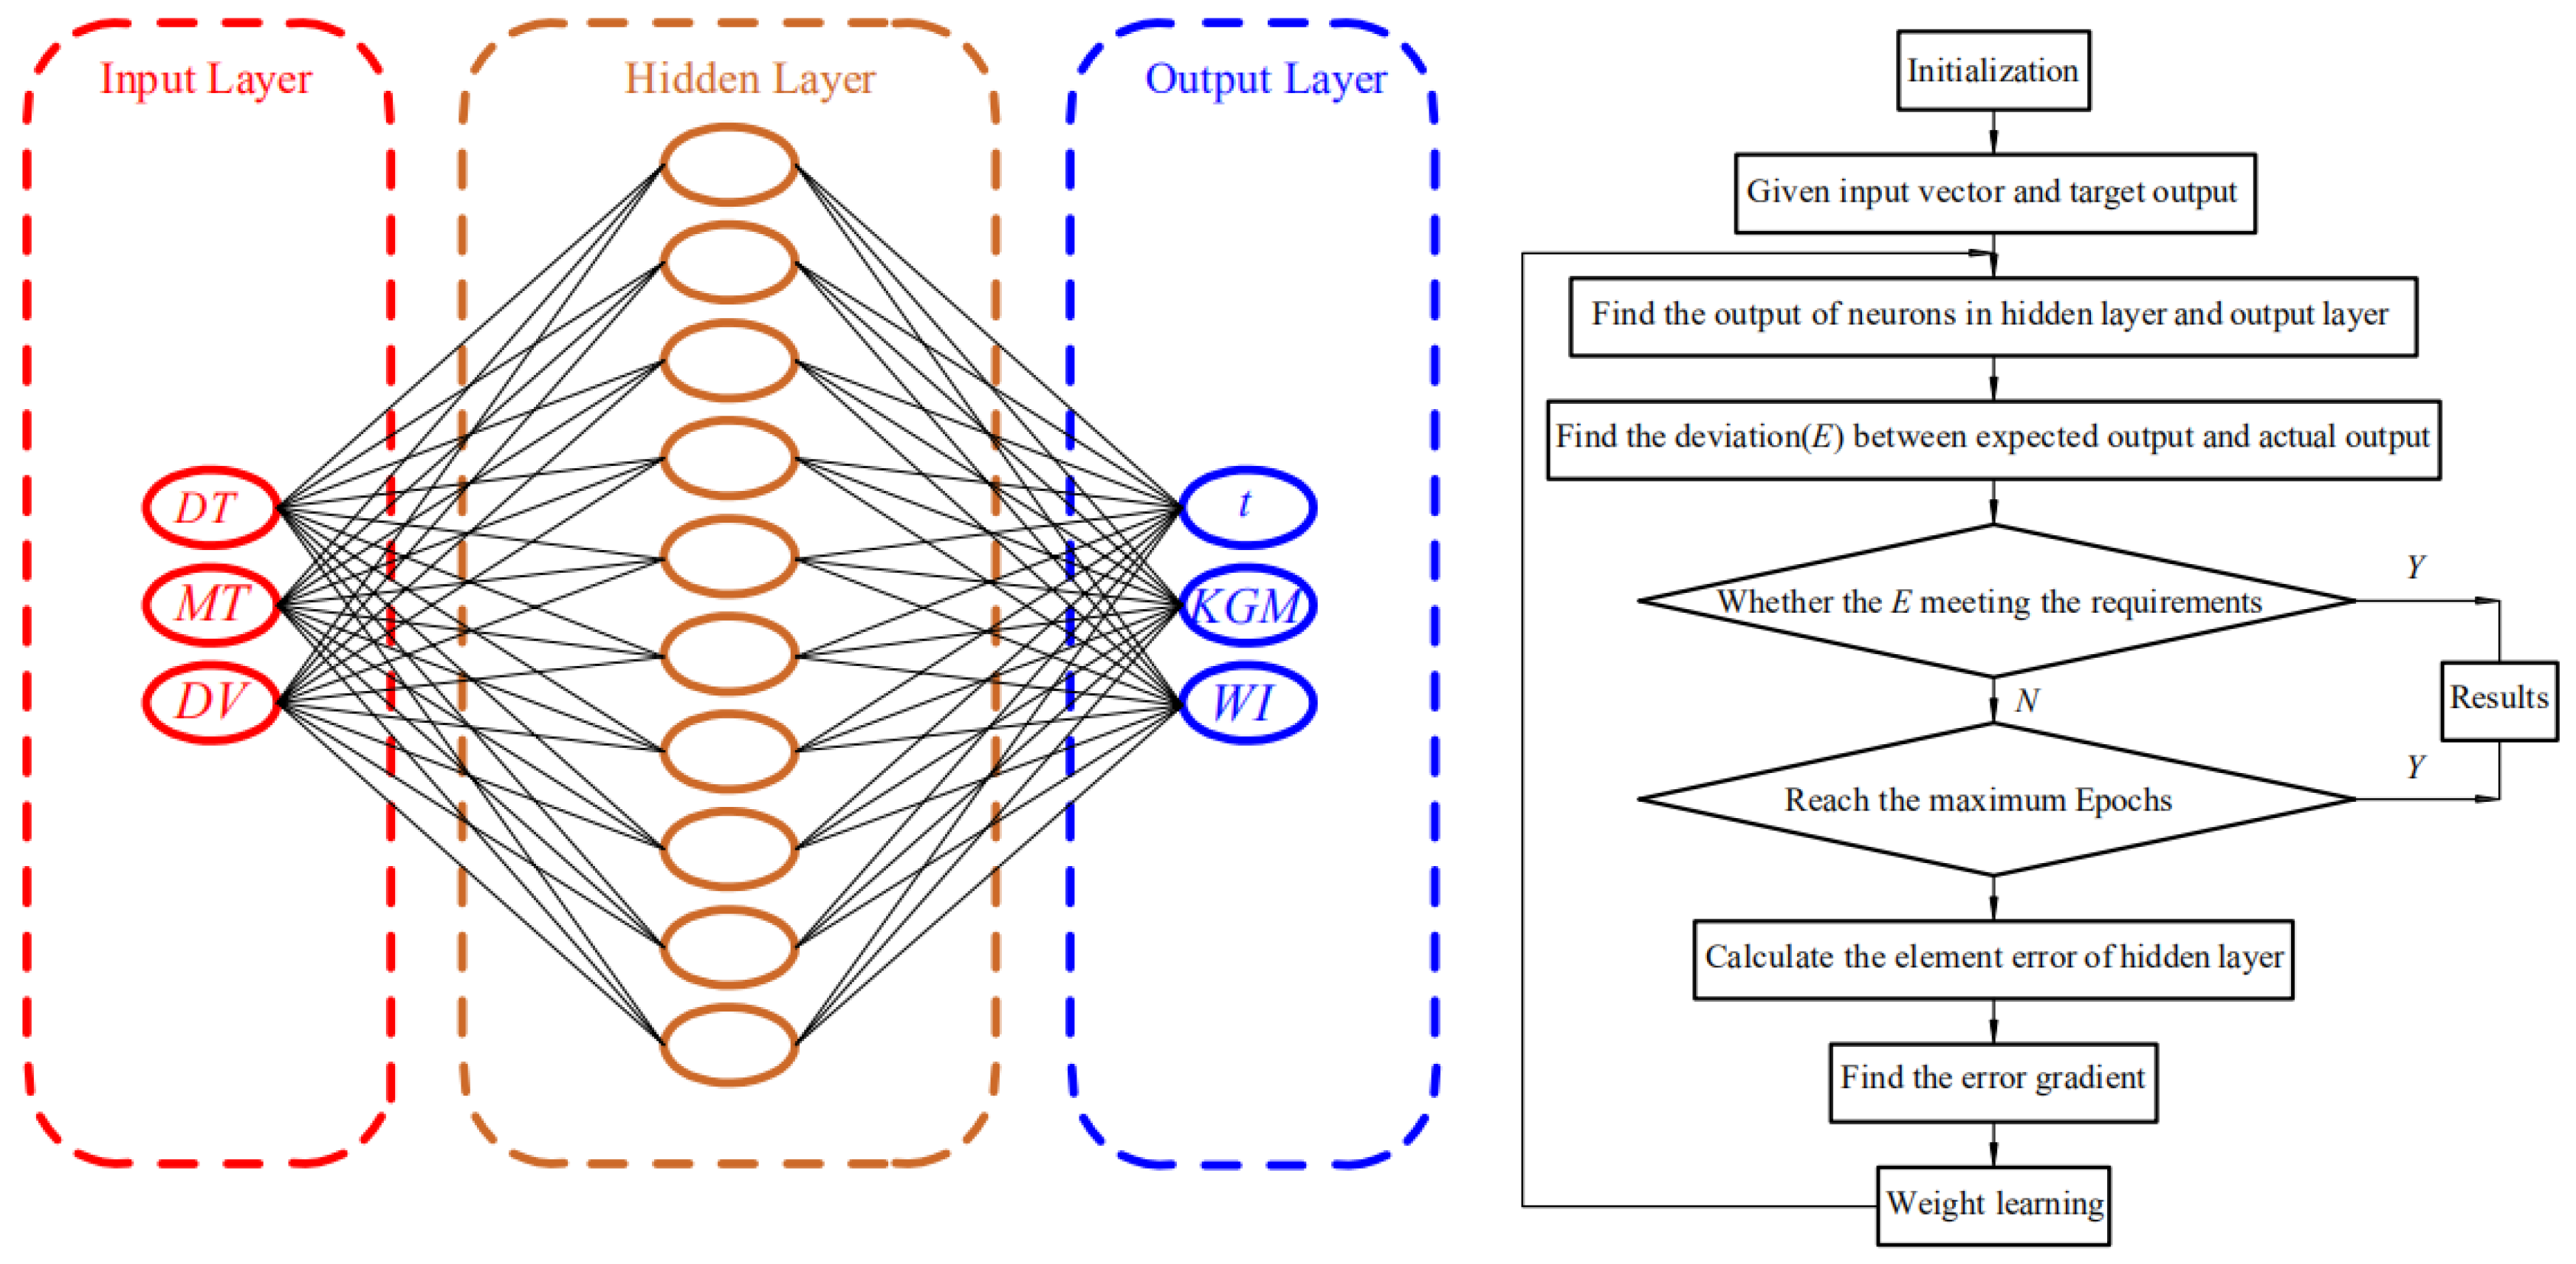
2.4.2. Artificial Neural Network Modeling
2.5. Statistical Analysis
3. Results
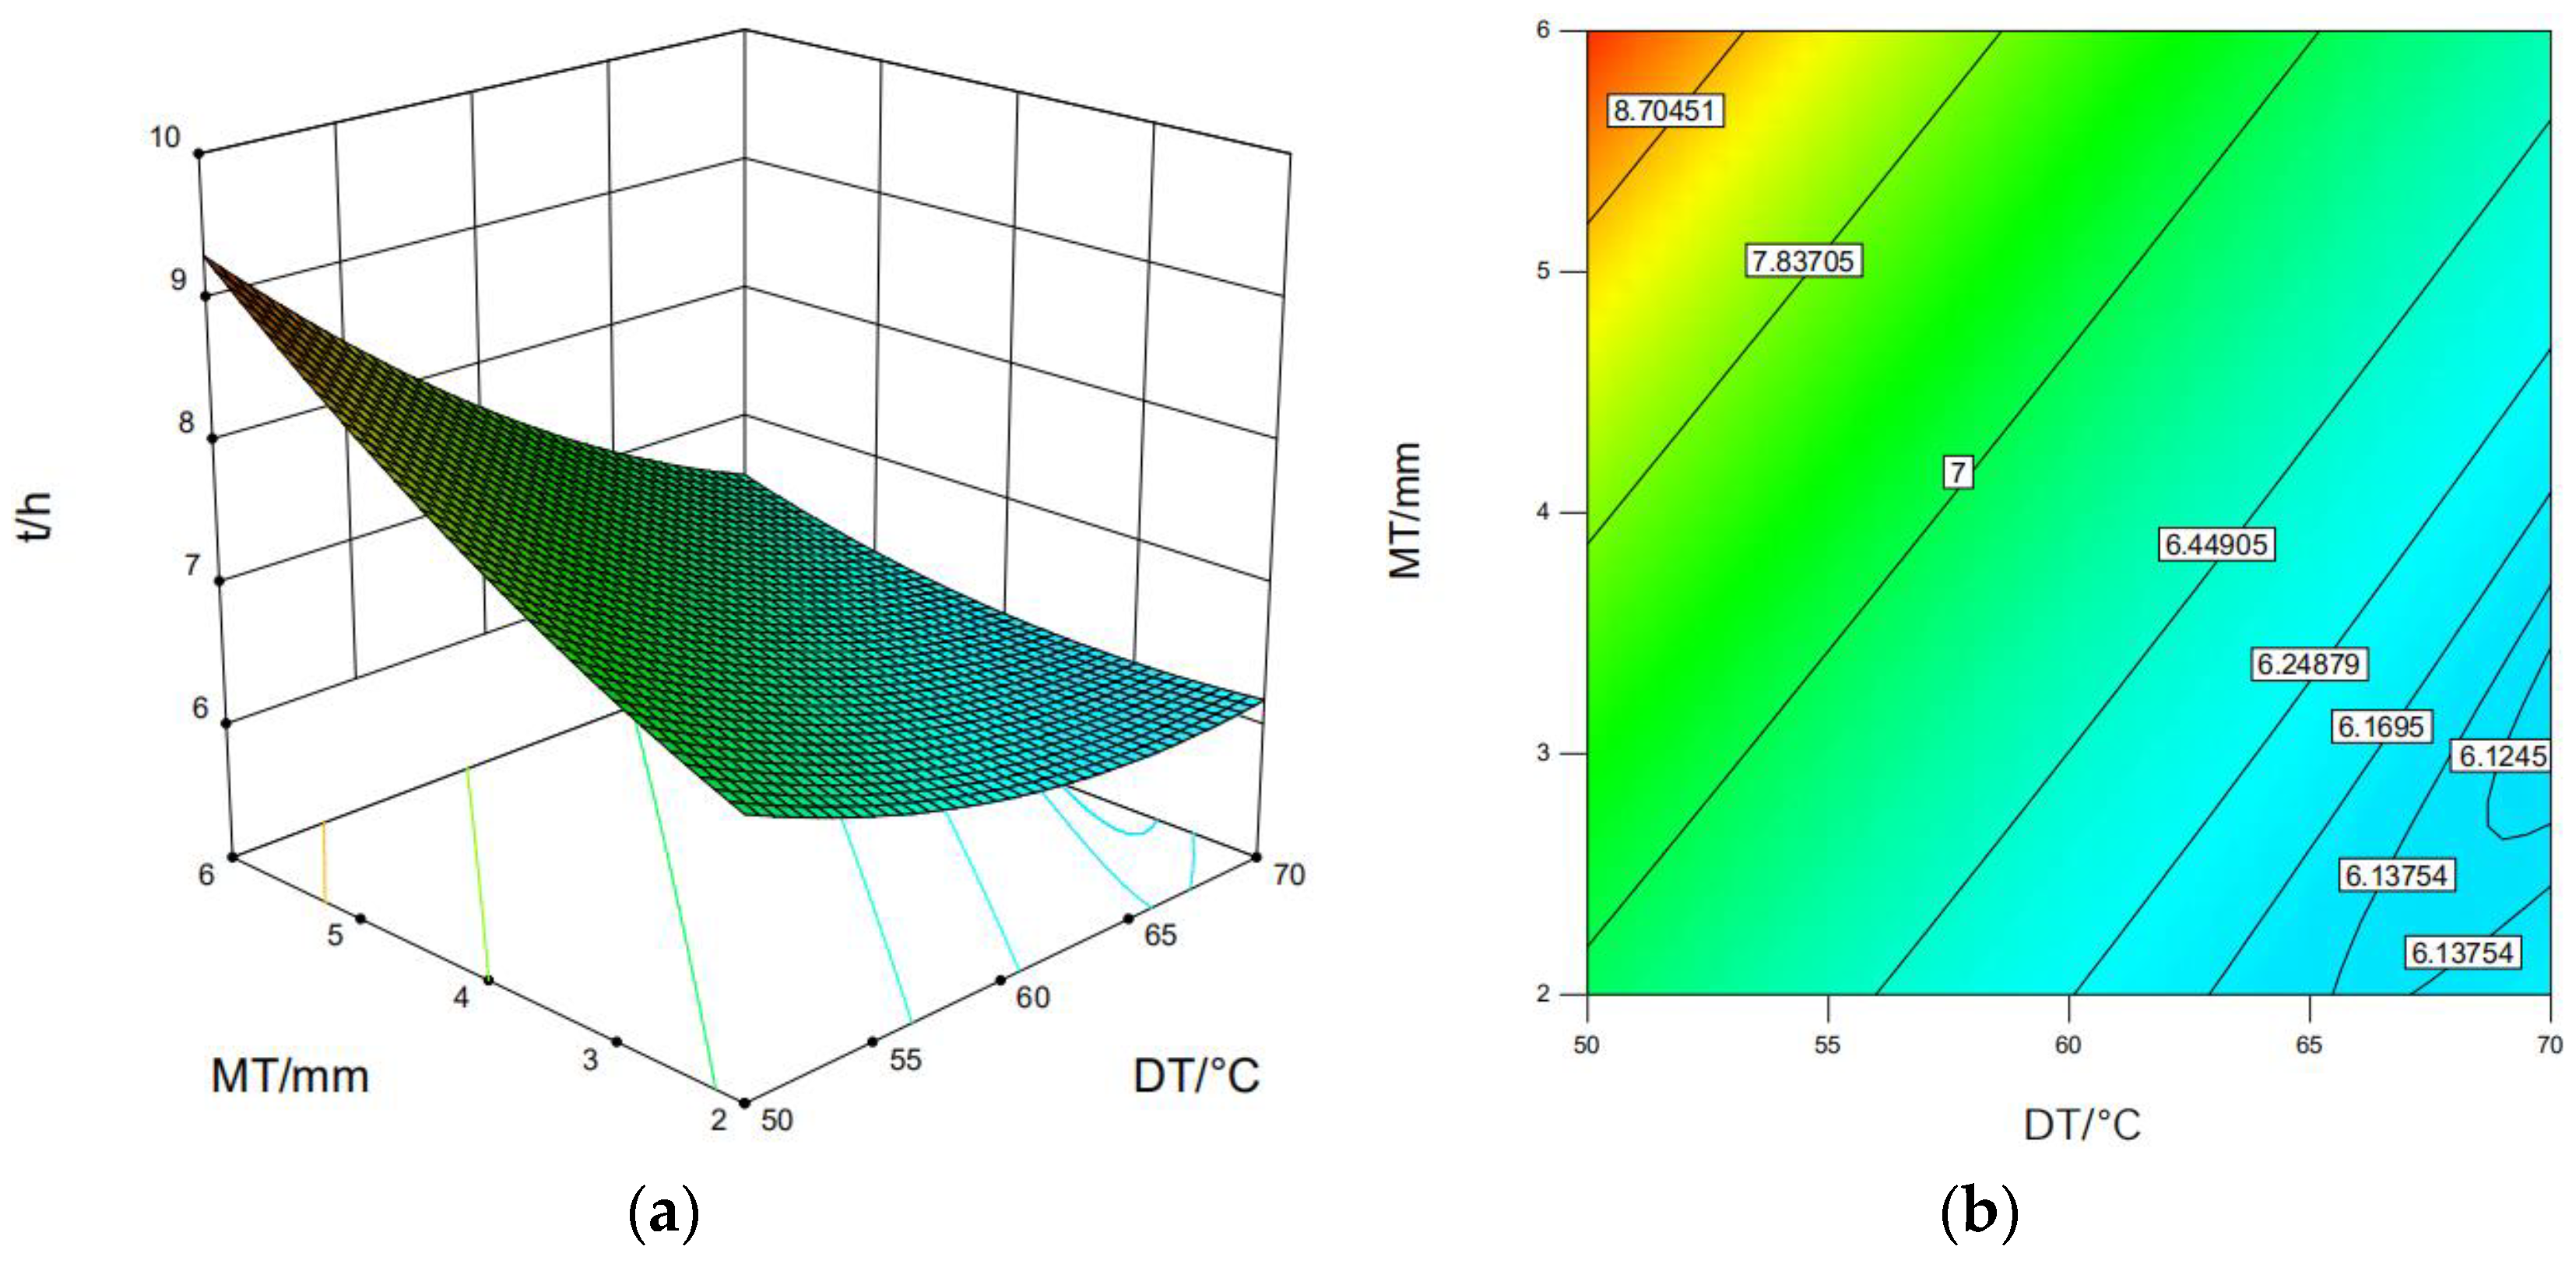
3.1. Drying Time
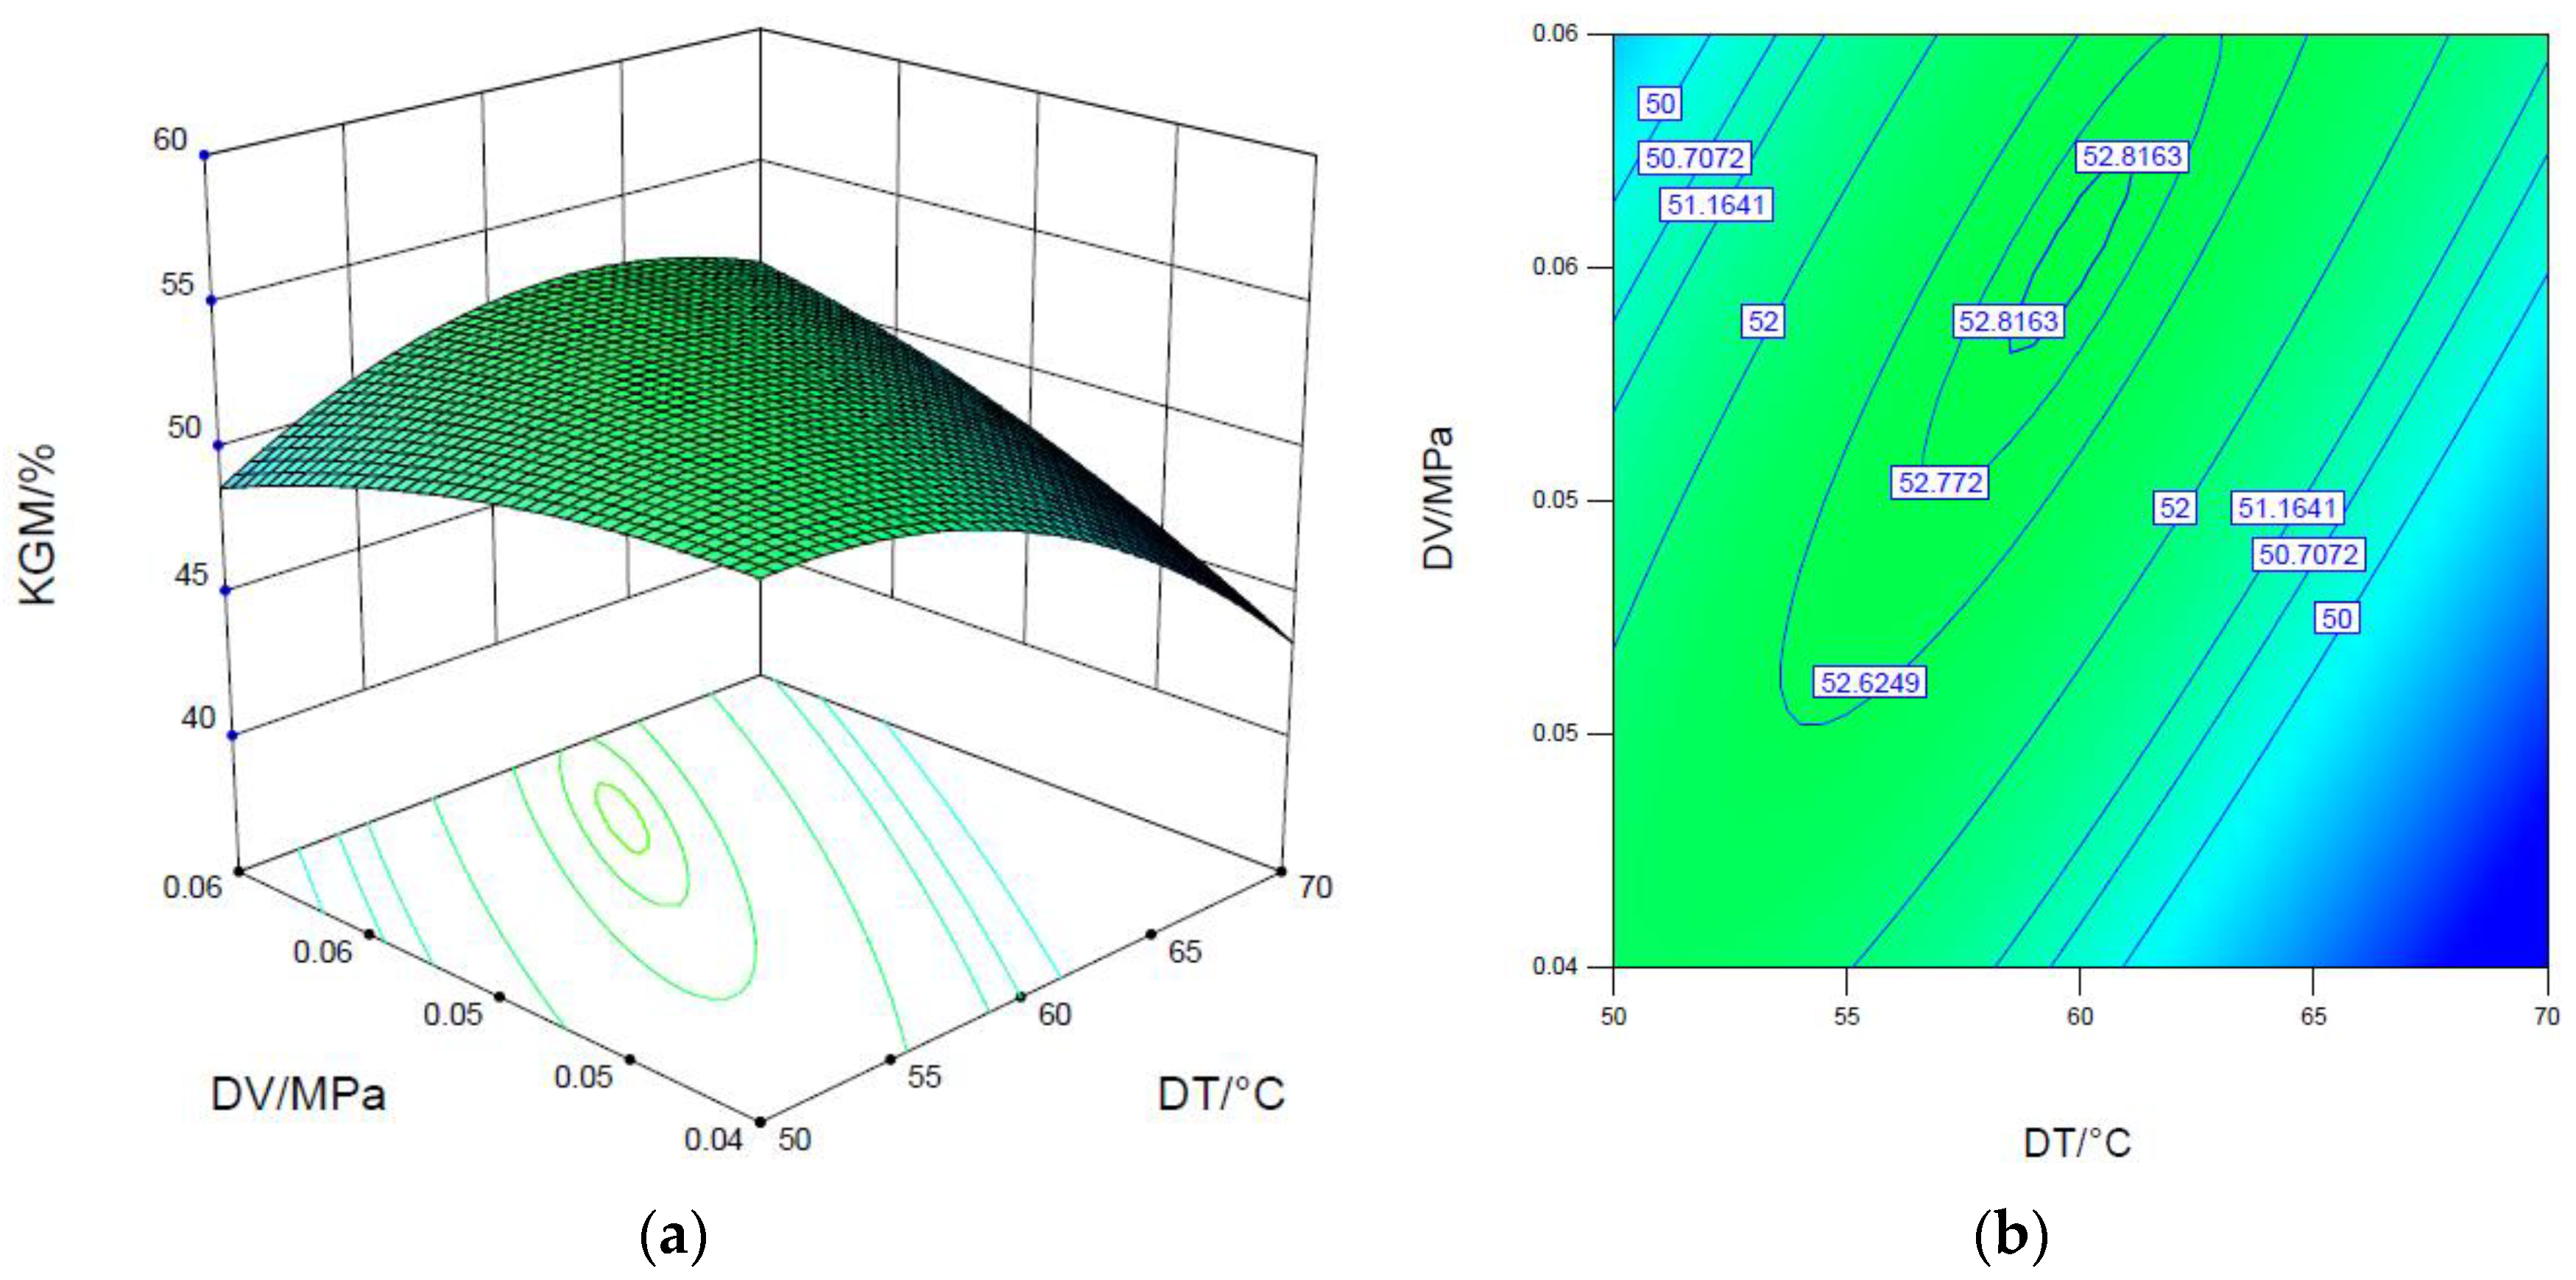
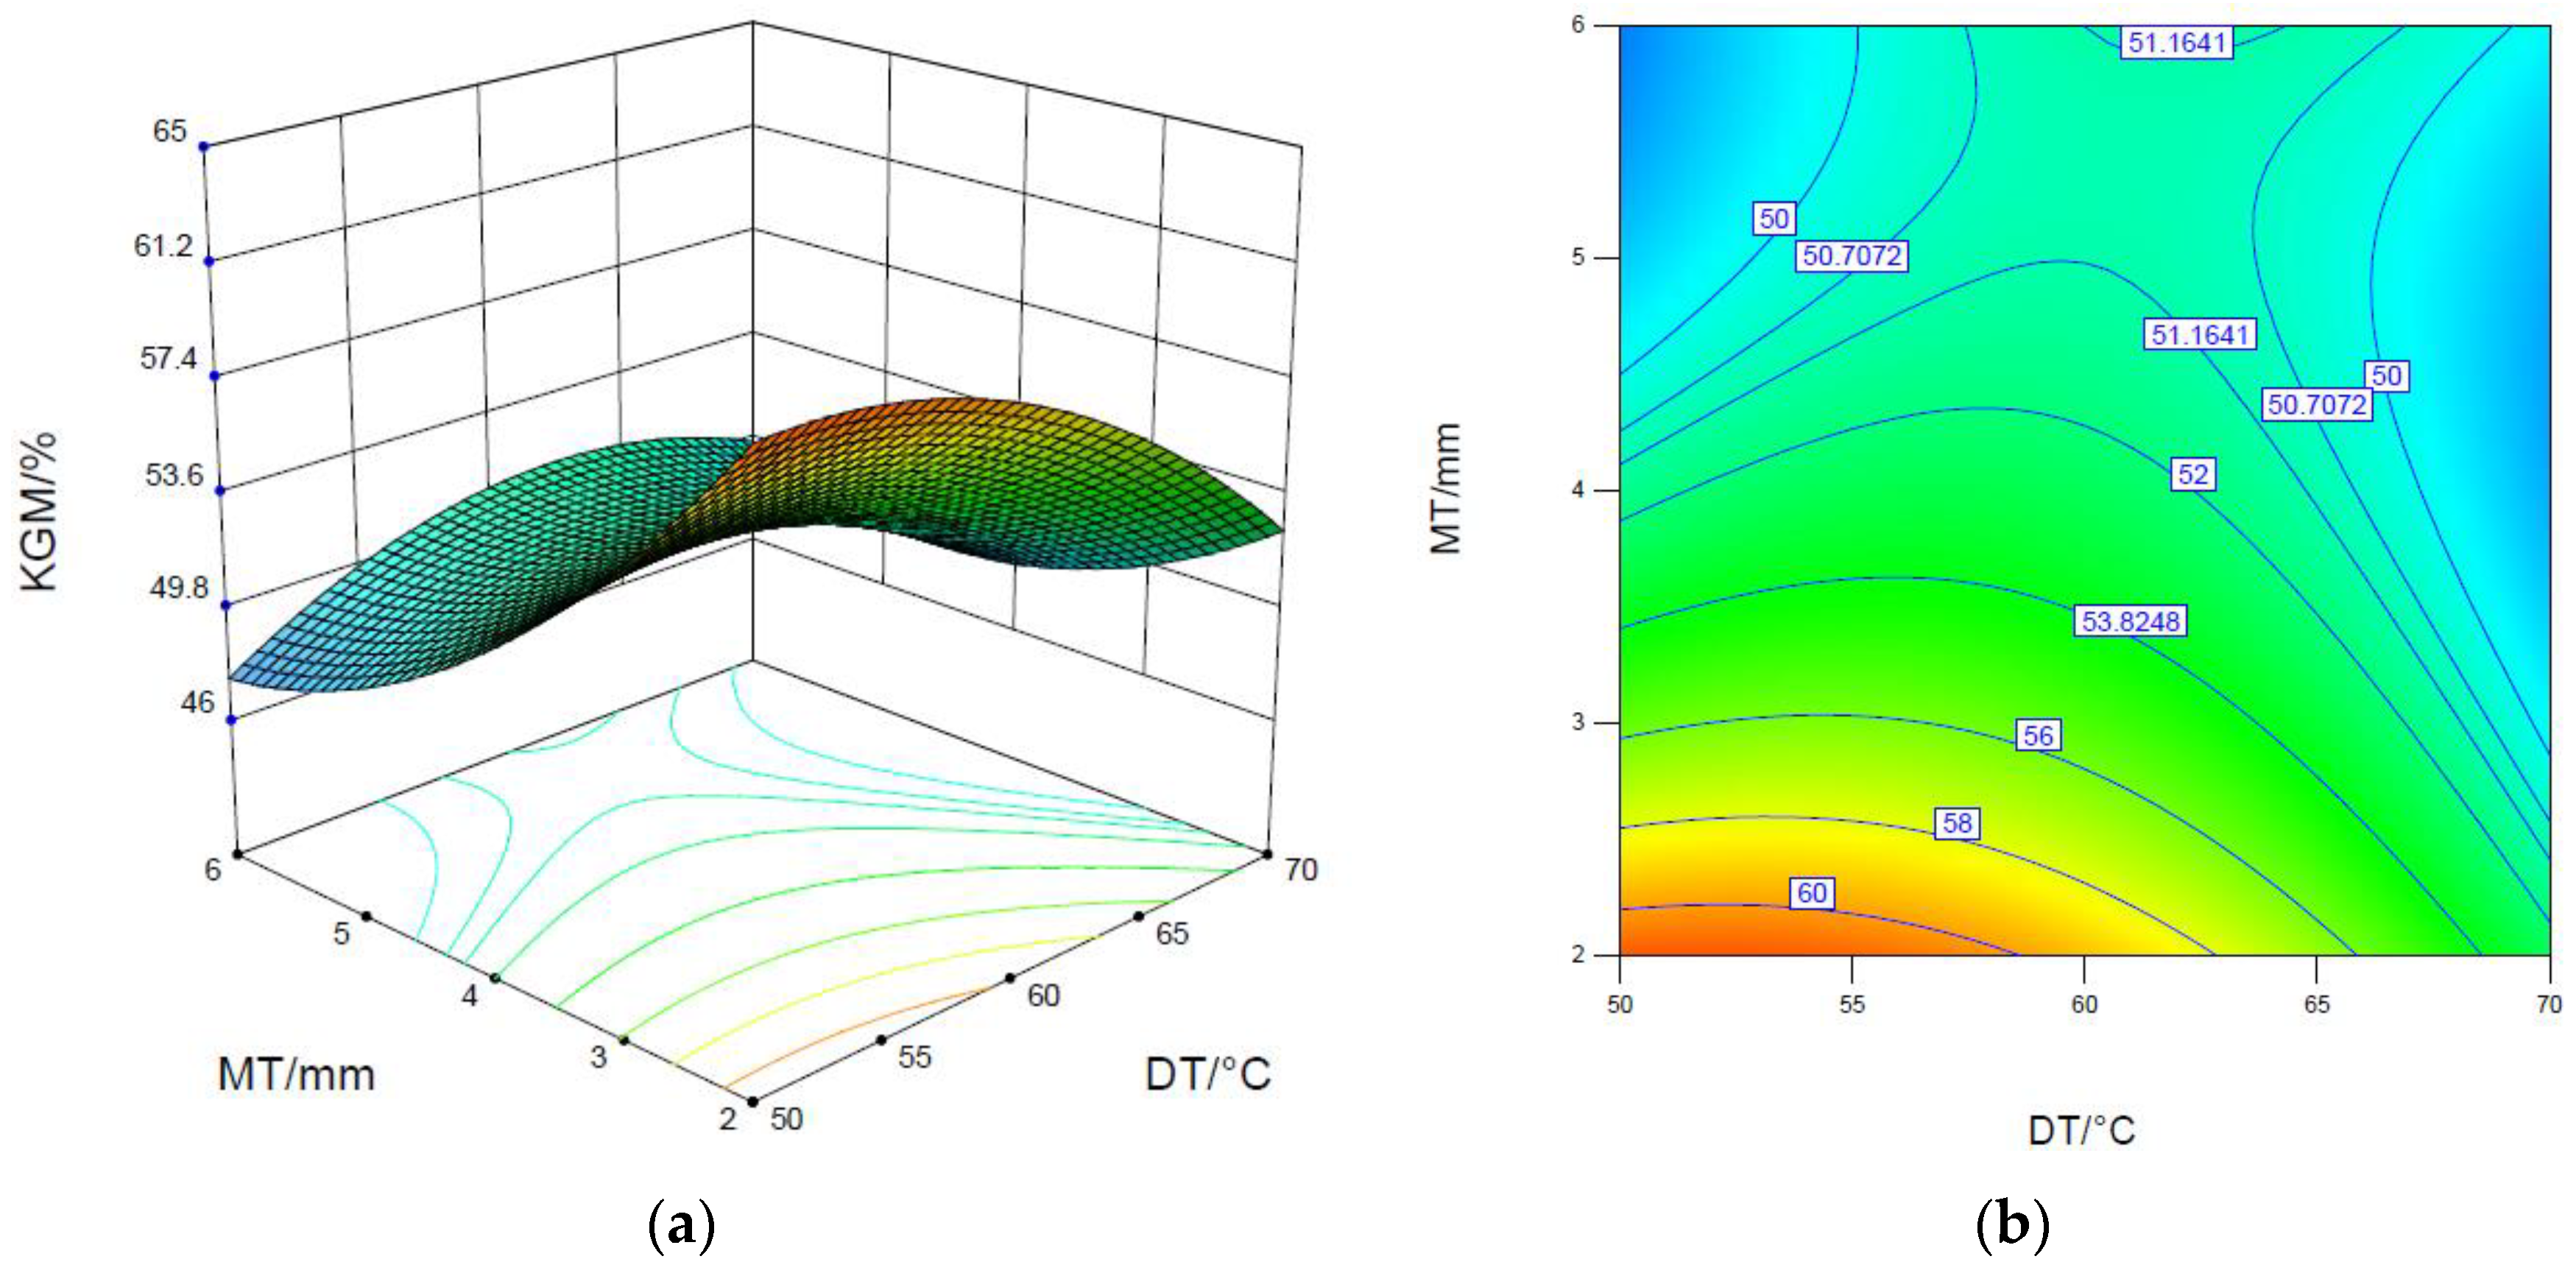
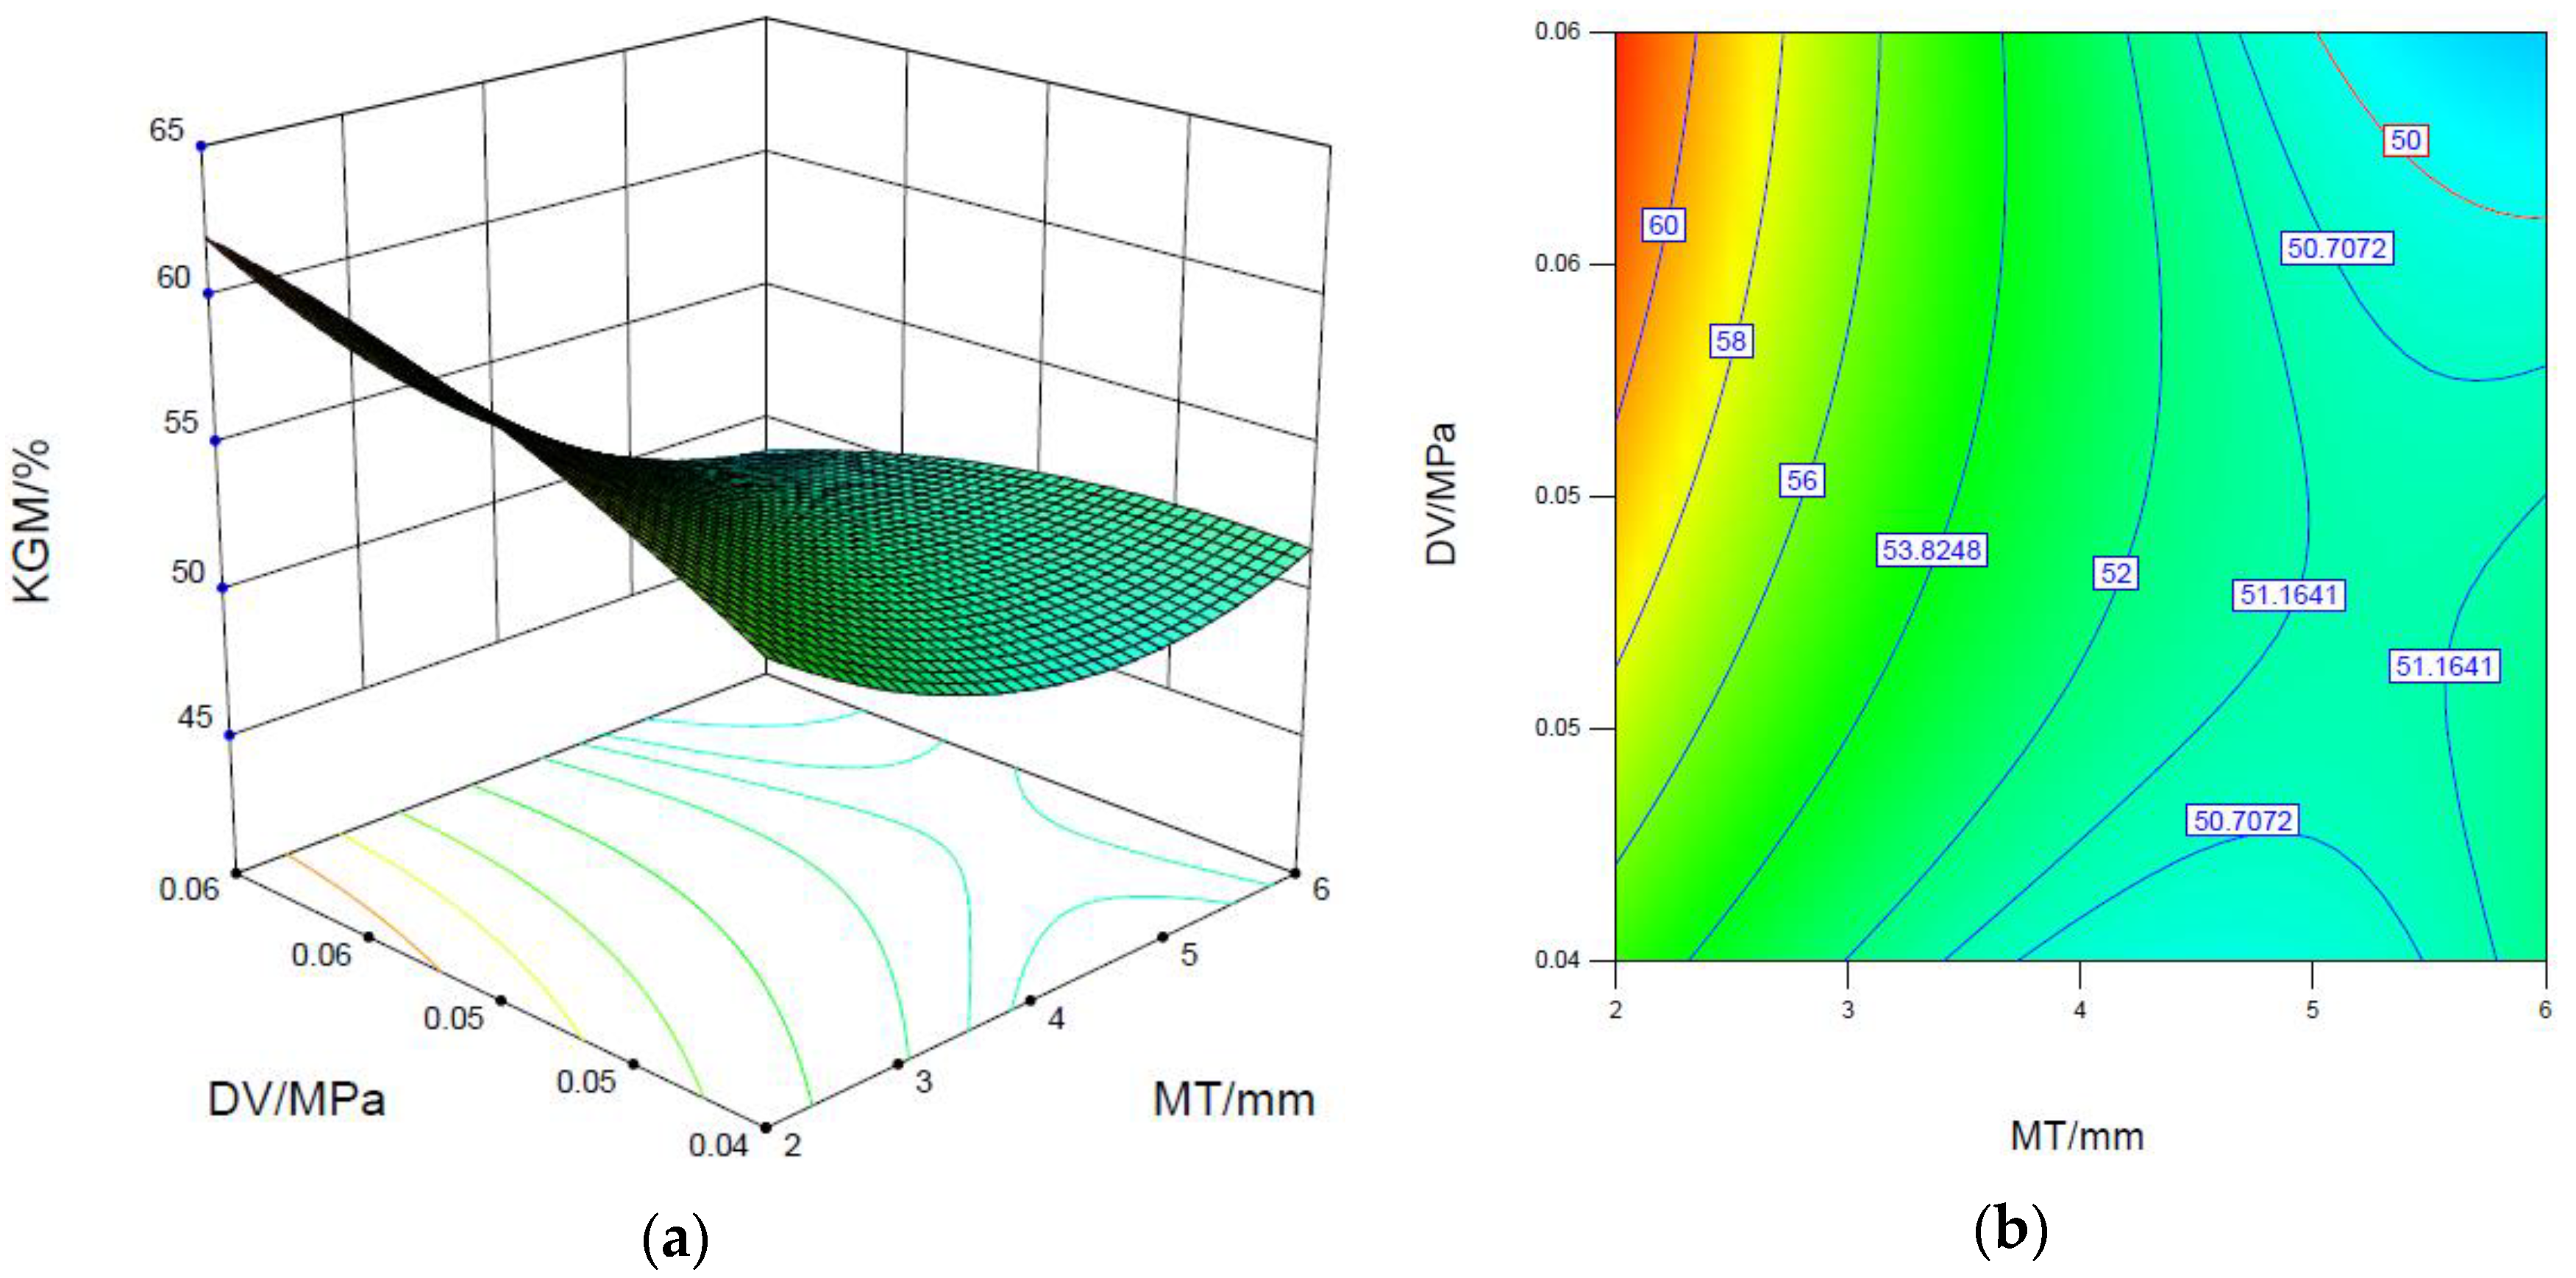
3.2. Konjac Glucomannan Content
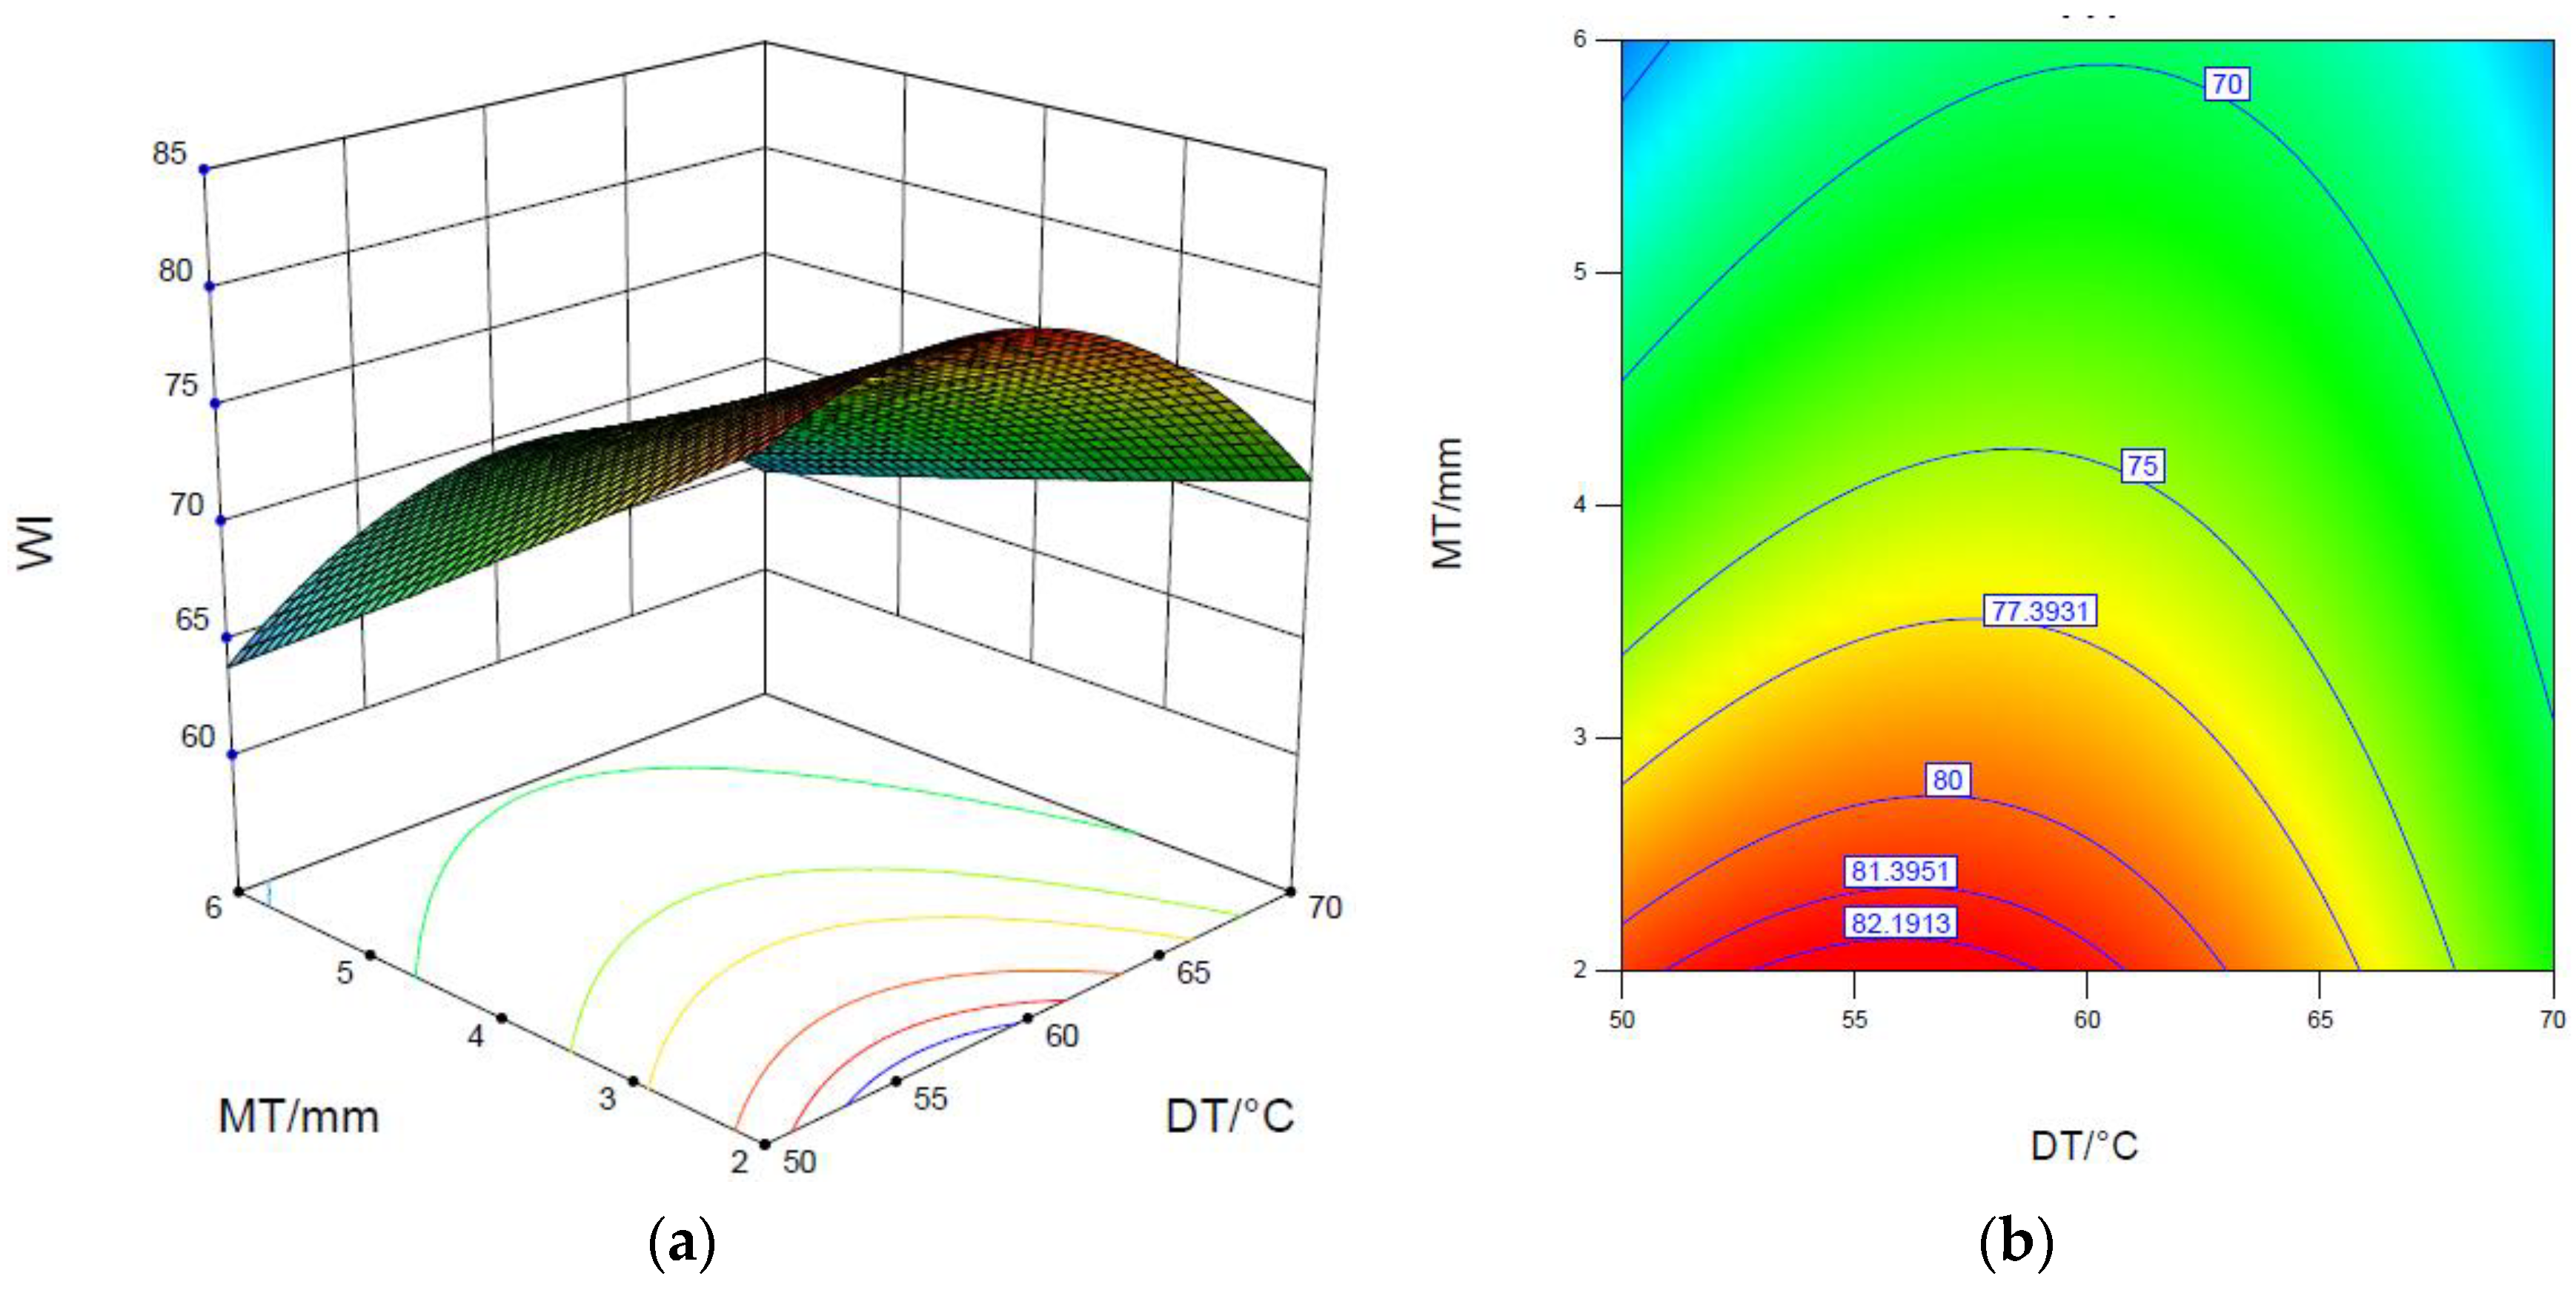
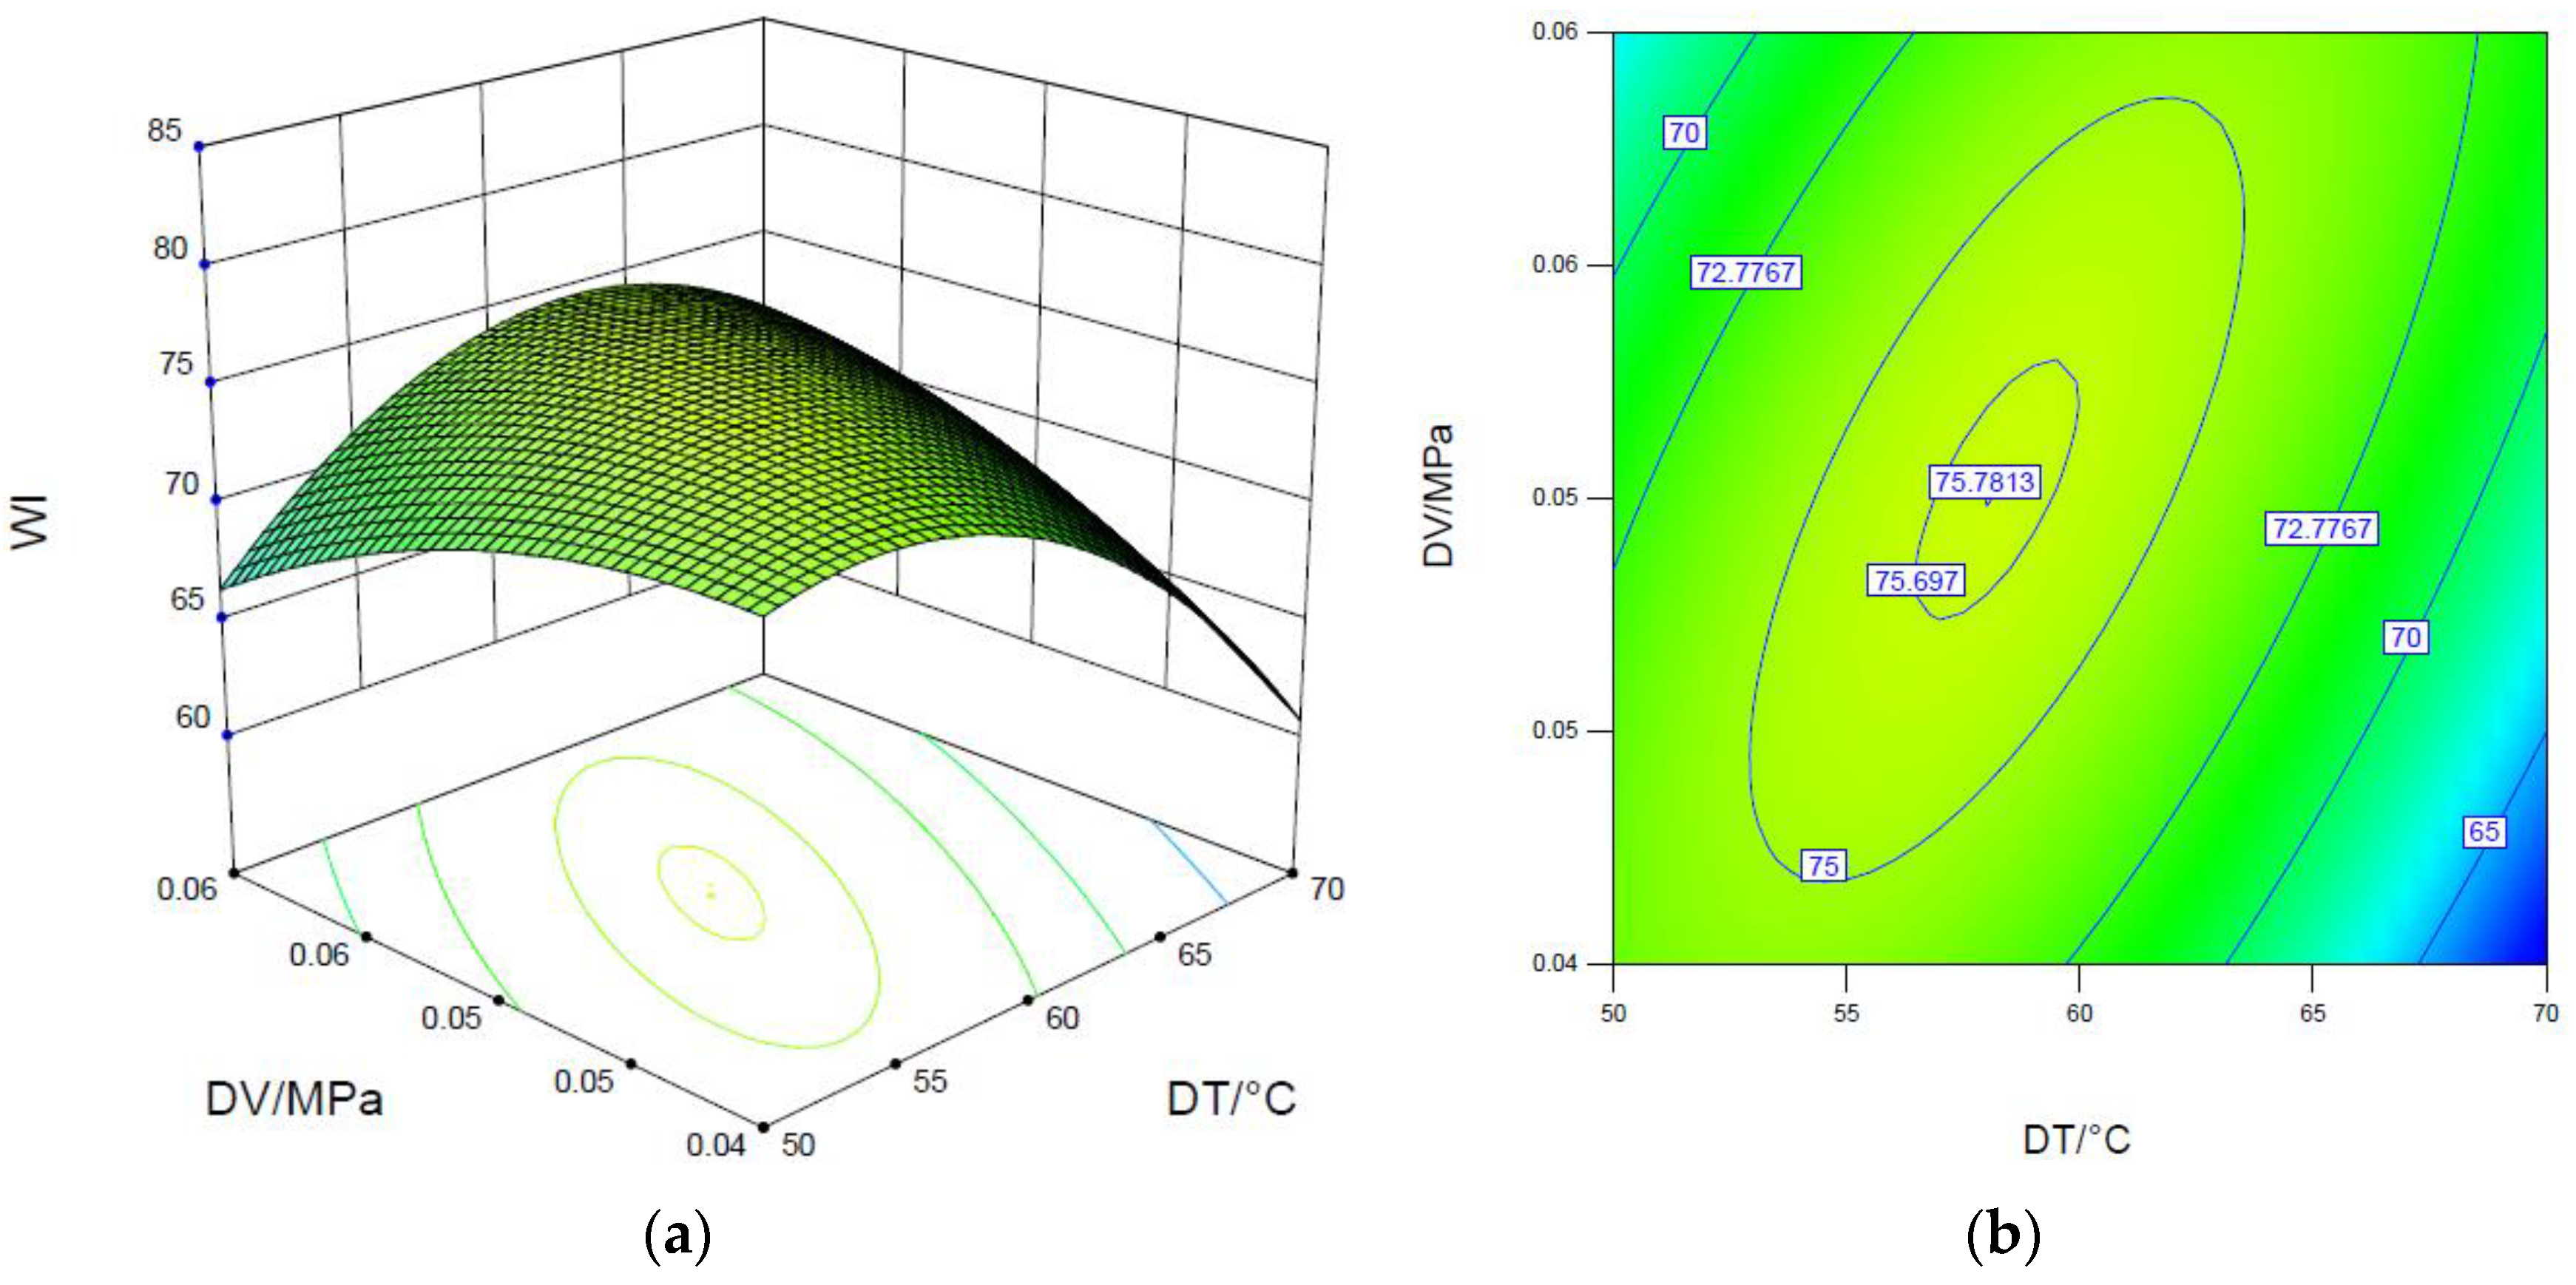
3.3. Whiteness Index
3.4. Optimization of Process Parameters
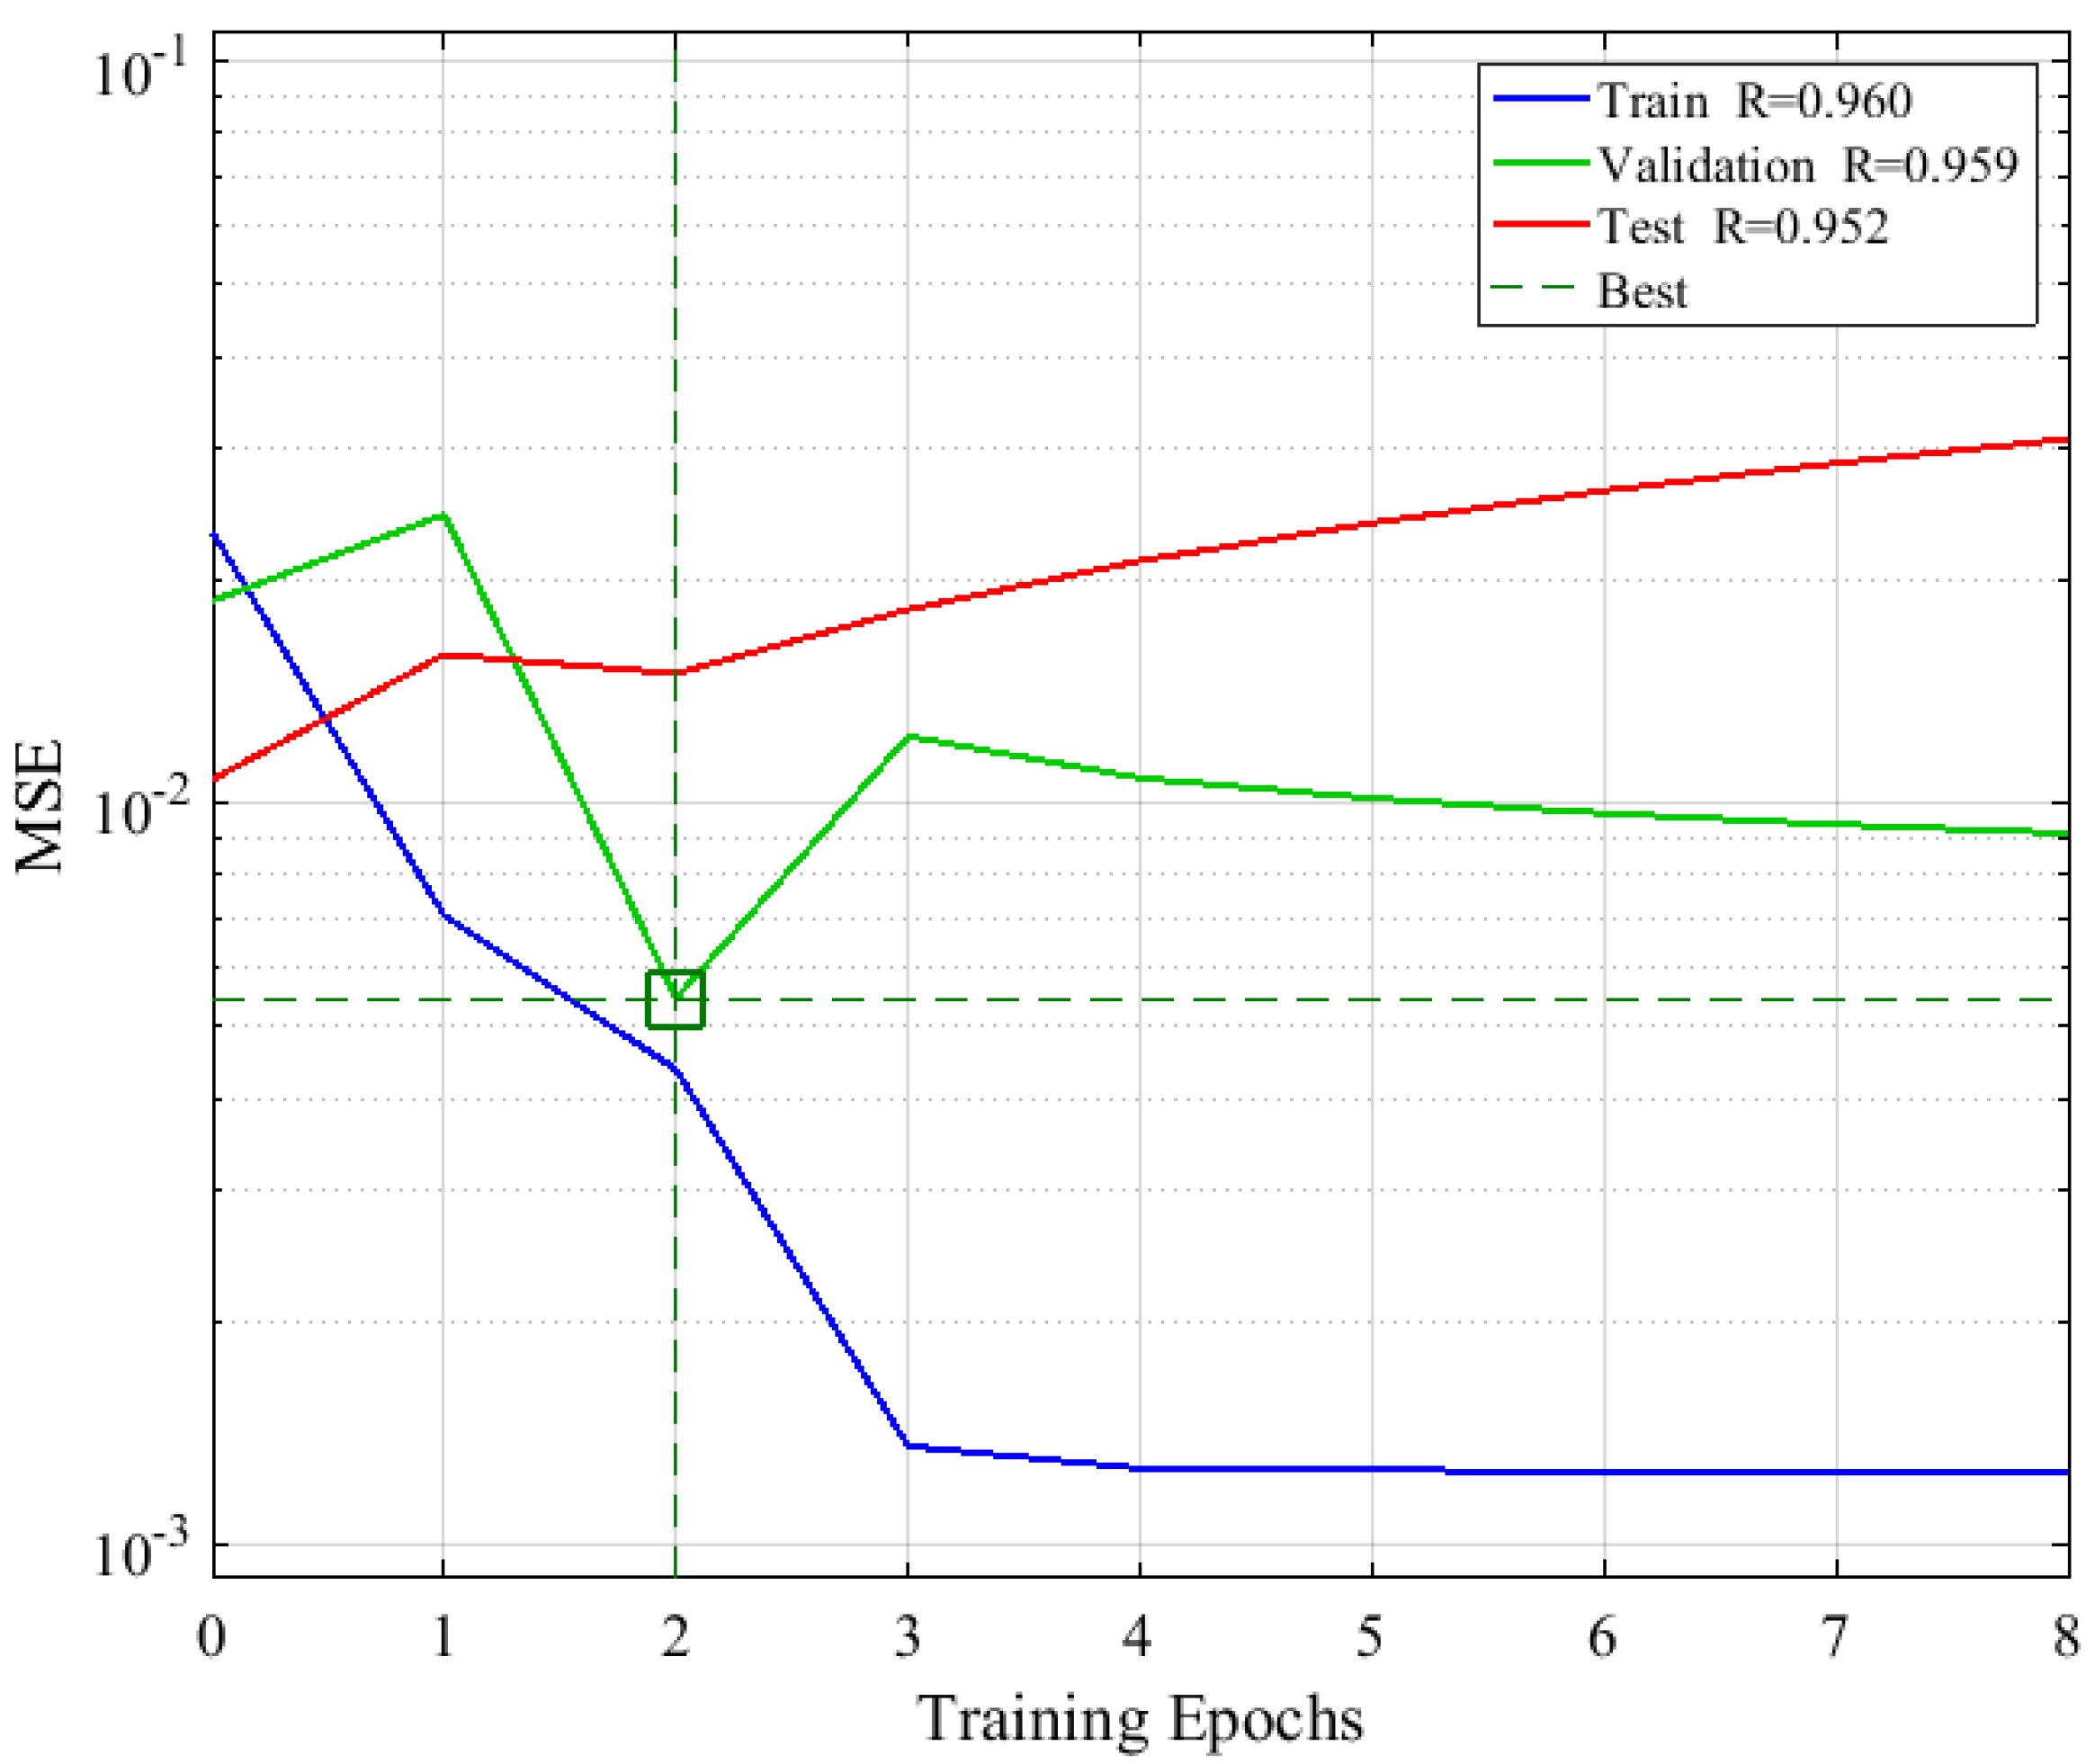
3.5. ANN Modeling for Konjac Vacuum Drying
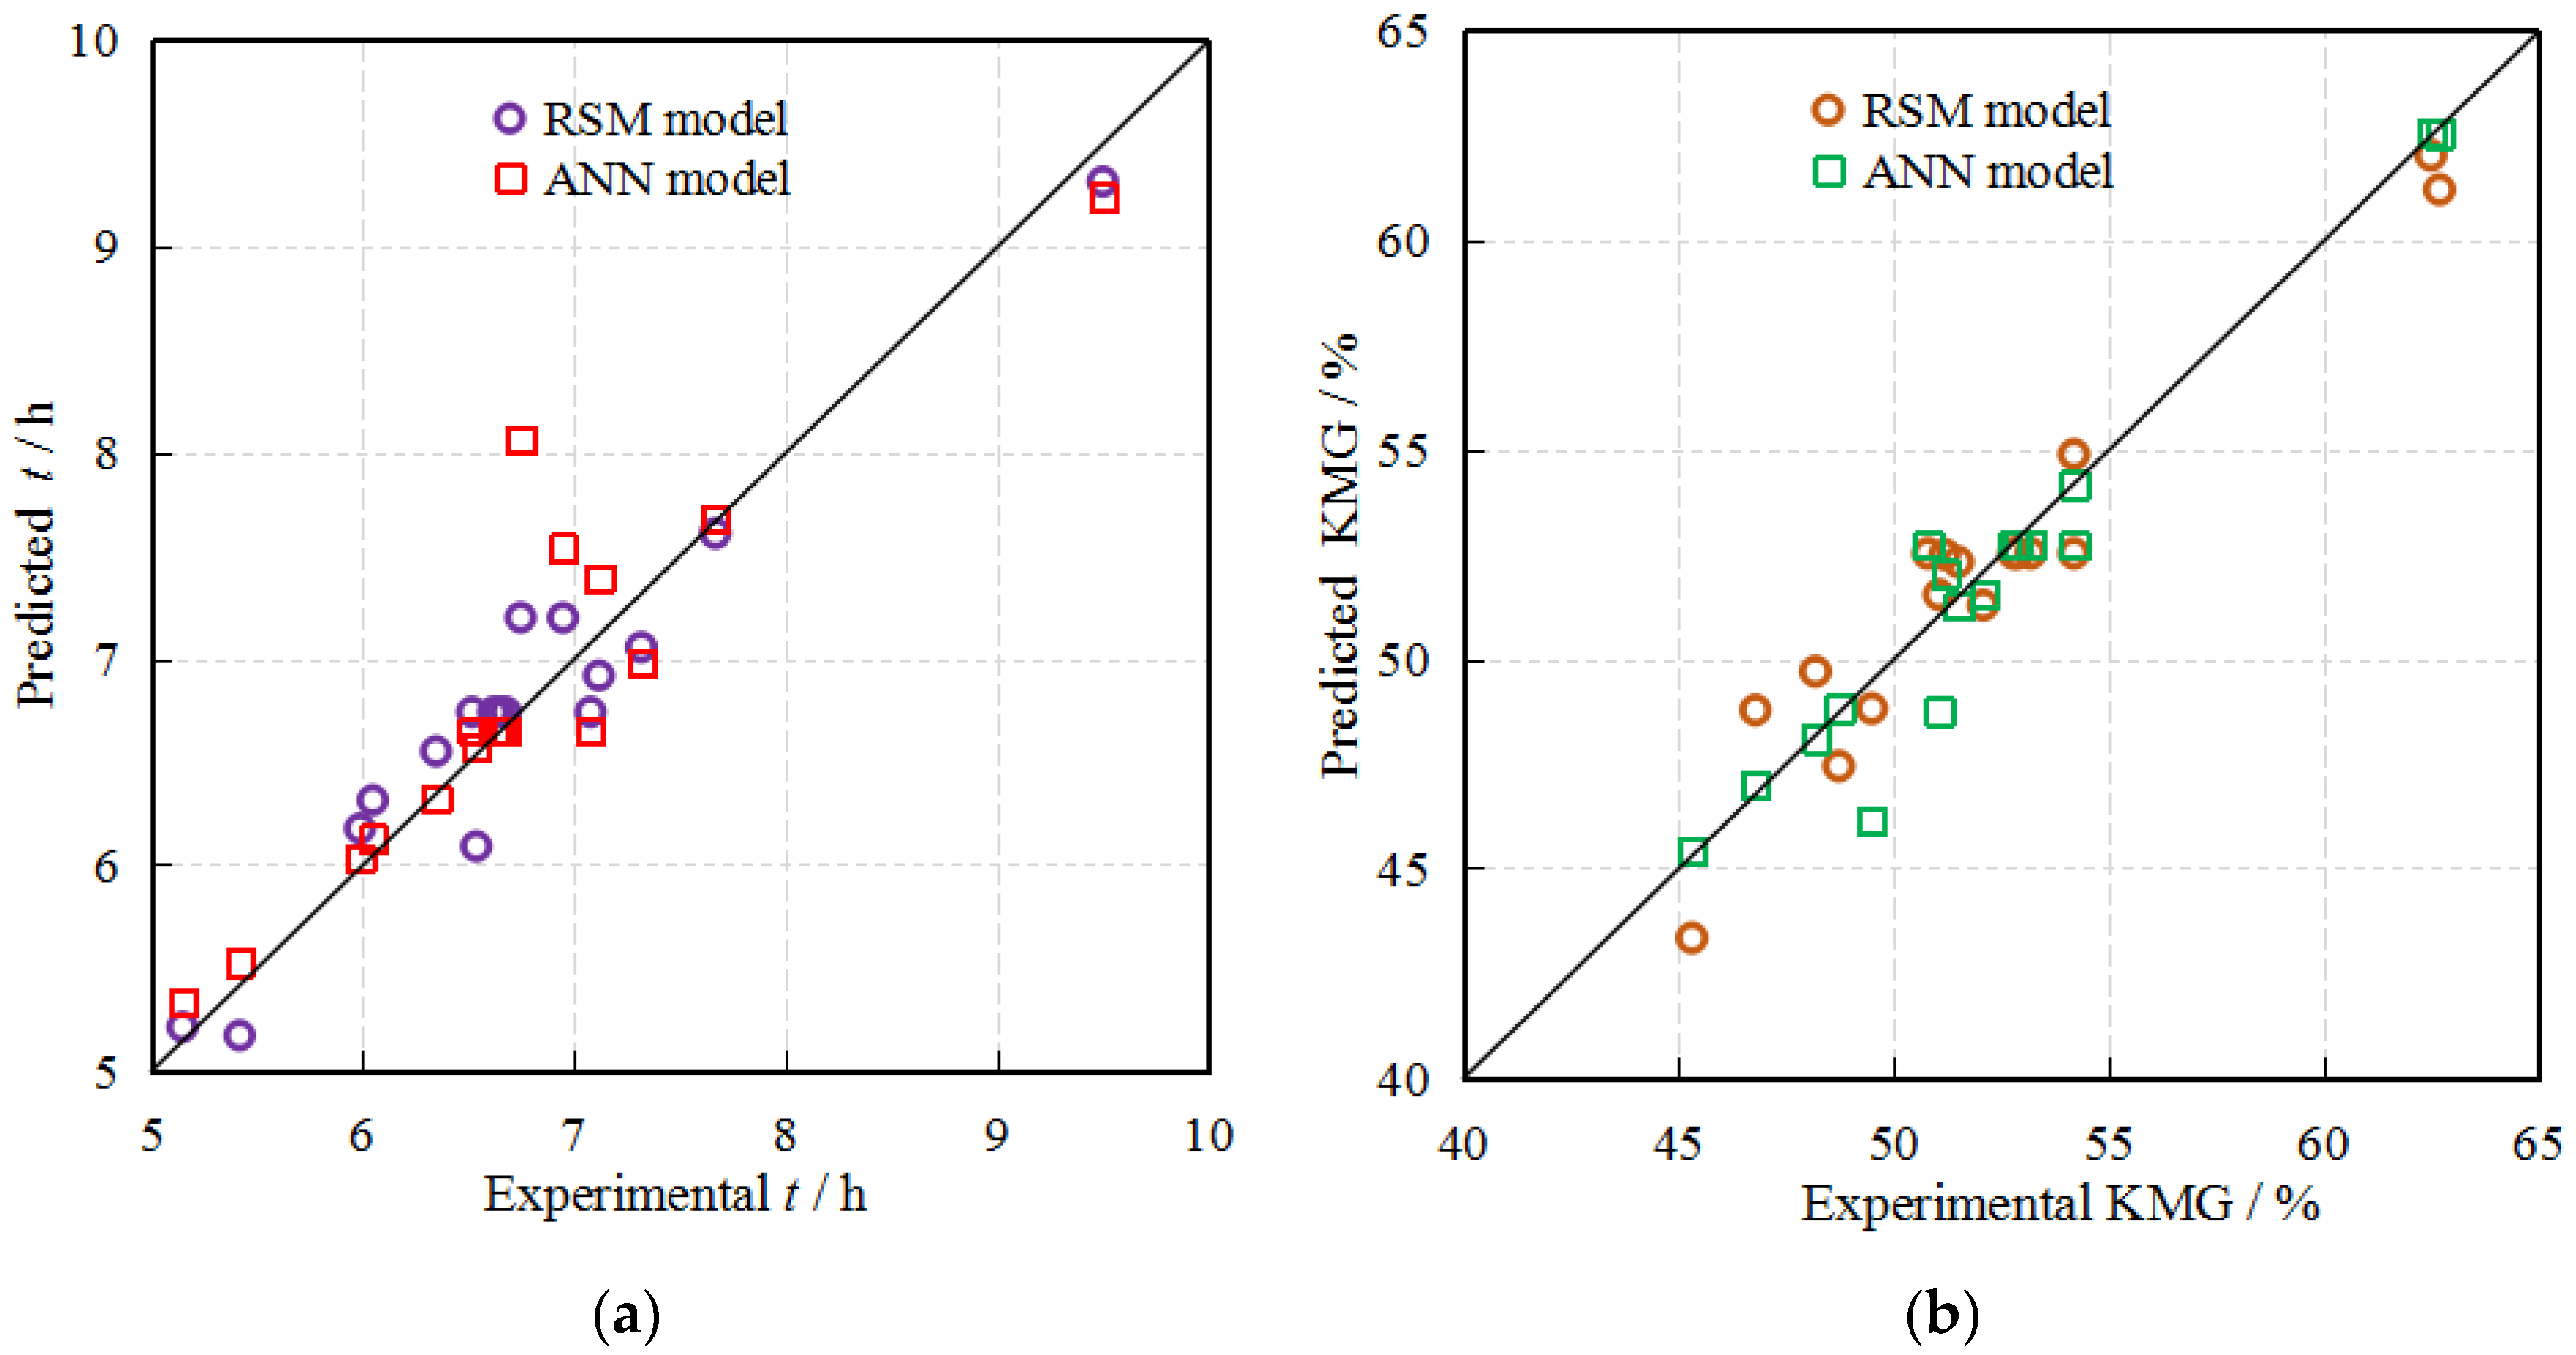
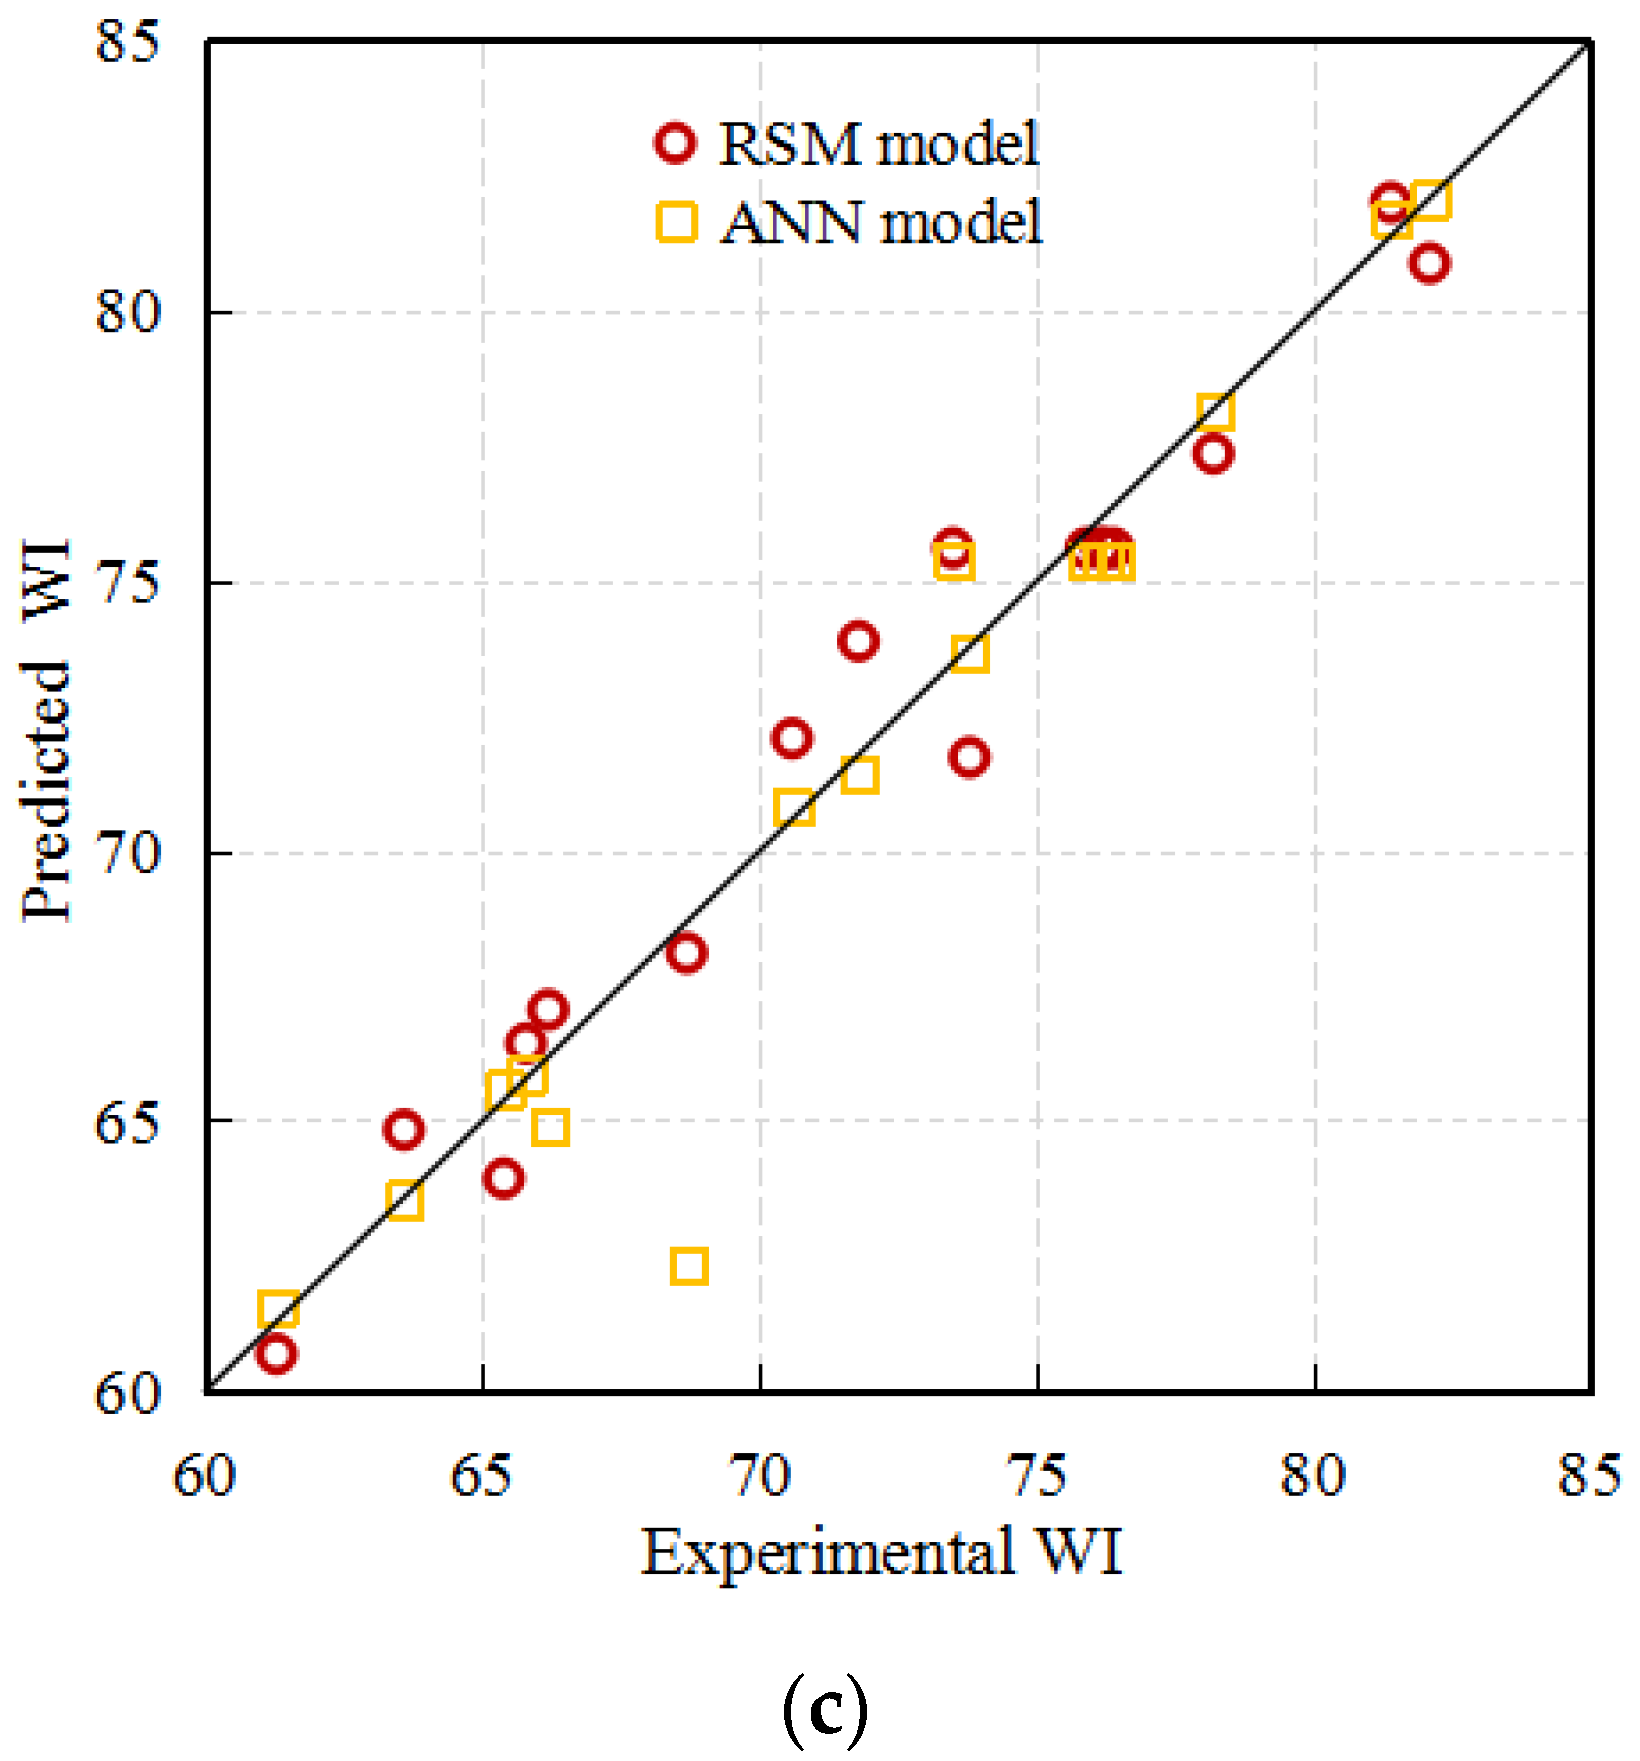
3.6. Comparison of the Established RSM Models and the ANN Model
4. Conclusions
- (1)
- Three second order polynomial models (KGM, t, WI) were established in this study, though the models show good predicting performance, the results at the significance level showed that the WI performs a better performance than the KGM and t.
- (2)
- The results of the interaction analysis indicated that the drying temperature and the material thickness of the konjac should be, respectively, under 60 °C and 4 mm for quality and efficiency purposes.
- (3)
- The optimal drying conditions obtained based on the given criteria are 60.34 °C, 0.06 MPa and 2.00 mm. For the optimized combination of drying parameters, the t, KGM and WI are 5 h, 61.96% and 82, respectively. In order to facilitate the practical production, the optimal drying parameters were adjusted as 60.00 °C, 0.06 MPa and 2.00 mm.
- (4)
- Though both models provided good quality predictions, the results confirmed that the established RSM models in this work are superior in predicting capacity compared (R2 > 0.928; MSE < 1.46; MAE < 1.04; RMSE < 1.21) with the ANN model. Such a result may suggest that the performance may be a problem-specific issue and might provide some theoretical and technical basis for guiding the konjac vacuum drying and the designing of related equipment.
Author Contributions
Funding
Acknowledgments
Conflicts of Interest
References
- Li, W.; Zheng, H.; Bukuru, J.; De Kimpe, N. Natural medicines used in the traditional Chinese medical system for therapy of diabetes mellitus. J. Ethnopharmacol. 2004, 92, 1–21. [Google Scholar] [CrossRef]
- Diao, T.; Wu, X.; Wu, J.P. The research progress of konjac. Anhui Agric. Sci. Bull. 2006, 6, 137–139. [Google Scholar]
- Niu, Z.; Wang, L.; Sun. Research and utilization of konjac (amorphophallus) resources in china. J. Southwest Agric. Univ. (Nat. Sci.) 2005, 5, 69–73. [Google Scholar]
- Orikasa, T.; Koide, S.; Okamoto, S.; Imaizumi, T.; Muramatsu, Y.; Takeda, J.I.; Shiina, T.; Tagawa, A. Impacts of hot air and vacuum drying on the quality attributes of kiwifruit slices. J. Food Eng. 2014, 125, 51–58. [Google Scholar] [CrossRef] [Green Version]
- Jing-Kun, Y.; Wu, L.X.; Qiao, Z.R.; Cai, W.D.; Ma, H. Effect of different drying methods on the product quality and bioactive polysaccharides of bitter gourd (momordica charantia L.) slices. Food Chem. 2019, 271, 588–596. [Google Scholar] [CrossRef]
- Turkmen, F.; Karasu, S.; Karadag, A. Effects of Different Drying Methods and Temperature on the Drying Behavior and Quality Attributes of Cherry Laurel Fruit. Processes 2020, 8, 761. [Google Scholar] [CrossRef]
- Khaled, A.Y.; Kabutey, A.; Selvi, K.Ç.; Mizera, Č.; Hrabe, P.; Herák, D. Application of Computational Intelligence in Describing the Drying Kinetics of Persimmon Fruit (Diospyros kaki) During Vacuum and Hot Air Drying Process. Processes 2020, 8, 544. [Google Scholar] [CrossRef]
- Zhong, X.; Kan, L.; Xin, H.; Qin, B.; Dou, G. Thermal effects and active group differentiation of low-rank coal during low-temperature oxidation under vacuum drying after water immersion. Fuel 2019, 236, 1204–1212. [Google Scholar] [CrossRef]
- Wang, J.; Law, C.L.; Nema, P.K.; Zhao, J.H.; Liu, Z.L.; Deng, L.Z. Pulsed vacuum drying enhances drying kinetics and quality of lemon slices. J. Food Eng. 2018, 224, 129–138. [Google Scholar] [CrossRef]
- Wu, L.; Orikasa, T.; Ogawa, Y.; Tagawa, A. Vacuum drying characteristics of eggplants. J. Food Eng. 2007, 83, 422–429. [Google Scholar] [CrossRef]
- Gupta, M.; Sehgal, V.K.; Arora, S. Optimization of drying process parameters for cauliflower drying. J. Food Sci. Technol. 2011, 50, 62–69. [Google Scholar] [CrossRef] [Green Version]
- Manuel, A.I.; Javier, B.; Clara, A.T. Use of Konjac glucomannan as additive to reinforce the gels from low-quality squid surimi. J. Food Eng. 2010, 101, 281–288. [Google Scholar] [CrossRef]
- Qiu, L. An experimental study on air drying properties for thin layer-sliced Konjak. Acta Univ. Agric. Boreali-Occident. 1995, 23, 78–82. [Google Scholar]
- Vishal, K.; Manish, K.; Sanjay, K. Influences of Temperature-Time Blanching on Drying Kinetics and Quality Attributes of Yam Chips. J. Agric. Eng. 2012, 2, 72–75. [Google Scholar]
- Ye, W.; Li, B.G. Drying Characteristics and Mathematical Modeling for Heat Pump Drying of Konjacs. Sichuan Food Ferment. 2015, 51, 32–36. [Google Scholar]
- Zhang, R.; Wang, X.; Li, L.; Cheng, M.; Zhang, L. Optimization of konjac glucomannan/carrageenan/nano-SiO2 coatings for extending the shelf-life of Agaricus bisporus. Int. J. Biol. Macromol. 2019, 122, 857–865. [Google Scholar] [CrossRef]
- Swasdisevi, T.; Devahastin, S.; Sa-Adchom, P. Mathematical modeling of combined far-infrared and vacuum drying banana slice. J. Food Eng. 2009, 92, 100–106. [Google Scholar] [CrossRef]
- Burande, R.R.; Kumbhar, B.K.; Ghosh, P.K.; Jayas, D.S. Optimization of fluidized bed drying process of green peas using response surface methodology. Dry. Technol. 2008, 26, 920–930. [Google Scholar] [CrossRef]
- Kumar, G.V.; Agarwal, S.; Asif, M.; Fakhri, A.; Sadeghi, N. Application of response surface methodology to optimize the adsorption performance of a magnetic graphene oxide nanocomposite adsorbent for removal of methadone from the environment. J. Colloid Interface Sci. 2017, 497, 193–200. [Google Scholar] [CrossRef]
- Yuan, Y.; Tan, L.; Xu, Y. Optimization of Combined Drying for Lettuce Using Response Surface Methodology. J. Food Process. Preserv. 2016, 40, 1027–1037. [Google Scholar] [CrossRef]
- Neto, A.H.; Fiorelli, F.A.S. Comparison between detailed model simulation and artificial neural network for forecasting building energy consumption. Energy Build. 2008, 40, 2169–2176. [Google Scholar] [CrossRef]
- Sarimeseli, A.; Coskun, M.A.; Yuceer, M. Modeling microwave drying kinetics of thyme (thymus vulgaris L.) leaves using ann methodology and dried product quality. J. Food Process. Preserv. 2014, 38, 558–564. [Google Scholar] [CrossRef]
- Li, B.; Peng, G.-L.; Wu, S.-F.; Luo, C.-W.; Qiu, G.-Y.; Yang, L. Vacuum drying characteristics and modeling of kinetics for konjac. Food Ferment. Ind. 2017, 43, 115–122. [Google Scholar] [CrossRef]
- Sahin, U.; Ozturk, H.K. Comparison between artificial neural network model and mathematical models for drying kinetics of osmotically dehydrated and fresh figs under open sun drying. J. Food Process Eng. 2018, 41, e12804. [Google Scholar] [CrossRef]
- Bas, D.; Boyaci, I.H. Modeling and Optimization II: Comparison of Estimation Capabilities of Response Surface Methodology with Artificial Neural Networks in a Biochemical Reaction. J. Food Eng. 2007, 78, 846–854. [Google Scholar] [CrossRef]
- Desai, K.M.; Survase, S.; Saudagar, P.S.; Lele, S.S.; Singhal, R.S. Comparison of artificial neural network (ANN) and response surface methodology (RSM) in fermentation media optimization: Case study of fermentative production of scleroglucan. Biochem. Eng. J. 2008, 41, 266–273. [Google Scholar] [CrossRef]
- Giri, S.K.; Prasad, S. Drying kinetics and rehydration characteristics of microwave-vacuum and convective hot-air dried mushrooms. J. Food Eng. 2007, 78, 512–521. [Google Scholar] [CrossRef]
- He, Z.-K.; Zhao, G.-H.; Li, M.-T.; Wang, X.-Y.; Li, C.-P. Selenization of konjac glucomannan oligosaccharides by dry heating in the presence of selenite and antioxidant activity of selenized products. Food Science 2013, 34, 5–9. [Google Scholar] [CrossRef]
- Yuan-Ming, S.; Pei-Ying, L.; Sheng-Lin, Z. Spectrophotometry for Glucomannan from Amorphophallus spp. Plant Physiol. Commun. 1991, 27, 219–222. [Google Scholar]
- Xiao, H.W.; Yao, X.D.; Lin, H.; Yang, W.X.; Meng, J.S. Effect of SSB (superheated steam blanching) time and drying temperature on hot air impingement drying kinetics and quality attributes of yam slices. J. Food Process Eng. 2012, 35, 370–390. [Google Scholar] [CrossRef]
- Fakhreddin, S.; Mahdi, K. Modeling of moisture loss kinetics and color changes in the surface of lemon slice during the combined infrared-vacuum drying. Inf. Process. Agric. 2018, 5, 516–523. [Google Scholar] [CrossRef]
- Li, B.; Peng, G.L.; Luo, C.W.; Meng, G.D.; Yang, L. Vacuum drying kinetics characteristics of Chinese prickly ash based on Weibull distribution. Food Ferment. Ind. 2017, 43, 58–64. [Google Scholar] [CrossRef]
- Vogl, T.P.; Mangis, J.K.; Rigler, A.K.; Zink, W.T.; Alkon, D.L. Accelerating the convergence of the backpropagation method. Biol. Cybern. 1988, 59, 257–263. [Google Scholar] [CrossRef]
- Chokphoemphun, S. Moisture content prediction of paddy drying in a fluidized-bed drier with a vortex flow generator using an artificial neural network. Appl. Therm. Eng. 2018, 145, 630–636. [Google Scholar] [CrossRef]
- Li, B.; Li, C.; Huang, J. Application of artificial neural network for prediction of key indexes of corn industrial drying by considering the ambient conditions. Appl. Sci 2020, 10, 5659. [Google Scholar] [CrossRef]
- Thyagarajan, R.; Narendrakumar, G.; Kumar, V.R.; Namasivayam, K.R. Comparison of response surface methodology and artificial neural networks for optimization of medium constituents for enhancement of phytase production from hypocrea lixii surt01. Res. J. Pharm. Technol. 2016, 4, 1–3. [Google Scholar] [CrossRef]
- Xu, F.Y.; Li, C.Y.; Chen, Z. Drying Characteristics of Vacuum and Selective Far-Infrared Radiation Superheat for Litchi chinensis Sonn. J. Huazhong Agric. Univ. 2009, 28, 495–499. [Google Scholar] [CrossRef]
- Li, X.; Liu, Y.; Gao, Z.; Xie, Y.; Wang, H. Computer vision online measurement of shiitake mushroom (lentinus edodes) surface wrinkling and shrinkage during hot air drying with humidity control. J. Food Eng. 2020, 292, 110253. [Google Scholar] [CrossRef]
- Li, B.; Liu, W.; Li, D.; Yu, Y.; Liu, Y. Characteristics of hot air drying of candied prunes and representation model. Trans. Chin. Soc. Agric. Eng. 2009, 25, 330–335. [Google Scholar] [CrossRef]
- Lakshmi, D.V.N.; Muthukumar, P.; Layek, A.; Nayak, P.K. Drying kinetics and quality analysis of black turmeric (curcuma caesia) drying in a mixed mode forced convection solar dryer integrated with thermal energy storage. Renew. Energy 2018, 120, 23–34. [Google Scholar] [CrossRef]
- Sehrawat, R.; Nema, P.K.; Kaur, B.P. Quality evaluation and drying characteristics of mango cubes dried using low-pressure superheated steam, vacuum and hot air drying methods. LWT 2018, 92, 548–555. [Google Scholar] [CrossRef]
- Brooks, M.S.; El-Hana, N.H.A.; Ghaly, A.E. Effects of tomato geometries and air temperature on the drying behavior of plum tomato. Am. J. Appl. Sci. 2008, 5, 1369–1375. [Google Scholar] [CrossRef]
- Song, X.; Hu, H.; Zhang, B. Drying characteristics of chinese yam (dioscorea opposita thunb.) by far-infrared radiation and heat pump. J. Saudi Soc. Agric. Sci. 2018, 17, 290–296. [Google Scholar] [CrossRef] [Green Version]
- Chen, J.; Lin, H.; Lin, Y.; Li, H.; Wang, Z. Optimized technology of pleurotus eryngii by microwave-vacuum drying based on quality and energy consumption. Trans. Chin. Soc. Agric. Eng. 2014, 30, 277–284. [Google Scholar] [CrossRef]
- Erbay, Z.; Icier, F. Optimization of hot air drying of olive leaves. using response surface methodology. J. Food Eng. 2009, 91, 533–541. [Google Scholar] [CrossRef]
- Rafigh, S.M.; Yazdi, A.V.; Vossoughi, M.; Safekordi, A.A.; Ardjmand, M. Optimization of culture medium and modeling of curdlan production from Paenibacillus polymyxa by RSM and ANN. Int. J. Biol. Macromol. 2014, 70, 463–473. [Google Scholar] [CrossRef] [PubMed]
- Ebrahimpour, A.; Rahman, R.; Ean Ch’ng, D.; Basri, M.; Salleh, A. A modeling study by response surface methodology and artificial neural network on culture parameters optimization for thermostable lipase production from a newly isolated thermophilic Geobacillus sp. strain ARM. BMC Biotechnol. 2008, 8, 96. [Google Scholar] [CrossRef] [Green Version]
- Yang, L.B.; Zhan, X.B.; Zhu, L.; Gao, M.J.; Lin, C.C. Optimization of a low-cost hyperosmotic medium and establishing the fermentation kinetics of erythritol production by Yarrowia lipolytica from crude glycerol. Prep. Biochem. Biotechnol. 2015, 46, 376–383. [Google Scholar] [CrossRef]
- Mohamed, M.S.; Tan, J.S.; Mohamad, R.; Mokhtar, M.N.; Ariff, A.B. Comparative Analyses of Response Surface Methodology and Artificial Neural Network on Medium Optimization forTetraselmissp. FTC209 Grown under Mixotrophic Condition. Sci. World J. 2013, 36, 1–14. [Google Scholar] [CrossRef] [Green Version]


| Variables | Code Levels | ||
|---|---|---|---|
| −1 | 0 | 1 | |
| Natural Levels | |||
| DT (Drying temperatures,°C) | 50 | 60 | 70 |
| MT (Konjac Thicknesses, mm) | 2 | 4 | 6 |
| DV (Vacuum Degrees, MPa) | 0.04 | 0.05 | 0.06 |
| Run | Std | Experimental Design | Results | ||||
|---|---|---|---|---|---|---|---|
| DT (°C) | DV (MPa) | MT (mm) | t (h) | KGM (%) | WI | ||
| 1 | 10 | 60(0.5) | 0.06(1) | 2(0) | 5.42(0.06) | 62.5(0.99) | 81.4(0.97) |
| 2 | 16 | 60(0.5) | 0.05(0.5) | 4(0.5) | 6.62(0.34) | 52.8(0.43) | 75.9(0.70) |
| 3 | 12 | 60(0.5) | 0.06(1) | 6(1) | 7.32(0.50) | 49.5(0.24) | 66.2(0.24) |
| 4 | 3 | 50(0) | 0.06(1) | 4(0.5) | 6.75(0.37) | 46.8(0.09) | 65.8(0.22) |
| 5 | 4 | 70(1) | 0.06(1) | 4(0.5) | 5.15(0.00) | 52.1(0.39) | 73.8(0.60) |
| 6 | 17 | 60(0.5) | 0.05(0.5) | 4(0.5) | 6.68(0.35) | 52.9(0.44) | 76.2(0.72) |
| 7 | 11 | 60(0.5) | 0.04(0) | 6(0.5) | 6.95(0.41) | 51.06(0.33) | 68.7(0.36) |
| 8 | 6 | 70(1) | 0.05(0.5) | 2(0) | 5.99(0.19) | 51.2(0.34) | 70.6(0.45) |
| 9 | 15 | 60(0.5) | 0.05(0.5) | 4(0.5) | 7.08(0.44) | 53.2(0.45) | 76.2(0.72) |
| 10 | 8 | 70(1) | 0.05(0.5) | 6(1) | 6.35(0.28) | 48.2(0.17) | 63.6(0.11) |
| 11 | 2 | 70(1) | 0.04(0) | 4(0.5) | 6.54(0.32) | 45.32(0.00) | 61.3(0.00) |
| 12 | 13 | 60(0.5) | 0.05(0.5) | 4(0.5) | 6.65(0.34) | 50.8(0.32) | 73.5(0.59) |
| 13 | 7 | 50(0) | 0.05(0.5) | 6(1) | 9.5(1.00) | 48.74(0.20) | 65.4(0.20) |
| 14 | 5 | 50(0) | 0.05(0.5) | 2(0) | 7.12(0.45) | 62.7(1.00) | 82.1(1.00) |
| 15 | 1 | 50(0) | 0.04(0) | 4(0.5) | 7.67(0.58) | 51.51(0.36) | 71.8(0.50) |
| 16 | 9 | 60(0.5) | 0.04(0) | 2(0) | 6.05(0.21) | 54.2(0.51) | 78.2(0.81) |
| 17 | 14 | 60(0.5) | 0.05(0.5) | 4(0.5) | 6.52(0.31) | 54.2(0.51) | 76.4(0.73) |
| Source | Drying Time | Konjac Glucomannan Content | Whiteness Index | ||||||
|---|---|---|---|---|---|---|---|---|---|
| Sum of Squares | Coefficient | p-Value | Sum of Squares | Coefficient | p-Value | Sum of Squares | Coefficient | p-Value | |
| Model | 13.68 | 3.832 | 0.0023 * | 316.99 | 52.29 | 0.0022 * | 591.03 | 5.1375 | 0.0004 * |
| DT | 6.14 | −0.28217 | 0.0003 * | 20.90 | 0.96962 | 0.037 * | 31.20 | 3.38 | 0.0203 * |
| DV | 0.83 | 498.125 | 0.0448 * | 9.70 | −129.125 | 0.1233 | 6.48 | −287.5 | 0.2157 |
| MT | 3.84 | 0.83075 | 0.0012 * | 136.95 | −9.69875 | 0.0003 * | 292.82 | −7.0125 | <0.0001 * |
| DT•DV | 0.055 | −1.175 | 0.5482 | 33.01 | 28.725 | 0.0178 * | 85.56 | 46.25 | 0.0017 * |
| DT•MT | 1.02 | −0.02525 | 0.0301 * | 30.03 | 0.137 | 0.0144 * | 23.52 | 0.12125 | 0.0358 * |
| DV•MT | 0.25 | 12.5 | 0.2214 | 24.30 | −123.25 | 0.0276 * | 8.12 | −71.25 | 0.1714 |
| DT2 | 0.37 | 2.9525 × 10 −3 | 0.1479 | 28.38 | −0.025962 | 0.0201 * | 118.83 | −0.053125 | 0.0006 * |
| DV2 | 1.09 | −5097.5 | 0.0262 * | 4.14 | −9912.5 | 0.2903 | 18.79 | −21125 | 0.0536 |
| MT2 | 0.17 | 0.050687 | 0.3009 | 32.69 | 0.69656 | 0.0148 * | 0.08 | 0.034375 | 0.8844 |
| Residual | 0.97 | 22.14 | 24.49 | ||||||
| Lack of Fit | 0.83 (NS) | 18.35 (NS) | 18.91(NS) | ||||||
| Pure Error | 0.15 | 3.79 | 5.58 | ||||||
| Std. Dev | 0.37 | 1.78 | 1.87 | ||||||
| Mean | 6.74 | 52.14 | 72.17 | ||||||
| R2 | 0.9337 | 0.9347 | 0.9602 | ||||||
| Adj R2 | 0.8485 | 0.8508 | 0.9091 | ||||||
| Pred R2 | 0.0825 | 0.1168 | 0.4943 | ||||||
| Adep Pre | 14.499 | 13.693 | 14.865 | ||||||
| C.V.% | 5.53 | 3.41 | 2.59 | ||||||
| PRESS | 13.44 | 299.53 | 311.28 | ||||||
| Solution Number | Parameters | Responses | Desirability | ||||
|---|---|---|---|---|---|---|---|
| DT | MT | DV | t | KGM | WI | ||
| 1 | 60.34 | 2.00 | 0.06 | 5 | 61.96 | 82 | 0.984 |
| 2 | 59.92 | 2.00 | 0.06 | 5 | 62.03 | 82 | 0.983 |
| 3 | 60.99 | 2.00 | 0.06 | 5 | 61.82 | 82 | 0.981 |
| 4 | 60.37 | 2.02 | 0.06 | 5 | 61.85 | 82 | 0.980 |
| 5 | 58.73 | 2.00 | 0.06 | 5 | 62.17 | 82 | 0.980 |
| Weight | Matrix |
|---|---|
| Parameters | RSM Models | ANN Model | ||||
|---|---|---|---|---|---|---|
| t (h) | KGM (%) | WI | t (h) | KGM (%) | WI | |
| Determination coefficient (R2) | 0.9312 | 0.9286 | 0.9591 | 0.9796 | 0.9982 | 0.9896 |
| Mean-square error (MSE) | 0.0595 | 1.4399 | 1.4648 | 0.2116 | 2.5676 | 6.2089 |
| Mean absolute error (MAE) | 0.2092 | 1.0262 | 1.0427 | 0.1823 | 0.6773 | 1.2922 |
| Root-mean-square error (RMSE) | 0.2439 | 1.1999 | 1.2103 | 0.4600 | 1.6024 | 2.4918 |
Publisher’s Note: MDPI stays neutral with regard to jurisdictional claims in published maps and institutional affiliations. |
© 2020 by the authors. Licensee MDPI, Basel, Switzerland. This article is an open access article distributed under the terms and conditions of the Creative Commons Attribution (CC BY) license (http://creativecommons.org/licenses/by/4.0/).
Share and Cite
Zeng, Z.; Chen, M.; Wang, X.; Wu, W.; Zheng, Z.; Hu, Z.; Ma, B. Modeling and Optimization for Konjac Vacuum Drying Based on Response Surface Methodology (RSM) and Artificial Neural Network (ANN). Processes 2020, 8, 1430. https://doi.org/10.3390/pr8111430
Zeng Z, Chen M, Wang X, Wu W, Zheng Z, Hu Z, Ma B. Modeling and Optimization for Konjac Vacuum Drying Based on Response Surface Methodology (RSM) and Artificial Neural Network (ANN). Processes. 2020; 8(11):1430. https://doi.org/10.3390/pr8111430
Chicago/Turabian StyleZeng, Zhiheng, Ming Chen, Xiaoming Wang, Weibin Wu, Zefeng Zheng, Zhibiao Hu, and Baoqi Ma. 2020. "Modeling and Optimization for Konjac Vacuum Drying Based on Response Surface Methodology (RSM) and Artificial Neural Network (ANN)" Processes 8, no. 11: 1430. https://doi.org/10.3390/pr8111430