Article

Numerical Investigation on the Transient Flow of a Boiler Circulating Pump Based on the Shear Stress Transport Turbulence Model

1
National Research Center of Pumps, Jiangsu University, Zhenjiang 212013, China
2
Wuxi Institute of Technology, School of Mechanical Technology, Wuxi 214121, China
3
NR Electric Power Electronics Co., Ltd., Changzhou 213025, China
*
Author to whom correspondence should be addressed.
Processes 2020, 8(10), 1279; https://doi.org/10.3390/pr8101279
Submission received: 23 June 2020 / Revised: 10 August 2020 / Accepted: 11 August 2020 / Published: 13 October 2020
(This article belongs to the Special Issue CFD Applications in Energy Engineering Research and Simulation)

Abstract

:
Based on the shear stress transport (SST) turbulence model, the influence of different outlet pipe angles on the head and efficiency of a boiler circulating pump was analyzed. When the outlet pipe angle changed from 115° to 130°, the head and efficiency of the pump reduced significantly. The boiler circulating pump with 115° outlet pipe angle was selected as the further research object, and the reliability of the numerical simulation was verified by experiments. The transient flow of the prototype pump under the design flow rate condition (1.0Qd) and four other flow rate conditions (0.6Qd, 0.8Qd, 1.2Qd, and 1.4Qd) was studied. The results show that, under the conditions of design flow and large flow rate (1.0Qd, 1.2Qd, and 1.4Qd), the centrality and regularity of radial force distribution are obviously better than those of small flow rate (0.6Qd, 0.8Qd). The leakage of the rear seal ring is less than that of the front seal ring under five flow rate conditions. As the flow rate increases, the leakage of front and rear seal rings decreases, and the leakage ratio of front and rear seal rings increases. The energy loss of the rear cover plate is greater than the energy loss of the front cover plate under five flow rate conditions. With the increase in flow rate, the total loss energy of the prototype pump decreases first and then increases, and the energy loss of the disc becomes larger and larger.

1. Introduction

At present, electric energy mainly comes from thermal power, nuclear power, hydropower, wind power, and solar power, among which thermal power still occupies the leading position [1]. The boiler circulating pump is an important medium of circulating equipment in supercritical thermal power stations [2,3,4], which is used for circulating high-temperature and high-pressure water. Its stable operation directly affects the safety of the generating unit. For a long time, the boiler circulating pumps used in China mainly depended on imports, and the operation and maintenance costs were high. It is of great significance to carry out research on boiler circulating pumps to improve the level of localization.
Scholars around the world carried out research on boiler circulating pumps, mainly focusing on structural optimization, the hydraulic model, and flow characteristics. Baumgarten et al. [5] re-designed the impeller and diffuser in a boiler circulating pump, analyzed the internal flow of the diffuser and casing, and presented the structure of a hemispherical pump casing and acute angle outlet pipe, which could significantly reduce energy loss and improve the efficiency of the pump. Sha et al. [6] explored the function of a balance hole in the impeller of a high-temperature and high-pressure centrifugal pump, and they found that the axial force decreased by 15% after increasing the balance hole, which effectively improved the performance of the pump. Zuo et al. [7] optimized the casing of a boiler circulating pump based on computational fluid dynamics (CFD) and finite element method (FEM) analyses. Different combinations of casing materials, casing wall thickness, and casing sizes were numerically simulated to evaluate its safety and economic efficiency. Ni et al. [8] studied pressure fluctuation in the spherical shell of a nuclear reactor coolant pump based on large eddy simulation (LES), and pointed out that unsteady vortex flow is one of the main causes of pressure fluctuation in the pump. Su et al. [9] took a nuclear reactor coolant pump as the research object and investigated the change rule of pressure fluctuation during the starting process of the pump; they pointed out that the pressure fluctuation intensity of the guide vane passage was stronger than that of the impeller passage, while the pressure fluctuation intensity of the impeller and the pressure chamber was weaker.
Numerical simulations are widely used in the flow analysis of pumps [10,11,12,13]. The analysis of radial force distribution, seal ring leakage, and disc loss is helpful to improve the performance of pumps and optimize their hydraulic design.
Zhao et al. [14] studied the internal radial force of a deep-sea lifting pump; they pointed out that the dynamic and static interferences of the impeller and diffuser are important reasons for the unbalanced radial force in the pump, while the radial force and pressure in the pump have periodic fluctuation characteristics. Qian et al. [15] investigated the influence of export gland on the radial force in a multistage pump, and the results showed that the amplitude and main frequency of radial force decreased significantly after adding the export gland. Cheng et al. [16] analyzed the influence of the static and rotor clearance ratio on the hydraulic performance of a nuclear main pump. The results showed that the change in clearance ratio has great influence on the hydraulic loss of the guide vane and the water chamber. Gao and Yang [17,18,19] performed numerical simulations to study the effect of clearance on the flow field of a centrifugal pump. The results showed that, with the increase in clearance, the amplitude of pressure fluctuation and the radial force increased, whereas the head and efficiency decreased. Liu et al. [20,21,22] verified and modified the existing disc loss calculation method based on numerical calculations, and they finally obtained a prediction model with high accuracy. Dong et al. [23,24] combined experimental and numerical calculations to verify their disc loss prediction model, and they put forward the shortcomings and basis of the prediction model.
Most of the above studies were based on common centrifugal pumps, while there were few investigations on the radial force of a rotor, the leakage of a seal ring, and the disc loss of a boiler circulating pump.
In this paper, with the help of Pro/Engineer 5.0® software, the three-dimensional (3D) model of a boiler circulating pump was built. Based on the shear stress transport (SST) turbulence model, the influence of the boiler circulating pump with different outlet pipe angles on the head and efficiency of the boiler circulating pump was compared with the help of ANSYS 14.5® software. According to the analysis of different outlet pipe angles, a boiler circulating pump prototype with an outlet pipe angle of 115° was manufactured, performance experiments were carried out, and the experimental results of the boiler circulating pump prototype were compared with the results of a numerical simulation. The radial force of the rotor, the leakage of the seal ring, and the disc loss characteristics of the pump under different flow rate conditions were studied further. The conclusions of this paper can provide a reference for the design and optimization of boiler circulating pumps.

2. Materials and Methods

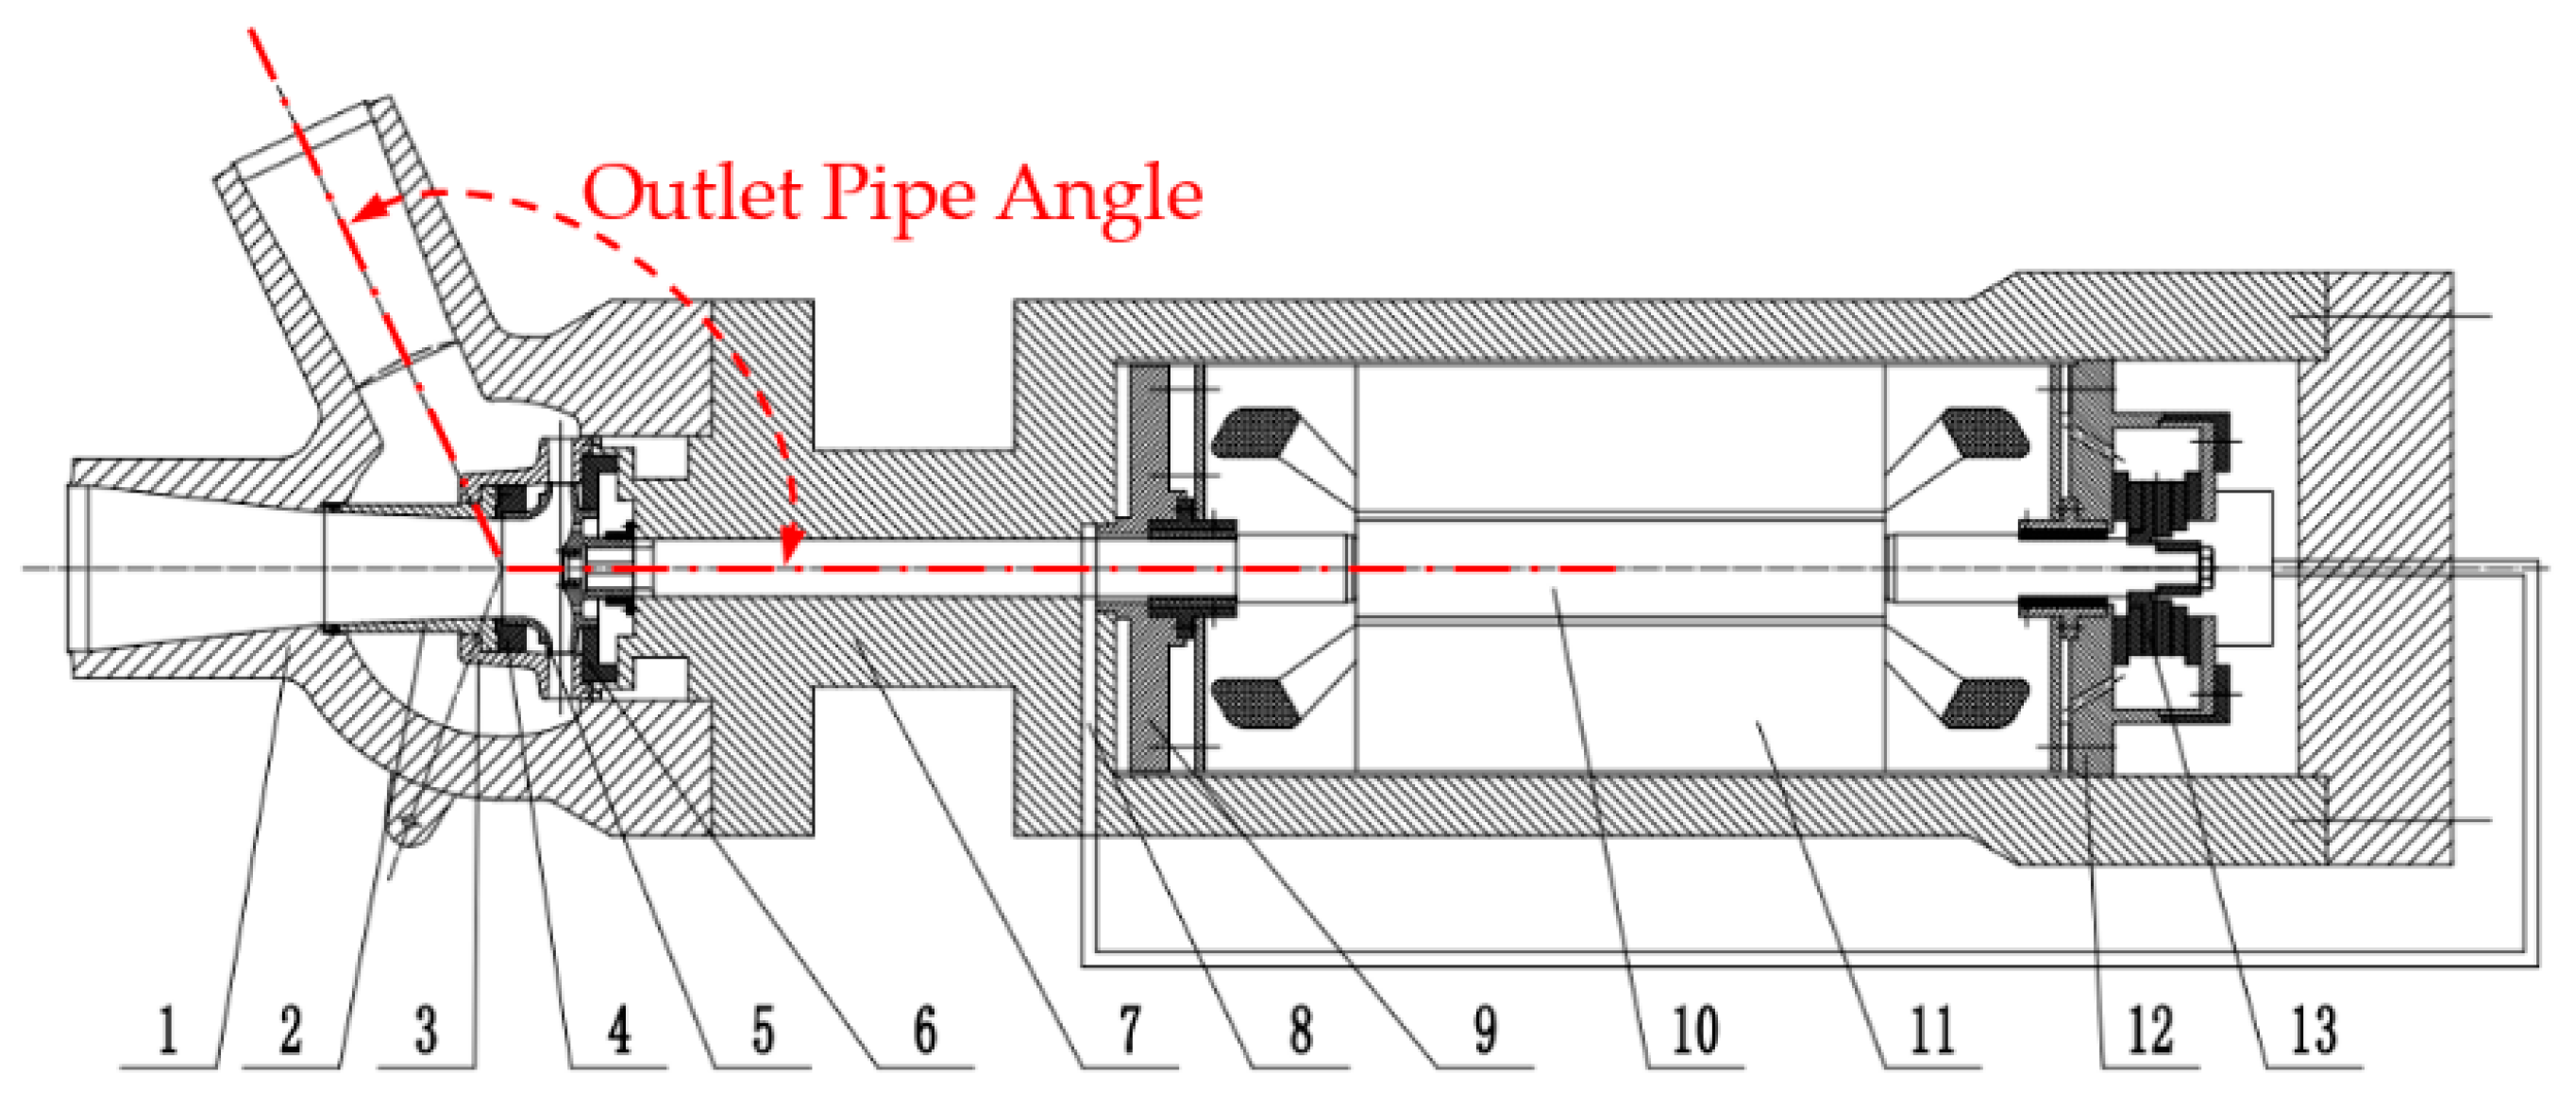
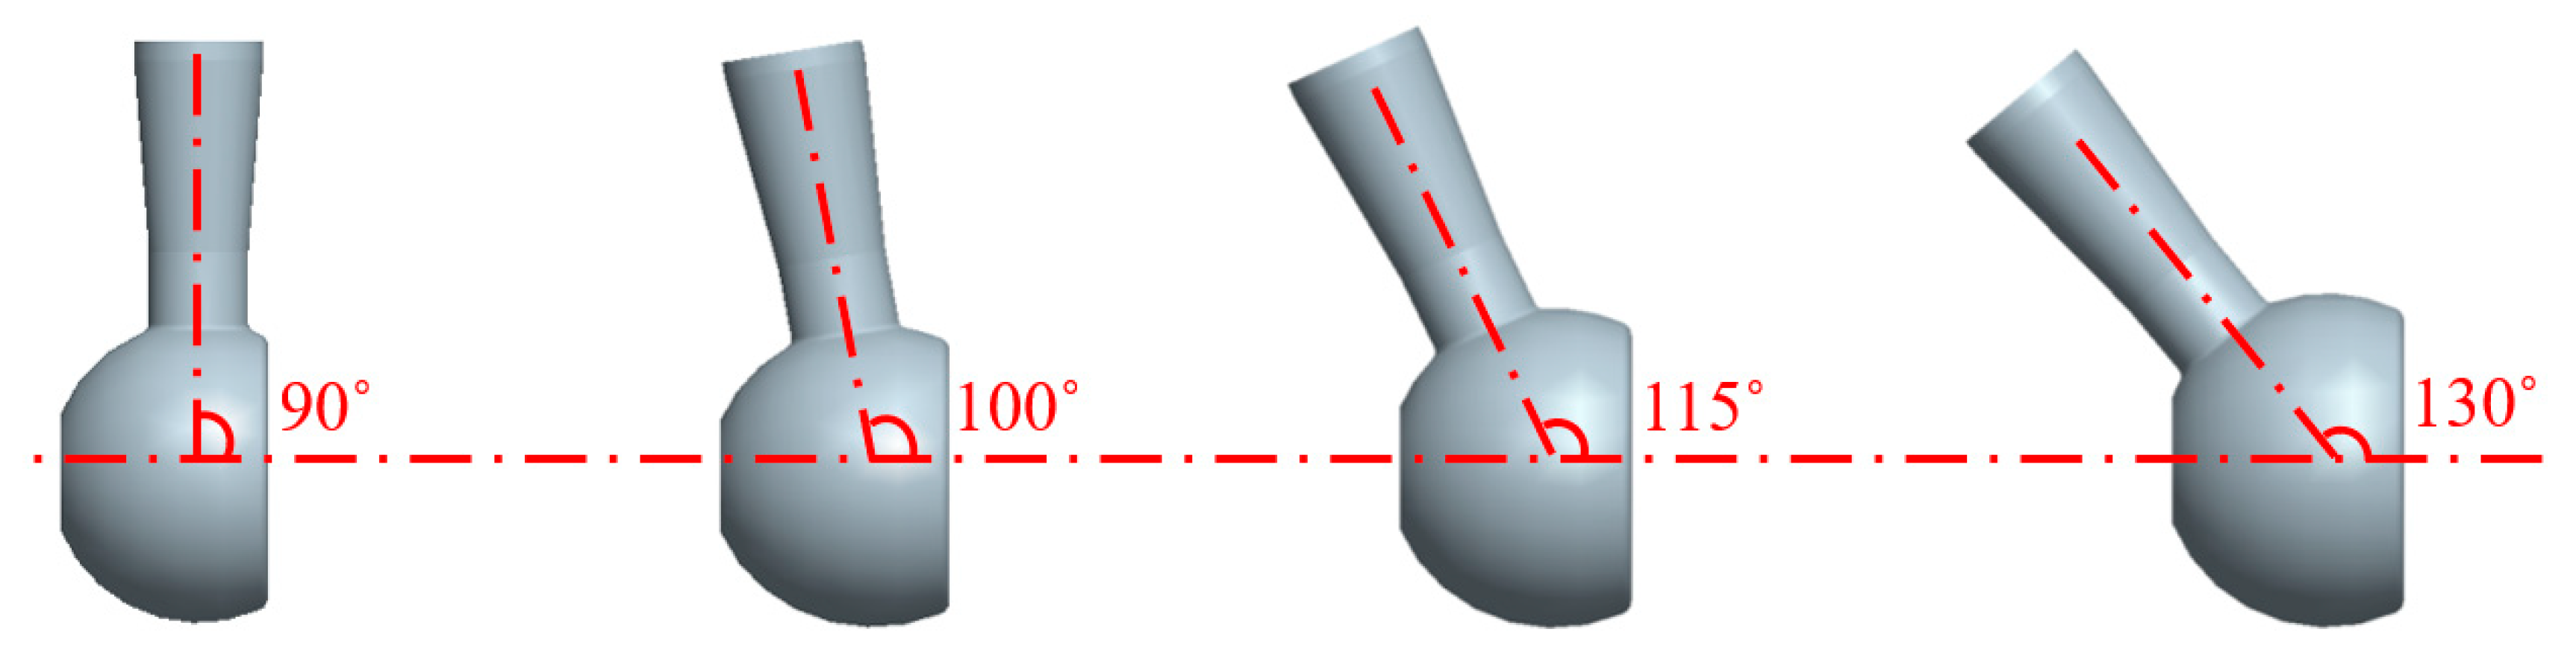
2.1. Pump Structure and Design Schemes of Pump Casing

The design parameters of boiler circulating pump are shown in Table 1. The transport medium of boiler circulating pump is high temperature and high-pressure water. The hemispherical structure shell can effectively balance the problem of asymmetric circumferential deformation, so that the pump casing has a strong compressive capacity. The structure of the boiler circulating pump is shown in Figure 1.
Different outlet pipe angles on the pump casing (as shown in Figure 1) will affect the utilization of the space around the boiler water circulating pump and the performance of the pump. Baumgarten S. et al. [5] of KSB group pointed out that the outlet pipe angle of the boiler circulating pump should be obtuse, but did not specifically analyze the impact of the outlet pipe angle on the performance of the pump. In order to analyze the influence of outlet pipe angle on the performance of boiler circulating pump, four different forms of pump casing have been designed by Pro/Engineer 5.0® software (Parametric Technology Corporation, Needham, MA, USA), as shown in Figure 2; the corresponding outlet pipe angles are 90°, 100°, 115°and 130°, respectively.

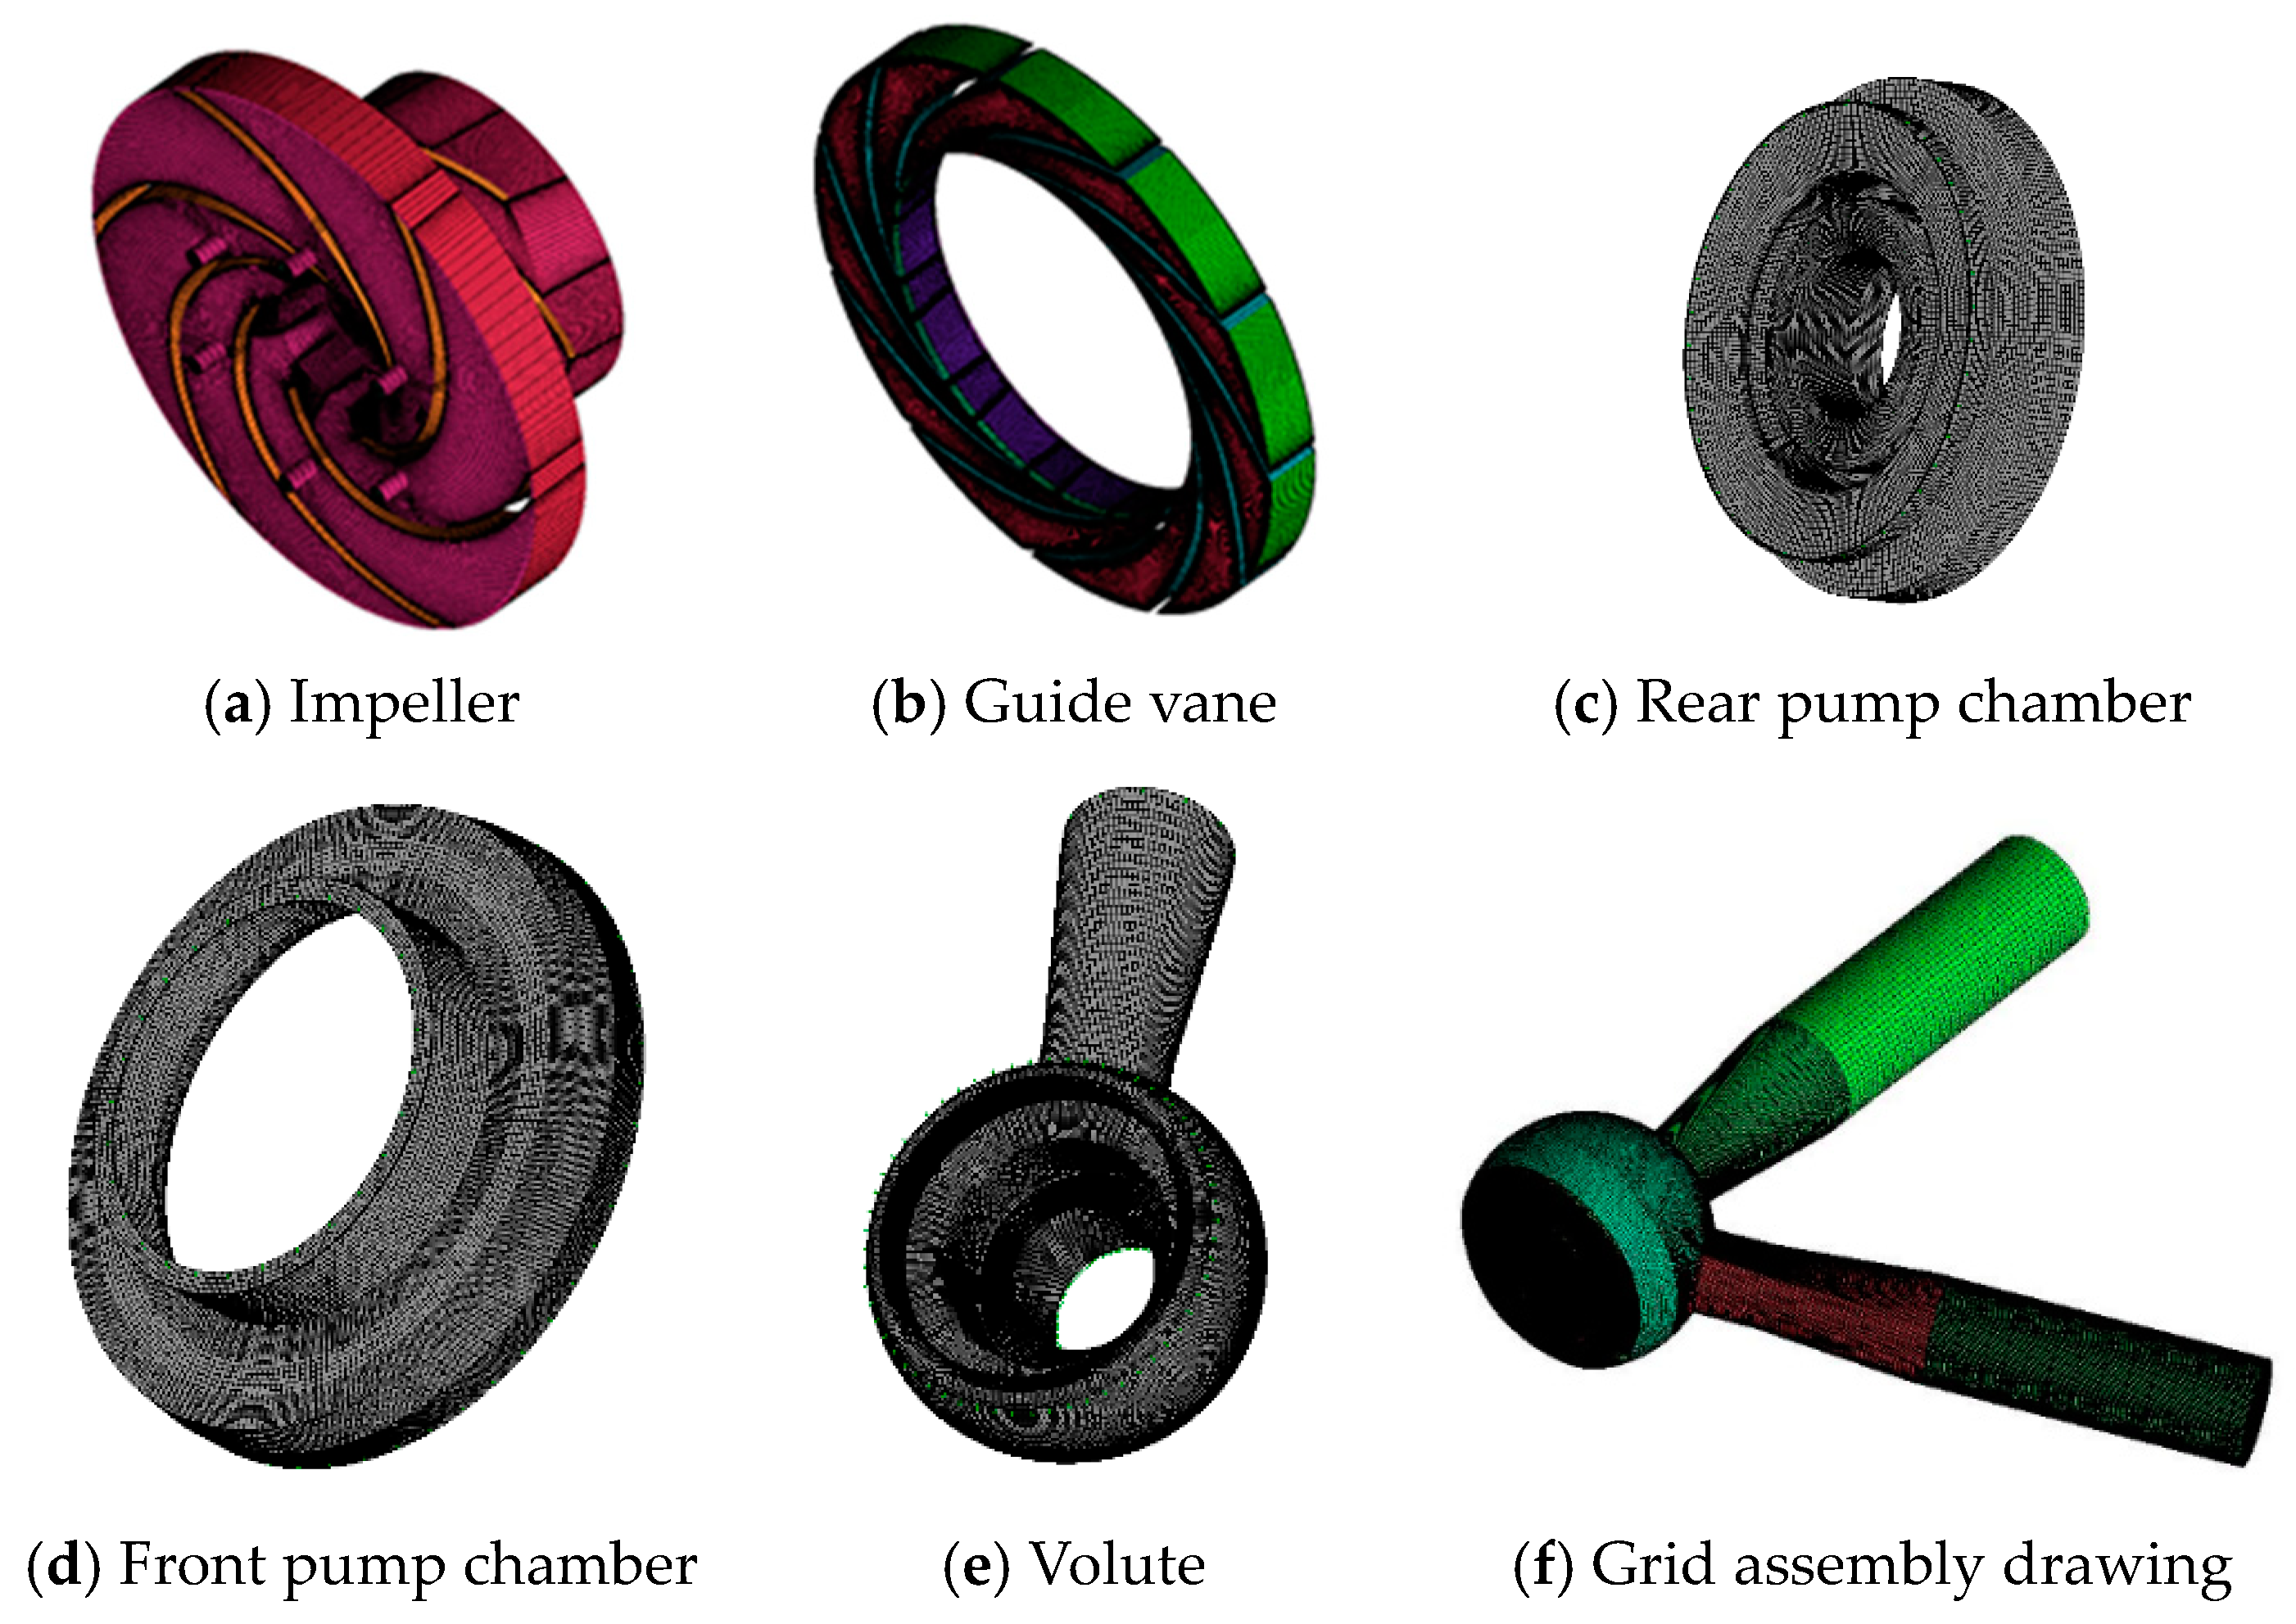
2.2. Mesh Generation and Independence Verification

ICEM 14.5® (ANSYS, Inc., Canonsburg, PA, USA) software was used to divide the hexahedral grid in the convection field. The grid at the blades were densified, and the quality of each water grid was controlled to be greater than 0.35. Figure 3 shows the flow field grid of the boiler circulating pump.
Taking head and efficiency as the evaluation indexes, grid independence analysis was carried out, and the results are shown in Table 2. As can be seen from Table 2, FEM solution developed is convergent and the change of the solution is small when grid number is greater than 2.9 × 10⁶. Considering the limitation of computing time and computer hardware, the 2.9 × 10⁶ grid is selected for numerical simulation.

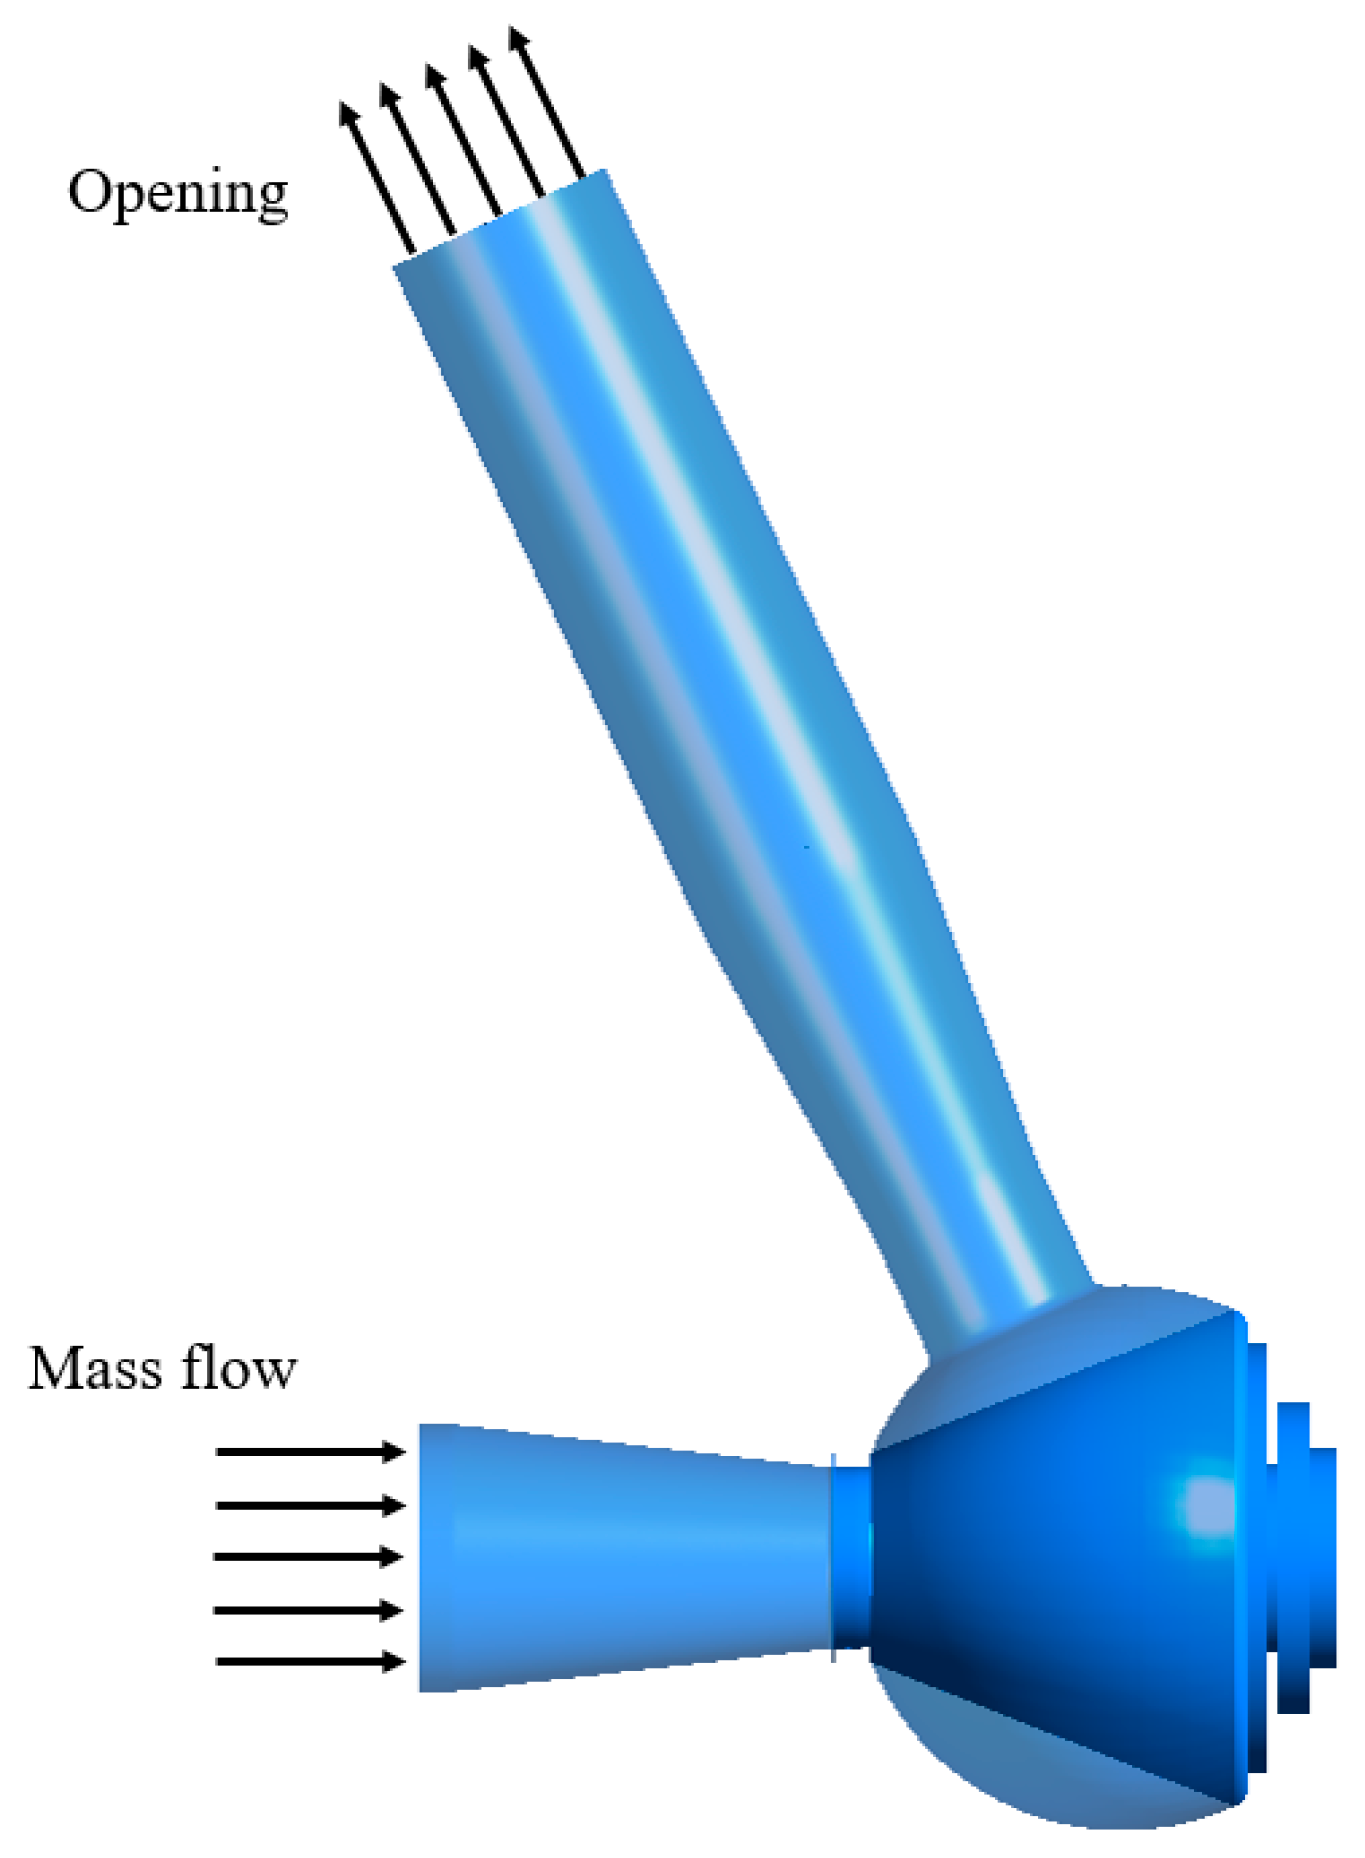
2.3. Turbulence Model and Simulation Setting

The mass conservation and momentum conservation are the basic laws that must be satisfied by the flow system, and the two equations are shown as follows.
x i ( ρ u i ) = 0
x j ( ρ u i u j ) = p x i + x j [ μ ( u i x j + u j x i ) ] + x j ( ρ u i u j ¯ ) + F i
where ρ is the density of liquid, μ is the dynamic viscosity, u means the flow velocity, and F i stands for source item [25].
The shear stress transport (SST) turbulence model is used in numerical simulation of the boiler circulating pump. The SST turbulence model is a mixture of turbulence model k ε and turbulence model k ω , where k means the turbulence kinetic energy, ε means the dissipation of turbulence kinetic energy, ω means the turbulence frequency. The SST turbulence model not only has the accuracy of the model k ε in calculating the free flow in the boundary layer edges and free-shear layers, but also has the reliability of the model k ω in calculating the flow in the near wall layers [26,27]. The control equations of SST turbulence model are as follows [28,29].
t ( ρ k ) + x i ( ρ u i k ) = P ˜ k β * ρ k ω + x i [ ( μ + σ k μ t ) k x i ]
t ( ρ ω ) + x i ( ρ u i ω ) = α 1 v t P ˜ k β ρ ω 2 + x i [ ( μ + σ ω μ t ) ω x i ] + 2 ( 1 F 1 ) ρ σ ω 2 1 ω k x i ω x i
v t = a 1 k max ( a 1 ω , S F 2 )
S = 2 S i j S i j
P k = μ t u i x j ( u i x j + u j x i ) P ˜ k = m i n ( P k , 10 β * ρ k ω )
F 1 = tan h { { m i n [ m a x ( k β * ω y , 500 v y 2 ω ) , 4 ρ σ ω 2 k C D k ω y 2 ] } 4 }
F 2 = tan h { [ m a x ( 2 k β * ω y , 500 v y 2 ω ) ] 2 }
C D k ω = m a x ( 2 ρ σ ω 2 1 ω k x i ω x i , 10 10 )
α = α 1 F 1 + α 2 ( 1 F 1 )
where, ρ means the density of liquid, k means the turbulence kinetic energy, u i means the flow velocity, ω means the turbulence frequency, y means the distance to the nearest wall, S means the invariant measure of the strain rate. F 1 and F 2 are the blending functions. The constants in the above equations are: β * = 0.09 , α 1 = 5 / 9 , β 1 = 0.075 , σ k 1 = 0.85 , σ ω 1 = 0.5 , α 2 = 0.44 ,   β 2 = 0.0828 ,   σ k 2 = 1.0 , σ ω 2 = 0.856 .
The constant calculation used the inlet mass flow and outlet opening setting. Figure 4 shows the boundary conditions of the boiler circulating pump in the numerical simulation.
The outer wall of the impeller was set as the rotating wall, and the rotating speed was 2950 r/min. The solid wall adopted the non-slip boundary condition. According to the actual situation, the wall roughness was set to 25 μm, and the near wall area was treated by the standard wall function. The interface connection between the dynamic and static areas was set to the frozen rotor mode, and the calculation convergence residual was set to 10−5.
The setting of time step in the unsteady calculation was based on the Courant number criterion [30]:
C 0 = | v ¯ | Δ t l 50
where, v ¯ stands for estimate average speed (m/s), l stands for the minimum size of grid (m). Set the time step to 1.69492 × 10⁻⁴ s, and rotate 120 steps for one cycle.

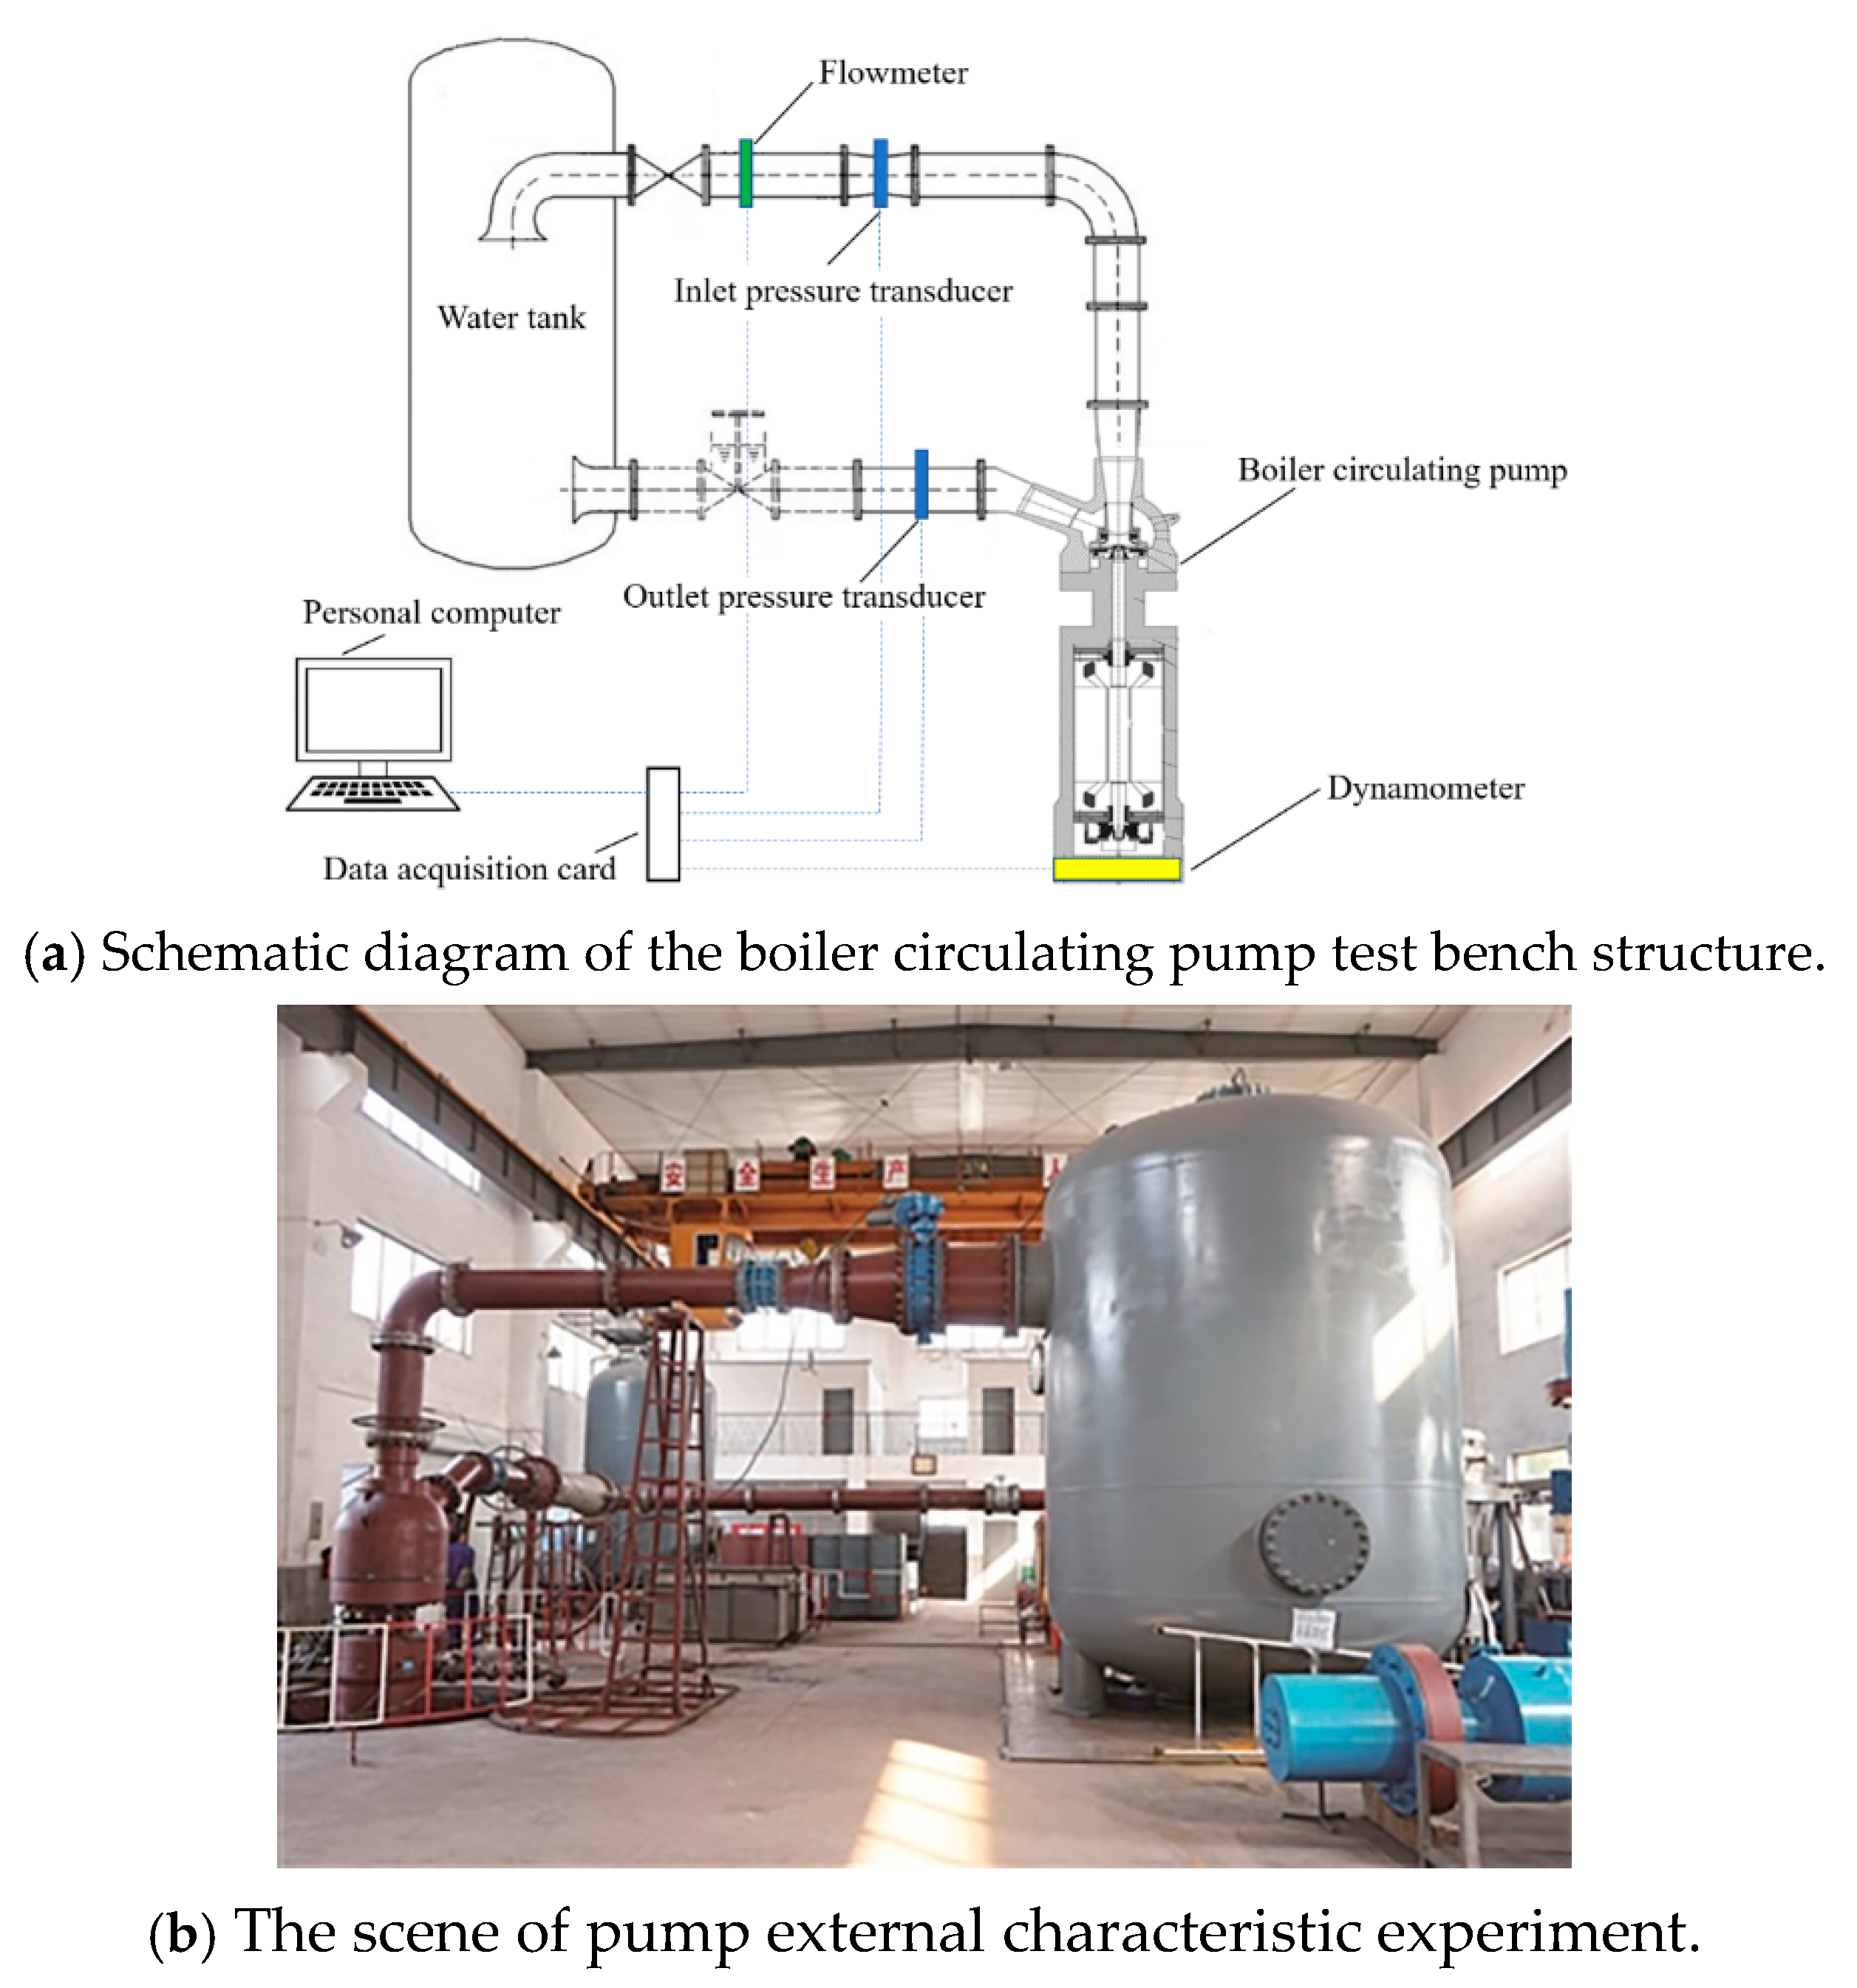
2.4. Test Bench for Boiler Circulating Pump

The external characteristic experiment was carried out at the boiler circulating pump test bench in Wanhua Electrical Machinery Tech. Development Co., Ltd. Schematic diagram of the boiler circulating pump test bench structure and the scene of pump external characteristic experiment are shown in Figure 5a,b, respectively.

3. Results and Discussion

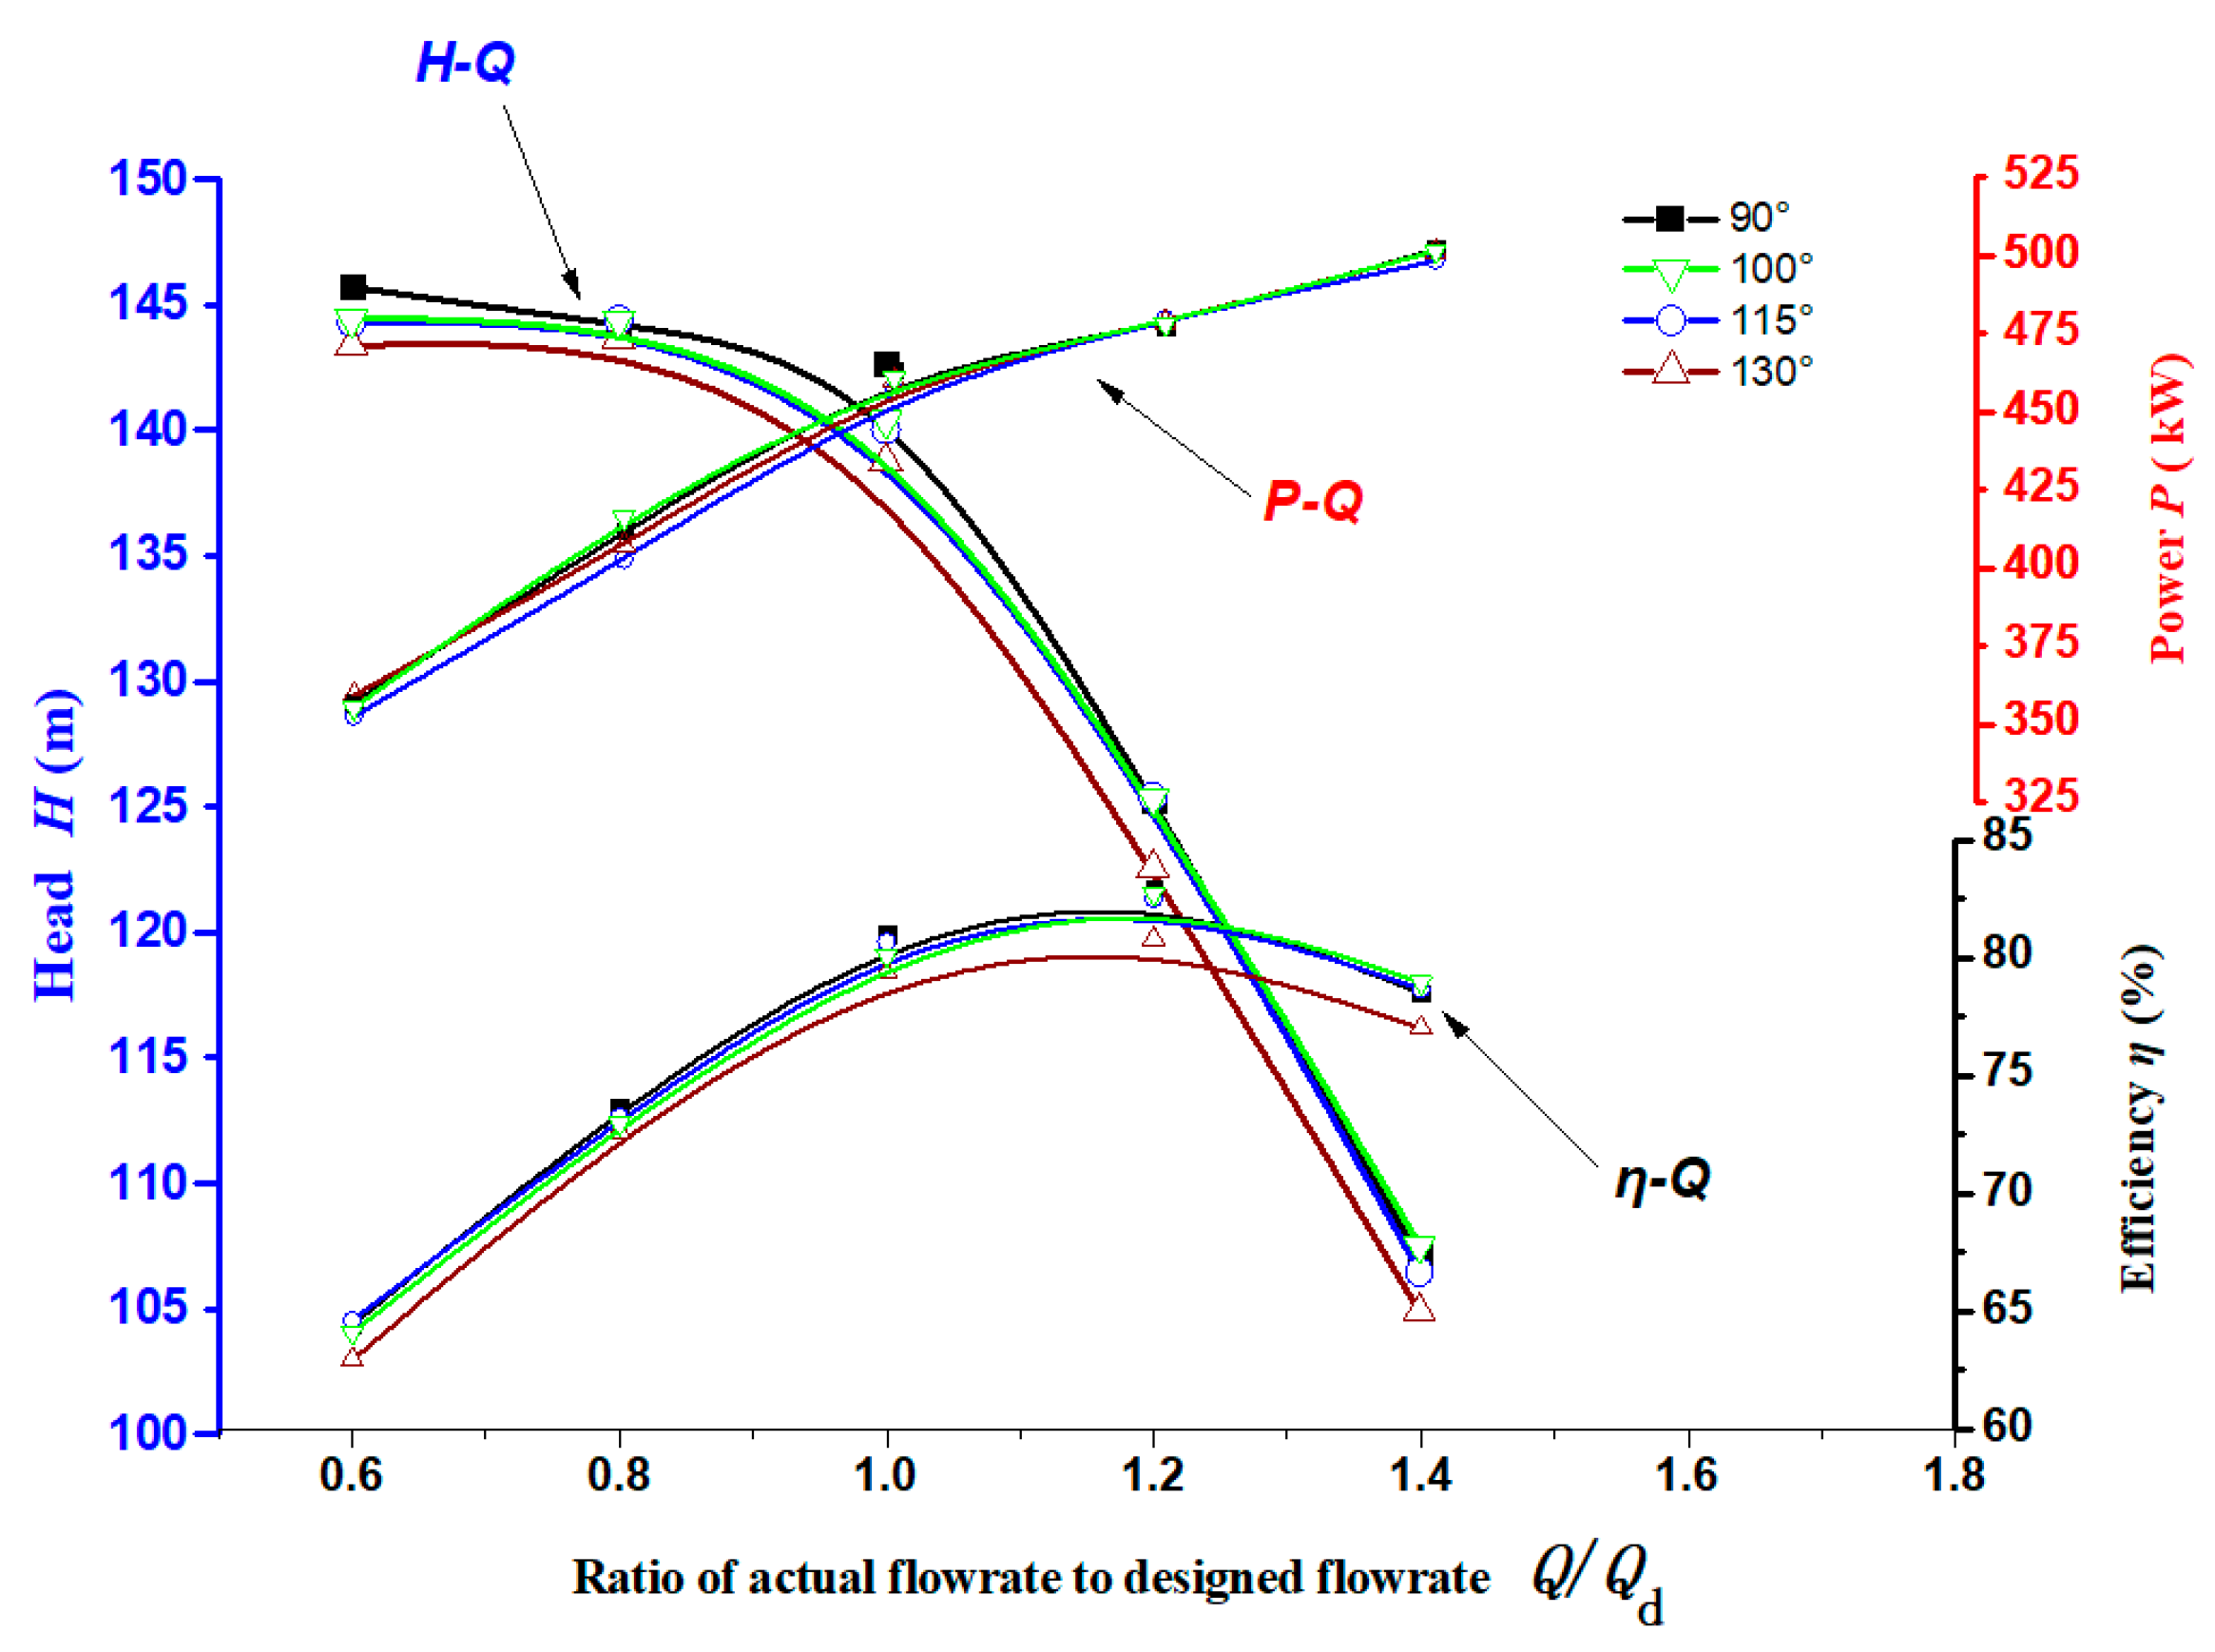
3.1. Influence of Outlet Pipe Angle on Pump Head and Efficiency

The external characteristic curve of numerical simulation for different outlet pipe angles (90°, 100°, 115°, 130°) under different flow rates (0.6Qd, 0.8Qd, 1.0Qd, 1.2Qd, and 1.4Qd) is shown in Figure 6.
It can be seen from Figure 6 that the pump head, efficiency and shaft power curves corresponding to the outlet pipe angles of 90°, 100° and 115° are basically the same. When the outlet pipe angle is 130°, compared with the other three outlet pipe angles, the maximum head drop is about 2.8 m, and the maximum efficiency drop is about 2.1%. It can be seen from the above that in a certain range of outlet pipe angle (90° to 115°), the change of head and efficiency is very small. When the outlet pipe angle is 130°, the pump head and efficiency reduce significantly.

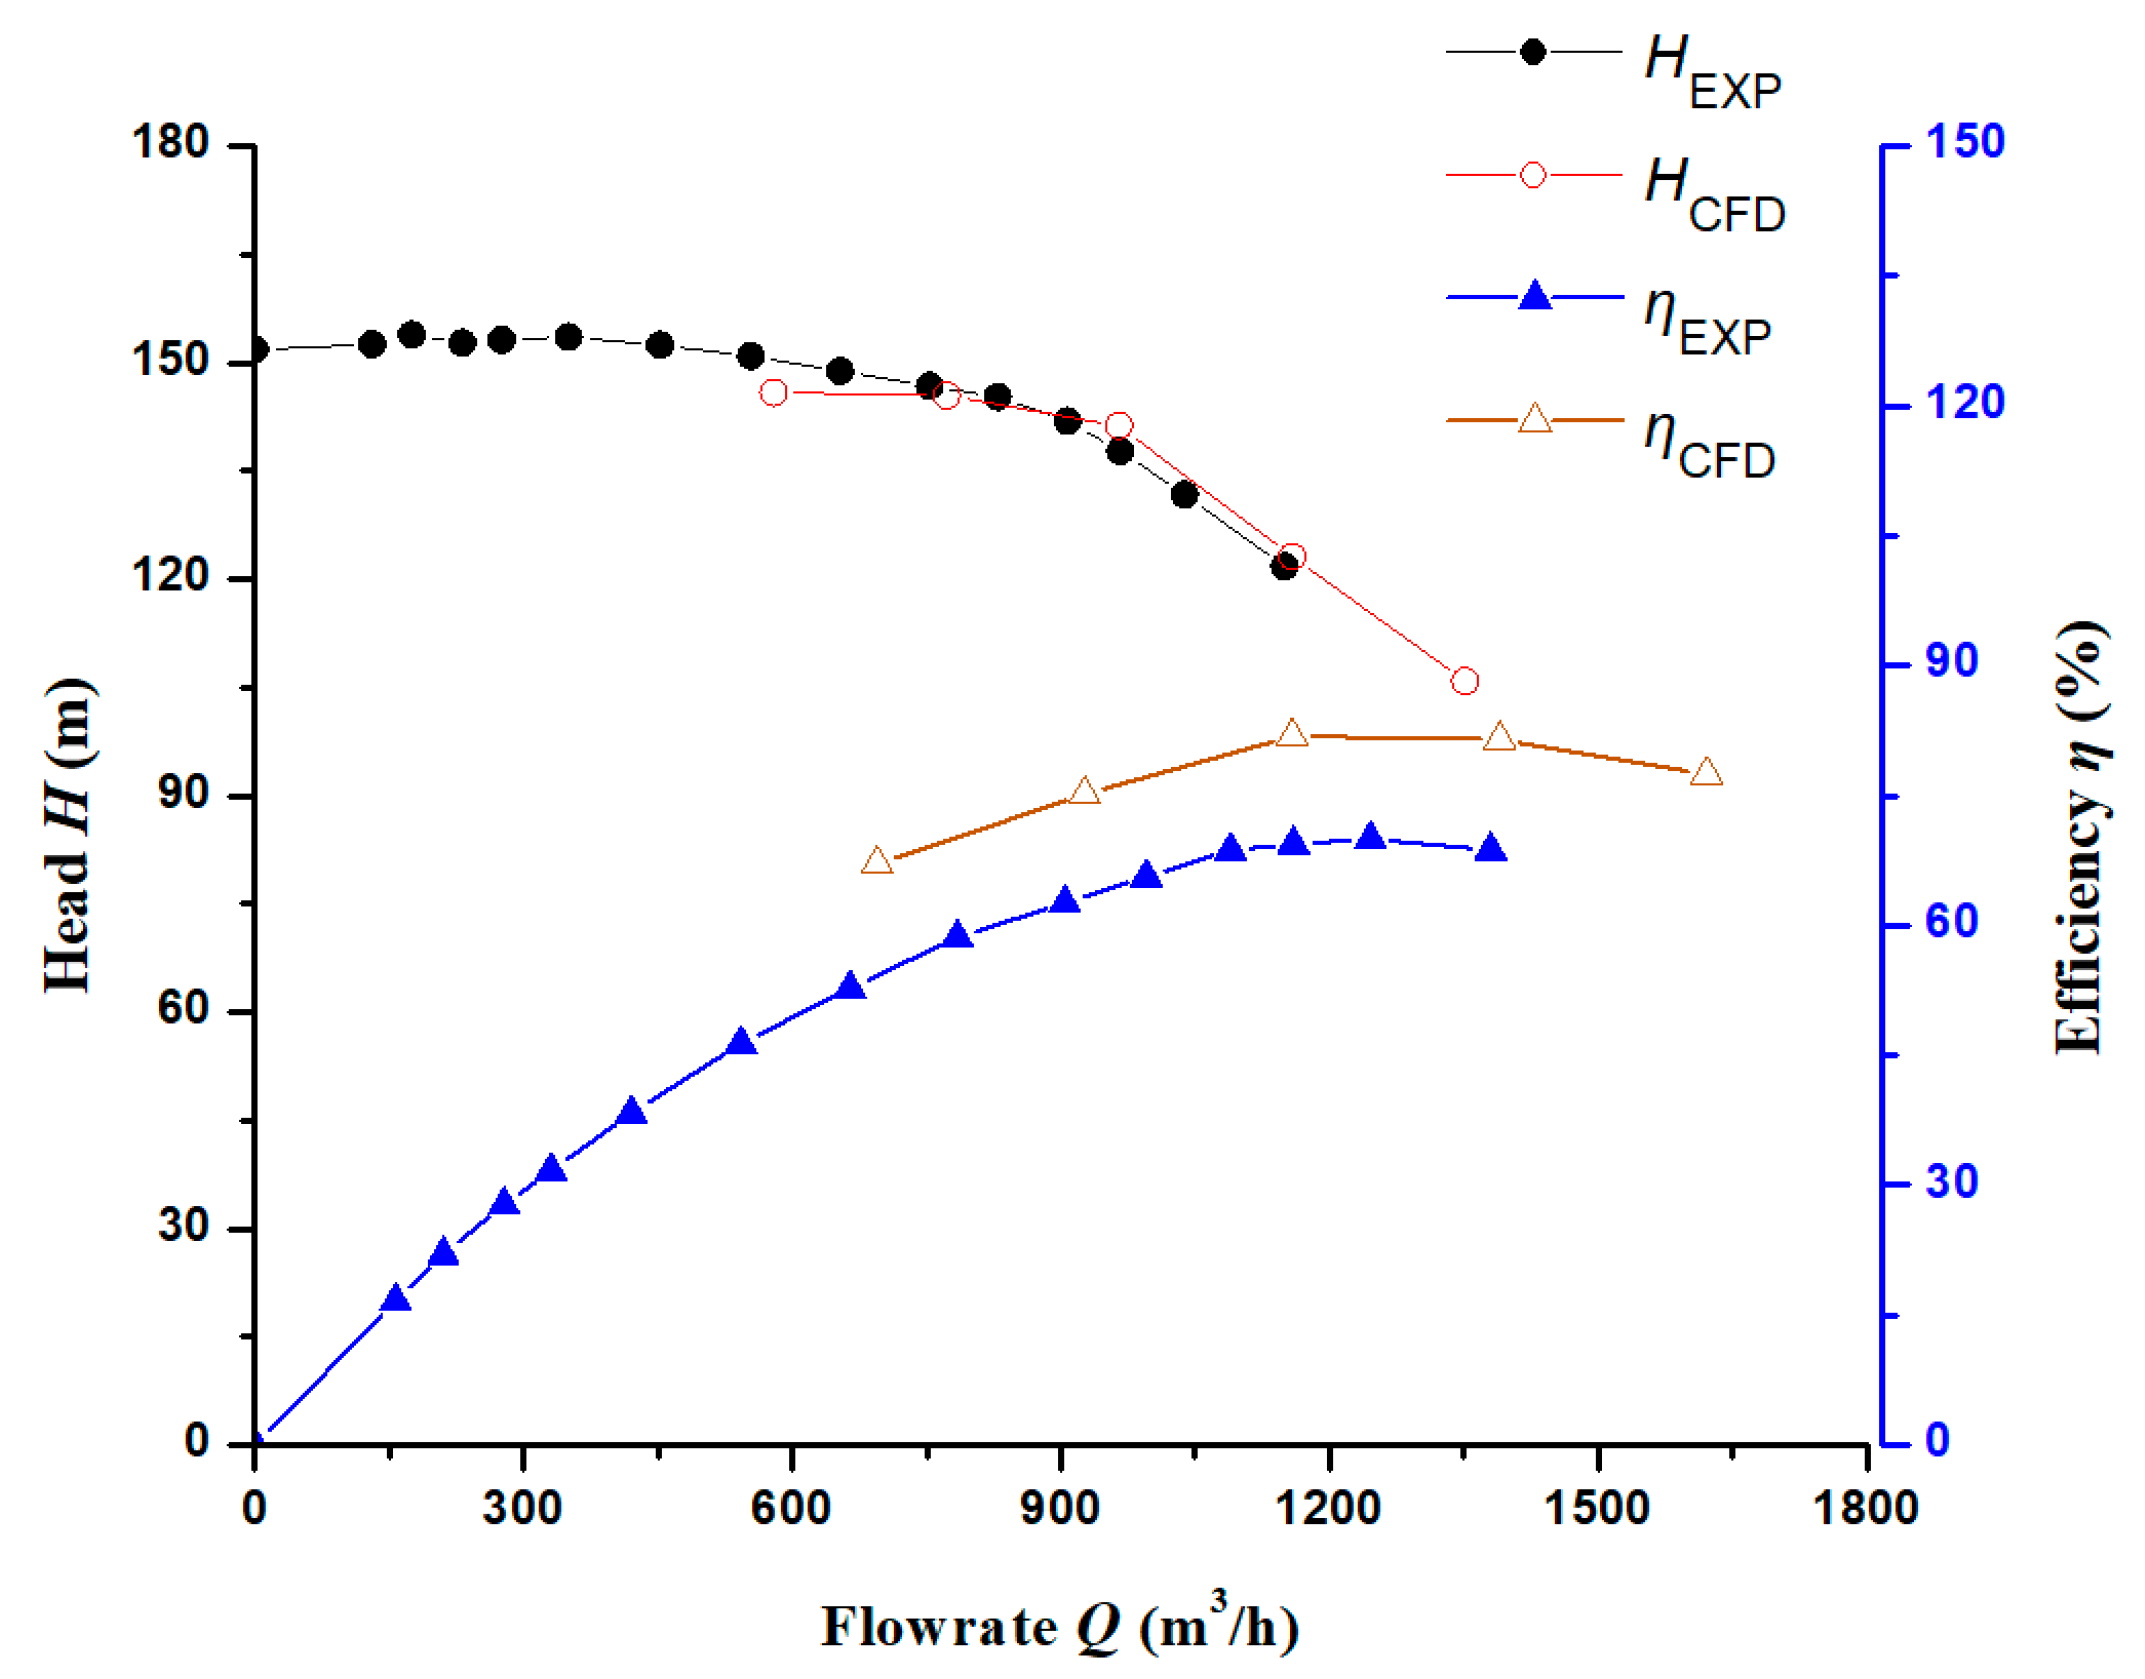
3.2. Experimental Verification

According to the analysis in the previous section, a boiler circulating pump prototype with an outlet pipe angle of 115° was manufactured; the experimental results of the boiler circulating pump prototype were compared with the results of numerical simulation. The uncertainty estimation of the experiment was conducted according to the ISO 9906:2012(E) international standard [31].
The experimental overall uncertainty e is given by:
e = e R 2 + e S 2
where e R is random uncertainty, and e S stands for system uncertainty.
The random uncertainty e R is given by:
e R = 100 t s x ¯ n %
when the reading number n is eight, according to reference [31], the value of t is 2.32. The arithmetic mean x ¯ of a set of repeated observations x i (i = 1, 2, ..., n) is calculated by the following formula.
x ¯ = 1 n x i
where n stands for the number of readings. The observation x i could be the pump head H, flowrate Q or pump efficiency η.
The standard deviation s of the observations is given by:
s = 1 n 1 ( x i x ¯ ) 2
The system uncertainty e S mainly depends on the uncertainty of the measuring instrument. The flowrate was measured by electromagnetic flowmeter with the uncertainty of ±0.25%. The inlet pressure and outlet pressure were measured by pressure transducers with the uncertainty of ±0.3%. The input electric power is measured by the dynamometer with the uncertainty of ±0.3%. Based on above formulas, the uncertainties of flowrate, pump head, and pump efficiency are calculated, as shown in Table 3.
The head and efficiency at five flow rate conditions (0.6Qd, 0.8Qd, 1.0Qd, 1.2Qd, and 1.4Qd) were calculated and experimented, respectively, and the corresponding external characteristic curve was drawn. The comparison between the experimental results and the computational fluid dynamics calculation results is shown in Figure 7.
As can be seen from Figure 7, the numerical calculation head is basically the same as the experimental head, while the numerical calculation efficiency is higher than the experimental efficiency. The loss of efficiency between the simulated and the experimental is shown in the Table 4.
The main reason for the efficiency loss between the simulation and the experiment is that the boiler circulating pump is an integral structure pump, and the shaft power cannot be measured directly. During the experiment, the input electric power is measured, and the loss of the motor converting electric energy to mechanical energy has not been deducted, so the experimental efficiency is low. Therefore, the numerical results are reasonable and reliable.

3.3. Analysis of Rotor Radial Force

In the vane pumps, because of the interference between the moving and stationary blades, the flow field inside the impeller is asymmetric, which causes the rotor to be affected by the transient radial force. The radial force of the rotor will affect the stability of the pump operation. The analysis of the radial force distribution of the boiler circulating pump at different flow rate conditions is helpful to improve and optimize the design of the pump.
Through the analysis of the transient calculation results, the radial force vector distribution of the rotor at different flow rate conditions is obtained, as shown in Figure 8. It can be seen from Figure 8 that the distribution regularity and track centricity of radial force vector are poor under the flow rate conditions of 0.6Qd and 0.8Qd, and the regularity is stronger and the track centricity is better under flow rate conditions of 1.0Qd, 1.2Qd and 1.4Qd. Under the conditions of small flow rate, the regularity and centricity are improved with the increase in flow rate, and under the conditions of design and large flow rate, the regularity is enhanced. With the increase in flow rate, the distribution range of the radial force vector decreases gradually.
The guide vane has a certain interference effect on the flow field in the fluid domain of the impeller. Its direct effect is that the asymmetric interference makes the flow field in the impeller circumferentially asymmetric, and the asymmetric flow field will cause the unbalanced force on the impeller in the fluid domain. Figure 9 shows the circumferential pressure distribution at the impeller outlet under different flow rate conditions, showing certain periodicity under five flow rate conditions, with 11 fluctuations, consistent with the number of guide vanes.
It can be seen from Figure 9 that although the pressure distribution at the outlet of the impeller is periodic, the circumferential direction is not completely symmetrical, so it interferes with the internal flow field of the impeller, resulting in the hydraulic imbalance of the internal flow field of the impeller and the radial force described in Figure 8.
In Figure 10, areas A and B are circumferentially symmetrical. Under five flow rate conditions, the pressure distribution in the circumferentially symmetrical area and inside the flow passage of the impeller appears to be asymmetrical, resulting in the circumferential asymmetry of the pressure acting on the wall surface of the flow passage of the impeller. According to Figure 9 and Figure 10, with the increase in flow rate, the pressure at the outlet of impeller decreases, and the pressure difference between guide vane and impeller decreases, which reduces the radial force of impeller caused by asymmetry to a certain extent. The pressure distribution in impeller and guide vane reveal that pressure fluctuation of the flow field is more periodic with the increase in flow rate, which to some extent controls the asymmetry of the flow field in the impeller.

3.4. Leakage Analysis of Front and Rear Seal Ring

The dynamic and static cooperation between impeller and pump casing forms the clearances at the front and the rear ring, which prevent the medium in the high-pressure area from leaking to the low-pressure area under the joint action of the dynamic and static rotors. The clearances at the seal rings are very small, at the same time, there is relative rotation between the rotor and the stator, which makes the flow resistance of the structure larger and can effectively control the leakage. Under different flow rate conditions, the pressure distribution of the flow field is different, which makes the leakage of the front and rear seal ring change. The mathematical expressions of leakages are shown as follows [32].
Q d = Q + q
q = q f + q r
Δ m = Δ m f + Δ m r
Δ m f = ρ q f
Δ m r = ρ q r
where, Q is the actual flow rate of pump, q is the leaked flow rate of pump, Δ m is the total leakage, Δ m f is the leakage of front seal ring, Δ m r is the leakage of rear seal ring, ρ is the density of liquid, q f is the leaked flow rate of front seal ring, q r is the leaked flow rate of rear seal ring.
Figure 11 describes the statistical chart of the leakage of seal rings and the pressure difference of the pump chamber, wherein the pressure difference of the pump chamber is the pressure difference between the inlet of the pump chamber and the inlet of the pump impeller. According to the overall distribution of the statistical chart, with the increase in the flow rate, the pressure difference at the inlet and outlet of the pump chamber, the leakage of the seal rings and the total leakage as a percentage of total flow all decrease. The variation trend of the pressure difference between the front and rear pump chambers is the same. The pressure difference at the inlet of the pump chamber decreases with the increase in the flow rate, which is in line with the characteristics of the pump. The absolute value of front and rear seal ring leakage changes little under five flow rate conditions, so the total leakage as a percentage of total flow decreases with the increase in flow rate.
The results show that the pressure differences between the front and rear pump chambers at 0.6 Qd and 1.4Qd are 180,620.1 Pa and 172,596.3 Pa, respectively. Under five flow rate conditions (0.6Qd, 0.8Qd, 1.0Qd, 1.2Qd, and 1.4Qd), the leakage values of the front seal ring are 2.43 kg/s, 2.38 kg/s, 2.29 kg/s, 1.95 kg/s and 1.63 kg/s, and the leakage values of the rear seal ring are 1.22 kg/s, 0.98 kg/s, 0.89 kg/s, 0.74 kg/s and 0.56 kg/s. The leakage ratio values of the front seal ring and the rear seal ring are 1.95, 2.48, 2.56, 2.64 and 2.88. With the increase in the flow rate, the leakage of the front seal ring and rear seal ring decreases. The main reason is that the pressure at the inlet of the pump chamber decreases with the increase in the flow rate. The absolute value of the leakage of the front seal ring is higher than that of the rear seal ring, mainly because the structure of the rear pump chamber is more complex than that of the front pump chamber, resulting in greater flow resistance. Therefore, the leakage of the rear pump chamber is less than that of the front pump chamber, and the leakage ratio of the front and rear seal ring increases with the increase in the flow rate.

3.5. Disc Loss Analysis

Disc loss is an important part of pump energy loss. Analyzing the characteristics of disc loss at different flow rate conditions can effectively guide the design and optimization of the pump. The mathematical expressions of disc losses are shown as follows [32].
The impeller energy consumption Ptotal is:
P total = P uesful + P loss = N ω
The useful energy Puesful is:
P uesful = ρ g Q d H
The total energy loss Ploss is:
P loss = P total P uesful = M ω ρ g Q d H
The energy loss of disc Pdl is:
P dl = P fdl + P rdl = M f ω + M r ω
Percentage of front cover plate loss to total energy loss ηfl is:
η fl = P fdl / P loss = M f ω / ( M ω ρ g Q d H )
Percentage of rear cover plate loss to total energy loss ηrl is:
η rl = P rdl / P loss = M r ω / ( M ω ρ g Q d H )
Percentage of energy loss of disc to total energy loss ηdl is:
η dl = P dl / P total = ( M f ω + M r ω ) / ( M ω )
Equation (28) can be simplified as:
η dl = ( M f + M r ) / M
where, M is the torque of impeller, ω is the angular velocity of rotation, Mf is the torque of front cover plate, Mr is the torque of rear cover plate, Qd is the design flow rate of pump, H is the hydraulic head of pump.
The numerical results show that the total energy loss values under five flow rate conditions are 52,754.1 W, 40,539.4 W, 27,163.1 W, 28,609.6 W and 42,177.7 W, respectively. The total energy loss decreases first and then increases with the increase in flow rate, and reaches the minimum at 1.0Qd. Figure 12 shows the statistical chart of disc loss. The disc loss energy increases with the increase in flow rate, which is in line with the actual design and operation conditions. As the total loss energy decreases first and then increases, the disc loss increases with the flow, so the disc loss percentage increases first and then decrease. The energy loss of the rear cover plate is higher than that of the front cover plate under five flow rate conditions. The main reason is that the length of the boundary line of the rear cover plate is longer than that of the front cover plate, and the volume of the rear pump chamber is larger than that of the front pump chamber, so the energy loss of the front cover plate is smaller than that of the rear cover plate.
The change of flow rate has a limited impact on the absolute value of energy loss of the front cover plate, and a greater impact on the rear cover plate. With the increase in flow rate, the absolute value of energy loss of rear cover plate increases. The structure of rear pump chamber is more complex, and the flow change has a great impact on the flow in the pump chamber. Thus, the energy loss of the rear cover plate changes greatly.
Figure 13 shows the shear stress distribution of the front and rear cover plates. Under different flow rate conditions, the distribution trend of shear stress on the wall of front and rear cover plates is the same, and the difference at different conditions is small. The shear stress increases at the abrupt change of the clearance and the wall. Therefore, the abrupt change of the cover plate wall should be avoided in the design process. At the same time, the reasonable control of the clearance size will also reduce the shear strain rate, thereby reducing the disc energy loss.

4. Conclusions and Future Work

ANSYS-CFX is used to analyze the influence of different outlet pipe angles on the head and efficiency of the boiler circulating pump. The transient flow of the prototype pump with 115° outlet pipe angle under different flow rate conditions are analyzed. The conclusions are as follows.
(1)
In a certain range of outlet pipe angle (90° to 115°), the change of head and efficiency is very small. When the outlet pipe angle is 130°, compared with the other three outlet pipe angles, the maximum head drop is about 2.8 m, and the maximum efficiency drop is about 2.1%.
(2)
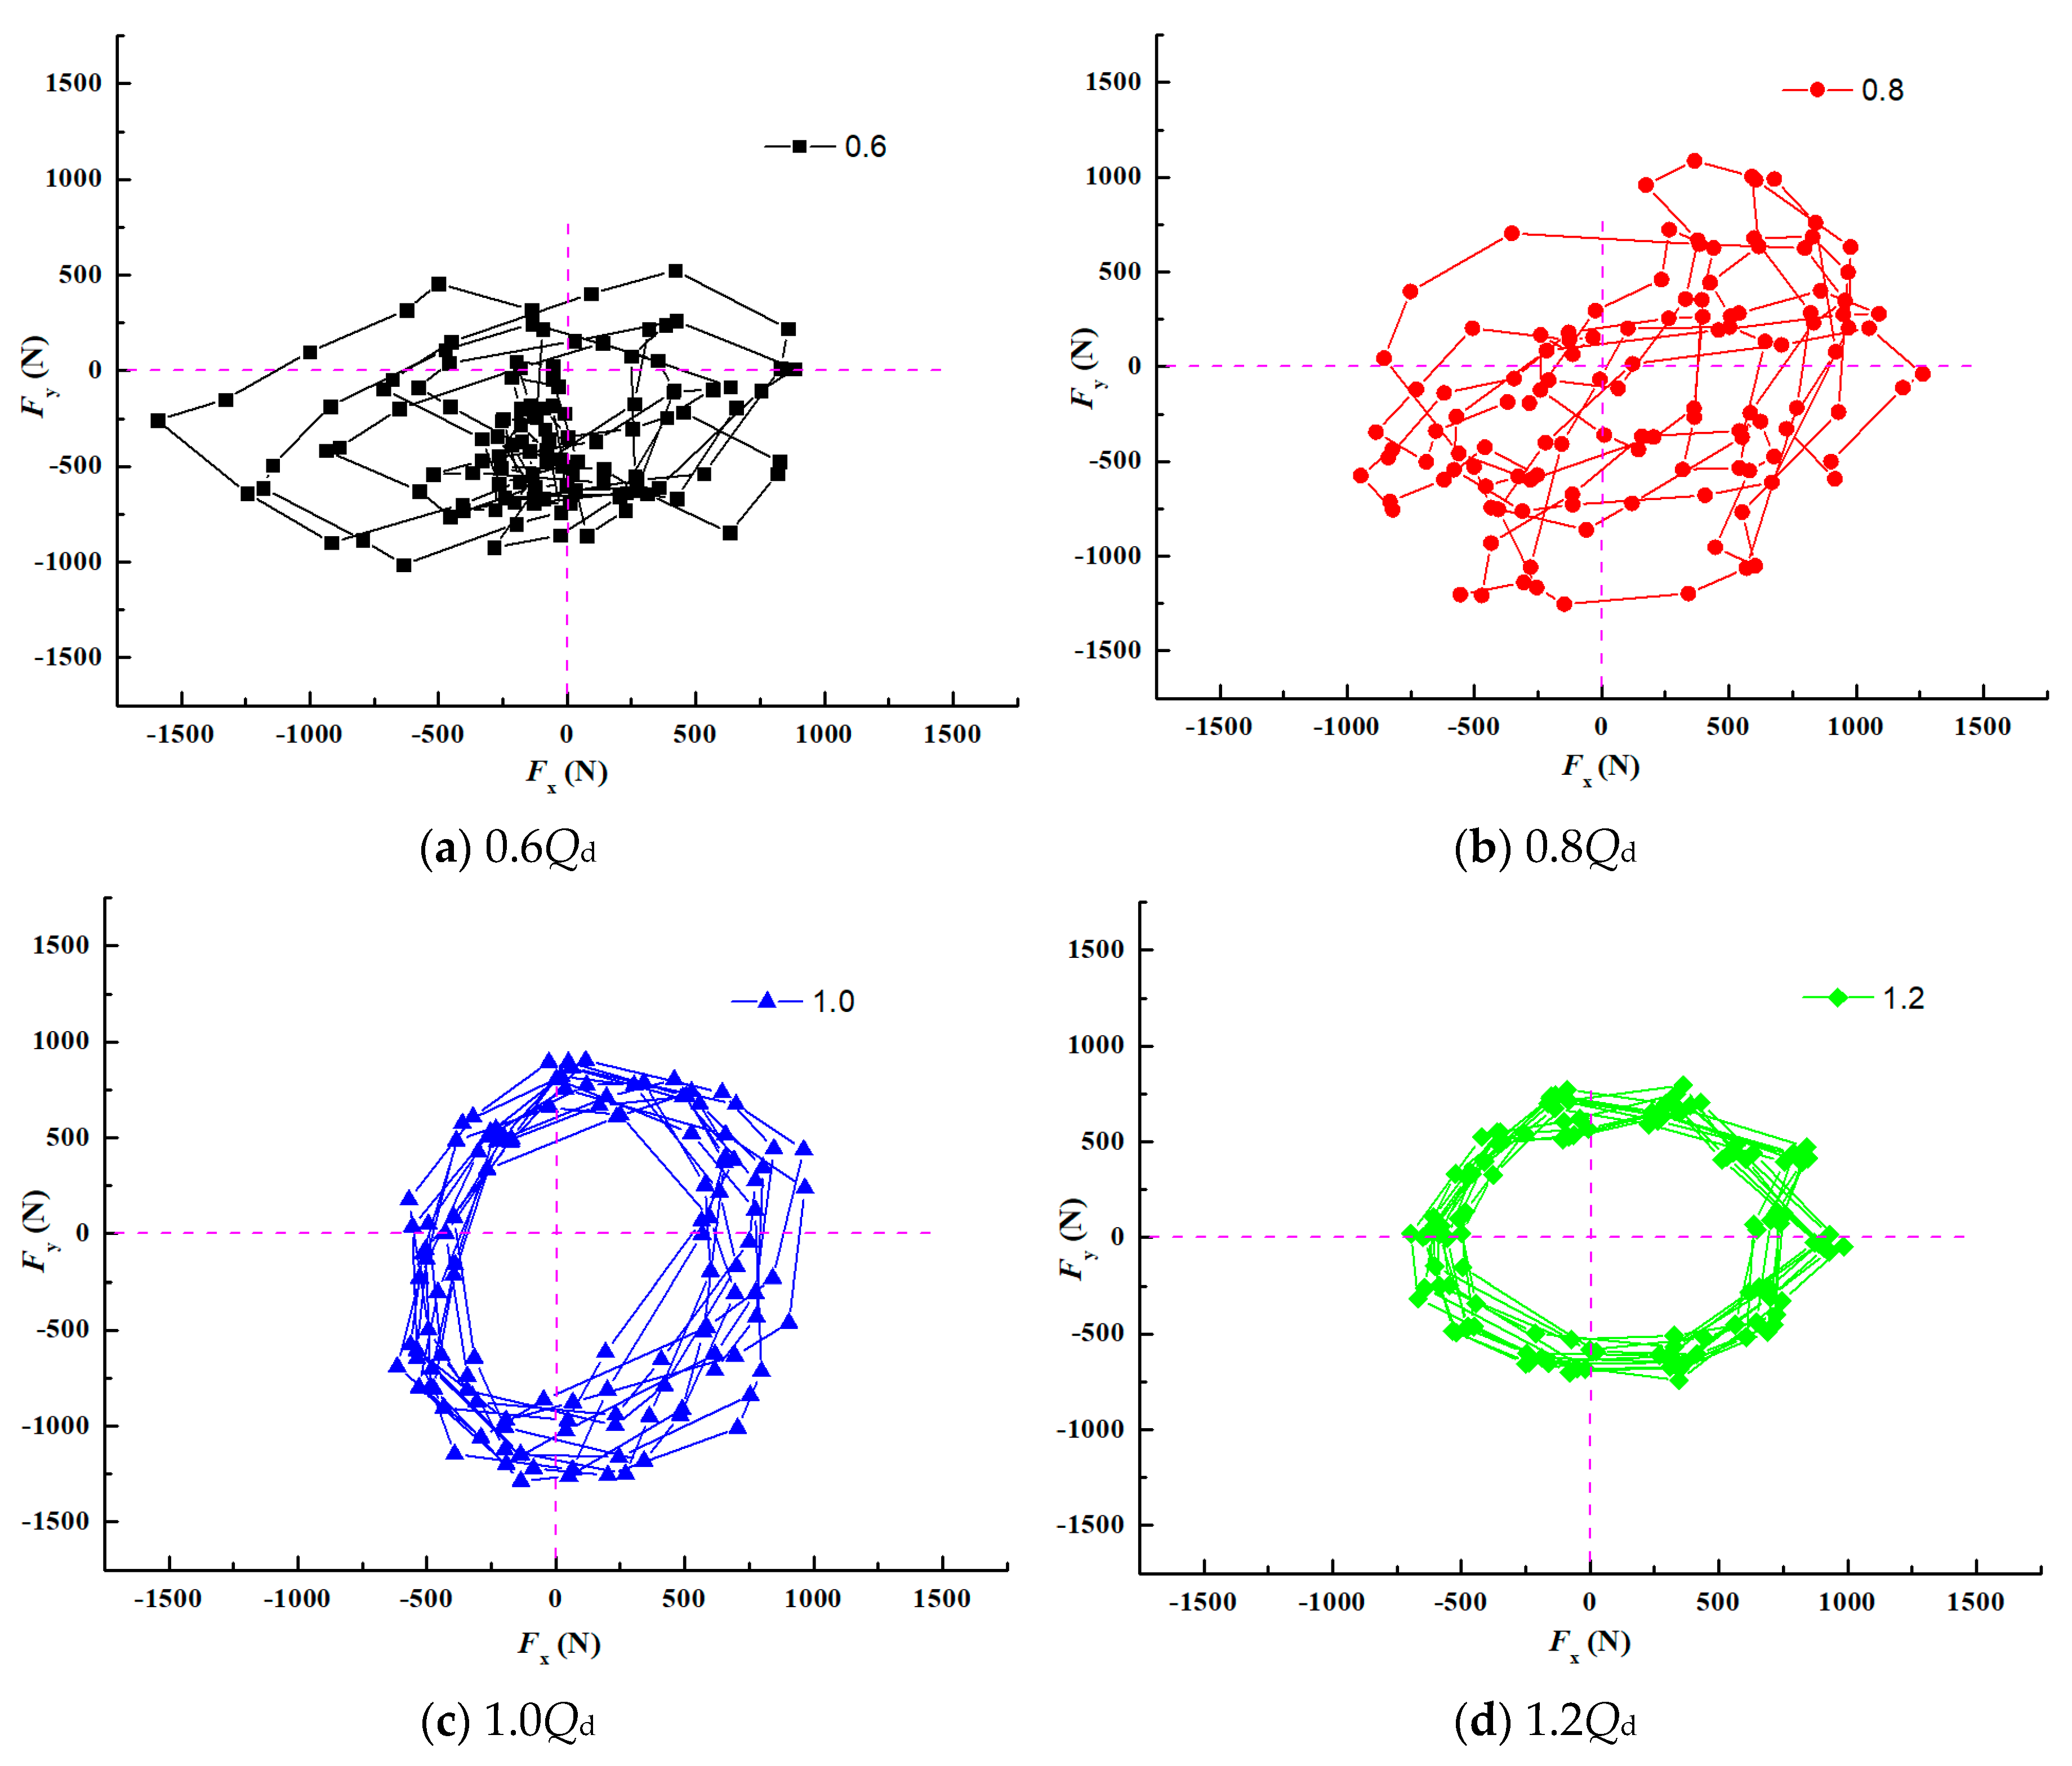
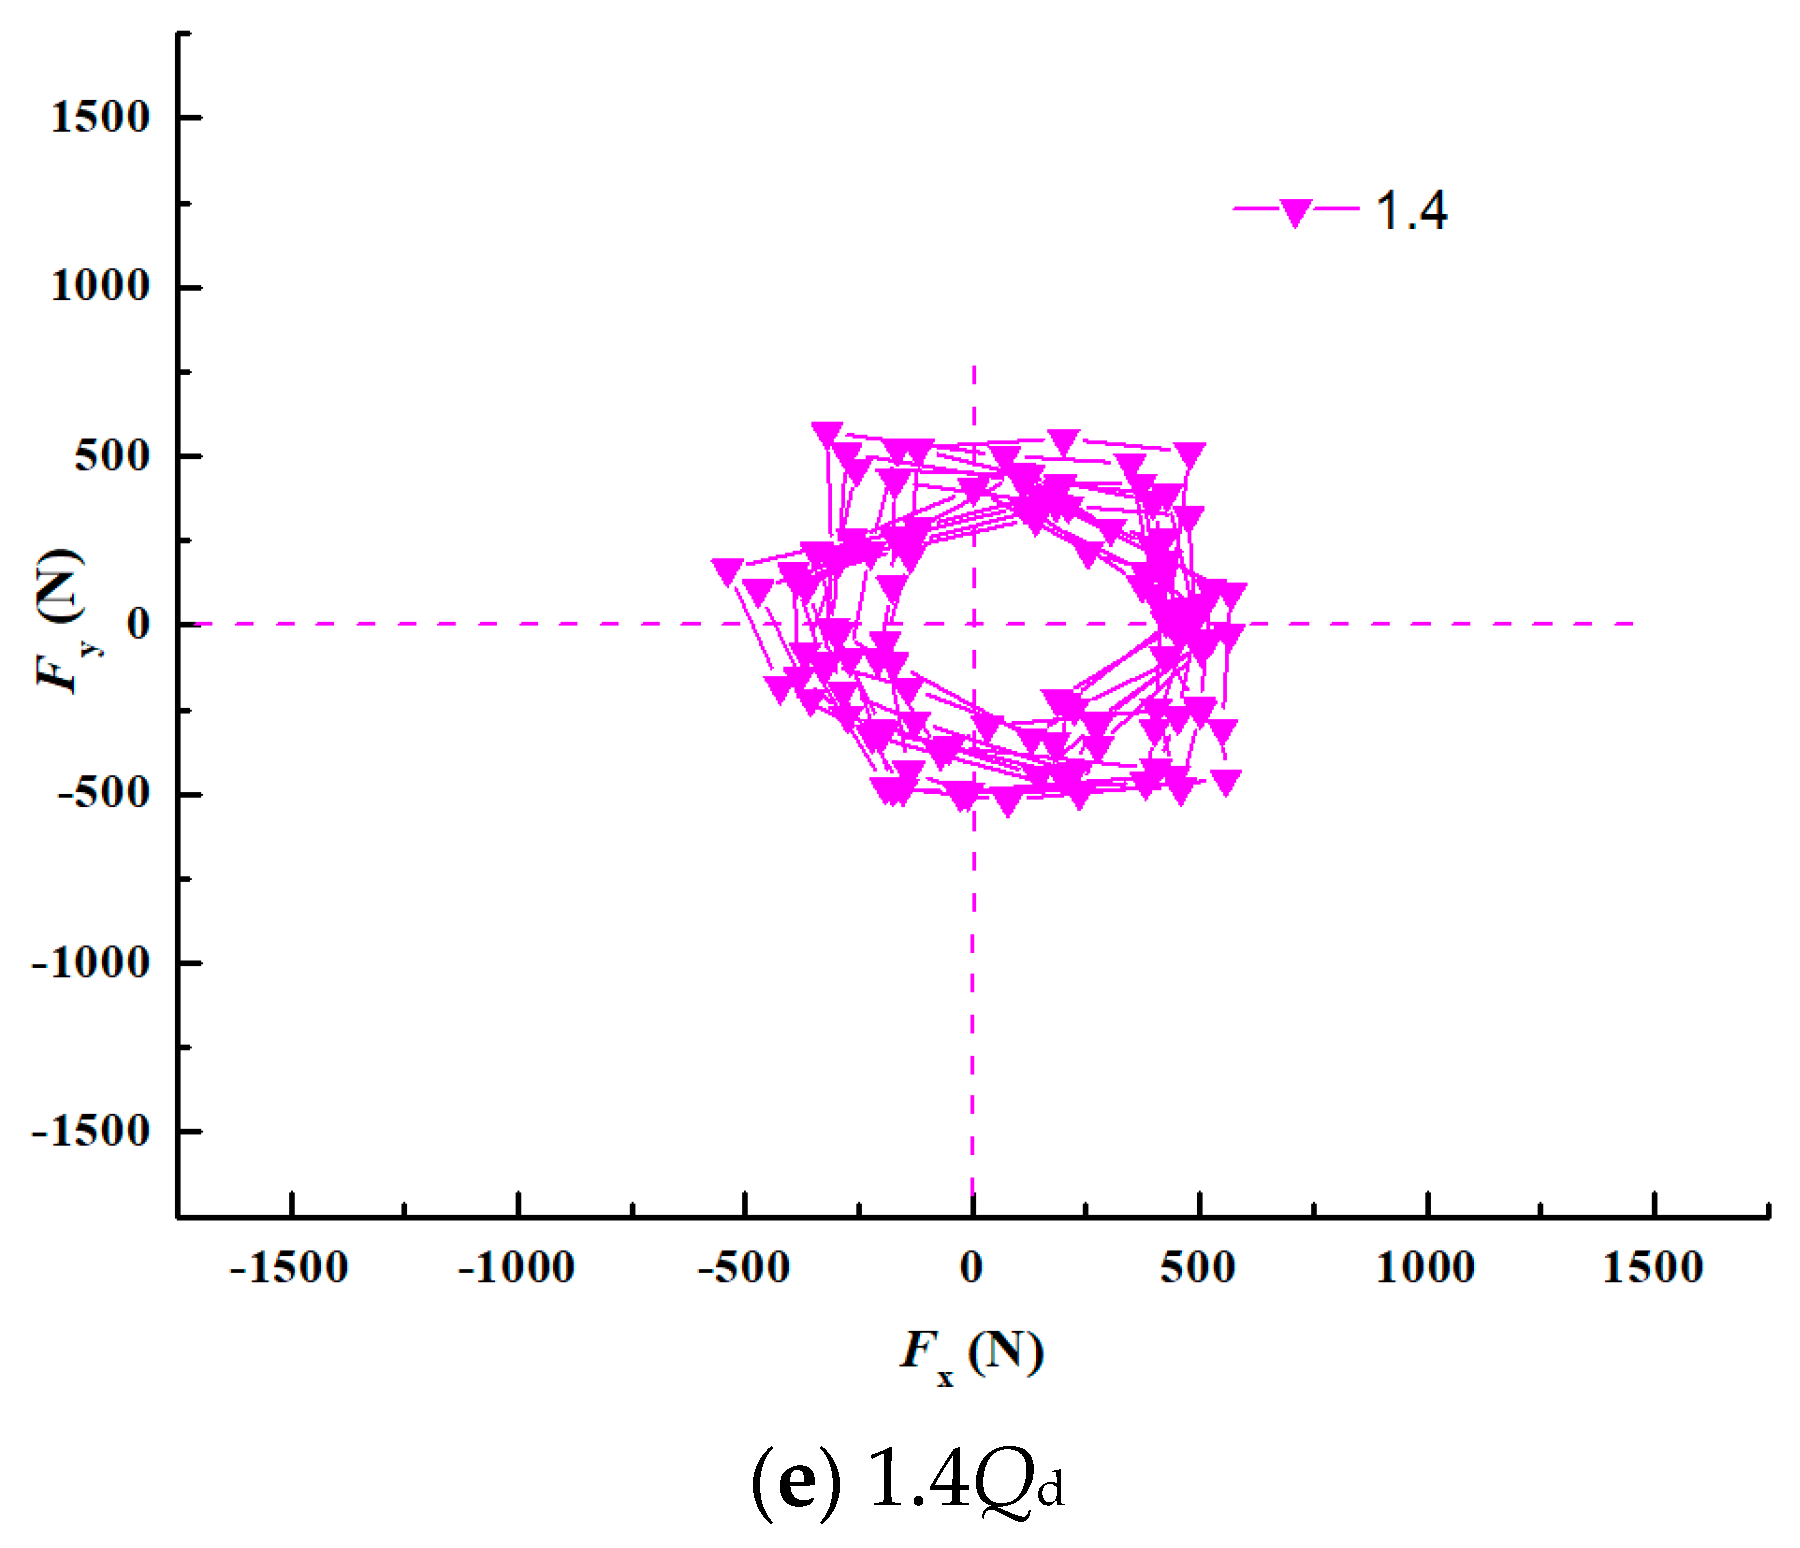
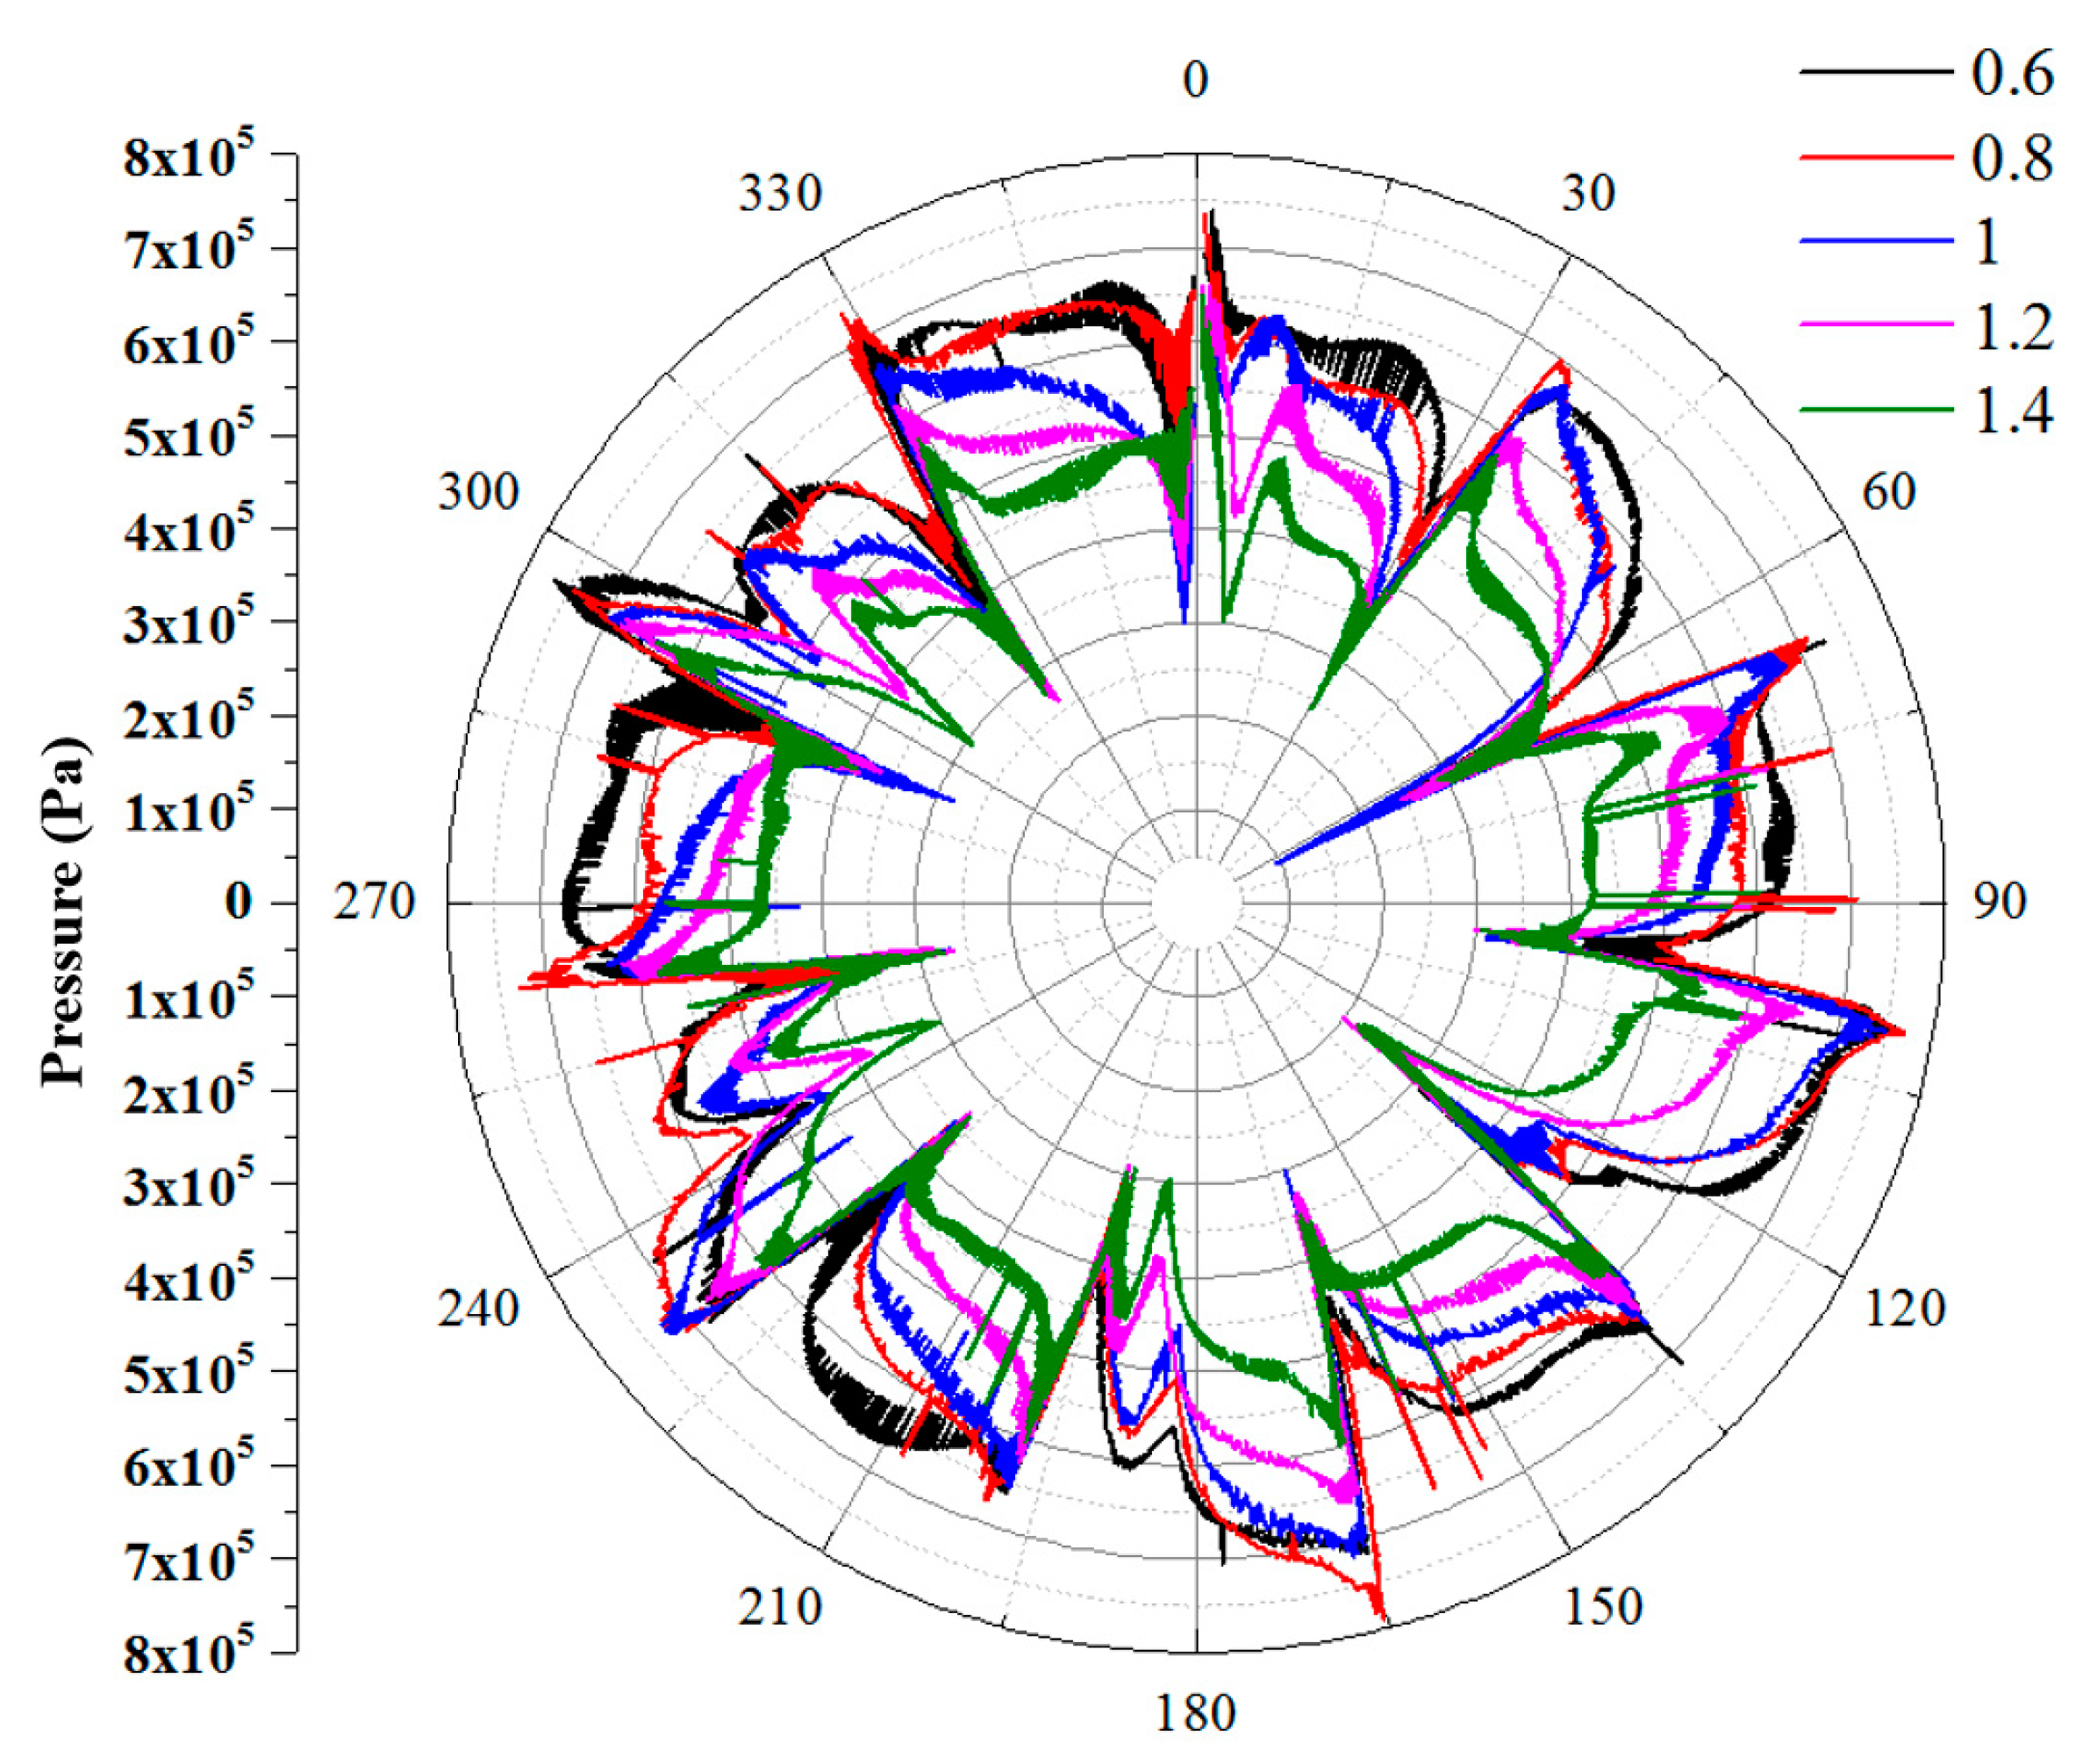
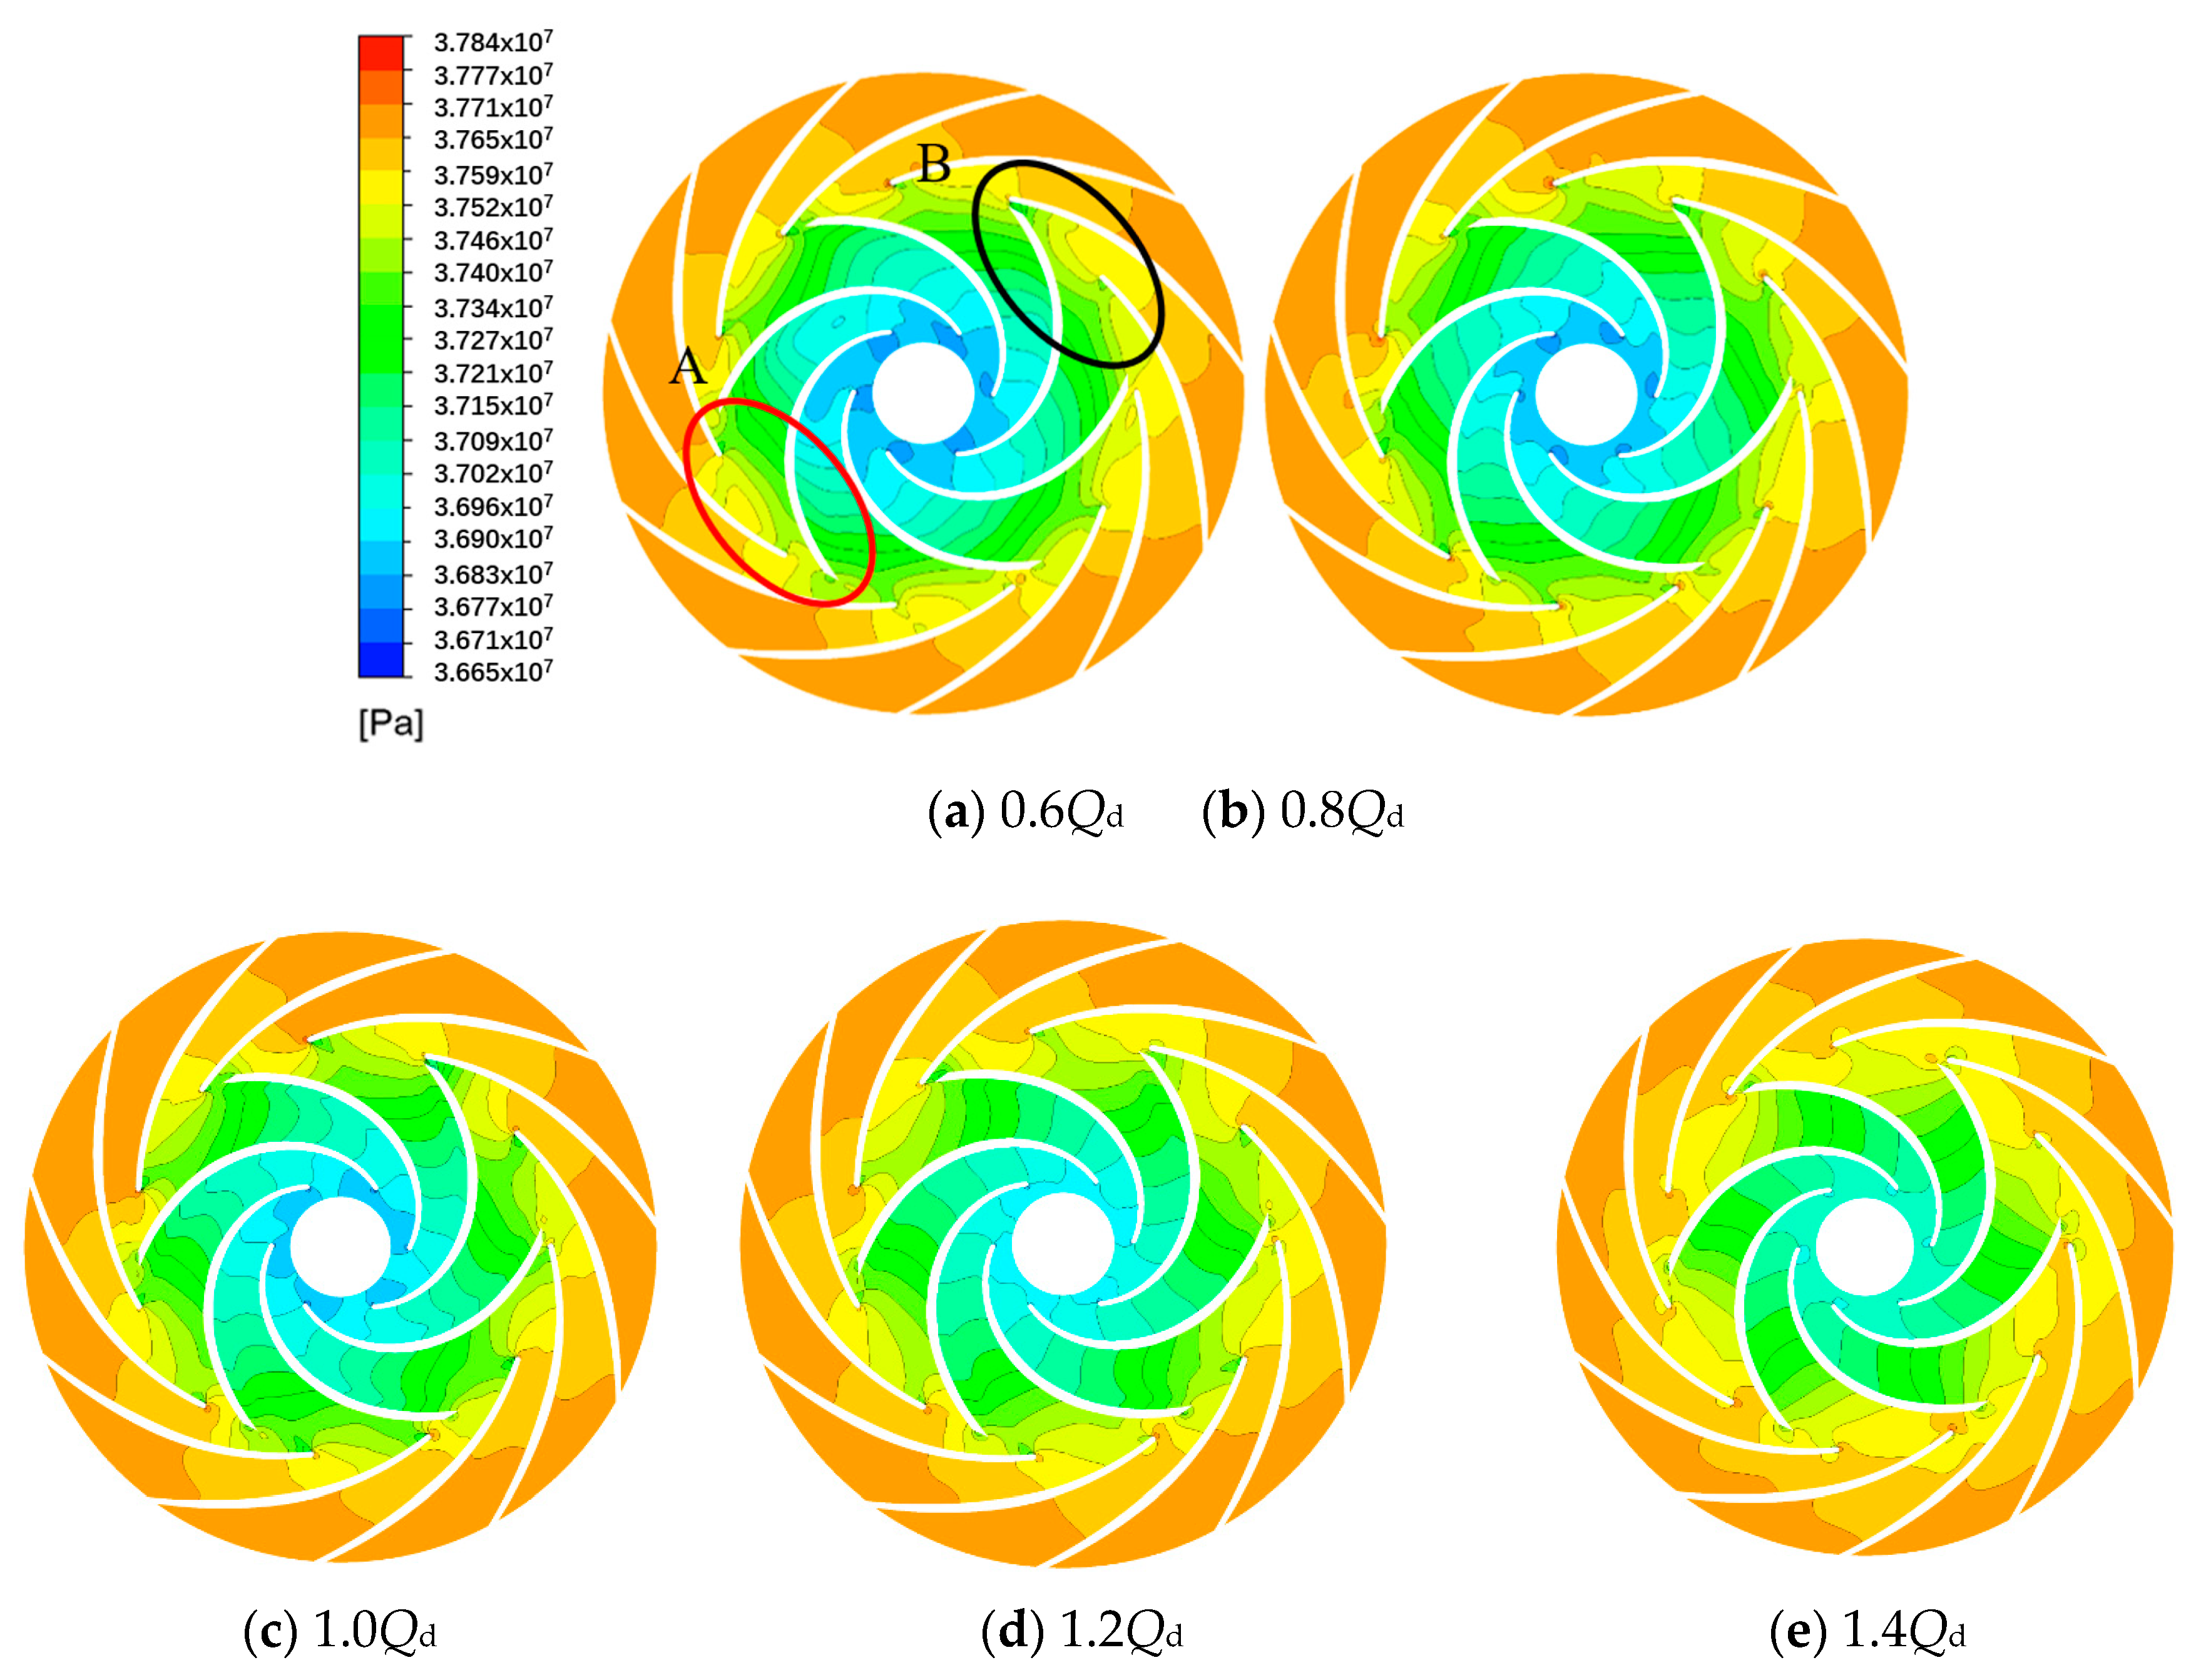
The centricity and regularity of rotor radial force distribution are poor under the small flow rate conditions (0.6Qd, 0.8Qd). With the increase in flow rate, the centrality and regularity are obviously improved, and the distribution range of radial force vector gradually reduces. The reason is that with the increase in flow rate, the symmetry of flow field increases, the static pressure of the flow field decreases and the interference intensity decreases.
(3)
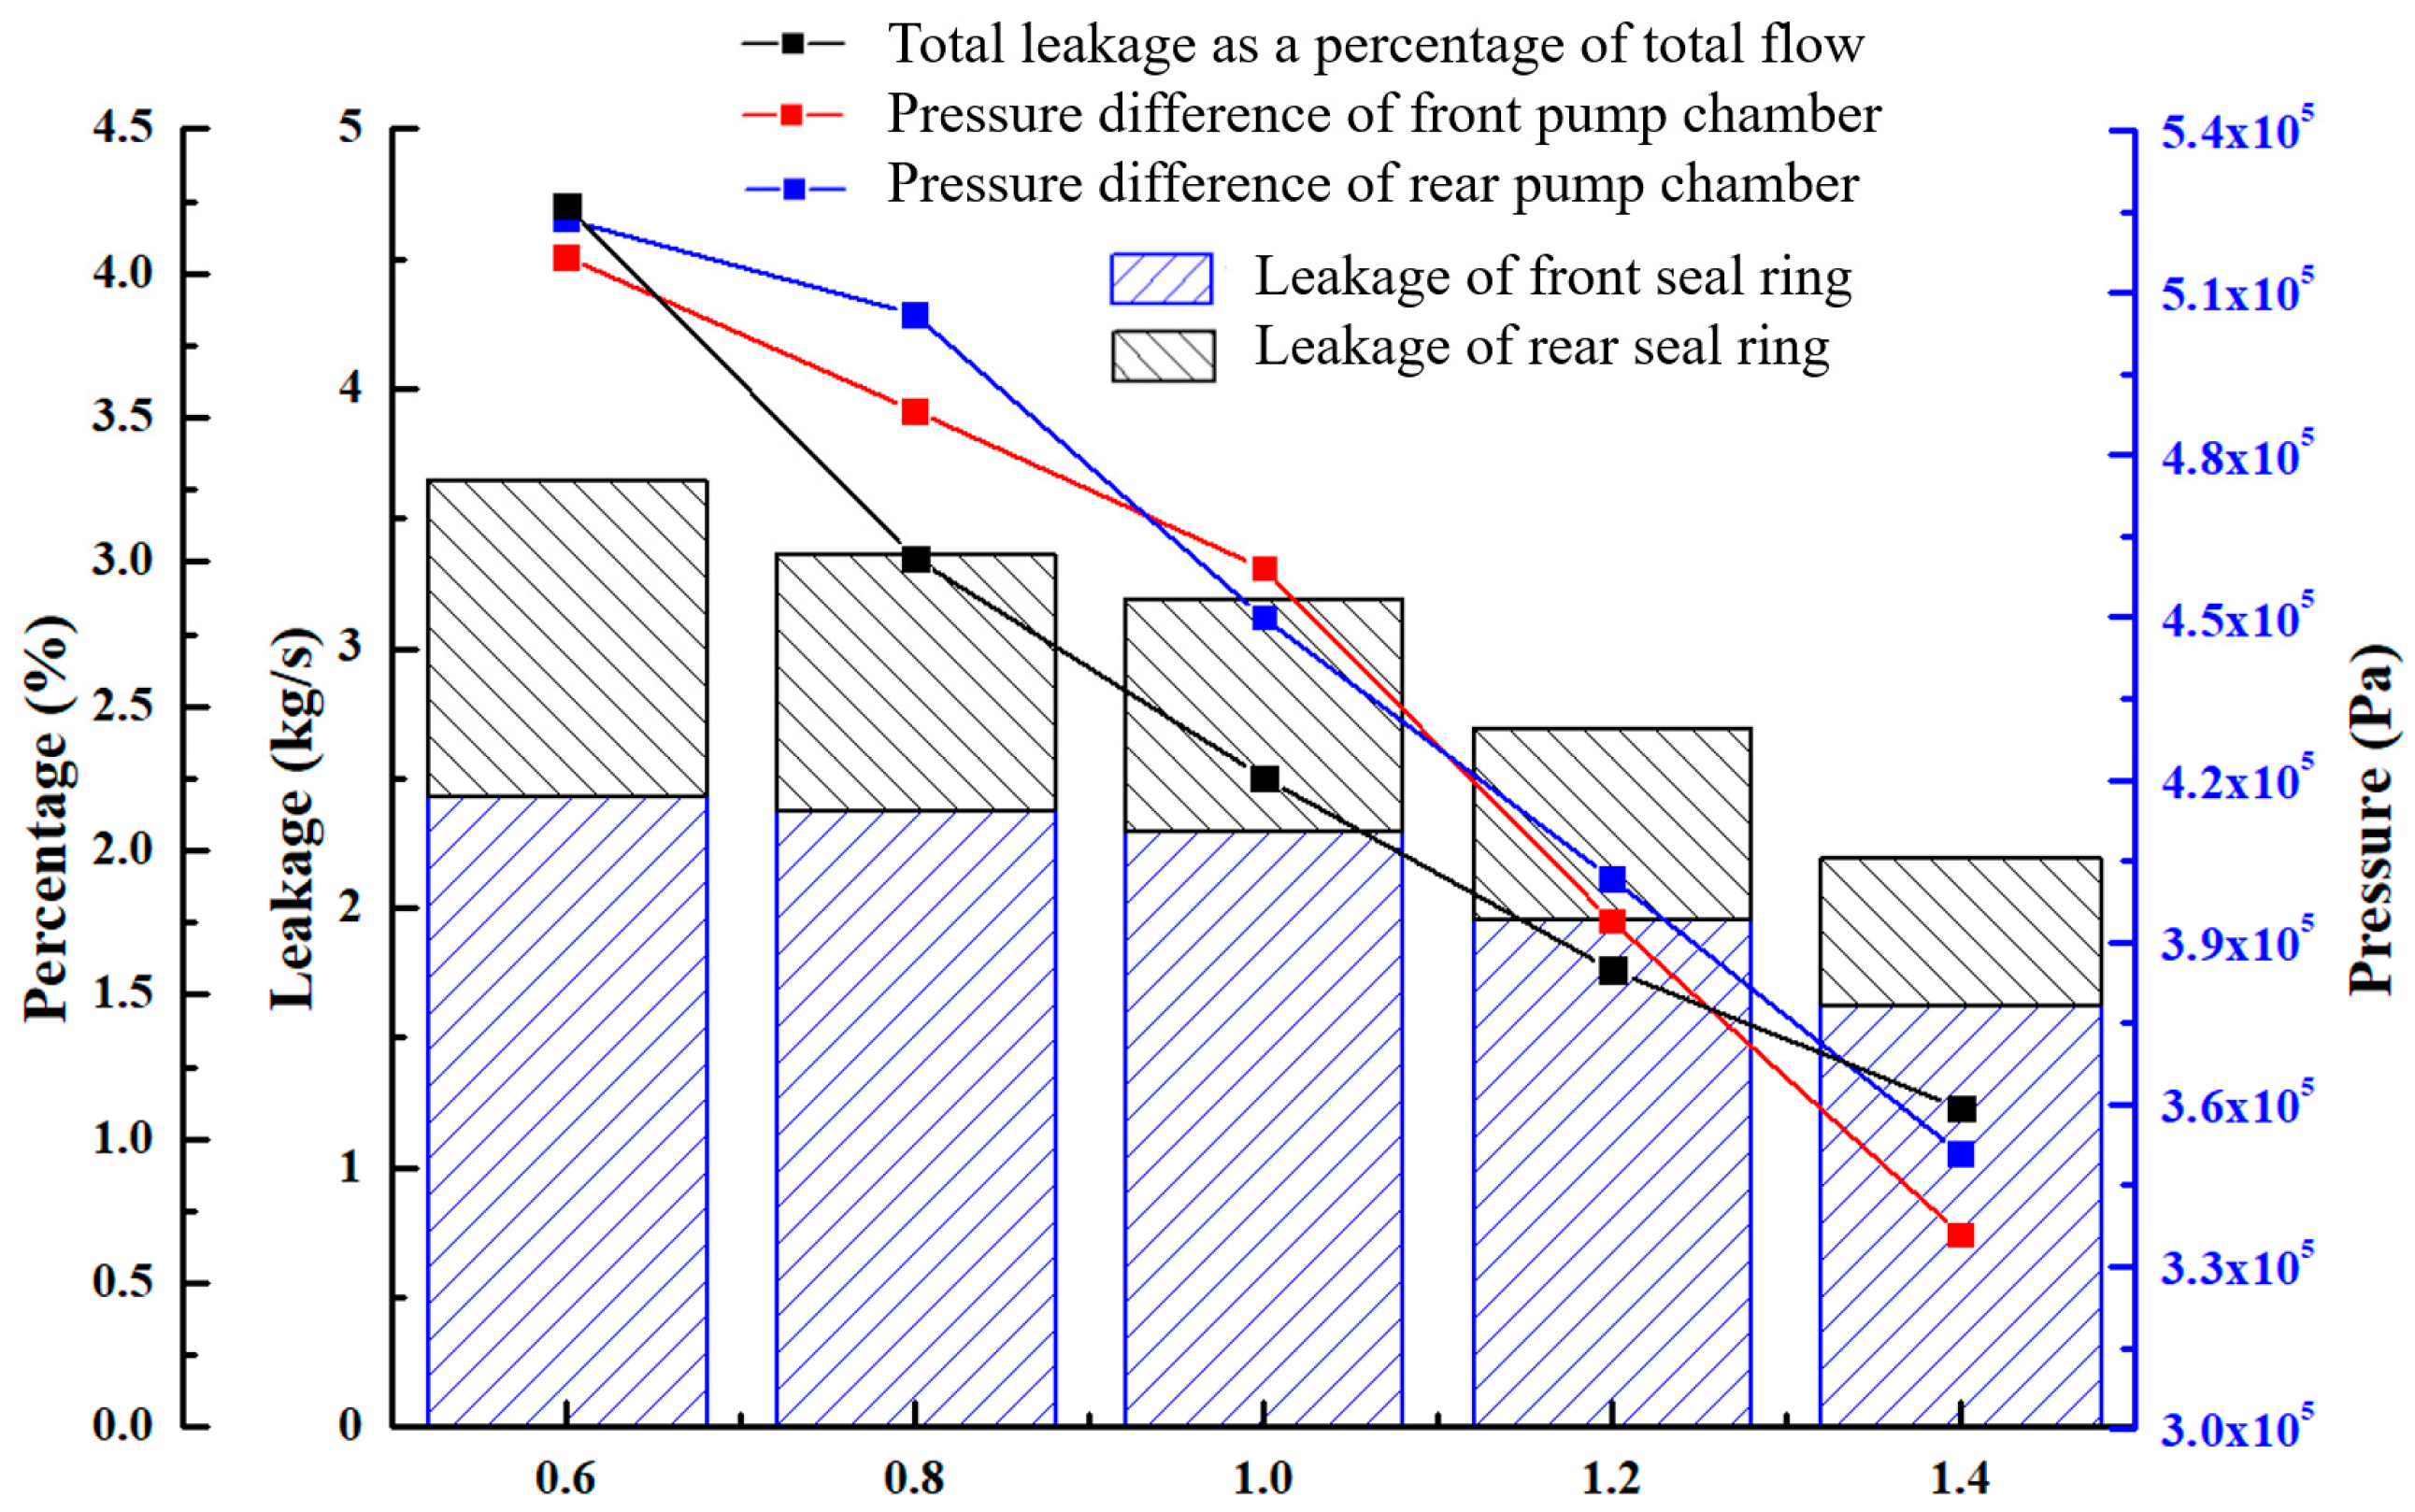
Under different flow rate conditions (0.6Qd, 0.8Qd, 1.0Qd, 1.2Qd, and 1.4Qd), the leakage ratio values of the front seal ring and rear seal ring are 1.95, 2.48, 2.56, 2.64 and 2.88, respectively. The leakage ratio of the front seal ring and the rear seal ring increases with the increase in the flow rate. With the increase in the flow rate, the leakage of the front and the rear seal ring decreases, which is mainly due to the decrease in the pressure at the inlet of the pump chamber. The absolute value of the leakage of the front seal ring is higher than that of the rear seal ring, mainly because the structure of the rear pump chamber is more complex than that of the front pump chamber, resulting in greater flow resistance.
(4)
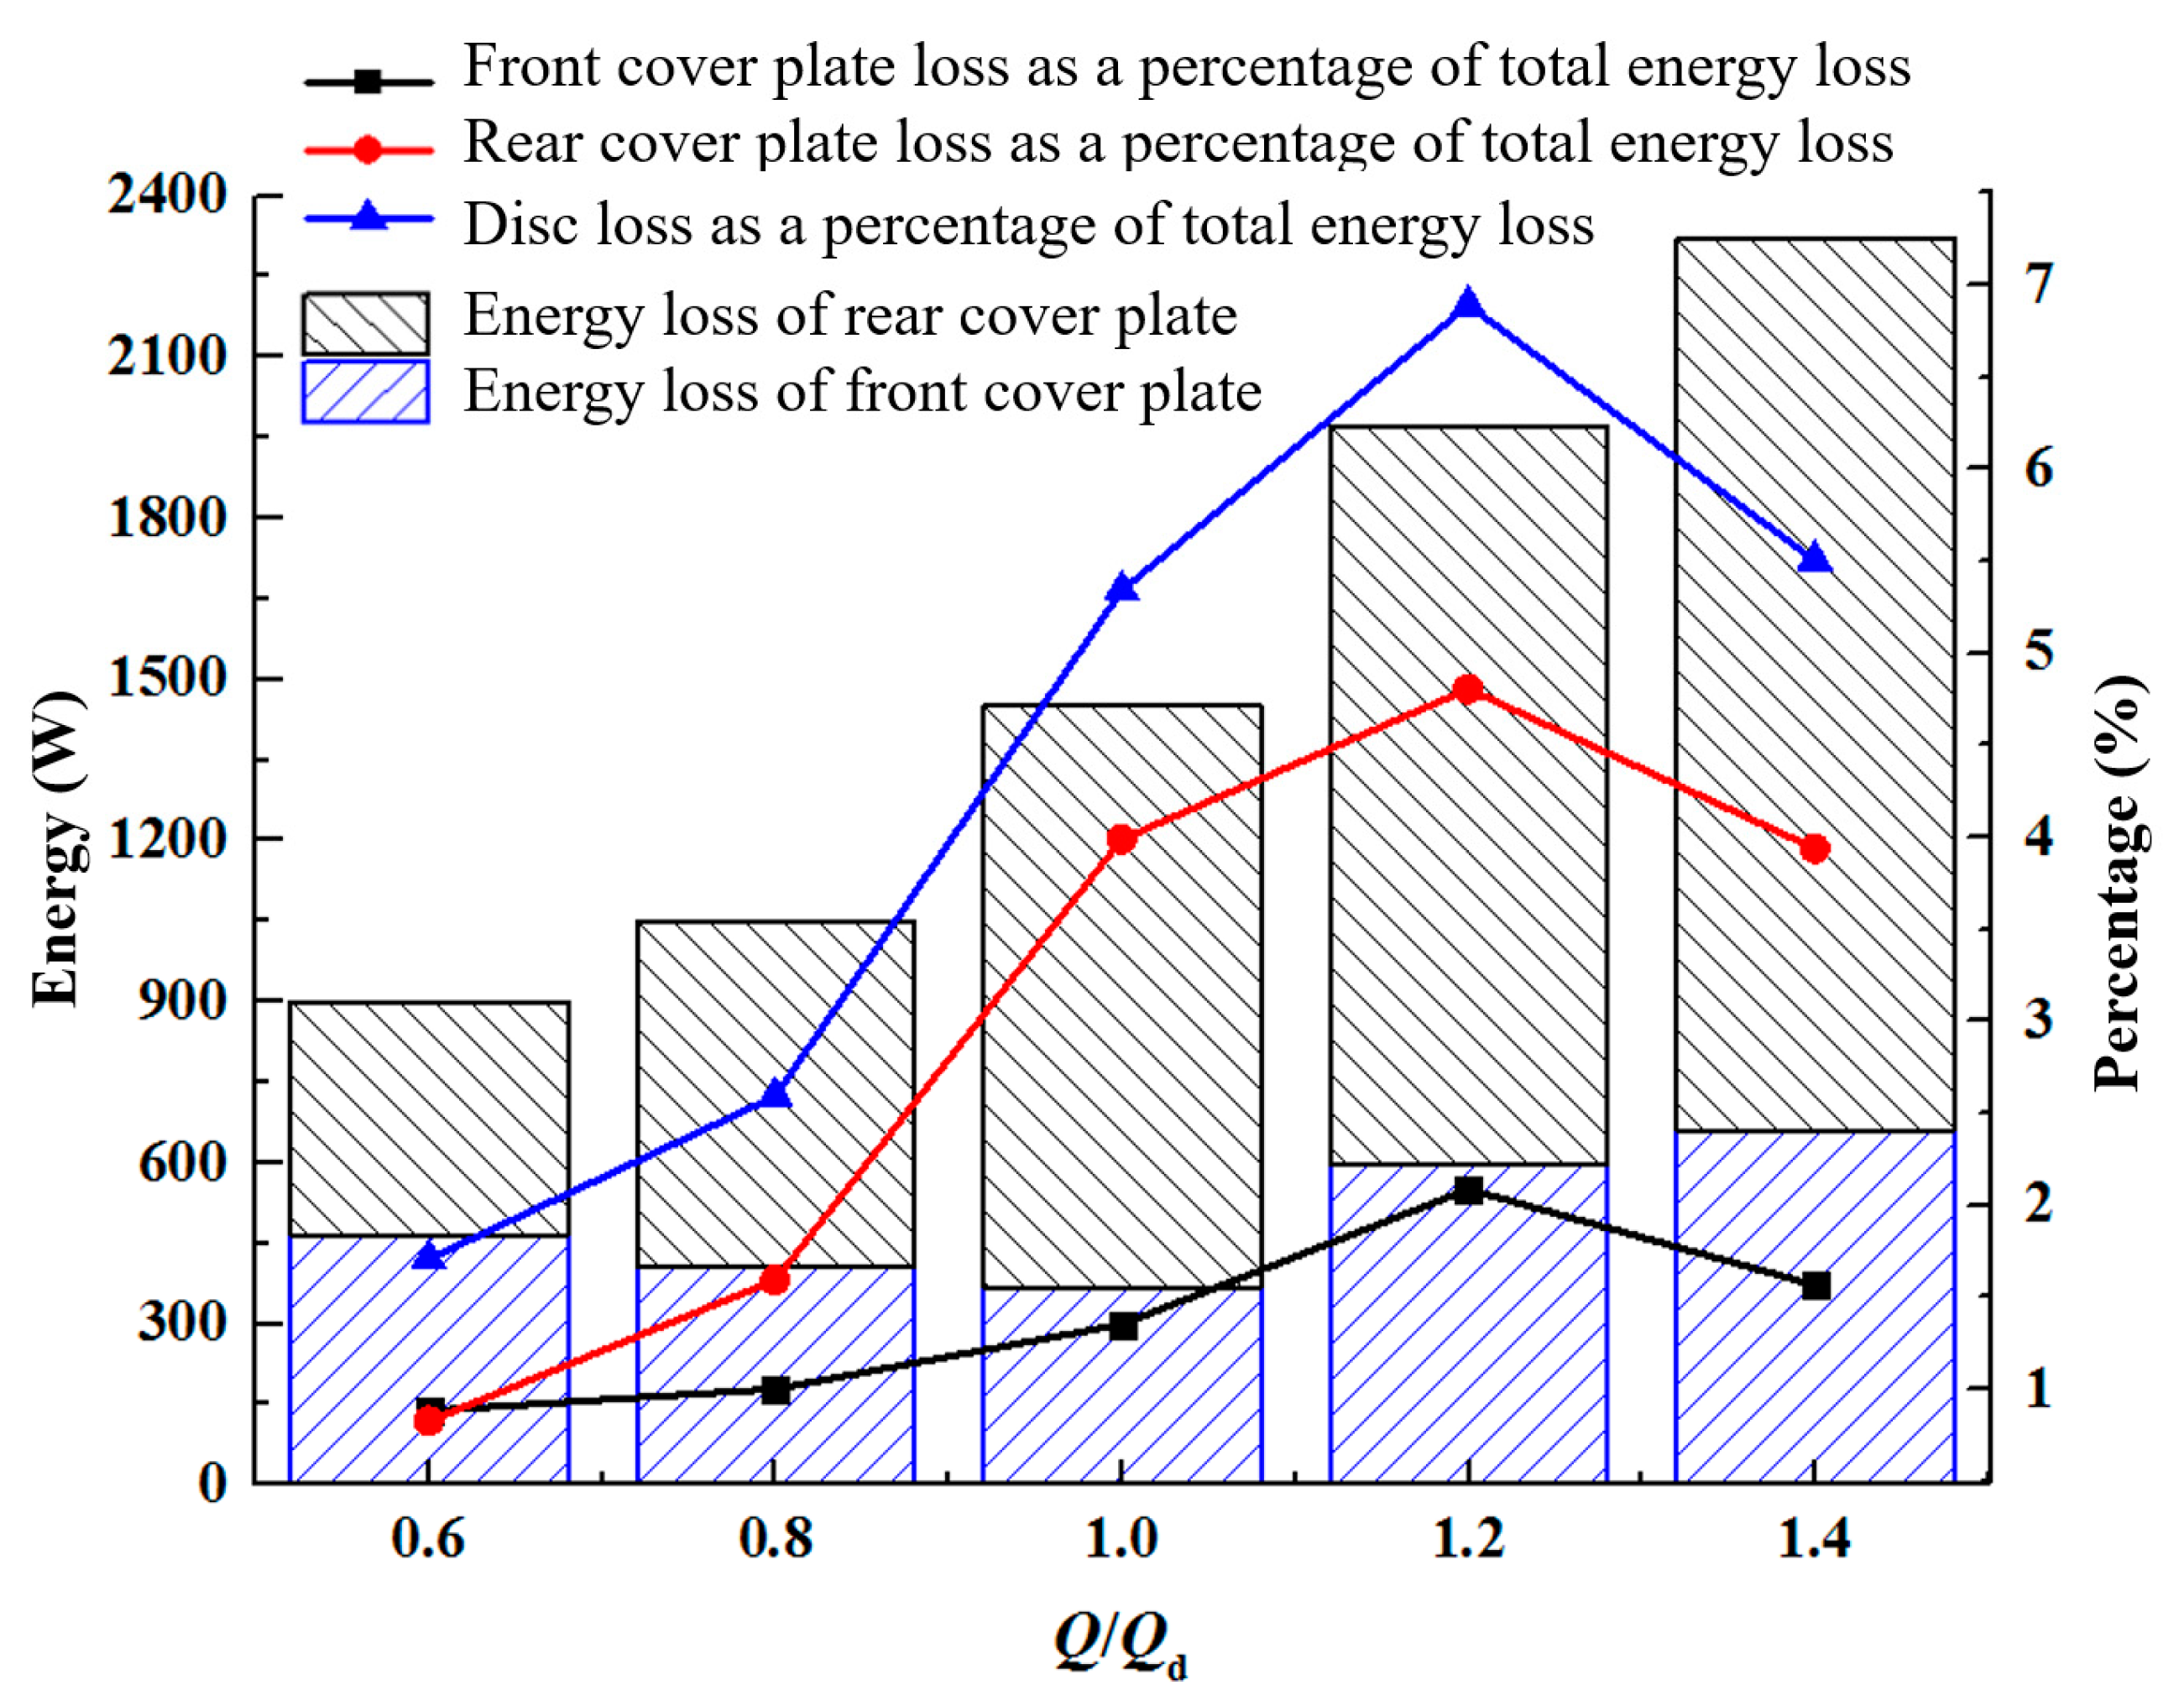
The total energy loss values of the boiler circulating pump under five flow rate conditions are 52,754.1 W, 40,539.4 W, 27,163.1 W, 28,609.6 W, and 42,177.7 W, respectively. With the increase in flow rate, the total loss energy of the pump first decreases and then increases, with the minimum loss energy at the design flow rate condition.
(5)
Under all flow rate conditions, the energy loss of the front cover plate is less than that of the rear cover plate, which is mainly caused by the larger rotating surface and volume of the rear pump chamber than those of the front pump chamber, the viscous friction loss and the medium rotation in the pump chamber need more energy.
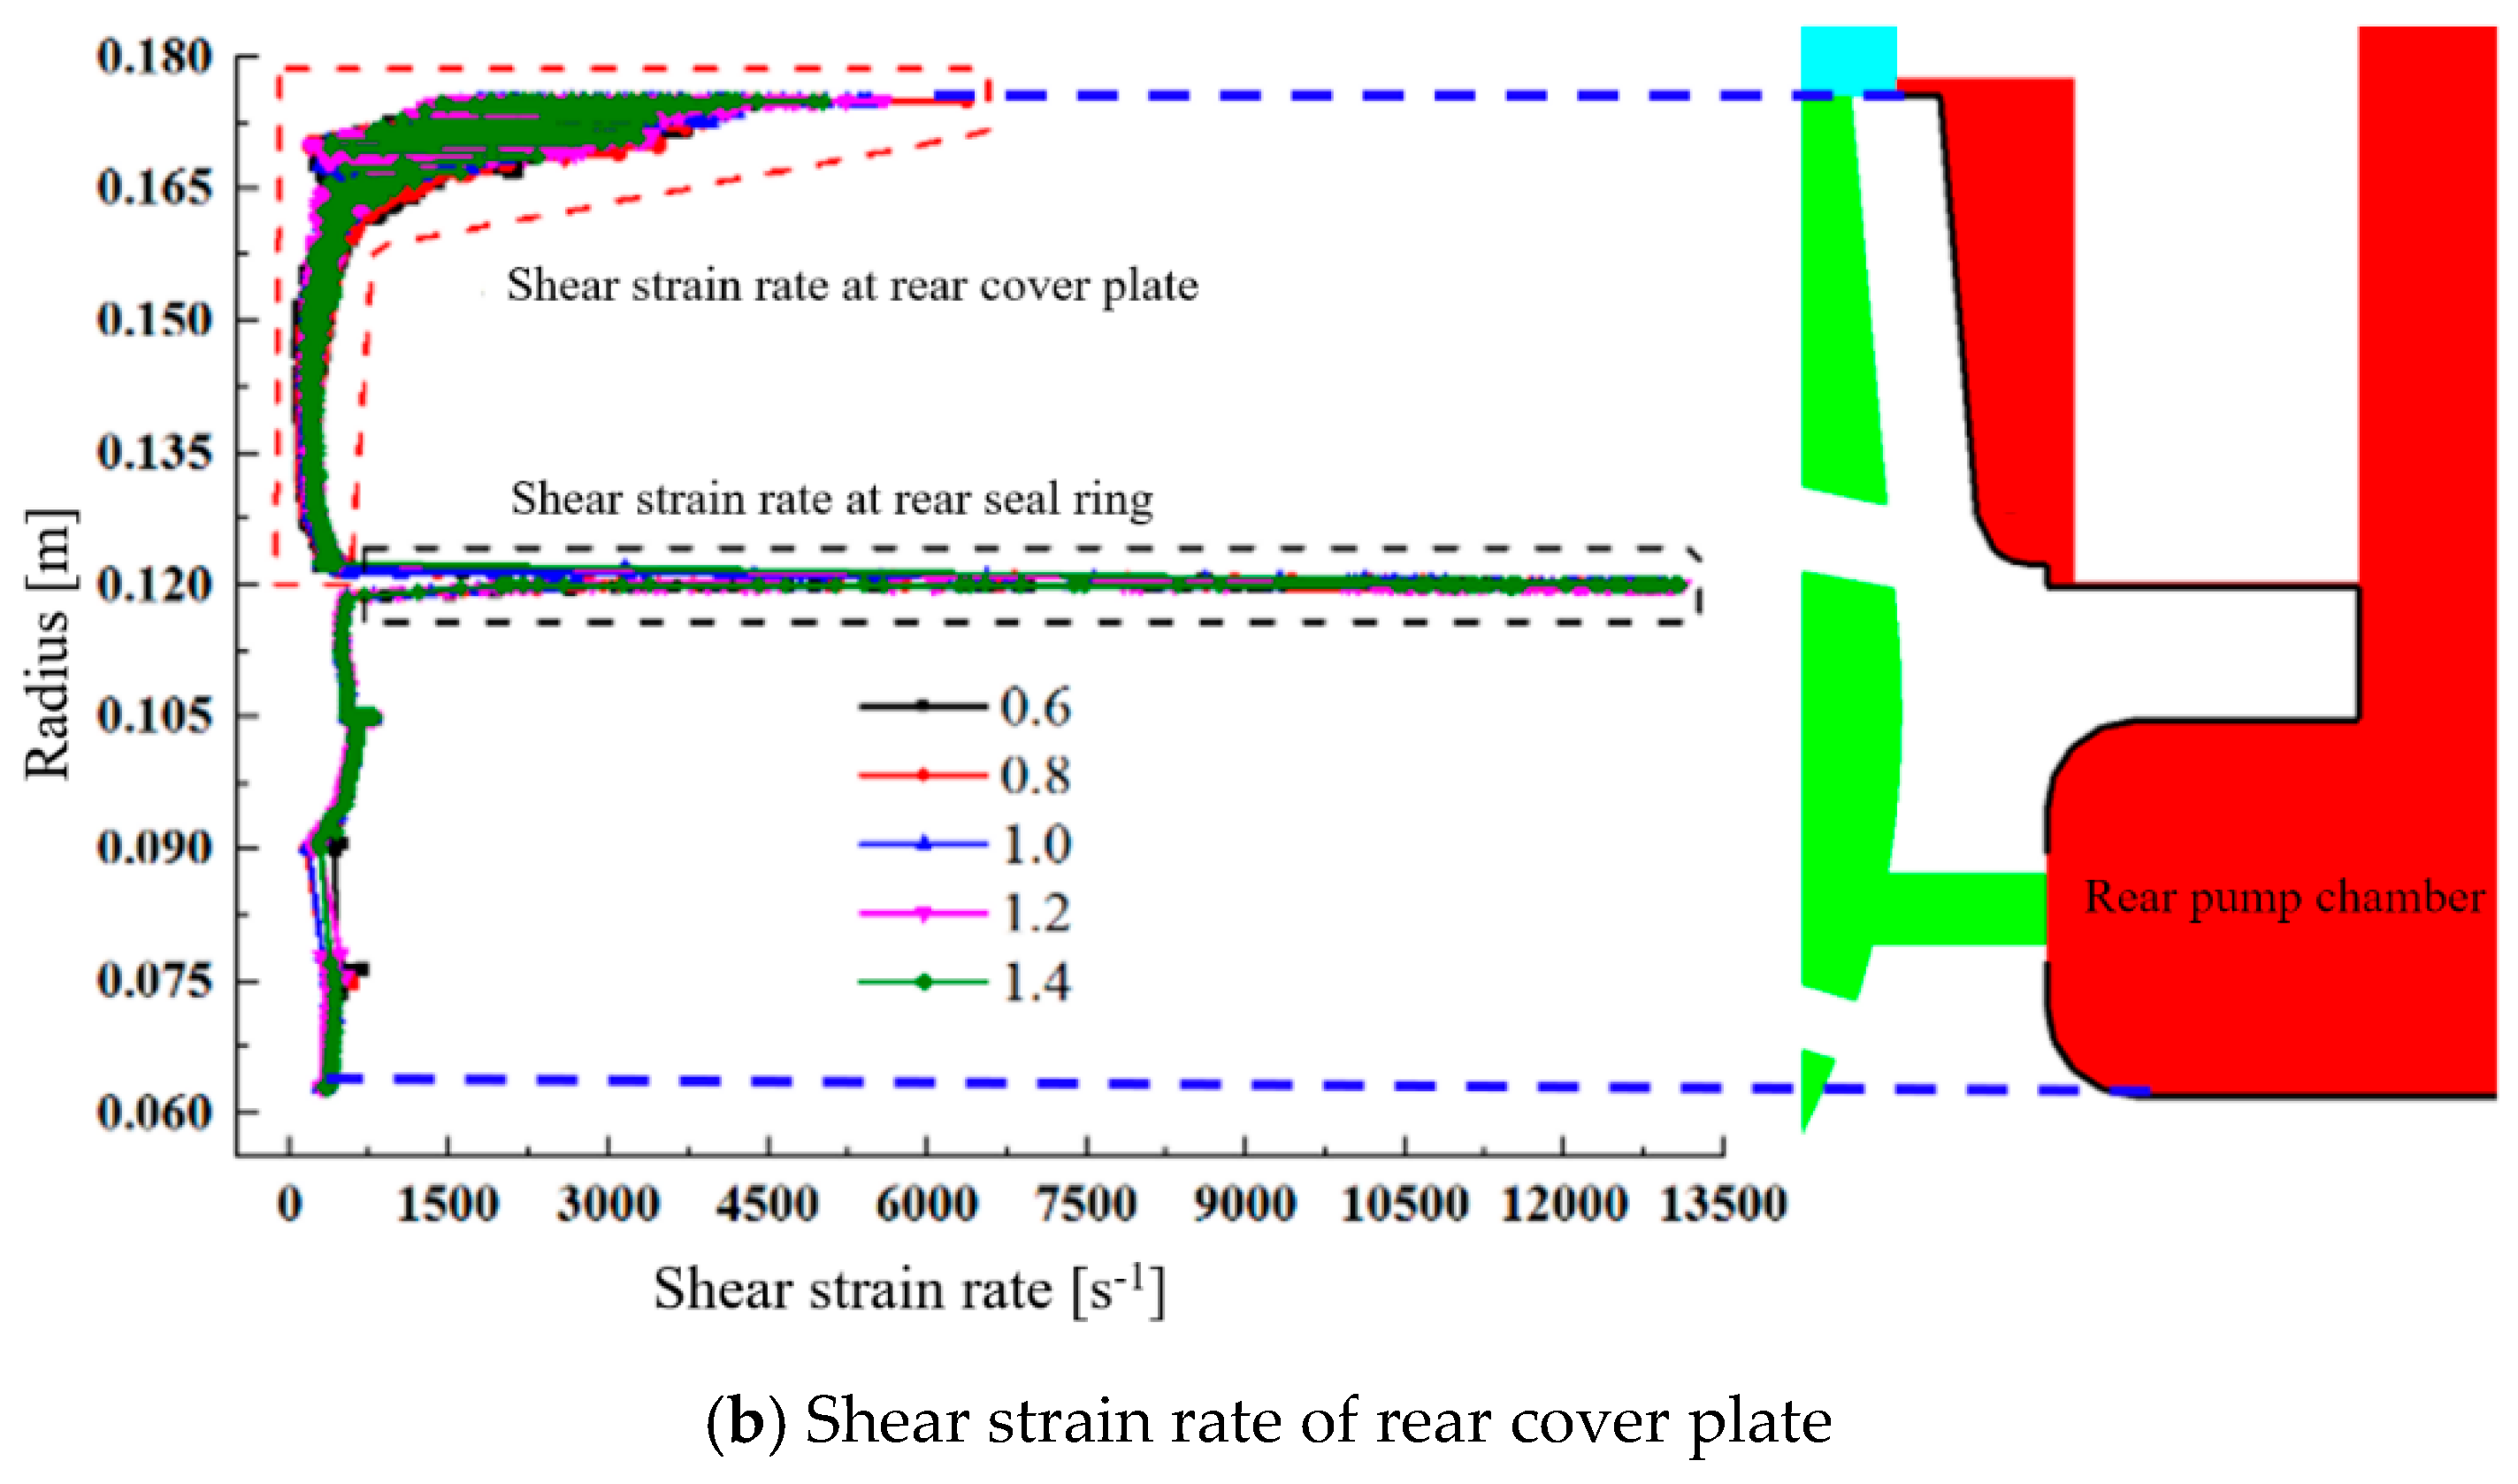
(6)
Through the analysis of the energy loss and the wall shear strain rate of the disk, it is found that the shear strain rate increases at the clearance and the wall mutation. Therefore, in the design process of a boiler circulating pump, the sudden change of the cover plate wall should be avoided. At the same time, the reasonable control of the clearance size will also reduce the shear strain rate, thus reducing the disc energy loss.
This paper analyses the characteristics of the radial force of the rotor, the leakage of the seal ring and the disc loss in a boiler circulating pump, which can provide reference for the design and optimization of this kind of pump. Based on the research content of this paper, in the near future, the next research goal is to build mathematical model by applying artificial neural network models, use the traditional gradient-based optimization algorithm to improve the rotor force and reduce the disk loss.

Author Contributions

F.Z. and F.K. designed the experiments. F.Z. and X.D. made the numerical simulation and performed the experiment. F.Z., H.W. and J.W. analyzed the data. F.Z. wrote the paper. All authors have read and agreed to the published version of the manuscript.

Funding

This research was supported by: the Science and Engineering Research Project of Wuxi Institute of Technology, grant number ZK202001; the Industry-University-Research Cooperation Project of Jiangsu Province, grant number BY2019043; the Scientific Research Project of Wuxi Institute of Technology, grant number BT2018-01; the Excellent scientific and technological innovation team of Jiangsu Higher Education Institutions (Intelligent Manufacturing Equipment Design and Engineering Application); Qing Lan Project; the Scientific Research project of professor and doctor in Wuxi Institute of Technology, grant number BT2018-03; The Natural Science Foundation of the Jiangsu Higher Education Institutions of China, grant number 19KJD470006; and the Priority Academic Program Development (PAPD) of Jiangsu Higher Education Institutions.

Conflicts of Interest

The authors declare no conflict of interest.

References

  1. Yang, Q.P.; Lin, W.J.; Wang, Y.M.; He, Y. Industry Development and Frontier Technology Roadmap of Thermal Power Generation. Proc. Chin. Soc. Electr. Eng. 2017, 37, 3787–3794. [Google Scholar]
  2. Yao, J.C. Optimization and Application of Domestic BCP of 1050 MW Ultra-supercritical Efficient Once Reheat Unit. Boil. Technol. 2017, 48, 62–66. [Google Scholar]
  3. Zhang, H.; Liu, X.; Kong, X.; Lee, K.Y. Stacked Auto-Encoder Modeling of an Ultra-Supercritical Boiler-Turbine System. Energies 2019, 12, 4035. [Google Scholar] [CrossRef] [Green Version]
  4. Wang, C.; Feng, Q.; Lv, Q.; Zhao, L.; Du, Y.; Wang, P.; Zhang, J.; Che, D. Numerical Investigation on Co-firing Characteristics of Semi-Coke and Lean Coal in a 600 MW Supercritical Wall-Fired Boiler. Appl. Sci. 2019, 9, 889. [Google Scholar] [CrossRef] [Green Version]
  5. Baumgarten, S.; Fritz, J.; Knierim, C.; Müller, T. Numerical simulation of the flow in a boiler circulating pump. Proc. Inst. Mech. Eng. Part A 2001, 215, 793–800. [Google Scholar] [CrossRef]
  6. Sha, Y.J. Three-Dimensional Turbulence Numerical Simulation and Flow Characteristics of High Temperature and High Pressure Centrifugal Pump. Ph.D. Thesis, Tsinghua University, Beijing, China, 2011. [Google Scholar]
  7. Zuo, Z.; Liu, S.; Fan, Y.; Wu, Y. Optimization of a Centrifugal Boiler Circulating Pump’s Casing Based on CFD and FEM Analyses. Adv. Mech. Eng. 2014, 2014, 1–10. [Google Scholar] [CrossRef]
  8. Ni, D.; Yang, M.G.; Gao, B.; Li, Z.; Li, Y.T.; Lu, S.; Jiangsu, H.P.M. The internal correlations between unsteady flow and pressure pulsations in a nuclear reactor coolant pump. J. Eng. Thermophys. 2017, 38, 1676–1682. [Google Scholar]
  9. Su, S.Z.; Wang, P.F.; Xu, Z.B. Study on Pressure Fluctuation and Radial Force during Startup of Reactor Coolant Pump. Nucl. Power Eng. 2017, 38, 110–114. [Google Scholar]
  10. Ohashi, H. Case Study of Pump Failure Due to Rotor-Stator Interaction. Int. J. Rotat. Mach. 1994, 1, 53–60. [Google Scholar] [CrossRef]
  11. Wang, L.; Liu, H.; Wang, K.; Zhou, L.; Jiang, X.; Li, Y. Numerical Simulation of the Sound Field of a Five-Stage Centrifugal Pump with Different Turbulence Models. Water 2019, 11, 1777. [Google Scholar] [CrossRef] [Green Version]
  12. Zhao, F.; Kong, F.; Zhou, Y.; Xia, B.; Bai, Y. Optimization Design of the Impeller Based on Orthogonal Test in an Ultra-Low Specific Speed Magnetic Drive Pump. Energies 2019, 12, 4767. [Google Scholar] [CrossRef] [Green Version]
  13. Lin, P.; Li, Y.; Xu, W.; Chen, H.; Zhu, Z. Numerical Study on the Influence of Inlet Guide Vanes on the Internal Flow Characteristics of Centrifugal Pump. Processes 2020, 8, 122. [Google Scholar] [CrossRef] [Green Version]
  14. Zhao, H.; Liu, S.J.; Hu, X.Z. Study on unsteady fluid radial force in deep-sea lifting pump. J. Cent. South Univ. (Sci. Technol.) 2019, 50, 829–836. [Google Scholar]
  15. Qian, C.; Yang, C.X. Influence of High Pressure side outflow condition on radial force in multistage pump. J. Xi’an Jiaotong Univ. 2019, 53, 106–113. [Google Scholar]
  16. Cheng, X.R.; Wei, Y.Q.; Wu, C.; Liu, H. The effect of static and rotor clearance ratio on hydraulic performance of nuclear main pump. J. Drain. Irrig. Mach. Eng. 2019, 5, 1–8. [Google Scholar]
  17. Gao, B.; Wang, Z.; Yang, L.; Du, W.Q.; Wu, C.B. Analysis and test of performance and hydraulic excitation characteristics of centrifugal pump with different seal ring clearances. Trans. Chin. Soc. Agric. Eng. 2016, 32, 79–85. [Google Scholar]
  18. Gao, B.; Wang, Z.; Yang, L.; Du, W.; Li, C. Effect of wear-ring clearance on performance and flow characteristics of centrifugal pump. J. Drain. Irrig. Mach. Eng. 2017, 35, 13–17. [Google Scholar]
  19. Yang, C.X.; Qiang, P.; An, S.; Xu, N.; Liu, J. Effects of wear-ring clearance on performance of high-speed centrifugal pump. J. Drain. Irrig. Mach. Eng. 2017, 35, 18–24. [Google Scholar]
  20. Liu, H.L.; Tan, M.G.; Yuan, S.Q. Calculation of disk friction loss of centrifugal pumps. Trans. Chin. Soc. Agric. Eng. 2006, 22, 107–109. [Google Scholar]
  21. He, X.J.; Lao, X.S. Accuracy evaluation of several calculation formulas of disc friction loss power of low specific speed centrifugal pump. Water Pump Technol. 2010, 10, 16–20. [Google Scholar]
  22. Yang, C.X.; Qian, C. Calculation of disc loss in centrifugal pump with low specific speed. J. Lanzhou Univ. Technol. 2012, 38, 56–60. [Google Scholar]
  23. Dong, W.; Chu, W.L. Analysis of Flow Characteristics and Disc Friction Loss in Balance Cavity of Centrifugal Pump Impeller. Trans. Chin. Soc. Agric. Mach. 2016, 47, 29–35. [Google Scholar]
  24. Feng, J.J.; Luo, X.Q.; Wu, G.K.; Zhu, G.J. Influence of clearance flow on efficiency prediction of Francis turbines. Trans. Chin. Soc. Agric. Eng. 2015, 31, 53–58. [Google Scholar]
  25. Wang, F.J. Principle and Application of CFD Software for Computational Fluid Dynamics Analysis; Tsinghua University Press: Beijing, China, 2004; pp. 110–130. [Google Scholar]
  26. Li, Y.B.; He, H.; Fan, Z.J.; Li, J.Z. Effect of blade tip clearance on cavitating flow in mixed-flow pump. J. Drain. Irrig. Mach. Eng. 2020, 38, 224–229. [Google Scholar]
  27. Menter, F.R. Zonal two equation k-w turbulence models for aerodynamic flows. AIAA Pap. 1993, 7, 2906. [Google Scholar]
  28. Menter, F.R. Ten years of experience with the SST turbulence model. Turbul. Heat Mass Transf. 2003, 4, 625–632. [Google Scholar]
  29. Menter, F.R. Review of the shear stress transport turbulence model experience from an industrial perspective. Int. J. Comput. Fluid 2009, 23, 305–316. [Google Scholar] [CrossRef]
  30. ANSYS CFX-Solver Theory Guide; ANSYS, Inc.: Canonsburg, WA, USA, 2011.
  31. Technical Committee ISO/TC. ISO 9906 Rotodynamic Pumps—Hydraulic Performance Acceptance Tests—Grades 1, 2 and 3; International Standardization Organization: Geneva, Switzerland, 2012. [Google Scholar]
  32. Guan, X.F. Modern Pumps Theory and Design; China Aerospace Press: Beijing, China, 2011; pp. 26–51. [Google Scholar]
Figure 1. Structure of boiler circulating pump. 1 Pump casing; 2 connecting body; 3 guide vane; 4 front seal ring; 5 impeller; 6 rear seal ring; 7 motor housing; 8 cooling circuit; 9 front bearing seat; 10 rotor; 11 stator; 12 rear bearing seat; 13 thrust disk.
Processes 08 01279 g001
Figure 2. Pump Casings with different outlet pipe angles.
Processes 08 01279 g002
Figure 3. Flow field grid of boiler circulating pump.
Processes 08 01279 g003
Figure 4. Boundary conditions of boiler circulating pump.
Processes 08 01279 g004
Figure 5. Test bench of boiler circulating pump.
Processes 08 01279 g005
Figure 6. External performance curve of different outlet pipe angles. H-Q: Head (m)-Flowrate curve (m3/h); P-Q: Power (kW)-Flowrate (m3/h); η-Q: Efficiency (%)-Flowrate (m3/h).
Processes 08 01279 g006
Figure 7. Comparison of experimental and simulated external performance curves.
Processes 08 01279 g007
Figure 8. Rotor radial force vector distribution at different flow rate conditions.
Processes 08 01279 g008aProcesses 08 01279 g008b
Figure 9. Distribution of pressure at the impeller outlet under different flow rate conditions.
Processes 08 01279 g009
Figure 10. Pressure Distribution in Impeller and Guide Vane.
Processes 08 01279 g010
Figure 11. Leakage and pump chamber pressure difference statistics.
Processes 08 01279 g011
Figure 12. Statistical chart of disc loss.
Processes 08 01279 g012
Figure 13. Shear strain rate distribution of cover plate.
Processes 08 01279 g013aProcesses 08 01279 g013b
Table 1. Pump design parameters.
ParametersUnitParameter Value
Design flow rate (Qd)m3/h966
Hydraulic head (H)m133
Design rotation speed (n)r/min2950
Specific speed (ns)142
Net Positive Suction Head Required (NPSHr)m17
Design pressure (P)MPa37
Design temperature (T)°C360
Table 2. Grid independence analysis.
Grid Number Head/mEfficiency/%
2.0 × 106137.980.0
2.4 × 106139.580.9
2.9 × 106141.281.4
3.2 × 106141.181.4
4.0 × 106141.381.4
Table 3. Experiment overall uncertainty.
Performance CharacteristicsFlowrate Pump Head Pump Efficiency
Uncertainty (%)±0.29±0.34±1.43
Table 4. The loss of efficiency between the simulation and the experiment.
Flowrate (m3/h)Simulated Efficiency (%)Experimental Efficiency (%)Loss of Efficiency (%)
579.167.154.312.8
772.175.263.311.9
965.181.969.412.5
1149.781.568.712.8

