Article

Physicochemical Properties of Guava Snacks as Affected by Drying Technology

by
Yuri M. Leiton-Ramírez
,
Alfredo Ayala-Aponte
and
Claudia I. Ochoa-Martínez
*
School of Food Engineering, University of Valle, Cali 760031, Colombia
*
Author to whom correspondence should be addressed.
Processes 2020, 8(1), 106; https://doi.org/10.3390/pr8010106
Submission received: 20 October 2019 / Revised: 27 December 2019 / Accepted: 10 January 2020 / Published: 14 January 2020
(This article belongs to the Special Issue Drying Kinetics and Quality Control in Food Processing)

Abstract

:
Guava is widely consumed because of its agro-industrial use, and its antioxidant properties attributed to vitamin C and carotenoids content. However, it has a short shelf life. Guava has been dried by atomization, fluidized bed, lyophilization (FD) and convective drying (CD). CD requires long operation times and the product characteristics are not desirable. In contrast, FD produces high quality products, but requires long processing times, high energy consumption and high operation costs. As an alternative, the Refractance Window® (RW) drying is relatively simple and cheap technique. The objective of this study was to compare the effect of CD, FD and RW techniques, on the moisture content, water activity, color, porosity, volume change, vitamin C and carotenoids content in guava samples. The samples dried by RW required less time to reduce the moisture content and exhibited smaller changes in color than CD or FD. There were greater losses of carotenoids and vitamin C when drying by CD whereas RW had similar losses than FD. Lyophilized products exhibited minor change in volume and greater porosity. RW results in better retention of properties, compared with other drying techniques. Based on this, RW is a promising technique for the development of guava snacks.

Graphical Abstract

1. Introduction

Pink guava (Psidium guajava L.), which belong to the Myrtaceae family, is a favorite fruit in tropical and hot subtropical zones and is becoming increasingly popular in European and North American markets, because of its high potential for agro-industrial use, and its known antioxidant properties mainly attributed to vitamin C and carotenoids content [1,2]. The high levels of these compounds could suggest their relevance in boosting the immune system as well as in cancer prevention. This fruit is used in different processed products such as nectars, juices, preserves, jams, syrups and beverages; however, dehydrated guava (as snack or as an ingredient for other food products) is not as common as the other products in the market.
According to Global Industry Analysts, Inc. [3], the global consumption of dried fruits is forecast to reach 4.0 million by 2020, driven by growing focus on inculcating healthier foods habits, rising health consciousness, increasing disposable incomes, and a parallel rise in per capita spending on foods.
The choice of preservation method is very important, particularly for foods containing high amounts of bioactive compounds, because processing can affect product quality [2]. Drying is a preservation technique that reduces the moisture content of foods, thereby decreasing weight and volume and facilitating the transport and storage of the product [4]. Once fruits and vegetables are dried, the water activity decreases (<0.6), inhibiting spoilage microorganisms and enzymatic activity as well as physical and chemical changes during storage [5]. Guava has been dried by various methods such as atomization [6], oven-drying [1,7], fluidized bed drying [8], heat pump dryer [9], lyophilization [1,2,9,10], cast-tape drying [11], and hot air drying [9,12]. Guava dried by these methods has been used as a food ingredient; however, as mentioned before, the use of this fruit as a snack has not been reported.
Drying with hot air is the most commonly used technique in the food industry, but it requires long operation times and the characteristics of the final product are not always desirable [2,13]. In contrast, drying by lyophilization (or freeze drying) is the least used technique due to the long processing times, high energy consumption and high operation costs; however, the dry product is of high quality. Lyophilized products are characterized by their low water activity, maintenance of form and volume and high porosity and rehydration capacity, among other parameters [9,10,14]. This method consists of removing water from the structure of the product by sublimation, which occurs when the vapor pressure and temperature of the surface of the ice are below the triple point of water (611.73 Pa, 0.01 °C), thus reducing substance entrainment and damage to the structure of the product [14].
The Refractance Window® (RW) drying technique is a technique developed by MCD Technologies, Inc., is relatively simple, cheap and can be applied to a variety of products. It uses water as a heating medium at a temperature below the boiling point and at atmospheric pressure. The product is placed on a film that is relatively transparent to infrared radiation from water [15,16,17,18]. In several investigations has been demonstrated that RW results in high retention of nutritional, physiochemical and organoleptic properties, compared with other drying techniques in products such as asparagus [15], pumpkin [18], berries [19,20], paprika [21], mango [22,23,24], pomegranate [25], haskap berry [26], apple [27], kiwi [28], papaya [29], and tomato [30].
The objective of this study was to obtain guava snacks by convective drying, freeze drying and refractance window drying methods, comparing the physicochemical and nutritional properties.

2. Materials and Methods

Guavas of the pear variety were used (Psidium guajava L.) in this study. In order to have an attractive appearance of the final product and to avoid the unpleasant taste of the seeds after drying, the fruits were washed, peeled and depulped. The initial moisture content of the pulp was 8.41 ± 0.85 g water/g pulp (dry basis, db) and the soluble solids content was 7.8 ± 0.4%. Slices, 2 mm thick and 35 mm in diameter, were made by spreading the pulp on an acrylic mold (Figure 1).
Hot air convection (CD) was conducted in a tray dryer (Armfield, UOP8 model, Hampshire, England) at 60 ± 0.5 °C and with an air velocity of 0.6 ± 0.02 m/s. Drying times were 10, 20, 30, 60, 120, 180 and 240 min. Freeze drying (FD) was performed in a tray lyophilizer (Labconco, 6 L, Kansas, USA); samples were frozen in the same lyophilizer at −35 °C. A vacuum pressure of 8 Pa was subsequently applied and the samples were heated to 35 °C. Drying times were 1, 2, 3, 4 and 5 h (not including the freezing time). Drying by refractance window (RW) was conducted on laboratory-grade equipment designed and constructed by CEI-ROBOTS and Universidad del Valle, from the information provided in Abonyi et al. [29] and Nindo et al. [15] (Figure 2) (Refer to the Supplementary Materials). The velocity of the tray was 4.16 × 10⁻⁵ m/s and the water temperature was 90 °C. Drying times were 10, 20, 30, 60 and 120 min.
In each drying method, physiochemical properties (moisture, water activity and color) were evaluated at each drying time, whereas porosity, volume and nutritional properties (vitamin C content and total carotenoid content) were determined only in fresh fruit and in dried fruit with a moisture content at 0.04 g water/g db.
The moisture content (Xw) was determined by AOAC method 20.013 [31] using an analytic balance (Mettler Toledo AE200, Kowloon, Hong Kong) with a 0.001 g sensitivity. Water activity (aw) was measured using a water activity meter (Decagon, Aqualab model, Pullman USA) with a sensitivity of 0.003.
Color was measured as the spectral reflectance between 400 and 780 nm using a spectrophotometer (Hunter Lab Color Flex, Reston, USA). Three measurements were taken on each sample. The CIE-L*a*b* color coordinates were obtained using the D65 illuminant and 10° observer. The color difference (ΔE) was calculated using Equation (1).
Δ E   =   ( Δ L * ) 2   +   Δ ( a * ) 2   +   ( Δ b * ) 2
where ΔL* is the change in the clarity/darkness value, Δa* is the change in the red/green axis and Δb* is the change in the yellow/blue axis. Changes in L*, a* and b* were calculated as the difference between the final (dry sample) and initial (original sample) values [21,22].
Porosity (ε) was calculated from values of real density (ρr) and apparent density (ρa) according to Equation (2), as follows:
ε = ( ρ r ρ a ρ r )   ( 100 )
The ρr was calculated as a function of the mass fraction of water (Xw) in the sample using Equation (3). The ρa was determined by the volume displacement method with a pycnometer at 20 °C.
ρ r = 1 X w 1000 + 1 X w 1590
The change in volume was calculated from the initial volume of the sample (V0) and the volume at time t (Vt) using Equation (4). Measurements were taken with a digital calibrator (Bull Tools, USA); the diameter and height were measured at 3 points separated by 120 degrees on the circular face of the sample.
Δ V = ( V 0 V t V 0 )   ( 100 )
Carotenoids in guava samples were extracted following the protocol described the literature with modifications [32]. Five g of homogenized guava sample were added to 50 mL centrifuge tubes with 10 mL of acetone. After 10 min, 10 mL of petroleum ether were added and mixed using an ultra-turrax (IKA Janke & Kunkel) for 30 s. The samples were then centrifuged (Eppendorf 5804R, Hamburg, Germany) at 3000 rpm for 10 min at 10 °C. The upper (organic) phase was collected separately and the extraction was repeated two additional times with 5 mL of acetone and 5 mL of petroleum ether. Ten mL of NaCl 0.1M solution were added to the organic extract and centrifuged at 3000 rpm for 7 min at 10 °C. The lower (aqueous) phase was discarded and the washing process was repeated twice. Because of the wide range of carotenoid concentration, final extraction volumes of 30, 35, and 40 mL were adjusted for low, middle, and high total carotenoids content (TCC) samples. For HPLC determinations, the organic extract was totally dried in glass tubes with the nitrogen evaporator N-EVAP 112 (Organomation Associates, Berlin, MA) and re-dissolved in 3, 4, or 5 mL of (1:1) methanol and methyl tert-butyl ether for low, middle, and high TCC samples, respectively. The samples were shaken in a vortex mixer and filtered through a 0.22 μm polytetrafluoroethylene filter. The chromatographic system consisted of a YMC Carotenoid S-5 C30 reversed-phase column (4.6 mm × 150 mm; particle size, 5 μm) with a YMC Carotenoid S-5 guard column (4.0 mm × 23 mm). Mobile phase A was methanol with 2% of ammonium acetate adjusted to pH 4.6 and mobile phase B was methyl tert-butyl ether. The gradient was 0 min 85% A, 20.0–23.5 min 40% A, and 23.8 min 85% A at a constant flow of 0.66 mL min-1. The column temperature was 25 °C, the autosampler temperature was 4 °C, and the injection volume was 10 μL. All-trans-β-carotene was identified and quantified with the use of an external standard and a calibration curve made in the range of 2–30 μg/mL (Sigma-Aldrich) at 450 nm using a diode array detector. TCC by HPLC was calculated using the sum of the areas of all peaks in the chromatogram at 450 nm and quantified with the same curve as trans-BC [32].
The ascorbic acid content (mg/100 g of sample) was measured in both fresh and dried samples. The content was determined via a redox titration using iodine. A solution of 0.01 N iodine, a starch indicator solution (1% w/v) and sulfuric acid (10%) was employed [33,34]. The content of ascorbic acid was determined using the following expression:
A A = ( V ) ( N ) ( 176.23 ) 2   w
where AA is the ascorbic acid content (mg/100 g sample), V is the volume of iodine (ml), N is the normality of the iodine solution and w is the sample weight (g). To calculate the loss of ascorbic acid, AA values were converted to a dry matter basis.
All experimental results were statistically analyzed, using statistical package Minitab 16 (version 16.2.4; Minitab Inc., State College, PA, USA) to perform one-way analysis of variance (ANOVA) and Tukey’s significant multiple comparison test at a 95% confidence level (α = 0.05). Differences were considered to be significant at p < 0.05. All the experiments were made in triplicate and an arithmetic average was taken for data interpretation.

3. Results and Discussion
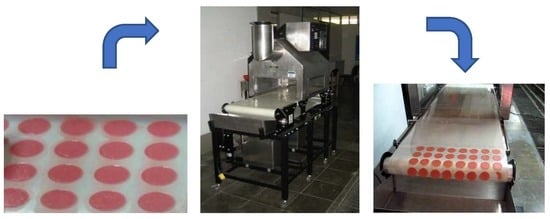
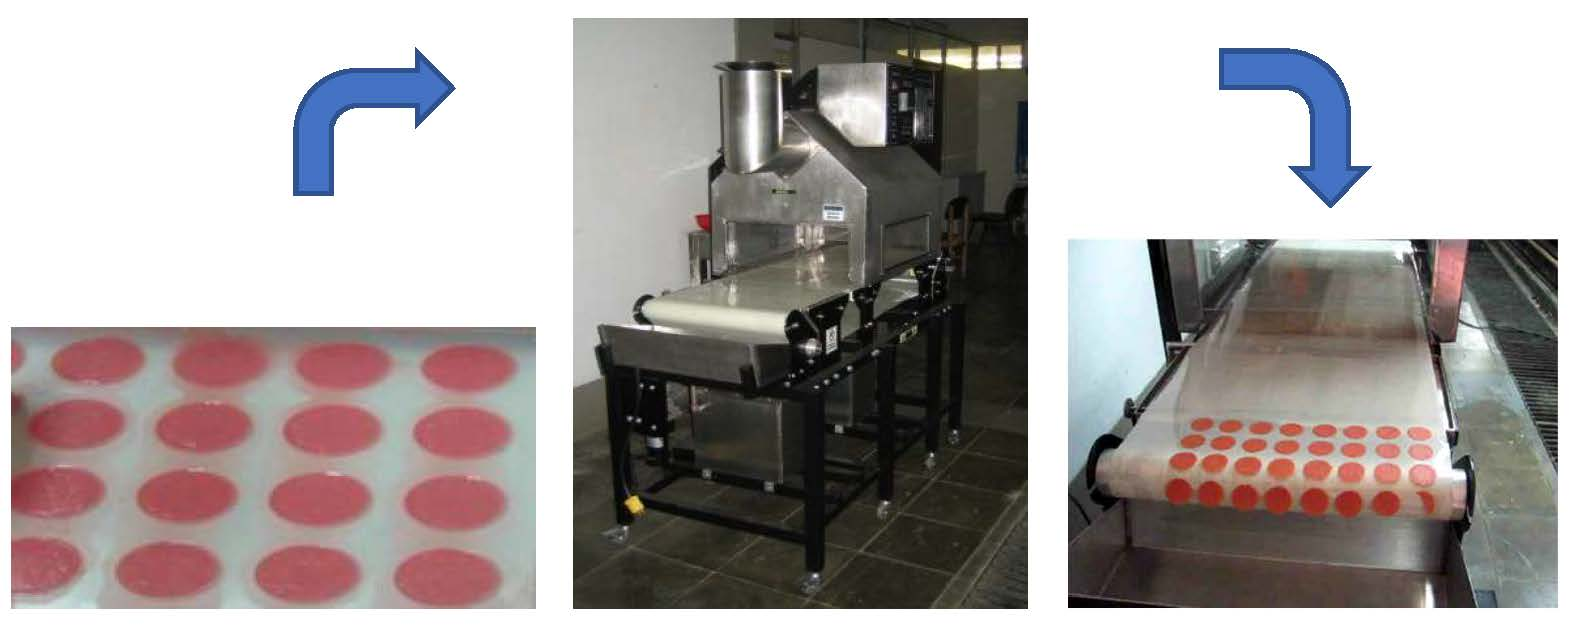
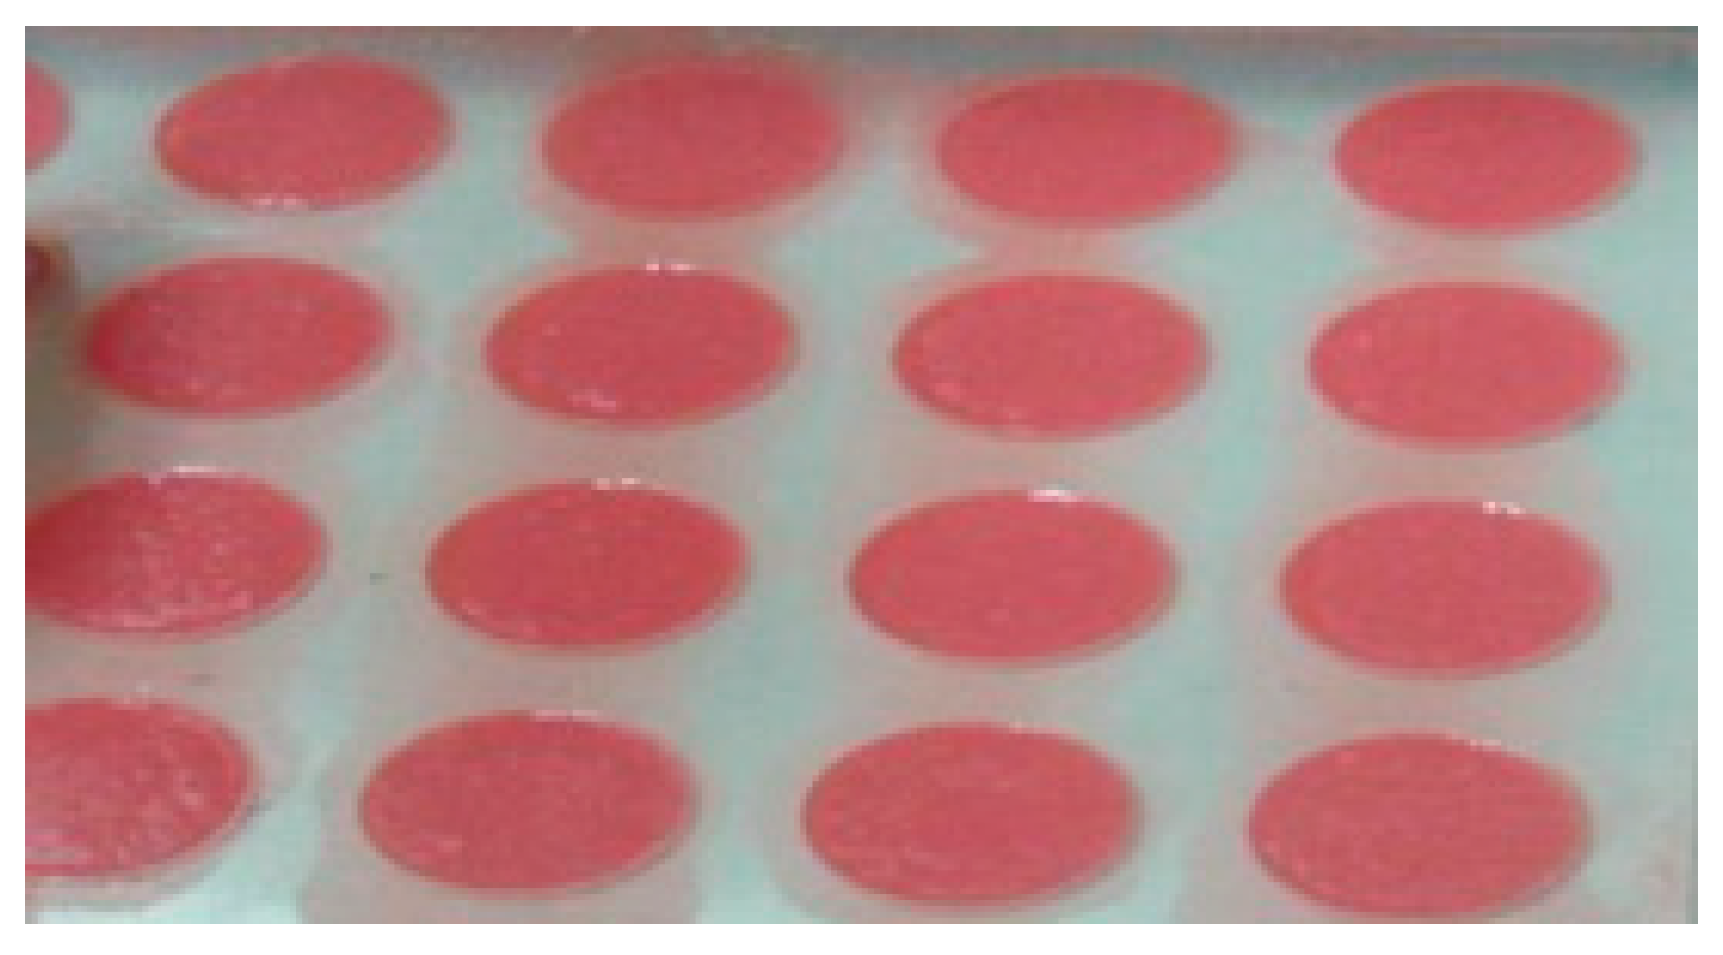
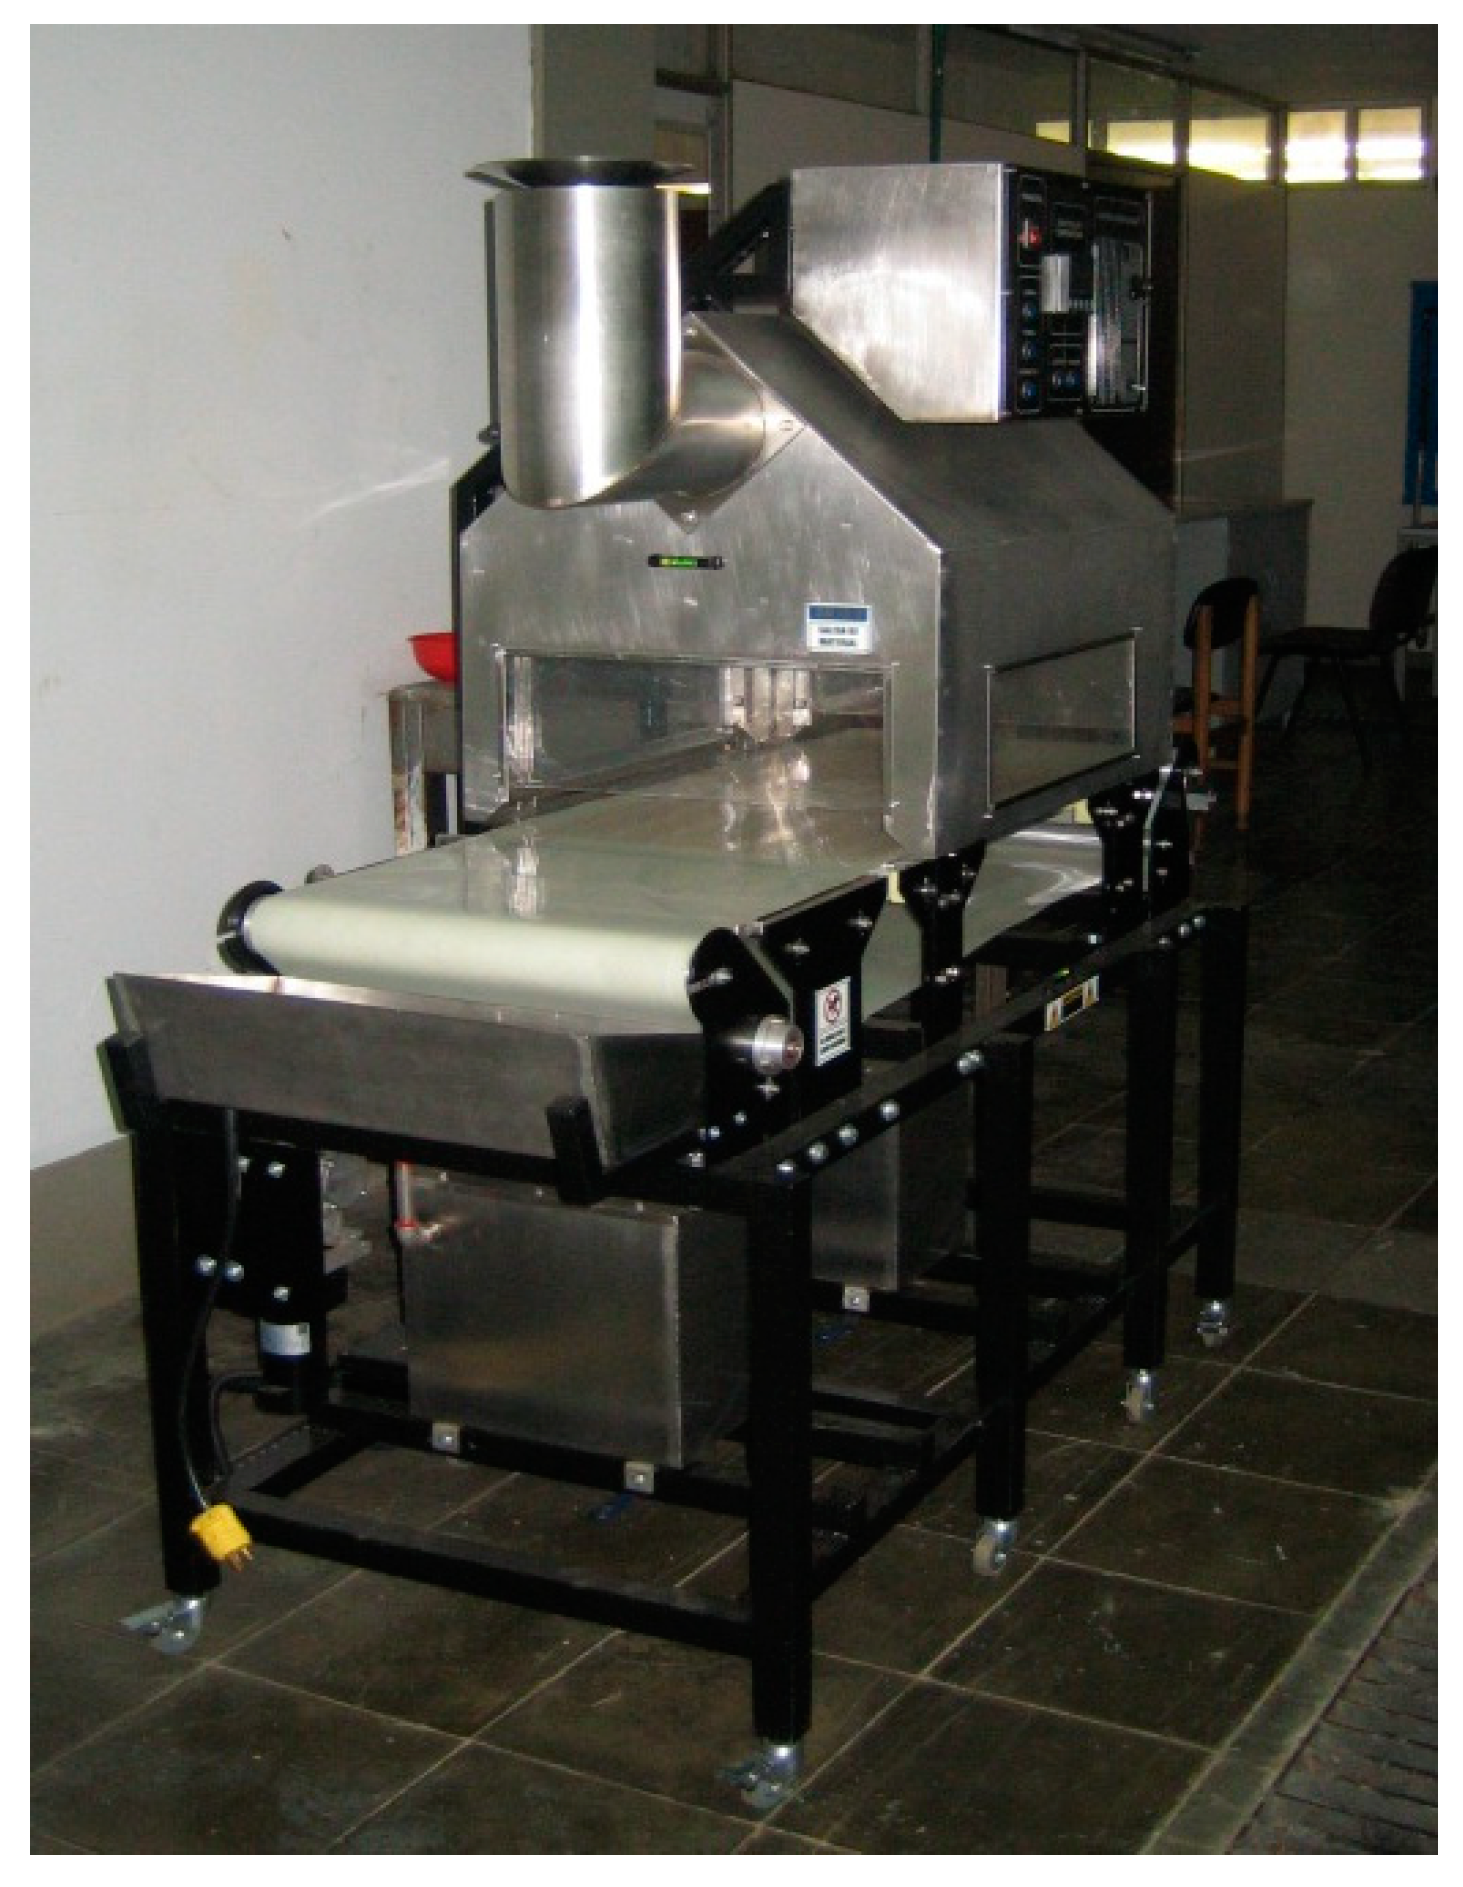
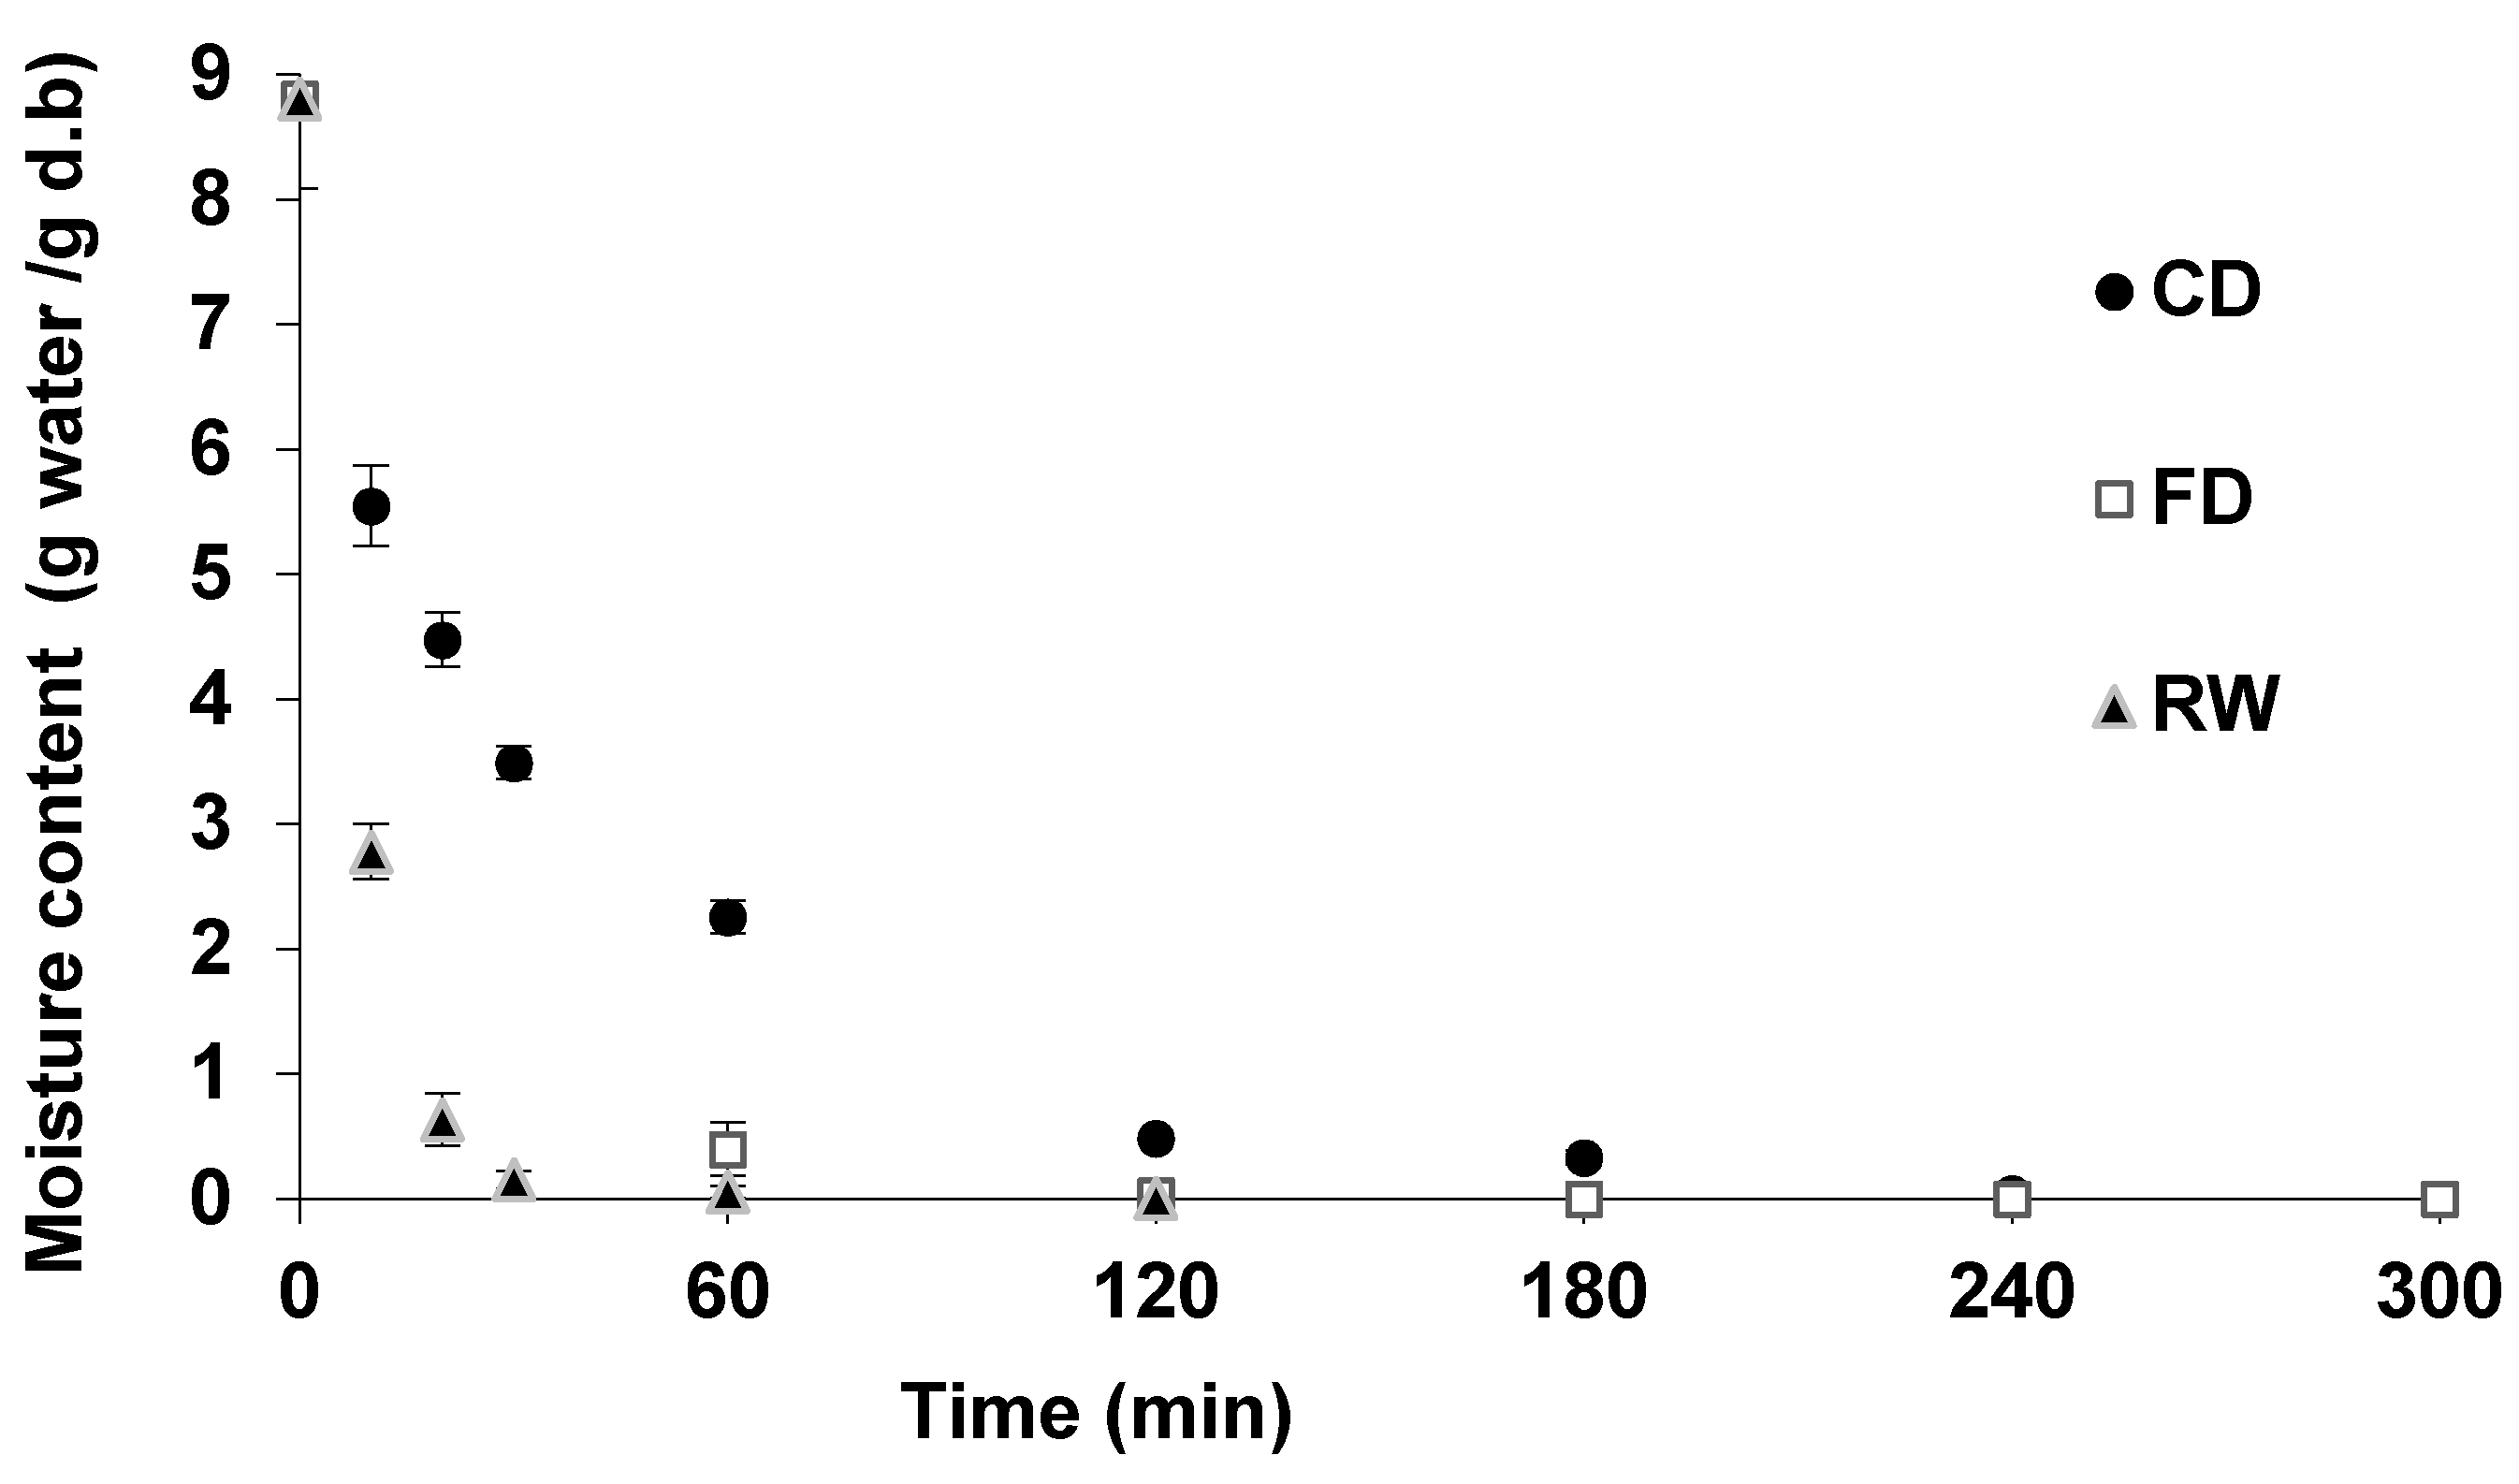
3.1. Drying

Figure 3 shows the drying curves of guava samples obtained by CD, FD and RW methods. The moisture content of the fresh samples was 8.8 ± 0.7 g water/g dry solid (89.7%, wet basis). The decrease in water content using RW was achieved in less time than the CD and FD methods; with RW, a moisture content of 0.040 ± 0.002 g water/g db was achieved in 76 min, whereas the same moisture content was achieved in 107 and 240 min for FD and CD, respectively (Table 1).
The high drying rate using RW is the result of the high mass and energy transfer that occurs in the food because of the continuous circulation of hot water below the conveyor, and the circulation of air on the samples increasing the convection mechanisms besides of the combination of radiation and conduction during the drying [5,18,25,28].
A lower drying time for RW was also observed by Nindo et al. [15], who compared the drying of asparagus by the CD, FD and RW methods; the authors found that with RW, a moisture content of 0.10 (db) was obtained in 4.4 min, whereas with CD and FD, drying times were 210 and 1080 min, respectively. The drying time of asparagus puree with RW was lower than the value for guava pulp in this study; this difference is due to the thickness of the sample. In asparagus, an atomized sample was used, creating a fine layer on the belt, whereas a 2 mm sample was used for the guava puree. Ochoa et al. [22] compared the RW and convective drying methods for the drying of mango slices of 1 and 2 mm thicknesses. The authors found that to achieve a moisture content close to 0.05 g water/g db, 30 min was required for 1 mm samples and 60 min was required for 2 mm samples dried by RW, whereas drying times with CD were greater than 120 min. Abonyi et al. [4] compared the RW and FD methods for carrot and strawberry purees of 1 mm thickness. The results showed that carrot samples dried by RW achieved a moisture content of 0.065 g water/g db and strawberry samples achieved a moisture content of 0.1099 g water/g db within 3–5 min; with the FD method, 24 h was needed to achieve a similar moisture content. Cichella Frabetti et al. [11] performed drying of guava using a technique called cast-tape drying (similar to RW technique), but they used hot water at 98 ± 2 °C and vapor in contact with Mylar film. The drying time was 10 min for 2 mm-thick guava pulp.

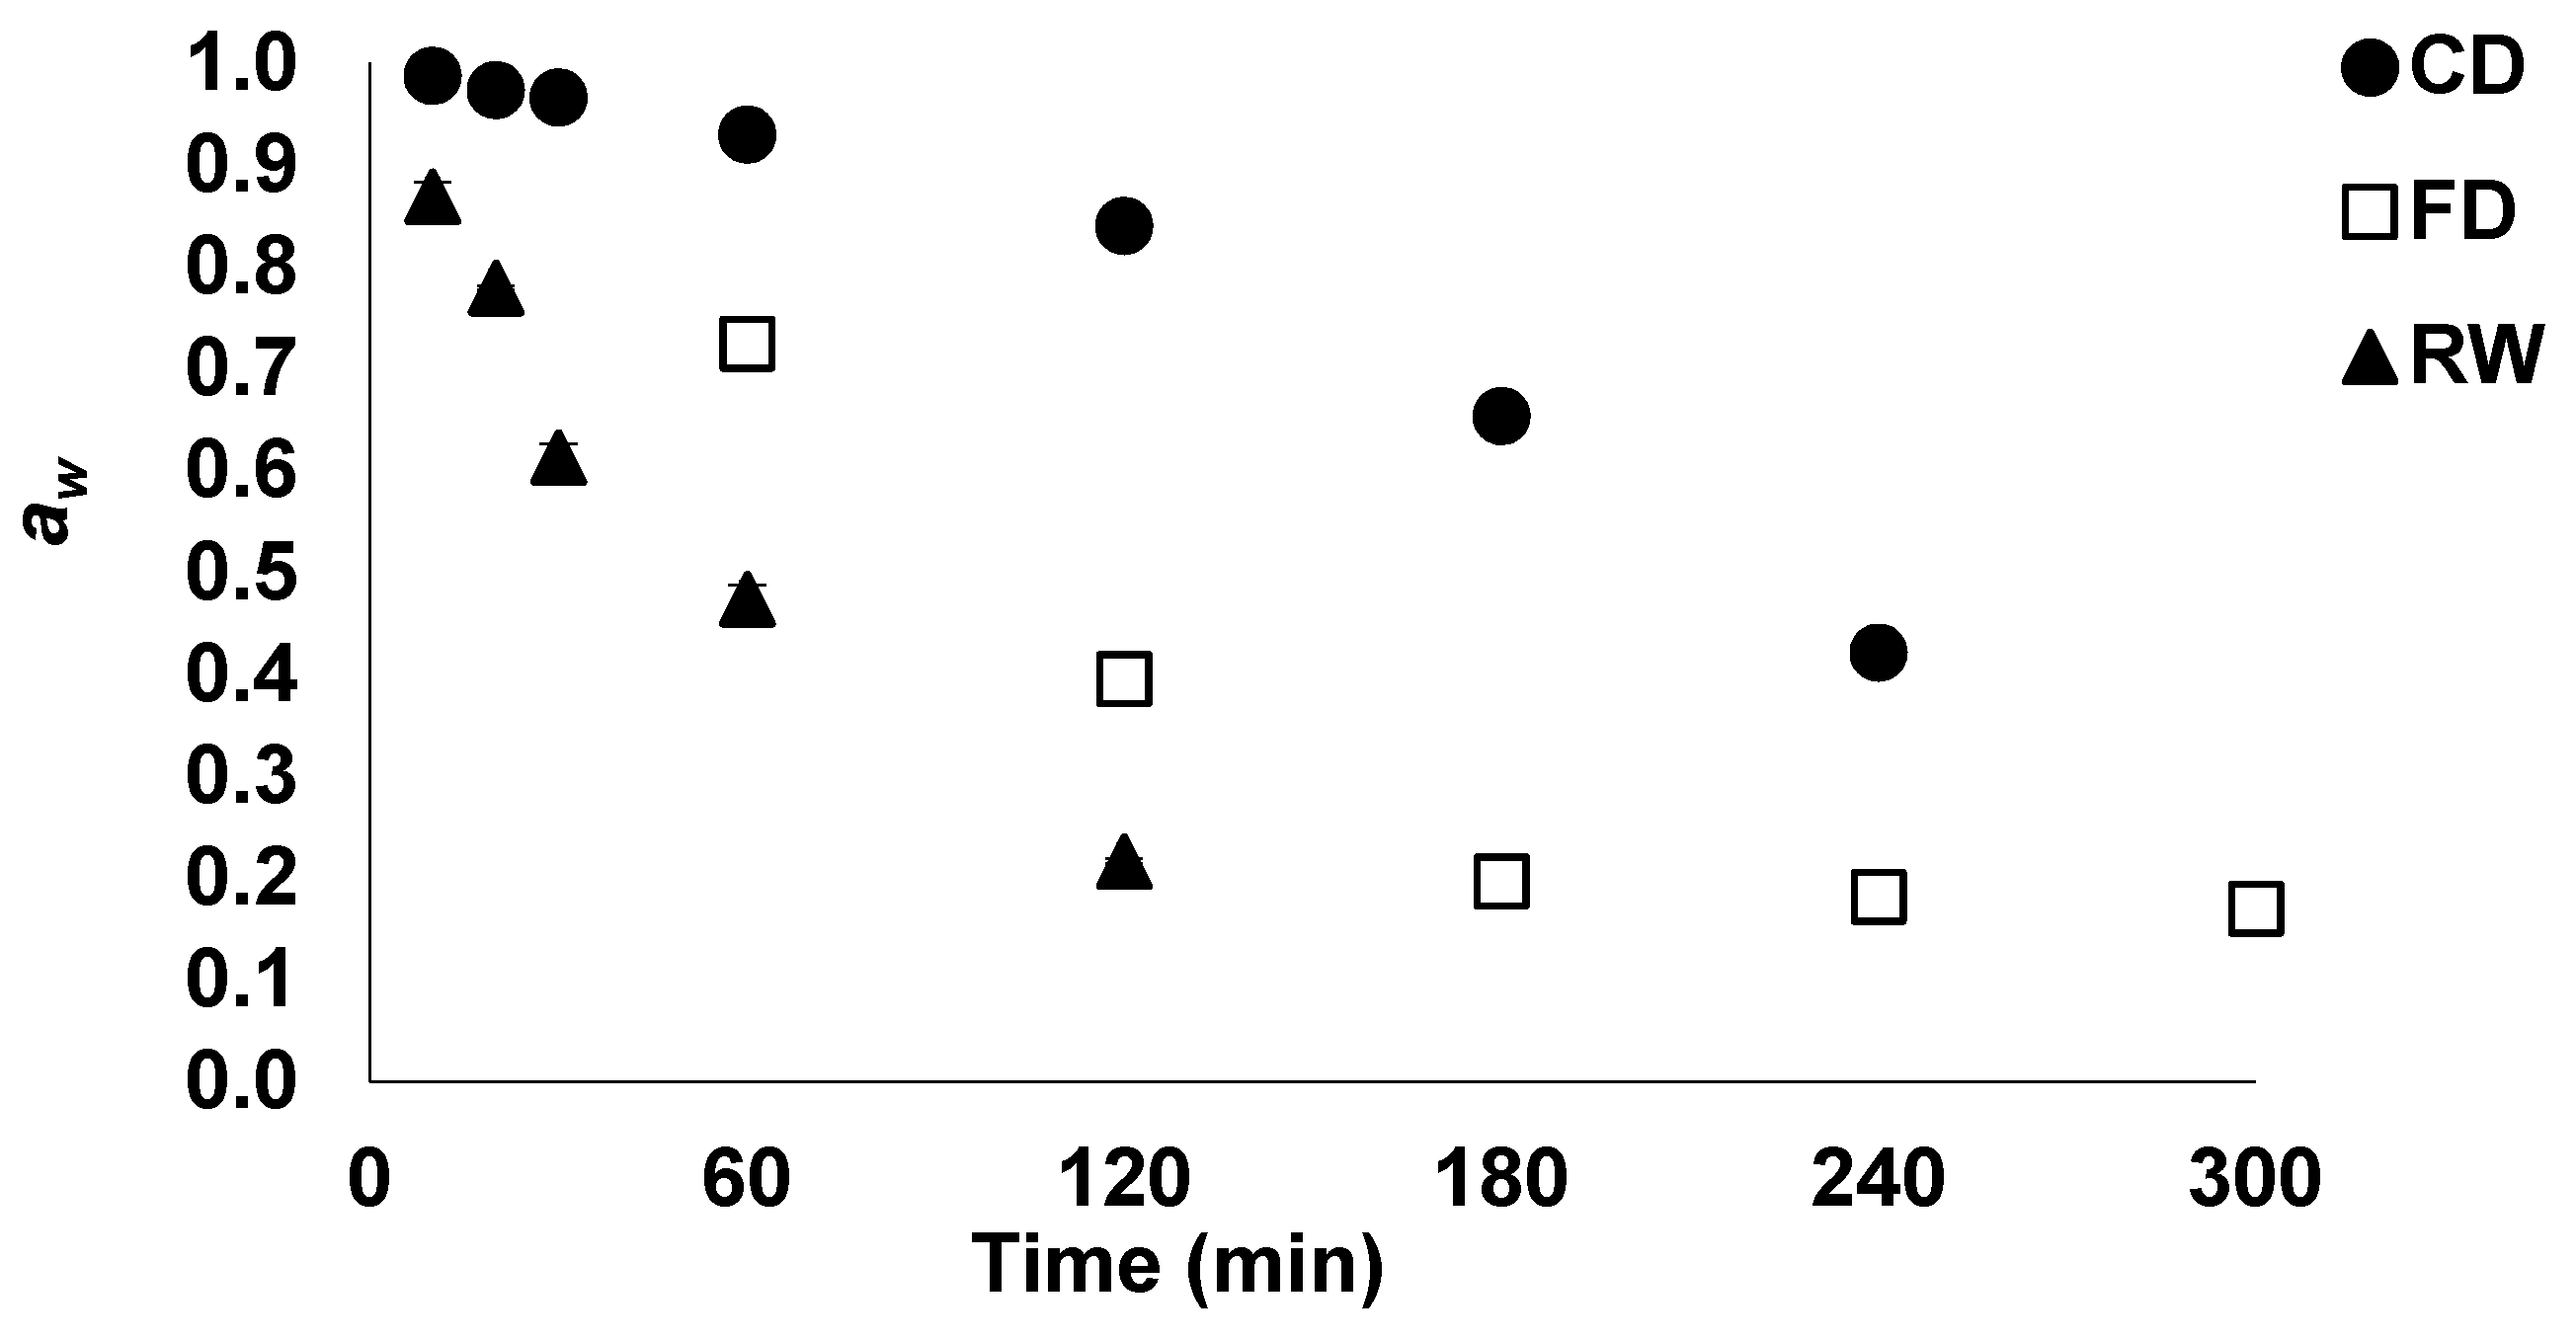
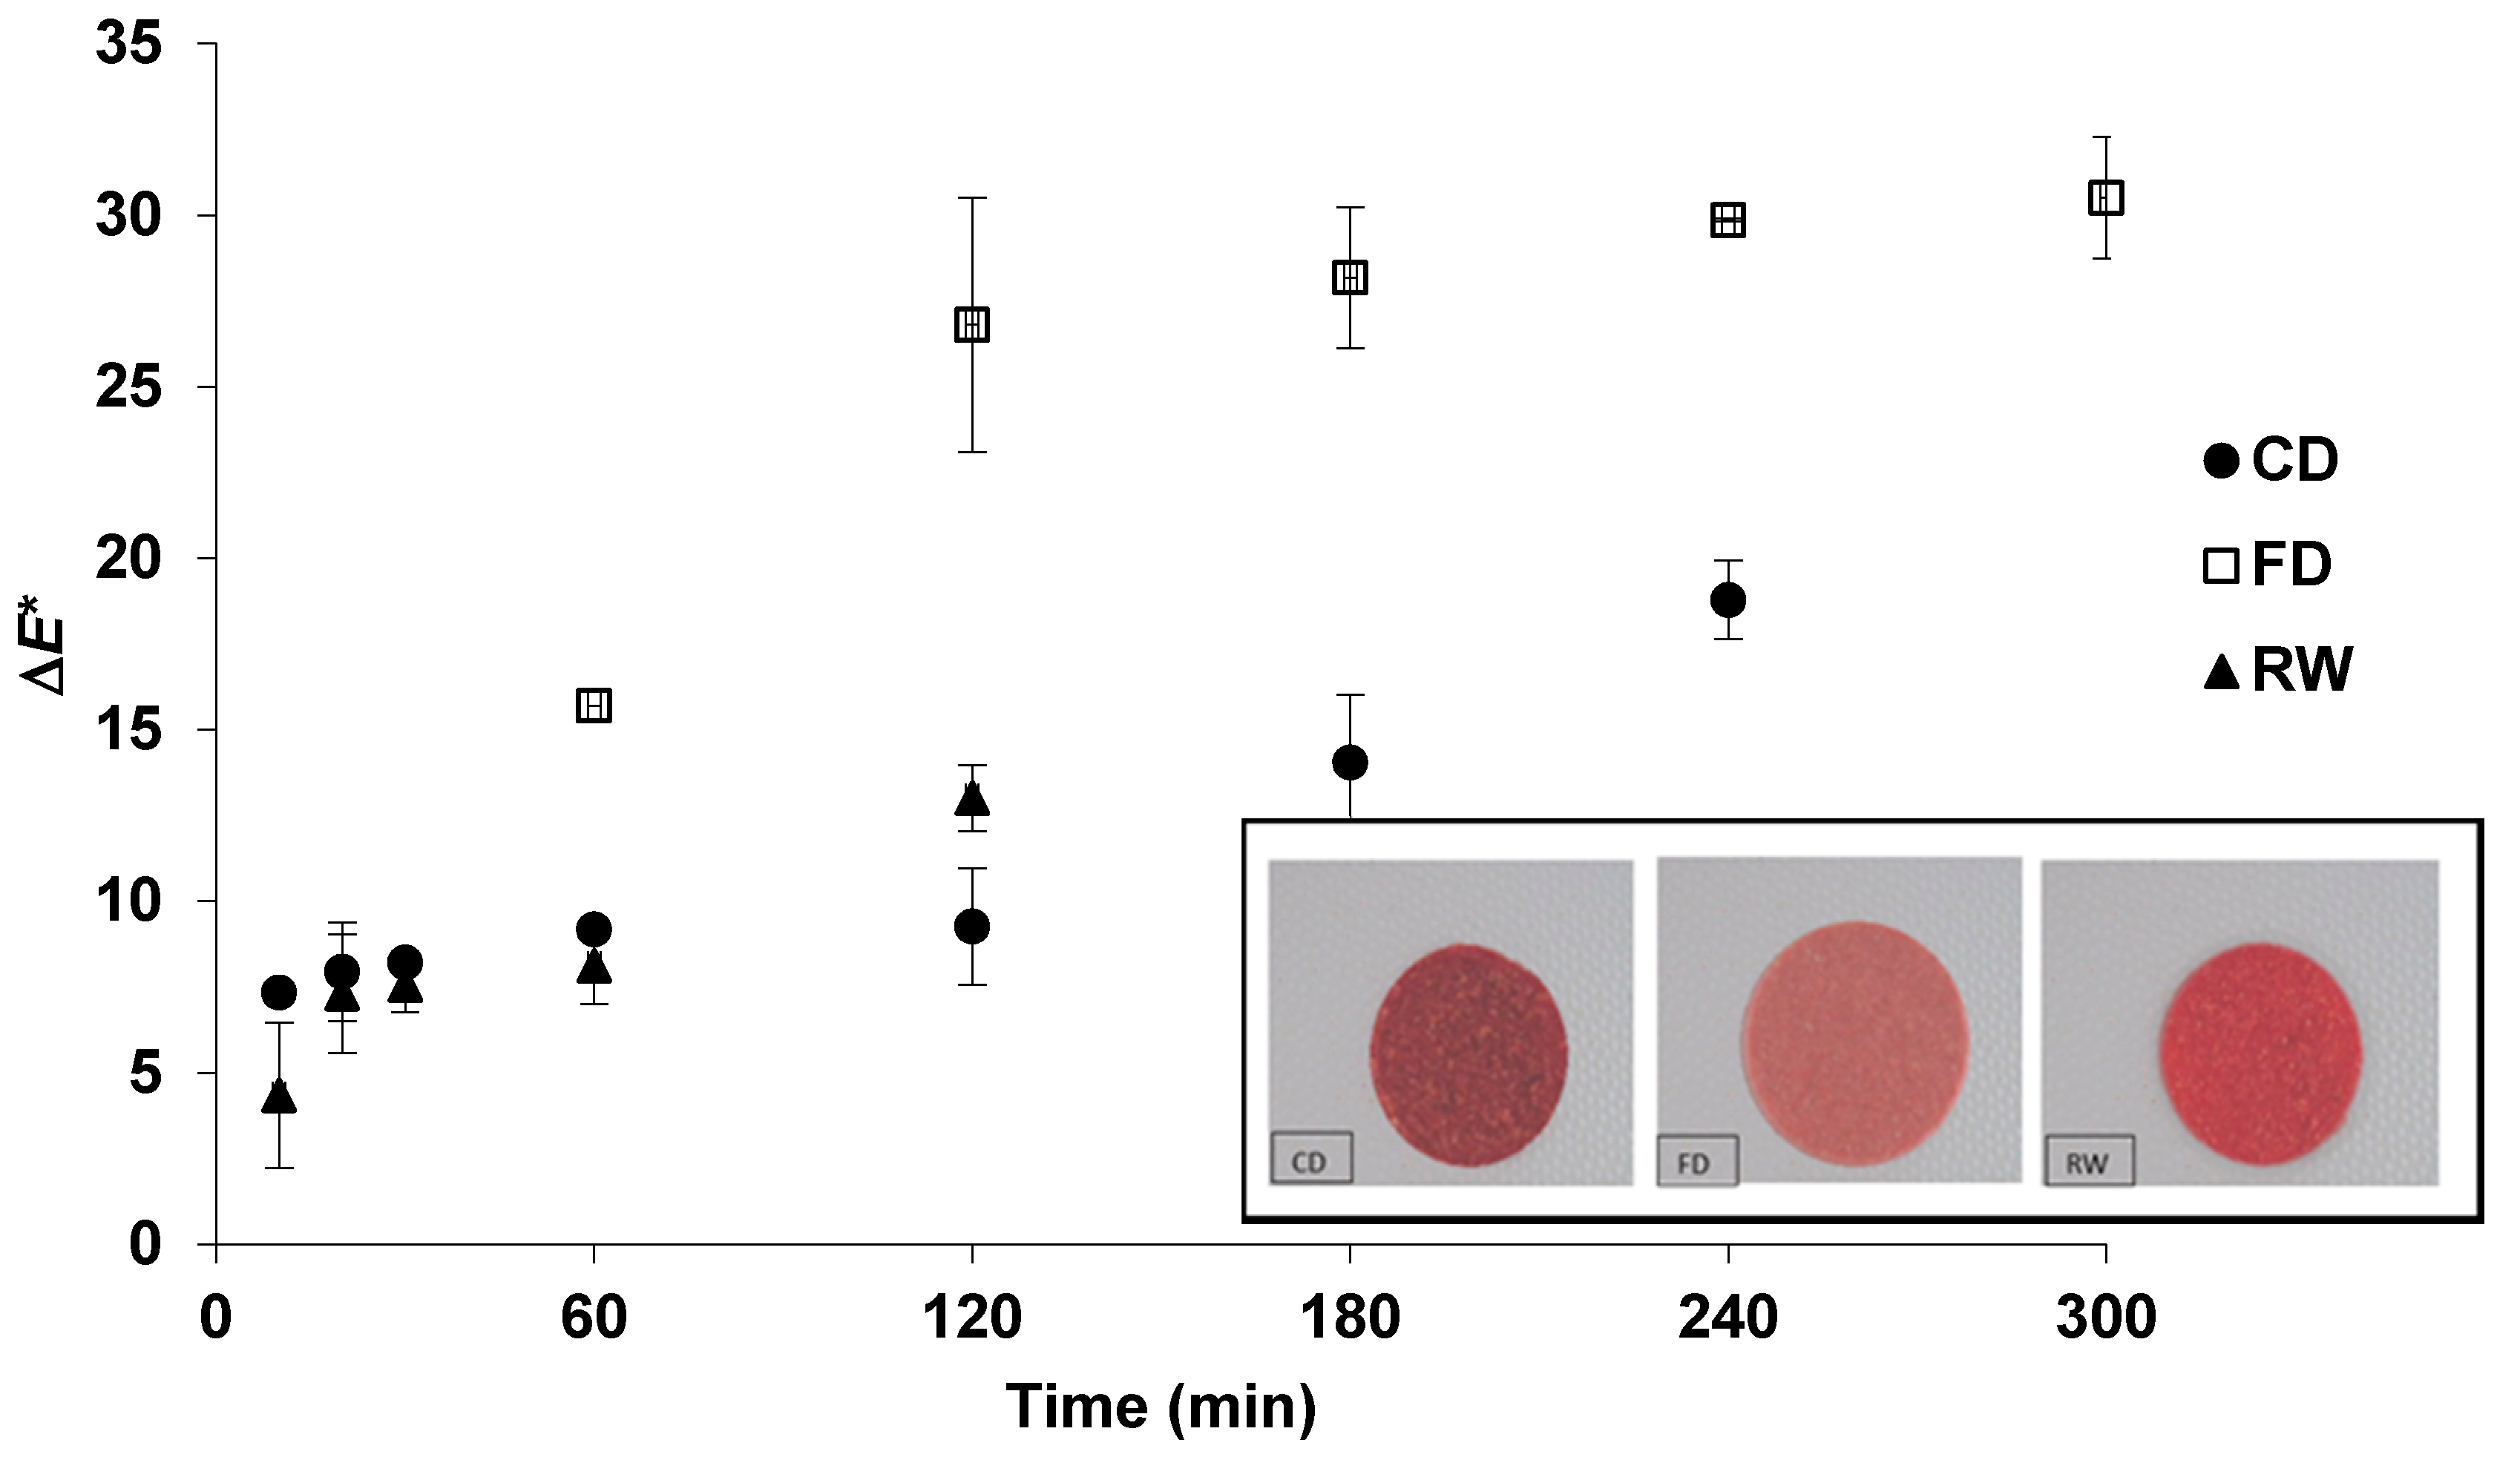
3.2. Physicochemical Properties

In Figure 4, aw curves are shown for guava samples dried by the three methods. The aw values were lower for the RW method than for the other methods; this result is associated with the lower moisture content of the fruit during drying by RW. In Table 1, the values of aw, color, volume (V) and of guava pulp are shown at a moisture content of 0.040 ± 0.002 g water/g db for the CD, FD and RW methods. The aw values of the samples were similar and varied between 0.4210 and 0.4311; these values indicate high stability of the dehydrated pulp against microbiological spoilage during storage [5]. Similar results were found by Ochoa et al. [22] and Caparino et al. [24] for the drying of mango with RW. According Barbosa-Canovas et al. [5], the water content in a food is not completely available for microbial growth; part of it is bound to components of the food. Thus, water activity is the best measurement to quantify the water necessary for the growth and development of microorganisms as well as enzymatic activity.
Figure 5 shows the total color change of guava during drying by CD, FD and RW. An ANOVA showed that the color change was significantly different (p < 0.05) among the three drying methods. The lyophilized samples showed the greatest change in color during drying due to the greater luminosity values obtained (not shown), whereas the a* and b* values showed no significant differences (p < 0.05) compared with fresh fruit (values not shown). Consistent with this result, when drying samples by FD to 4% (db) (Table 1), the ΔL* values were higher (21.57 ± 0.74) and the Δa*and Δb* values were lower and similar. Hawlader et al. [9] showed the same effect in papaya comparing FD and CD, Abonyi et al. [4] observed similar results in strawberries and carrots and Baeghbali et al. [25] reported the colour of pomegranate after RW drying was similar to the FD product. In general, there is a lower index of browning in the lyophilization process due to the reduction in oxygen content. CD drying showed the highest values of Δa* and Δb* (Table 1) due to the presence of oxygen over the long residence time during processing (240 min), which results in spoilage and non-enzymatic browning reactions associated with color loss (Maillard reactions and oxidation reactions) [2,12,35]. Mastrocola and Lerici [36] showed that the metallic trays of the convective dryer promote reactions that form complexes with metal ions in the fruit such as copper and iron, causing browning. When drying with RW, smaller values of ΔE were obtained for the same moisture value; for example, in Table 1, the lowest value (8.46) at a moisture of 0.04 (db) was recorded for RW. This result possibly occurred due to the lower exposure time of the fruit during drying. The photographs shown in Figure 5 demonstrate the higher luminosity of lyophilized samples compared with the sample dried by convective drying, which shows browning.
Changes in the volume and porosity of guava samples at 4% (db) moisture are presented in Table 1. The ANOVA showed significant differences in shrinkage and porosity (p < 0.05) among the three drying methods. Samples dried by FD showed a higher porosity (73.41%) and a smaller loss of volume (22.75%), followed by samples dried by RW with 19% porosity and a 42.31% in loss of volume; the samples dried by CD showed the lowest values of porosity (5.89%) and the greatest loss of volume (81.34%). Similar results have been observed by other authors when fruits are dried with different methods. Krokida and Maroulis [37] reported high values of porosity in lyophilized fruits such as banana (90%) and pumpkin (92%) and low porosities for these fruits when dried with hot air (25% and 12%, respectively). Que et al. [38] reported the porosity of lyophilized pumpkin at 85% and of pumpkin dried with hot air at 67%. Ochoa et al. (2012) published that the porosity in mango dried by the RW technique was greater compared with mango dried with hot air. Marques et al. [10] also reported high porosity values in lyophilized guava (89%). Hawlader et al. [9] obtained low porosity values (34.39%) for guava dried by lyophilization and with hot air (15.88%); this low value of porosity from lyophilization compared with the current study may be due to the different operating conditions used.
In this study, the glass transition temperature (Tg) was not investigated, but it is a significant factor explaining the change in volume (shrinkage) of dried fruit, particularly for the RW and CD methods. It is possible that the temperature of the fruit at the end of drying in the RW and CD methods had exceeded the glass transition temperature for a moisture level of 0.04 g water/g (db) causing a greater decrease in dimensions (shrinkage) and lower porosity with respect to the lyophilized sample. If the temperature of a material is above its Tg, viscosity is considerably reduced, causing deformation [39]. The high porosity in lyophilized samples can be attributed to the low temperature, which causes the material to be maintained in a glass state, reducing internal cellular collapse and therefore producing low shrinkage and high porosity [40]. Greater porosity values and reduced loss of volume in lyophilized guava pulp were expected. The pre-processing of fruit (transformation into pulp), modifies the structure by decreasing the pore size and possibly causes shrinkage.

3.3. Nutritional Properties

The β-carotene, lycopene and total carotenoids content was quantified for a moisture content close to 0.13 g water/g db (Table 2). Carotenoids are the most common group of natural pigments found in plants and are red, orange or yellow [2]. McCook-Russell et al. [41] reported 1952 μg GAE/g fresh weight total carotenoids and Dalla Nora et al. [2] reported 2298.6 μg/100 g dry fruit in fresh guava. According to Dalla Nora et al. [2] the carotenoids present in larger quantities in red guava are β-cryptoxanthin (10.298 μg/100 g dry fruit) and β-carotene (5.126 μg/g dry fruit) [2]. Furthermore, Nwaichi et al. (2015) reported a lycopene content of 51.0 μg/g and a β-carotene content of 3.8 μg/g [42].
Table 2 shows that total carotene decreases after drying with the three methods evaluated, without significant differences among them. The strongest effect on lycopene content was observed when samples were dried by FD; these samples exhibited significantly (p < 0.05) greater losses (39.02%) as compared to samples dried by CD (28.71%) and RW (29.57%); there were no significant differences between the CD and RW methods (p > 0.05). Lycopene can undergo degradation via isomerization and oxidation under different heating and light exposure conditions, but at the same time, heating (i.e., CD and RW) can enhance the extractability of lycopene from the tomato matrix [43].
Heat treatments can reduce carotenoids content in food because carotenoids are prone to degradation or isomerization, although the temperature can, at the same time, facilitate the inactivation of the enzyme lipoxygenase. Thus, hydroperoxides that decompose to alkoxyl and peroxyl radicals could be responsible for degradation of these pigments [2].
On the other hand, levels of β-carotene increased or remained constant in all evaluated methods but after FD, β-carotene levels increased significantly as compared to the other methods. A similar behavior was reported by Dalla Nora et al. [2]. The increase of these compounds may have occurred due to rupture and decompression of tissues, which would facilitate contact with the solvent and enhance extraction at the time of analysis [2].
The content of β-carotene is lower than that of lycopene to which is due the red-pink color of guava. The high loss of lycopene in FD is related to the results of color shown in Table 1 and Figure 5 where FD exhibited the greatest color changes.
Although in some studies [2,4] greater losses in carotenes have been found for drying with hot air, in the present study the three drying methods evaluated had a similar loss of total carotene. In a drying process, the cumulative effect of time-temperature determines the total carotene loss. Carotene degradation during CD and RW drying has been attributed to its high sensitivity to oxidation. In the case of FD, the formation of cis·isomers due the absence of oxygen, can also cause degradation of carotene [4].
According to Dalla Nora [2], the stability of carotenoids depends on many factors, such as the oxygen residue dissolved in the sample, the processing temperature and the matrix containing the carotenoids. Ratti [35] and Sanjinez-Argandoña et al. [12] mentioned that the loss of carotenes during drying with hot air is the result of several reactions in response to cellular damage and exposure to oxygen that result in the destruction of pigments. Some investigations of guava drying show losses of carotenoids greater than those observed in this study. Sanjinez-Argandoña et al. [12] reported a 75% loss in guava (Psidium guajava L. var. Paluma) with thicknesses of 5 and 7 mm that were osmotically pre-treated and subsequently placed in a tray dryer at 60 ± 2 °C for 3 and 4 h, respectively. Dalla Nora et al. [2] reported a 61% loss in guava (Psidium cattleianum Sabine) dried with air at 70°C and an air velocity of 0.72 m/s but the drying time was not reported.
The loss of vitamin C was quantified for a moisture content of 0.04 g water/g db (Table 3). Vitamin C is one of the most heat-sensitive nutrients, showing significant losses during drying, and is therefore an indicator for the retention of quality and the effects of heating in different drying methods [4]. Vitamin C is one of the most abundant antioxidants in fruits, and guava has one of the highest ascorbic acid contents of all fruits [44]. Fresh guava pulp had a vitamin C content of 68.4 ± 0.5 mg/100 g (664.21 mg/100 g db). Da Silva Oliveira et al. [34] reported a similar value of ascorbic acid in guava (76.4 ± 11.7 mg/100 g), and Lim et al. [44], Marques et al. [10] and McCook et al. [41] reported values of ascorbic acid in guava of 144 ± 60, 113.62 ± 0.02, and 120 ± 4.6 mg/100 g fresh weight, respectively.
Table 3 shows that the CD method resulted in the greatest loss of vitamin C (92.30%), followed by RW (69.57%) and FD (62.13%). The high loss of vitamin C in these three drying methods may be associated with oxidation from the incorporation of air during the depulping of the fruit; moreover, in CD drying, the presence of oxygen and the prolonged drying time also influence oxidative damage in fruit [12].
Other investigators have also reported high losses of vitamin C in the drying of guava; Sanjinez-Argandoña et al. [12] reported losses of vitamin C between 65% and 70% in the drying of guava with osmotic pre-treatment followed by drying with air at 60 °C, Marques et al. [10] recorded vitamin C losses of 80% in lyophilized guava pulp and Hawlader et al. [9] reported losses of 42% and 75% in FD and CD, respectively. The least loss of vitamin C during the lyophilization process (62.12%) is possibly due to the near absence of oxygen and the low temperature because, in anaerobic reactions, the degradation rate of vitamin C is generally lower than in aerobic processes. The smaller loss of vitamin C from RW compared with CD may be associated with the reduced residence time during drying (76 min), resulting in minimal oxidation of the fruit, whereas in the CD process, oxidation is greater due to the long drying time (240 min).
The ANOVA showed significant differences (p < 0.05) in loss of vitamin C between the CD drying method and the FD and RW methods, whereas there were no significant differences (p > 0.05) between the FD and RW methods. A similar pattern was reported by Abonyi et al. [4] when comparing the effect of the FD and RW methods on the degradation of vitamin C in strawberry puree.

4. Conclusions

The RW and FD methods exhibited a greater retention of the physical characteristics and nutritional quality of guava pulp compared with convection drying with hot air. With the RW method, the drying time to the same level of moisture is significantly lower, and there is greater retention of the total color in the fruit. Drying process reduced observed ascorbic and lycopene content but improved β-carotene. There were no significant differences among the CD, RW and FD methods in the retention of total carotenoids. Samples dried by FD exhibited greater porosity and less shrinkage, possibly due to the lower temperature used.
From the consideration of the scope of the present study, it turns out that it included physicochemical properties such as moisture content, water activity, color, porosity, volume change, vitamin C, and carotenoids content; however, it did not include shelf life and sensorial analysis tests. Although Refractance window technology is a promising alternative to dry guava for snack production, it would be convenient, in future work, to include those tests in order to supplement the knowledge gained about the dried product to assess the feasibility of introducing it into the snack market.

Supplementary Materials

The following are available online at https://www.mdpi.com/2227-9717/8/1/106/s1, Video S1: RW guava drying.

Author Contributions

Conceptualization, Y.M.L.-R., A.A.-A. and C.I.O.-M.; methodology, Y.M.L.-R.; formal analysis, Y.M.L.-R.; investigation, Y.M.L.-R.; resources, Y.M.L.-R., A.A-A. and C.I.O.-M.; writing—original draft preparation, Y.M.L.-R.; writing—review and editing, A.A.-A. and C.I.O.-M.; project administration, C.I.O.-M.; funding acquisition, A.A.-A. and C.I.O.-M. All authors have read and agreed to the published version of the manuscript.

Funding

This research was funded by COLCIENCIAS (Colombian Institute for the Development of Science and Technology, Francisco José de Caldas).

Acknowledgments

Authors thank Luis Fernando Londoño from International Center for Tropical Agriculture (CIAT) for the carotenoids content analyses.

Conflicts of Interest

The authors declare no conflict of interest. The funders had no role in the design of the study; in the collection, analyses, or interpretation of data; in the writing of the manuscript, or in the decision to publish the results.

References

  1. Nunes, J.C.; Lago, M.G.; Castelo-Branco, V.N.; Oliveira, F.R.; Guedes, A.; Perrone, D.; Monteiro, M. Effect of drying method on volatile compounds, phenolic profile and antioxidant capacity of guava powders. Food Chem. 2016, 197, 881–890. [Google Scholar] [CrossRef] [PubMed]
  2. Dalla Nora, C.; Müller, C.D.R.; de Bona, G.S.; De Oliveira Rios, A.; Hertz, P.F.; Jablonkski, A.; de Jong, E.V.; Flôres, S.H. Effect of processing on the stability of bioactive compounds from red guava (Psidium cattleyanum Sabina) and guabiju (Myrcianthespungens). J. Food Compos. Anal. 2014, 34, 18–25. [Google Scholar] [CrossRef]
  3. Global Industry Analysts, Inc. Shift to Healthier Food Habits Drives the Global Dried Fruits and Edible Nuts Market. 2014. Available online: http://www.prweb.com/releases/dried_fruits_and_nuts/food_industry/prweb11723691.htm (accessed on 15 March 2017).
  4. Abonyi, B.; Feng, H.; Tang, J.; Edwards, C.; Chew, B.; Mattinso, D.; Fellman, J. Quality retention in strawberry and carrot purees dried with Refractance WindowTM system. J. Food Sci. 2002, 67, 1051–1056. [Google Scholar] [CrossRef]
  5. Barbosa-Canovas, G.; Fontana, A.; Schmidt, S.; Labuza, T. Water Activity in Foods: Fundamentals and Applications; IFT Press – Blackwell Publishing: Ames, IA, USA, 2007. [Google Scholar]
  6. Patil, V.; Kumar, A.; Pratap, R. Optimization of the spray-drying process for developing guava powder using response surface methodology. Powder Technol. 2014, 253, 230–236. [Google Scholar] [CrossRef]
  7. Kong, K.; Ismail, A.; Tam, C.; Rajab, N. Optimization of oven drying conditions for lycopene content and lipophilic antioxidant capacity in a by-product of the pink guava puree industry using response surface methodology. LWT Food Sci. Technol. 2010, 43, 729–735. [Google Scholar] [CrossRef]
  8. Cabral, R.; Telis-Romero, J.; Telis, V.; Gabas, A.; Finzer, J. Effect of apparent viscosity on fluidized bed drying process parameters of guava pulp. J. Food Eng. 2007, 80, 1096–1106. [Google Scholar] [CrossRef]
  9. Hawlader, M.N.; Perera, C.; Tian, M.; Yeo, K. Drying of guava and papaya: Impact of different drying methods. Dry. Technol. 2006, 24, 77–87. [Google Scholar] [CrossRef]
  10. Marques, L.; Silveira, A.; Freire, J. Freeze-drying characteristics of tropical fruits. Dry. Technol. 2006, 24, 457–463. [Google Scholar] [CrossRef]
  11. Cichella Frabetti, A.C.; Durigon, A.; Laurindo, J.B. Effect of process variables on the drying of guava pulp by cast-tape drying. LWT Food Sci. Technol. 2018, 96, 620–626. [Google Scholar] [CrossRef]
  12. Sanjinez-Argandoña, E.; Cunha, R.; Menegalli, F.; Hubinger, M. Evaluation of total carotenoids and ascorbic acid in osmotic pretreated guavas during convective drying. Ital. J. Food Sci. 2005, 17, 305–314. [Google Scholar]
  13. Zhang, Z.; Wei, Q.; Nie, M.; Jiang, N.; Liu, C.; Liu, C.; Li, D.; Xu, L. Microstructure and bioaccessibility of different carotenoid species as affected by hot air drying: Study on carrot, sweet potato, yellow bell pepper and broccoli. LWT Food Sci. Technol. 2018, 96, 357–363. [Google Scholar] [CrossRef]
  14. Garcia, L.; Welti, J.; Vergara, F.; Bermúdez, D. Freeze-drying: The Basic Process. In Encyclopedia of Food and Health; Caballero, B., Finglas, P.M., Toldrá, F., Eds.; Elsevier: Oxford, UK, 2016; pp. 104–109. [Google Scholar]
  15. Nindo, C.; Sun, T.; Wang, S.; Tang, J.; Powers, J. Evaluation of drying technologies for retention of physical quality and antioxidants in asparagus (Asparagus officinalis L.). LWT Food Sci. Technol. 2003, 36, 507–517. [Google Scholar] [CrossRef]
  16. Raghavi, L.M.; Moses, J.A.; Anandharamakrishnan, C. Refractance window drying of foods: A review. J. Food Eng. 2018, 222, 267–275. [Google Scholar] [CrossRef]
  17. Karam, M.C.; Petit, J.; Zimmer, D.; Baudelaire Djantou, E.; Scher, J. Effects of drying and grinding in production of fruit and vegetable powders: A review. J. Food Eng. 2016, 188, 32–49. [Google Scholar] [CrossRef]
  18. Ortiz-Jerez, M.J.; Gulati, T.; Datta, A.K.; Ochoa-Martínez, C.I. Quantitative understanding of Refractance WindowTM drying. Food Bioprod. Process. 2015, 95, 237–253. [Google Scholar] [CrossRef]
  19. Nindo, C.I.; Tang, J.; Powers, J.R.; Bolland, K. Energy consumption during Refractance Window evaporation of selected berry juices. Int. J. Energy Res. 2004, 28, 1089–1100. [Google Scholar] [CrossRef]
  20. Nemzer, B.; Vargas, L.; Xia, X.; Sintara, M.; Feng, H. Phytochemical and physical properties of blueberries, tart cherries, strawberries, and cranberries as affected by different drying methods. Food Chem. 2018, 262, 242–250. [Google Scholar] [CrossRef]
  21. Topuz, A.; Feng, H.; Kushand, M. The effect of drying method and storage on color characteristics of paprika. LWT Food Sci. Technol. 2009, 42, 1667–1673. [Google Scholar] [CrossRef]
  22. Ochoa-Martínez, C.I.; Quintero, P.T.; Ayala, A.A.; Ortiz, M.J. Drying characteristics of mango slices using the Refractance WindowTM technique. J. Food Eng. 2012, 109, 69–75. [Google Scholar] [CrossRef]
  23. Kaur, G.; Saha, S.; Kumari, K.; Datta, A.K. Mango pulp drying by refractance window method. Agric. Eng. Int. CIGR J. 2017, 19, 145–151. [Google Scholar]
  24. Caparino, O.A.; Nindo, C.I.; Tang, J.; Sablani, S.S.; Chew, B.P.; Mathison, B.D.; Powers, J.R. Physical and chemical stability of Refractance Window®–dried mango (Philippine ‘Carabao’ var.) powder during storage. Dry. Techol. 2017, 35, 25–37. [Google Scholar] [CrossRef]
  25. Baeghbali, V.; Niakousari, M.; Farahnaky, A. Refractance Window drying of pomegranate juice: Quality retention and energy efficiency. LWT Food Sci. Technol. 2016, 66, 34–40. [Google Scholar] [CrossRef]
  26. Celli, G.B.; Khattab, R.; Ghanem, A.; Brooks, M.S.L. Refractance WindowTM drying of haskap berry—Preliminary results on anthocyanin retention and physicochemical properties. Food Chem. 2016, 194, 218–221. [Google Scholar] [CrossRef] [PubMed]
  27. Franco, S.; Jaques, A.; Pinto, M.; Fardella, M.; Valencia, P.; Núñez, H.; Simpson, R. Dehydration of salmon (Atlantic salmon), beef, and apple (Granny Smith) using Refractance windowTM: Effect on diffusion behavior, texture, and color changes. Innov. Food Sci. Emerg. Technol. 2019, 52, 8–16. [Google Scholar] [CrossRef]
  28. Jafari, S.; Azizi, D.; Mirzaei, H.; Dehnad, D. Comparing quality characteristics of oven-dried and refractance window-dried kiwifruits. J. Food Process. Preserv. 2016, 40, 362–372. [Google Scholar] [CrossRef]
  29. Ocoró Zamora, M.U.; Ayala-Aponte, A. Influence of thickness on the drying of papaya puree (Carica papaya L.) through refractance windowTM technology. Dyna Rev. Fac. Nac. Minas 2014, 80, 147–154. [Google Scholar]
  30. Castoldi, M.; Zotarelli, M.; Durigon, A.; Carciofi, B.; Laurindo, J. Production of tomato powder by refractance window drying. Dry. Technol. 2015, 33, 1463–1473. [Google Scholar] [CrossRef]
  31. AOAC method 20.013. Official Methods of Analysis, 13th ed.; Association of the Official Analytical Chemists: Washington, DC, USA, 1980. [Google Scholar]
  32. Jaramillo, A.M.; Londoño, L.F.; Orozco, J.C.; Patiño, G.; Belalcazar, J.; Davrieux, F.; Talsmal, E.F. A comparison study of five different methods to measure carotenoids in biofortified yellow cassava (Manihot esculenta). PLoS ONE 2018, 13, e0209702. [Google Scholar] [CrossRef]
  33. Zhang, Y.; Zhao, J.H.; Ding, Y.; Xiao, H.W.; Sablani, S.S.; Nie, Y.; Tang, X.M. Changes in the vitamin C content of mango with water state and ice crystals under state/phase transitions during frozen storage. J. Food Eng. 2018, 222, 49–53. [Google Scholar] [CrossRef]
  34. Da Silva Oliveira, D.; Lemos Lobato, A.; Machado Rocha Ribeiro, S.; Campos Santana, A.M.; Paes Chaves, J.B.; Pinheiro-Sant’Ana, H.M. Carotenoids and vitamin C during handling and distribution of guava (Psidium guajava L.), mango (Mangifera indica L.), and papaya (Carica papaya L.) at commercial restaurants. J. Agric. Food Chem. 2010, 58, 6166–6172. [Google Scholar] [CrossRef]
  35. Ratti, C. Hot air and freeze drying of high value foods: A review. J. Food Eng. 2001, 49, 311–319. [Google Scholar] [CrossRef]
  36. Mastrocola, D.; Lerici, C. Colorimetric measurements of enzymatic and non-enzymatic browning in apples purees. Ital. J. Food Sci. 1991, 3, 219–229. [Google Scholar]
  37. Krokida, M.; Maroulis, Z. Structural properties of dehydrated products during rehydration. Int. J. Food Sci. Technol. 2001, 36, 529–538. [Google Scholar] [CrossRef]
  38. Que, F.; Mao, L.; Fang, X.; Wu, T. Comparison of hot air-drying and freeze-drying on the physicochemical properties and antioxidant activities of pumpkin (Cucurbita moschata Duch.) flours. Int. J. Food Sci. Technol. 2008, 43, 1195–1201. [Google Scholar] [CrossRef]
  39. Levi, G.; Karel, M. Volumetric shrinkage (collapse) in freeze-dried carbohydrates above their glass transition temperature. Food Res. Int. 1995, 28, 145–151. [Google Scholar] [CrossRef]
  40. Achanta, S.; Okos, M. Quality changes during drying of food polymers. Dry. Technol. Agric. Food Sci. 2000, 2, 133–147. [Google Scholar]
  41. McCook-Russell, K.P.; Nair, M.G.; Facey, P.C.; Bowen-Forbes, C.S. Nutritional and nutraceutical comparison of Jamaican Psidium cattleianum (strawberry guava) and Psidium guajava (common guava) fruits. Food Chem. 2012, 134, 1069–1073. [Google Scholar] [CrossRef]
  42. Nwaichi, E.O.; Chuku, L.C.; Oyibo, N.J. Profile of Ascorbic Acid, Beta-Carotene and Lycopene in Guava, Tomatoes, Honey and Red Wine. Int. J. Curr. Microbiol. App. Sci. 2015, 4, 39–43. [Google Scholar]
  43. Shi, J.; Dai, Y.; Kakuda, Y.; Mittal, G.; Xue, S.J. Effect of heating and exposure to light on the stability of lycopene in tomato pureé. Food Control 2008, 19, 514–520. [Google Scholar] [CrossRef]
  44. Lim, Y.; Lim, T.; Tee, J. Antioxidant properties of several tropical fruits: A comparative study. Food Chem. 2007, 103, 1003–1008. [Google Scholar] [CrossRef]
Figure 1. Acrylic mold for the preparation of slices of guava pure.
Processes 08 00106 g001
Figure 2. Refractance window equipment for drying guava slices.
Processes 08 00106 g002
Figure 3. Drying curves of guava samples using convective drying (CD), freeze drying (FD) and refractance window drying (RW).
Processes 08 00106 g003
Figure 4. Effect of the drying method (CD, FD and RW) on the water activity of guava samples.
Processes 08 00106 g004
Figure 5. Total color change of guava samples using different drying methods (CD, FD and RW).
Processes 08 00106 g005
Table 1. Changes in physical properties of guava samples dried by CD, FD and RW to moisture values of 0.040 ± 0.002 g water/g db.
MethodTime (Min)AwColorΔV (%)ε (%)
ΔL*Δa*Δb*ΔE*
CD240 a0.421 a5.39a3.54 a12.89 a18.78 a81.34 a5.89 a
FD107 b0.420 a21.57b−1.67 b1.49 b24.40 b22.75 b73.41 b
RW76 c0.431 a8.75c2.74 c11.55 a8.46 c42.31 c19.00 c
Different superscripts letters in same column indicate significantly difference between different treatments (p < 0.05).
Table 2. Carotene content in guava pulp dried by the CD, FD and RW methods. Different letters indicate significantly difference between different treatments (p < 0.05).
SampleDry MatterBeta-CaroteneLycopeneTotal Carotene
(450 nm)
%µg/g (db)SDµg/g (db)SDµg/g (db)SD
Fresh11.958.45 a0.3086.73 a5.0195.24 a4.64
CD88.108.67 a0.6561.83 b5.8673.14 b6.75
FD89.5010.67 b0.5052.89 c1.4467.67 b2.48
RW86.958.09 a0.7961.08 b1.9972.04 b2.53
Table 3. Loss of vitamin C from guava pulp dried by the CD, FD and RW methods. Different letters indicate significantly difference between different treatments (p < 0.05).
Vitamin C Content
(mg/100 g Dry Sample)
Loss of Vitamin C (%)
Fresh664.21 ± 1.0
CD51.17 ± 0.8092.30 ± 0.12 a
FD251.55 ± 0.1662.13 ± 0.02 b
RW202.15 ± 1.4269.57 ± 0.21 b

