Multi-Attribute Decision-Making: Applying a Modified Brown–Gibson Model and RETScreen Software to the Optimal Location Process of Utility-Scale Photovoltaic Plants


Abstract
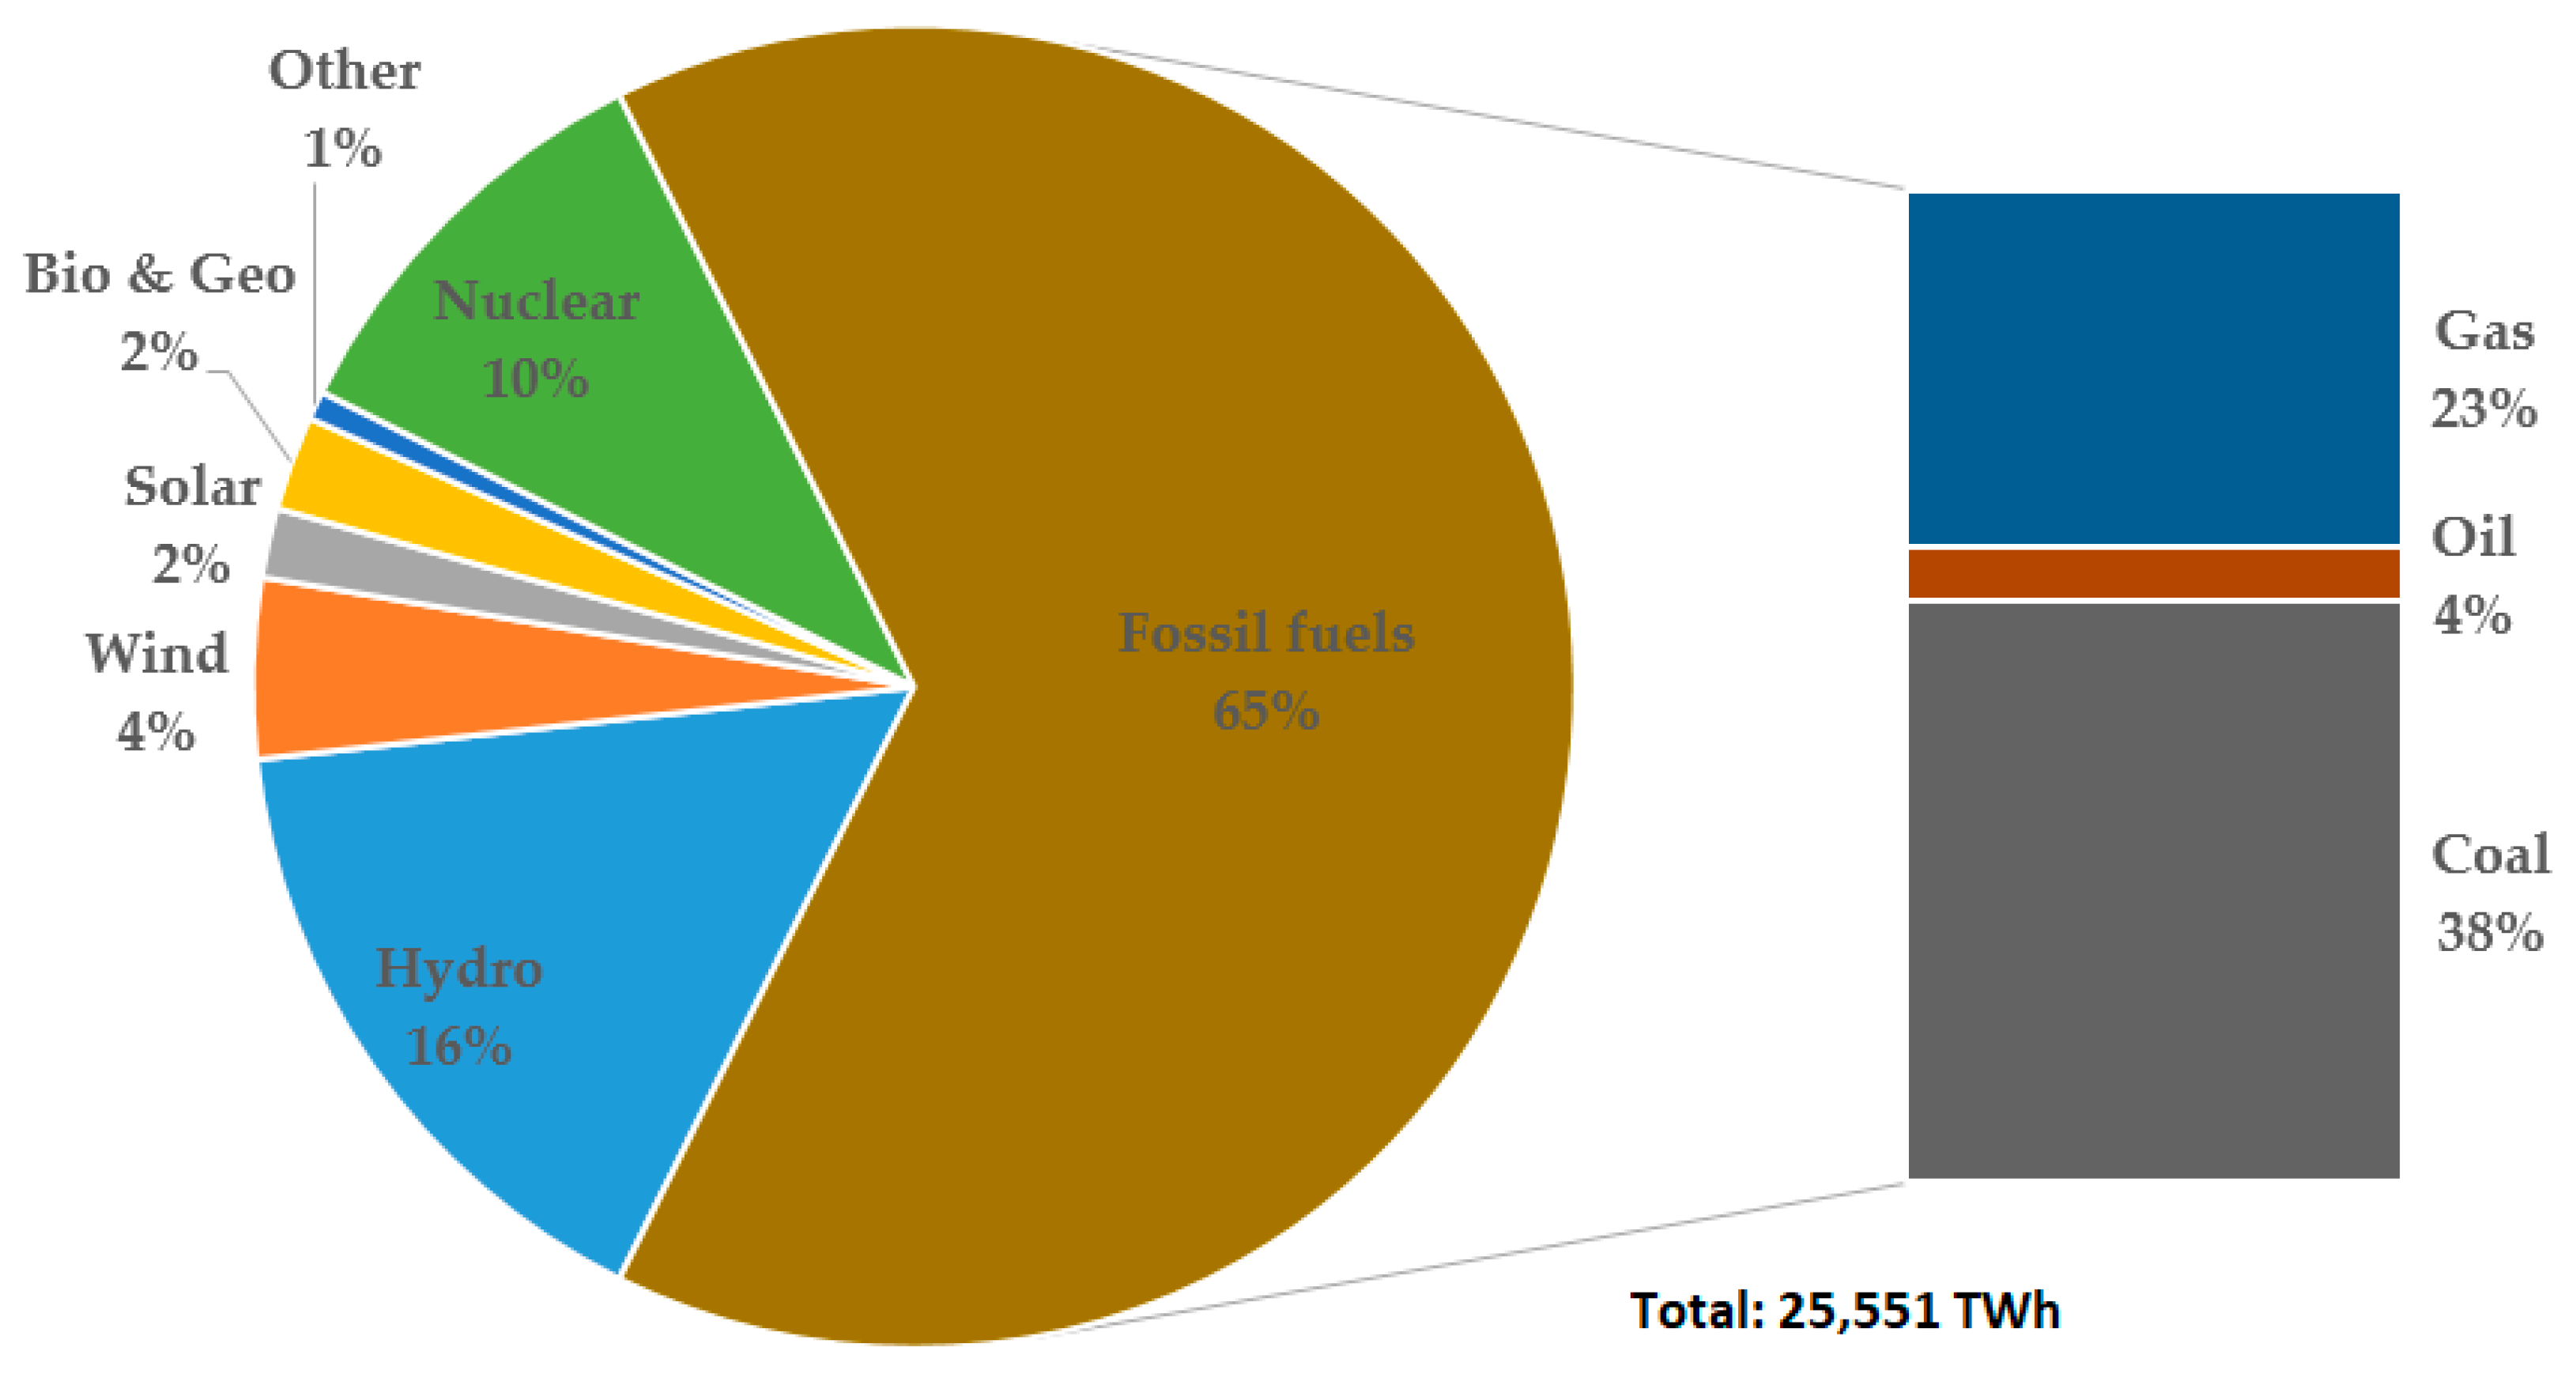
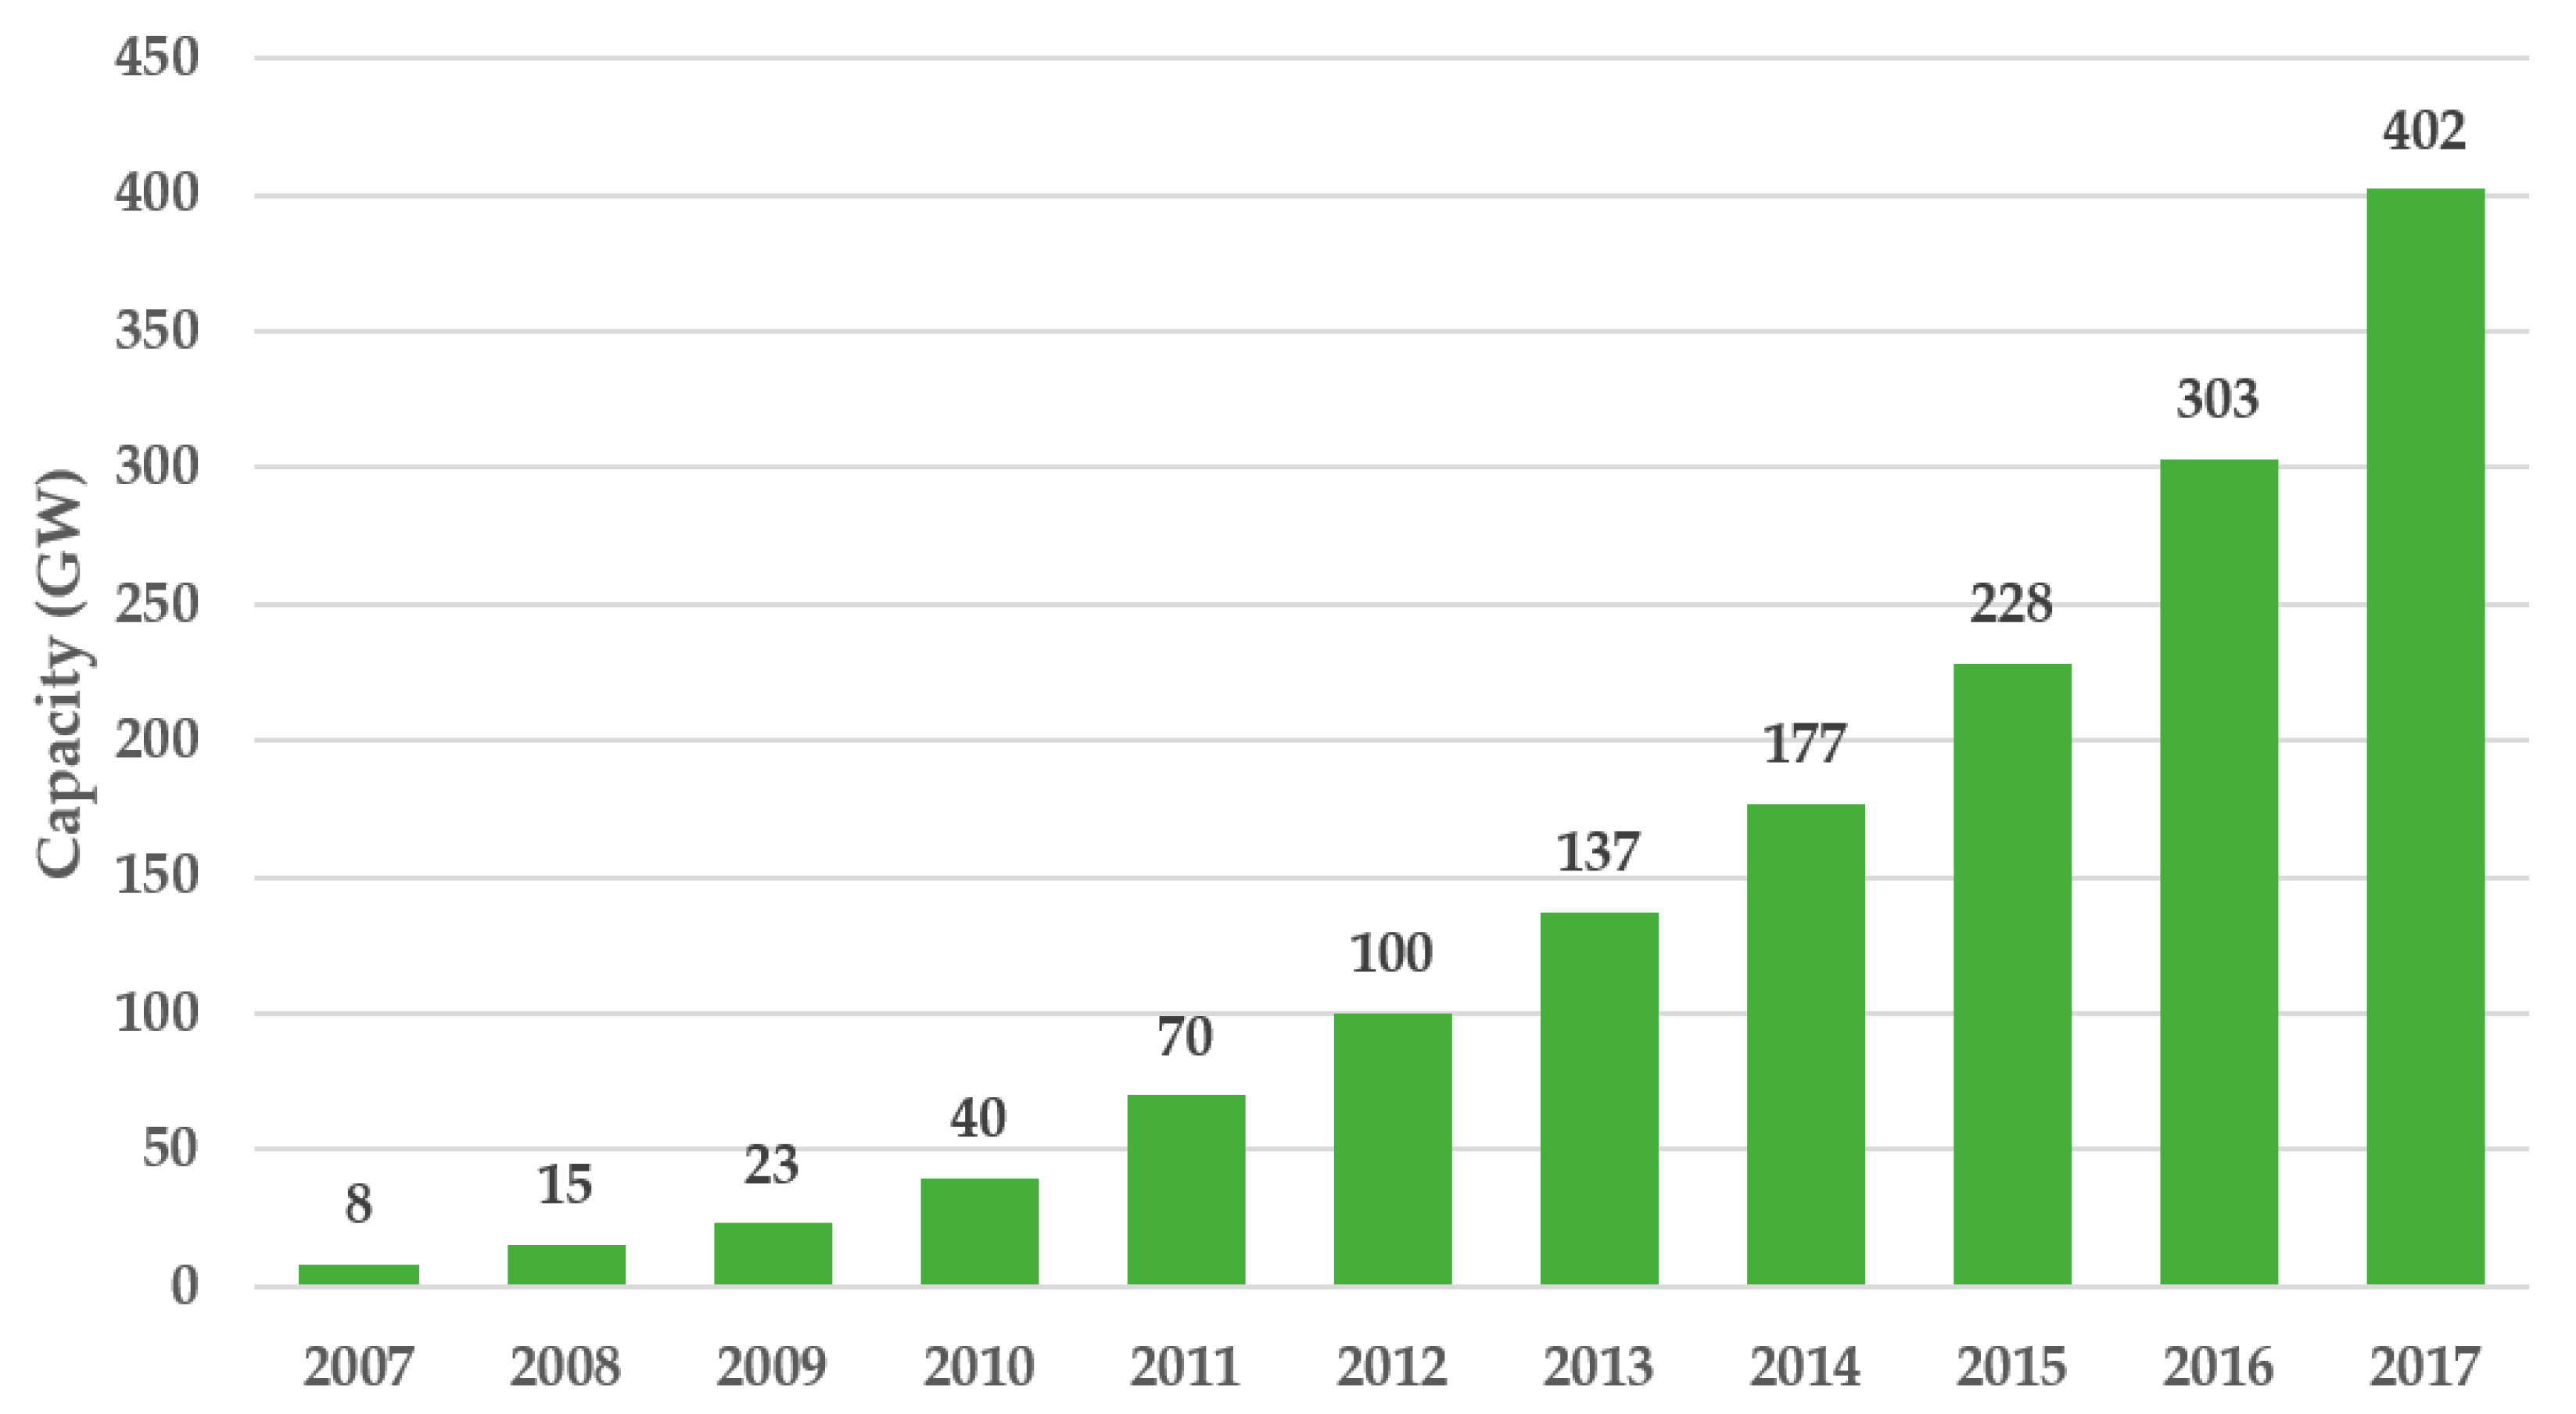
:1. Introduction
2. Materials and Methods
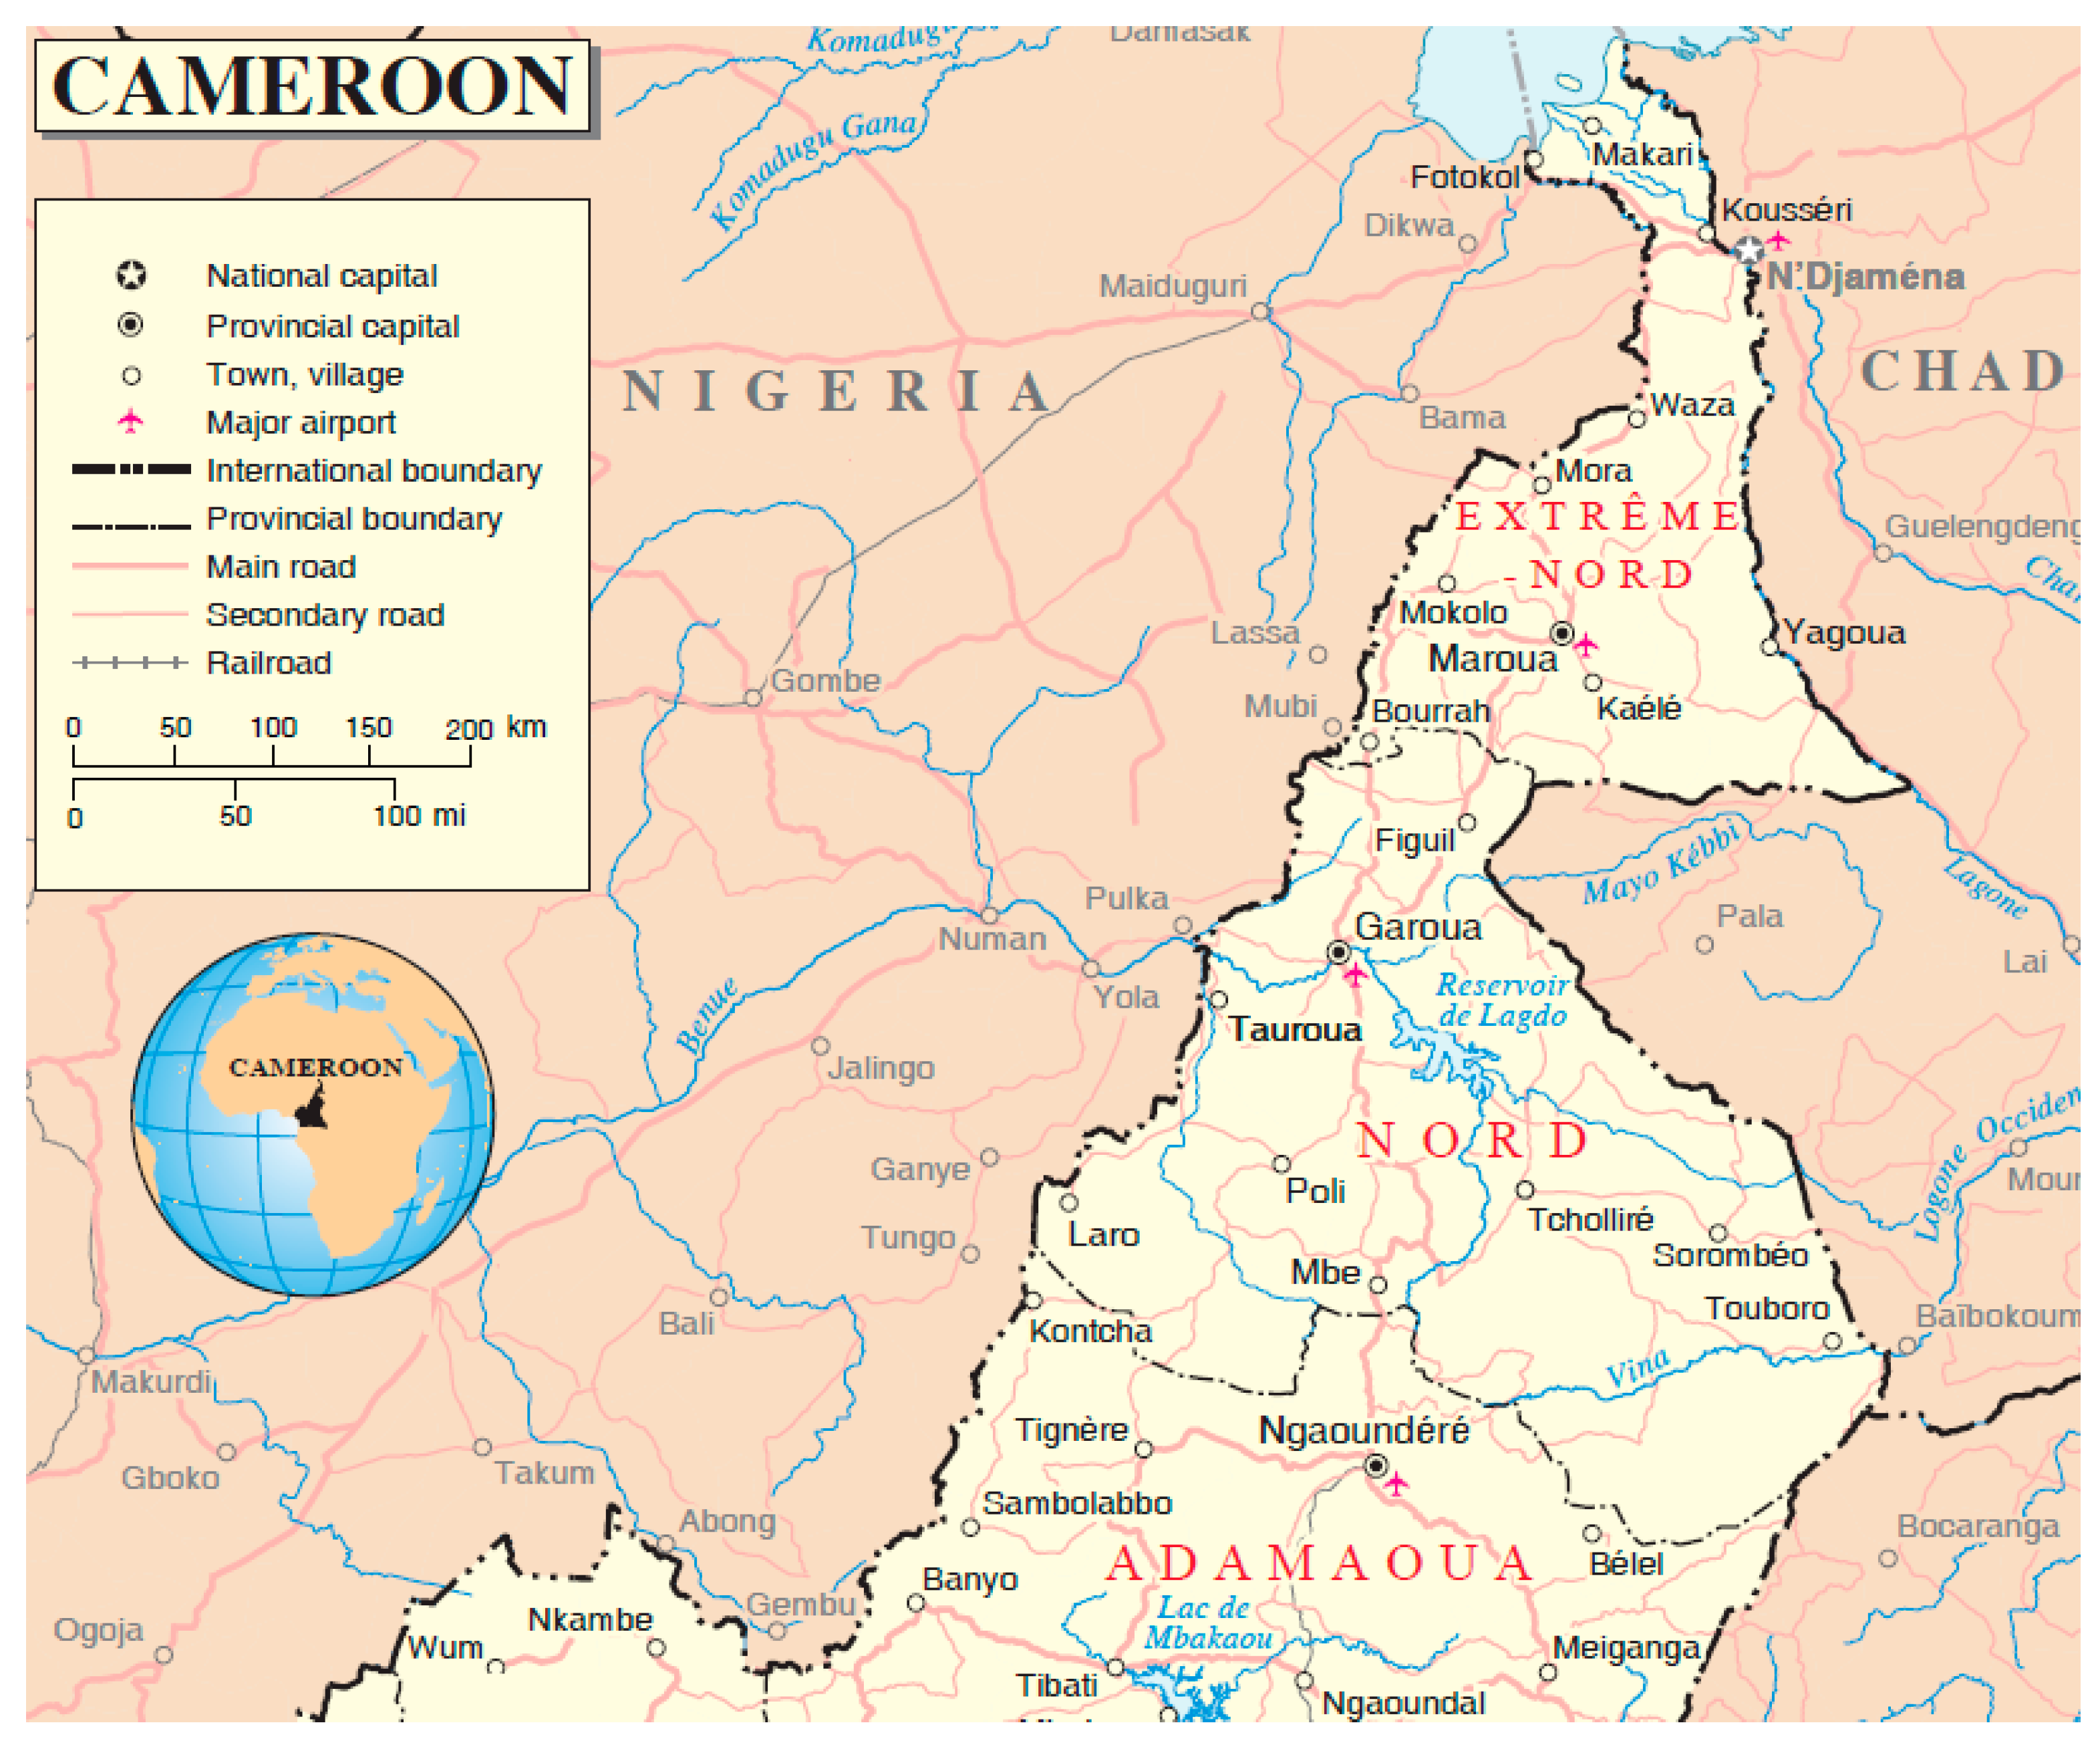
2.1. The Area of the Study and Selected Alternative Sites
2.2. PV System Configuration and Specifications
2.3. RETScreen Analysis
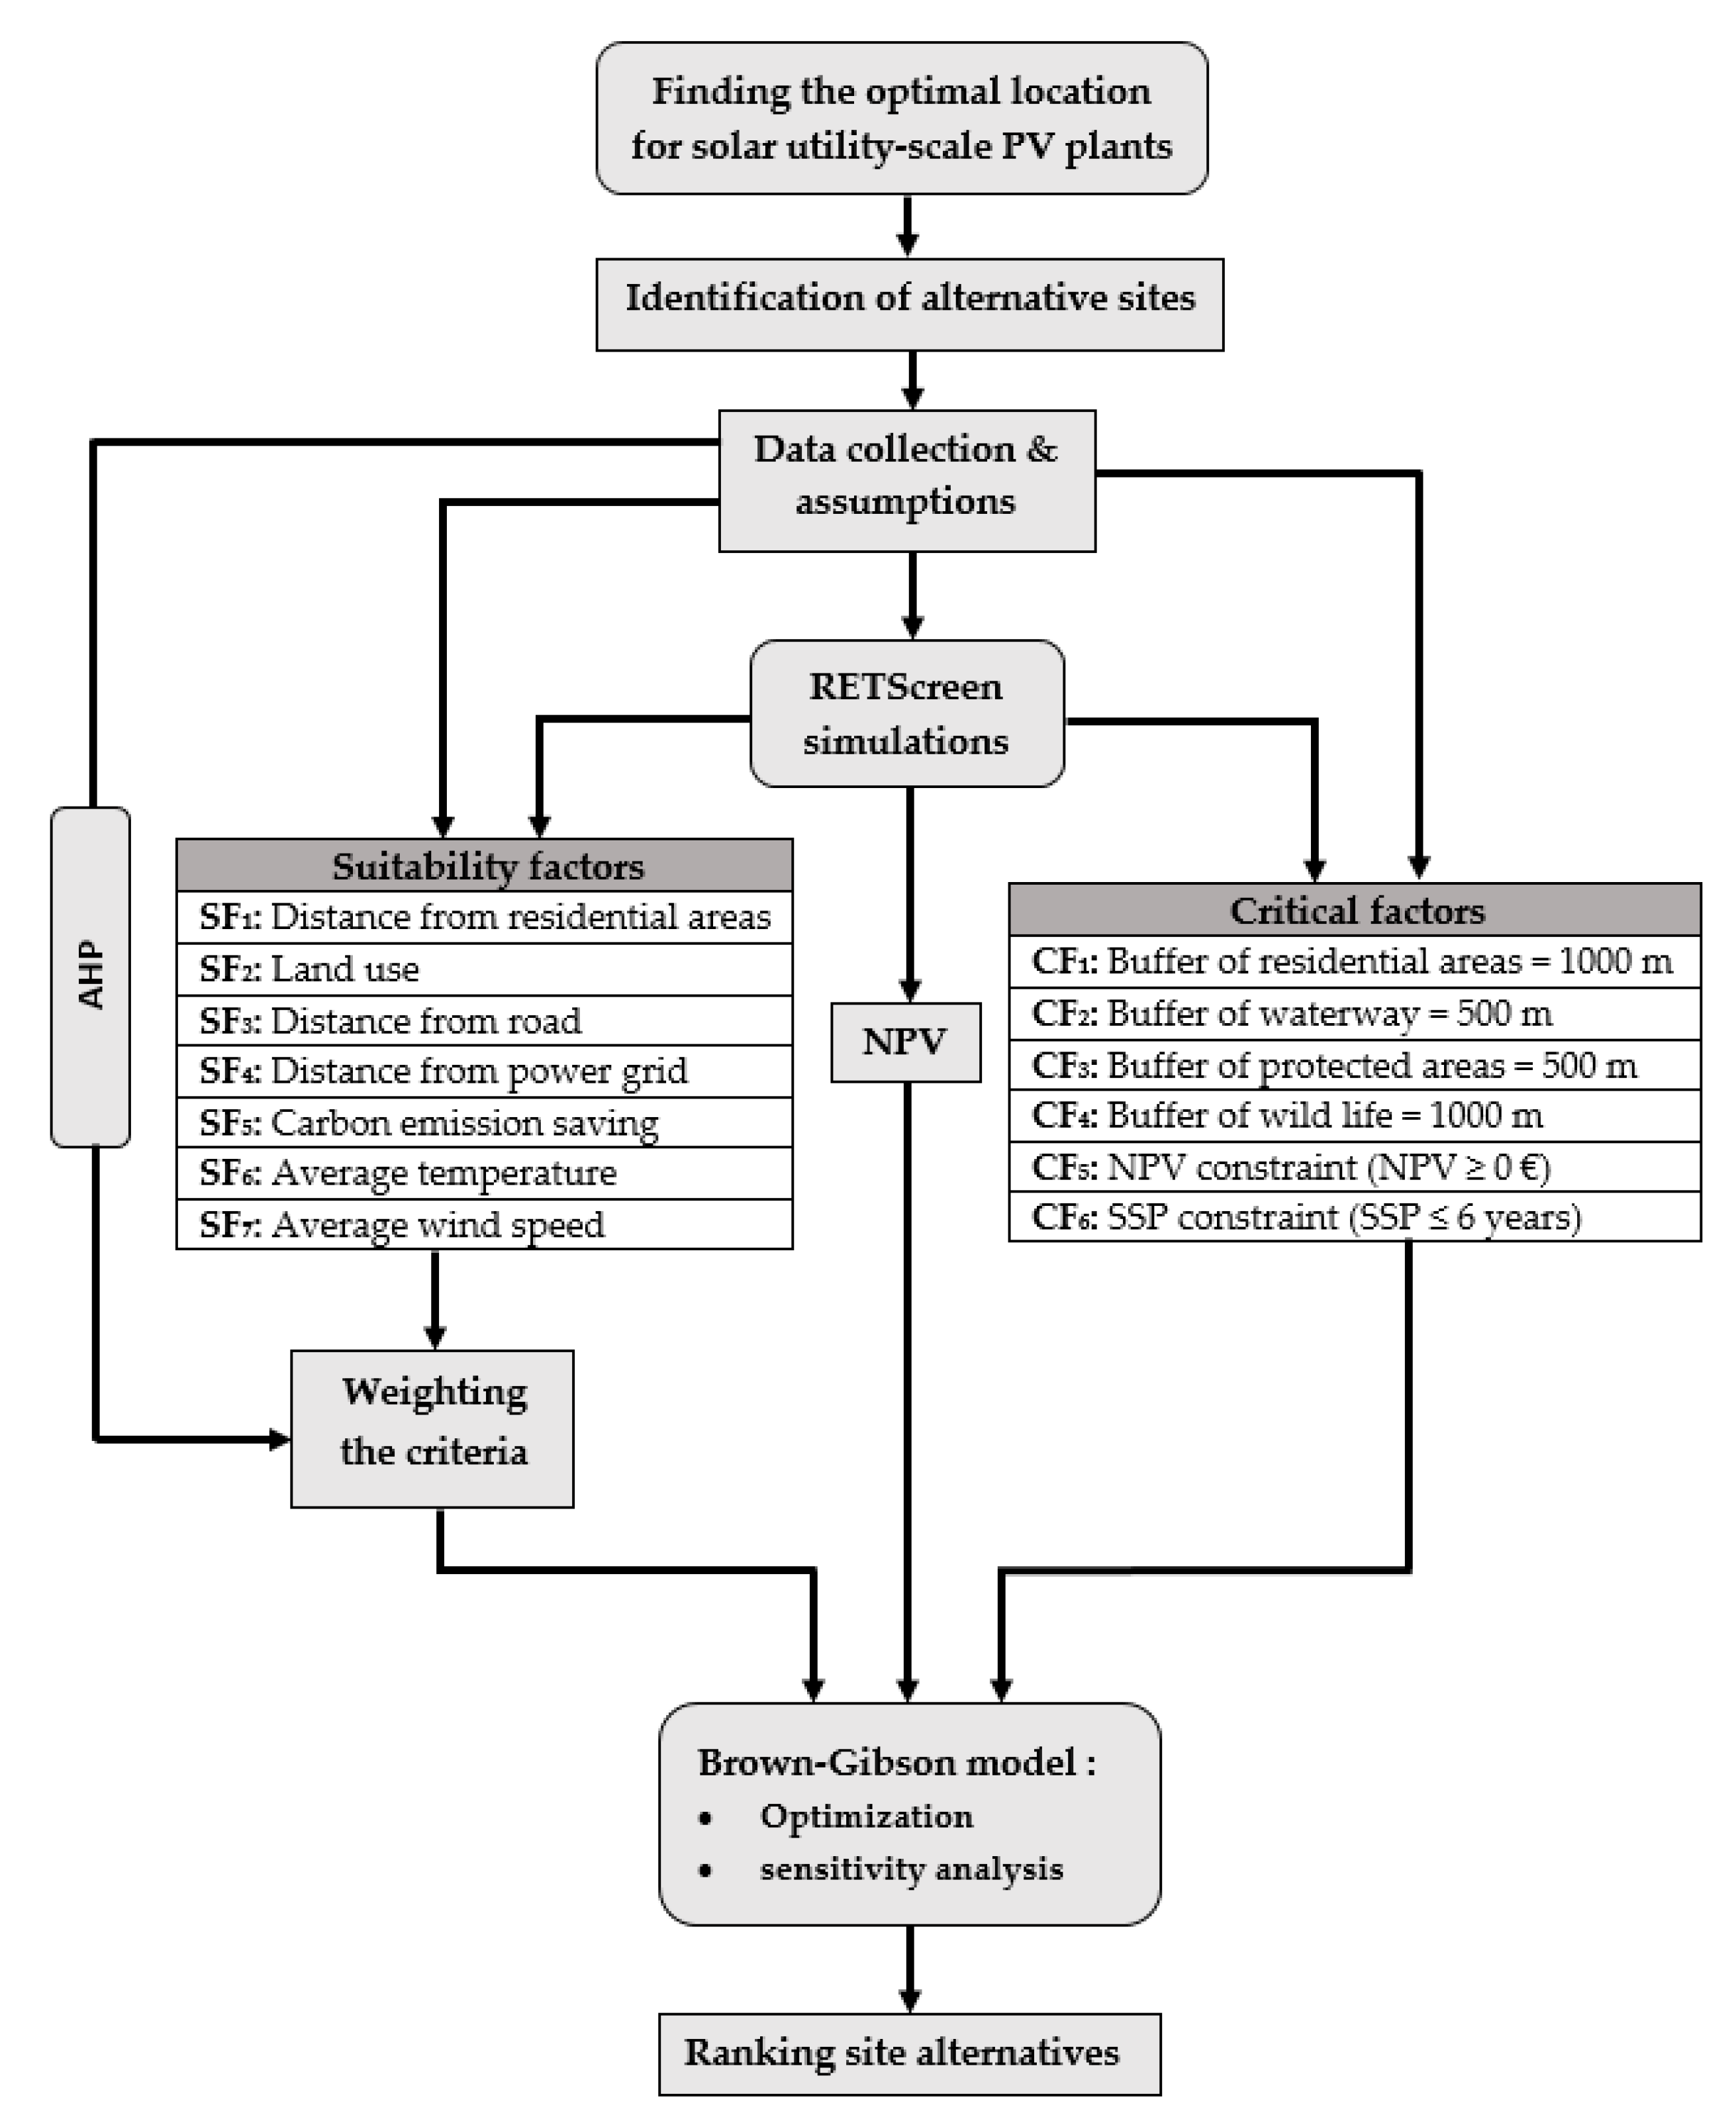
2.4. Brown–Gibson Model
2.4.1. The Original Model
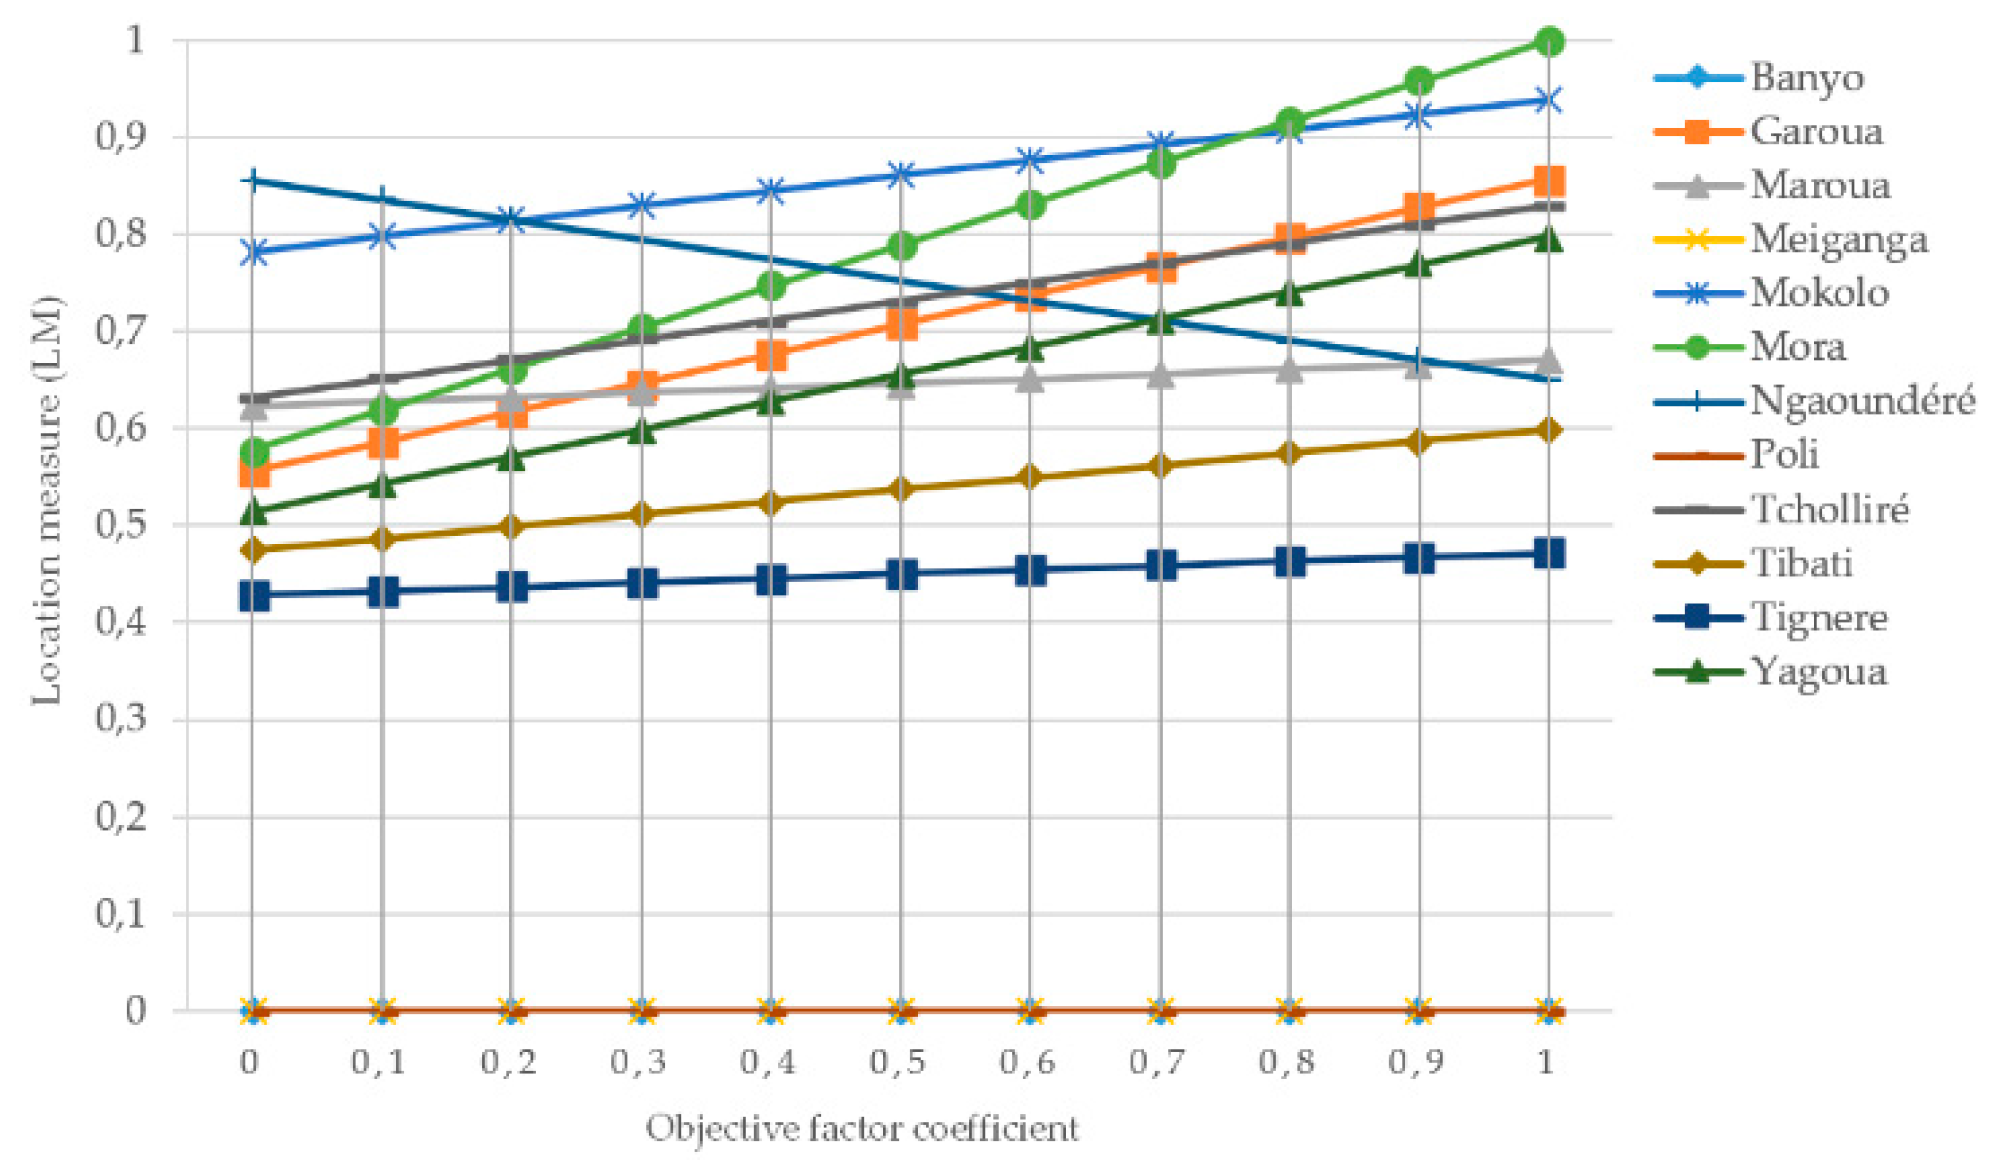
- α is the objective factor decision weight. It should be between 0 and 1.
- The best location for setting the plant is the one with the highest location measure (LM).
2.4.2. Modified Brown–Gibson Model for Utility-Scale PV Plants
- Net Present Value (NPV)
- Critical factors
- CF1: Buffer of residential areas = 1000 m
- CF2: Buffer of waterway = 500 m
- CF3: Buffer of protected areas = 500 m
- CF4: Buffer of wildlife = 1000 m
- CF5: NPV constraint (NPV ≥ 0€) (From RETScreen)
- CF6: SPP constraint (SPP ≤ 6 years) (From RETScreen)
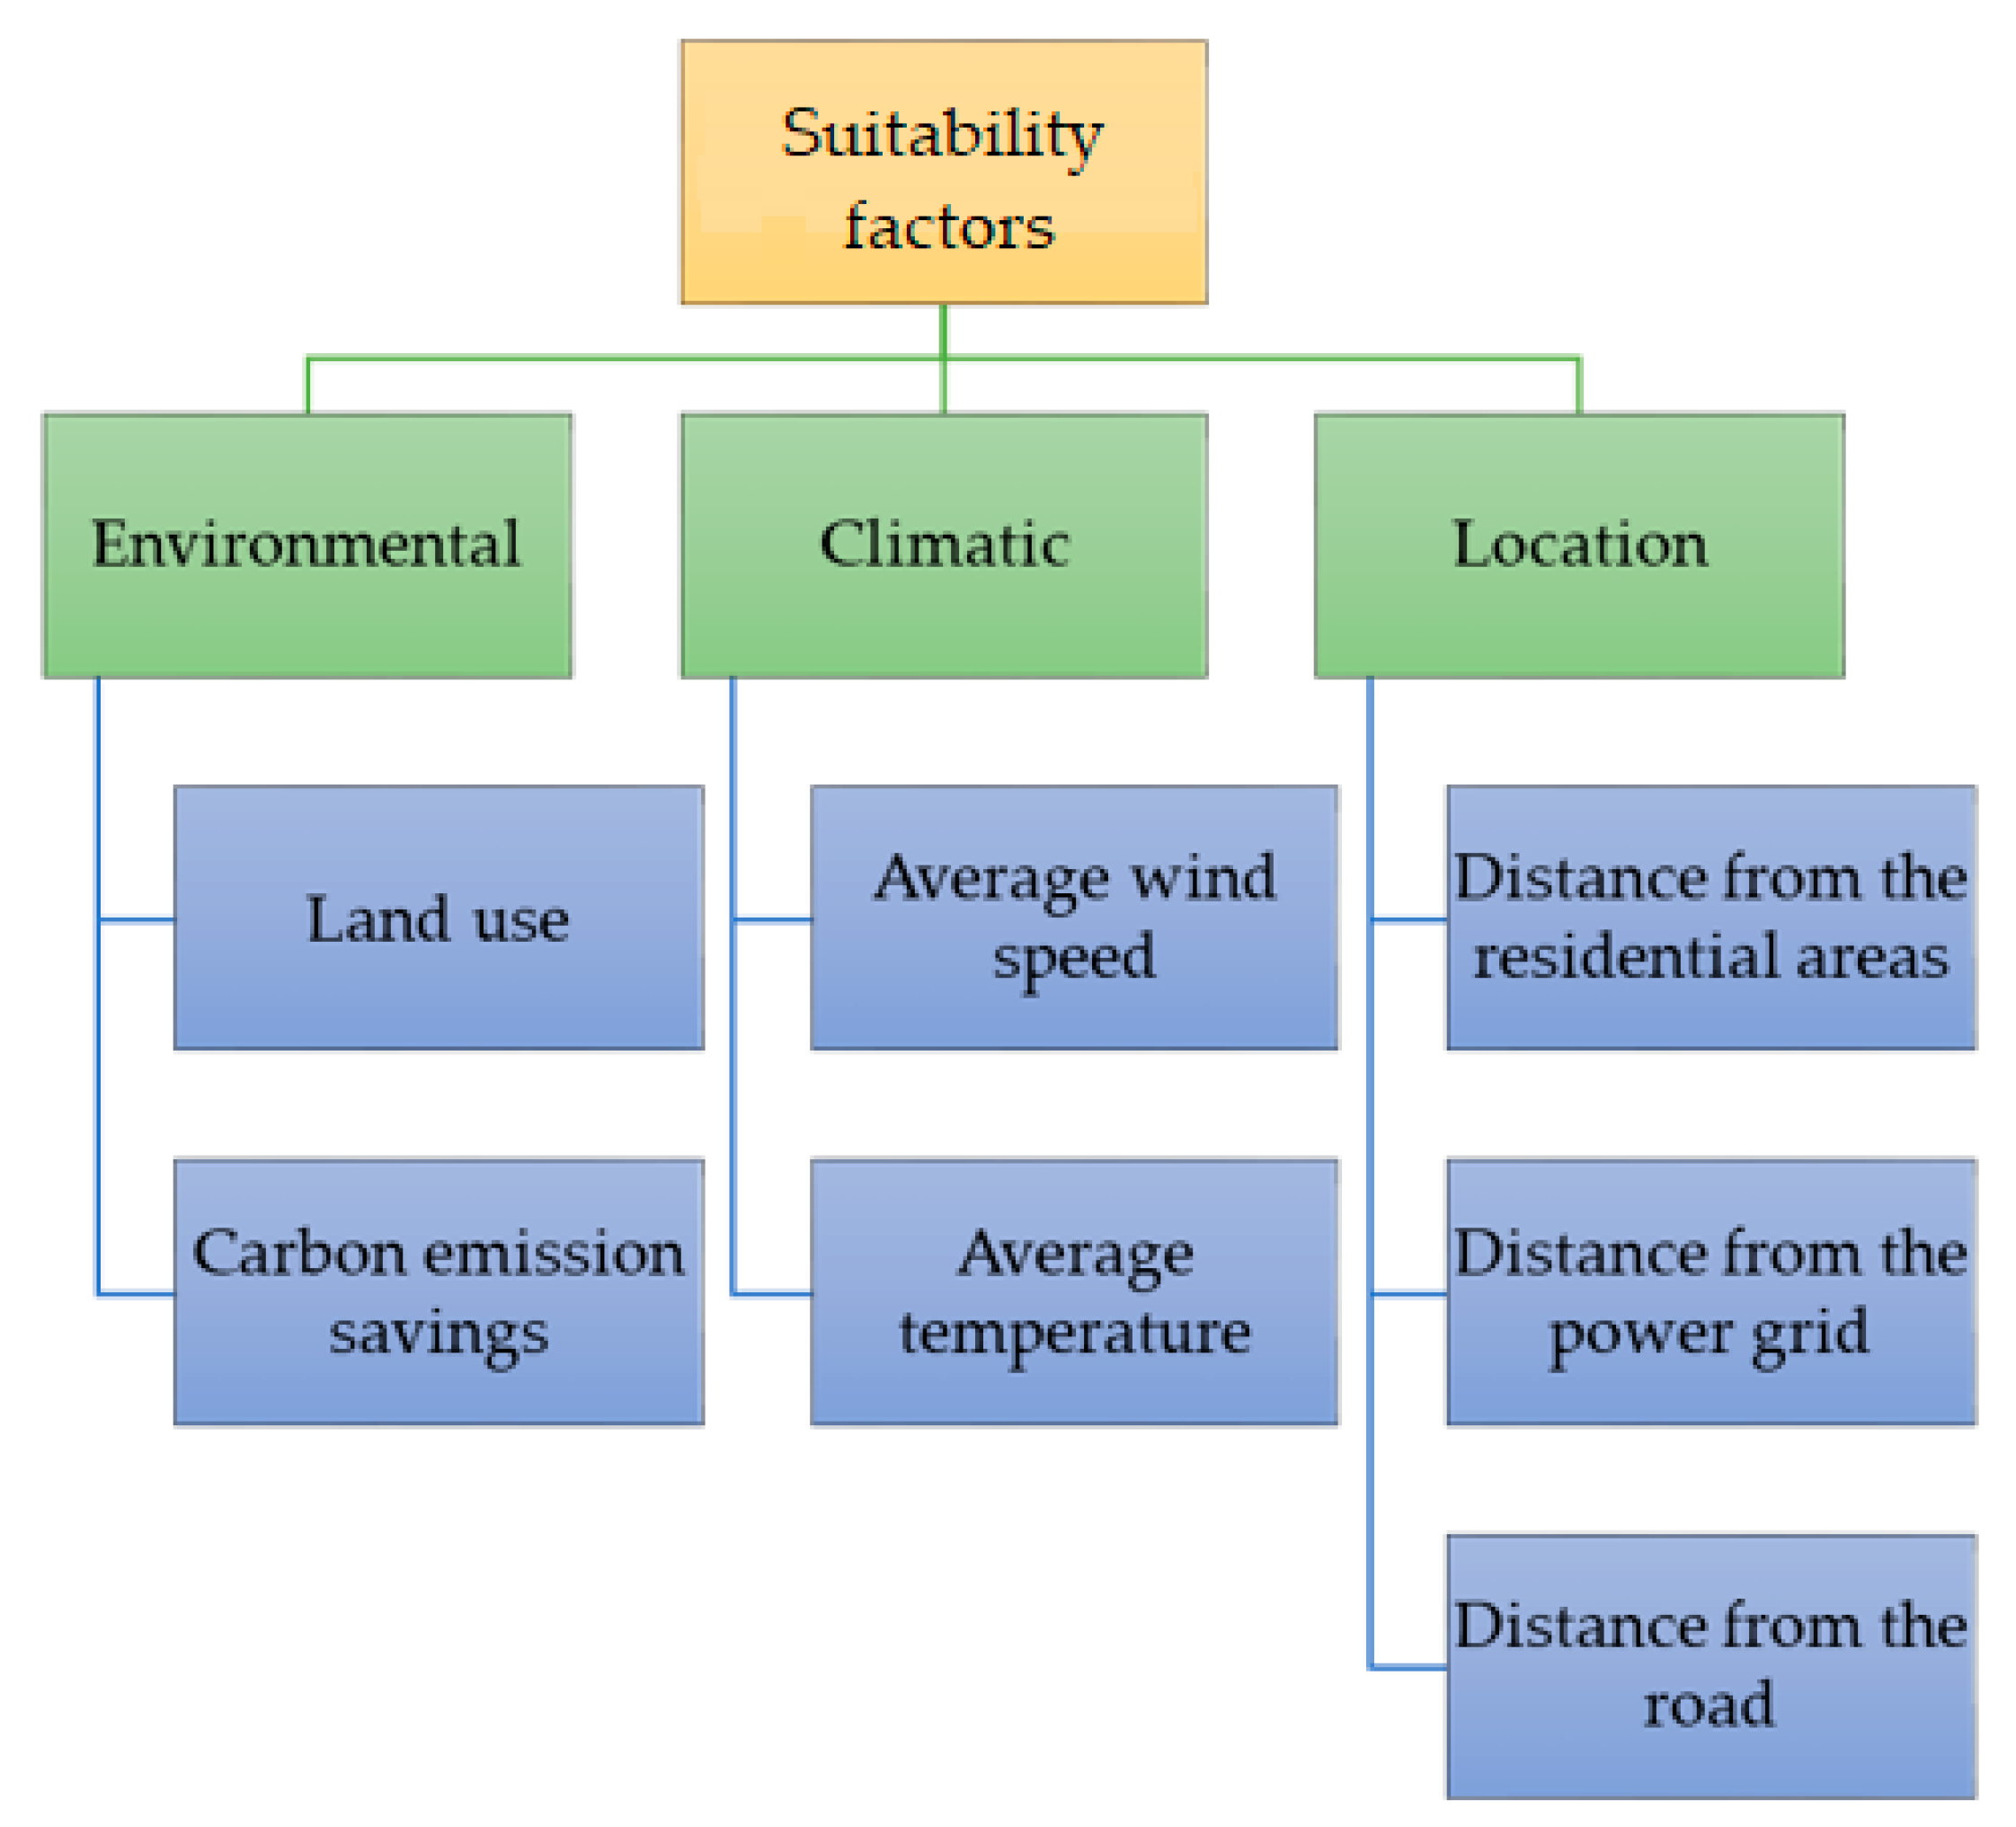
- Suitability factors
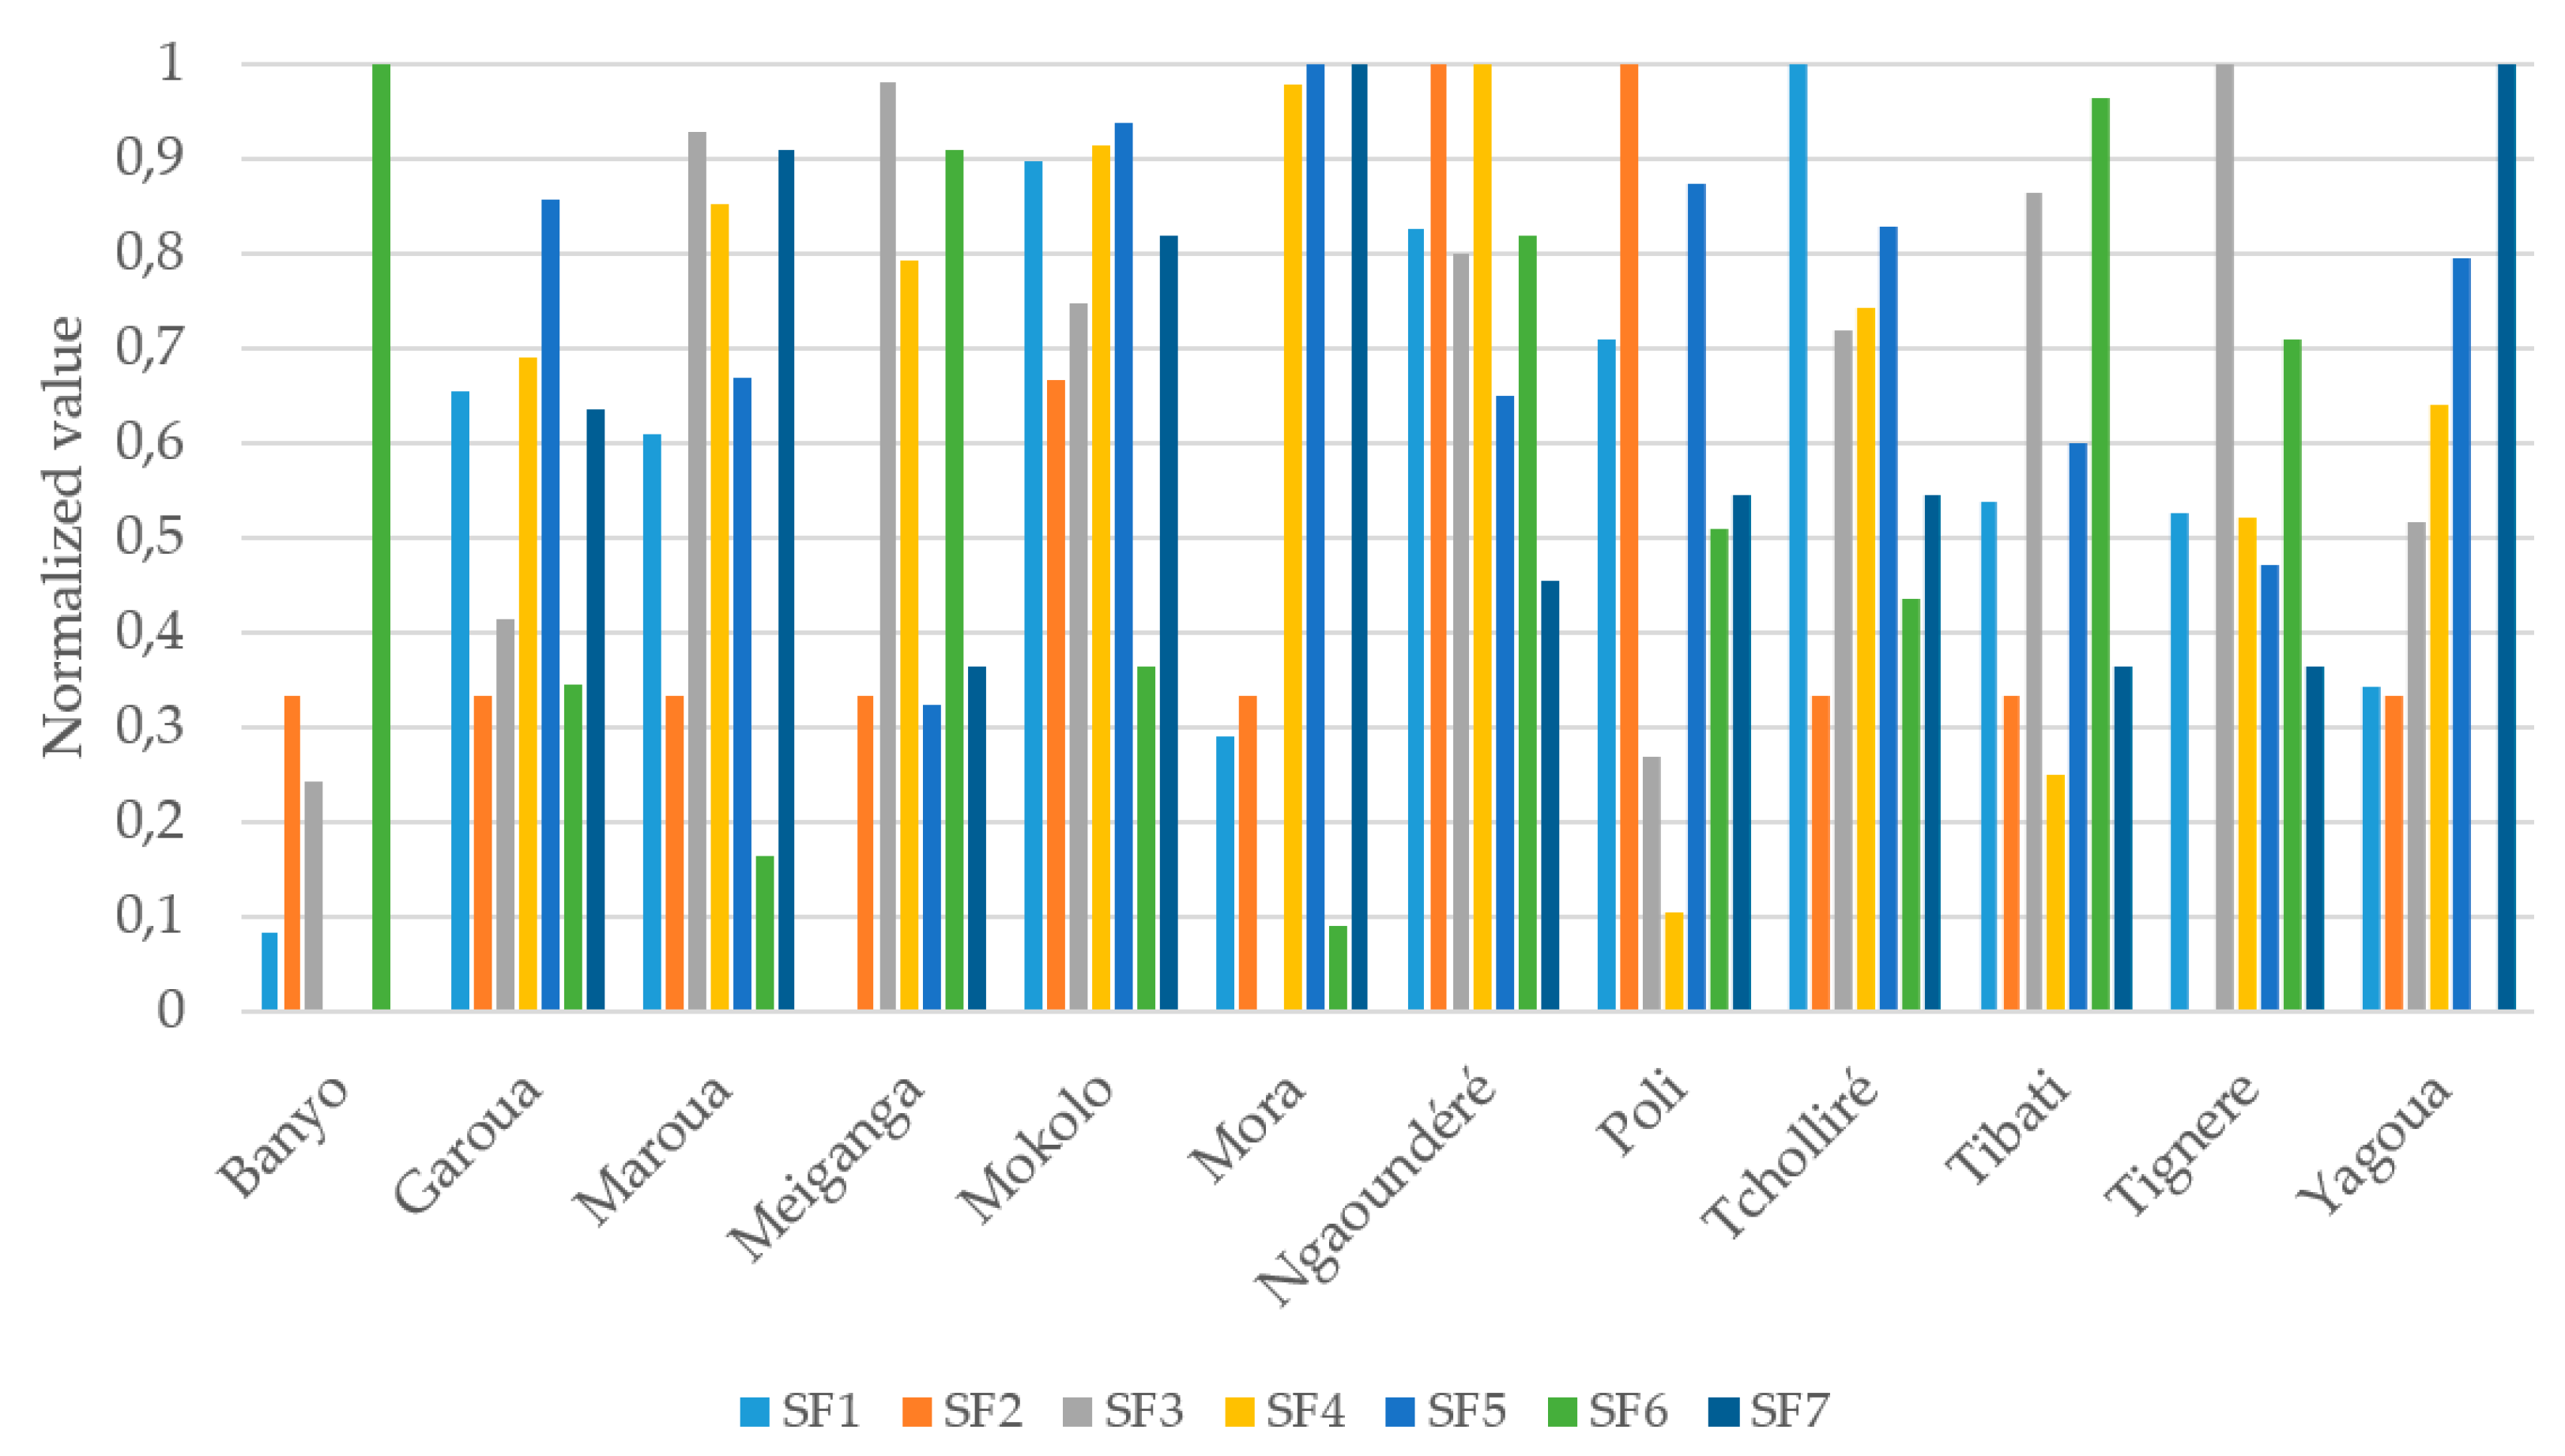
- SF1: Distance from residential areas
- SF2: Land use (= 1 for forest, 2 for cultivated land, 3 for pasture, and 4 for bare land/desert)
- SF3: Distance from road
- SF4: Distance from the power grid
- SF5: Carbon emission saving (From RETScreen)
- SF6: Annual average temperature
- SF7: Annual average wind speed
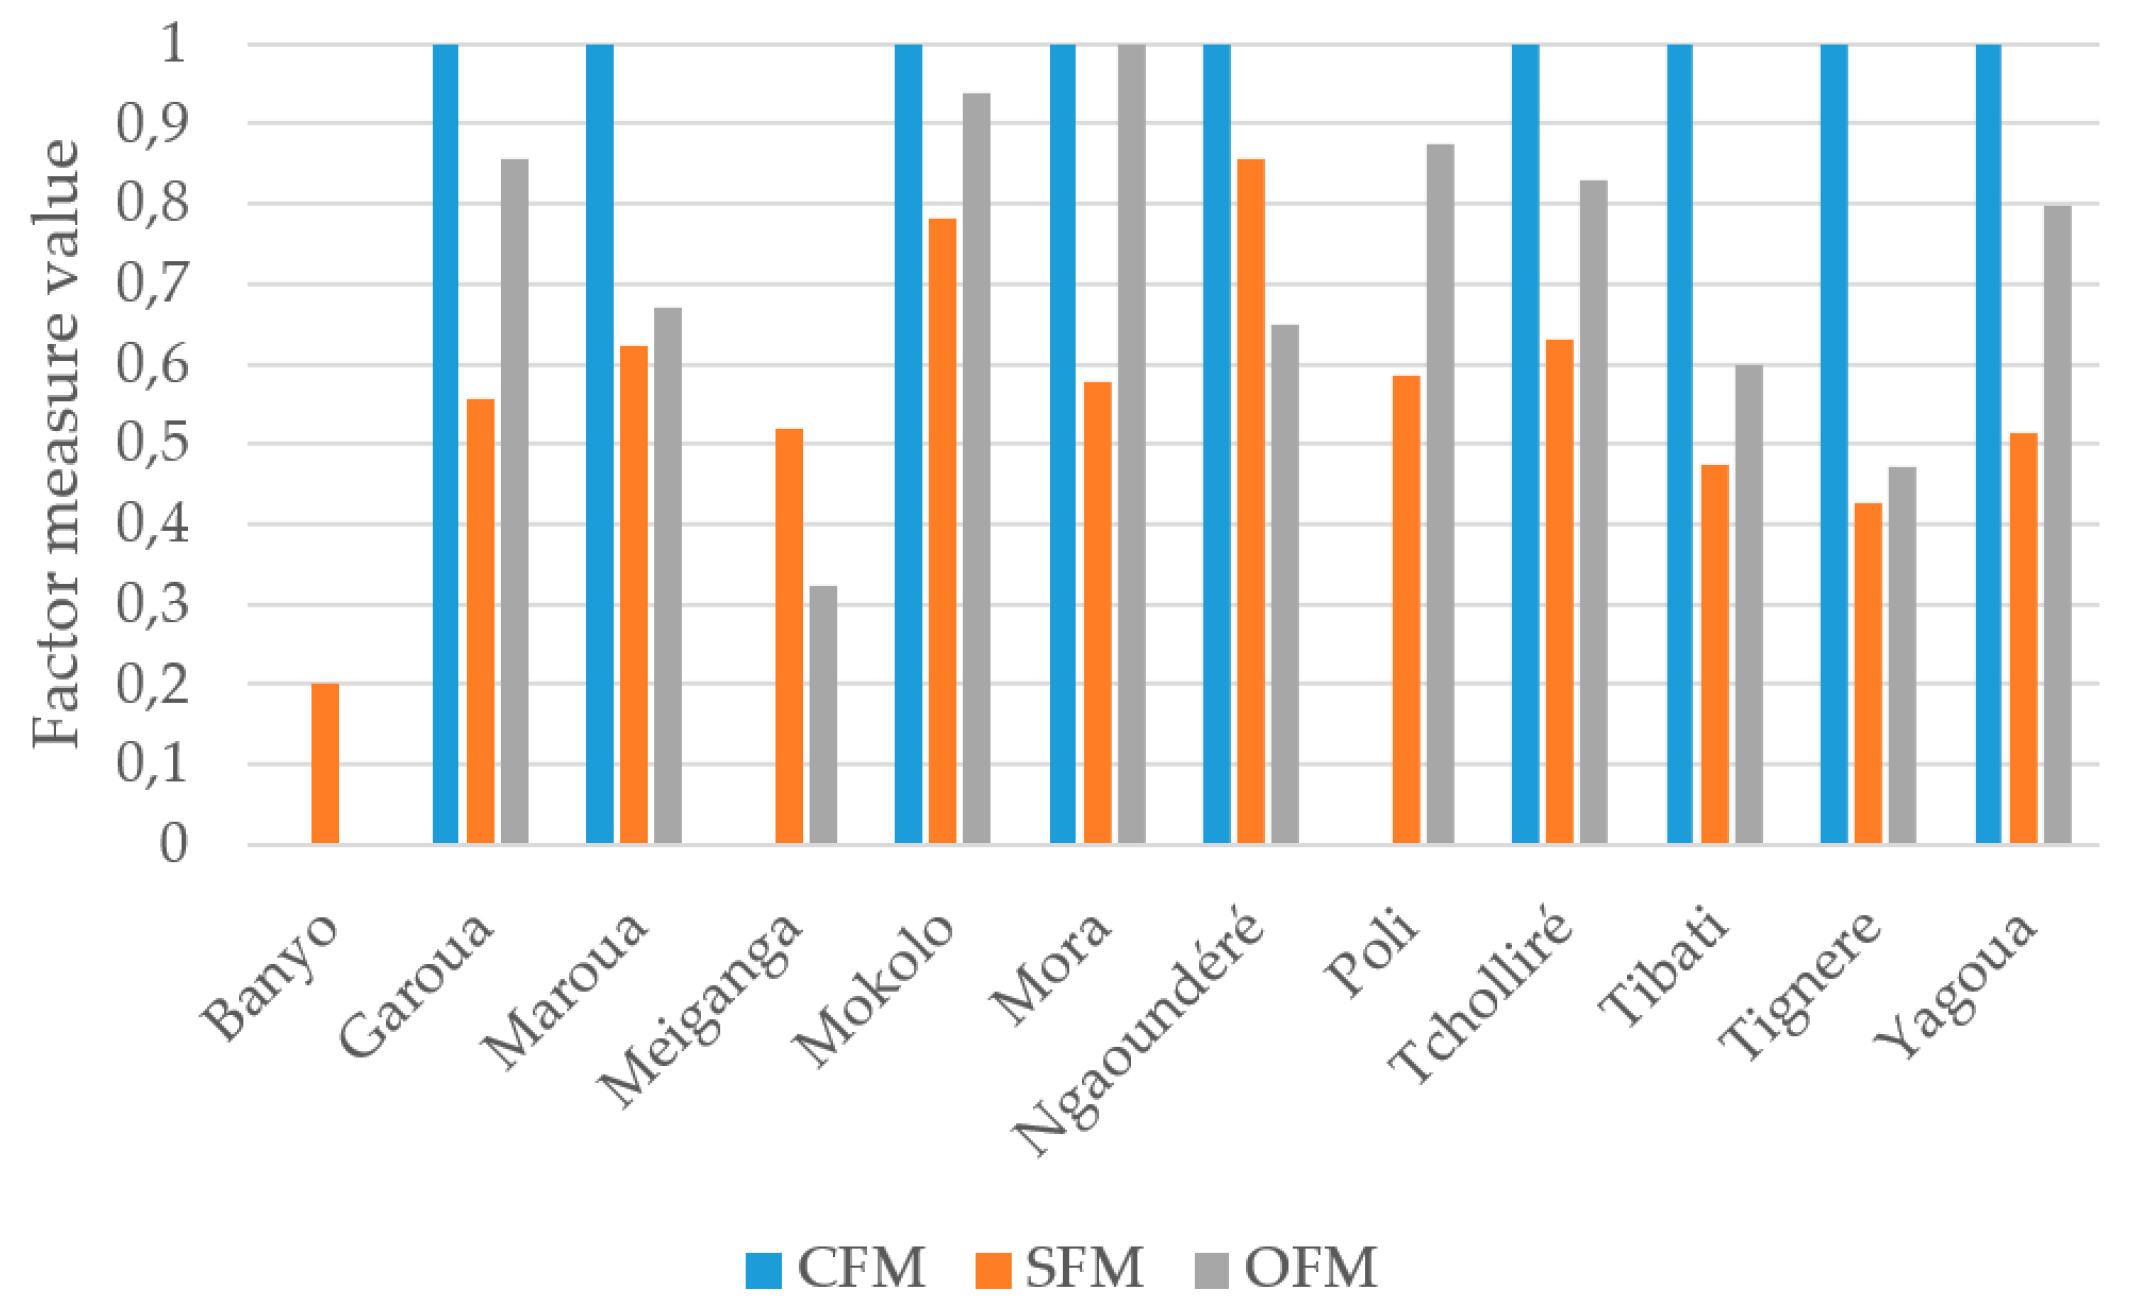
- Considering the selected criteria above and the Equations (1), (2), (4) and (6), the following location model for utility-scale photovoltaic systems was obtained:where
- LMi = location measure of site i,
- CFIij = critical factor index of the critical factor CFj at location i,
- SFij = 0–1 scale, normalized value of the suitability factor SFj at location i,
- NPVi = Net present value of the PV project at location i,
- α = the objective factor decision weight. The value of α for this study was 0.6.
- The normalized values SFij were obtained from the values of suitability factors using the following normalization formulas [49]:for criteria of maximum,for criteria of minimum.
- The suitability factor weights were determined using the Analytic Hierarchy Process (AHP). The details about the calculation are given in the next section.
- The coefficient of variation (CV) was used to compare the LM and NPV parameters in site differentiation. The CV is the ratio of the standard deviation to the mean [50].
2.5. AHP (Analytic Hierarchy Process)
- Divide each entry of column i by the sum of entries in column i to form Anorm
- Obtain wi as the mean of the entries in row i of Anorm.
2.6. Sensitivity Analysis
3. Results and Discussion
4. Conclusions
Author Contributions
Funding
Conflicts of Interest
Appendix A

| Acronyms | Meaning |
|---|---|
| AC | Alternating Current |
| ADSR | Average Daily Solar Radiation |
| AHP | Analytic Hierarchy Process |
| AYT | Average Yearly Temperature |
| AYWS | Average Yearly Wind Speed |
| BCR | Benefit-Cost Ratio |
| CF | Critical Factor |
| CFI | Critical Factor Index |
| CFM | Critical Factor Measure |
| CI | Consistency index |
| CR | Consistency Ratio |
| DC | Direct Current |
| DPA | Distance from Protected Areas |
| DPG | Distance from the Power Grid |
| DR | Distance from the Road |
| DAR | Distance from Residential Areas |
| DWL | Distance from Wildlife |
| GHGs | Greenhouse Gases |
| GSR | Global Solar Radiation Levels |
| IEA | International Energy Agency |
| IRR | Internal Rate of Return |
| LM | Location Measure |
| LU | Land Use |
| MCDM | Multi-Criteria Decision-Making |
| NIG | Northern Interconnected Grid |
| NREL | US National Renewable Energy Laboratory |
| OF | Objective Factor |
| PV | Photovoltaic |
| RI | Random Index |
| RESs | Renewable Energy Sources |
| RETs | Renewable Energy Technologies |
| SF | Suitability Factor |
| SFM | Suitability Factor Measure |
| SPP | Simple Payback Period |
| SSE | Surface meteorology and Solar Energy |
| TVM | Time Value of Money |
References
- Karanfil, F.; Li, Y. Electricity consumption and economic growth: Exploring panel-specific differences. Energy Policy 2015, 82, 264–277. [Google Scholar] [CrossRef]
- IEA. Global Energy & CO2 Status Report 2017; IEA: Paris, France, 2018. [Google Scholar]
- Abas, N.; Kalair, A.; Khan, N. Review of fossil fuels and future energy technologies. Futures 2015, 69, 31–49. [Google Scholar] [CrossRef]
- Pachauri, R.K.; Allen, M.R.; Barros, V.R.; Broome, J.; Cramer, W.; Christ, R.; Church, J.A.; Clarke, L.; Dahe, Q.; Dasgupta, P. Climate Change 2014: Synthesis Report. Contribution of Working Groups I, II and III to the Fifth Assessment Report of the Intergovernmental Panel on Climate Change; IPCC: Geneva, Switzerland, 2014; ISBN 92-9169-143-7. [Google Scholar]
- REN21, Renewables. Global Status Report; Technical Report; REN21 Secretariat: Paris, France, 2017. [Google Scholar]
- International Energy Agency (IEA). Key World Energy Statistics; IEA: Paris, France, 2015. [Google Scholar]
- IRENA. Renewable Capacity Statistics; The International Renewable Energy Agency: Abu Dhabi, UAE, 2017. [Google Scholar]
- Global Solar Atlas. Maps of Global Horizontal Irradiation (GHI), GeoModel Solar Sro Bratislava Slovakia; Infodocfree-Sol.-Radiat.-Maps-GHI; World Bank Group: Washington, DC, USA, 2016. [Google Scholar]
- Hermann, S.; Miketa, A.; Fichaux, N. Estimating the Renewable Energy Potential in Africa: A GIS-Based Approach; IRENA Secretariat: Abu Dhabi, UAE, 2014. [Google Scholar]
- International Energy Agency (IEA). Available online: http://energyatlas.iea.org/#!/tellmap/-1118783123/1 (accessed on 29 December 2018).
- Yimen, N.; Hamandjoda, O.; Meva’A, L.; Ndzana, B.; Nganhou, J. Analyzing of a Photovoltaic/Wind/Biogas/Pumped-Hydro Off-Grid Hybrid System for Rural Electrification in Sub-Saharan Africa—Case study of Djoundé in Northern Cameroon. Energies 2018, 11, 2644. [Google Scholar] [CrossRef]
- Muh, E.; Amara, S.; Tabet, F. Sustainable energy policies in Cameroon: A holistic overview. Renew. Sustain. Energy Rev. 2018, 82, 3420–3429. [Google Scholar] [CrossRef]
- Diboma, B.; Tatietse, T.T. Power interruption costs to industries in Cameroon. Energy Policy 2013, 62, 582–592. [Google Scholar] [CrossRef]
- Lalwani, M.; Kothari, D.; Singh, M. Investigation of solar photovoltaic simulation softwares. Int. J. Appl. Eng. Res. 2010, 1, 585–601. [Google Scholar]
- Abhishek, K.; Kumar, M.K.; Ali, R.M.; Rao, M.R.S.; Reddy, S.S.; Kiran, B.R.; Neelamegam, P. Analysis of Software Tools for Renewable Energy Systems. In Proceedings of the 2018 International Conference on Computation of Power, Energy, Information and Communication (ICCPEIC), Chennai, India, 28–29 March 2018; pp. 179–185. [Google Scholar]
- Sharma, D.K.; Verma, V.; Singh, A.P. Review and analysis of solar photovoltaic softwares. Int. J. Curr. Eng. Technol. 2014, 4, 725–731. [Google Scholar]
- Bustos, F.; Toledo, A.; Contreras, J.; Fuentes, A. Sensitivity analysis of a photovoltaic solar plant in Chile. Renew. Energy 2016, 87, 145–153. [Google Scholar] [CrossRef]
- Jain, A.; Mehta, R.; Mittal, S.K. Modeling Impact of Solar Radiation on Site Selection for Solar PV Power Plants in India. Int. J. Green Energy 2011, 8, 486–498. [Google Scholar] [CrossRef]
- Asumadu-Sarkodie, S.; Owusu, P.A. The potential and economic viability of solar photovoltaic power in Ghana. Energy Sources Part A Recovery Util. Environ. Eff. 2016, 38, 709–716. [Google Scholar] [CrossRef]
- Samu, R.; Fahrioglu, M. An analysis on the potential of solar photovoltaic power. Energy Sources Part B Econ. Plan. Policy 2017, 12, 883–889. [Google Scholar] [CrossRef]
- El-Shimy, M. Viability analysis of PV power plants in Egypt. Renew. Energy 2009, 34, 2187–2196. [Google Scholar] [CrossRef]
- Kebede, K.Y. Viability study of grid-connected solar PV system in Ethiopia. Sustain. Energy Technol. Assess. 2015, 10, 63–70. [Google Scholar] [CrossRef]
- Al Garni, H.Z.; Awasthi, A. Solar PV Power Plants Site Selection: A Review. In Advances in Renewable Energies and Power Technologies; Elsevier: Amsterdam, The Netherlands, 2018; pp. 57–75. [Google Scholar]
- Mateo, J.R.S.C. Multi Criteria Analysis in the Renewable Energy Industry; Springer Science & Business Media: London, UK, 2012; ISBN 1-4471-2346-8. [Google Scholar]
- Wang, J.-J.; Jing, Y.-Y.; Zhang, C.-F.; Zhao, J.-H. Review on multi-criteria decision analysis aid in sustainable energy decision-making. Renew. Sustain. Energy Rev. 2009, 13, 2263–2278. [Google Scholar] [CrossRef]
- Sipahi, S.; Timor, M. The analytic hierarchy process and analytic network process: An overview of applications. Manag. Decis. 2010, 48, 775–808. [Google Scholar] [CrossRef]
- Effat, H.A. Selection of potential sites for solar energy farms in Ismailia Governorate, Egypt using SRTM and multicriteria analysis. Int. J. Adv. Remote Sens. GIS 2013, 2, 205–220. [Google Scholar]
- Uyan, M. GIS-based solar farms site selection using analytic hierarchy process (AHP) in Karapinar region, Konya/Turkey. Renew. Sustain. Energy Rev. 2013, 28, 11–17. [Google Scholar] [CrossRef]
- Uyan, M. Optimal site selection for solar power plants using multi-criteria evaluation: A case study from the Ayranci region in Karaman, Turkey. Clean Technol. Environ. Policy 2017, 19, 2231–2244. [Google Scholar] [CrossRef]
- Merrouni, A.A.; Elalaoui, F.E.; Mezrhab, A.; Mezrhab, A.; Ghennioui, A. Large scale PV sites selection by combining GIS and Analytical Hierarchy Process. Case study: Eastern Morocco. Renew. Energy 2018, 119, 863–873. [Google Scholar] [CrossRef]
- Georgiou, A.G.; Skarlatos, D. Optimal site selection for sitting a solar park using multi-criteria decision analysis and geographical information systems. Geosci. Instrum. Methods Data Syst. 2016, 5, 321–332. [Google Scholar] [CrossRef] [Green Version]
- Cameroon Electricity Transmission Network. Available online: https://www.arcgis.com/home/webmap/viewer.html?layers=f2a84c5f513c4a70a2ac116f0e62f6e4 (accessed on 10 February 2019).
- Fu, R.; Feldman, D.J.; Margolis, R.M.; Woodhouse, M.A.; Ardani, K.B. US Solar Photovoltaic System Cost Benchmark: Q1 2017; National Renewable Energy Lab. (NREL): Golden, CO, USA, 2017. [Google Scholar]
- Leng, G.; Meloche, N.; Monarque, A.; Painchaud, G.; Thevenard, D.; Ross, M.; Hosette, P. Clean Energy Project Analysis: Retscreen, Engineering & Cases Textbook-Photovoltaic Project Analysis; CANMET Energy Technology Centre: Ottawa, ON, Canada, 2004. [Google Scholar]
- Tisdale, M.; Grau, T.; Neuhoff, K. Impact of Renewable Energy Act Reform on Wind Project Finance; Department of Climate Policy, DIW Berlin: Berlin, Germany, 2014. [Google Scholar]
- Bekker, B.; Gaunt, T. Simulating the impact of design-stage uncertainties on PV array energy output estimation. Rural Electrif. 2005, 1. [Google Scholar]
- Thevenard, D.; Leng, G.; Martel, S. The Retscreen Model for Assessing Potential PV Projects. In Proceedings of the Conference Record of the Twenty-Eighth IEEE Photovoltaic Specialists Conference, Anchorage, AK, USA, 15–22 September 2000; pp. 1626–1629. [Google Scholar]
- Leng, G.J. Retscreentm International: A Decision Support and Capacity Building Tool for Assessing Potential Renewable Energy Projects; UNEP Industry and Environment: Paris, France, 2000; Volume 23, pp. 22–23. [Google Scholar]
- Ganoe, R.D.; Stackhouse, P.W., Jr.; DeYoung, R.J. RETScreen Plus Software Tutorial; NASA Langley Research Center: Hampton, VA, USA, 2014. [Google Scholar]
- NASA Surface Meteorology and Solar Energy. Available online: https://power.larc.nasa.gov/ (accessed on 10 February 2019).
- Nfah, E.; Ngundam, J. Feasibility of pico-hydro and photovoltaic hybrid power systems for remote villages in Cameroon. Renew. Energy 2009, 34, 1445–1450. [Google Scholar] [CrossRef]
- World Bank. World Development Indicators Online; World Bank: Washington, DC, USA, 2017. [Google Scholar]
- Schwerhoff, G.; Sy, M. Financing renewable energy in Africa—Key challenge of the sustainable development goals. Renew. Sustain. Energy Rev. 2017, 75, 393–401. [Google Scholar] [CrossRef]
- Global Wind Energy Council (GWEC). Global Wind Report. Annual Market Update Global Wind Energy Council; Global Wind Energy Council (GWEC): Brussels, Belgium, 2016. [Google Scholar]
- Brown, P.A.; Gibson, D.F. A Quantified Model for Facility Site Selection-Application to a Multiplant Location Problem. AIIE Trans. 1972, 4, 1–10. [Google Scholar] [CrossRef]
- Heragu, S.S. Facilities Design; CRC Press: Boca Raton, FL, USA, 2008; ISBN 1-4200-6627-7. [Google Scholar]
- Fahnehjelm, C.; Ämting, V. Evaluation of Cost Competitiveness and Payback Period of Grid-Connected Photovoltaic Systems in Sri Lanka. 2016. Available online: http://www.diva-portal.org/smash/get/diva2:1069584/FULLTEXT01.pdf (accessed on 1 May 2018).
- Kaldellis, J.K.; Kapsali, M.; Kavadias, K.A. Temperature and wind speed impact on the efficiency of PV installations. Experience obtained from outdoor measurements in Greece. Renew. Energy 2014, 66, 612–624. [Google Scholar] [CrossRef]
- Borgogno Mondino, E.; Fabrizio, E.; Chiabrando, R. Site selection of large ground-mounted photovoltaic plants: A GIS decision support system and an application to Italy. Int. J. Green Energy 2015, 12, 515–525. [Google Scholar] [CrossRef]
- Spiegel, M.R.; Stephens, L.J. Schaum’s Outline of Statistics; McGraw Hill Professional: New York, NY, USA, 2017; ISBN 1-260-01147-X. [Google Scholar]
- Saaty, T.L. Decision making with the analytic hierarchy process. Int. J. Serv. Sci. 2008, 1, 83–98. [Google Scholar] [CrossRef]
- Basuki, A.; Cahyani, A.D. Decision Making of Warehouse Location Selection Using Brown-Gibson Model. Adv. Sci. Lett. 2017, 23, 12381–12384. [Google Scholar] [CrossRef]


| Ref. Year | Location | Constraint Factors | Criteria Category | Evaluation Criteria |
|---|---|---|---|---|
| [27], 2013 | Ismailia, Egypt | Buffer of urban areas = 2.000 m Buffer of roads s = 200 m |
| |
| [28], 2013 | Konya region, Turkey | Buffer of residential areas = 500 m Buffer of rivers and lakes = 500 m Buffer of roads = 100 m Buffer of protected areas = 500 m | Environmental factors |
|
| [29], 2017 | Ayranci region, Turkey | Economic factors |
| |
| [30], 2018 | Eastern Morocco | Buffer of residential areas = 2.000 m Buffer of rivers and lakes = 500 m Buffer of roads and railways = 100 m Buffer of agricultural areas = 500 m | Climate |
|
| Orthography |
| |||
| Location |
| |||
| Water resource |
| |||
| [31], 2016 | Limassol, Cyrus | Buffer of urban areas = 200 m Buffer of natural forest = 200 m Buffer of roads and railways = 50 m Buffer of shoreline = 200 m Buffer of waterway = 100 m Buffer of archaeological site = 500 m | Technical |
|
| Social |
| |||
| Financial |
|
| Location | Latitude (N) | Longitude (N) | Elevation (m) | ADSR (kWh/m2/d) | AYT (°C) | AYWS (m/s) | DRA (m) | DPA (m) | DWL (km) | DR (m) | DWW (m) | LU 1 | DPG (m) |
|---|---|---|---|---|---|---|---|---|---|---|---|---|---|
| Banyo | 06°45′41″ | 11°47′22″ | 1115 | 5.44 | 23.1 | 2.8 | 622 | 8050 | 17,000 | 2032 | 3005 | 2 | 10,541 |
| Garoua | 09°16′46″ | 13°22′06″ | 209 | 5.75 | 26.7 | 3.5 | 1800 | 1600 | 20,502 | 1700 | 1890 | 3 | 5300 |
| Maroua | 10°34′34″ | 14°19′00″ | 403 | 5.70 | 27.7 | 3.8 | 1706 | 7125 | 8585 | 700 | 2412 | 2 | 4058 |
| Meiganga | 06°30′35″ | 14°18′40″ | 992 | 5.55 | 23.6 | 3.2 | 450 | 8805 | 48,522 | 600 | 968 | 2 | 4521 |
| Mokolo | 10°45′11″ | 13°49′53″ | 779 | 5.74 | 26.6 | 3.7 | 2302 | 10,582 | 35,074 | 1052 | 1250 | 3 | 3589 |
| Mora | 11°03′23″ | 14°06′53″ | 454 | 5.82 | 28.1 | 3.9 | 2000 | 65,000 | 58,840 | 2504 | 2350 | 3 | 3100 |
| Ngaoundéré | 07°20′04″ | 13°34′06″ | 1102 | 5.62 | 24.1 | 3.3 | 2155 | 12,055 | 175,458 | 950 | 1568 | 4 | 2944 |
| Poli | 08°28′46″ | 13°15′13″ | 613 | 5.75 | 25.8 | 3.4 | 1917 | 65,232 | 41,778 | 1980 | 495 | 4 | 9745 |
| Tcholliré | 08°23′26″ | 14°08′56″ | 393 | 5.74 | 26.2 | 3.4 | 2514 | 28,541 | 8741 | 1105 | 1985 | 2 | 4895 |
| Tibati | 06°27′02″ | 12°38′02″ | 873 | 5.64 | 23.3 | 3.2 | 1560 | 1755 | 2587 | 824 | 2585 | 2 | 8650 |
| Tignere | 07°22′38″ | 12°38′24″ | 1181 | 5.59 | 24.7 | 3.2 | 1534 | 10,811 | 7584 | 562 | 1368 | 1 | 6582 |
| Yagoua | 10°19′51″ | 15°14′33″ | 337 | 5.76 | 28.6 | 3.9 | 1159 | 1852 | 2558 | 1502 | 2522 | 2 | 5680 |
| Item | Specification |
|---|---|
| Manufacturer | Sunpower |
| PV Module type | Mono-si |
| Module number | SPR-320E-WHT-D |
| Module efficiency | 19.60% |
| Power capacity | 320 W |
| Dimensions | 32 mm × 155 mm × 128 mm |
| Maximum system voltage | DC 600 V |
| Operating temperature | −40–80 °C |
| Area | 1.60 m2 |
| Weight | 18.60 kg |
| Parameters | Units | Value Used |
|---|---|---|
| Inflation rate | % | 1.5 |
| Project lifetime | yr | 20 |
| Debt term | year | 10 |
| Debt ratio | % | 70 |
| Discount rate | % | 10 |
| Debt interest rate | % | 15 |
| Electricity export rate | € | 100 |
| Total initial costs of PV | €/kW | 1661 |
| O and M of PV | €/kW/year | 13.12 |
| Inverter capacity | kw | 3900 |
| Inverter replacement cost | €/kW | 51 |
| Inverter efficiency | % | 98 |
| Inverter lifetime | year | 15 |
| Miscellaneous losses | % | 5 |
| T & D losses | % | 10 |
| Transmission line cost | €/km | 5000 |
| n | 2 | 3 | 4 | 5 | 6 | 7 | 8 | 9 | 10 | 11 | 12 |
|---|---|---|---|---|---|---|---|---|---|---|---|
| RI | 0 | 0.58 | 0.90 | 1.12 | 1.24 | 1.32 | 1.41 | 1.45 | 1.49 | 1.51 | 1.48 |
| Environment | Climatic | Location | |
|---|---|---|---|
| Environment | 1 | 2 | 1 |
| Climatic | 1/2 | 1 | 1/3 |
| Location | 1 | 3 | 1 |
| Land Use | Carbone Emission | |
|---|---|---|
| Land use | 1 | 2 |
| Carbone emission | 1/2 | 1 |
| Average Wind Speed | Average Temperature | |
|---|---|---|
| Average wind speed | 1 | 2 |
| Average temperature | 1/2 | 1 |
| DRA | DPG | DR | |
|---|---|---|---|
| DRA | 1 | 2 | 1 |
| DPG | 1/2 | 1 | 1/3 |
| DR | 1 | 3 | 1 |
| Location | CF (%) | EG (MWh/y) | GHG E.R. (tCO2/y) | NPV (M€) | SPP (Years) |
|---|---|---|---|---|---|
| Banyo | 24.4 | 10,671 | 9156 | 1.515 | 6.3 |
| Garoua | 25.8 | 11,311 | 9705 | 2.224 | 5.9 |
| Maroua | 25.5 | 11,172 | 9585 | 2.069 | 6 |
| Meiganga | 24.9 | 10,914 | 9364 | 1.784 | 6.1 |
| Mokolo | 26.0 | 11,372 | 9757 | 2.291 | 5.9 |
| Mora | 26.1 | 11,419 | 9797 | 2.342 | 5.9 |
| Ngaoundéré | 25.5 | 11,167 | 9572 | 2.052 | 6 |
| Poli | 25.9 | 11,324 | 9716 | 2.237 | 5.9 |
| Tcholliré | 25.8 | 11,291 | 9687 | 2.201 | 5.9 |
| Tibati | 25.4 | 11,119 | 9540 | 2.011 | 6 |
| Tignere | 25.2 | 11,024 | 9458 | 1.905 | 6 |
| Yagoua | 25.7 | 11,266 | 9666 | 2.163 | 5.9 |
| Criteria | Suitability Factor | Weight of Factor (%) |
|---|---|---|
| Environmental (38.7%) | Land use (SF2) (66.7%) | 25.8 |
| Carbone emission saving (SF5) (33.3%) | 12.9 | |
| Climatic (16.9%) | Average wind speed (SF7) (50%) | 8.45 |
| Average temperature (SF6) (50%) | 8.45 | |
| Location (44.4%) | Distance from residential areas (SF1) (24.0%) | 10.7 |
| Distance from power grid (SF4) (55%) | 24.4 | |
| Distance from the road (SF3) (21%) | 9.3 |
| Location | CFI1 | CFI2 | CFI3 | CFI4 | CFI5 | CFI6 |
|---|---|---|---|---|---|---|
| Banyo | 0 | 1 | 1 | 1 | 1 | 0 |
| Garoua | 1 | 1 | 1 | 1 | 1 | 1 |
| Maroua | 1 | 1 | 1 | 1 | 1 | 1 |
| Meiganga | 0 | 1 | 1 | 1 | 1 | 0 |
| Mokolo | 1 | 1 | 1 | 1 | 1 | 1 |
| Mora | 1 | 1 | 1 | 1 | 1 | 1 |
| Ngaoundéré | 1 | 1 | 1 | 1 | 1 | 1 |
| Poli | 1 | 0 | 1 | 1 | 1 | 1 |
| Tcholliré | 1 | 1 | 1 | 1 | 1 | 1 |
| Tibati | 1 | 1 | 1 | 1 | 1 | 1 |
| Tignere | 1 | 1 | 1 | 1 | 1 | 1 |
| Yagoua | 1 | 1 | 1 | 1 | 1 | 1 |
| Location | LM | Rank |
|---|---|---|
| Banyo | 0 | Not ranked |
| Garoua | 0.74 | 4 |
| Maroua | 0.65 | 7 |
| Meiganga | 0 | Not ranked |
| Mokolo | 0.88 | 1 |
| Mora | 0.83 | 2 |
| Ngaoundéré | 0.73 | 5 |
| Poli | 0 | Not ranked |
| Tcholliré | 0.75 | 3 |
| Tibati | 0.55 | 8 |
| Tignere | 0.45 | 9 |
| Yagoua | 0.68 | 6 |
© 2019 by the authors. Licensee MDPI, Basel, Switzerland. This article is an open access article distributed under the terms and conditions of the Creative Commons Attribution (CC BY) license (http://creativecommons.org/licenses/by/4.0/).
Share and Cite
Yimen, N.; Dagbasi, M. Multi-Attribute Decision-Making: Applying a Modified Brown–Gibson Model and RETScreen Software to the Optimal Location Process of Utility-Scale Photovoltaic Plants. Processes 2019, 7, 505. https://doi.org/10.3390/pr7080505
Yimen N, Dagbasi M. Multi-Attribute Decision-Making: Applying a Modified Brown–Gibson Model and RETScreen Software to the Optimal Location Process of Utility-Scale Photovoltaic Plants. Processes. 2019; 7(8):505. https://doi.org/10.3390/pr7080505
Chicago/Turabian StyleYimen, Nasser, and Mustafa Dagbasi. 2019. "Multi-Attribute Decision-Making: Applying a Modified Brown–Gibson Model and RETScreen Software to the Optimal Location Process of Utility-Scale Photovoltaic Plants" Processes 7, no. 8: 505. https://doi.org/10.3390/pr7080505