Article

Assessment of Wind Energy Potential for the Production of Renewable Hydrogen in Sindh Province of Pakistan

1
College of Economics and Management, Yanshan University, Qinhuangdao 066004, China
2
Department of Economics, Ghazi University, Dera Ghazi Khan, Pakistan
3
School of Business Administration, Shaheed Benazir Bhutto University, Shaheed Benazirabad, Pakistan
4
School of Information science and Technology, Yanshan University, Qinhuangdao 066004, China
*
Author to whom correspondence should be addressed.
Processes 2019, 7(4), 196; https://doi.org/10.3390/pr7040196
Submission received: 30 January 2019 / Revised: 22 March 2019 / Accepted: 26 March 2019 / Published: 4 April 2019
(This article belongs to the Special Issue Energy, Economic and Environment for Industrial Production Processes)

Abstract

:
In this study, we developed a new hybrid mathematical model that combines wind-speed range with the log law to derive the wind energy potential for wind-generated hydrogen production in Pakistan. In addition, we electrolyzed wind-generated power in order to assess the generation capacity of wind-generated renewable hydrogen. The advantage of the Weibull model is that it more accurately reflects power generation potential (i.e., the capacity factor). When applied to selected sites, we have found commercially viable hydrogen production capacity in all locations. All sites considered had the potential to produce an excess amount of wind-generated renewable hydrogen. If the total national capacity of wind-generated was used, Pakistan could conceivably produce 51,917,000.39 kg per day of renewable hydrogen. Based on our results, we suggest that cars and other forms of transport could be fueled with hydrogen to conserve oil and gas resources, which can reduce the energy shortfall and contribute to the fight against climate change and global warming. Also, hydrogen could be used to supplement urban energy needs (e.g., for Sindh province Pakistan), again reducing energy shortage effects and supporting green city programs.

1. Introduction

In Pakistan, the boreal summer is extremely hot. Sometimes the maximum temperature reaches 54 °C, such as in the summer in 2016 (21 May 2016 in the District of Larkana, Sindh province) [1]. Heatstroke and other heat-related medical conditions can result in human fatalities, particularly when power shortages occur in urban areas (e.g., Sindh province Pakistan). In June 2015, a heat wave was responsible for 1200 fatalities in Karachi, along with 67,000 patients admitted to hospital with heatstroke. Meanwhile, the summer season in Pakistan has suffered energy shortages also, which has resulted in significant national energy crises in recent years [2]. As a result, frequent power cuts will also create new problems in the form of reduced natural gas supplies, breaking off most industrial and commercial processes as well as interrupting logistics, home cooking and cooling. Pakistan is now facing more energy challenges than it did a decade ago. From the winter of 2015 to the present, the country’s natural gas supply and electricity have suffered considerable breakdowns [3].
In recent years, due to the energy crisis, researchers have started to explore all the resources of energy which can be harnessed technically. Along with the requirements of exploring new energy sources, there is also a need to generate climate-friendly energy sources. Similarly, Pakistan is one several regional economies facing difficulty due to climate change-induced shifts in weather patterns. The results of flooding and drought have affected economic growth and agricultural output [4]. With respect to the ongoing energy crisis, renewable hydrogen energy can play a vital role in the future and also minimize the effect of harmful greenhouse gasses (GHGs) that are not only damaging to Pakistan but to the whole world. Hydrogen as a transportation fuel has an auspicious potential to reduce GHG emissions and urban pollution significantly, and its fuel cell technologies have the potential for the end-user applications that are entirely more sustainable and advanced than commercial models [5]. The invention of hybrid vehicles in Pakistan have introduced a new era of non-fossil fuel-based applications. Furthermore, the power-to-gas concept in the advanced countries is near realization.
Fuel cell power-driven applications have been developed but remain expensive presently. However, as these technologies are likely to approach a cost-effective range with further research and development. It is expected that hydrogen fuel-cell appliances will take possession of the existing petroleum vehicles as fossil fuels reach an exhaustion stage.
Hydrogen production can be achieved using different renewable energy sources including wind energy, solar energy, geothermal energy, palm oil, and biomass [6]. However, hydrogen production via wind-generated electricity is considered to be the simplest and cleanest approach. Currently, hydrogen production by the use of wind energy in the electrolysis process is considered to produce the lowest GHG emissions of all hydrogen production sources. Furthermore, wind-generated electricity has the lowest cost per kWh among all renewable resources of electricity generation [7]. Numerous studies have been conducted in the literature on hydrogen production using wind-generated electricity in different countries [8,9,10,11,12].
In Pakistan, greater emphasis should apply to renewable sources of energy in order to decrease dependency on fossil fuels and to help address issues related to climate change. Different authors have identified that wind, solar [13], and biomass [14,15] are the three most important renewable sources for hydrogen production with good prospects in Pakistan. Various studies have determined the potential of sites and considered wind-generated hydrogen production from the estimation of capacity factor using the Weibull distribution function over the wind. For example, Farfan et al. tested the potential of hydrogen generation by applying a multi-criteria assessment through a gas turbine, a photovoltaic system, and wind energy to find that when energy activity is slow, an integrated heated pump, hydrogen storage systems and a wind turbine can provide a continual supply of energy [16]. Sacramento et al. conducted a study in the state of Ceara, Brazil, to evaluate the production of electrolytic hydrogen, where the per capita gross internal product and energy consumption of the region would be increased [17]. Bhattacharyya et al. suggested that hydrogen produced by electrolyzed water and renewable wind energy do not produce carbon dioxide or other dangerous gases, and can be used as part of an optimal energy mix to reduce dependency on fossil fuels [18]. Aiche-Hamane et al. assessed the feasibility of hydrogen production by using wind energy for Ghardaia state, Algeria, and found that at 30 m altitude, 3250 m3 of hydrogen could be produced by a wind turbine, while at 60 m altitude 4200 m3 of hydrogen could be produced by a wind turbine [19]. Sigal et al. assessed the hydrogen production potential in Argentina through wind energy and found that, from renewable sources, Argentina can produce 1 billion metric tons of hydrogen per year [20]. Rahmouni et al. analyzed the potential for hydrogen production from renewable resources in Algeria using statistical and graphical methods to find that hydrogen from renewable sources can play a vital role in the energy transition [21]. Finally, Sarrias-Mena et al. considered wind turbines coupled with an electrolyzer for four different models under different conditions [22]. In addition, many other studies have considered renewable hydrogen production using sources of wind-generated energy; some focused on off-grid applications and some on grid-connected applications of hydrogen energy [21,23].
Hydrogen gas, like other natural sources gas and oil, does not exist as a natural source. Therefore, hydrogen can be extracted from a natural resource, especially from water [23], biomass, coal [24], methane and biological sources [25]. In order to extract hydrogen from these existing sources, the energy spent must be available in an excess quantity and with continuous availability. The purpose of this study is to focus on the techno-economic assessment of renewable hydrogen generation through the use of wind energy in different windy sites situated in the Sindh province of Pakistan. Unlike other studies, the potential of renewable hydrogen generation through wind energy is analyzed by modified mathematical modeling tools, e.g., combining Weibull and log law together. Also, the Levelized cost of wind energy was calculated to measure the hydrogen production cost. A comprehensive policy framework is also considered and, based on these results, we considered possible policy initiatives that could reduce the energy shortfall in Pakistan and ensure a sustainable power supply. The study provides valuable information for policy and decision makers.
The rest of the paper is organized as follows. Section 2 describes the wind power potential and its application in Pakistan. In Section 3, methodology related to the wind-hydro system is described, and in Section 4, the results are presented. Conclusions are drawn in Section 5.

2. Background and Wind Power Potential in Pakistan

Pakistan is positioned in South Asia with an area of 796,095 km2. However, the total land area without water area is 770,875 km2. Many areas of the Pakistan experience near constant wind-speed, and windy area percentage is calculated using the total land area. In order to evaluate the potential of wind power, it is estimated by conventional estimates that the total installed capacity per square kilometer of wind power area is 5 MW [26]. The overall potential of wind resource assessment in numerical terms is presented in Table 1. It can also be noted that about 3.5 % of the area has a wind power class 4 or greater, which is the requirement for cost effective wind energy production [27].
Pakistan has an enormous amount of wind energy potential for the generation of power. As expressed in Table 1, over 9% land in Pakistan is appropriate for most utility-scale wind turbine applications. Hence the total potential of wind energy production capacity in this respect is around 349 GW [28].
In addition to the potential of onshore wind energy, Pakistan also has favorable offshore wind power resources, and its utilization can achieve a considerable share of electricity generation. Moreover, harnessing offshore sources can combat the air pollution in Pakistan [30]. Hydrogen is found to be a significant and most abundant chemical element in the world, constituting about 75% of the elemental mass of the earth [31]. Neither the vision of hydrogen nor the use of hydrogen as an energy vector in the economy is new, while the hydrogen economy is based on a sustainable hydrogen supply. Fossil fuels remain the existing method of hydrogen generation, although they are considered to be infeasible as a sustainable substitute for fossil economies. In this case, hydrogen production must rely on substances other than fossil fuel feedstocks, such as renewable energy (wind, solar) resources, which are the most viable alternatives for sustainable hydrogen production [32]. Renewable resource-based hydrogen can be generated in many ways; one of the fundamental diagrams representing hydrogen production through wind energy is shown in Figure 1.
Hydrogen itself is not an energy source, it is an energy carrier. The benefits of hydrogen as an energy carrier include the fact it has little impact on the environment and diverse applications. Possible disadvantages may be the high necessity of sealing the container and pipelines required to prevent leakage [33]. The use of hydrogen produced by clean sources offers a variety of benefits such as a clean energy carrier. Hydrogen is emission-free at the point of final use. Consequently, hydrogen evades the transport induced both CO2 emissions and air pollutants. Further, hydrogen can be used as a storage medium for electric power from alternating renewable energy sources such as wind energy.
Hydrogen is not readily available in nature, unlike fossil fuels. However, it can be produced from any primary energy source and then it can be used as the fuel either for direct combustion in an internal fuel cell or burning engine [34]. However, it must be emphasized that the hydrogen itself is not an energy source, it is a secondary “energy carrier” like electricity. It is similar to electricity in terms of greenhouse gas emissions or supply security. Any advantage of hydrogen used as a fuel depends on the method of hydrogen generation. If it is produced from coal, it enhances the security of supply but causes much higher CO2 emissions, except the CO2 is captured and stored. If hydrogen is produced using a nuclear or renewable method, it reduces CO2 emissions and enhances the efficiency and security of supply.

3. Data and Methodology

Data and information were acquired from the reports of the meteorological department of Pakistan. In this paper the analysis is based on three years of wind data from April 2002 to March 2005, presented along with the wind generated electric power at eight sites (Katti Bandar, Talhar, Gharo, Jamshoro, Baghan, D.H.A. Karachi, Golarchi, and Nooriabad) in Sindh province. Pakistan Metrological Department reported that to conduct an investigation, at altitudes of 10, 30 and 50 m towers were erected at mentioned sites. At different heights, two wind-speed anemometers have been installed, and to know the wind direction, wind vanes are also installed. Automatic data loggers and temperature sensors for wind record assessment have been installed. The major objective behind this data collection was the identification of windy areas, which also keeps the extra benefit of wind power sites. Furthermore, to compute the wind energy capacity and wind characteristics of the selected sites, the Metrological Department of Pakistan use Weibull distribution functions to analyze the results. Mathematical analysis has been done by MATLAB and Microsoft Excel.

3.1. The System of Wind Power Potential to Produce Hydrogen

Various density functions are used for the simulation of wind-speed data, although the Weibull distribution is the most commonly used and accepted probability distribution function, mainly because of its capability to fit an extensive input data range [35]. One of the main weaknesses of Weibull is the inability to simulate near zero or low wind-speed. However, for the commercial use of wind turbines, it does not affect the estimation of wind power potential, as low wind-speed usually produces less energy, and can be ignored [36]. For the valuation of wind characteristics, the Weibull probability distribution function, f(v) describing the wind-speed frequency is expressed as [37]:
f ( v ) = k c ( v c ) k 1 exp [ ( v c ) k ]
where v is the wind-speed ms−1; c and k represent the scale parameter and dimensionless shape parameter, respectively. The shape factor k denotes the potential of wind and the distribution peak position, while the scale factor c indicates how windy the site is under study [35].
The standard deviation (σ) and the average wind-speed v are calculated using the following relations:
σ v = 1 N i = 1 N ( v v ¯ ) 2
v ¯ = 1 N i = 1 N v i
where n indicates the number of hourly wind-speed values over the period considered, ( v i ) is the value of wind-speed, and σ v represents the density of wind-speed corresponding to the month in which ( v i ) occurs. In this study, we use moment method suggested by [38], in which standard deviation σ and mean wind-speed v values are used to assess the Weibull distribution factors c and k.
The wind speed survey represents not only the real situation of wind potential, but also the kinetic energy and frequency distribution of wind speed are intimidated by wind energy density [39]. It is well known that winds flowing at a velocity v, sweep through the blade A and increase with the cube of its velocity. The power density is expressed as using the following equation [40].
P w ( v ) = 1 2 A ρ v ¯ 3
The average air density based on the Weibull probability density function of sites can be expressed as:
P ¯ w = 1 2 ρ v ¯ 3 ( 1 + 3 / k ) [ ( 1 + 3 / k ) ] 3
where the value of air density ( ρ ) measured at sea level is 1.225 kg/m3 with pressure 1 atm and mean temperature 15 °C [41].
As the hub-height increases wind-speed also increase which reveals a relationship among height of hub and wind speed. However, the wind-speed is measured at different hub-heights on the wind turbine. In this case, the log law method is used to modify the wind-speed based on the ground height and to derive the wind potential because it provides the best wind-speed fit when increasing the altitude [42].
v v R = log ln ( H H o ) ln ( H R / H o )
where at H height, v is wind-speed, and v R indicates the wind-speed at reference height ( H R ). Ho indicate the roughness length, which is related to displacement height.
One of the most important indicators to calculate the energy output of a wind turbine is the capacity factor (CF), which is the ratio of energy output and maximum output. The capacity factor is primarily dependent on the capacity of the wind turbine to generate electricity, depending on the wind-speed of the suggested site [43]. CF is presented as follows:
C f = P out P r
where, P out indicates the mean power output and P r denotes the rated power of the wind machine. Using Weibull probability density function mean power output P out can be determined as:
P out = v ci v co ρ vf ( v ) dv
where f ( v ) denotes the function of the wind-speed, v c o and v c i indicates the cut-out and cut-in wind-speed respectively, ρ v is a power curve of wind turbines. Wind turbine power generation (Pr) approximates the power curve as follows:
P r = 1 2 ρ AC P v 3
The capacity factor can be calculated as using the values of P out and P r in Equation (10)
C f = P out P r = v ci v co ρ vf ( v ) dv 1 2 ρ AC P v 3 .
By using the capacity factor and nominal turbine power, the annual electricity can be measured from the following equation
E o u t = 8760 × C f × P r
Depending on the availability of the wind, the level of wind is attributed to each area, so each area is classified according to its power generation potential. Table 2 lists the internationally recognized categories of wind power and their percentage of the area of Pakistan.
Wind-speed data specify that approximately 20% of the area has wind resources “fair to excellent” while 3+ wind class level is generally considered appropriate for power generation. According to Table 2, it is assumed that with the current technologies wind Class 4 is the most suitable. Also, for economical wind power generation the wind turbines respond positively to speeds above 5.5 ms−1. Wind energy helps Pakistan to meet its energy requirements, but can also help to promote the energy industry and introduce cross border electricity trade in the region [44].

3.2. Hydrogen Generation via Electrolysis

Electrolysis of water is defined as the decomposition of H2O (water) into H2 (hydrogen gas) and O2 (oxygen) due to an electric current passing through the water, which instead is performed with PEM for providing purity of the gas and greater efficiency [45]. Through electricity generation systems, renewable hydrogen can be generated in the course of water electrolysis by using the renewable wind electricity. Also, from water electrolysis, hydrogen generation is an excellent option to make full use of the surplus renewable energy. Water electrolysis using electricity from renewable sources with an efficiency of 80–90%, shows great promise in various technologies for the production of hydrogen. The renewable hydrogen production amount from the wind energy is presented in the following equation [46].
h = η el E out ec el
where h indicates the amount of hydrogen produced, E out denotes the wind electricity input to the electrolyzer for hydrogen production, η el represents the electrolysis process efficiency and its efficiency varies from 80–90% [47]; ec el is the electrolyzer energy consumption and its value is usually 5–6 (KWh/Nm3). The decomposition of water (H2O) to provide H2 needs ΔH = 286 kJ mol−1 [48]. The overall water electrolysis chemical reaction can be written as:
H 2 O H 2 + 1 2 O 2
Decomposition without heating (thermal-neutral) requires at least 1.48 V (25 C, 1 atm), varying only with temperature and pressure. Thermoneutral voltage V TH is defined by the charge transfer and enthalpy change of the reaction:
V T H = Δ H 2 F
where F is a molar charge constant and has a value of 96,485 (C mol−1). Efficiency is the comparison of the energy flow rate between the electrical power input and the H2 output. Electrolyzer process efficiency ( η el ) can be determined almost exactly by electrolyzer voltage ( V el ) in comparison to V TH of n number of cells.
η e l 1.48 n V e l
Overvoltage is generated by various loss mechanisms, e.g., electrical, electrochemical and transmission related, increasing with current density. The electrolyzer will operate at a range of current and power levels when connected to a wind turbine.

3.3. Role of Battery in Electrolysis Process

It can be observed that the entire cell reaction response is the sum of the two half reactions. Generally, cell emf can be the sum of two half-cell potentials, i.e., sum of the voltage of the reduction half-reaction ( E r e d o ) and oxidation half-reaction ( E o x o ).
E c e l l o = E ( o x ) o + E ( r e d ) o
It is not possible to directly calculate the potential of the separated half-cell, select a standard hydrogen half-reaction as a reference, and have assigned a standard reduction potential of exactly 0.000 V.
It is not possible to directly calculate the potential of an isolated half-cell. The standard hydrogen half-reaction has been selected as a reference and has been assigned a standard reduction potential of exactly 0.000 V
2 H ( 1 M ) + + 2 e = H 2 ( 1 a t m )    ( E r e d o = 0.00   V )
Let us look again at the Daniell cell described above. The standard half-cell potentials are:
( Anode )    Z n ( s ) Z n ( a q ) 2 + + 2 e    ( o x i d a t i o n )    E Z n / Z n 2 + o = 0.76   V ( Cathode )    C u 2 + + 2 e C u ( s )    ( r e d u c t i o n )    E C u 2 + / C u = 0.34   V
Therefore,
E c e l l o = E ( o x ) o + E ( r e d ) o E c e l l o = 0.76 + 0.34   V E c e l l o = 1.10   V
The notation scheme that represents galvanic cell is written on the left with the anode, the double vertical line indicating the presence of a salt bridge or porous plate.

3.4. Economic Assessment

3.4.1. Investment Cost of the Wind Power Plant

An appropriate tool for the comparison of different technologies unit costs, over their economic life is known as the levelized cost of electricity (LCOE). Also, to assess the cost of different energy generation technologies, the LOCE method is used as a benchmarking tool [49]. LCOE can be calculated using energy generation annual cost divided by annual total energy generation [50]. The economic assessment of a wind energy project depends on the project’s capability to produce electricity at a low operating cost per unit of energy. The economics of wind power is based on different parameters such as total investment costs, electricity production, maintenance and operation costs, site selected, and wind turbine characteristics. The proper selection of the wind turbine site among all listed parameters is the most essential parameter for achieving economic viability. Different methods are often used to evaluate the operating cost per unit of energy produced by a wind energy conversion system. In this study, per unit cost ( C W ) of wind energy is measured as the ratio of accumulated net present value of total costs (PVC) to the total energy ( E t o t ) generated by the system.
C W = P V C E t o t

3.4.2. Electrolysis Cost of the Wind Power Plant

Many previous works have proposed an economic modeling of the electrolyzer, where the electrolyzer investment includes three main costs including capital, operating, maintenance and replacement costs. The total investment in the electrolysis cell depends on the size of the hydrogen generation capability. The capital cost of the electrolyzer depends on the required rate of hydrogen production. The estimated specific capital cost per kWh at nominal production and the effective electrolyzer efficiency is measured as.
C e l e , u = M H 2 K e l , t h 8760 · f η u
where ( C e l e , u ) is the electrolyser unit cost, f is the capacity factor and K e l , t h is the energy required by the electrolyser. The reference case considers the unit cost of the electrolyzer to be $368/kWh which corresponds to the target value. We assume that annual operating costs and replacement costs are equivalent to 2% and 25% of the first cell investment, respectively, and that the operating life of the electrolyzer is seven years.
In order to investigate the economic assessment of the selected sites, we need to calculate their operating costs. In previous studies, various researchers used different methods to calculate operating costs per unit ($/kWh) [51]. For selected sites, the per-unit cost ($/kWh) of wind power generation needs to be calculated. The variable includes the specifically stated power cost (C1) of the wind turbine, miscellaneous (C2), installation (C3), operation and maintenance (C4), inverter costs (C5) and battery bank (C6) [52].
Using Table 3 the variables C1–C4 can be combined into a present value cost (PVC), whereas interest rate (r), wind turbine operation and maintenance cost [53], scrap value (S), inflation rate (i), turbine investment cost (I) and turbine lifetime (L). It can be calculated as:
P V C = I + C 2 ( 1 + i r 1 ) [ 1 ( 1 + i 1 + r ) L ] S ( 1 + i 1 + r ) L
The total cost of wind energy (CT) can be measured as:
C T = P V C + C 5 + C 6
Wind turbine operation and maintenance costs are considered to be 25% of the wind turbine’s annual investment cost [8]. The value of scrap is estimated to be 10% of the annual investment cost [54]. The inflation rate and interest rate in Pakistan are taken as 12.63% and 6.9% respectively. Civil works and installation costs are to be taken 4% of the total investment cost. Battery cost, miscellaneous cost and inverter cost are estimated at 9%, 10% and 4% of the investment cost respectively [55]. Investment cost (IC) can be measured as:
I c = C ASPEC + P r
where C ASPEC is the average cost of per unit kW and P r is the rated power cost of a wind turbine [56]. The specific cost and rated cost of different wind turbines are presented in Table 4. The wind energy per unit cost ( C cu ) can then be measured as:
C cu = Total   cost / Annual   average   yield
The hydrogen production cost C H 2 was the key economic parameter chosen for the optimization of the size of the hydrogen production devices and it is measured as:
C H 2 C W + C ele M H 2 · T
where C W and M H 2 is the energy cost ($) and annual hydrogen production respectively. C ele is the capital, maintenance and operating cost of the electrolyzer. T is the lifetime of the project and considered as 20 years.

4. Results and Discussion

The mean wind-speed, shape parameter, scale parameter, capacity factor and mean power densities have been studied for electricity generation. The hydrogen is measured through the power generated from wind turbines wind and also the economic assessment of the hydrogen production from wind energy is presented.

4.1. Wind Power Potential

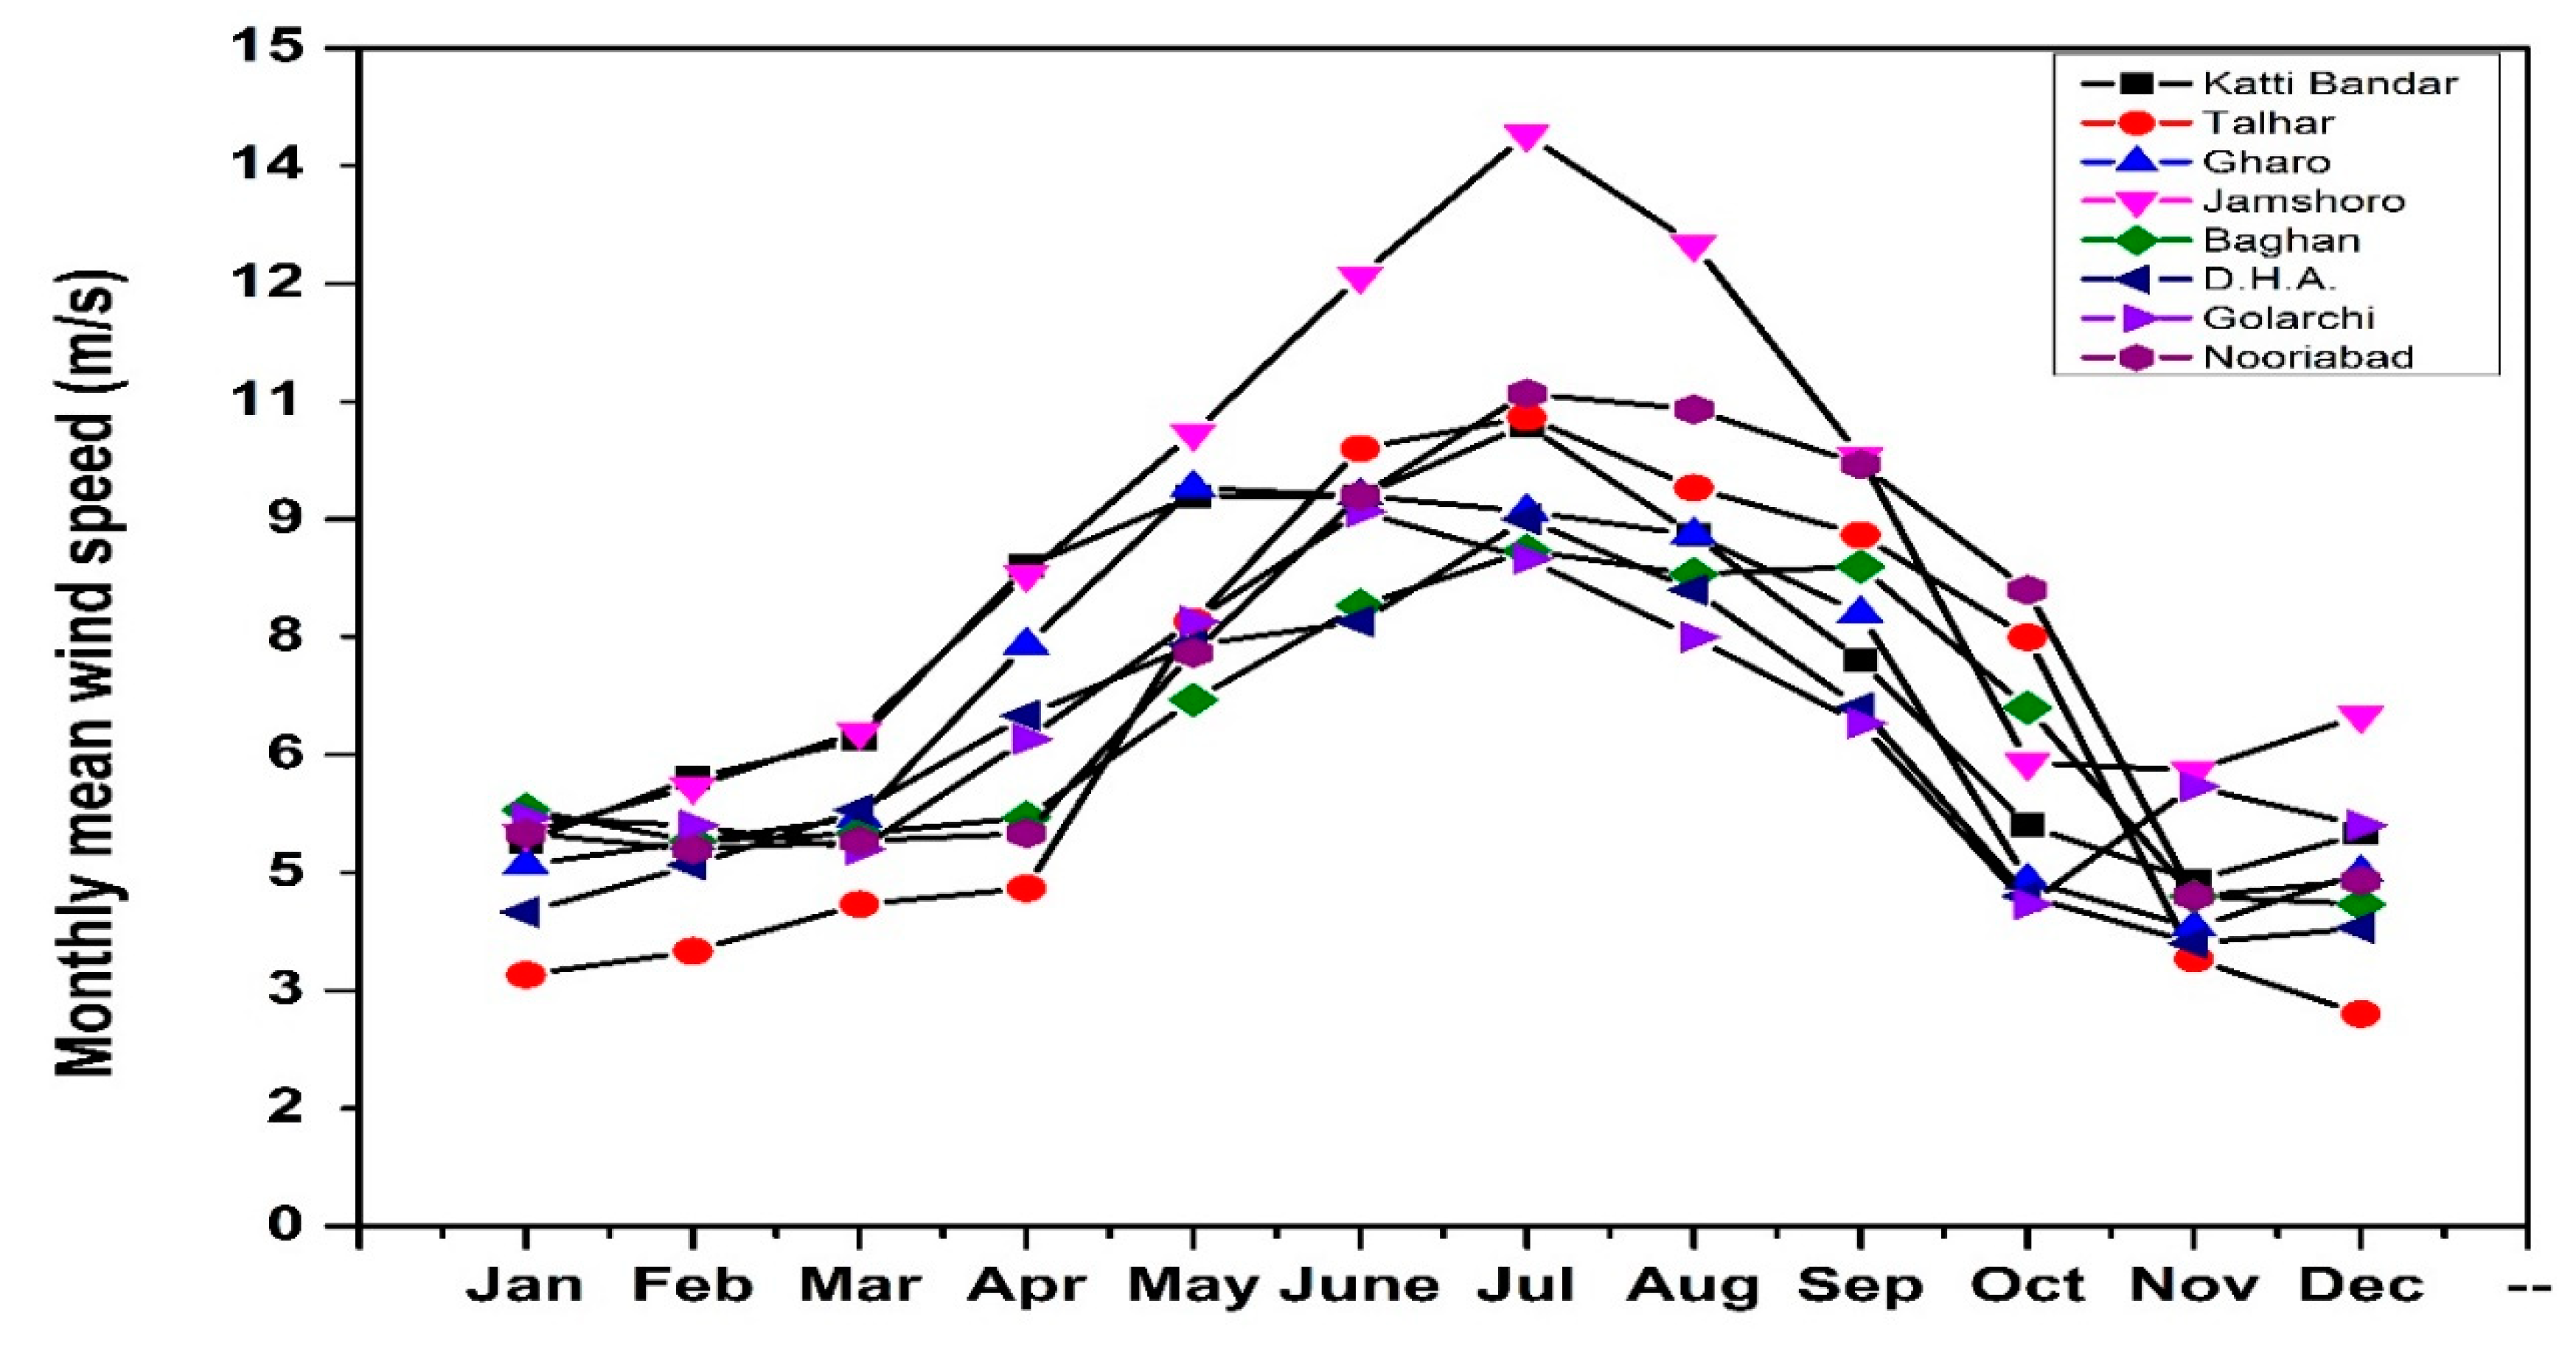
The monthly average wind-speeds for the particular selected locations are presented in Figure 2. For Katti Bandar wind station, the monthly average wind-speed vary amongst 4.50 ms−1 and 10.50 ms−1. The highest mean wind-speed in the month of July was 10.20 ms−1, and 4.90 ms−1 was lowest in the month of January. For Talhar wind station, the lowest and highest monthly wind-speed is 2.70 ms−1 in the month of November, while 10.30 ms−1 in June respectively. For the Gharo location, the highest wind-speed is 9.4 ms−1 in the month of May, while the lowest wind-speed is 3.8 ms−1 recorded during November. The monthly mean wind-speed ranged from 5.00 ms−1 to 14 ms−1 at Jamshoro wind location. Where the highest wind-speed is 13.9 ms−1 in July and the lowest mean wind-speed is 5 ms−1 recorded in January. For Baghan wind station, the highest monthly mean wind-speed of 8.6 ms−1 occurred in June and the lowest monthly mean wind-speed of 4.4 ms−1. For the Golarchi wind site, the monthly wind-speed data ranges among 4.5 ms−1 to 9.5 ms−1 from January to December. For Nooriabad wind station, the monthly mean wind speed is recorded 10.6 ms−1 at the peak in June, the lowest wind speed is 4.2 ms−1 in October and also the mean wind speed fluctuate between 4 ms−1 and 11 ms−1 over the period of the question. However, during the study period the highest monthly mean wind-speed occurred mostly in between May and August, which is the summer season for all of the wind stations included in the study. The lowest monthly mean wind-speed is recorded in the months of January–April and September–December. As the length of the daytime increases, the climate becomes more arid, the electricity demand increases throughout summer. Therefore, the peak demands coincide with the highest wind-speed for all the selected wind satiations.
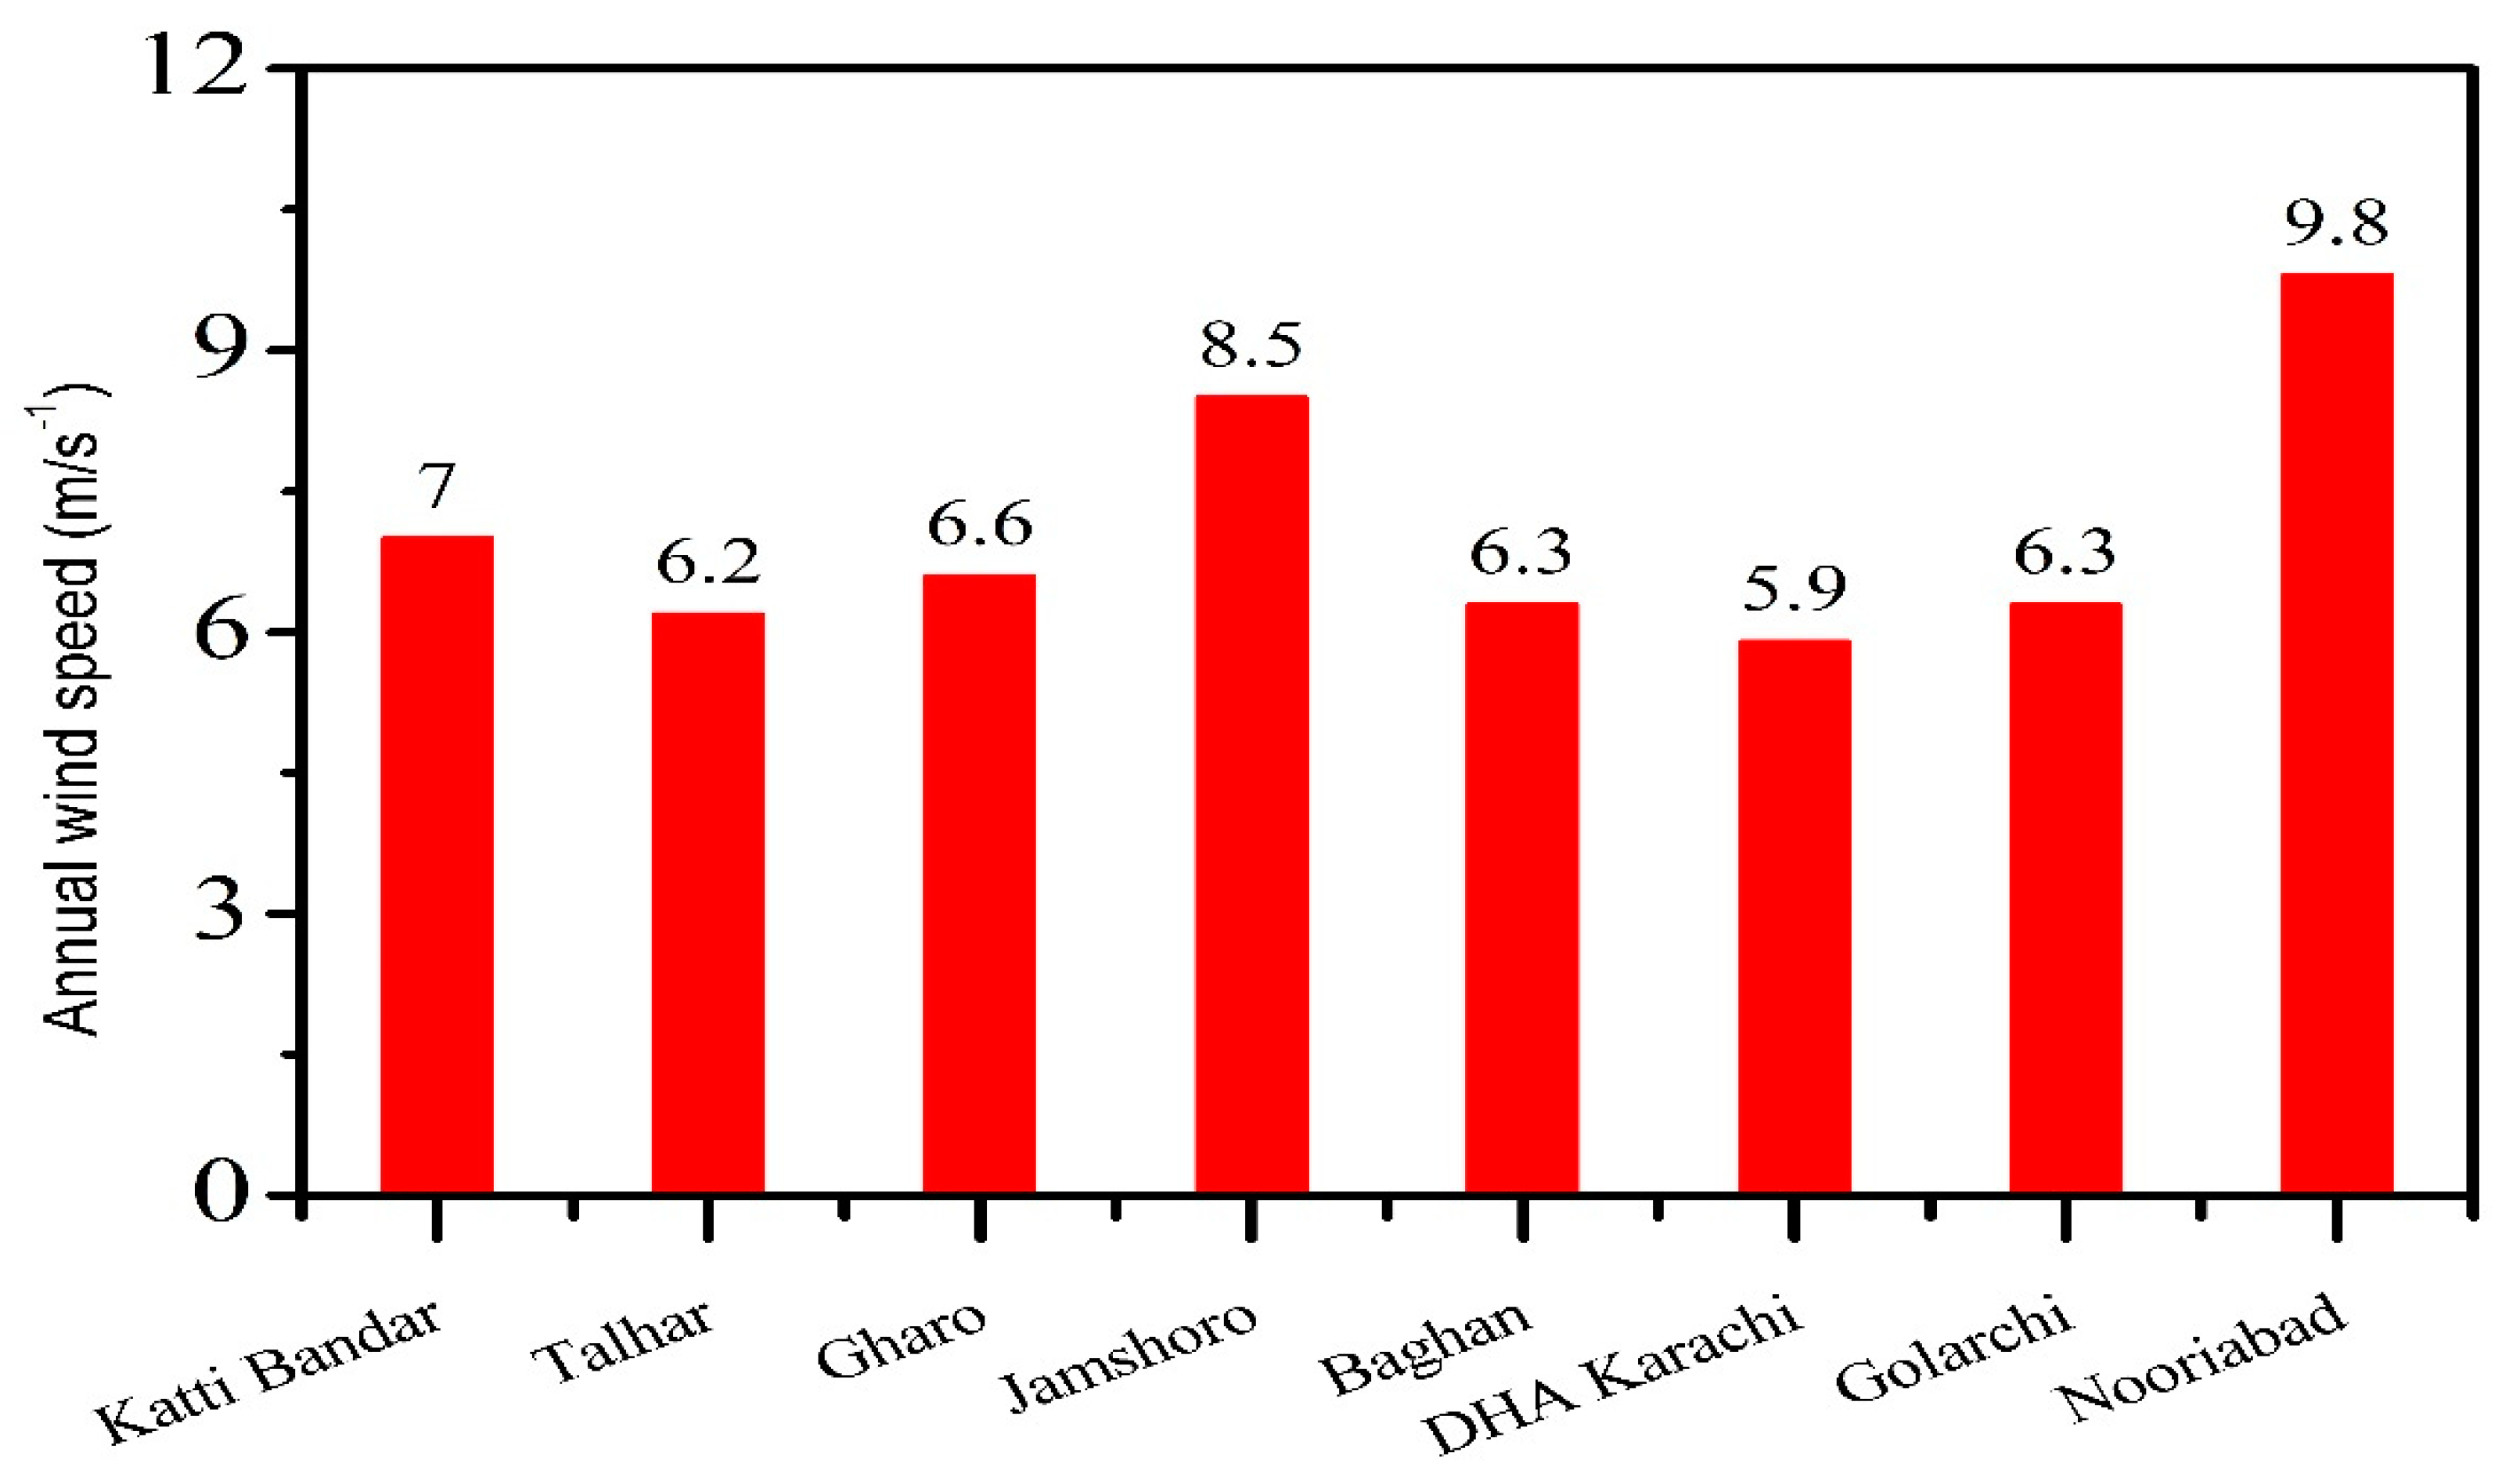
Figure 3 illustrates the annual mean wind-speed for the eight selected sites. The average annual wind-speed of selected locations Katti Bandar, Talhar, Gharo, Jamshoro, Baghan, DHA Karachi, Golarchi and Nooriabad are 7, 6.24, 6.6, 8.5, 6.3, 5.9, 6.3, and 7 ms−1 respectively. Based on the wind-speed classification as mentioned in Table 2, Nooriabad wind site can be classified as an excellent to ideal location for wind potential, while Jamshoro site is classified as good and the other locations Talhar, Katti Bandar, Gharo, Baghan, Golarchi and DHA Karachi are classified as moderate, as they are considered to have relatively limited wind resources.
The annual Weibull scale parameter (c) and shape parameters (k) results are presented in Table 5 for the selected wind locations. Selecting the most proper distribution for a given location depends on the situation of wind regimes. The annual mean Weibull shape parameter of Katti Bandar, Talhar, Gharo, Jamshoro, Baghan, DHA Karachi, Golarchi and Nooriabad are 1.8, 1.5, 1.9, 1.9, 2.1, 2.0, 2.1 and 1.7 whereas, the annual scale parameters are 7.0, 6.2, 6.6, 8.5, 6.3, 5.9, 6.3 and 9.8 ms−1 respectively. The values of shape parameters (k) and scale parameters (c) fluctuate in the ranges of 1.5 to 2.1 and 6.71 to 9.61 ms−1 amongst all the locations, respectively. Moreover, it is obviously clear that the shape parameter (k) has a much smaller variation than the scale parameter (c).
The power densities of locations Katti Bandar, Talhar, Gharo, Jamshoro, Baghan, DHA Karachi, Golarchi and Nooriabad are 595.9, 545.4, 359.5, 647.5, 575.9, 540.5, 382.01, and 754.20 W/m2, respectively, as presented in Table 5, while the annual renewable energy production with a GW-109/2500 KW wind turbine is 21,009,552, 16,388,043, 16,977,724, 22,379,630, 20,705,733, 20,448,179, 19,199,308 and 304,660,119 kWh/year, respectively. Additionally, compared to the other sites Nooriabad has highest annual average power density value (754.20 W/m2) with capacity factor 0.50 among all the selected sites, which is internationally accepted for wind power project installation. Also, according to wind power density classification as presented in Table 5, the monthly mean wind power density of Nooriabad and Jamshoro is higher than 600 W/m2. Katti Bandar, Talhar and Baghan wind sites have substantial resources of wind energy in the months of May, June, July, and August respectively, while the mean power density of DHA Karachi and Gharo is higher than 400 W/m2 in the months of May, June, July and August, which are also suitable for wind energy generation. Hence, we can draw the conclusion that all the selected locations are suitable to generate the wind power.

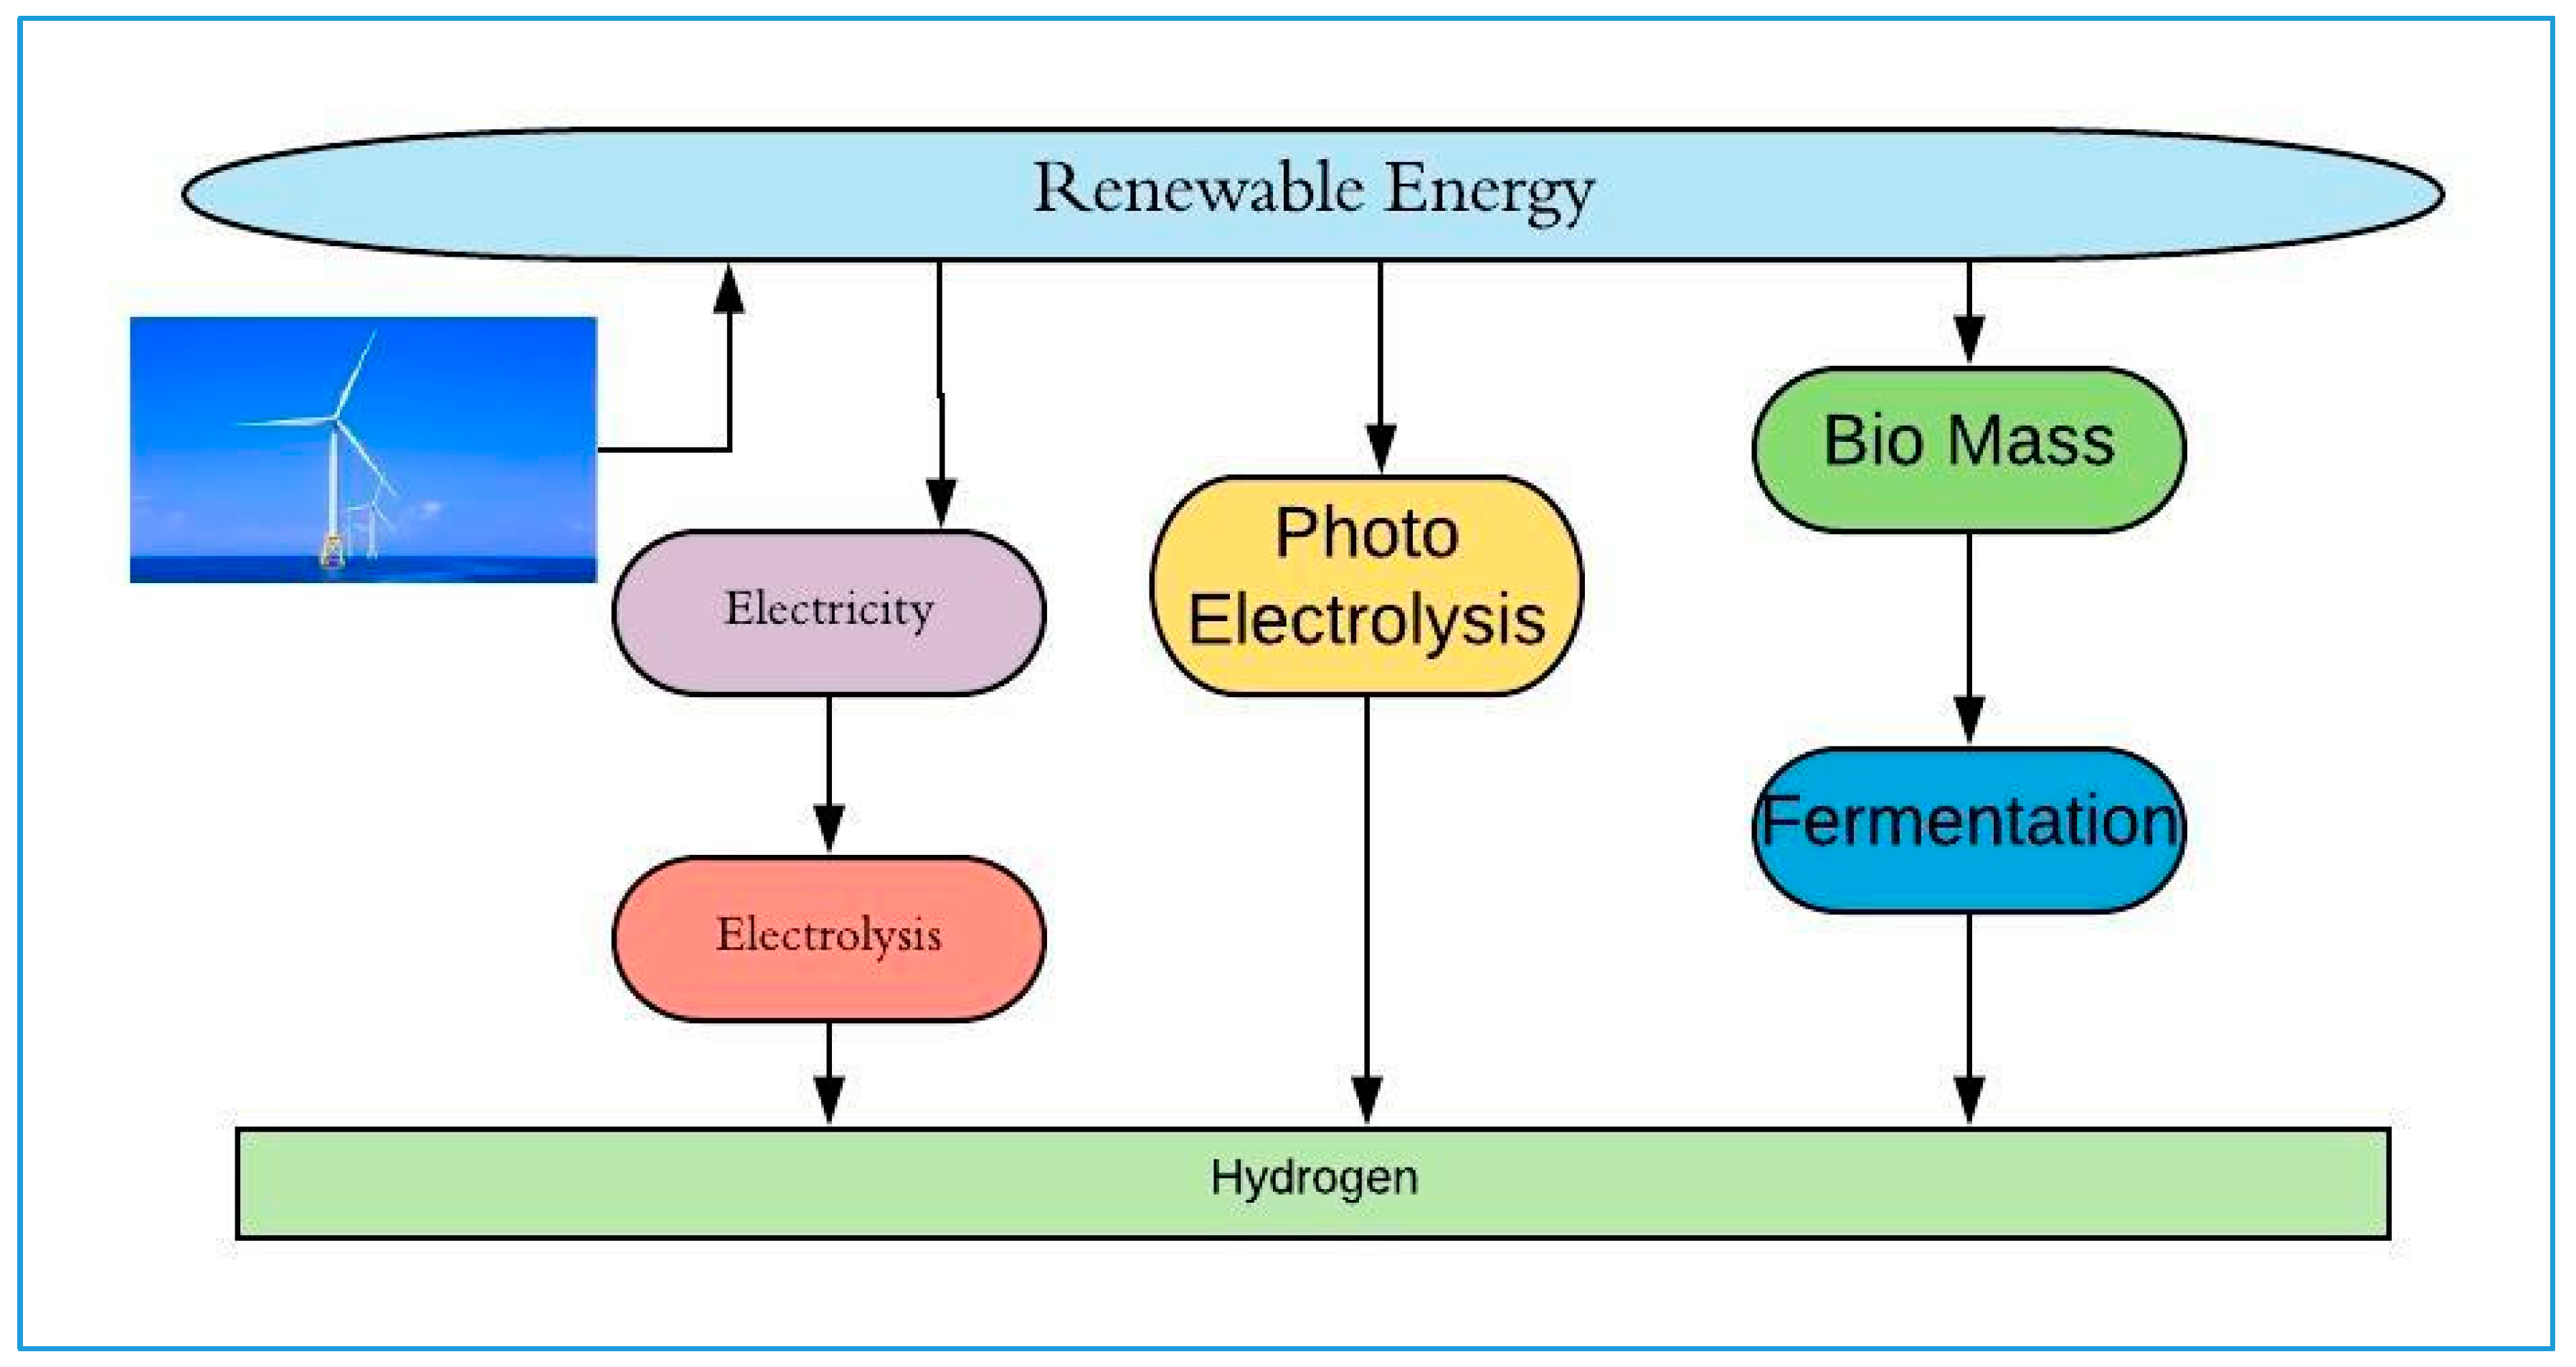
4.2. Hydrogen Production

In this study, we used electrolyzer with an energy consumption of 5 (kWh/Nm3) and a rectifier with 90% efficiency. One kilogram of produced hydrogen equals to 11.13 (Nm3) [47], which can be used to convert hydrogen produced by normal cubic meters into kilograms. The annual renewable energy generation of the GW-109/2500 wind turbines is calculated based on Weibull data. Table 6 lists the results of the analysis of the annual production of hydrogen at eight selected sites.
The capacity factor, annual renewable energy and the annual hydrogen production of wind sites Katti Bandar, Talhar, Gharo, Jamshoro, Baghan, DHA Karachi, Golarchi and Nooriabad are presented in Table 6
The range of capacity factor varies 0.25 to 0.50 and the annual renewable energy production varies from 16,388,043 kWh/year to 304,660,119 kWh/year. While the range of annual hydrogen production varies from 570,524 kg/year to 306,892 kg/year. Table 6 summarizes that the most hydrogen is produced from Nooriabad and Jamshoro with values of 570,524.7 kg/year, 419,094.2 kg/year, while the lowest amounts of hydrogen productions can be observed in wind sites DHA Karachi, Golarchi, Baghan, Talhar and Gharo with values 382,924.7 kg/year, 359,537.6 kg/year, 387,747.8 kg/year, 306,892.2 kg/year and 319,934.9 kg/year respectively.
Excessive wind flow is necessary to generate electricity, which is required to produce hydrogen. Approximately 97 kg of hydrogen is required per car annually [58]. By using the GW-109/2500 model of wind turbine, the hydrogen produced through wind energy from eight proposed locations in Sindh province of Pakistan can fuel 3,138,089 kg/97 kg = 32,351.43 vehicles per year. Further, hydrogen has an atomic weight of 1, making it a light element, but the density of hydrogen in its liquid form is 0.04 (g/cm3). Comparing the two energy sources of hydrogen and gasoline, we observed that 9.5 kg of hydrogen are equal to 25 kg of gasoline. A 14 kg tank can store 25 kg of hydrogen, but 25 kg of hydrogen storage requires a tank of 145 kg mass [59]. The reason is that the volume of gasoline fuel is four times smaller than that of hydrogen fuel. We conclude that hydrogen fuel efficiency is 1.33 better than gasoline fuel for cars.
The Pakistani government has a better chance to overcome the power shortage by installing a wind-hydrogen project, especially during the summer. Additionally, Pakistan’s total capacity of electricity generated through wind is 119,410 MW that can annually produce 51,917.39 × 103 kg of hydrogen. Hydrogen energy is an economical, secure and clean way to fuel the cars and other vehicles. Also, the consumption of transportation oil can be used to produce electricity to decrease power shortage.

4.3. Economic Analysis

The capacity factor, total energy output and unit cost of electricity are calculated using the Equations (13), (14) and (27). The economic analysis is carried out using certain assumptions such as that 25% of wind turbine annual investment is maintenance and operating cost, and the life of the wind turbine is considered to be 20 years [56]. While 5% is the installation cost, 10 % is the cost of investment, the current inflation and interest rate of Pakistan are 6.9 and 12.50, battery and inverter cost is 9% and 4% of wind turbine investment cost. Additionally, the capital expenditures related to hydrogen generation are $410 and annual capital expenses are $36.8/year, the total annual cost of raw material and operation for the maintenance of a hydrogen conversion system are $275,000 and $720,000 respectively.
The capacity factor at locations Jamshoro, Baghan, DHA Karachi and Golarchi is 0.45, 0.43, 0.42 and 0.40 respectively, while the highest capacity factor at Nooriabad is 50, and the remaining three sites Katti Bandar, Talhar and Gharo are 0.29, 0.25 and 0.27 respectively. The per unit cost of electricity generation fluctuates between $0.080/kWh to $0.086/kWh. Although, tariffs and per unit price are different from province to province. So, overall price changes with respect to the purpose of consumption at the final supply stage with the given proposed sites.
Here, for 1 kg of renewable hydrogen generation, the electricity and water requirements are 53.4 kWh and 10.6 kg respectively. Further considerations assumed that the renewable hydrogen generation capital cost includes direct, indirect and the operating cost is $0.027/kg. The leveled water supplying cost for the ease of calculation is assumed about $4.1/ton of water [60]. In order to repay the cost of capital, Pakistan’s interest rate is supposed to be 10 percent and the estimated project life is 25 years. Consequently, the capital charging factor of the electrolysis system is among 0.10 to 0.115.
Further, the cost structure breakdown is as, 87% is the cost of capital of electricity production, 8% is the cost of hydrogen generation, 6% is the cost of hydrogen storage, while 50% is the operating and maintenance cost of the turbine, 5% is the cost of gasification. Although the cost of electrolysis, water supply, operation and raw material is 2%, 20%, 10% and 10% respectively [59]. The total cost of capital could be reduced due to a decrease in configuration cost of the turbine or a decrease in the raw material cost for the electrolysis process, because it is the second highest cost contribution in the whole process.
Finally, the complete calculation shows the renewable hydrogen production cost of the efficient and optimal system is $4.02/kg-H2 to $4.310/kg-H2. Nooriabad site has the lowest hydrogen price $4.02/kg-H2 due to the highest capacity factor, while the Talhar has the highest hydrogen price $4.310/kg-H2 due to the lowest capacity factors as presented in Table 7. Annualized capital cost is the primary factor of the supply cost of renewable hydrogen against annual expenses like raw material purchase cost and facility operating costs. The literature provides evidence about the renewable energy system that the economic saddle by enormous capital expenditure is a serious obstruction to establish a development of a renewable energy system. Also, a realistic strategy for planning the excess electricity by adjusting, selling, planning, timing and extending markets and demand can improve the economics of renewable energy development. Our primary goal is to recognize the mainly cost-efficient approach for the generation of renewable hydrogen from electricity generated from wind sources. Hydrogen’s economic integration shows that the hydrogen’s cost of supply fluctuates between $4.9–$5.1/kg. The production of hydrogen and the cost of supplying hydrogen are contingent on the configuration of the wind turbine and the quality of the alkaline electrolyzer. The process of electrolysis efficiency fluctuates between 56–75% and the electricity required for the production per kilogram of hydrogen ranges between 52.5–53.4 kWh, for the production of 1000 kg/day. A total of 2.3 MW or 20 GWh electricity is required annually. At each site certain amounts of hydrogen energy can be produced with wind generated electricity.

5. Conclusions

Pakistan suffers from severe energy shortages and natural catastrophes due to environmental degradation that is particularly acute during the hot summer months. In this study, we investigated the wind characteristics and wind energy production potential of eight sites in Sindh province. Wind energy potential was examined using a Weibull distribution function that incorporated log law. The results show that most of the sites are capable of producing renewable electricity and that windy areas have enough potential to produce wind-generated renewable hydrogen. Also, the results show that the proposed sites have a total hydrogen production (via wind energy) potential of 8598 kg/day. Furthermore, the economic analysis shows that the wind generated renewable hydrogen is economically viable for light-duty vehicles to replace fossil fuel and other imported carbonized energy carriers. Wind generated renewable hydrogen can be produced $4.02–4.310/kg-H2 depending upon the amount of wind available for power production. Thus, the total wind generated electricity potential for Pakistan is 119,410 MW, which could theoretically produce ~5200 × 103 kg/day of hydrogen annually. Renewable wind-generated hydrogen represents a potential fuel source for the industrial, domestic and transportation sectors and could significantly contribute to reducing the electricity shortage in Pakistan.

Author Contributions

Writing—Original draft preparation, methodology, software and formal analysis have been done by W.I.; conceptualization, validation, data curation, and visualization, has done by W.I., M.M., Q.A., M.H.; supervision, resources, project administration, and funding acquisition has done by H.Y.; investigation has done by W.I., A.F., N.S.; finally writing—review and editing has carefully done by W.I., M.A.J., M.J., A.S.

Funding

We appreciate Yanshan University, China to fund us in this project.

Conflicts of Interest

No conflict of interest to declare.

References

  1. Abbas, F.; Rehman, I.; Adrees, M.; Ibrahim, M.; Saleem, F.; Ali, S.; Rizwan, M.; Salik, M.R. Prevailing trends of climatic extremes across Indus-Delta of Sindh-Pakistan. Theor. Appl. Climatol. 2018, 131, 1101–1117. [Google Scholar] [CrossRef]
  2. Ishaque, H. Is it wise to compromise renewable energy future for the sake of expediency? An analysis of Pakistan’s long-term electricity generation pathways. Energy Strateg. Rev. 2017, 17, 6–18. [Google Scholar] [CrossRef]
  3. Gondal, I.A.; Masood, S.A.; Khan, R. Green hydrogen production potential for developing a hydrogen economy in Pakistan. Int. J. Hydrogen Energy 2018, 43, 6011–6039. [Google Scholar] [CrossRef]
  4. Ali, A.; Rahut, D.B.; Mottaleb, K.A.; Erenstein, O. Impacts of changing weather patterns on smallholder well-being. Int. J. Clim. Chang. Strateg. Manag. 2017, 9, 225–240. [Google Scholar] [CrossRef]
  5. Rezaei, M.; Mostafaeipour, A.; Qolipour, M.; Arabnia, H.-R. Hydrogen production using wind energy from sea water: A case study on Southern and Northern coasts of Iran. Energy Environ. 2018, 29, 333–357. [Google Scholar] [CrossRef]
  6. Shuit, S.H.; Tan, K.T.; Lee, K.T.; Kamaruddin, A.H. Oil palm biomass as a sustainable energy source: A Malaysian case study. Energy 2009, 34, 1225–1235. [Google Scholar] [CrossRef] [Green Version]
  7. Uyar, T.S.; Beşikci, D. Integration of hydrogen energy systems into renewable energy systems for better design of 100% renewable energy communities. Int. J. Hydrogen Energy 2017, 42, 2453–2456. [Google Scholar] [CrossRef]
  8. Loisel, R.; Baranger, L.; Chemouri, N.; Spinu, S.; Pardo, S. Economic evaluation of hybrid off-shore wind power and hydrogen storage system. Int. J. Hydrogen Energy 2015, 40, 6727–6739. [Google Scholar] [CrossRef]
  9. Venkataraman, S.; Ziesler, C.; Johnson, P.; Van Kempen, S. Integrated Wind, Solar, and Energy Storage: Designing Plants with a Better Generation Profile and Lower Overall Cost. IEEE Power Energy Mag. 2018, 16, 74–83. [Google Scholar] [CrossRef]
  10. Yan, K.; Maark, T.A.; Khorshidi, A.; Sethuraman, V.A.; Peterson, A.A.; Guduru, P.R. The influence of elastic strain on catalytic activity in the hydrogen evolution reaction. Angew. Chem. Int. Ed. 2016, 55, 6175–6181. [Google Scholar] [CrossRef]
  11. Wang, A.; Li, H.; Xiao, J.; Lu, Y.; Zhang, M.; Hu, K.; Yan, K. Integration of Theory and Experiment on Mesoporous Nickel Sulfide Microsphere for Hydrogen Evolution Reaction. ACS Sustain. Chem. Eng. 2018, 6, 15995–16000. [Google Scholar] [CrossRef]
  12. Wang, A.; Lu, Y.; Yi, Z.; Ejaz, A.; Hu, K.; Zhang, L.; Yan, K. Selective Production of γ-Valerolactone and Valeric Acid in One-Pot Bifunctional Metal Catalysts. ChemistrySelect 2018, 3, 1097–1101. [Google Scholar] [CrossRef]
  13. Hussain Siyal, S.; Hopper, M.; Lefvert, A.; Mentis, D.; Korkovelos, A.; Lopez De Briñas Gorosabel, O.; Varela González, C.; Howells, M. GIS-based preliminary wind-hydrogen energy assessment: A case study for Pakistan. In Proceedings of the 19th EGU General Assembly, EGU2017, Vienna, Austria, 23–28 April 2017; Volume 19, p. 15638. [Google Scholar]
  14. Ghafoor, A.; Rehman, T.; Munir, A.; Ahmad, M.; Iqbal, M. Current status and overview of renewable energy potential in Pakistan for continuous energy sustainability. Renew. Sustain. Energy Rev. 2016, 60, 1332–1342. [Google Scholar] [CrossRef]
  15. Zhang, M.; Li, R.; Hu, D.; Huang, X.; Liu, Y.; Yan, K. Porous molybdenum trioxide as a bifunctional electrocatalyst for oxygen and hydrogen evolution. J. Electroanal. Chem. 2019, 836, 102–106. [Google Scholar] [CrossRef]
  16. Farfan, J.; Breyer, C. Structural changes of global power generation capacity towards sustainability and the risk of stranded investments supported by a sustainability indicator. J. Clean. Prod. 2017, 141, 370–384. [Google Scholar] [CrossRef]
  17. Do Sacramento, E.M.; de Lima, L.C.; Oliveira, C.J.; Veziroglu, T.N. A hydrogen energy system and prospects for reducing emissions of fossil fuels pollutants in the Ceará state—Brazil. Int. J. Hydrogen Energy 2008, 33, 2132–2137. [Google Scholar] [CrossRef]
  18. Bhattacharyya, R.; Misra, A.; Sandeep, K.C. Photovoltaic solar energy conversion for hydrogen production by alkaline water electrolysis: Conceptual design and analysis. Energy Convers. Manag. 2017, 133, 1–13. [Google Scholar] [CrossRef]
  19. Aiche-Hamane, L.; Belhamel, M.; Benyoucef, B.; Hamane, M. Feasibility study of hydrogen production from wind power in the region of Ghardaia. Int. J. Hydrogen Energy 2009, 34, 4947–4952. [Google Scholar] [CrossRef]
  20. Sigal, A.; Leiva, E.P.M.; Rodríguez, C.R. Assessment of the potential for hydrogen production from renewable resources in Argentina. Int. J. Hydrogen Energy 2014, 39, 8204–8214. [Google Scholar] [CrossRef]
  21. Rahmouni, S.; Negrou, B.; Settou, N.; Dominguez, J.; Gouareh, A. Prospects of hydrogen production potential from renewable resources in Algeria. Int. J. Hydrogen Energy 2017, 42, 1383–1395. [Google Scholar] [CrossRef]
  22. Sarrias-Mena, R.; Fernández-Ramírez, L.M.; García-Vázquez, C.A.; Jurado, F. Electrolyzer models for hydrogen production from wind energy systems. Int. J. Hydrogen Energy 2015, 40, 2927–2938. [Google Scholar] [CrossRef]
  23. Acar, C.; Dincer, I. Comparative assessment of hydrogen production methods from renewable and non-renewable sources. Int. J. Hydrogen Energy 2014, 39, 1–12. [Google Scholar] [CrossRef]
  24. Dufour, J.; Serrano, D.P.; Gálvez, J.L.; Moreno, J.; García, C. Life cycle assessment of processes for hydrogen production. Environmental feasibility and reduction of greenhouse gases emissions. Int. J. Hydrogen Energy 2009, 34, 1370–1376. [Google Scholar] [CrossRef]
  25. Uusitalo, V.; Väisänen, S.; Inkeri, E.; Soukka, R. Potential for greenhouse gas emission reductions using surplus electricity in hydrogen, methane and methanol production via electrolysis. Energy Convers. Manag. 2017, 134, 125–134. [Google Scholar] [CrossRef]
  26. Aized, T.; Shahid, M.; Bhatti, A.A.; Saleem, M.; Anandarajah, G. Energy security and renewable energy policy analysis of Pakistan. Renew. Sustain. Energy Rev. 2018, 84, 155–169. [Google Scholar] [CrossRef]
  27. Shami, S.H.; Ahmad, J.; Zafar, R.; Haris, M.; Bashir, S. Evaluating wind energy potential in Pakistan’s three provinces, with proposal for integration into national power grid. Renew. Sustain. Energy Rev. 2016, 53, 408–421. [Google Scholar] [CrossRef]
  28. Das Valasai, G.; Uqaili, M.A.; Memon, H.R.; Samoo, S.R.; Mirjat, N.H.; Harijan, K. Overcoming electricity crisis in Pakistan: A review of sustainable electricity options. Renew. Sustain. Energy Rev. 2017, 72, 734–745. [Google Scholar] [CrossRef]
  29. Ali, Y.; Butt, M.; sabir, M.; Mumtaz, U.; Salman, A. Selection of suitable site in Pakistan for wind power plant installation using analytic hierarchy process (AHP). J. Control Decis. 2018, 5, 117–128. [Google Scholar] [CrossRef]
  30. Khan, K.S.; Tariq, M. Wind resource assessment using SODAR and meteorological mast – A case study of Pakistan. Renew. Sustain. Energy Rev. 2018, 81, 2443–2449. [Google Scholar] [CrossRef]
  31. Nabgan, W.; Tuan Abdullah, T.A.; Mat, R.; Nabgan, B.; Gambo, Y.; Ibrahim, M.; Ahmad, A.; Jalil, A.A.; Triwahyono, S.; Saeh, I. Renewable hydrogen production from bio-oil derivative via catalytic steam reforming: An overview. Renew. Sustain. Energy Rev. 2017, 79, 347–357. [Google Scholar] [CrossRef]
  32. Higuita Cano, M.; Agbossou, K.; Kelouwani, S.; Dubé, Y. Experimental evaluation of a power management system for a hybrid renewable energy system with hydrogen production. Renew. Energy 2017, 113, 1086–1098. [Google Scholar] [CrossRef]
  33. Likkasit, C.; Maroufmashat, A.; Elkamel, A.; Ku, H.; Fowler, M. Solar-aided hydrogen production methods for the integration of renewable energies into oil & gas industries. Energy Convers. Manag. 2018, 168, 395–406. [Google Scholar]
  34. Nikolaidis, P.; Poullikkas, A. A comparative overview of hydrogen production processes. Renew. Sustain. Energy Rev. 2017, 67, 597–611. [Google Scholar] [CrossRef]
  35. Fazelpour, F.; Markarian, E.; Soltani, N. Wind energy potential and economic assessment of four locations in Sistan and Balouchestan province in Iran. Renew. Energy 2017, 109, 646–667. [Google Scholar] [CrossRef]
  36. Dabbaghiyan, A.; Fazelpour, F.; Abnavi, M.D.; Rosen, M.A. Evaluation of wind energy potential in province of Bushehr, Iran. Renew. Sustain. Energy Rev. 2016, 55, 455–466. [Google Scholar] [CrossRef]
  37. Allouhi, A.; Zamzoum, O.; Islam, M.R.; Saidur, R.; Kousksou, T.; Jamil, A.; Derouich, A. Evaluation of wind energy potential in Morocco’s coastal regions. Renew. Sustain. Energy Rev. 2017, 72, 311–324. [Google Scholar] [CrossRef]
  38. Justus, C.G.; Hargraves, W.R.; Mikhail, A.; Graber, D. Methods for Estimating Wind Speed Frequency Distributions. J. Appl. Meteorol. 1978, 17, 350–353. [Google Scholar] [CrossRef] [Green Version]
  39. Shoaib, M.; Siddiqui, I.; Amir, Y.M.; Rehman, S.U. Evaluation of wind power potential in Baburband (Pakistan) using Weibull distribution function. Renew. Sustain. Energy Rev. 2017, 70, 1343–1351. [Google Scholar] [CrossRef]
  40. St. P&#xE9, >A.; Sperling, M.; Brodie, J.F.; Delgado, R. Classifying rotor-layer wind to reduce offshore available power uncertainty. Wind Energy 2018, 21, 461–473. [Google Scholar] [CrossRef]
  41. Wiser, R. Recent Developments in the Levelized Cost of Energy from U.S. Wind Power Projects; Office of Energy Efficiency and Renewable Energy of the U.S. Department of Energy: Washington, DC, USA, 2012.
  42. Sempreviva, A.M.; Barthelmie, R.J.; Pryor, S.C. Review of Methodologies for Offshore Wind Resource Assessment in European Seas. Surv. Geophys. 2008, 29, 471–497. [Google Scholar] [CrossRef]
  43. Akdağ, S.A.; Güler, Ö. Alternative Moment Method for wind energy potential and turbine energy output estimation. Renew. Energy 2018, 120, 69–77. [Google Scholar] [CrossRef]
  44. Kaloi, G.S.; Wang, J.; Baloch, M.; Tahir, S. Wind Energy Potential at Badin and Pasni Costal Line Pakistan. Int. J. Renew. Energy Dev. 2017, 6, 103–110. [Google Scholar] [CrossRef]
  45. Boudries, R. Techno-economic study of hydrogen production using CSP technology. Int. J. Hydrogen Energy 2018, 43, 3406–3417. [Google Scholar] [CrossRef]
  46. Gandía, L.M.; Oroz, R.; Ursúa, A.; Sanchis, P.; Diéguez, P.M. Renewable Hydrogen Production: Performance of an Alkaline Water Electrolyzer Working under Emulated Wind Conditions. Energy Fuels 2007, 21, 1699–1706. [Google Scholar] [CrossRef]
  47. Alavi, O.; Mostafaeipour, A.; Qolipour, M. Analysis of hydrogen production from wind energy in the southeast of Iran. Int. J. Hydrogen Energy 2016, 41, 15158–15171. [Google Scholar] [CrossRef]
  48. Dixon, C.; Reynolds, S.; Rodley, D. Micro/small wind turbine power control for electrolysis applications. Renew. Energy 2016, 87, 182–192. [Google Scholar] [CrossRef]
  49. Lai, C.S.; McCulloch, M.D. Levelized cost of electricity for solar photovoltaic and electrical energy storage. Appl. Energy 2017, 190, 191–203. [Google Scholar] [CrossRef]
  50. Al-Sharafi, A.; Sahin, A.Z.; Ayar, T.; Yilbas, B.S. Techno-economic analysis and optimization of solar and wind energy systems for power generation and hydrogen production in Saudi Arabia. Renew. Sustain. Energy Rev. 2017, 69, 33–49. [Google Scholar] [CrossRef]
  51. Enevoldsen, P.; Valentine, S.V.; Sovacool, B.K. Insights into wind sites: Critically assessing the innovation, cost, and performance dynamics of global wind energy development. Energy Policy 2018, 120, 1–7. [Google Scholar] [CrossRef]
  52. Voormolen, J.A.; Junginger, H.M.; van Sark, W.G.J.H.M. Unravelling historical cost developments of offshore wind energy in Europe. Energy Policy 2016, 88, 435–444. [Google Scholar] [CrossRef]
  53. Dolter, B.; Rivers, N. The cost of decarbonizing the Canadian electricity system. Energy Policy 2018, 113, 135–148. [Google Scholar] [CrossRef]
  54. U.S. Energy Information Administration. Levelized Cost and Levelized Avoided Cost of New Generation Resources in the Annual Energy Outlook 2015; U.S. Energy Information Administration: Washington, DC, USA, 2015.
  55. Williams, E.; Hittinger, E.; Carvalho, R.; Williams, R. Wind power costs expected to decrease due to technological progress. Energy Policy 2017, 106, 427–435. [Google Scholar] [CrossRef] [Green Version]
  56. Bangalore, P.; Patriksson, M. Analysis of SCADA data for early fault detection, with application to the maintenance management of wind turbines. Renew. Energy 2018, 115, 521–532. [Google Scholar] [CrossRef]
  57. Ashrafi, Z.N.; Ghasemian, M.; Shahrestani, M.I.; Khodabandeh, E.; Sedaghat, A. Evaluation of hydrogen production from harvesting wind energy at high altitudes in Iran by three extrapolating Weibull methods. Int. J. Hydrogen Energy 2018, 43, 3110–3132. [Google Scholar] [CrossRef]
  58. Mostafaeipour, A.; Khayyami, M.; Sedaghat, A.; Mohammadi, K.; Shamshirband, S.; Sehati, M.-A.; Gorakifard, E. Evaluating the wind energy potential for hydrogen production: A case study. Int. J. Hydrogen Energy 2016, 41, 6200–6210. [Google Scholar] [CrossRef]
  59. Mohsin, M.; Rasheed, A.K.; Saidur, R. Economic viability and production capacity of wind generated renewable hydrogen. Int. J. Hydrogen Energy 2018, 43, 2621–2630. [Google Scholar] [CrossRef]
  60. Chi, J.; Yu, H. Water electrolysis based on renewable energy for hydrogen production. Chin. J. Catal. 2018, 39, 390–394. [Google Scholar] [CrossRef]
Figure 1. Hydrogen production through different ways.
Processes 07 00196 g001
Figure 2. Monthly mean wind speed (m/s).
Processes 07 00196 g002
Figure 3. Annual mean wind-speed ms−1.
Processes 07 00196 g003
Table 1. Wind resource assessment of Pakistan at 50 m height [29].
Wind ClassResource PotentialWind Area (km2)(%) of Total AreaInstallable Capacity (MW)
3Moderate43,2655.61216,325
4Good18,2192.3691,095
5Excellent53200.6926,600
6Excellent25140.3312,570
7Excellent5450.072725
Total 69,8639.06349,315
Table 2. Wind class and electricity capacity at the height of 50 m [3].
Wind ClassWind ResourceWind-Power (W/m2)Wind-Speed (ms−1)
6Excellent600–800<8.6
5Good500–6007.8–8.6
4Marginal400–5006.9–7.4
3Moderate300–4006.2–6.9
Table 3. Nominal rated power specific costs per kW of wind turbine.
Pt(kW)Caspec ($/kW)Average (CASPEC) ($/kW)
>2001150700–1600
20–2001250–23001775
<2026002200–3000
Table 4. Selected wind turbine specifications [57].
Wind Turbine ModelRated Power (KW)Hub Height (m)Cut in Speed (m/s)Cut Out Speed (m/s)Rotor Diameter (m)Swept Area (m2)
GW-109/25002500503251099516
Table 5. Annual mean Weibull parameters, wind power density and energy for eight locations.
SitesVCKP/A (W/m2)C.FRE kWh/year
Katti Bandar7.07.91.8595.90.2921,009,552
Talhar6.27.11.5545.40.2516,388,043
Gharo6.67.51.9359.50.2716,977,724
Jamshoro8.59.61.9647.50.4522,379,630
Baghan6.37.12.1575.90.4320,705,733
DHA Karachi5.96.72.0540.50.4220,448,179
Golarchi6.37.12.1382.010.4019,199,308
Nooriabad9.810.91.7754.200.50304,660,119
Table 6. Capacity factor, renewable energy and hydrogen production.
SitesC.FRE/kWhH2-kg
Katti Bandar0.2921,009,552393,437
Talhar0.2516,388,043306,892
Gharo0.2716,977,724317,934
Jamshoro0.4522,379,630419,094
Baghan0.4320,705,733387,747
DHA Karachi0.4220,448,179382,924
Golarchi0.4019,199,308359,537
Nooriabad0.50304,660,119570,524
Table 7. Cost of electricity and Renewable hydrogen.
SitesC.FElectricity ($/kWh)H2 Price/kg-H2
Katti Bandar0.290.0844.304
Talhar0.250.0864.315
Gharo0.270.0854.310
Jamshoro0.450.0814.221
Baghan0.430.0814.221
DHA Karachi0.420.0824.221
Golarchi0.400.0824.221
Nooriabad0.500.0804.002

