
Study on Flow Characteristics of Flue Gas and Steam Co-Injection for Heavy Oil Recovery
Abstract
:1. Introduction
2. Experimental Section
2.1. Materials
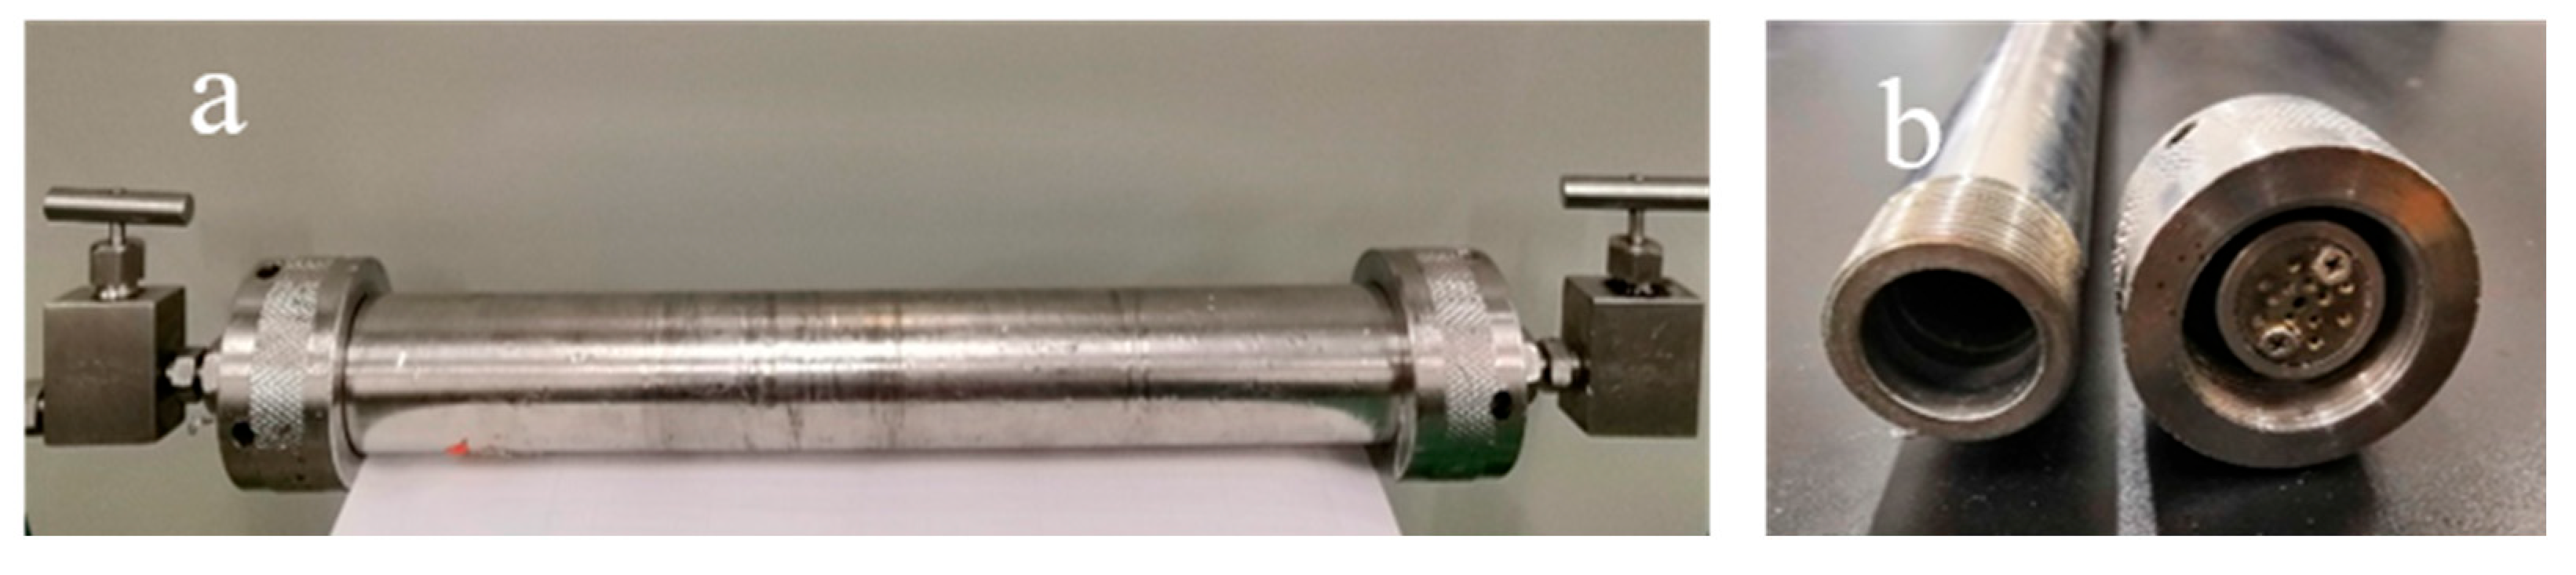
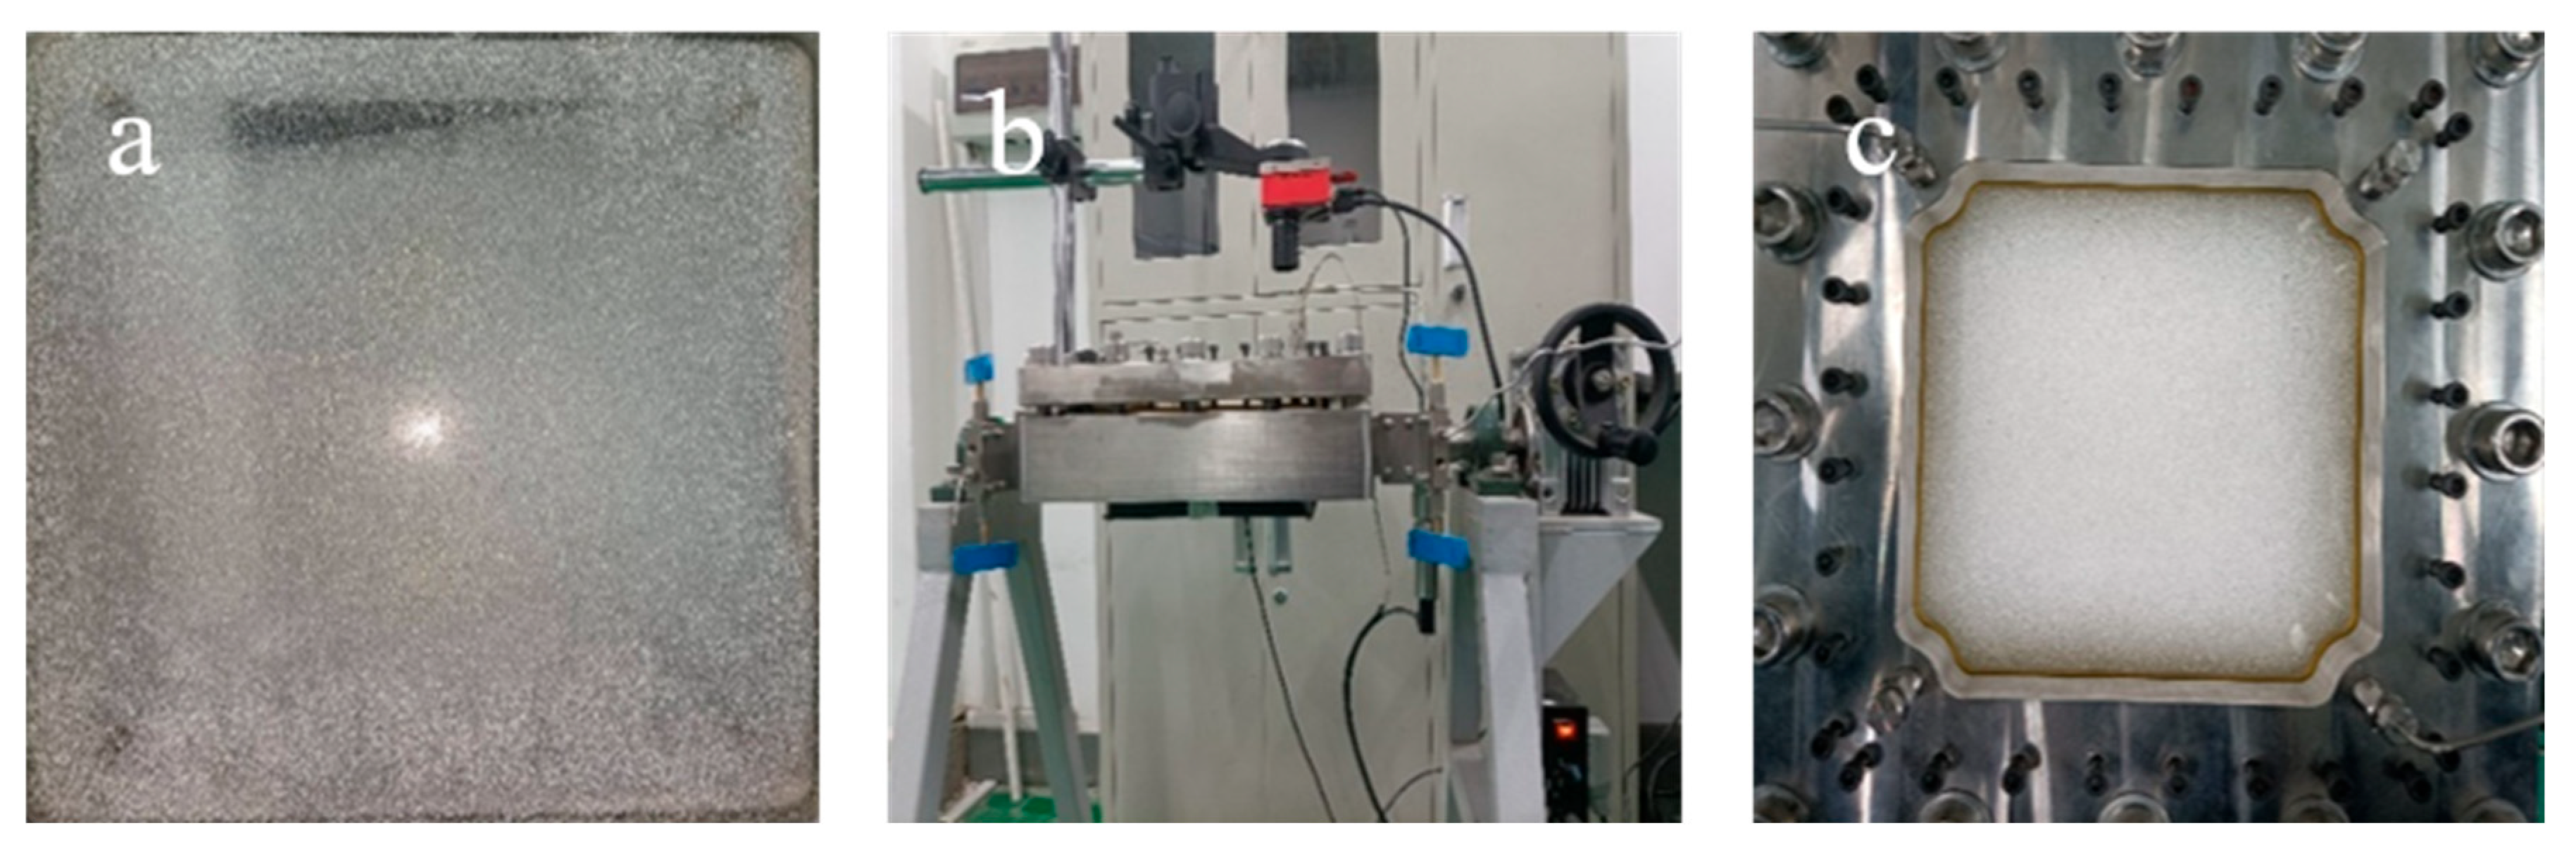
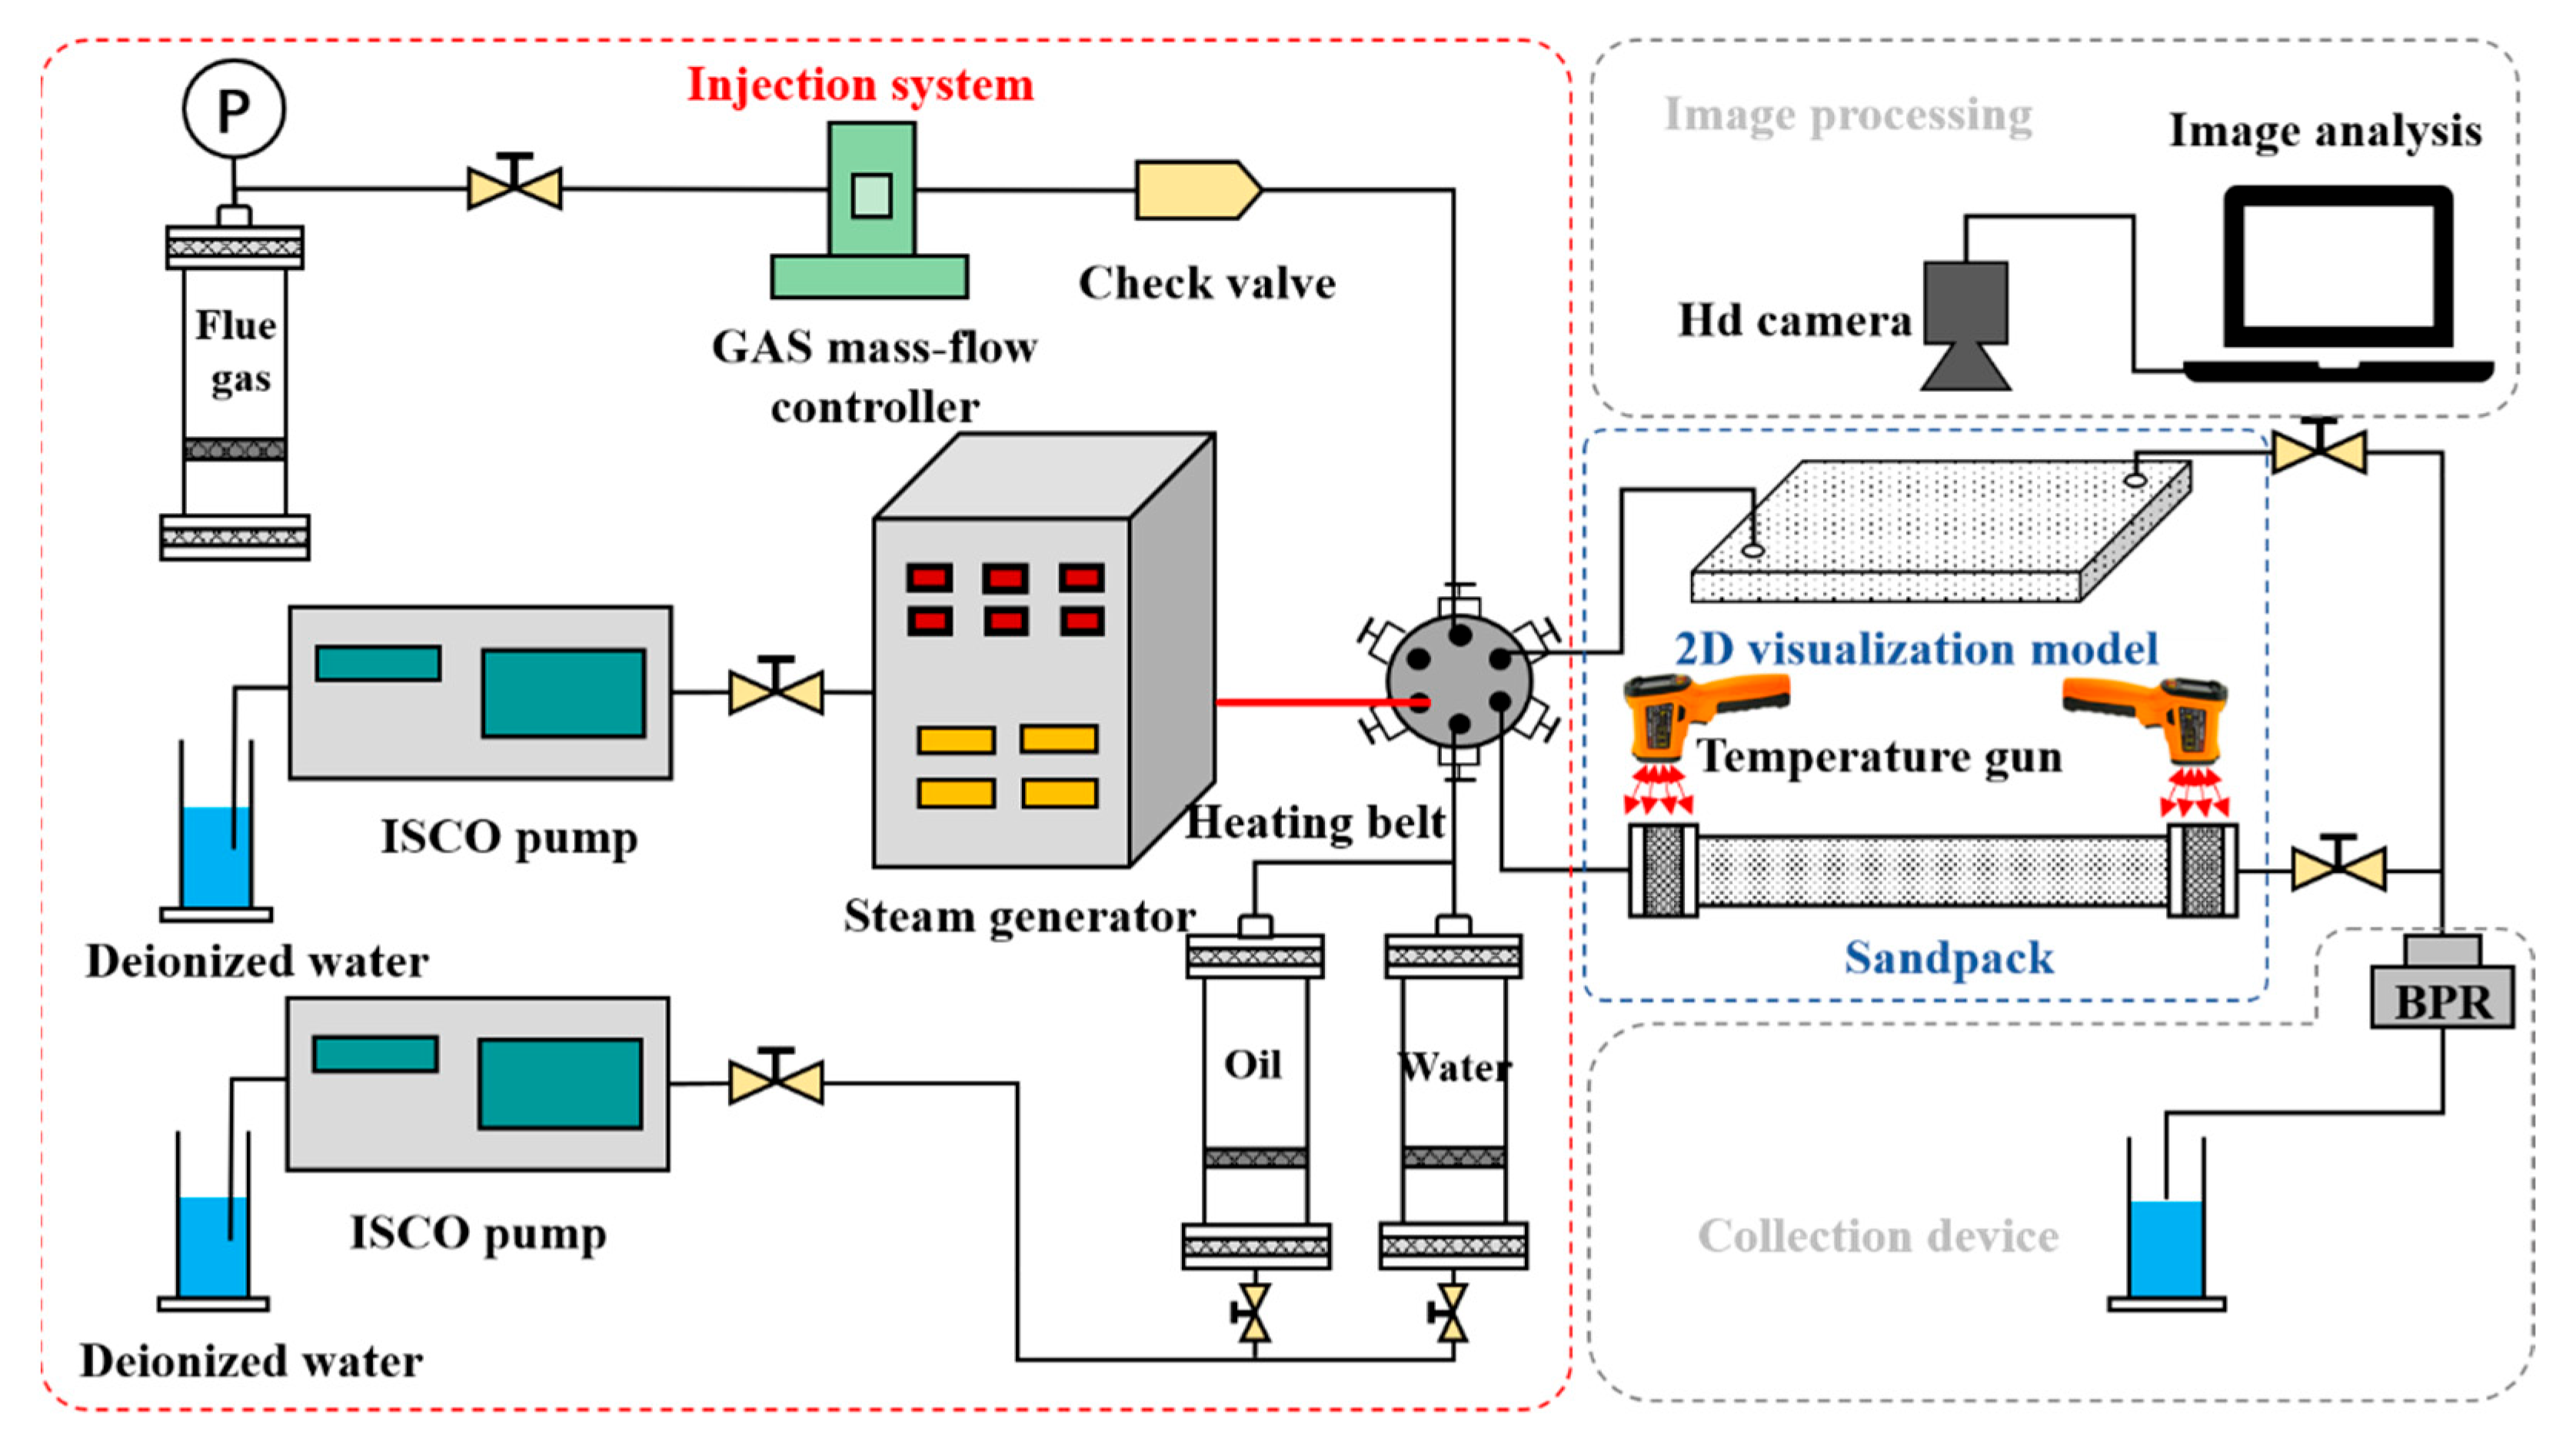
2.2. Apparatus
2.3. Experimental Procedures
2.3.1. Flow and Heat Transfer Experiments
2.3.2. Two-Dimensional Microscopic Visualization Experiment
3. Results and Discussion
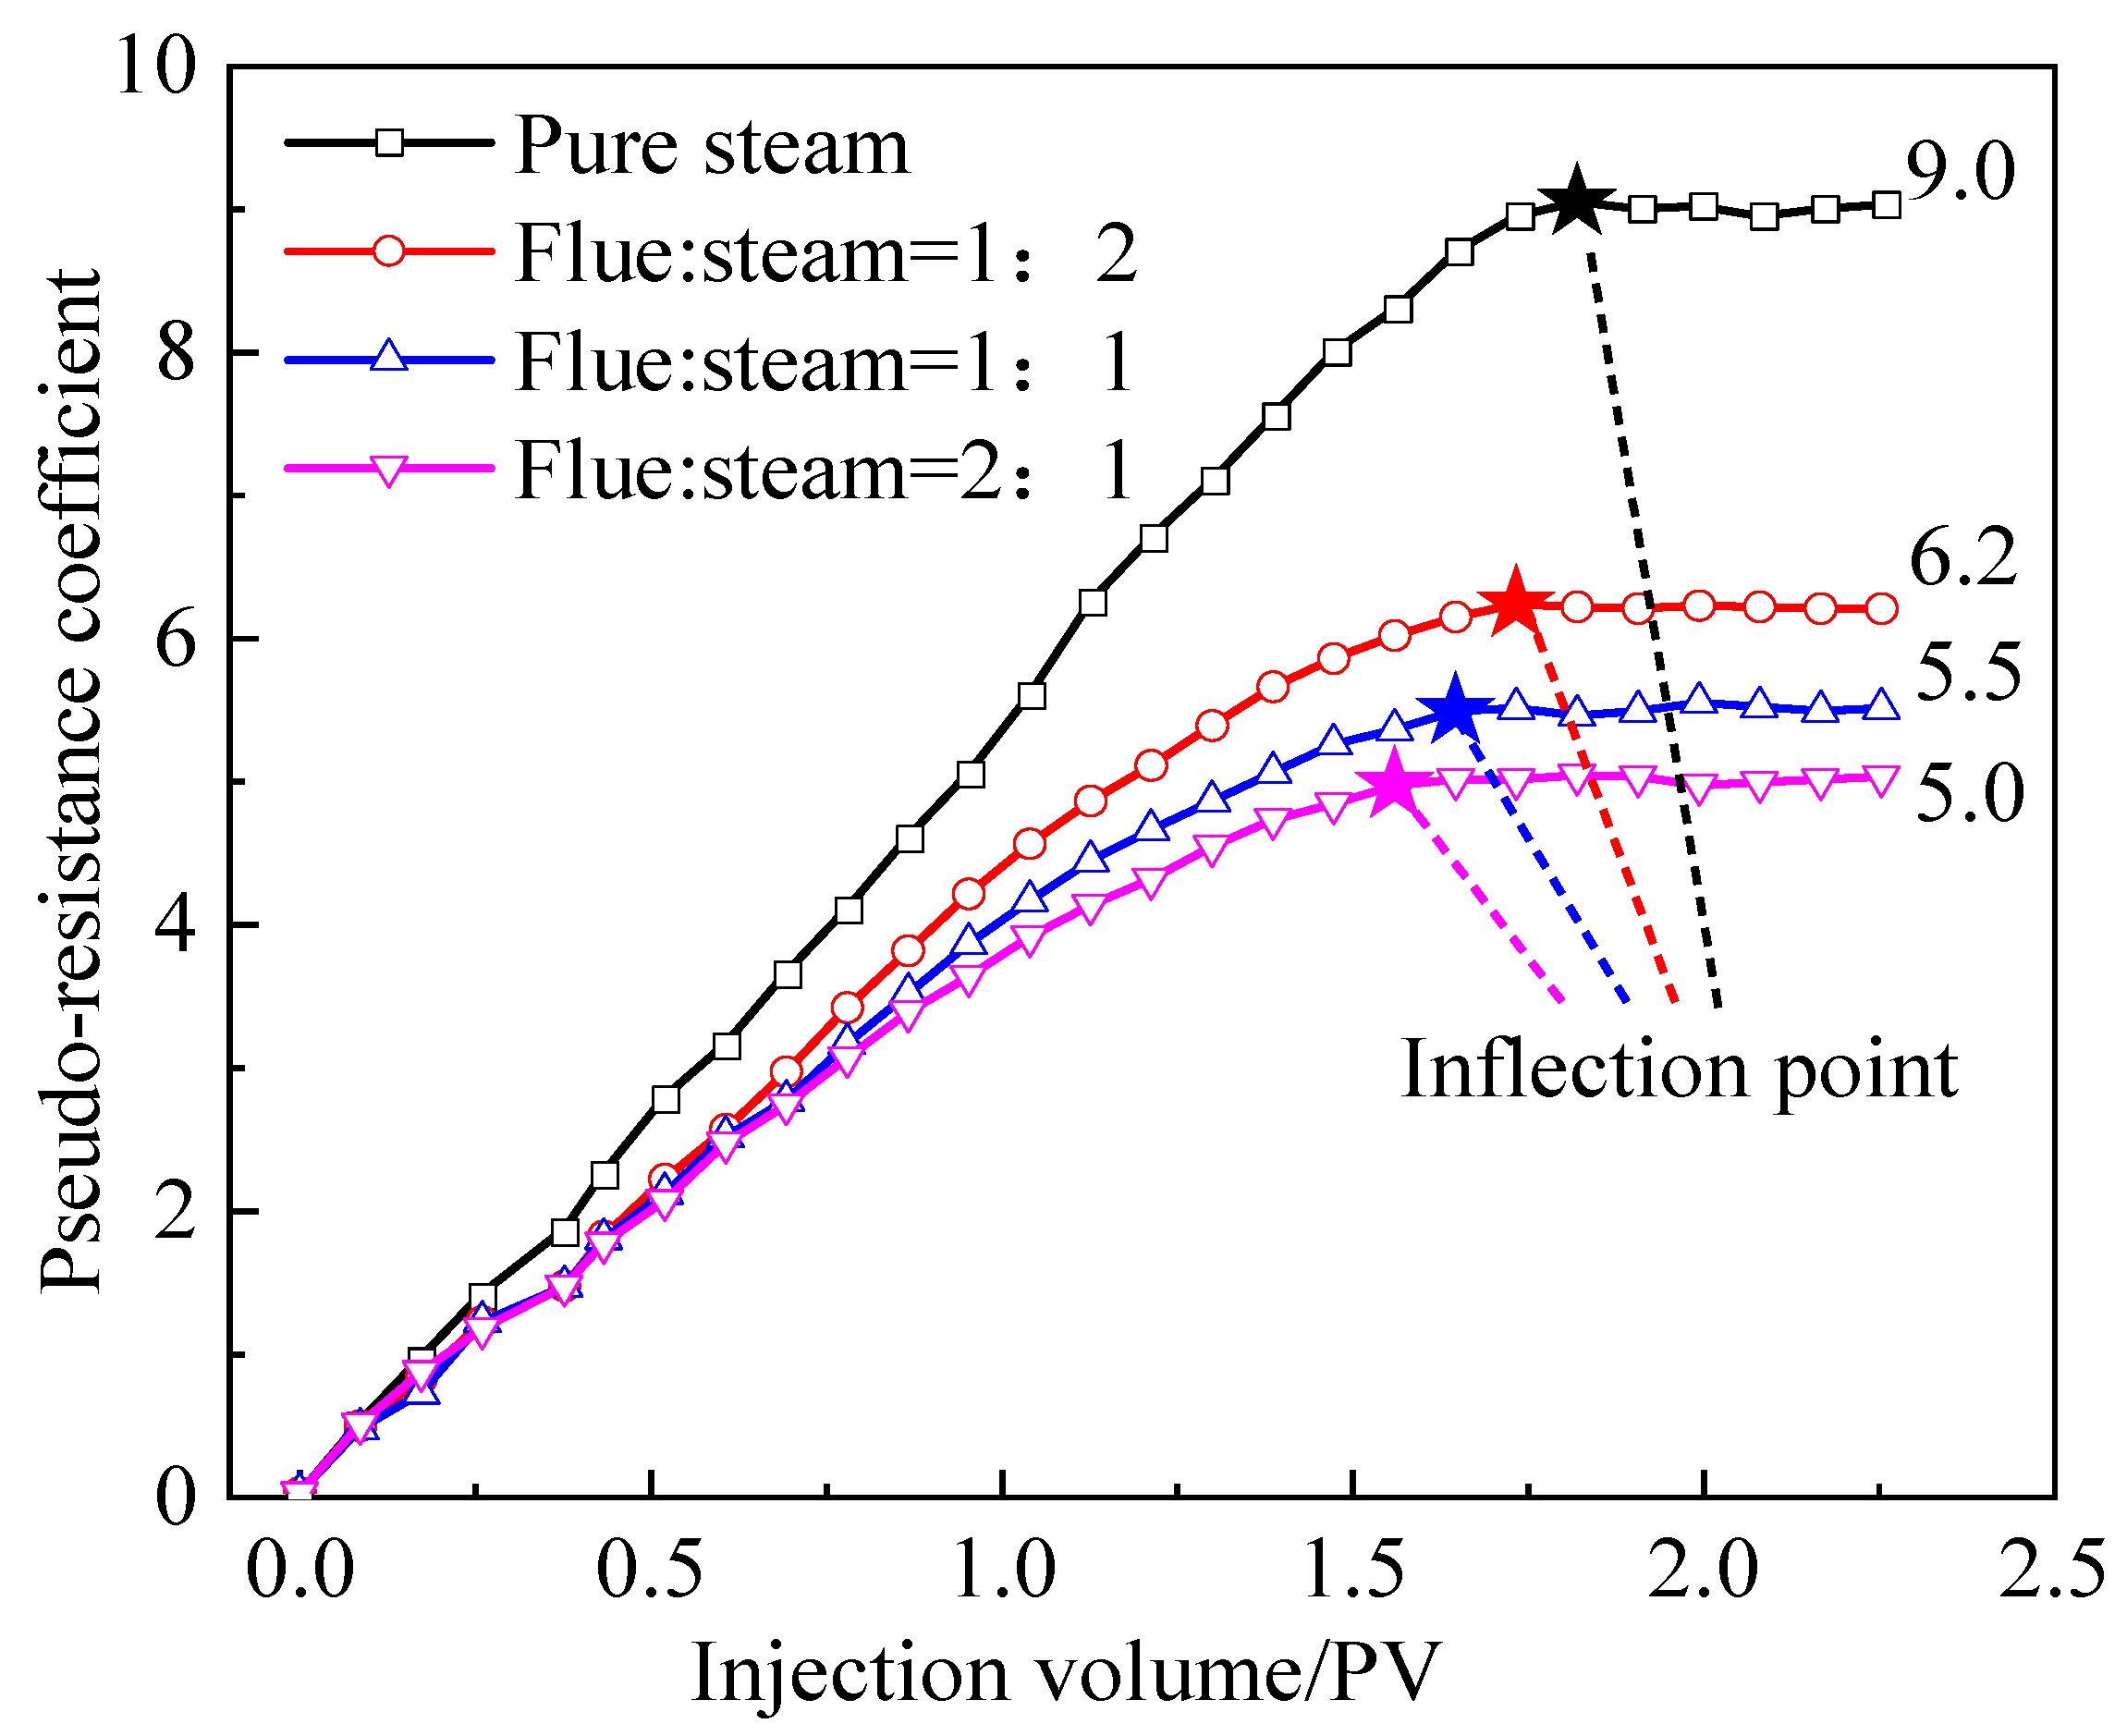
3.1. Flow Capacity and Heat Transfer Effect
3.2. Microscopic Flow Characteristics
3.2.1. Oil Displacement Dynamics and Sweep Variation
3.2.2. Flow Characteristics
4. Conclusions
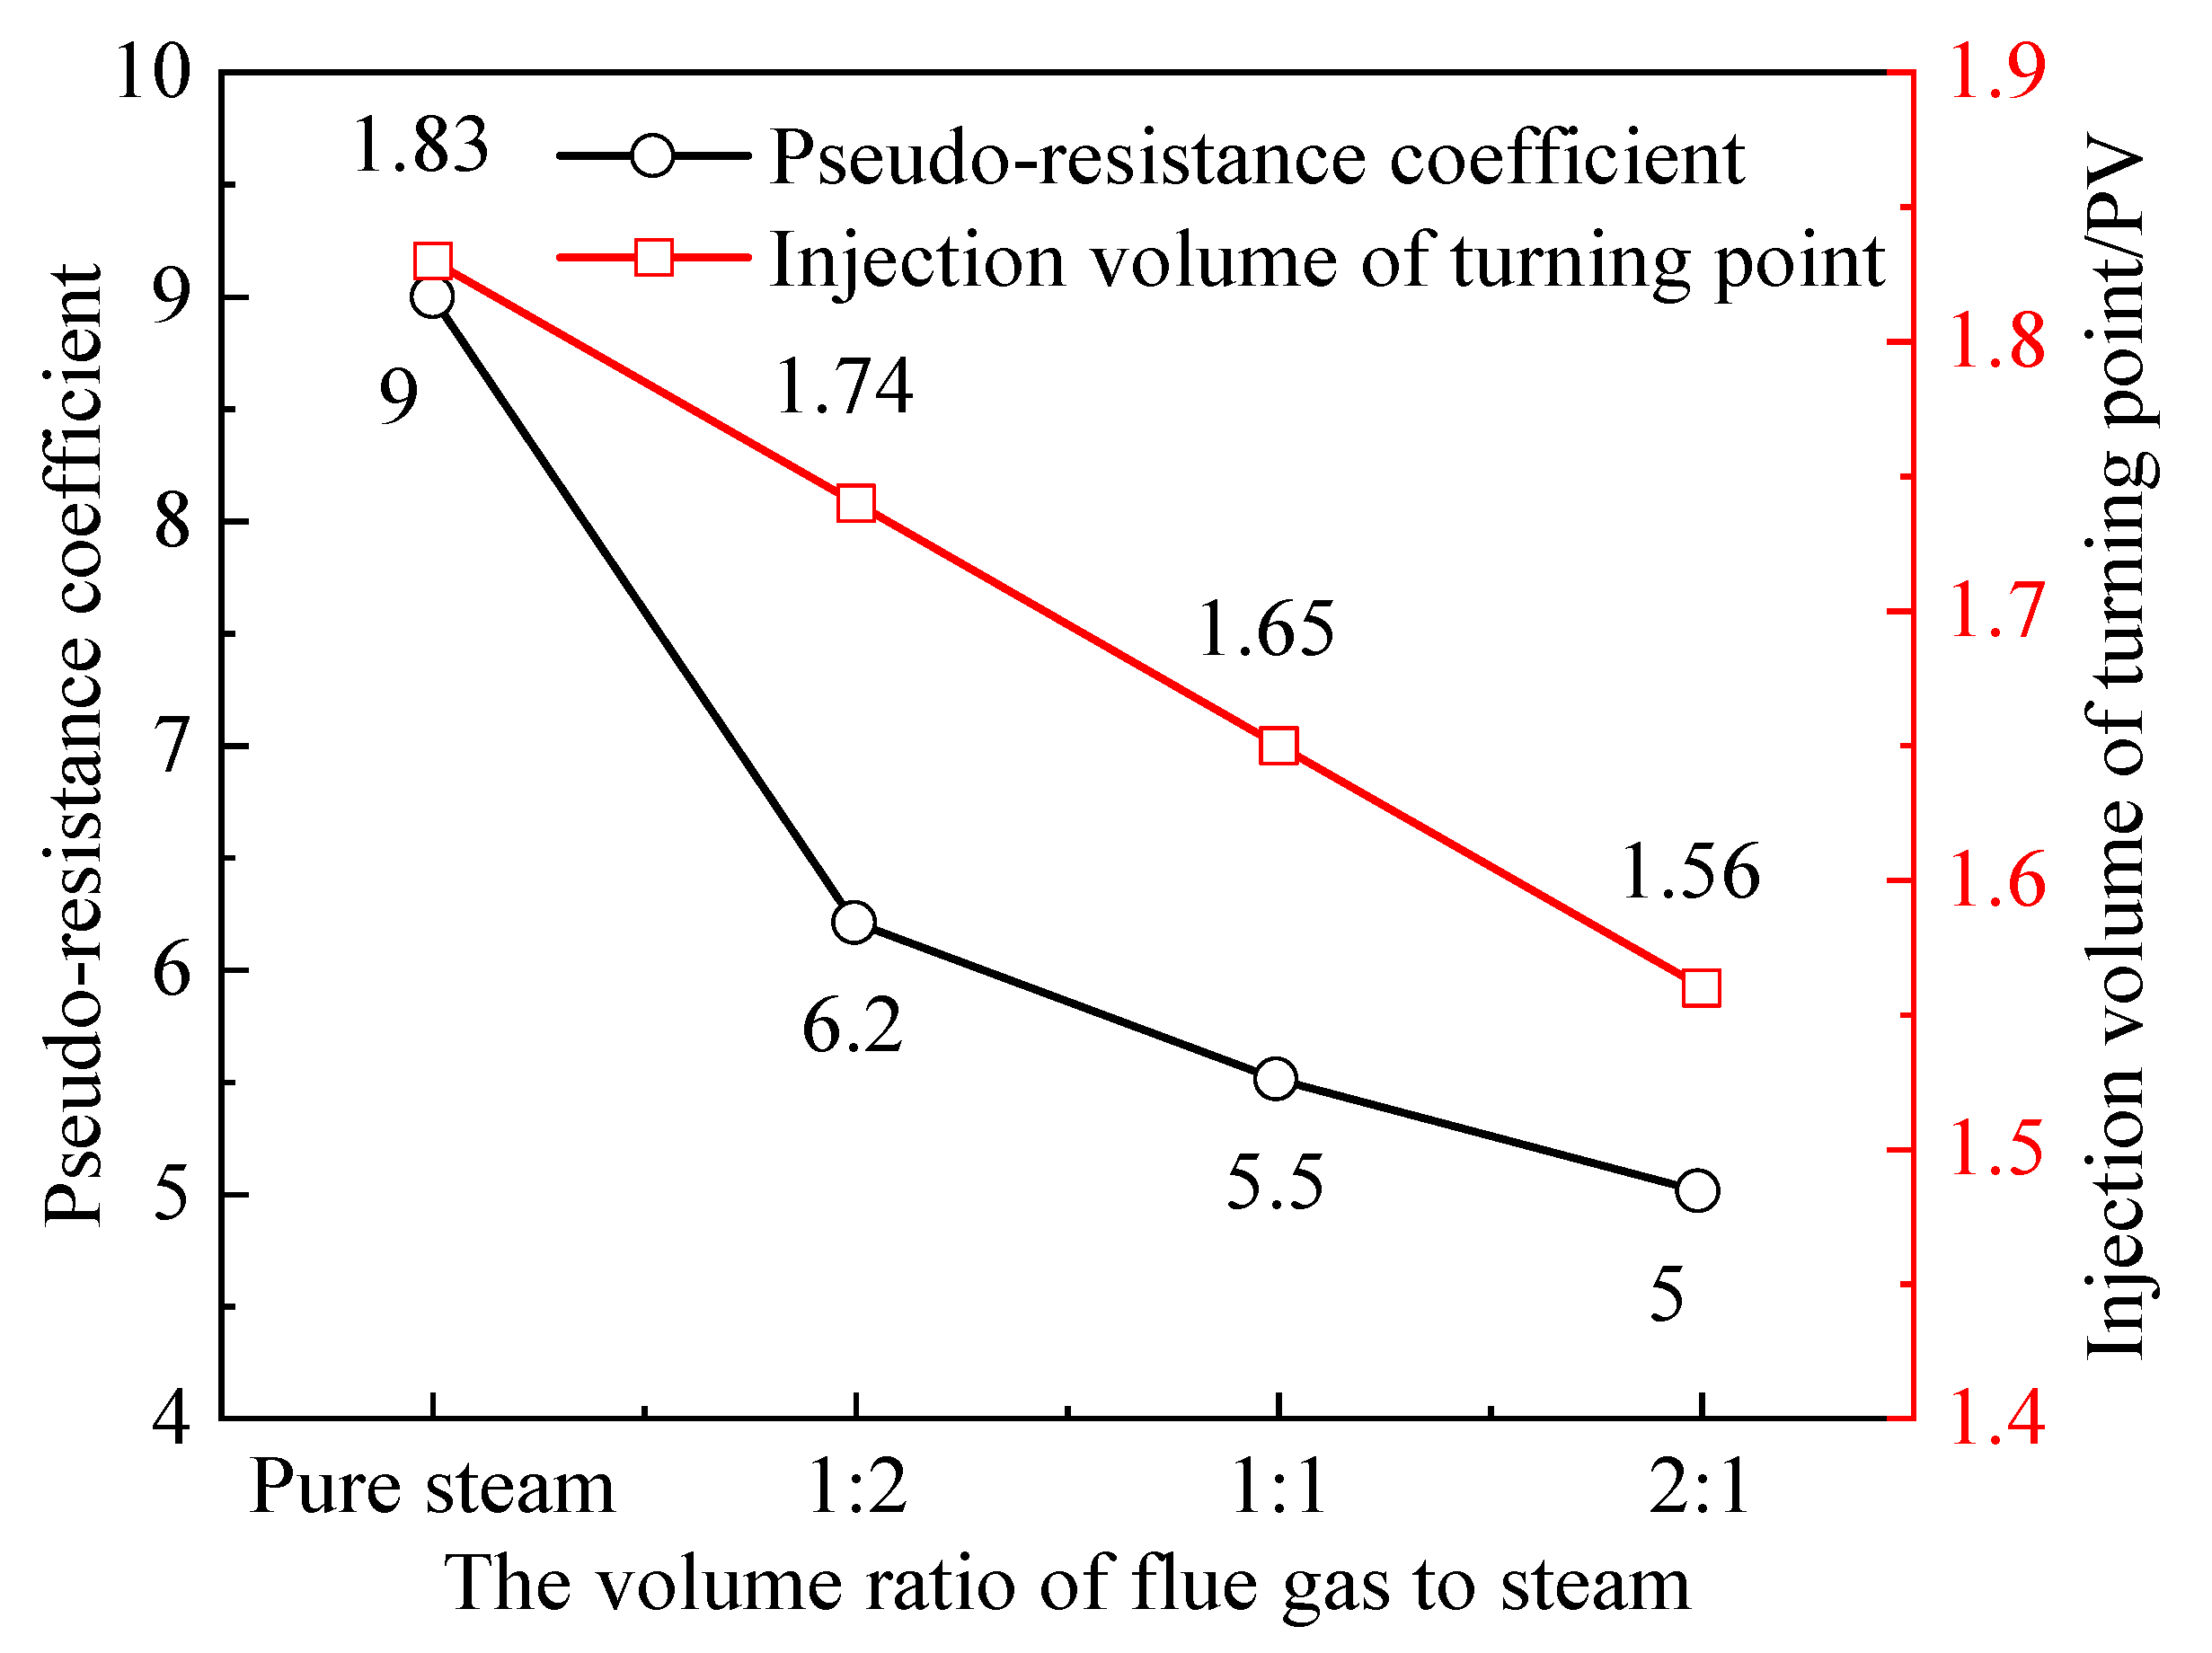
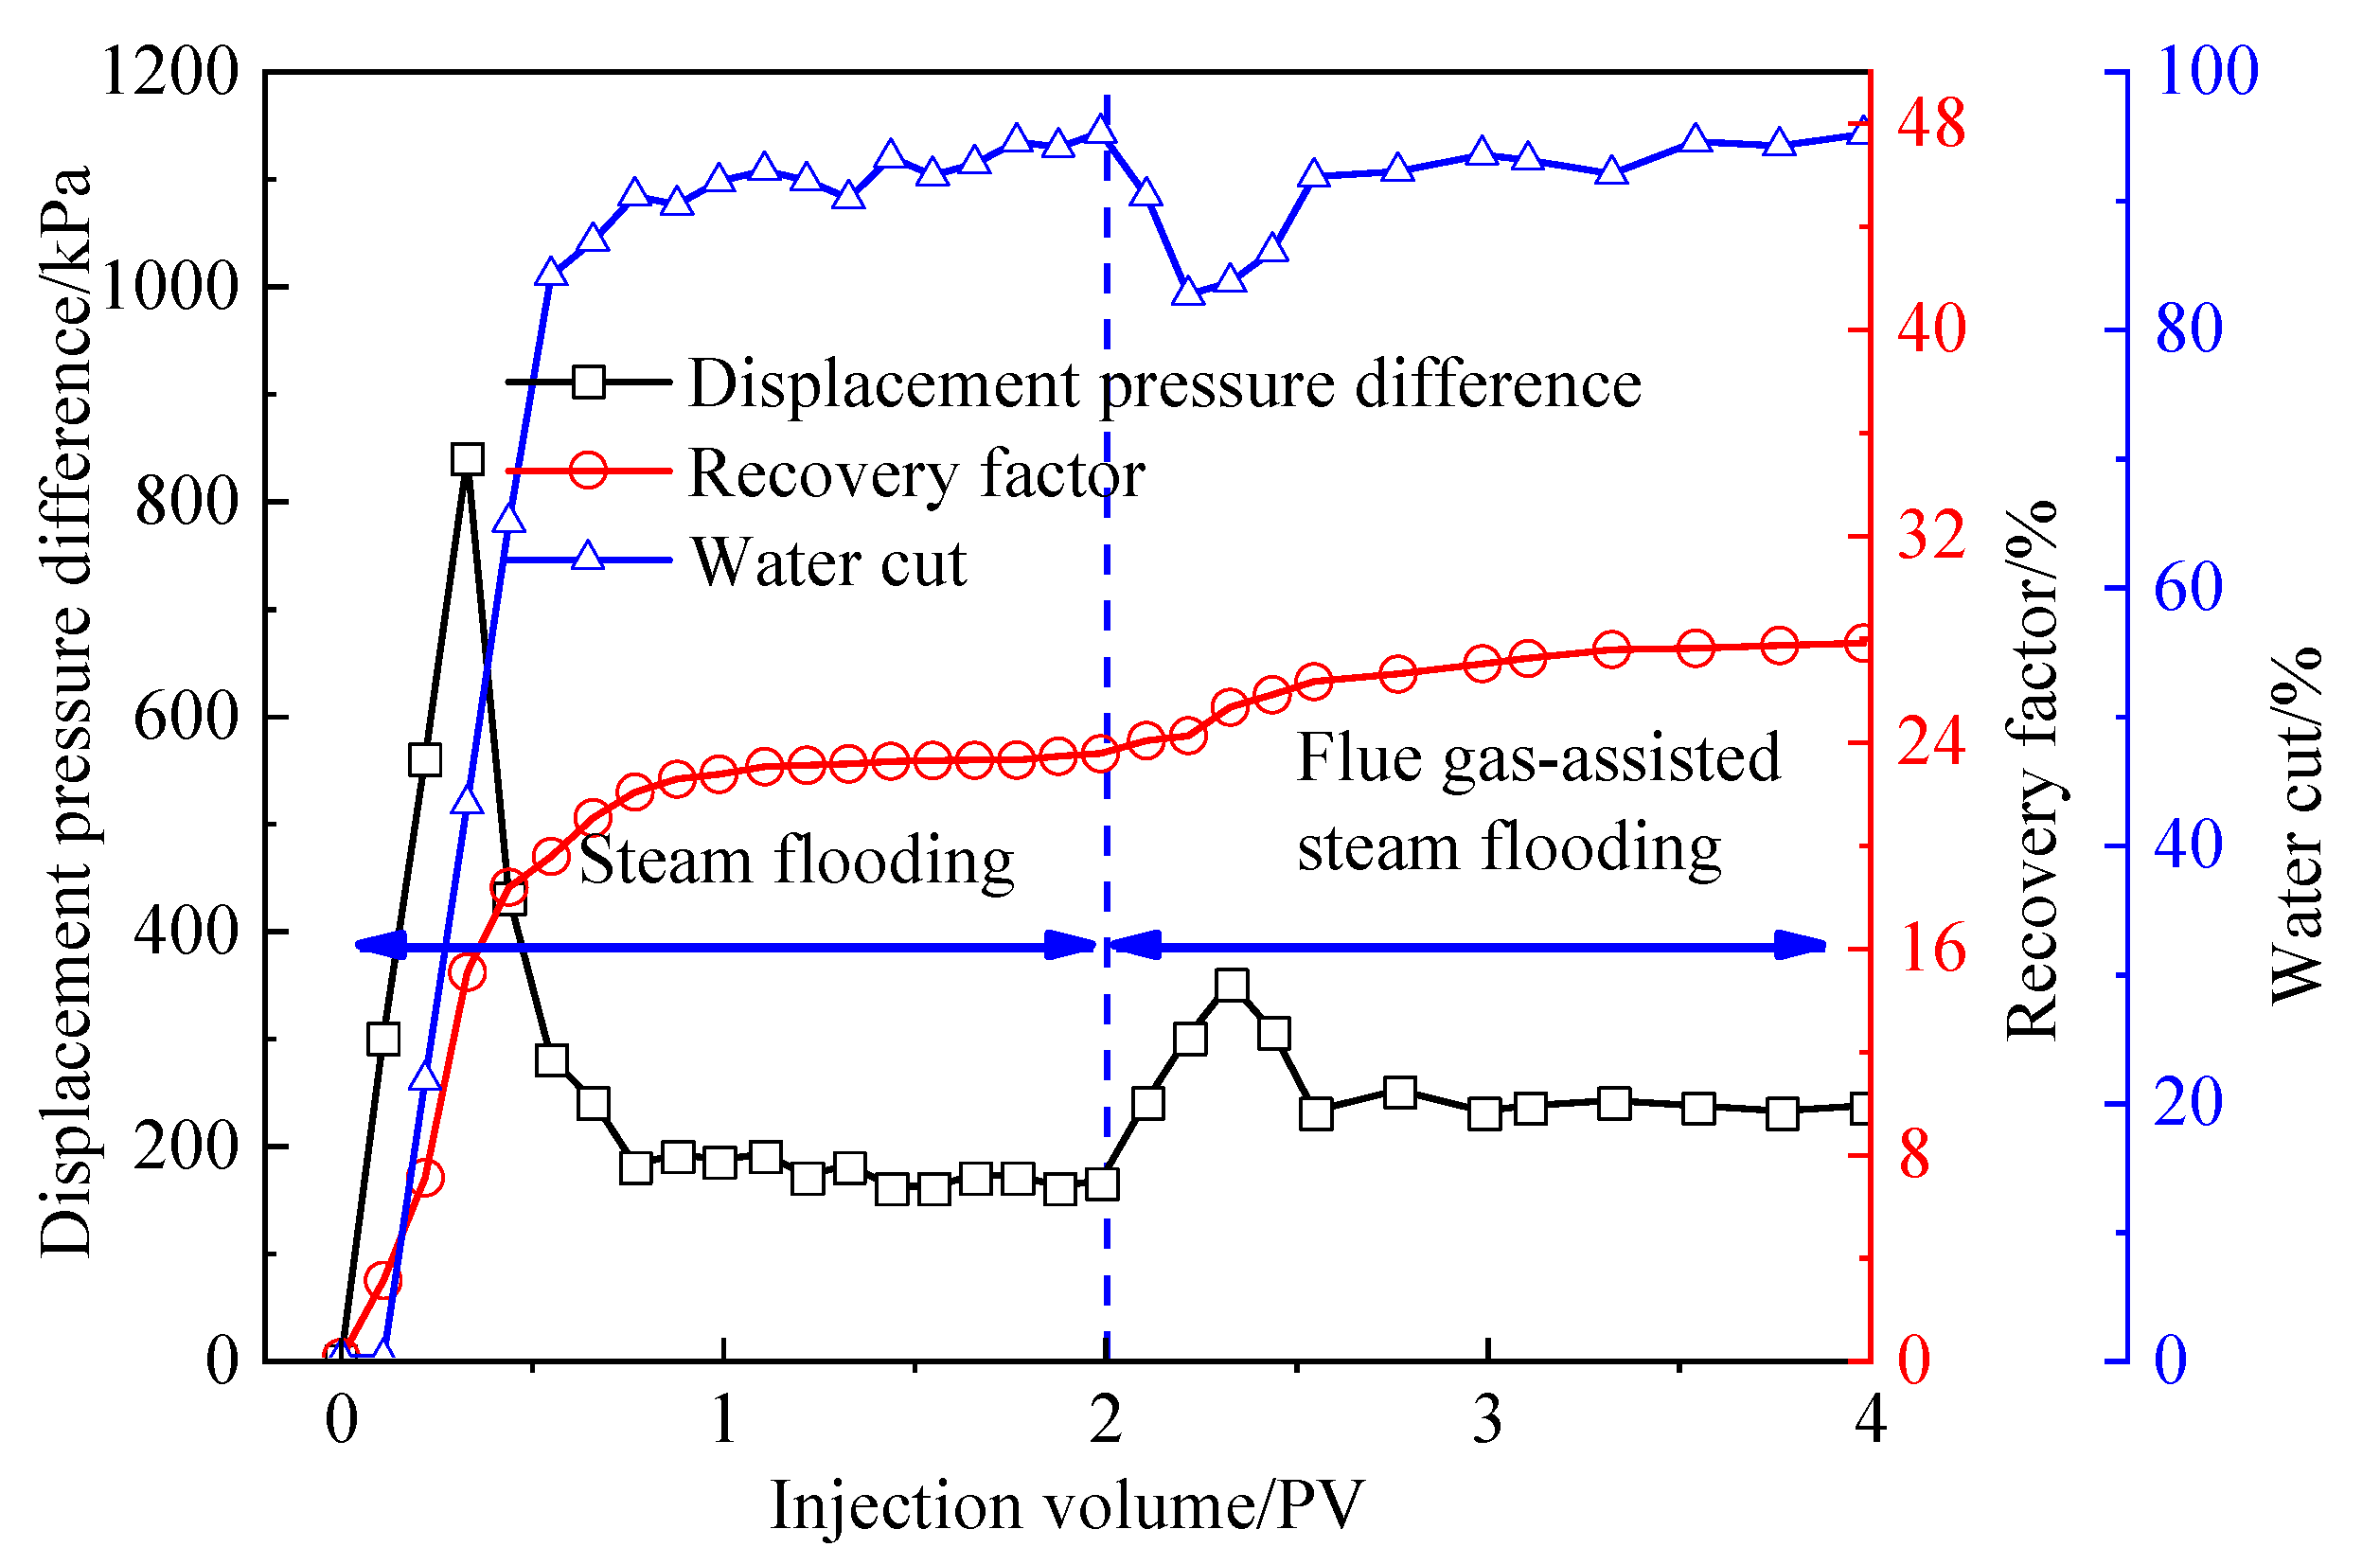
- The flue gas could reduce the flow resistance of steam whilst accelerating its flow. Compared with pure steam, the flow rate of flue gas to steam with a volume ratio of 1:2 was reduced by 2.8 and the stabilization time was advanced by 0.09 PV. This phenomenon intensified as the proportion of flue gas increased.
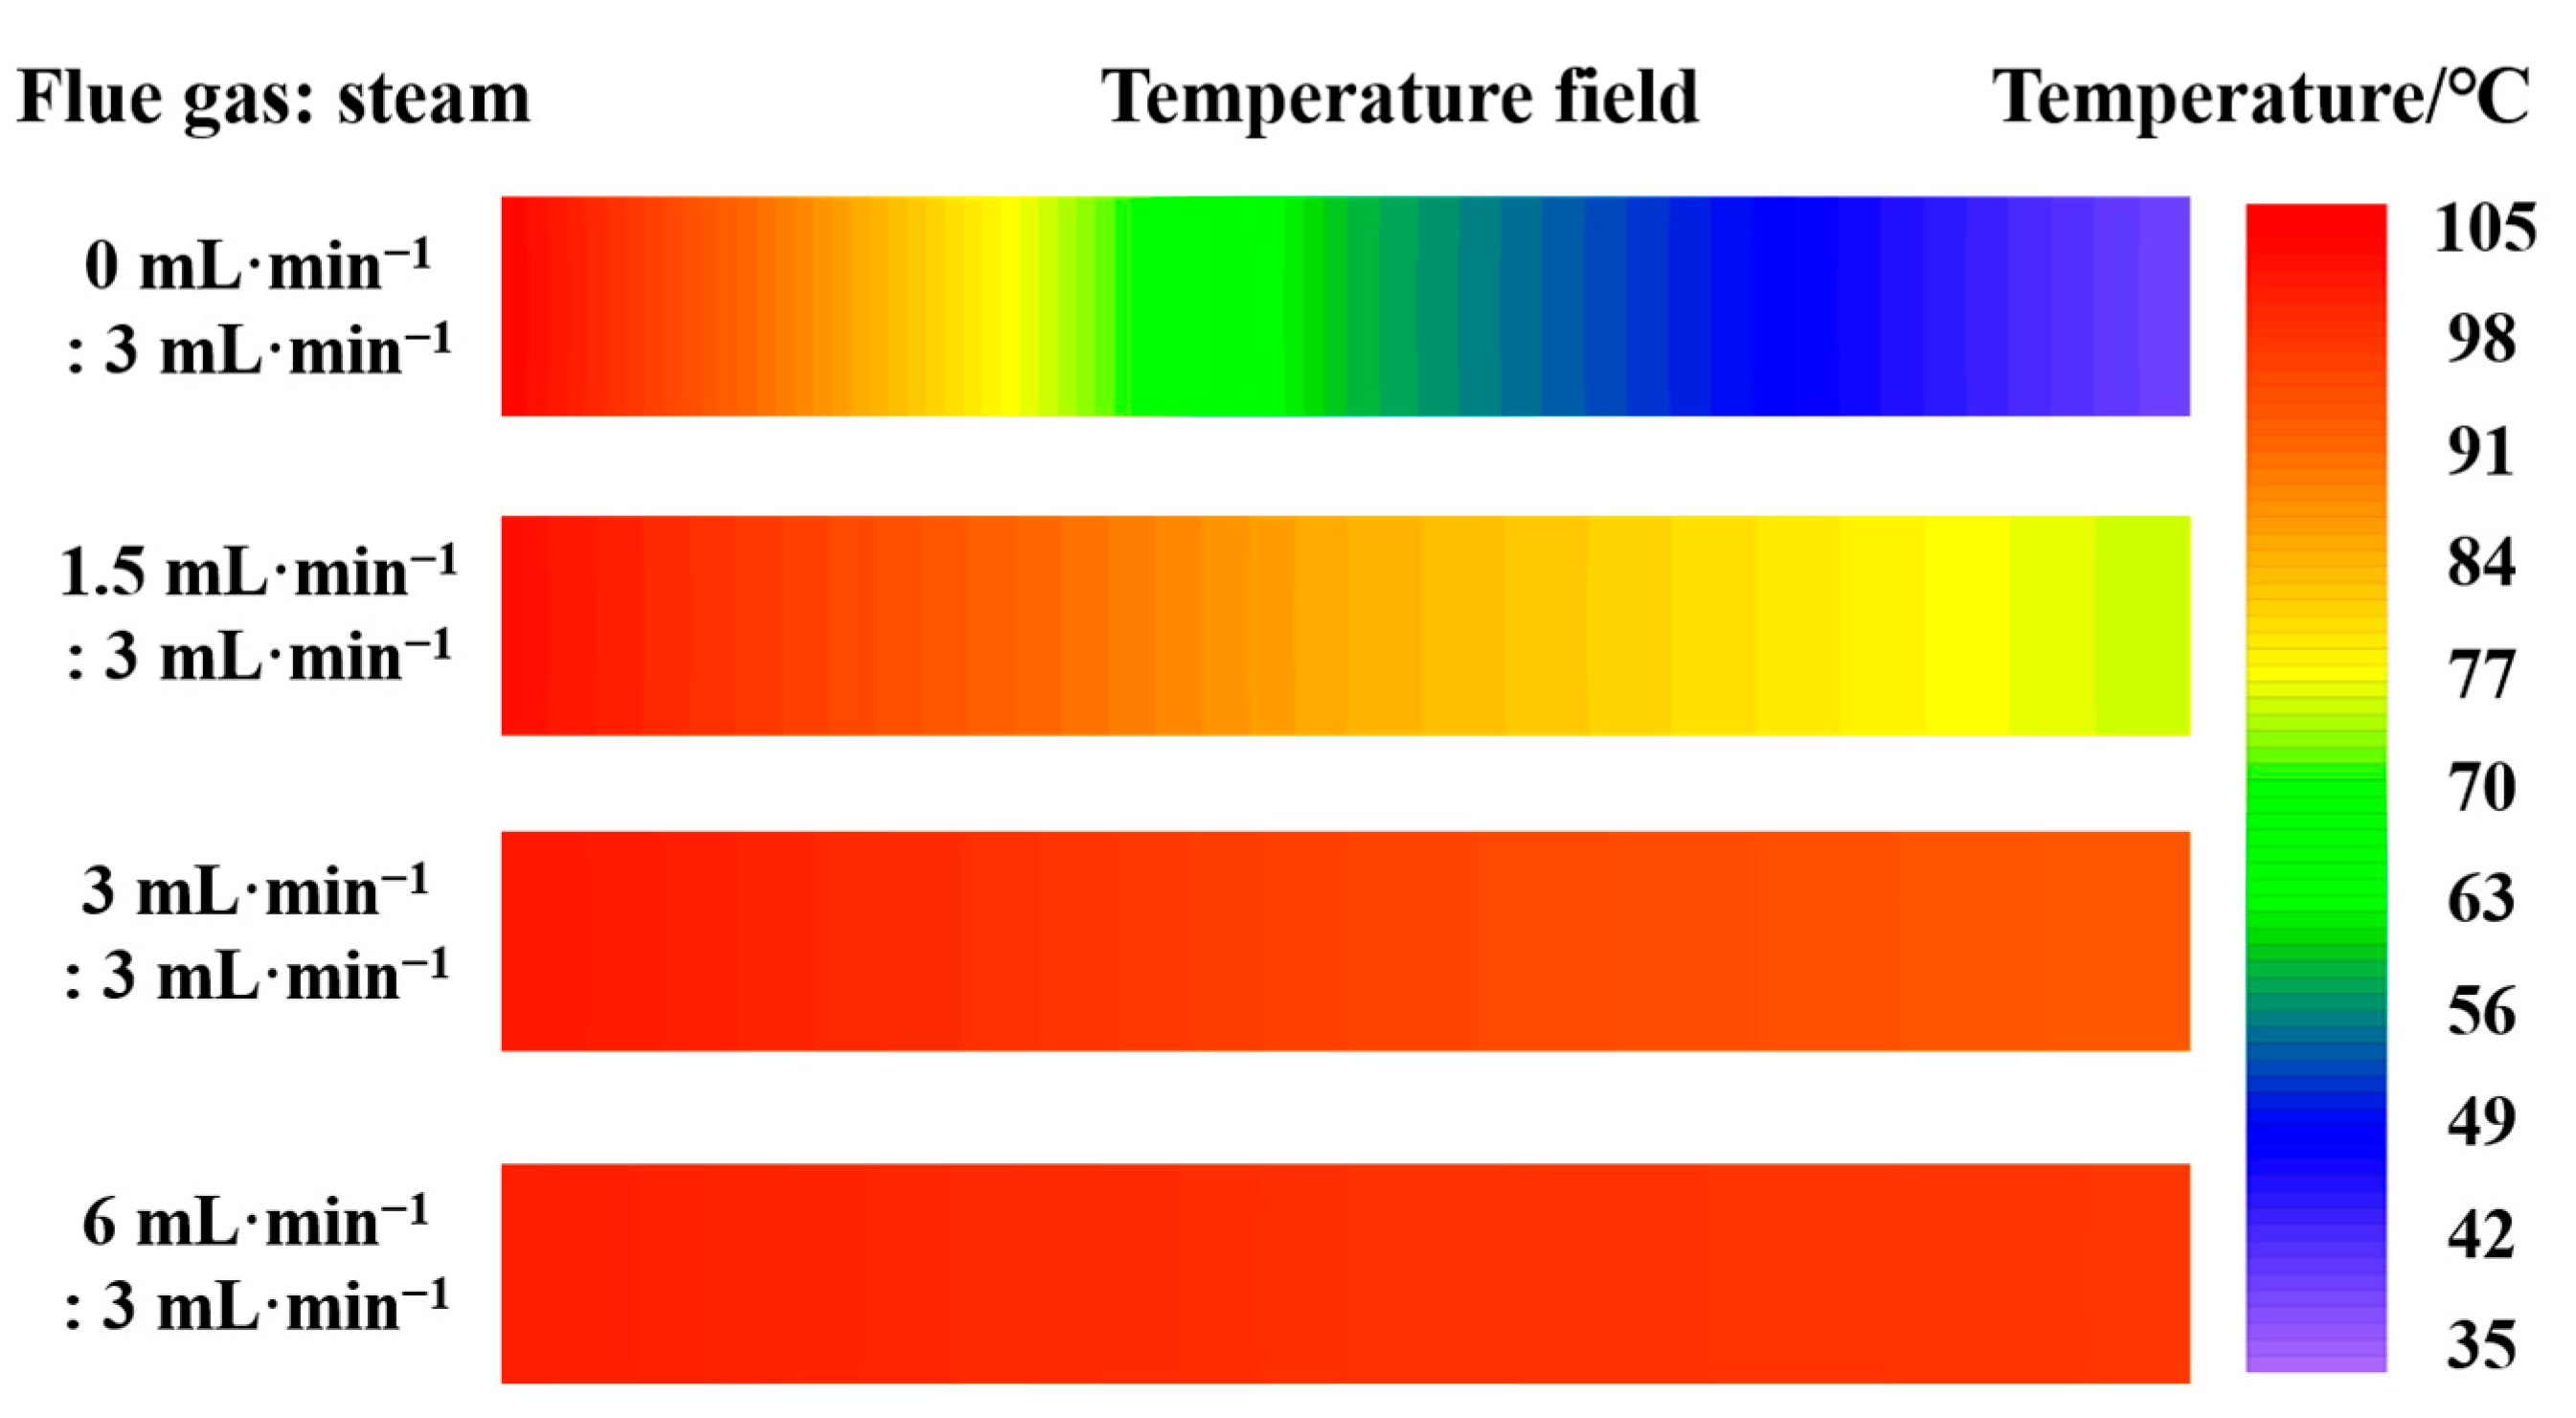
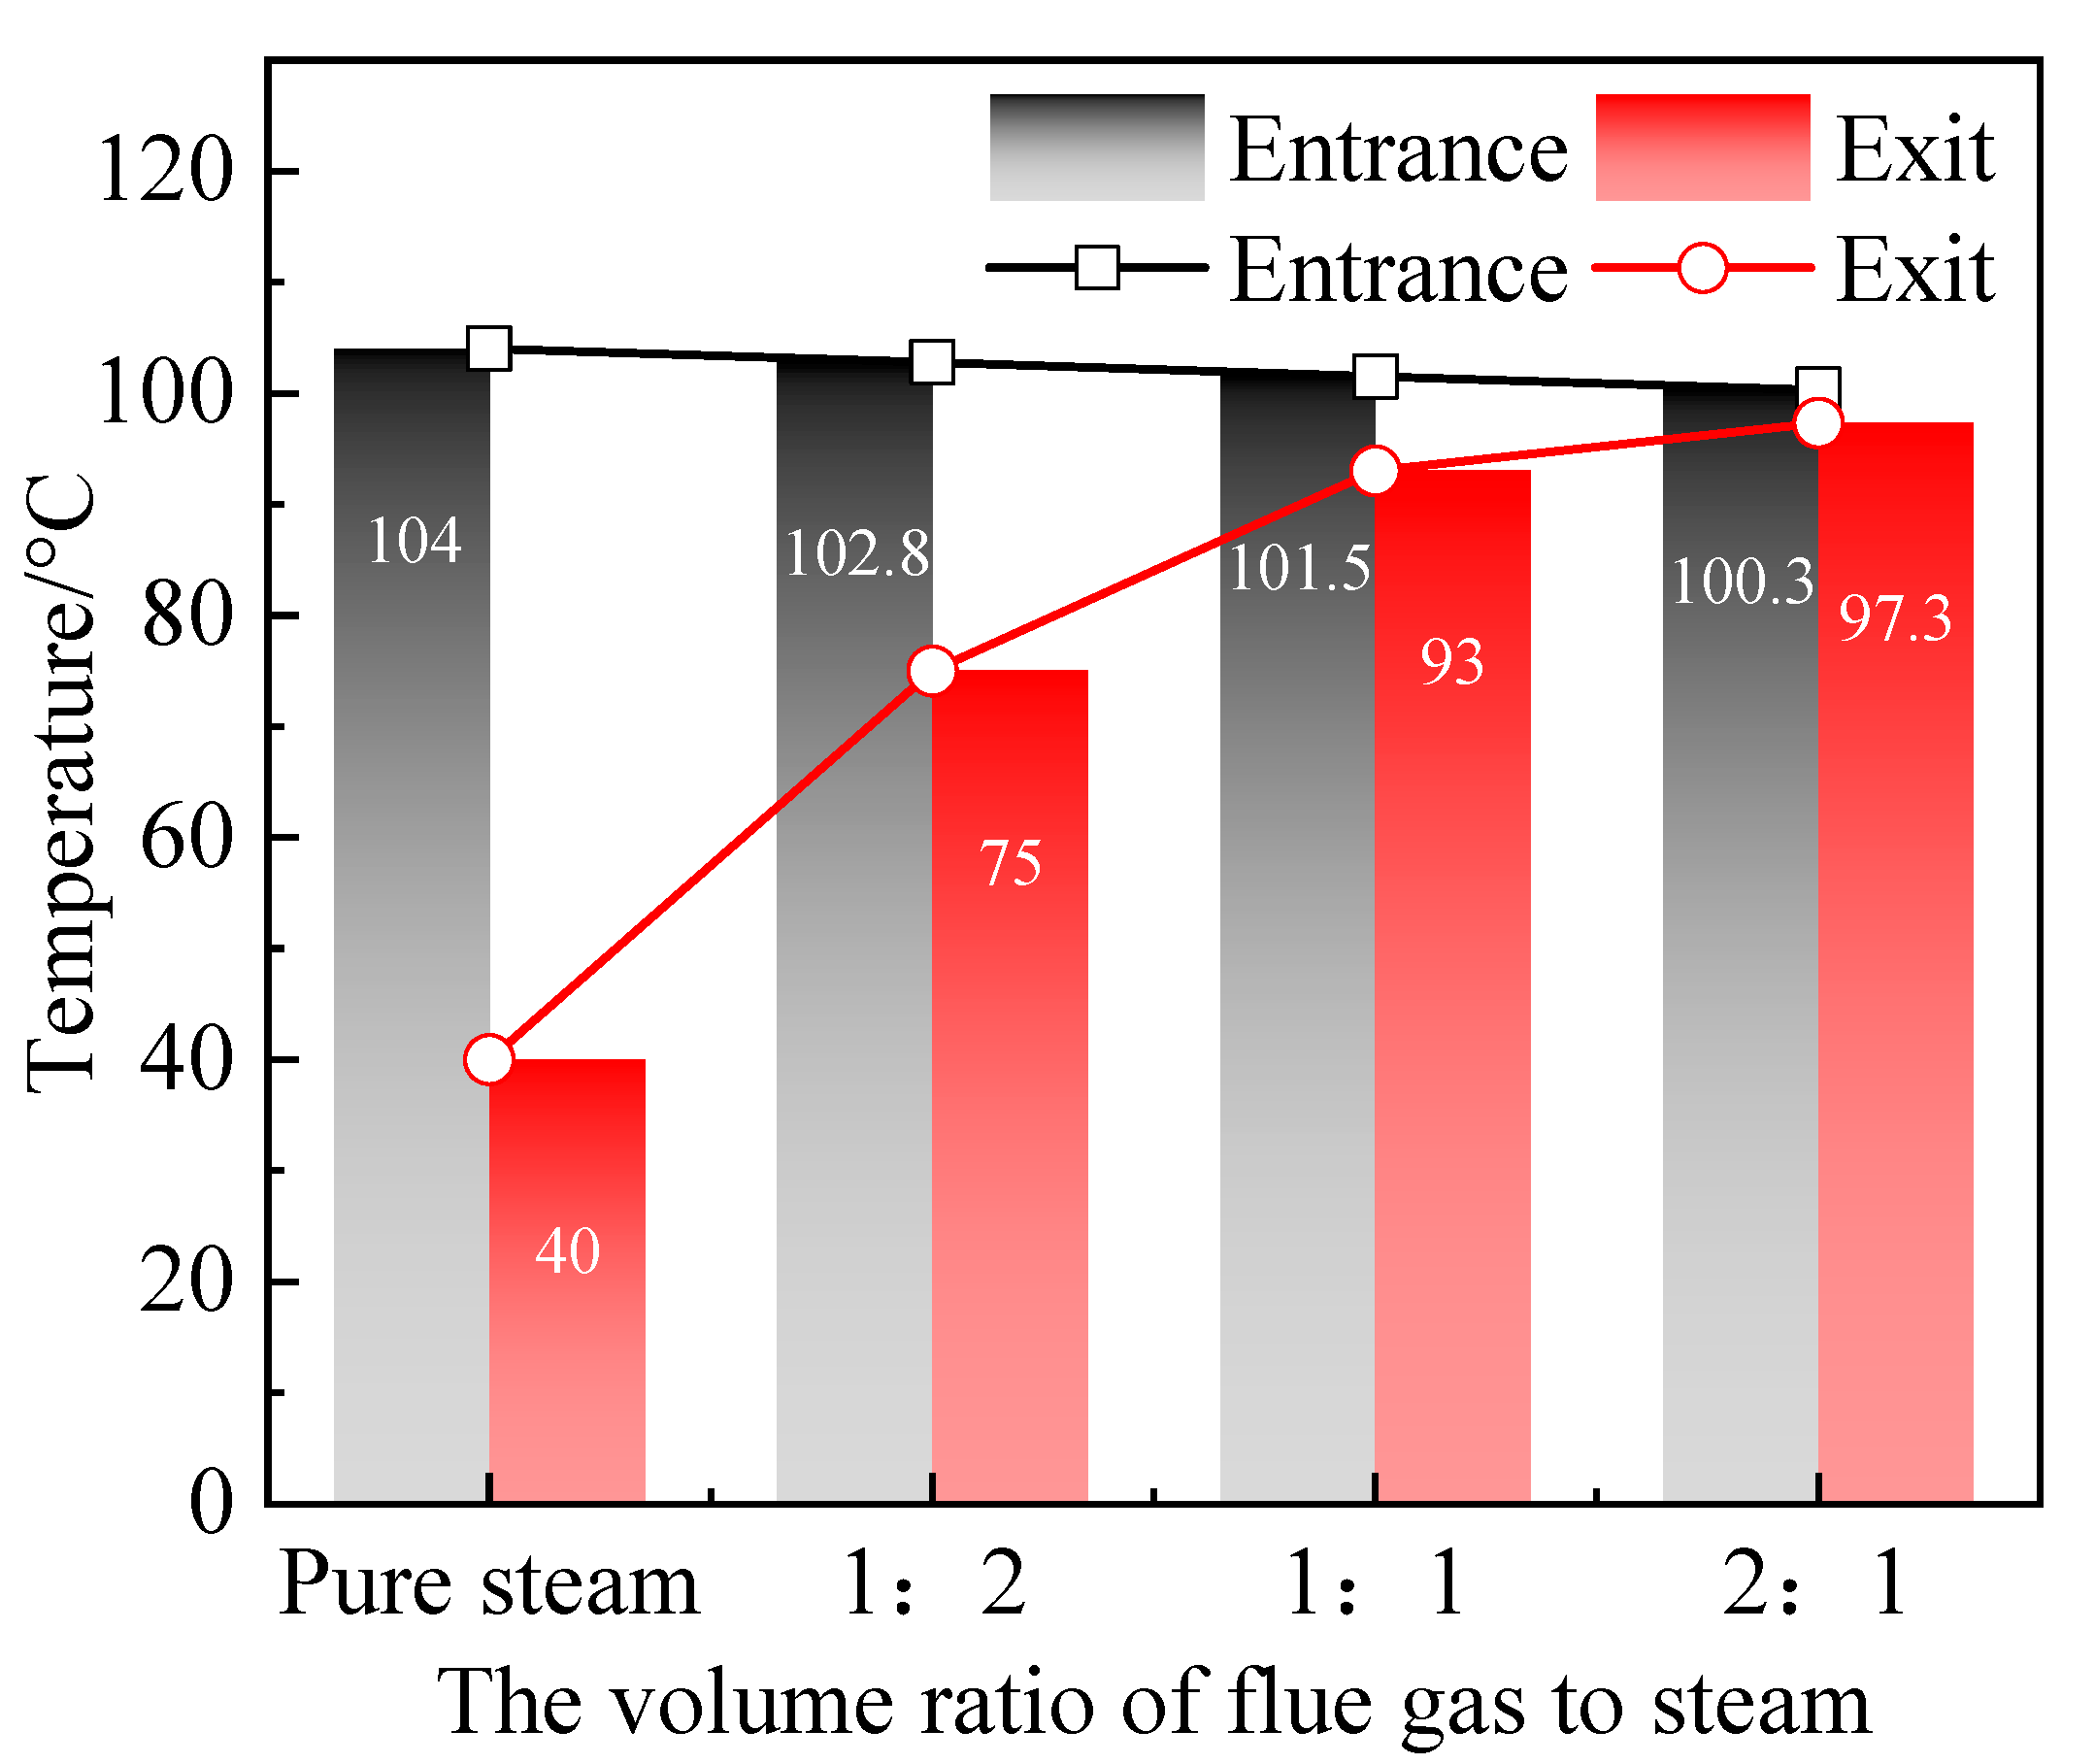
- The fingering effect of the flue gas could promote the steam flow, make the steam reach the deep part of the sandpack faster, reduce the heat loss along the way, and thus transfer more heat to the deep part of the model. When the volume ratio of flue gas to steam was 2:1, the temperature at the outlet of the model increased by 57.3 °C compared with pure steam.
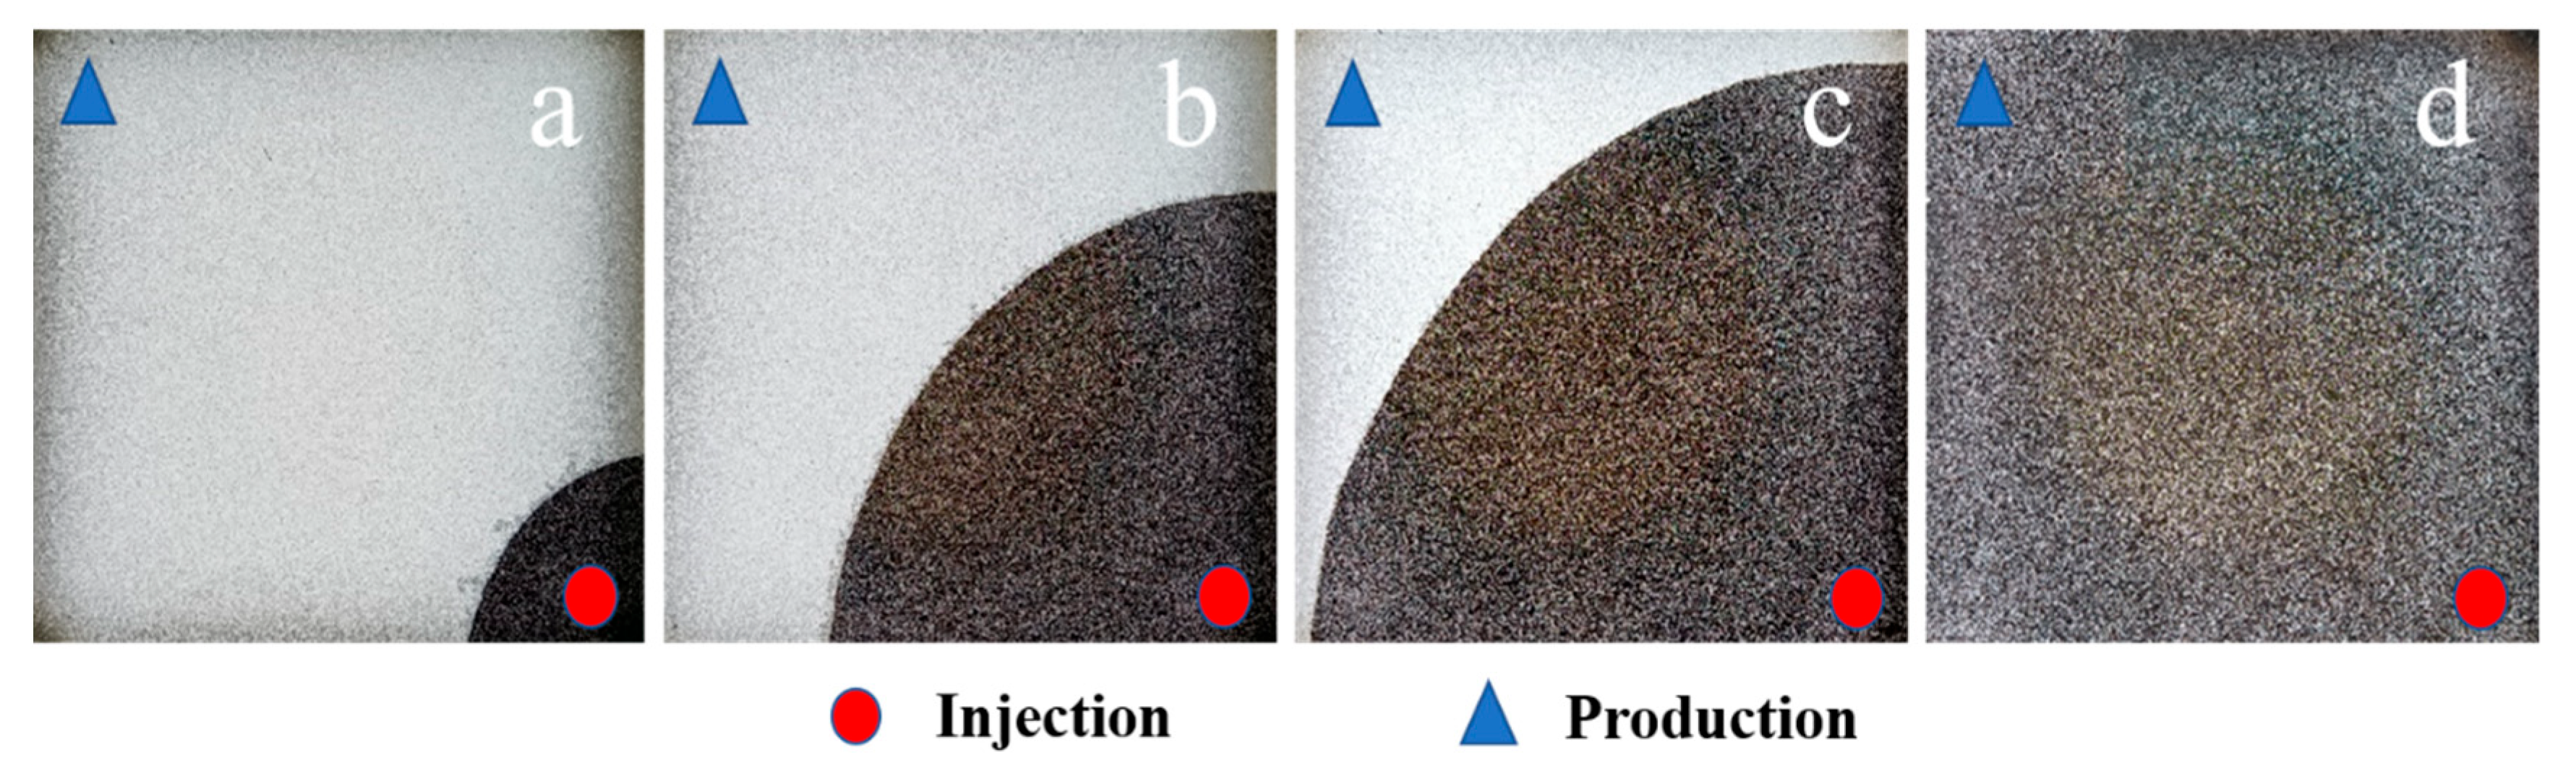
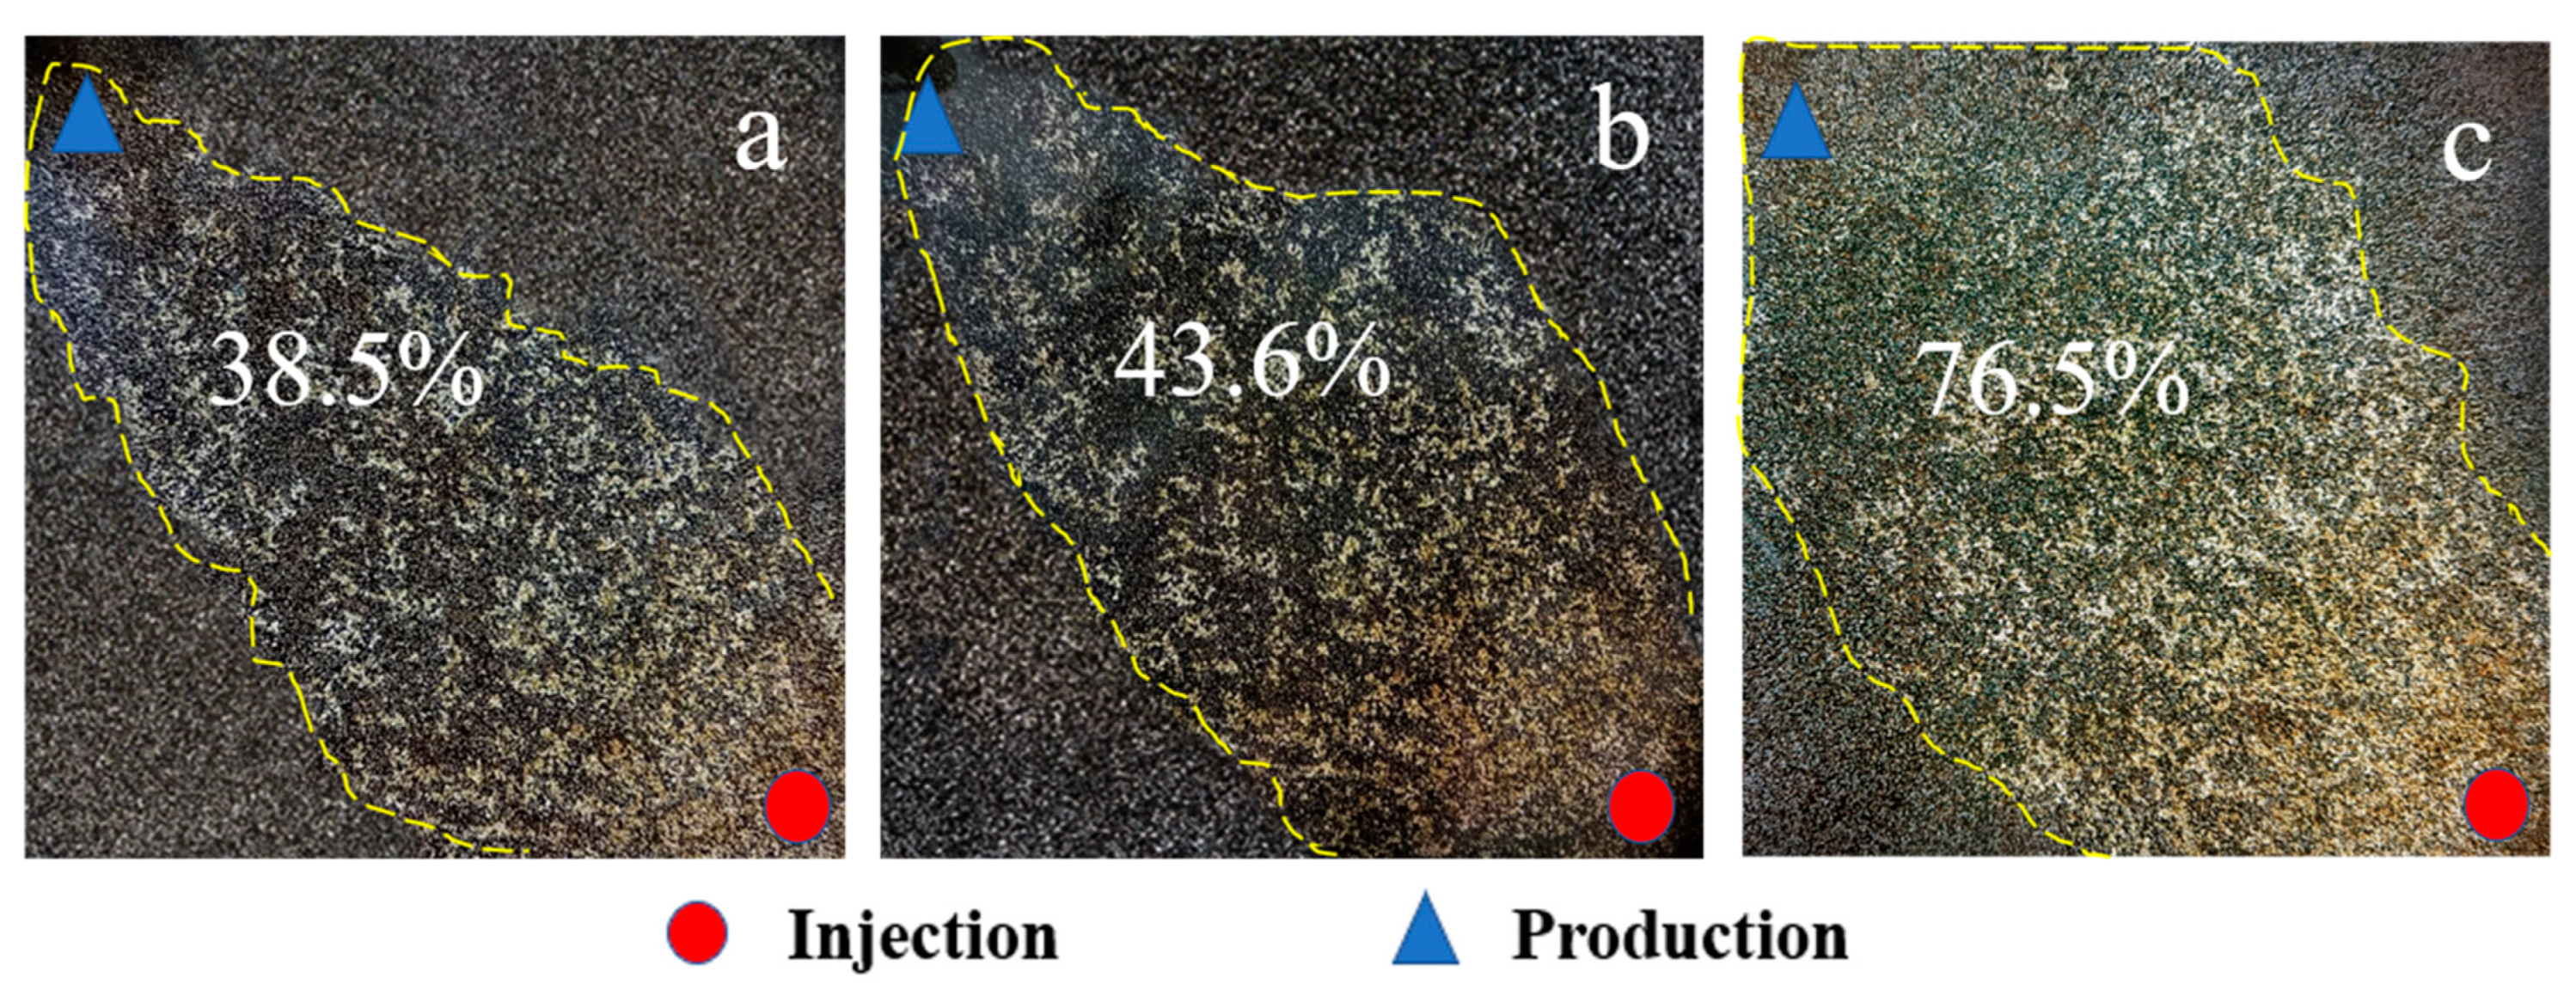
- Due to the expansion of fluid channels, the flow of flue gas foam, and the effective utilization of blocky remaining oil and corner remaining oil during the dissolution and release of flue gas in heavy oil, the recovery and sweep efficiency of the flue gas and steam mixed injection increased by 4.7% and 32.9%, respectively, compared with the pure steam injection stage.
Author Contributions
Funding
Data Availability Statement
Conflicts of Interest
References
- Briggs, P.; Baron, P.; Fulleylove, R.; Wright, M. Development of heavy-oil reservoirs. J. Pet. Sci. Eng. 1988, 40, 206–214. [Google Scholar] [CrossRef]
- Santos, R.; Loh, W.; Bannwart, A.; Trevisan, O. An overview of heavy oil properties and its recovery and transportation methods. Braz. J. Chem. Eng. 2014, 31, 571–590. [Google Scholar] [CrossRef]
- Langevin, D.; Poteau, S.; Hénaut, I.; Argillier, J. Crude oil emulsion properties and their application to heavy oil transportation. Oil Gas Sci. Technol. 2004, 59, 511–521. [Google Scholar] [CrossRef]
- Wilson, R.; Mercier, P.H.; Patarachao, B.; Navarra, A. Partial least squares regression of oil sands processing variables within discrete event simulation digital twin. Minerals 2021, 11, 689. [Google Scholar] [CrossRef]
- Liu, Z.; Wang, H.; Blackbourn, G.; Ma, F.; He, Z.; Wen, Z.; Wang, Z.; Yang, Z.; Luan, T.; Wu, Z. Heavy oils and oil sands: Global distribution and resource assessment. Acta Geol. Sin. 2019, 93, 199–212. [Google Scholar] [CrossRef]
- Zyrin, V.; Ilinova, A. Ecology safety technologies of unconventional oil reserves recovery for sustainable oil and gas industry development. J. Ecol. Eng. 2016, 17, 35–40. [Google Scholar] [CrossRef]
- Altunina, L.; Kuvshinov, V.; Stasyeva, L.; Kuvshinov, I. Trends and prospects of physicochemical methods for enhanced oil recovery of heavy oil fields. Chem. Sustain. Dev. 2018, 26, 240–255. [Google Scholar] [CrossRef]
- Zhao, D.; Wang, J.; Gates, I.D. Thermal recovery strategies for thin heavy oil reservoirs. Fuel 2014, 117, 431–441. [Google Scholar] [CrossRef]
- Nasr, T.N.; Ayodele, O.R. Thermal Techniques for the Recovery of Heavy Oil and Bitumen. In Proceedings of the SPE International Improved Oil Recovery Conference in Asia Pacific, Kuala Lumpur, Malaysia, 5–6 December 2005. SPE-97488-MS. [Google Scholar]
- Guo, K.; Li, H.; Yu, Z. In-situ heavy and extra-heavy oil recovery: A review. Fuel 2016, 185, 886–902. [Google Scholar] [CrossRef]
- Xu, A.; Meng, L.; Fan, Z.; Zhao, L. New findings on heatloss of superheated steam transmitted along the wellbore and heating enhancement in heavy oil reservoirs. In Proceedings of the International Petroleum Technology Conference, Beijing, China, 26–28 March 2013. IPTC-16439-MS. [Google Scholar]
- Cao, Y.; Liu, D.; Zhang, Z.; Wang, S.; Wang, Q.; Xia, D. Steam channeling control in the steam flooding of super heavy oil reservoirs, Shengli Oilfield. Petrol. Explor. Dev. 2012, 39, 785–790. [Google Scholar] [CrossRef]
- Hunter, B.; Buell, R.; Abate, T. Application of a polymer gel system to control steam breakthrough and channeling. In Proceedings of the SPE Western Regional Meeting, Bakersfield, CA, USA, 30 March–1 April 1992. SPE-24031-MS. [Google Scholar]
- Shah, A.; Fishwick, R.; Wood, J.; Leeke, G.; Rigby, S.; Greaves, M. A review of novel techniques for heavy oil and bitumen extraction and upgrading. Energ Environ. Sci. 2010, 3, 700–714. [Google Scholar] [CrossRef]
- Canbolat, S.; Akin, S.; Kovscek, A. Noncondensable gas steam-assisted gravity drainage. J. Petrol. Sci. Eng. 2004, 45, 83–96. [Google Scholar] [CrossRef]
- Huang, Y.; Xiao, W.; Chen, S.; Li, B.; Du, L.; Li, B. A Study on the Adaptability of Nonhydrocarbon Gas-Assisted Steam Flooding to the Development of Heavy Oil Reservoirs. Energies 2022, 15, 4805. [Google Scholar] [CrossRef]
- Fan, J.; Yang, J.; Fan, X.; Wu, L. Experimental study on the mechanism of enhanced oil recovery by non-condensable gas-assisted steam flooding process in extra-heavy oil reservoir. Energy Sources Part A 2021, 43, 444–460. [Google Scholar] [CrossRef]
- Monte-Mor, L.; Laboissiere, P.; Trevisan, O. Laboratory study on steam and flue gas co-injection for heavy oil recovery. In Proceedings of the SPE Heavy Oil Conference-Canada, Calgary, AB, Canada, 11–13 June 2013. SPE-165523-MS. [Google Scholar]
- Srivastava, R.; Huang, S.; Dong, M. Comparative effectiveness of CO2, produced gas, and flue gas for enhanced heavy-oil recovery. SPE Reserv. Eval. Eng. 1999, 2, 238–247. [Google Scholar] [CrossRef]
- Nasr, T.; Prowse, D.; Frauenfeld, T. The Use of Flue Gas with Steam in Bitumen Recovery from Oil Sands. J. Can. Pet. Technol. 1987, 26, 5–9. [Google Scholar] [CrossRef]
- Wang, Z.; Li, Z.; Lu, T.; Yuan, Q.; Yang, J.; Wang, H.; Wang, S. Research on enhancing heavy oil recovery mechanism of flue gas assisted steam flooding. In Proceedings of the Carbon Management Technology Conference, Houston, TX, USA, 17–20 July 2017. CMTC-486093-MS. [Google Scholar]
- Lu, T.; Ban, X.; Li, Z.; Gao, Y.; Guo, E.; Yang, J.; Ma, H.; Wang, H.; Wei, Y. Mechanisms on expansion of SAGD steam chamber assisted by flue gas. Acta Pet. Sin. 2021, 42, 1072–1080. [Google Scholar]
- Li, H.; Yang, D.; Tontiwachwuthikul, P. Experimental and theoretical determination of equilibrium interfacial tension for the solvent (s)–CO2–heavy oil systems. Energy Fuels 2012, 26, 1776–1786. [Google Scholar] [CrossRef]
- Hemmati-Sarapardeh, A.; Ayatollahi, S.; Ghazanfari, M.-H.; Masihi, M. Experimental determination of interfacial tension and miscibility of the CO2–crude oil system; temperature, pressure, and composition effects. J. Chem. Eng. Data 2014, 59, 61–69. [Google Scholar] [CrossRef]
- Gajbhiye, R. Effect of CO2/N2 mixture composition on interfacial tension of crude oil. ACS Omega 2020, 5, 27944–27952. [Google Scholar] [CrossRef]
- Chung, F.T.; Jones, R.A.; Nguyen, H.T. Measurements and correlations of the physical properties of CO2-heavy crude oil mixtures. SPE Reserv. Eng. 1988, 3, 822–828. [Google Scholar] [CrossRef]
- Li, S.; Li, B.; Zhang, Q.; Li, Z.; Yang, D. Effect of CO2 on heavy oil recovery and physical properties in huff-n-puff processes under reservoir conditions. J. Energy Resour. Technol. 2018, 140, 072907. [Google Scholar] [CrossRef]
- Jia, B.; Xian, C.; Tsau, J.; Zuo, X.; Jia, W. Status and Outlook of Oil Field Chemistry-Assisted Analysis during the Energy Transition Period. Energy Fuels 2022, 36, 12917–12945. [Google Scholar] [CrossRef]
- Gao, Y.; Liu, S.; Shen, D.; Guo, E.; Bao, Y. Improving oil recovery by adding N2 in SAGD process for super-heavy crude reservoir with top-water. In Proceedings of the SPE Russian Oil and Gas Technical Conference and Exhibition, Moscow, Russia, 28–30 October 2008. SPE-114590-MS. [Google Scholar]
- Cuiyu, M.; Yuetian, L.; Peiqing, L.; Chunhong, W.; Jingli, L. Study on steam huff and puff injection parameters of herringbone well in shallow and thin heavy oil reservoir. Open Pet. Eng. J. 2013, 6, 69–75. [Google Scholar]
- Tao, L.; Li, G.; Li, L.; Shan, J. Research and application of horizontal well infill SAGD development technology for super heavy oil reservoirs. In Proceedings of the SPE Improved Oil Recovery Conference, Virtual. 31 August–4 September 2020. SPE-200389-MS. [Google Scholar]
- Li, Z.; Lin, R. Flow features and heat exchange laws of steam-nitrogen mixture in thermal recovery wellbore. Acta Pet. Sin. 2010, 31, 506–510. [Google Scholar]
- Yu, J.; Li, Y. Progress in gas-water two-phase seepage and its application in water flooding gas reservoirs. J. Southwest Pet. Univ. Sci. Technol. Ed. 2003, 25, 36–39. [Google Scholar]
- Li, Y.; Zhao, D.; Du, D. Computational study on the three phase displacement characteristics of foam fluids in porous media. J. Pet. Sci. Eng. 2022, 215, 110732. [Google Scholar] [CrossRef]
- Lin, Y.; Yang, Q.; Liu, X. Three-phase seepage characteristics of oil, gas and water in low permeability reservoirs. Acta Pet. Sin. 2006, 27, 124–128. [Google Scholar]
- Blunt, M.; Zhou, D.; Fenwick, D. Three-phase flow and gravity drainage in porous media. Transp. Porous Media 1995, 20, 77–103. [Google Scholar] [CrossRef]
- Zhu, S.; Li, Y.; Zhang, R.; Tang, Y.; Qiu, L.; Zhi, X. Experimental study on the condensation characteristics of nitrogen with non-condensable gas. Cryogenics 2019, 98, 29–38. [Google Scholar] [CrossRef]
- Wang, Y.; Wu, X.; Wang, R.; Lai, F. Study on multiple thermal fluid applied in heavy oil development. Metal. Int. 2013, 18, 98–103. [Google Scholar]
- Wang, Y.; Liu, K.; Zhang, B.; Ling, Q. Effect of permeability on foam mobility and flow resistance distribution: An experimental study. Colloids Surf. A 2019, 582, 123769. [Google Scholar] [CrossRef]
- Wang, X.; Chen, J.; Lv, C.; Wei, M. Experimental investigation and evaluation on influence of foam flow resistance in porous media. Environ. Earth Sci. 2015, 74, 5729–5738. [Google Scholar] [CrossRef]
- Yi, Q.; Tian, M.; Yan, W.; Qu, X.; Chen, X. Visualization study of the influence of non-condensable gas on steam condensation heat transfer. Appl. Therm. Eng. 2016, 106, 13–21. [Google Scholar] [CrossRef]
- Zhang, Y.; Zhao, P.; Cai, M.; Lu, F.; Wu, X.; Guo, Z. Occurrence state and forming mechanism of microscopic remaining oil controlled by dynamic and static factors. J. Pet. Sci. Eng. 2020, 193, 107330. [Google Scholar] [CrossRef]
- Sun, H.; Zhao, Y.; Yao, J. Micro-distribution and mechanical characteristics analysis of remaining oil. Petroleum 2017, 3, 483–488. [Google Scholar] [CrossRef]
- Wright, R. Jamin effect in oil production. AAPG Bull. 1933, 17, 1521–1526. [Google Scholar]


| Displacement Mode | Flue Gas to Steam Ratio | Porosity/% | Permeability/10−3 μm2 | Steam Injection Rate (mL·min−1) | Flue Gas Injection Rate (mL·min−1) |
|---|---|---|---|---|---|
| Steam flooding | / | 43.4 | 2661 | 3 | 0 |
| Flue gas-assisted steam flooding | 1:2 | 44.07 | 2631 | 3 | 1.5 |
| 1:1 | 43.42 | 2558 | 3 | 3 | |
| 2:1 | 44 | 2719 | 3 | 6 |
| Displacement Mode | Steam Temperature/°C | Porosity/% | Permeability/10−3 μm2 | Steam Injection Rate (mL·min−1) | Flue Gas Injection Rate (mL·min−1) |
|---|---|---|---|---|---|
| Steam flooding | 150 | 34.6 | 2450 | 0.2 | 0 |
| Flue gas-assisted steam flooding | 0.2 | 0.2 |
Disclaimer/Publisher’s Note: The statements, opinions and data contained in all publications are solely those of the individual author(s) and contributor(s) and not of MDPI and/or the editor(s). MDPI and/or the editor(s) disclaim responsibility for any injury to people or property resulting from any ideas, methods, instructions or products referred to in the content. |
© 2023 by the authors. Licensee MDPI, Basel, Switzerland. This article is an open access article distributed under the terms and conditions of the Creative Commons Attribution (CC BY) license (https://creativecommons.org/licenses/by/4.0/).
Share and Cite
Ji, Y.; Li, B.; Han, Z.; Wang, J.; Li, Z.; Li, B. Study on Flow Characteristics of Flue Gas and Steam Co-Injection for Heavy Oil Recovery. Processes 2023, 11, 1406. https://doi.org/10.3390/pr11051406
Ji Y, Li B, Han Z, Wang J, Li Z, Li B. Study on Flow Characteristics of Flue Gas and Steam Co-Injection for Heavy Oil Recovery. Processes. 2023; 11(5):1406. https://doi.org/10.3390/pr11051406
Chicago/Turabian StyleJi, Yanmin, Boliang Li, Zongyuan Han, Jian Wang, Zhaomin Li, and Binfei Li. 2023. "Study on Flow Characteristics of Flue Gas and Steam Co-Injection for Heavy Oil Recovery" Processes 11, no. 5: 1406. https://doi.org/10.3390/pr11051406