Article

A New Method for Calculating Reservoir Core-Bound Water Saturation Using the Cast Thin Section

1
CNOOC China Ltd., Tianjin 300459, China
2
PetroChina Xinjiang Oilfield Company, Karamay 834099, China
3
Department of Logging, College of Geophysics and Petroleum Resources, Yangtze University., Wuhan 430100, China
*
Author to whom correspondence should be addressed.
Processes 2023, 11(5), 1397; https://doi.org/10.3390/pr11051397
Submission received: 9 March 2023 / Revised: 20 April 2023 / Accepted: 23 April 2023 / Published: 5 May 2023

Abstract

:
The rock coring of the reservoir in the Bohai A field is difficult. The cores of the target section in the study area are loose, making it difficult to accurately measure the core-bound water saturation. The purpose of this research was to develop and validate a method for calculating a reservoir core-bound water saturation ratio using the cast thin section. First, pepper noise denoising and image enhancement were performed on the thin section by median filtering and gamma variation. Based on this, the enhanced sheet images were thresholded for segmentation by the two-dimensional OTSU algorithm, which automatically picked up the thin section pore-specific parameters. Then, the thin section image was equivalent to a capillary cross-section, while the thin film water fused to the pore surface was observed as bound water. For hydrophilic rocks with a strong homogeneity, the area of thin film water in the pore space of the sheet was divided by the total area of the pore space, which produced the bound water saturation. Next, the theoretical relationship between the film water thickness and the critical pore throat radius was derived based on the Young–Laplace equation. The bound water saturation of the rock was calculated by combining the pore perimeter and the area that was automatically picked up from the thin film for a given critical pore throat radius of the rock. Finally, 22 images of thin sections of sparse sandstone from the coring well section of the study area were image processed using the new method proposed in this paper, and the bound water saturation was calculated. The calculated results were compared with 22 NMR-bound water saturations and 11 semi-permeable baffle plate-bound water saturations in the same layer section. The results showed that the bound water saturation values calculated by the three methods produced consistent trends with absolute errors within 5%. The calculated results confirm the reliability of the method proposed in this paper. This method can effectively avoid the problem of the inaccurate results of core experiments due to the easy damage of sparse sandstone and provides a new idea for the accurate determination of the bound water saturation of sparse sandstone.

1. Introduction

Bound water saturation is one important parameter for describing reservoir characteristics. The accurate calculation of bound water saturation is significant when determining reservoir fluid properties and revealing the original oil and gas saturation of the producing layer [1,2,3,4,5,6].
So far, core-bound water saturation has been determined by the semi-permeable baffle plate method, phase infiltration method, mercury injection method, and NMR method. The semi-permeable baffle plate method uses air to displace wet-phase brine, but clay-bound water cannot be displaced. The capillary pressure curve measured by this method reflects the pore structures other than the clay-bound water portion. As a classic and standard method, it can accurately determine the bound water saturation of muddy sandstone. However, the semi-permeable baffle plate method has very high requirements for the baffle plate, and the test time is long, making it difficult to meet field testing needs [7]. Bound water saturation, determined by the relative permeability method, refers to water saturation when the relative permeability of the water phase is equal to zero in the relative permeability curve. The bound water saturation determined by this method is critical water saturation, which is generally higher than the actual rock-bound water saturation [8,9,10]. The mercury injection method is used to inject mercury into rock samples under vacuum conditions. Mercury is a fluid with great interfacial tension and weak compressibility, and the reservoir involves a process of water displacement by oil. Therefore, the mercury injection method cannot accurately determine the bound water saturation of argillaceous sandstone samples. Moreover, mercury is a toxic liquid, which has high requirements for experimental testing [9,10,11,12]. The Core NMR experiment produces no loss of rock samples, which allows for the accurate determination of the bound water saturation of muddy sandstone; however, the key to this test is to select an appropriate centrifugal force, and the test is highly expensive [13,14,15]. Similarly, in the indirect determination of reservoir-bound water saturation, logging technologists have also conducted fairly detailed work, which can be divided into three main categories. The first method establishes a statistical regression model based on the reservoir’s physical parameters combined with core-bound water saturation. The second type calculates reservoir-bound water saturation based on NMR logging data with more accurate T2 cutoff values. The third type determines the reservoir-bound water saturation based on pressure mercury data and the use of parameters that reflect a pore throat structure. Although the indirect determination methods described above can obtain the value of bound water saturation for the whole reservoir section and the variation trend, they also have the drawback of producing a low accuracy of acquisition.
The casting thin section is one inevitable experiment in oil field exploration and development, which has low measurement costs and is relatively easy to obtain. This paper attempts to propose a new method of calculating core-bound water saturation using the casting thin section. When using image processing technology and capillary theory, pore characteristic parameters can be extracted directly from the casting thin section to calculate bound water saturation. This method has potential application value in determining the bound water saturation of unconsolidated sandstone, which is difficult for plunger sample drilling.

2. Principle

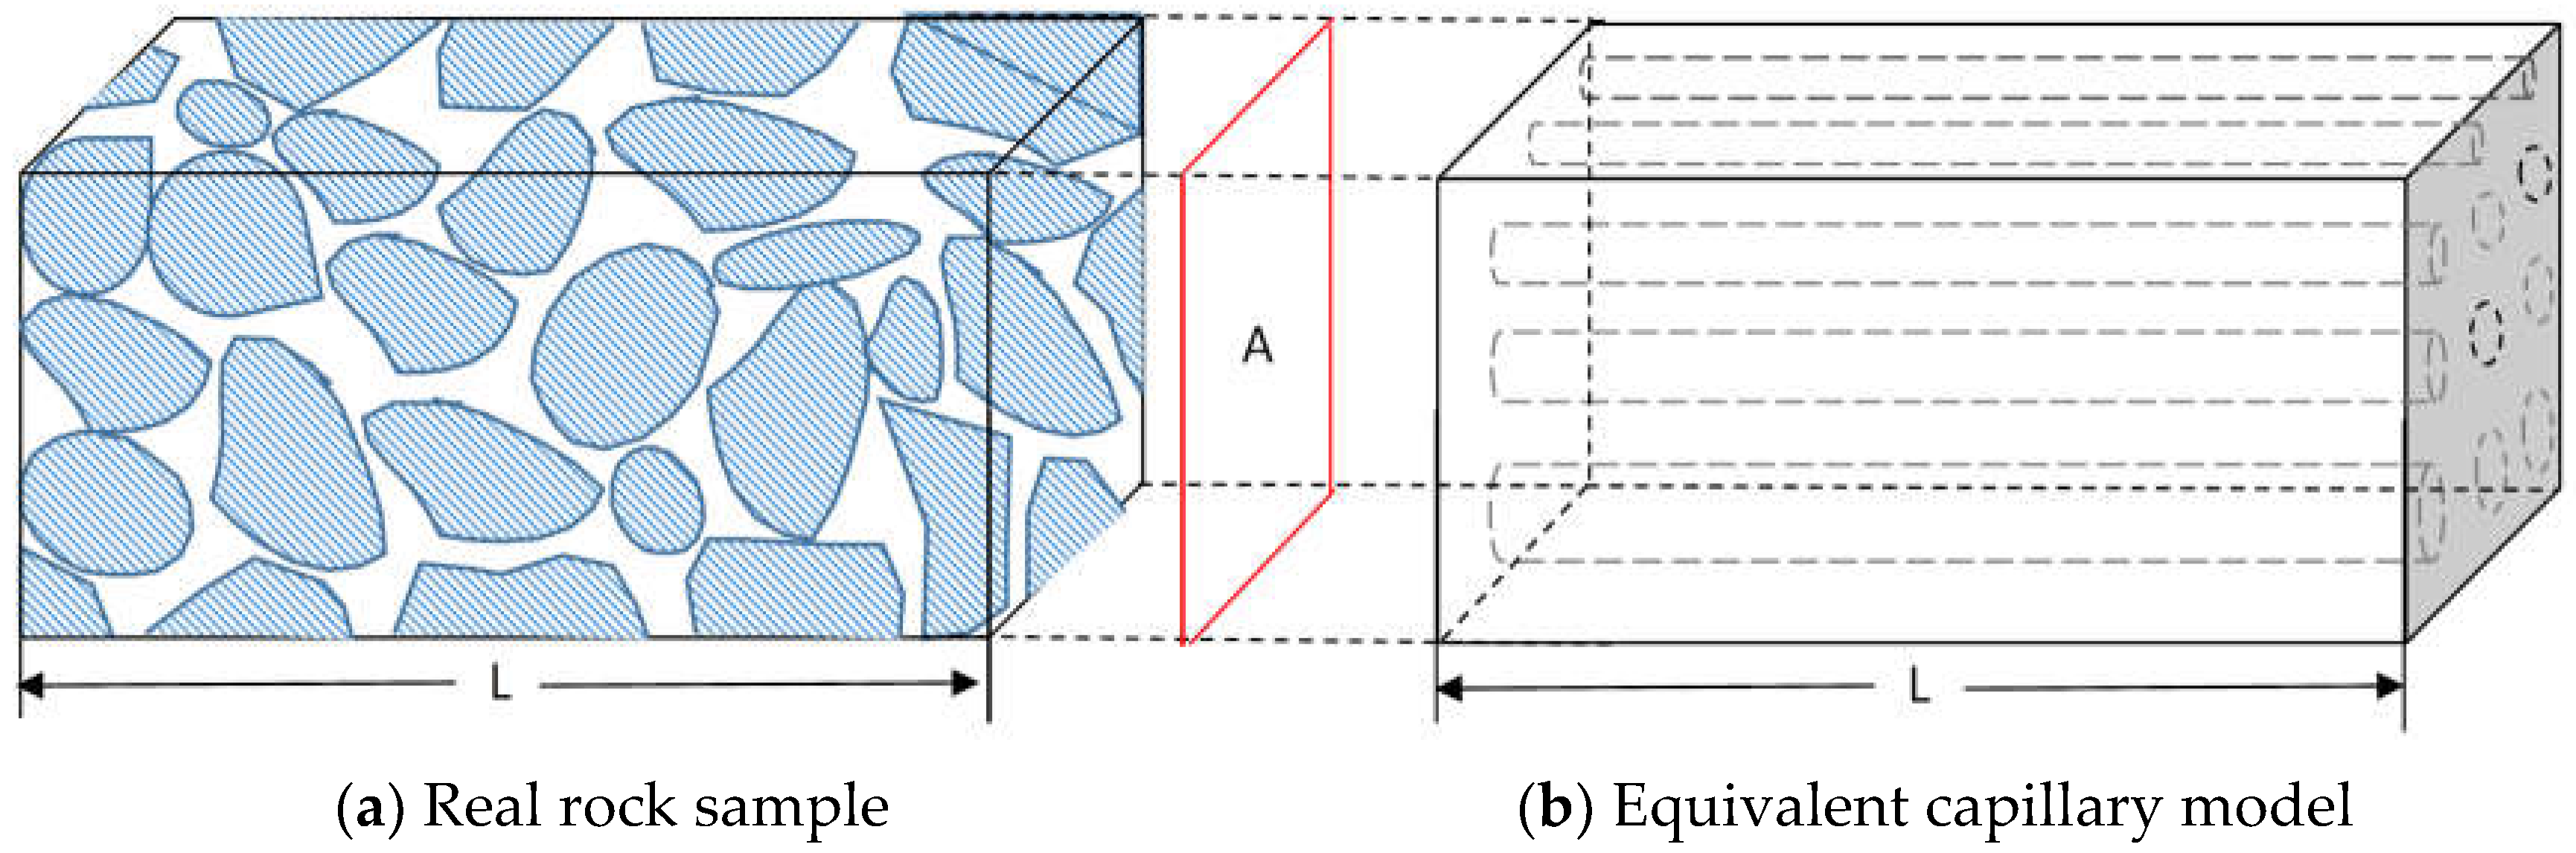
2.1. Basic Principles of Bound Water Saturation Calculation Using Thin Section

Bound water saturation refers to the ratio of the volume of immobile water in the reservoir pores to the volume of the pores. Considering the complex distribution of the rock pores, the rock is usually simplified into an equivalent capillary model to calculate the petrophysical parameters of the reservoir. Figure 1 shows a three-dimensional rock and its simplified model. In Figure 1a, the shaded area is the rock skeleton, and the void area is the rock’s pores. Figure 1b shows the equivalent capillary model. That is, the pores in the rock are equivalent to many cylinders (capillaries) with consistent lengths and different diameters. It is hypothesized that the rock has good homogeneity, so the bound water saturation can be calculated based on the area of the bound fluid and pore area in the rock section.
Figure 2 shows the section (the casting thin section) of the actual rock sample and its model. The blue part in Figure 2a is the pore and Figure 2b is a simplification of Figure 2a. In Figure 2b, it is hypothesized that the pore space of the rock is composed of n circles (pore units) with different diameters. For pore units with a diameter smaller than a certain cutoff value (small pores, suppose there are m pores, m < n), the pore fluid is basically filled with bound water; for pore units with a diameter larger than a certain cutoff value (large pores), the pore fluid is composed of bound water and movable oil. Suppose that the rock is hydrophilic, and bound water exists on the pore surface in the form of a water film; that is, the pore fluid presents an oil-in-water distribution state. According to the concept of bound water, bound water saturation is equal to the sum of the area of all small pores and the area of the water film in large pores divided by the total area of pores, which can be expressed as follows:
S w i = i = 1 m S i + i = m + 1 n S f i i = 1 n S i
where Swi is the bound water saturation%, Si is the total pore area, and Sfi is the area of the water film in the large pore space.
In order to calculate bound water saturation through the use of a casting thin section, the area and circumference of each pore unit in the thin section image can be extracted by image processing technology, and the total pore area in the thin section image can be calculated. The water film thickness can then be set to calculate the area of the small pore and the area of bound water in the large pore so that the bound water saturation can be calculated by Formula (1).

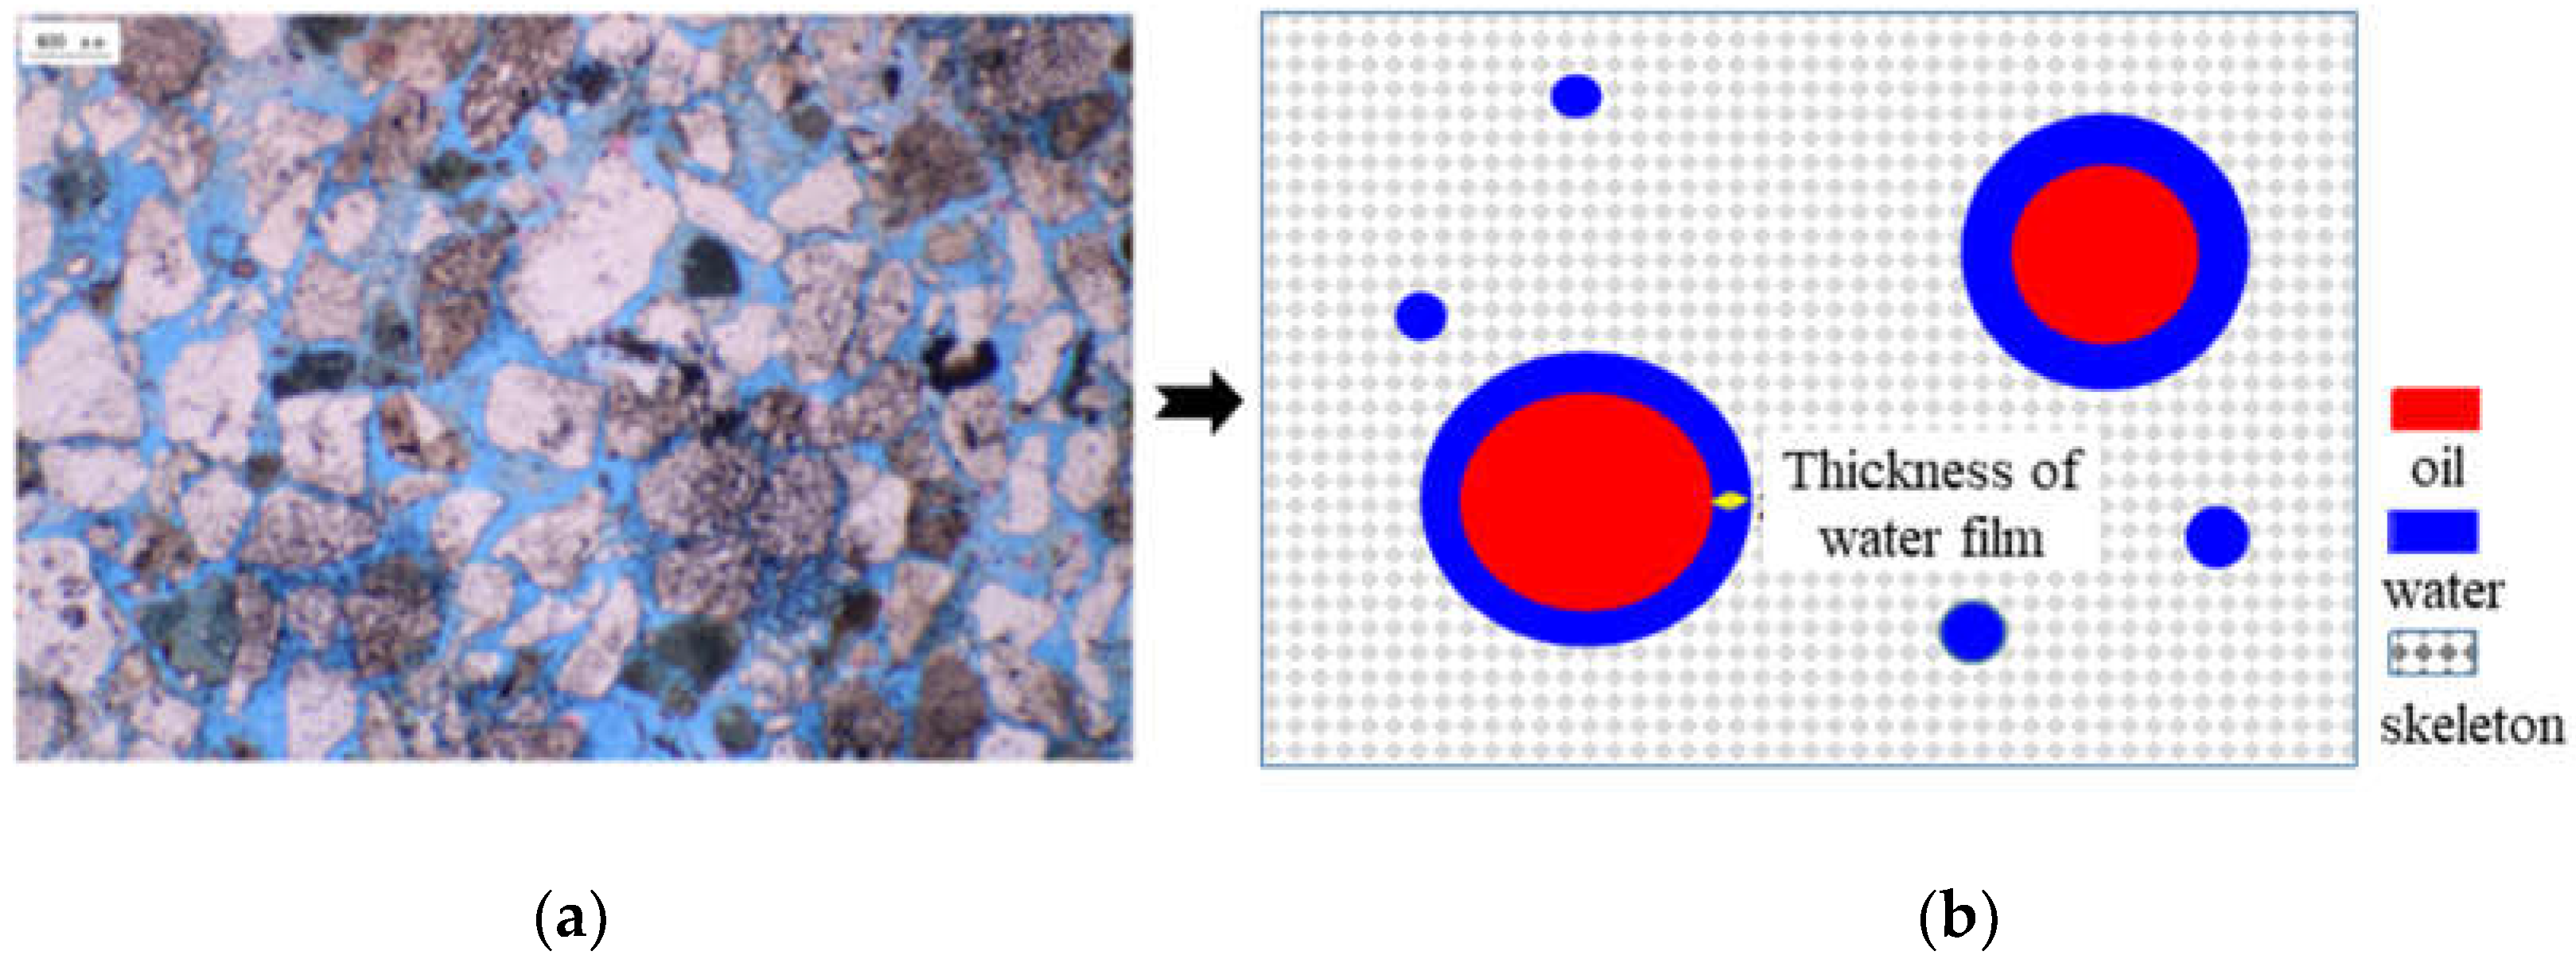
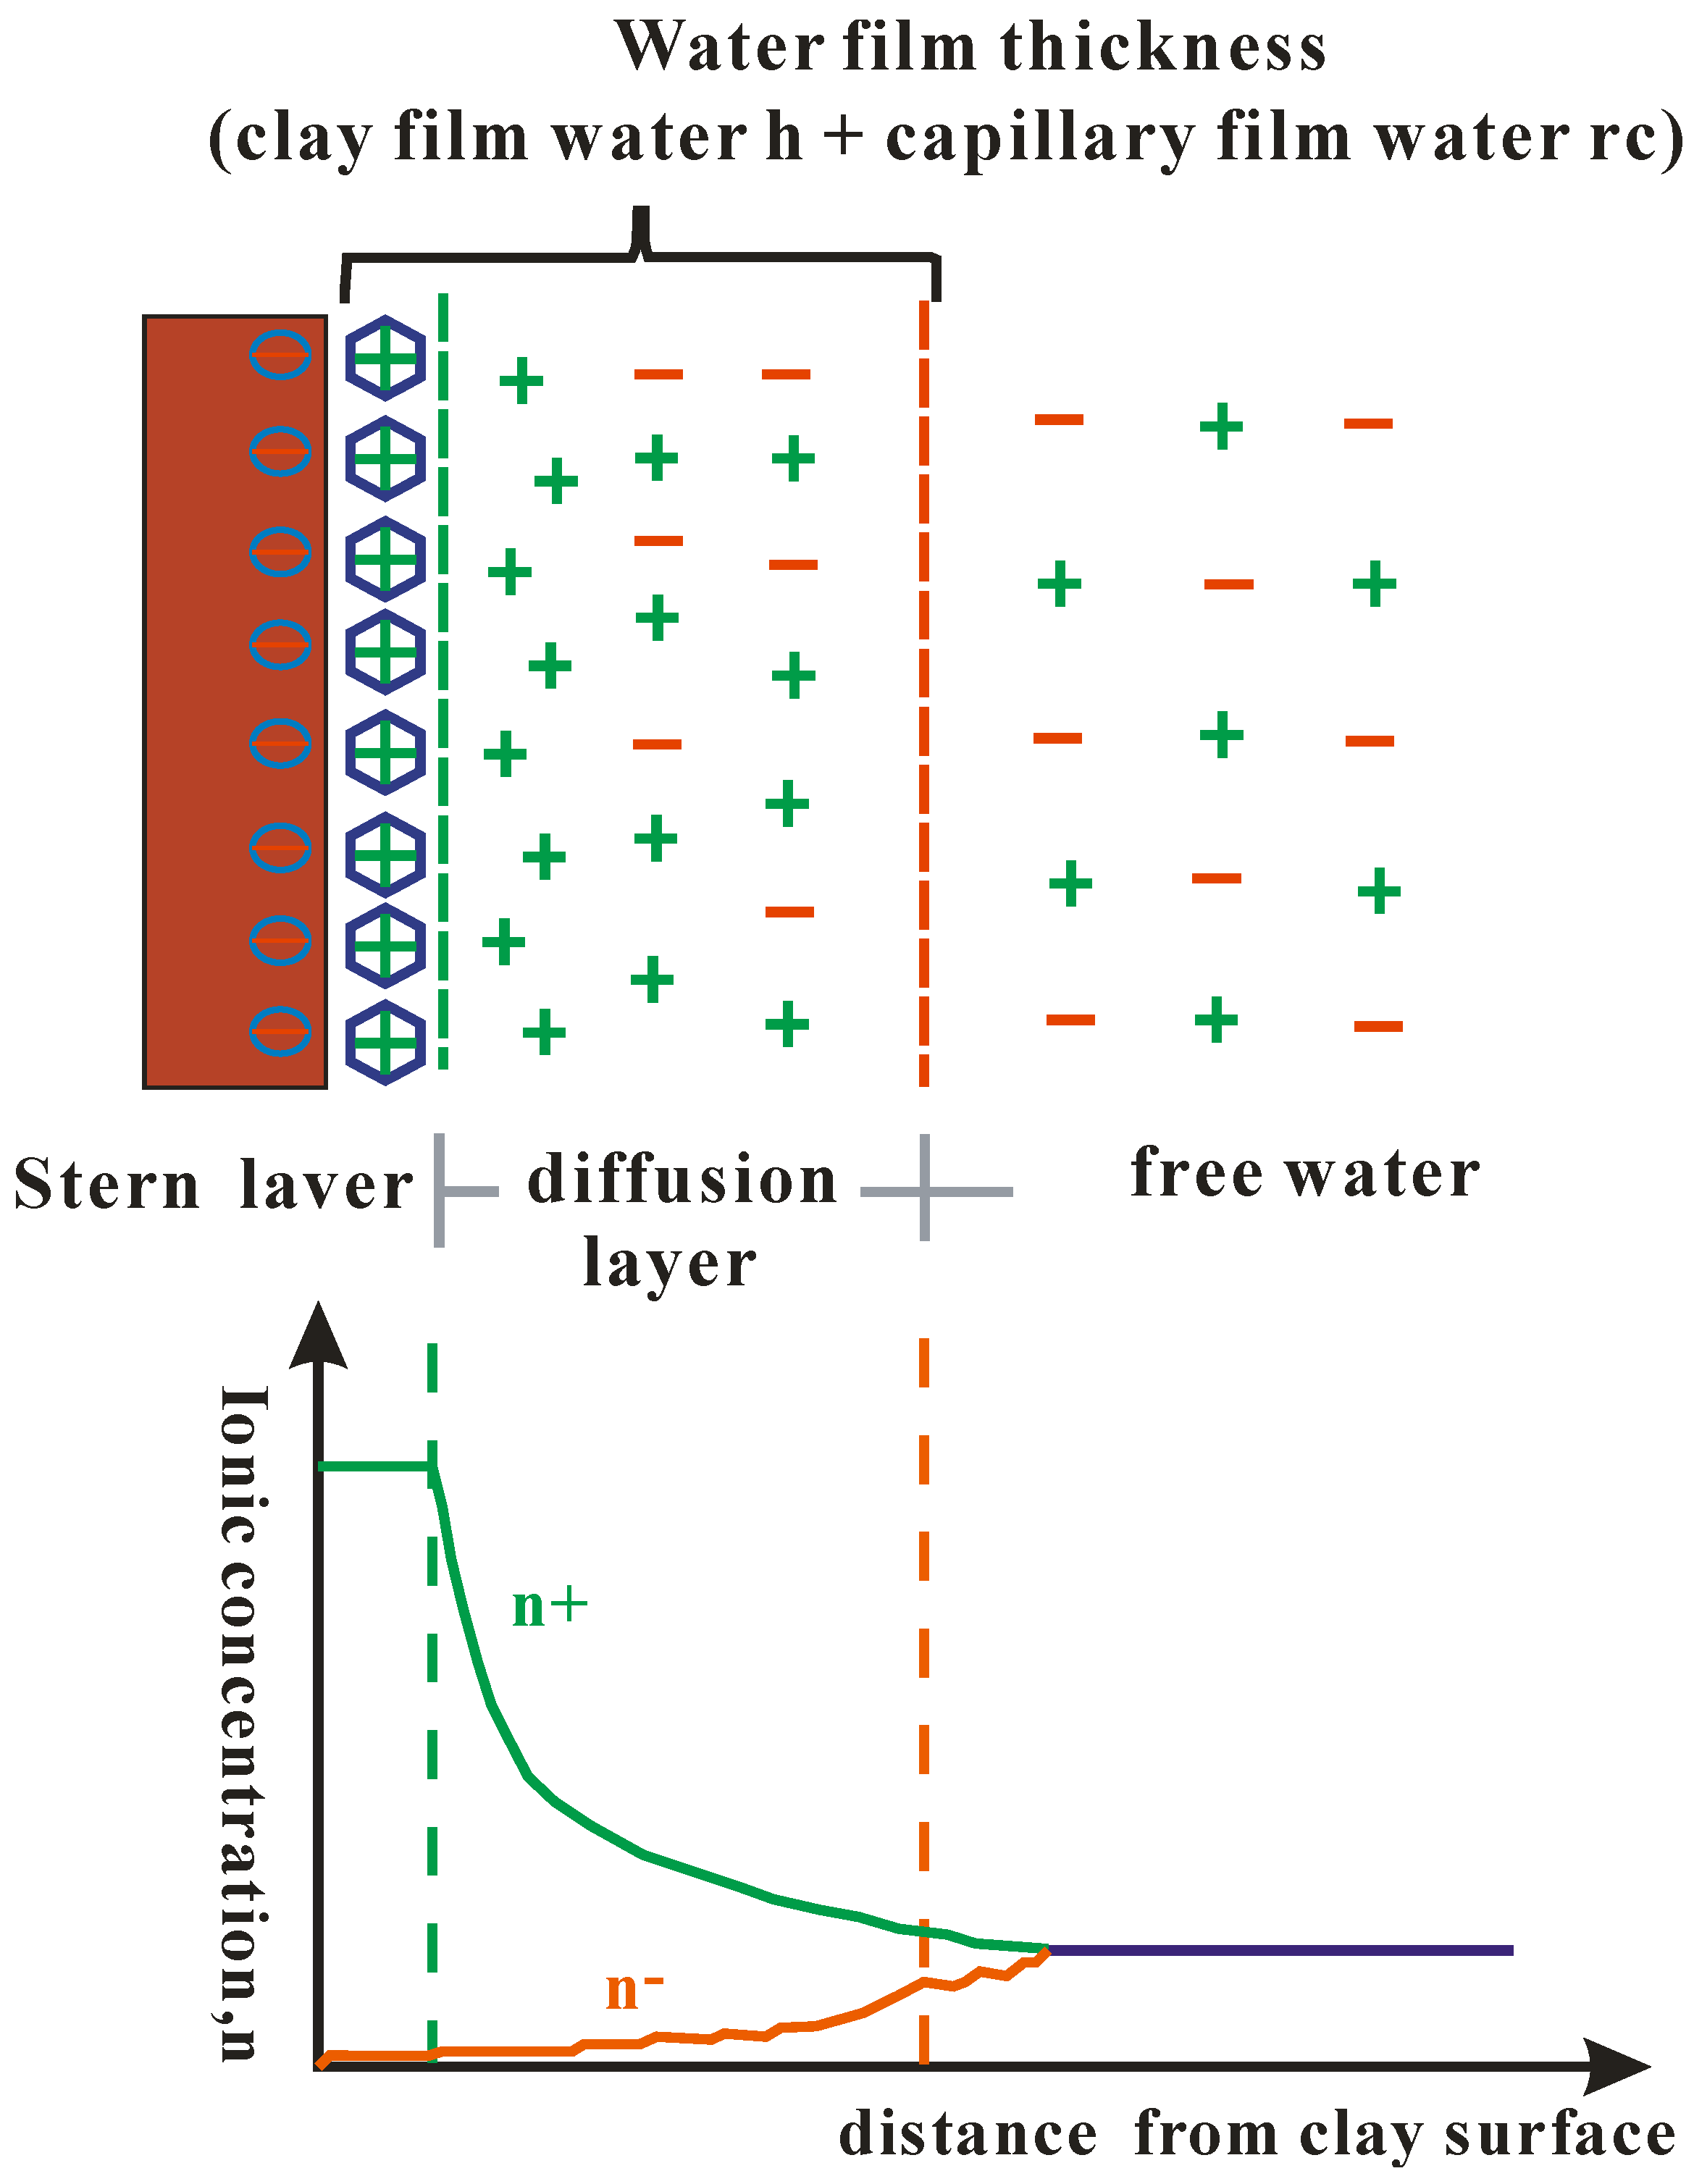
2.2. Determination of Water Film Thickness

According to the theory of double electric layers [16], bound water in oil and gas reservoirs mainly exists in the form of Stern and diffusion layers. When sandstone contains clay minerals wrapped in the surface of sandstone particles, because the surface of clay particles is negatively charged, in order to achieve electrical equilibrium, the negative charge can adsorb cations or adsorb polar water molecules from the nearby aqueous solution, forming a diffuse double electric layer. The double layer is divided into 2 parts, one is the compact layer close to the clay minerals, also called stern layer. The second part is the diffusion layer ( Figure 3).The bound water of the Stern layer is clay film water, and its thickness is the distance h between the outer Helmtz plane and the clay particle surface. The bound water of the diffusion layer is capillary film water, whose thickness is expressed by the critical pore throat radius rc. The water film thickness is equal to the sum of the thickness of the clay film water and capillary film water.
In general, the critical pore throat radius of reservoir rocks can be determined by the reservoir type and physical characteristics. In this way, the outlet water film thickness can be determined by merely establishing a relationship between the critical pore throat radius and the clay water film thickness so that bound water saturation can be calculated using the thin section.
According to the Young–Laplace equation, the relationship between the capillary pressure and water film separation pressure can be expressed as follows [17,18]:
Pe = 2Hσ + Pd
where Pe is the capillary pressure, MPa; Pd is the repulsive pressure between the oil–water interface of the water film, that is, the water film separation pressure, MPa; H is the average curvature of the solid surface where the water film is located; and σ is interfacial tension, mN/m.
The curve describing the relationship between the separation pressure and the clay film water thickness is called the separation pressure isotherm, whose empirical expression can be seen as follows:
P d = a h 3
where h is the clay film water thickness, μm, and a is a constant equal to 1.18 × 10⁻⁷, the value of which is greater under greater reservoir hydrophilicity. The relationship between the capillary pressure and pore throat radius is expressed as follows:
P e = 2 σ cos θ r
where r is the pore throat radius, μm; σ is interfacial tension, dyn/cm; and Θ is the wetting angle. Under reservoir conditions, the interfacial tension is 30 dyn/cm, and the wetting angle is 30°.
Since H = 0.5/r, Equations (2) and (4) can be substituted into Equation (3) to obtain the relationship between the clay water film thickness, h, and pore throat radius, r, under reservoir conditions:
h = ( 53.73 × 10 7 r c ) 1 3
Therefore, when the critical pore throat radius, rc, of the reservoir rock in the study block is known, the clay water film thickness can be determined by Equation (5).

3. Technical Implementation

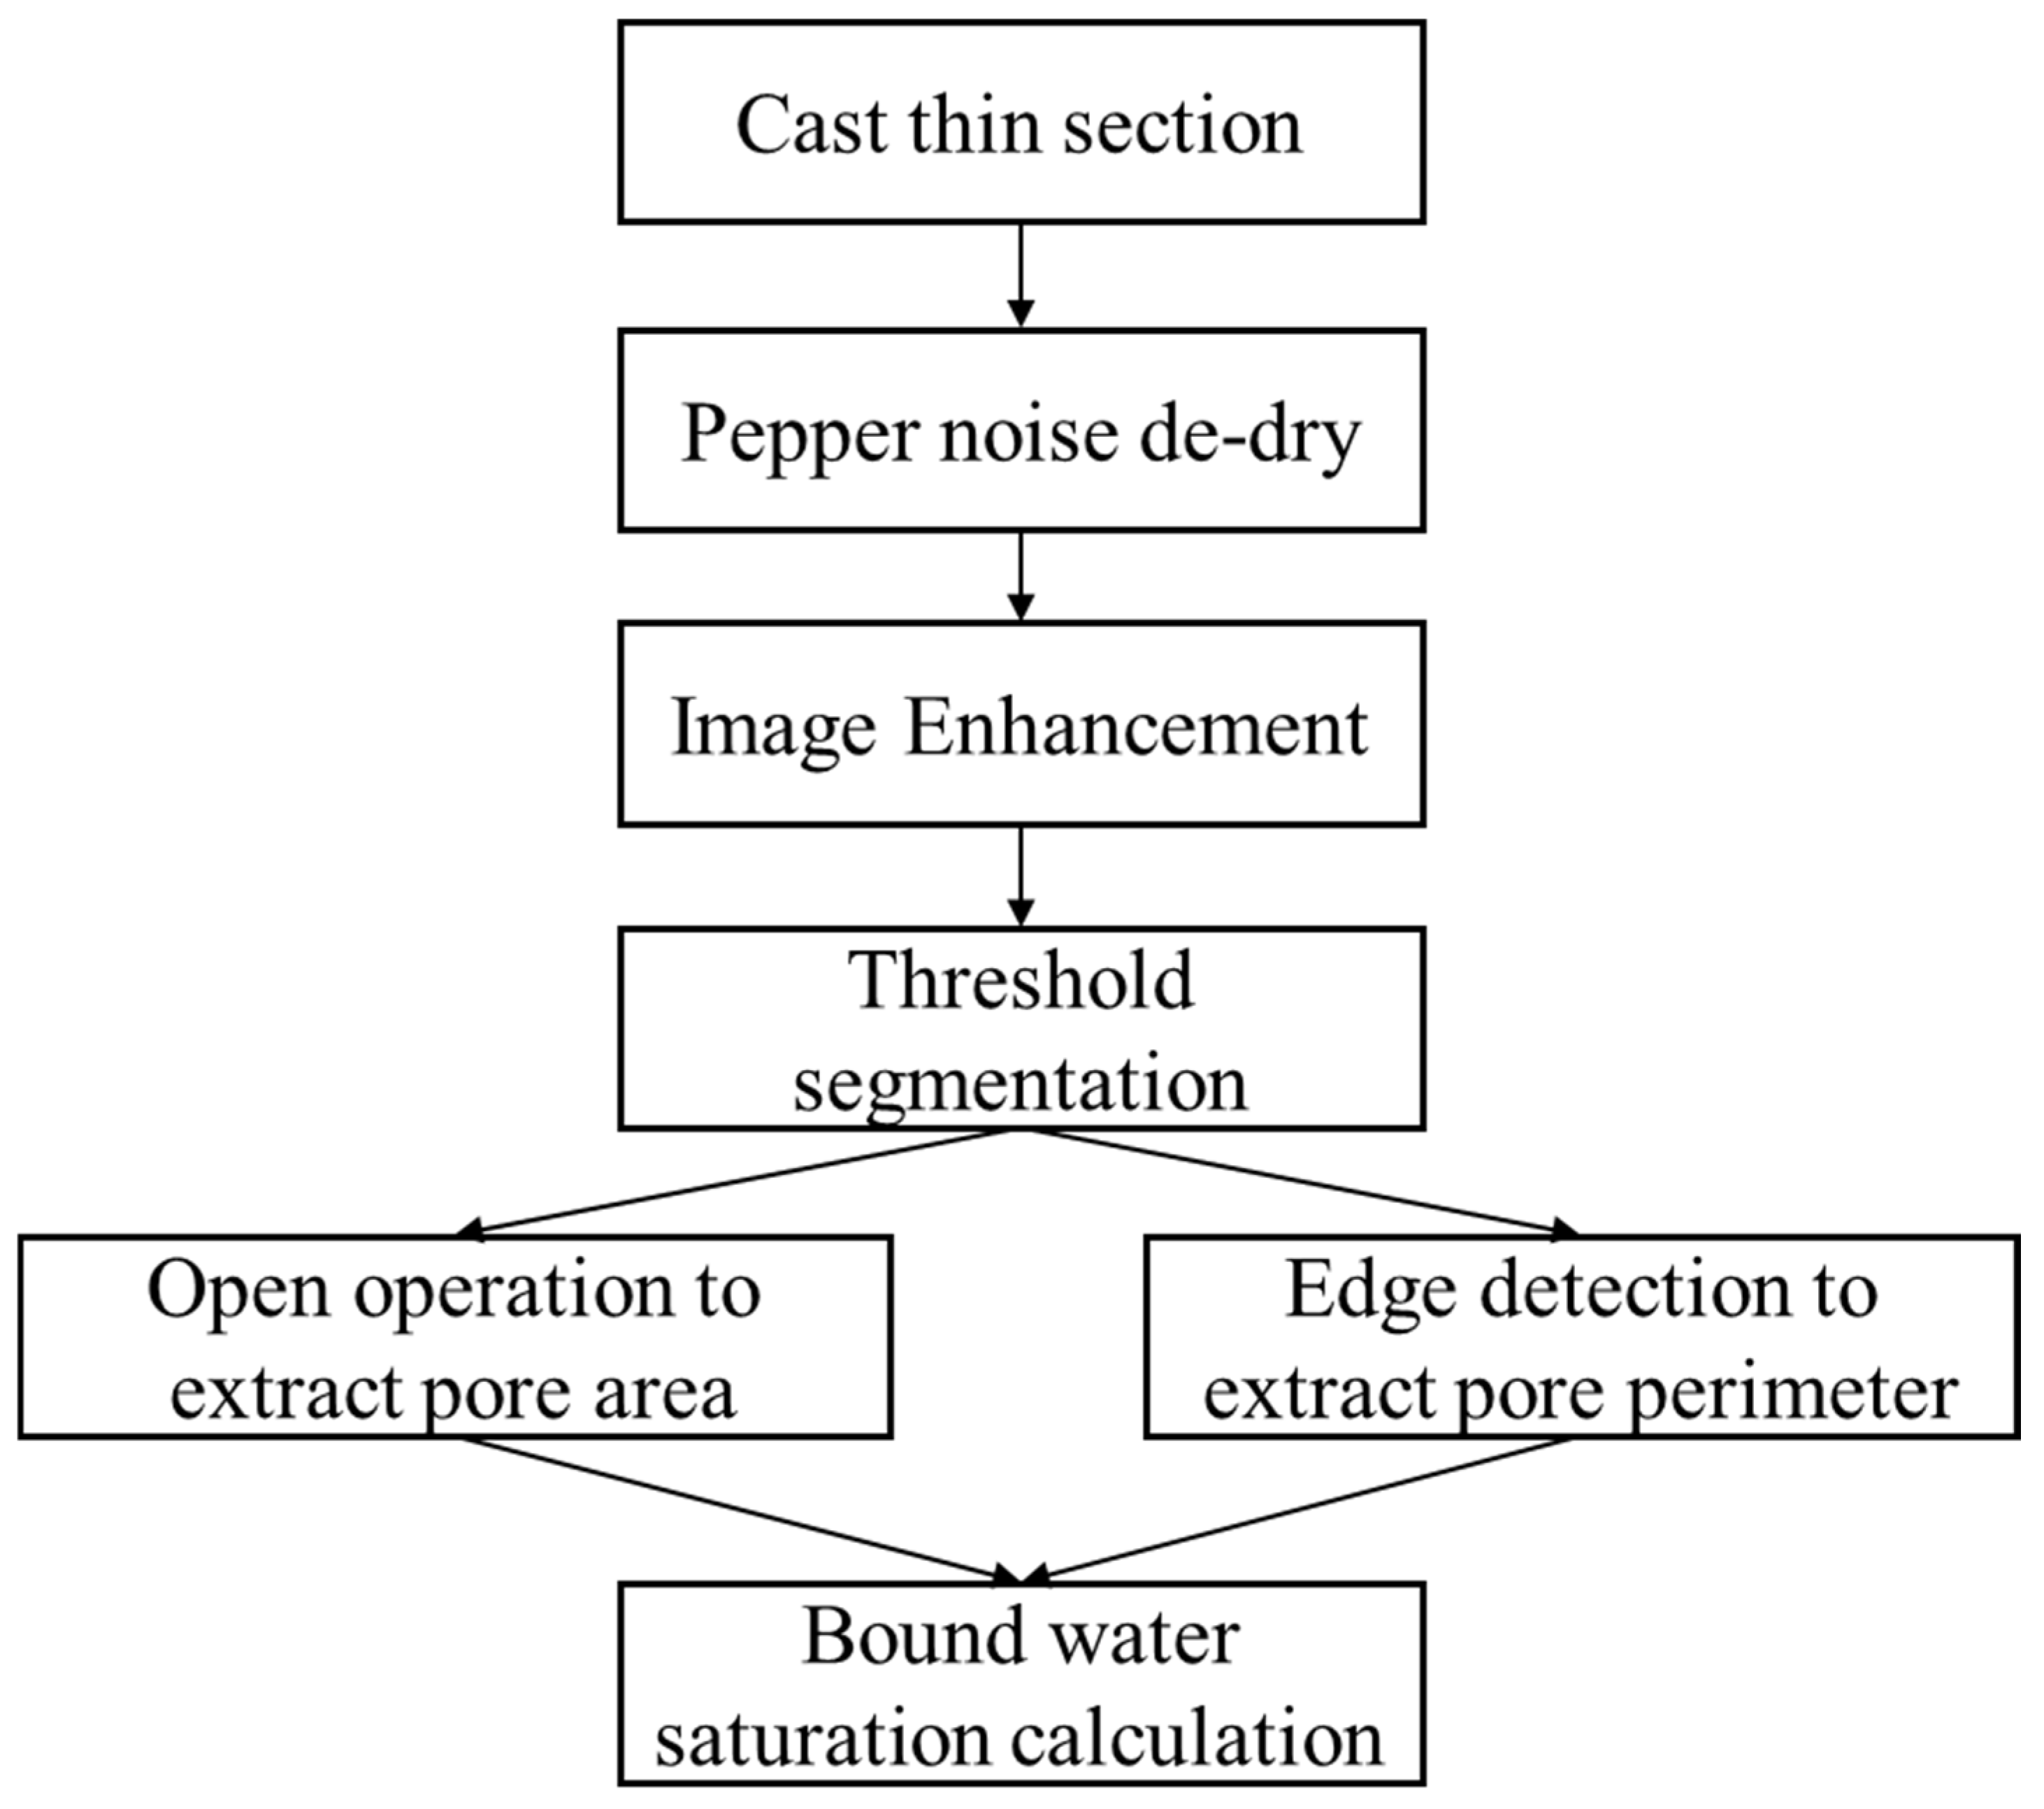
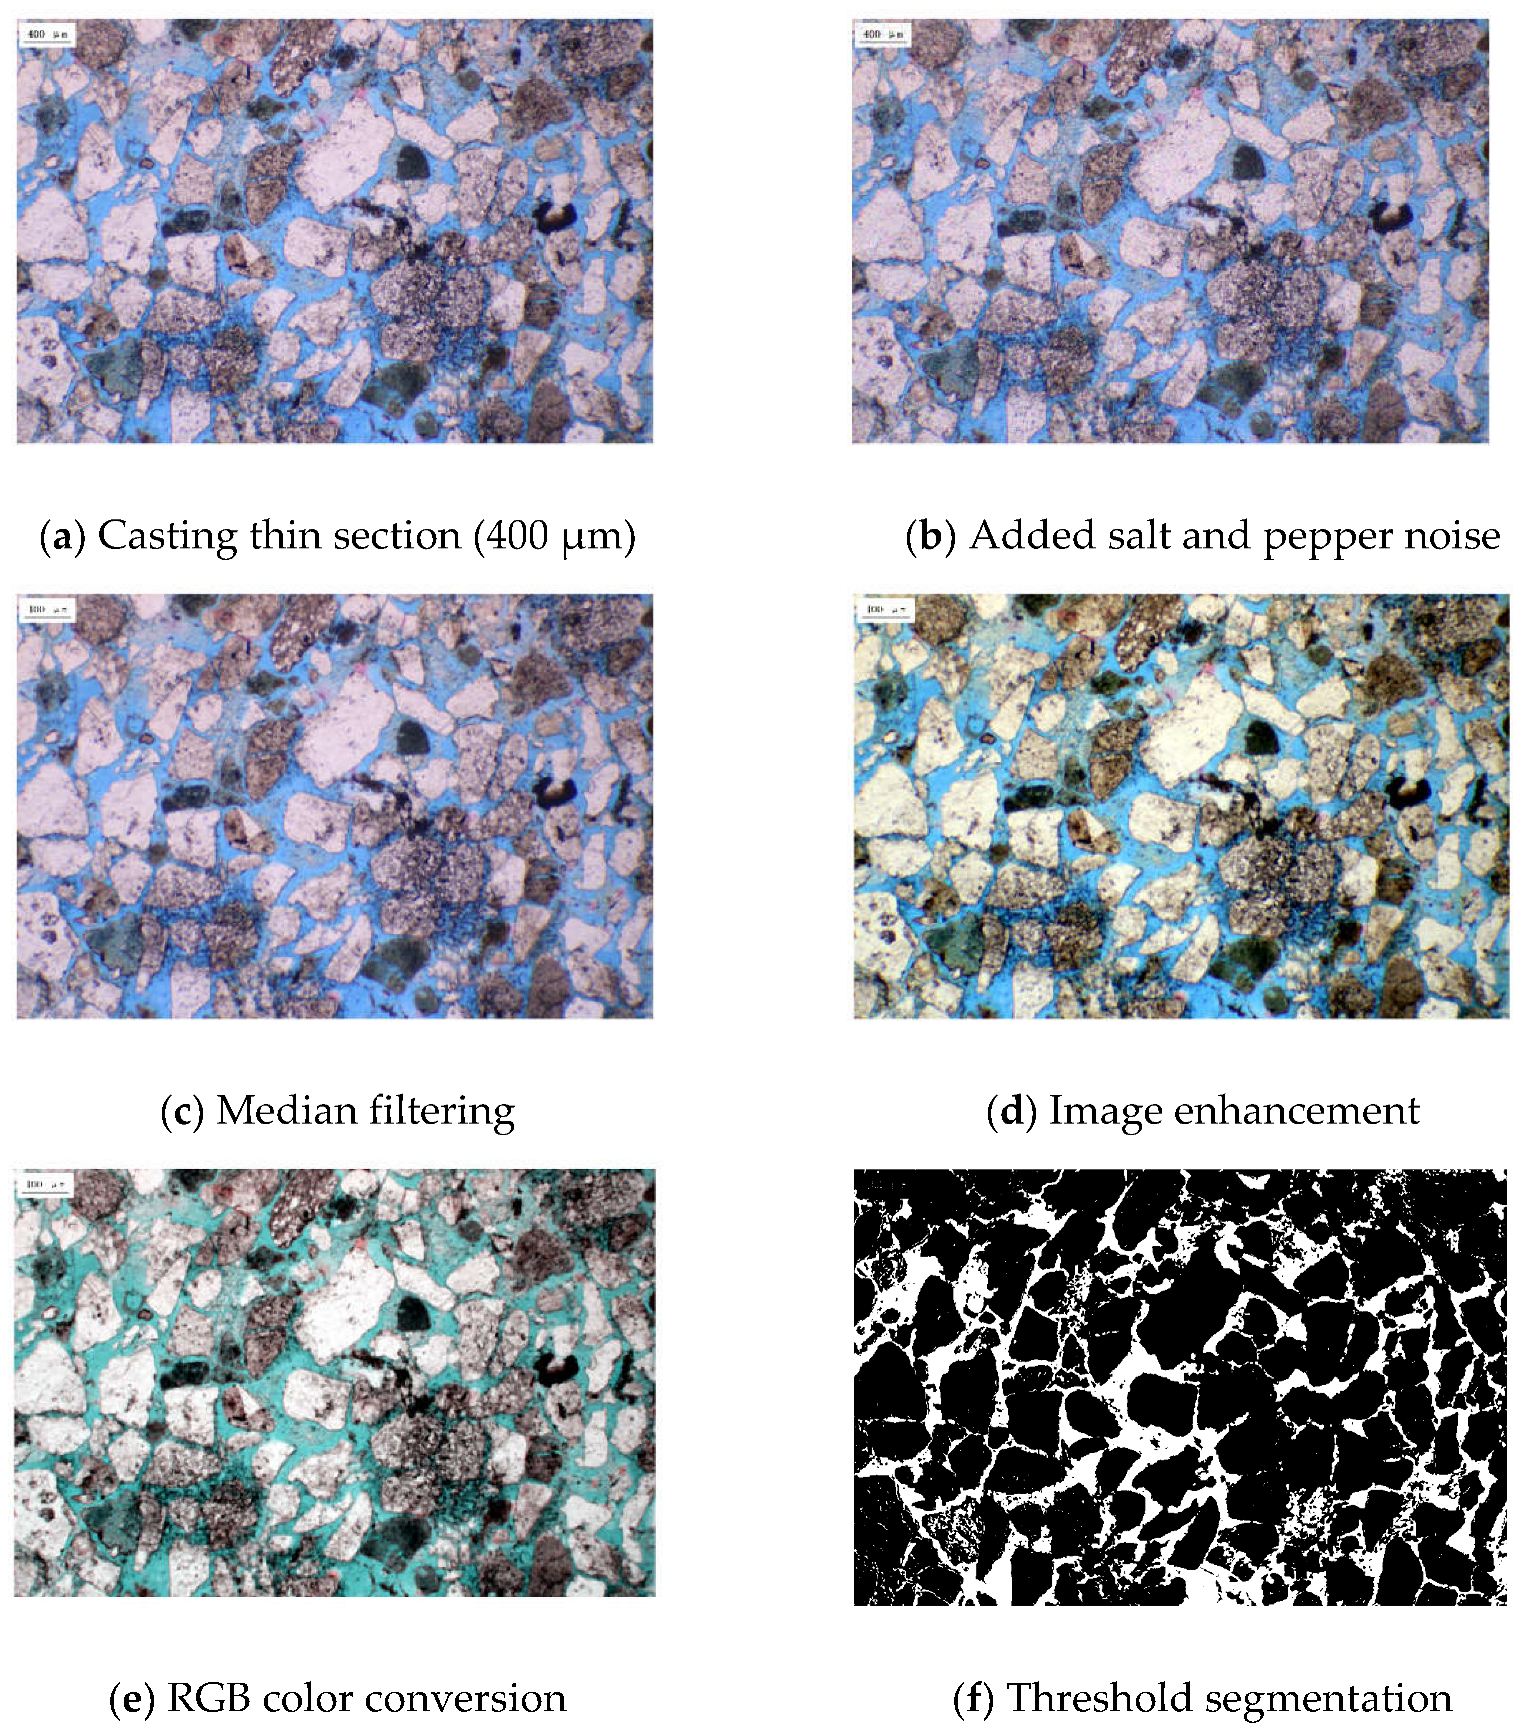
3.1. Automatic Collection of Pore Feature Parameters from Thin Section Images

The area and circumference of each pore unit can be automatically collected from the casting thin section image by using image processing technology. The cast thin section is also known as the colored liquid colloidal rock thin section. It is made by injecting colored liquid glue into the rock pore space under vacuum pressure, and the rock thin section can be made after the liquid glue is cured. The image of the cast thin section is imaged by microscope. Since the rock pores are filled with colored gum, the cast thin section is very eye-catching and easy to identify under the microscope, which provides an effective way to study the pore size and distribution state connectivity of the rock. In order to clearly demonstrate the process of technical realization, this section takes one of the casting thin section images in the study block as an example to illustrate the steps:
Image preprocessing
RGB, as a color space uniformly adopted by computers, is also used in the acquisition process of casting thin-section images, which contain more information about thin sections [19]. For any casting thin section image with an M × N pixel, it can be expressed as a three-dimensional array arranged as M × N × 3, consisting of red, green, and blue components, with each component in the value range of (0–255). That is, the value of each pixel is:
f ( x , y ) = R , G , B
where R is the red channel pixel value, G is the green channel pixel value, and B is the blue channel pixel value.
Due to environmental restrictions, some noise information is carried in the imaging process of the casting thin sections, and such information interferes with the subsequent acquisition of effective casting thin section information. Therefore, the casting thin section requires noise reduction. The most common noise for this is pepper noise, also called impulse noise. It randomly changes some pixel values and is a bright and dark point noise, between black and white, that is generated by the image sensor, transmission channel, decoding process, etc. As invalid information, such noise causes a deviation in the extraction of pores from the subsequent casting thin section. As a nonlinear filtering method, median filtering can effectively eliminate salt and pepper noise and protect the edge features. Median filtering takes the median value of multiple pixel points within the range of a pixel point as the output data of the point in order to eliminate random noise and pulse noise. The k × k filtering window, V, is used to process the image, and the processed pixel value can be expressed as:
f x , y = M e d f x + r , f y + w , r , s V ( x , y ) ( M , N )
Med is a function that takes the median value, K is the filter window step size, and the median value of f ( x , y ) is the output image after the filtering process.
Once the rock-cast thin section image has been processed by noise reduction, image enhancement processing can be carried out. Among the image enhancement methods, gamma transform is a more suitable image enhancement method. Gamma transformation-based image enhancement techniques can enhance the visibility and clarity of the image and also increase the brightness difference between the target and the background. The image after noise reduction can be used as the input and the image is pulled in varying degrees by the γ-adjustment of the gamma function shape. After the gamma transformation of the image, an obvious brightness and contrast between the pore and skeleton can be observed, which facilitates the subsequent pore extraction. The mathematical expression for this is:
f o u t = E f γ
where E is the grayscale scaling factor, γ is the gamma factor, and fout is the output image after gamma change. When >1, the brightness increases, and when <1, the brightness decreases. In the whole processing method of casting thin sections in the study block, the value was in the range of (0.8–1.5) according to different thin section characteristics.
Threshold segmentation
In the gamma-transformed image, the brightness contrast between the pores and the skeleton is stronger, and the pore color features are clear. Pores can automatically be extracted based on these features. Before the pore features are extracted, the image must be thresholded for segmentation. Threshold segmentation is a region-based image segmentation technique, the principle of which is to classify the image pixel points. Image thresholding segmentation is a traditional and commonly used image segmentation method and has become the most basic and widely used segmentation technique in image segmentation because of its simple implementation, small computational effort, and more stable performance. In the preparation process of the casting thin section, the blue resin is vacuum infused into the pore space before the resin is consolidated and then ground into thin sections. Therefore, the pores in the image are shown as blue. According to the principle of three primary colors, the color value of blue is {0,0,255}; while the pores in the real image are not completely in the color value of (0,0,255), they are in the adjacent color value of blue. Any pixel of the thin section image is composed of red, green, and blue, so R, G, and B are changed in the color space, then the changed image can be used for threshold segmentation. The specific changes are as follows:
I 1 = f o u t B f o u t R I 2 = f o u t B f o u t G
where fout{R} is the pixel value of the red channel after image enhancement, fout{B} is the pixel value of the blue channel after image enhancement, and fout{G} is the pixel value of the green channel after image enhancement. I1 is the difference charted between the blue channel and the red channel in the enhanced image, and I2 is the difference charted between the blue channel and the green channel in the enhanced image. I1 and I2 contain all the adjacent color values of blue in the thin section, an -dimensional OTSU threshold segmentation was performed using I1 and I2 [20,21].
The two-dimensional OTSU threshold segmentation is an improved image segmentation method based on OTSU. It makes calculations based on the gray information of the image. I1 and I2 are used as grayscale maps for the threshold segmentation of the thin section image. Firstly, the pixel value of I, I(x,y), and its average pixel, g(x,y), in the field range of 3 × 3 are calculated. On this basis, a two-dimensional histogram between the two is established to form an l × l matrix, and then the probability, P(m,m), of each combination in the binary array is formed by I(x,y), and g(x,y) is calculated.
g ( x 0 , y 0 ) = [ i = 1 1 j = 1 j f o u t ( x 0 + i , y 0 + j ) ] p ( x 0 , y 0 ) = w x 0 , y 0 M × N
The value range of x 0 and y 0 is (0–l), and w x 0 , y 0 is the occurrence frequency of each sequence in the binary array. x0 and y0 are two-dimensional pixel values at point (i, j, s, t), which is used as the optimal threshold to distinguish the pore and skeleton. The occurrence probability, p 0 p 1 , and the gray level vector of the pore and skeleton are calculated. If there is a group of ( s * , t * ) that makes the inter-class variance, σ, of the pore and skeleton reach the maximum, ( s * , t * ) is the segmentation threshold of the final image. According to this principle, two groups of optimal ( s * , t * ) can be obtained by the two-dimensional OTSU threshold segmentation of I 1 and I 2 , and the final threshold segmentation can then be carried out according to the two groups of thresholds.
m a x { σ s , t = p 0 ( μ 0 μ ) 2 + p 1 ( μ 1 μ ) 2 } p 0 = i = 0 s j = 0 t p i j p 1 = i = s + 1 255 j = t + 1 255 p i j μ 0 = ( i = 0 s j = 0 t i p i j p 0 , i = 0 s j = 0 t j p i j p 0 ) μ 1 = ( i = s + 1 l j = t + 1 l i p i j p 0 , i = 0 l j = 0 l j p i j p 0 ) μ = ( i = 0 l j = 0 l i p i j p 0 , i = 0 l j = 0 l j p i j p 0 )
where μ 0 and μ 1 are the gray level vectors of the pore and skeleton, and μ is the gray level vector of the whole image. p0 and p1 are the probabilities of the grey vectors corresponding to the pores and the skeleton, respectively.
Extraction of pore characteristic parameters
The image processed by threshold segmentation experiences noise produced by the isolated points and isolated blocks, and the connection boundary between the pores is blurred. To address the above problems, this study removed the boundary noise by morphological open and closed operations to clarify the connectivity between the pores in the sheet and used an edge detection algorithm to extract the edge features of the pores. The purpose of this open operation was to make the target contour smoother and break the narrow neck between the targets so that the closed operation could fill tiny vacancies in the targets. This was able to eliminate isolated pixel points in the binary map and burr the edges of the pores to smooth their edges while ensuring that the location and shape of the pores remained unchanged. The sum of all the pixel points in the pore after the opening operation was used as the pore area parameter. Edge detection defines the target and background based on luminance change, highlights the boundary of the image, and is able to identify potentially more edge information while not being easily affected by noise. The pore edge information identified after edge detection was the pore boundary from which the number of pixels in the pore boundary could be calculated, and the number of pixels contained in the pore boundary can be used as the pore perimeter length. Figure 4 illustrates the entire technology implementation process. Figure 5 shows the casting thin section in the research block after median filtering, image enhancement, and threshold segmentation.
Table 1 shows the pore circumference and area extracted from the thin section in Figure 4. As can be seen from Table 1, a total of 1286 pore units were extracted. The image scale of the thin section in Figure 4 is 1:400 µm; that is, the field of view area for the thin section was enlarged 25 times. As a result, the extracted area of each pore needed to be divided by 25 × 25 to calculate the actual area of each pore (unit µm2), and the circumference of each pore needed to be divided by 25 to calculate the actual circumference (unit µm).

3.2. Calculation of Bound Water Saturation

The pore characteristic parameters extracted in Table 1 can be taken as an example to illustrate the calculation process of the bound water saturation. First, the actual pore area of all 1286 pores was summed to obtain the actual total pore area (µm2) in the thin section image. Then, the critical pore throat radius of the study block was set as 0.3 µm, and the clay water film thickness was calculated as 0.012 µm, according to Equation (5). That is, the water film thickness of this thin section was 0.312 µm, and its water film area was S = 0.314 × 0.3122 = 0.306 μm2.
When the pore area was smaller than 0.306 μm2, all the pores were filled with bound water. When the pore area exceeded 0.306 μm2, the pores were composed of bound water and movable oil. For the hydrophilic rock samples, oil was distributed in the water and the bound water area, which was approximately equal to the pore circumference multiplied by the water film thickness. The actual bound water area in the thin section image was calculated by summing the bound water area of 1286 pores. Finally, by dividing the sum of the small pore-bound water area (351.193 μm2) and the large pore-bound water area (1337.175 μm2) in the thin section image by the actual total pore area (4549.117 μm2), the bound water saturation of the sample was calculated as 37%.

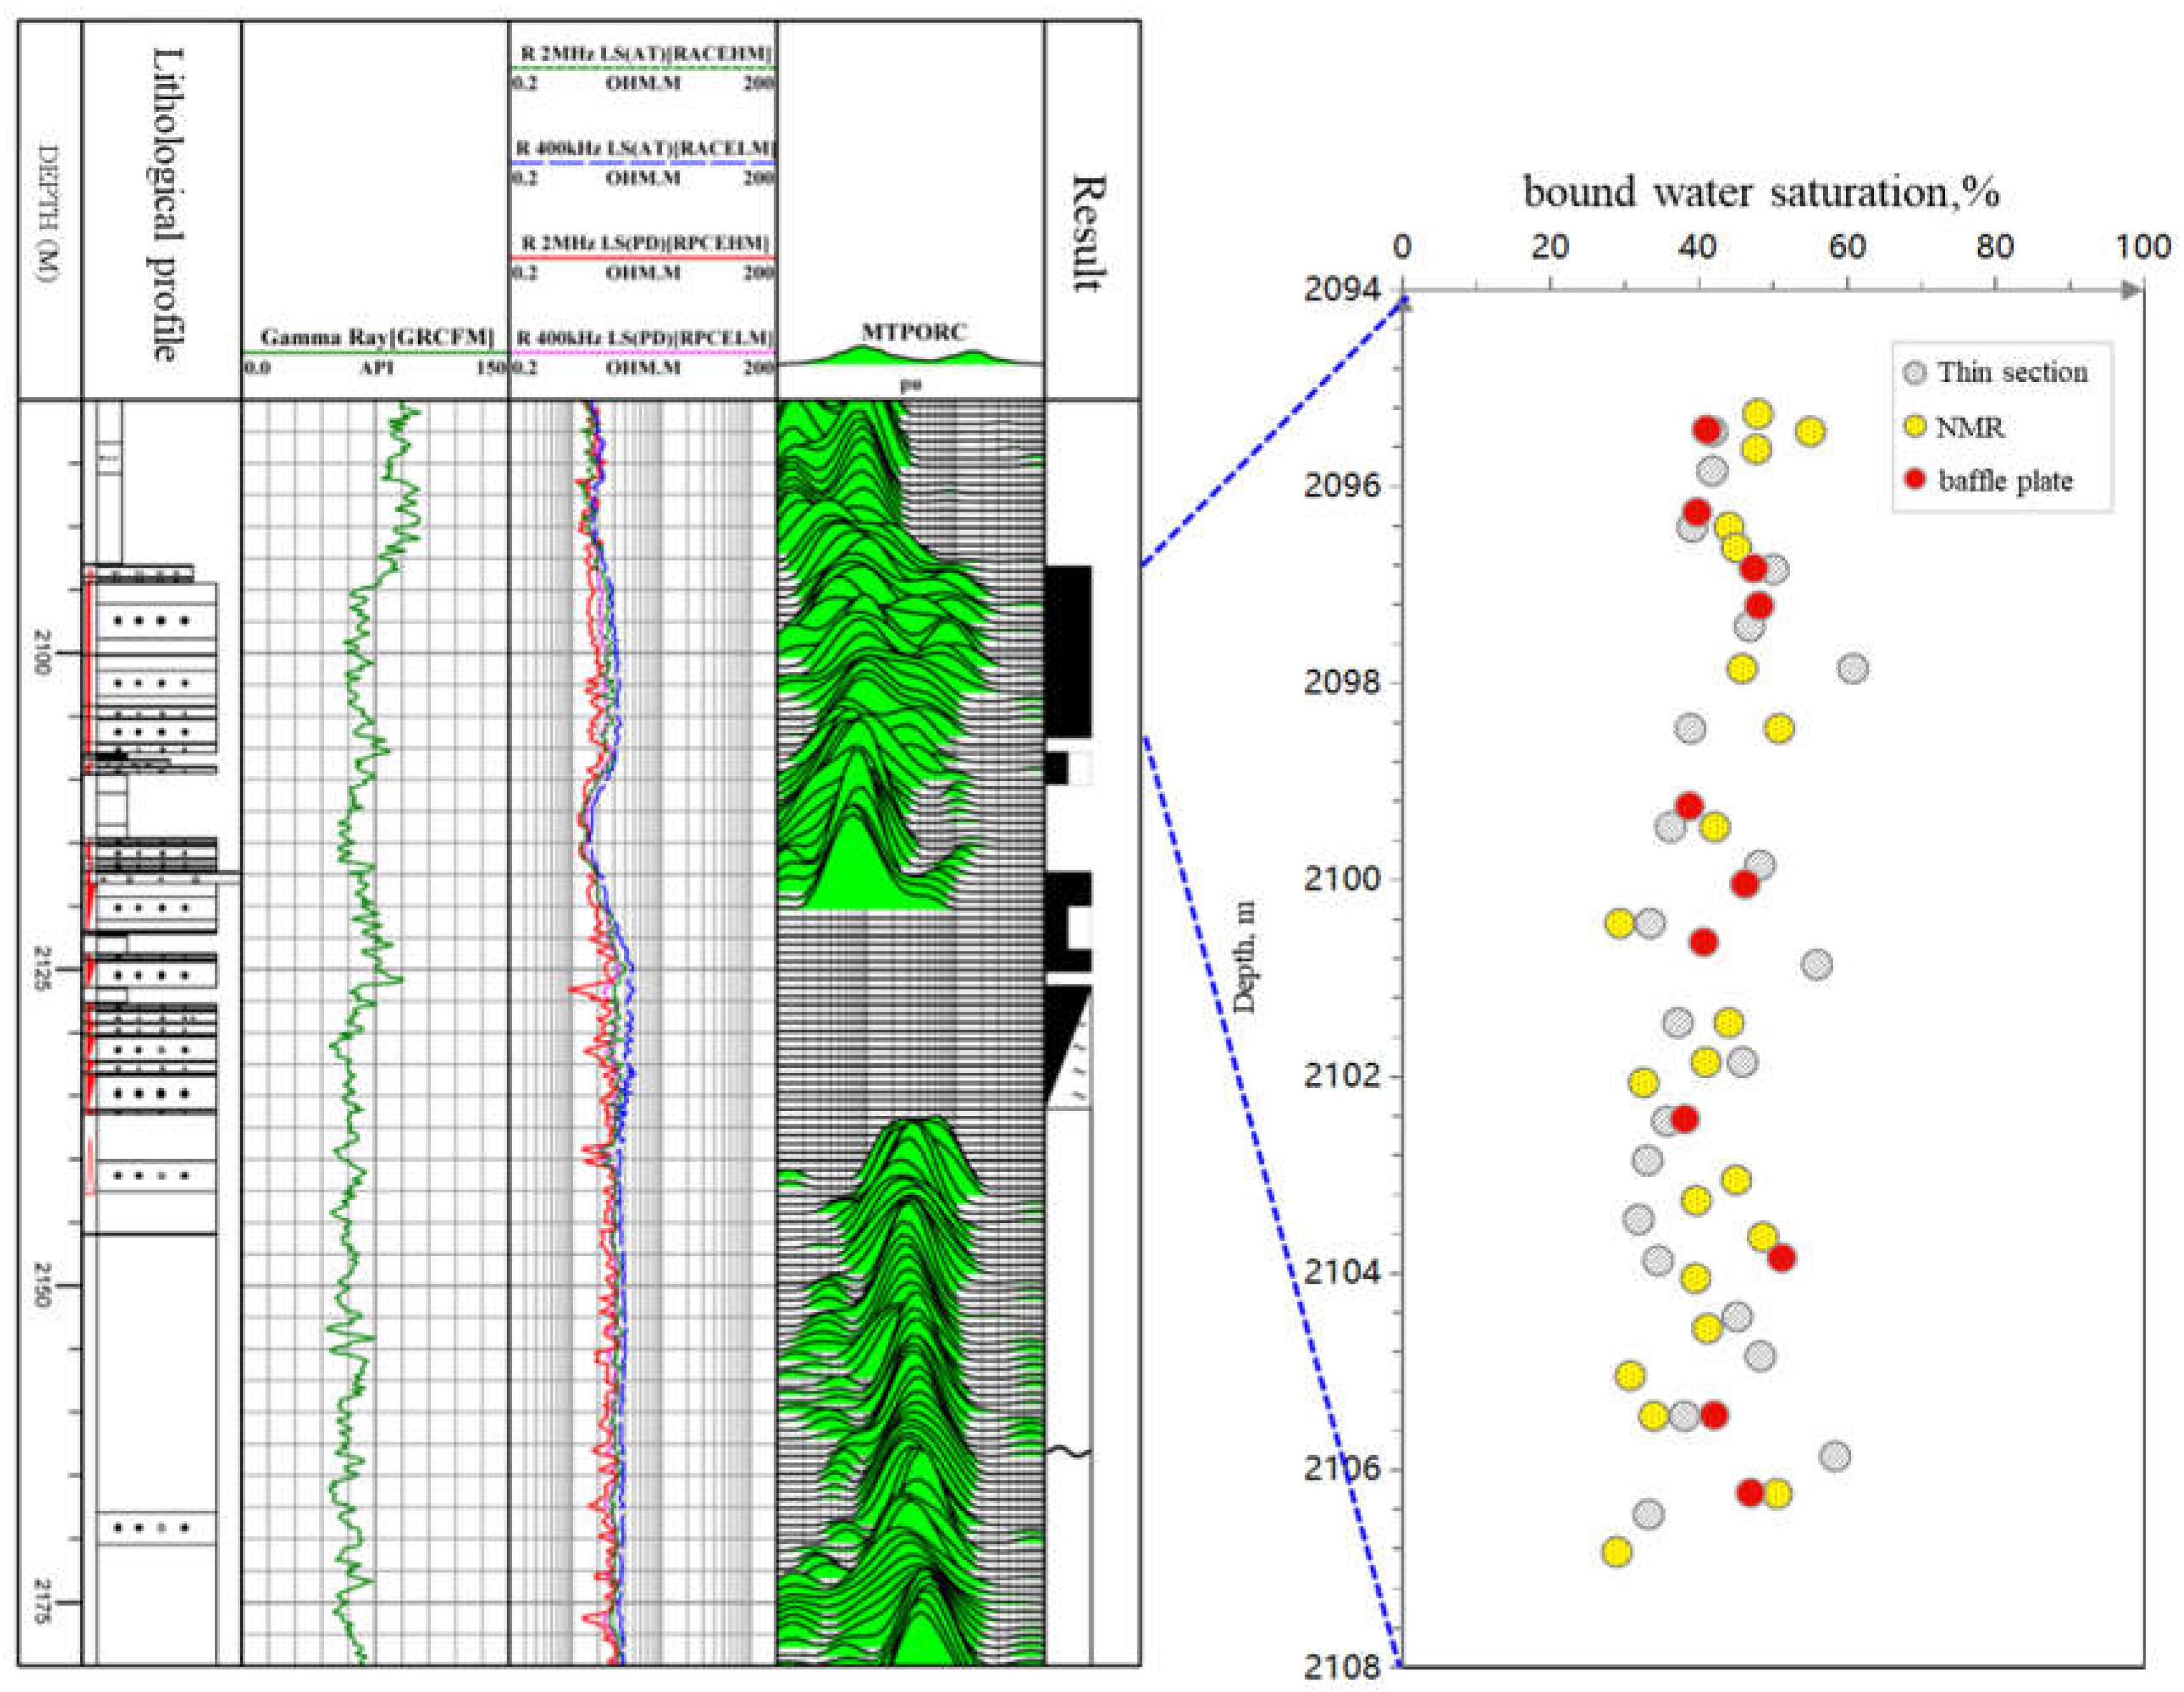
4. Validation Effect

Oilfield A is located in the middle of the Bohai Sea, and its main target layer is the Upper Tertiary Minghuazhen Formation, followed by the Guantao Formation. The Guantao Formation is a set of low-resistivity oil reservoirs with loose sandstone in lithology and a mid-high permeability in physical properties. The average porosity is 29.8%, and the average permeability is 802 mD. High bound water saturation is one of the main factors leading to the low resistivity of the Guantao Formation in the A oilfield. Developed in a braided river sedimentary environment with strong tectonic movement and low hydrodynamic force, this set of low-resistivity oil reservoirs has a high content of the matrix and is mostly supported by the matrix. Therefore, compared with the water layer, the compaction effect was enhanced, and the pore structure deteriorated [22].
Twenty-two cores were selected from the 2094–2108 m interval of the key core well in this block for the experimental measurement of casting thin sections. According to the reservoir conditions of this block, the critical pore throat radius was set to 0.3 µm, and then 22 casting thin sections were subjected to image processing to calculate bound water saturation. Some of the calculation results and the corresponding thin section images are shown in Figure 6. It can be clearly seen from the pore morphological characteristics in Figure 5 that under worse pore structures, the bound water saturation was higher.
In order to verify the accuracy in the thin section calculation of bound water saturation, 22 cores and 11 cores were selected from the same stratum in the core well for core NMR and semi-permeable baffle plate tests, respectively. The determination of bound water saturation by NMR and the semi-permeable baffle plate is described in the literature (7). The bound water saturation calculated by the thin section was compared with that determined by NMR and a semi-permeable baffle plate method, as shown in Figure 6. It can be seen from Figure 7 that the bound water saturation values calculated by the three methods were distributed in the range of 30–60%, exhibiting a consistent variation trend. Table 2 below shows the saturation of bound water calculated by the three methods. Since no parallel samples exist for the three experiments, the final statistics were obtained by interpolation. In contrast to the errors between most bound water saturation values of the thin section and the nuclear magnetic bound water saturation, in this study, the baffle plate bound water saturation values were controlled within 5%, indicating that those calculated by this method were reasonable.

5. Conclusions

Similar to X-CT and scanning electron microscopy, the cast thin section can also be obtained using two-dimensional structural information, such as pores and minerals, which can characterize the pore structure of rocks and their coordination relationships. In this study, based on the capillary theory, cast-thin section images were equated to rock cross-sections. The clay water film thickness was determined by the diffusion bilayer theory. An image processing technique was used to effectively extract the pore structure parameters of the cast thin section and, thus, determine the bound water saturation of the rock.
(1)
The salt and pepper noise in the thin section images could be effectively removed by median filtering, and the use of gamma transformation image enhancement technology effectively distinguished the pores and skeletons in thin section images.
(2)
The two-dimensional OTSU segmentation technique can enable the automatic and accurate collection of the pore characteristic parameters of the thin section.
(3)
For hydrophilic rocks with strong homogeneity, bound water saturation can be accurately calculated by thin section image processing technology. Compared with NMR and the semi-permeable baffle plate method, the proposed method for calculating bound water saturation was simpler and more practical for unconsolidated sandstone with expensive coring.
(4)
The rocks of sparse offshore sandstone were easily damaged when conducting core experiments. The method for calculating the bound water based on the cast thin section could effectively solve this problem. This method can provide a new way to find the bound water saturation of offshore sparse sandstone reservoirs.

Author Contributions

Conceptualization, Y.C. and J.M.; methodology, C.Z.; software, W.Y.; validation, Y.C., J.M. and Z.Z.; formal analysis, Y.C.; investigation, Y.C.; resources, Y.C.; data curation, J.M.; writing—original draft preparation, Y.C.; writing—review and editing, W.Y. and X.S.; visualization, W.Y.; supervision, Z.Z.; project administration, Y.C.; funding acquisition, C.Z. All authors have read and agreed to the published version of the manuscript.

Funding

This study is supported by the Demonstration of Cryptographic Adjustment and Enhanced Recovery Reservoir Engineering Technology in Bohai Oilfield (National Science and Technology Major Project) (2016ZX05058-001); CNOOC (China) Limited Major Science and Technology Special Project “Bohai Oilfield Key Technology Research Topic 1 for Stabilizing Production of 30 Million Tons and Increasing Production of 40 Million Tons: Enhanced Water Drive and Production Increasing and Tapping Technology in Bohai Oilfield “(CNOOC-KJ 135ZDXM 36TJ01TJ-GD 2020-02); CNOOC (China) Ltd. comprehensive scientific research project “Key Technologies and Practices for Exploration and Development of Low-Pore Low Oil and Gas Fields in Offshore China” (CNOOC-KJ 125ZDXM 07 LTD 01).

Data Availability Statement

The data that has been used is confidential.

Conflicts of Interest

The authors declare that they have no known competing financial interests or personal relationships that could have appeared to influence the work reported in this paper.

References

  1. Wu, M.; Qin, Y.; Shen, J.; Song, D.; Wang, X.; Zhang, G.; Li, G.; Zhu, S. Influencing factors of irreducible water saturation in tight sandstone reservoirs case study of Linxing Area in Ordos Basin. J. Jilin Univ. (Earth Sci. Ed.) 2022, 52, 68–79. [Google Scholar]
  2. Freedman, R.; Heaton, N.; Flaum, M.; Hirasaki, G.J.; Flaum, C.; Hürlimann, M. Wettability, saturation and viscosity from NMR measurements. SPE J. 2003, 8, 317–327. [Google Scholar] [CrossRef]
  3. Wang, Z. Calculation Method of lrreducible Water saturation of lower assemblage reservoir in Fuxian Oil Region. J. Xi’an Shiyou Univ. (Nat. Sci. Ed.) 2021, 36, 66–70. [Google Scholar]
  4. Sima, L.; Yin, R.; Wang, L. Determining methods of the irreducible water saturation of low-resistivity Oil Layers in Toutunhe Formation, Junggar Basin. Well Logging Technol. 2019, 43, 122–128. [Google Scholar]
  5. Cheng, R.; Li, K.; Hu, X.; Yuan, W.; Gao, C. X-X Gas Field bound water saturation evaluation in Yingqiong Basin. Offshore Oil 2018, 38, 67–71. [Google Scholar]
  6. Lu, Y.; Cui, Y.; Zhang, J.; Qi, Y. Calculation method of saturation of Neogene reservoirs with high irreducible water and low resistivity in Bohai Sea. Pet. Geol. Eng. 2022, 36, 72–77. [Google Scholar]
  7. Zhang, C.; Zhang, C.; Zhan, Z.; Qin, R.; Yu, J. Comparative experimental study of the core irreducible water saturation of tight gas reservoir. Nat. Gas Geosci. 2016, 27, 352–358. [Google Scholar]
  8. Gui, T.; Wei, D.; Wang, J.; Zhu, Q.; Fang, F.; Xie, K. Experimental test and mechanism of the irreducible water saturation for gas reservoirs. Pet. Geol. Oilfield Dev. Daqing 2017, 36, 81–84. [Google Scholar]
  9. Liu, P.; Lu, K.; Zhou, W.; Wang, W.; Ou, Z. Experimental evaluation of irreducible water changes during the production of high temperature and high-pressure gas reservoirs in X gas field. Pet. Geol. Eng. 2020, 34, 116–119. [Google Scholar]
  10. Wu, Y.; Hu, X.; Yang, D. A new method of obtaining core irreducible water saturation based on capillary pressure curve. Geol. Sci. Technol. Inf. 2018, 37, 68–79. [Google Scholar]
  11. Sun, P.; Cui, S.; Zhang, X.; Li, N.; Cao, X.; Guo, H. A T2cutoff optimization method constrained by irreducible water saturation obtained in petrophysical experiment. Well Logging Technol. 2019, 43, 410–415. [Google Scholar]
  12. Cheng, Y.; Zhang, C.; Zhu, L.Q. A fractual irreducible water saturation model for capillary tubes and its application in tight gas reservoir. J. Pet. Sci. Eng. 2017, 159, 731–739. [Google Scholar] [CrossRef]
  13. Xiao, L.; Mao, Z.Q.; Jin, Y. Calculation of irreducible water saturation from NMR logs in tight gas sands. Appl. Magn. Reson. 2012, 42, 113–125. [Google Scholar] [CrossRef]
  14. Peng, L.; Zhang, C.; Ma, H.L.; Pan, H. Estimating irreducible water saturation and permeability of sandstones from nuclear magnetic resonance measurements by fractal analysis. Mar. Pet. Geol. 2019, 110, 565–574. [Google Scholar] [CrossRef]
  15. Zhang, C.; Mao, Z.; Jin, Y. Experimental studies of NMR logging irreducible water saturation. Nucl. Electron. Detect. Technol. 2010, 30, 0517. [Google Scholar]
  16. Mao, Z.Q.; Kuang, L.C.; Xiao, C.W.; Li, G.; Zhou, C.; Ouyang, J. Identification and evaluation of low resistivity pay zones by well log sand the petrophysical research in China. Pet. Sci. 2007, 4, 41–48. [Google Scholar]
  17. Zhang, X.; Dai, Z.; Liu, L.; Peng, X. Application of theory of water film to reform the reservoir in tight and low permeability sandstone. Mineral. Petrol. 1998, 35, 161–163. [Google Scholar]
  18. He, C. The thick of water-film in oil and gas Reservoirs. Pet. Explor. Dev. 1998, 25, 75–77. [Google Scholar]
  19. Wang, L.; Sun, Y.; Nie, C.; Shi, J. Boundary curve recognition and extraction of granite composition based on RGB color space. China Sci. 2016, 11, 1525–1529. [Google Scholar]
  20. Gong, Q.; Fu, Y.; Ye, J.; Yao, Y. Otsu image segmentation algorithm based on rebuilding of two-dimensional histogram. Comput. Sci. 2013, 40, 313–315. [Google Scholar]
  21. Zhang, H. Research of Color Image Segmentation Based on the Combination of OTSU and Region Growing Method. Master’s Thesis, Shandong Normal University, Jinan, China, 2016. [Google Scholar]
  22. Jin, B.; Chen, J.; Shu, X.; Zhou, J.; Deng, M. Depositional characteristics of the low-resistance oil reservoirs of the Guantao formation in the Bohai sea and their control factors: A perspective of oilfield. Mar. Geol. Front. 2021, 37, 17–22. [Google Scholar]
Figure 1. Actual rock sample and simplified model.
Processes 11 01397 g001
Figure 2. Rock sample section and simplified model. (a) True rock sample section (the casting thin section). (b) Equivalent capillary section.
Processes 11 01397 g002
Figure 3. Stern and diffusion layers.
Processes 11 01397 g003
Figure 4. Flow chart of technical implementation.
Processes 11 01397 g004
Figure 5. Slice image preprocessing and threshold segmentation.
Processes 11 01397 g005
Figure 6. Irreducible water saturation results of some slices.
Processes 11 01397 g006
Figure 7. Comparison chart of irreducible water saturation calculated by the thin section of coring well section in an oilfield.
Processes 11 01397 g007
Table 1. Extraction results of the pore area and the perimeter of thin slice.
No.Area of ViewWeek
Length, μm
Actual
Area,
μm2
Actual
Circumference, μm
No.Area of ViewWeek
Length, μm
Actual Area,
μm2
Actual
Circumference,
μm
121.960.0030.078126219,6381582.3831.4263.30
221.960.0030.078126319,685745.4331.5029.82
321.960.0030.078126420,813849.6033.3033.98
433.920.0050.157126521,6282577.7734.61103.11
533.090.0050.1241266219191056.2435.0742.25
634.590.0050.184126728,3911935.9745.4377.44
733.920.0050.157126829,4491900.3647.1276.01
833.920.0050.157126931,8301285.8450.9351.43
934.590.0050.184127032,9551553.9652.7362.16
1033.090.0050.124127133,7871255.1254.0650.20
1135.620.0050.225127239,2232132.7962.7685.31
1234.590.0050.184127356,7881804.1490.8672.17
1334.590.0050.184127467,5052275.36108.0091.01
1434.590.0050.184127570,9993399.31113.60135.97
1534.590.0050.184127671,5544020.60114.49160.82
1633.920.0050.157127773,1723199.89117.08128.00
1733.920.0050.157127886,5314428.94138.45177.16
1835.260.0050.225127989,6373519.58143.42140.78
1933.090.0050.1241280112,9284209.25180.69168.37
2033.090.0050.1241281128,0124289.41204.82171.58
2133.090.0050.1241282128,8775142.98206.20205.72
2233.920.0050.1571283145,1116169.76232.18246.79
2333.920.0050.1571284164,4798032.20263.17321.29
2433.090.0050.1241285271,5748386.19434.52335.45
2535.620.0050.2251286401,35216616.95642.16664.68
Table 2. Bound water saturation calculation result statistics.
No.Depth, mSemi-Permeable Baffle Plate Bound Water Saturation, %NMR Bound Water Saturation, %Thin Section Bound Water Saturation, %
12095.441.147.142.3
22096.339.744.039.5
32096.847.344.248.5
42097.248.147.347.5
52099.340.142.138.9
62100.146.242.347.1
72100.640.638.739.6
82102.438.136.937.5
92103.851.150.239.8
102105.442.141.641.1
112106.246.947.945.7
Disclaimer/Publisher’s Note: The statements, opinions and data contained in all publications are solely those of the individual author(s) and contributor(s) and not of MDPI and/or the editor(s). MDPI and/or the editor(s) disclaim responsibility for any injury to people or property resulting from any ideas, methods, instructions or products referred to in the content.

