
Investigating the Power of LSTM-Based Models in Solar Energy Forecasting

 ,
,  , , , ,
  and
and
Abstract
:1. Introduction
- Analyze and compare the relevant papers that have been proposed and discussed LSTM models on solar irradiance prediction.
- Identify better models among standalone and hybrid models of LSTM to predict solar irradiation and PV power by comparing the features of prediction parameters.
- Discuss in depth regarding the characteristics and mechanism of LSTM and how it is able to integrate with other methods to improve the performance of solar prediction accuracy.
2. Related Works
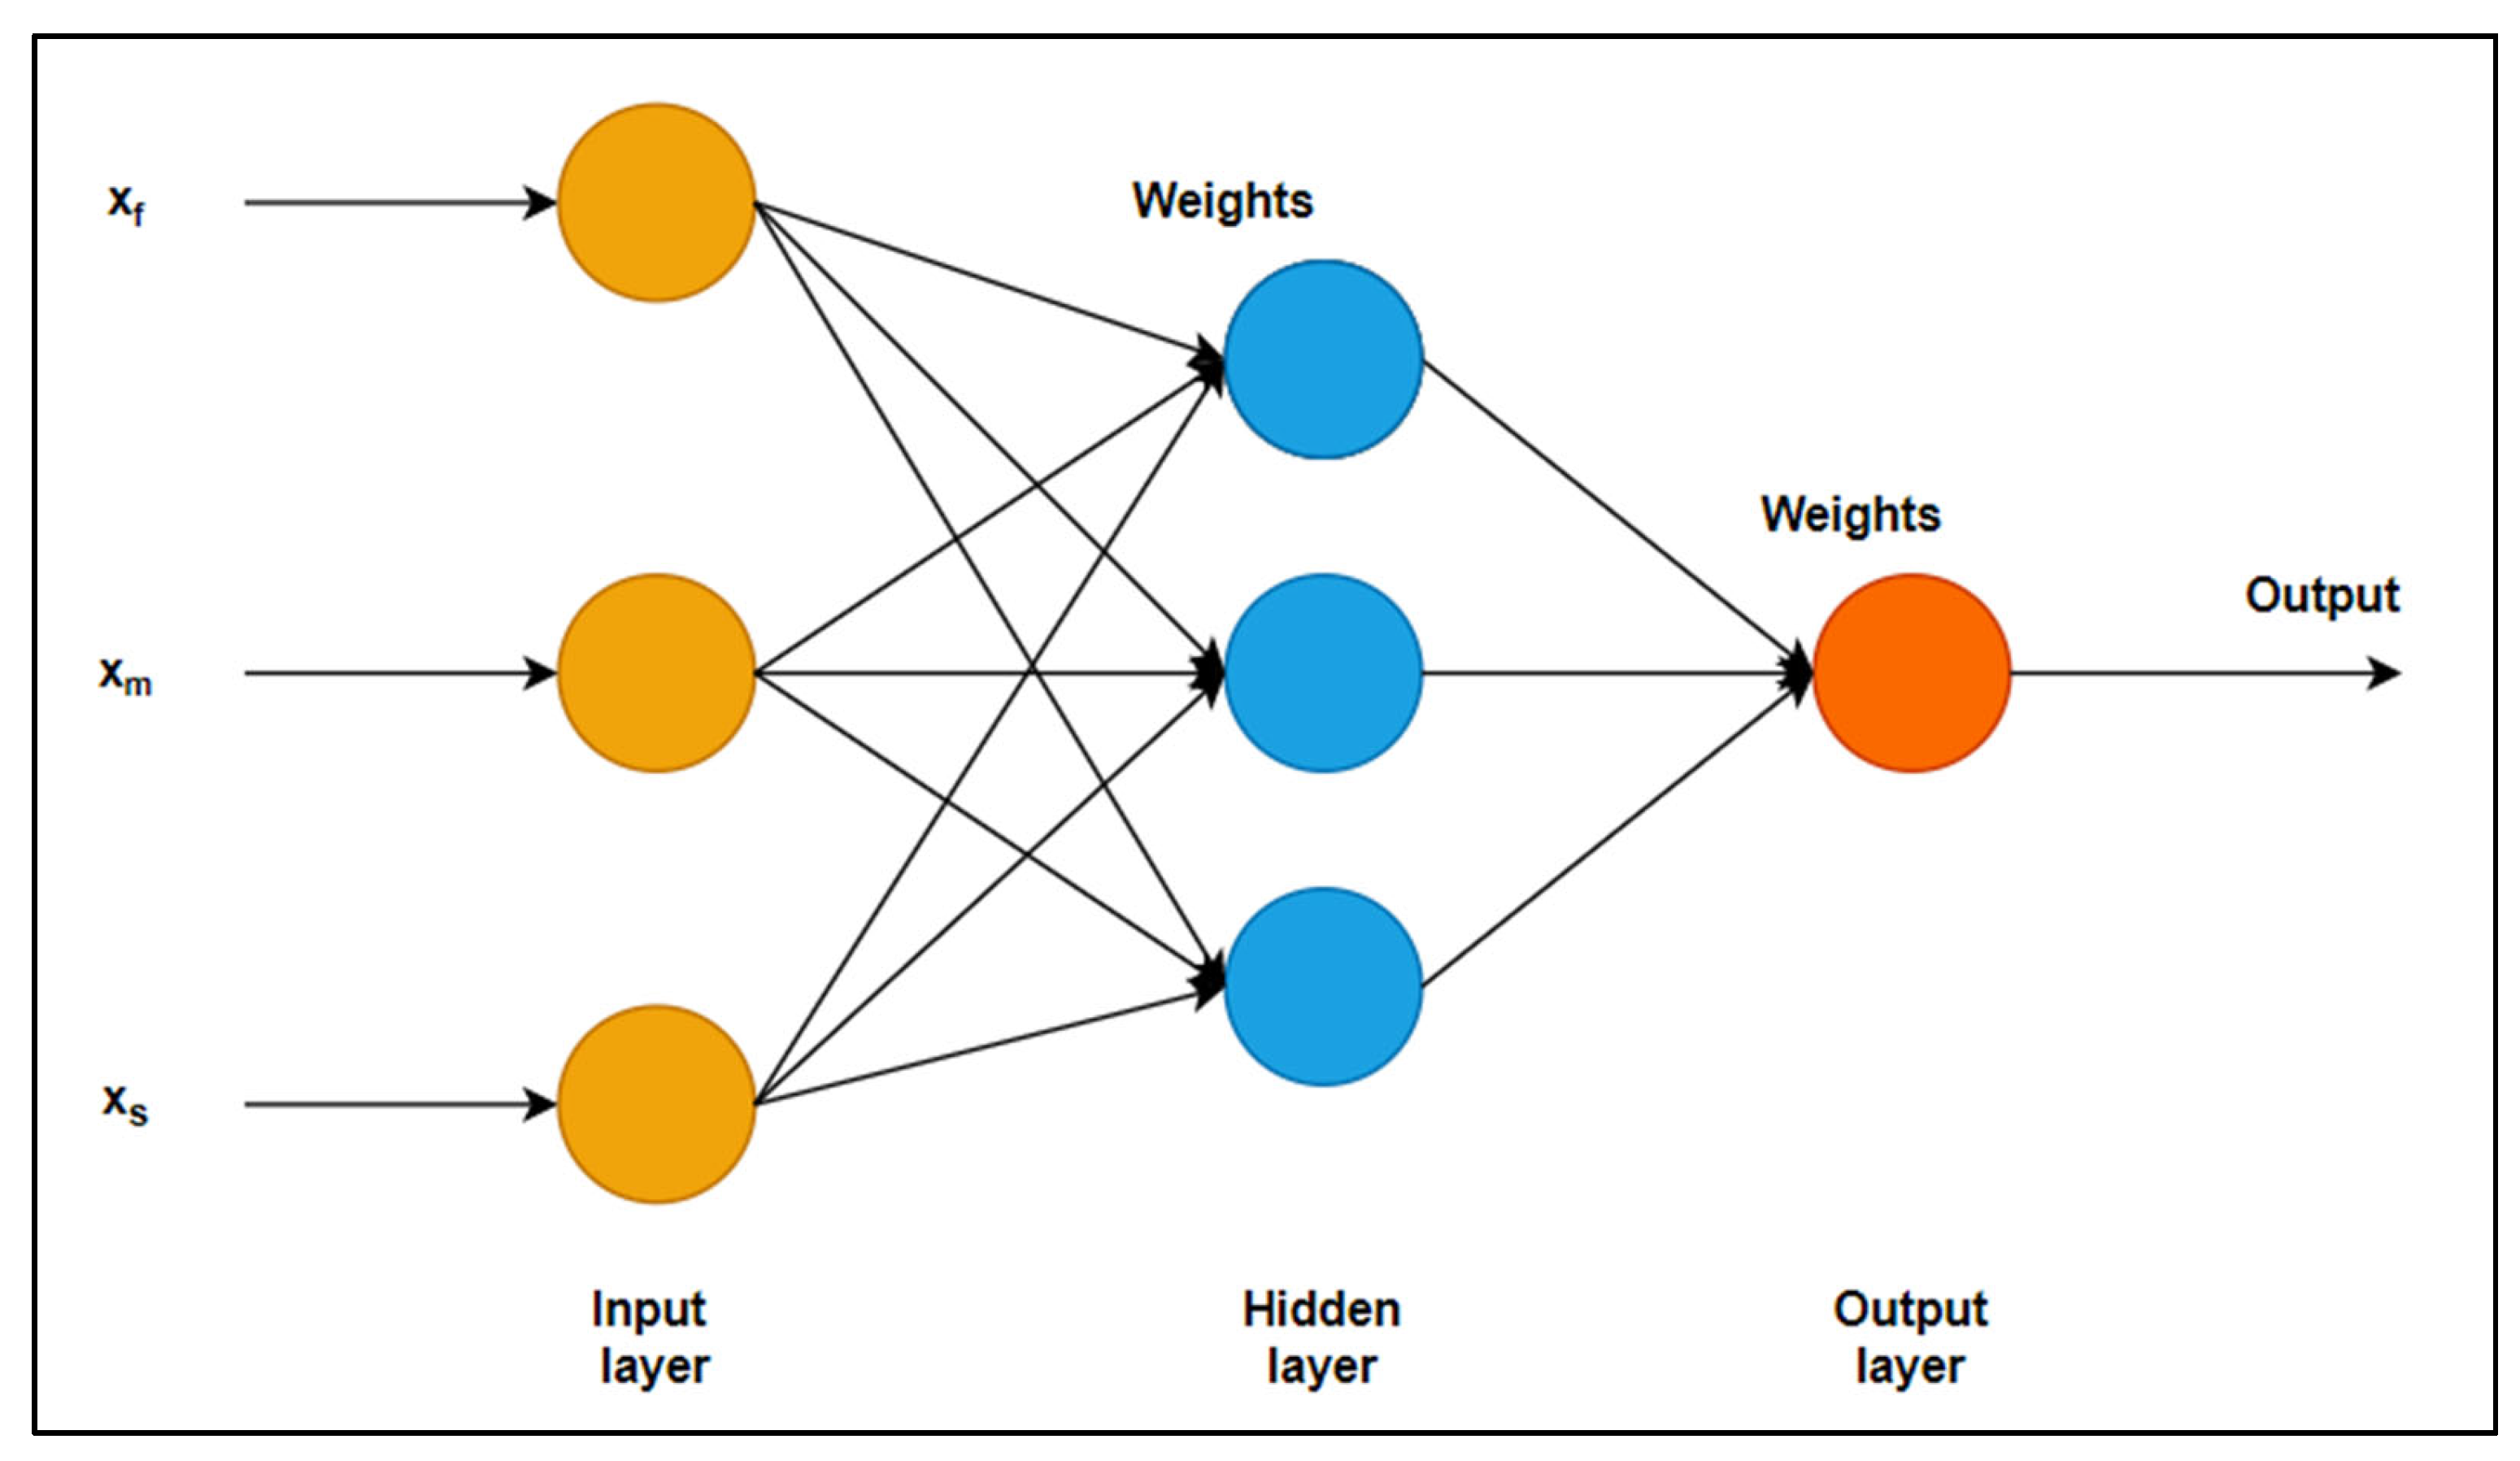
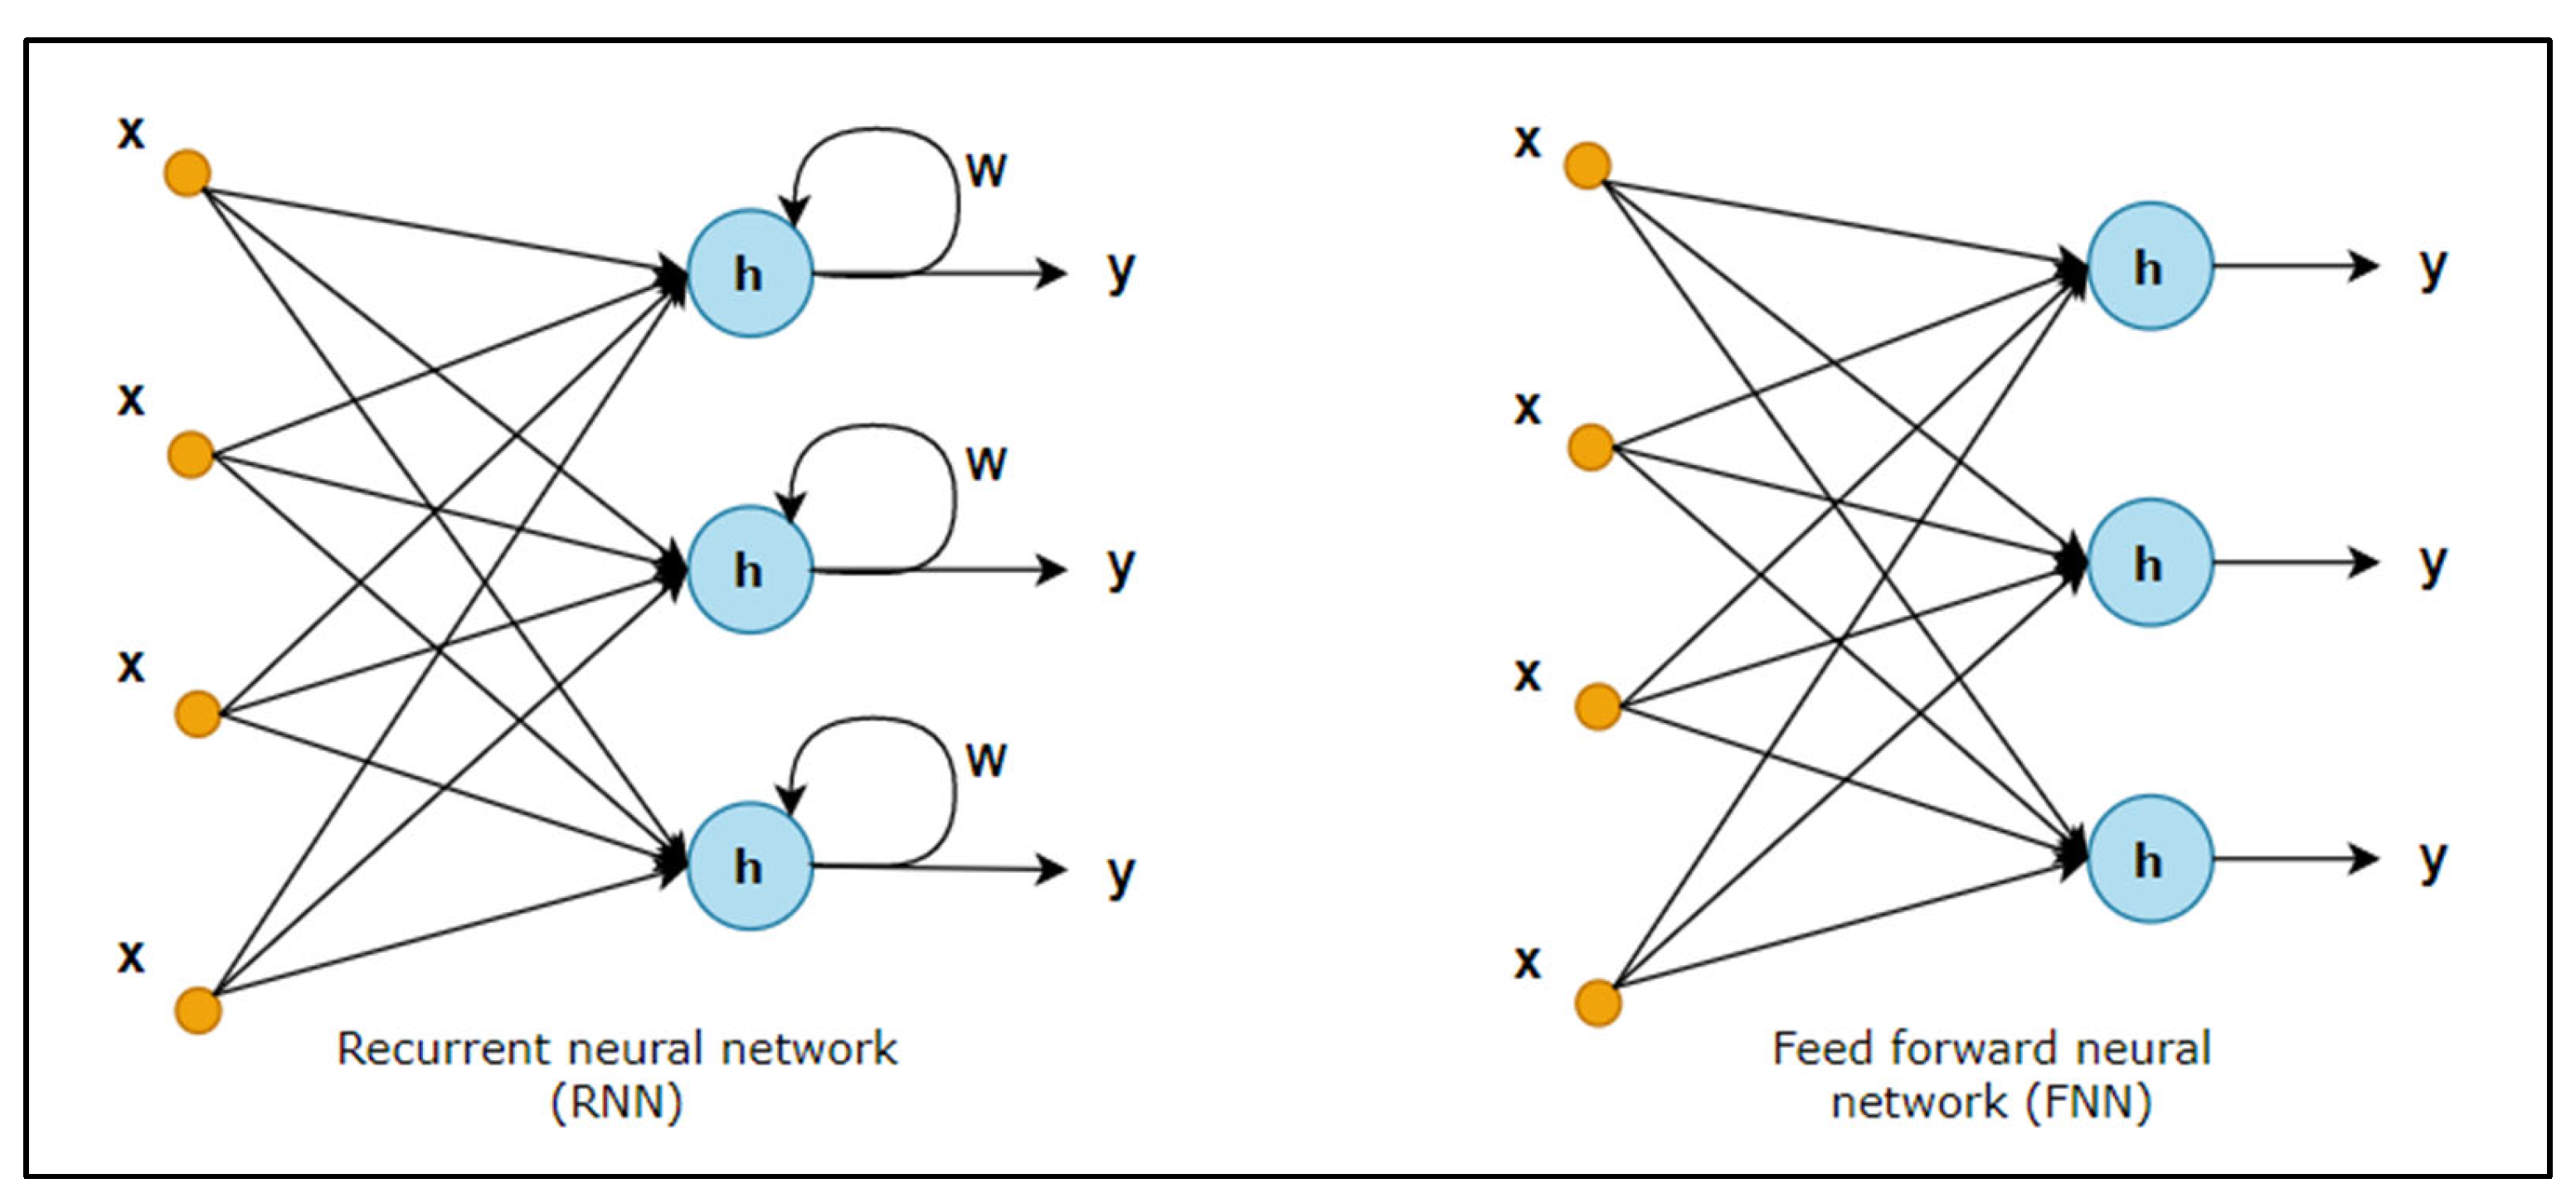
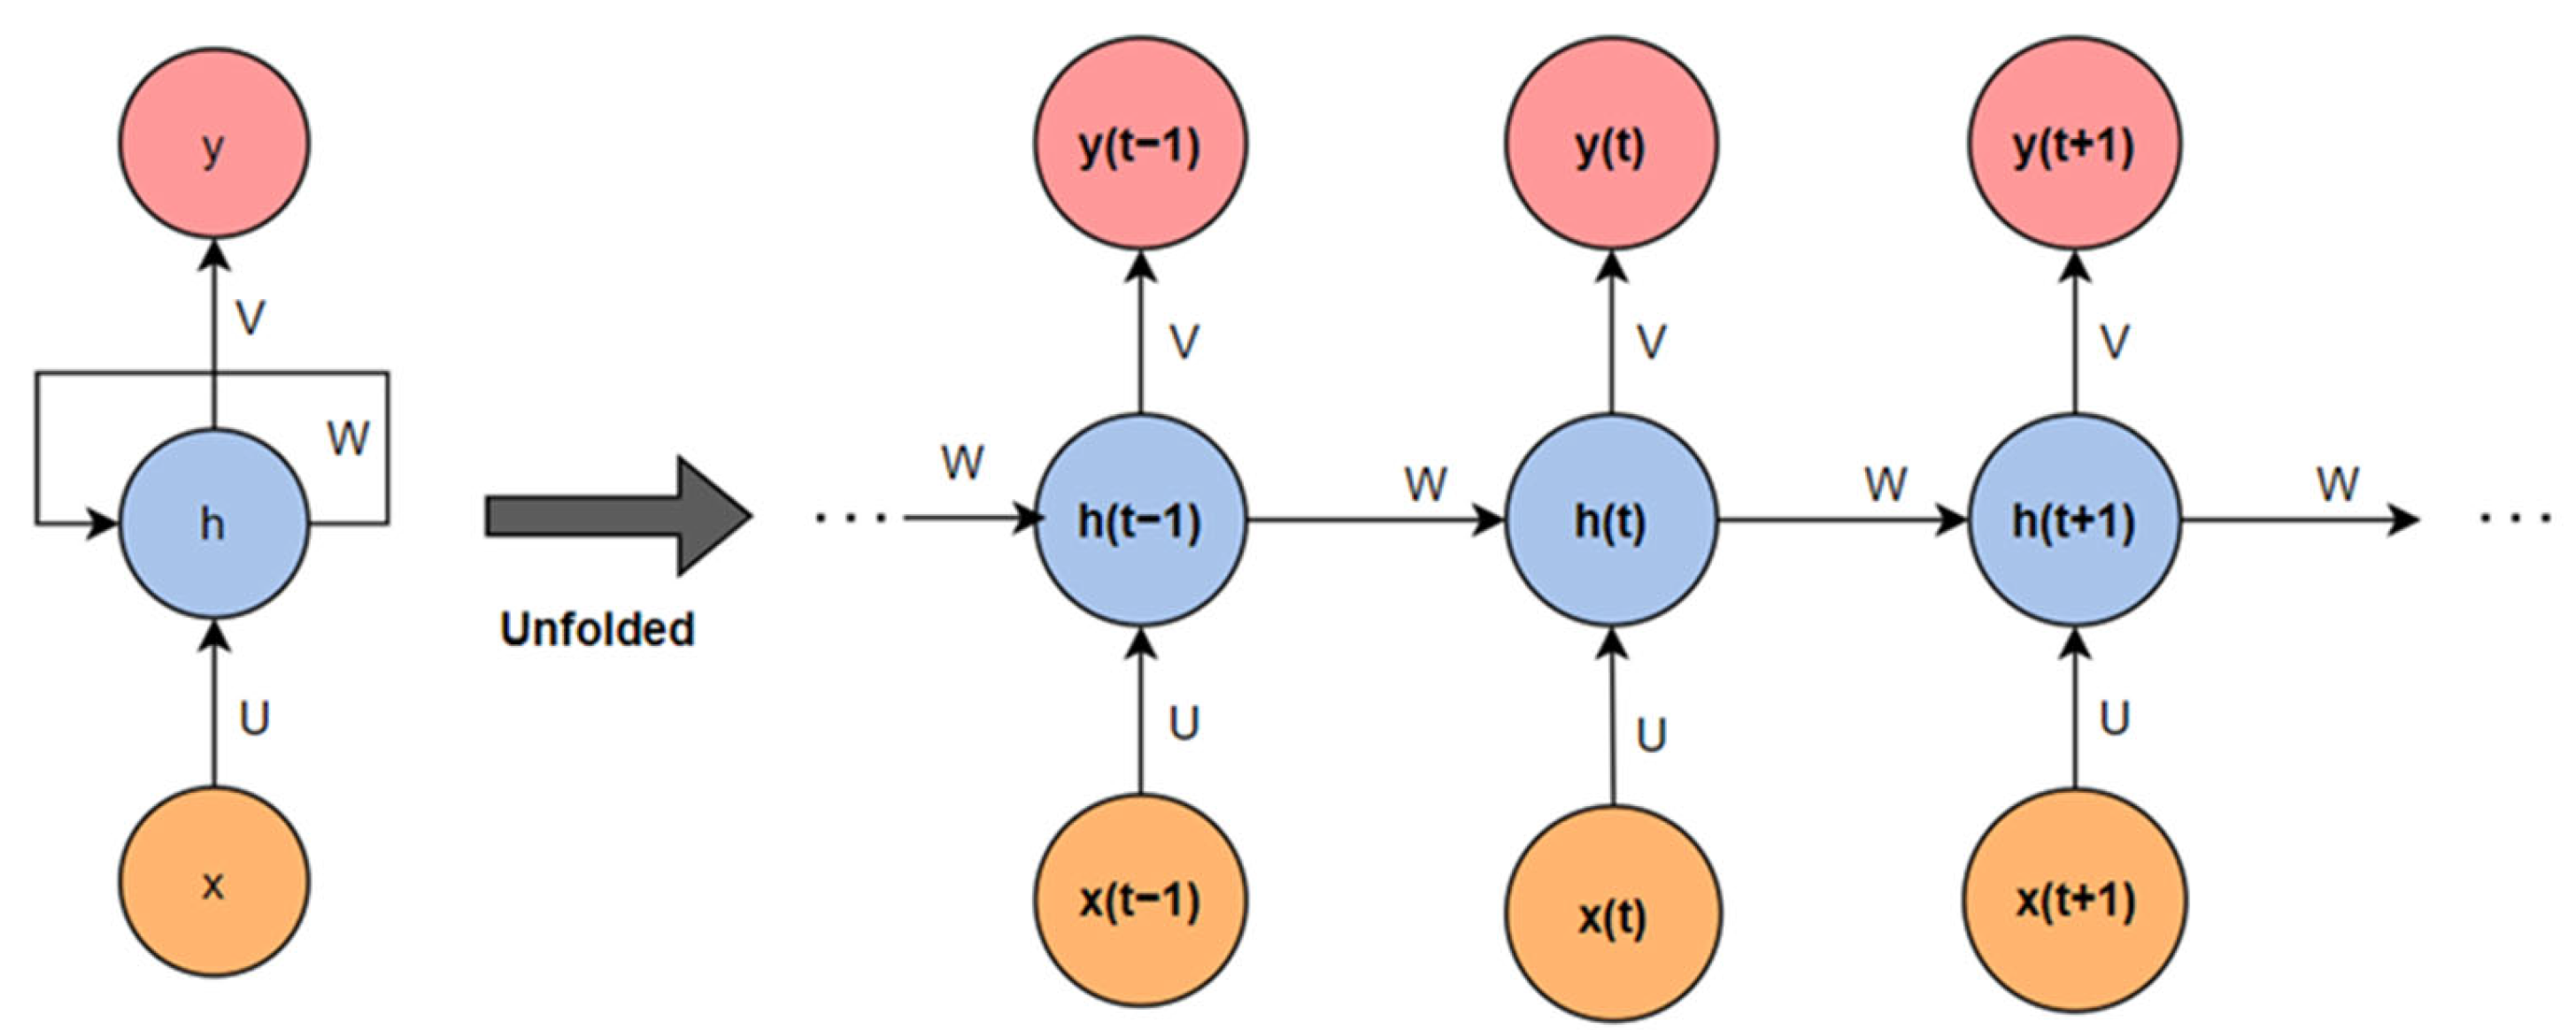
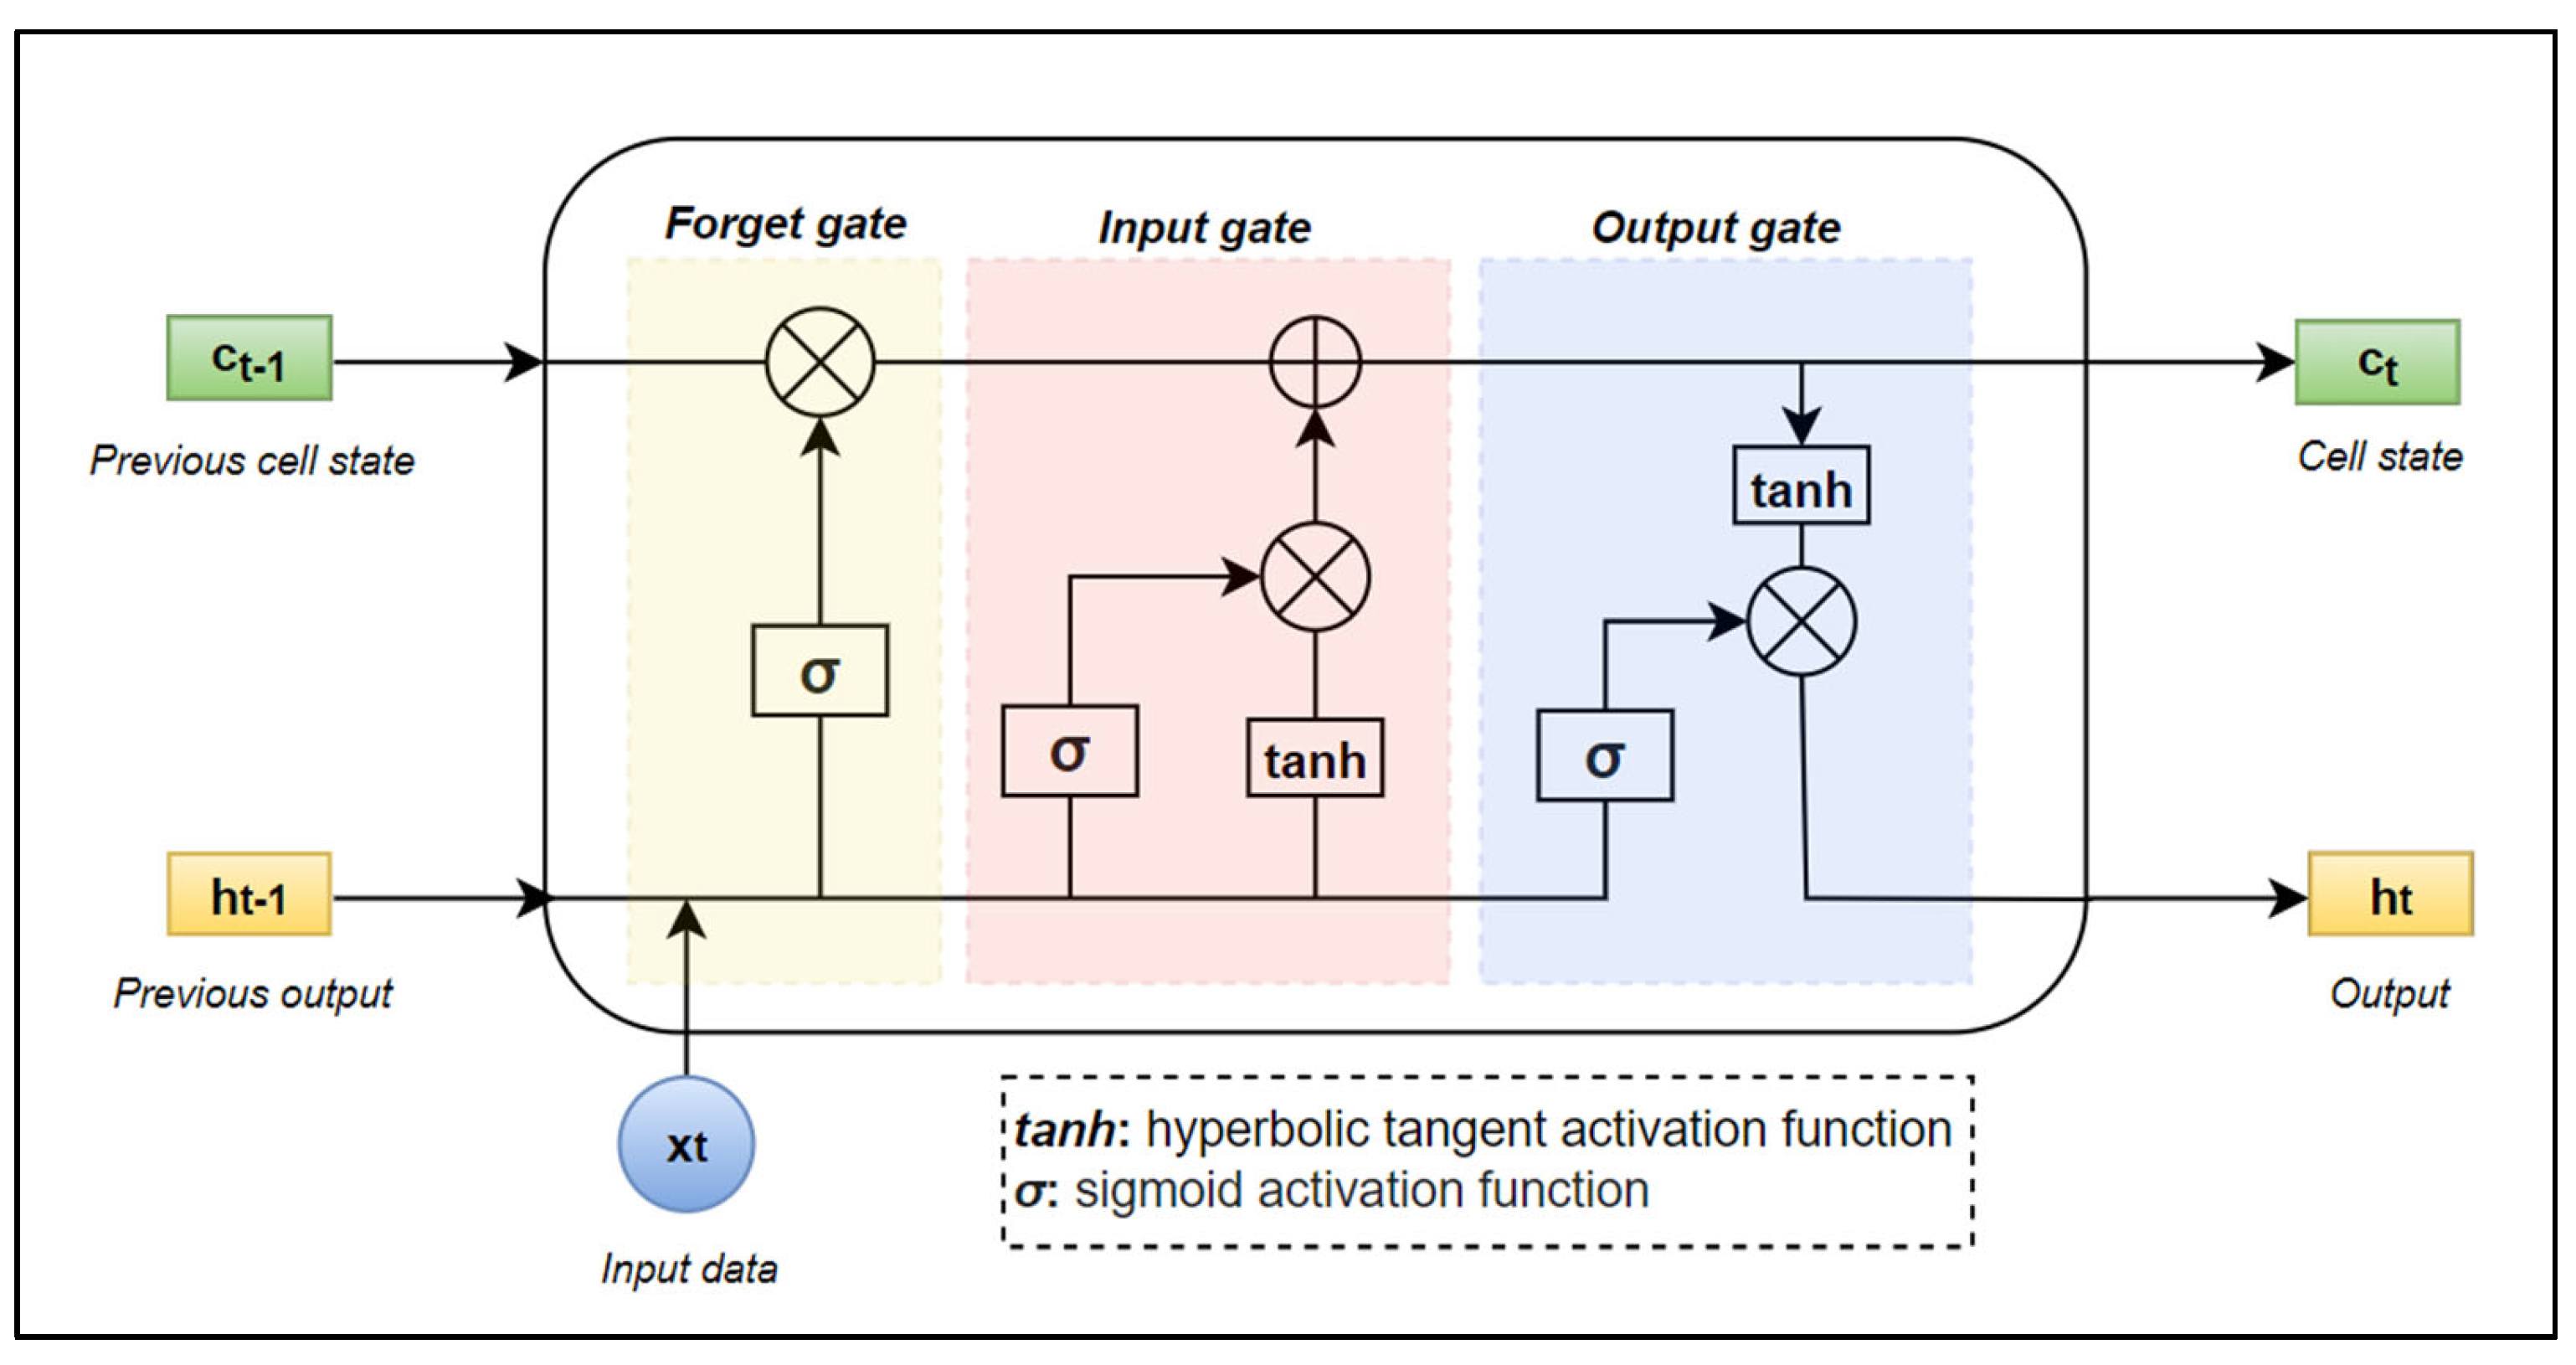
3. LSTM
4. Hybrid Models
5. Evaluation Metrics
6. Analysis of Past Studies
6.1. Accuracy
6.2. Types of Input Data
6.3. Forecast Horizon
- Very short-term forecast (ahead by 1 min to several minutes);
- Short-term forecast (ahead by 1 h or several hours to 1 day or 1 week);
- Medium-term forecast (ahead by 1 month to 1 year); and
- Long-term forecast (ahead by 1–10 years).
6.4. Type of Season and Weather
6.5. Training Time
7. Future Directions
- In terms of comparing and analyzing the available source code, not all the reviewed papers provided the data source codes; it is recommended for future works to find the data sources to describe the data and analyze their differences.
- Regarding performance evaluation, it is difficult to compare accuracy efficiently between the prediction models due to several main factors such as different evaluation metrics used, weather conditions of selected regions, forecasting horizons, size of input parameters, and so on. Thus, it is suggested to find specific research papers that discuss or review similar factors as mentioned, to compare the performance effectively.
- This paper has mostly reviewed very short-term and short-term forecast horizons for solar irradiance and solar power forecasting (Table 3 and Table 4). For future work, it is recommended to expand the review on medium-term and long-term forecast horizons by applying various combinations of DL and ML models to enhance the existing hybrid models.
8. Conclusions
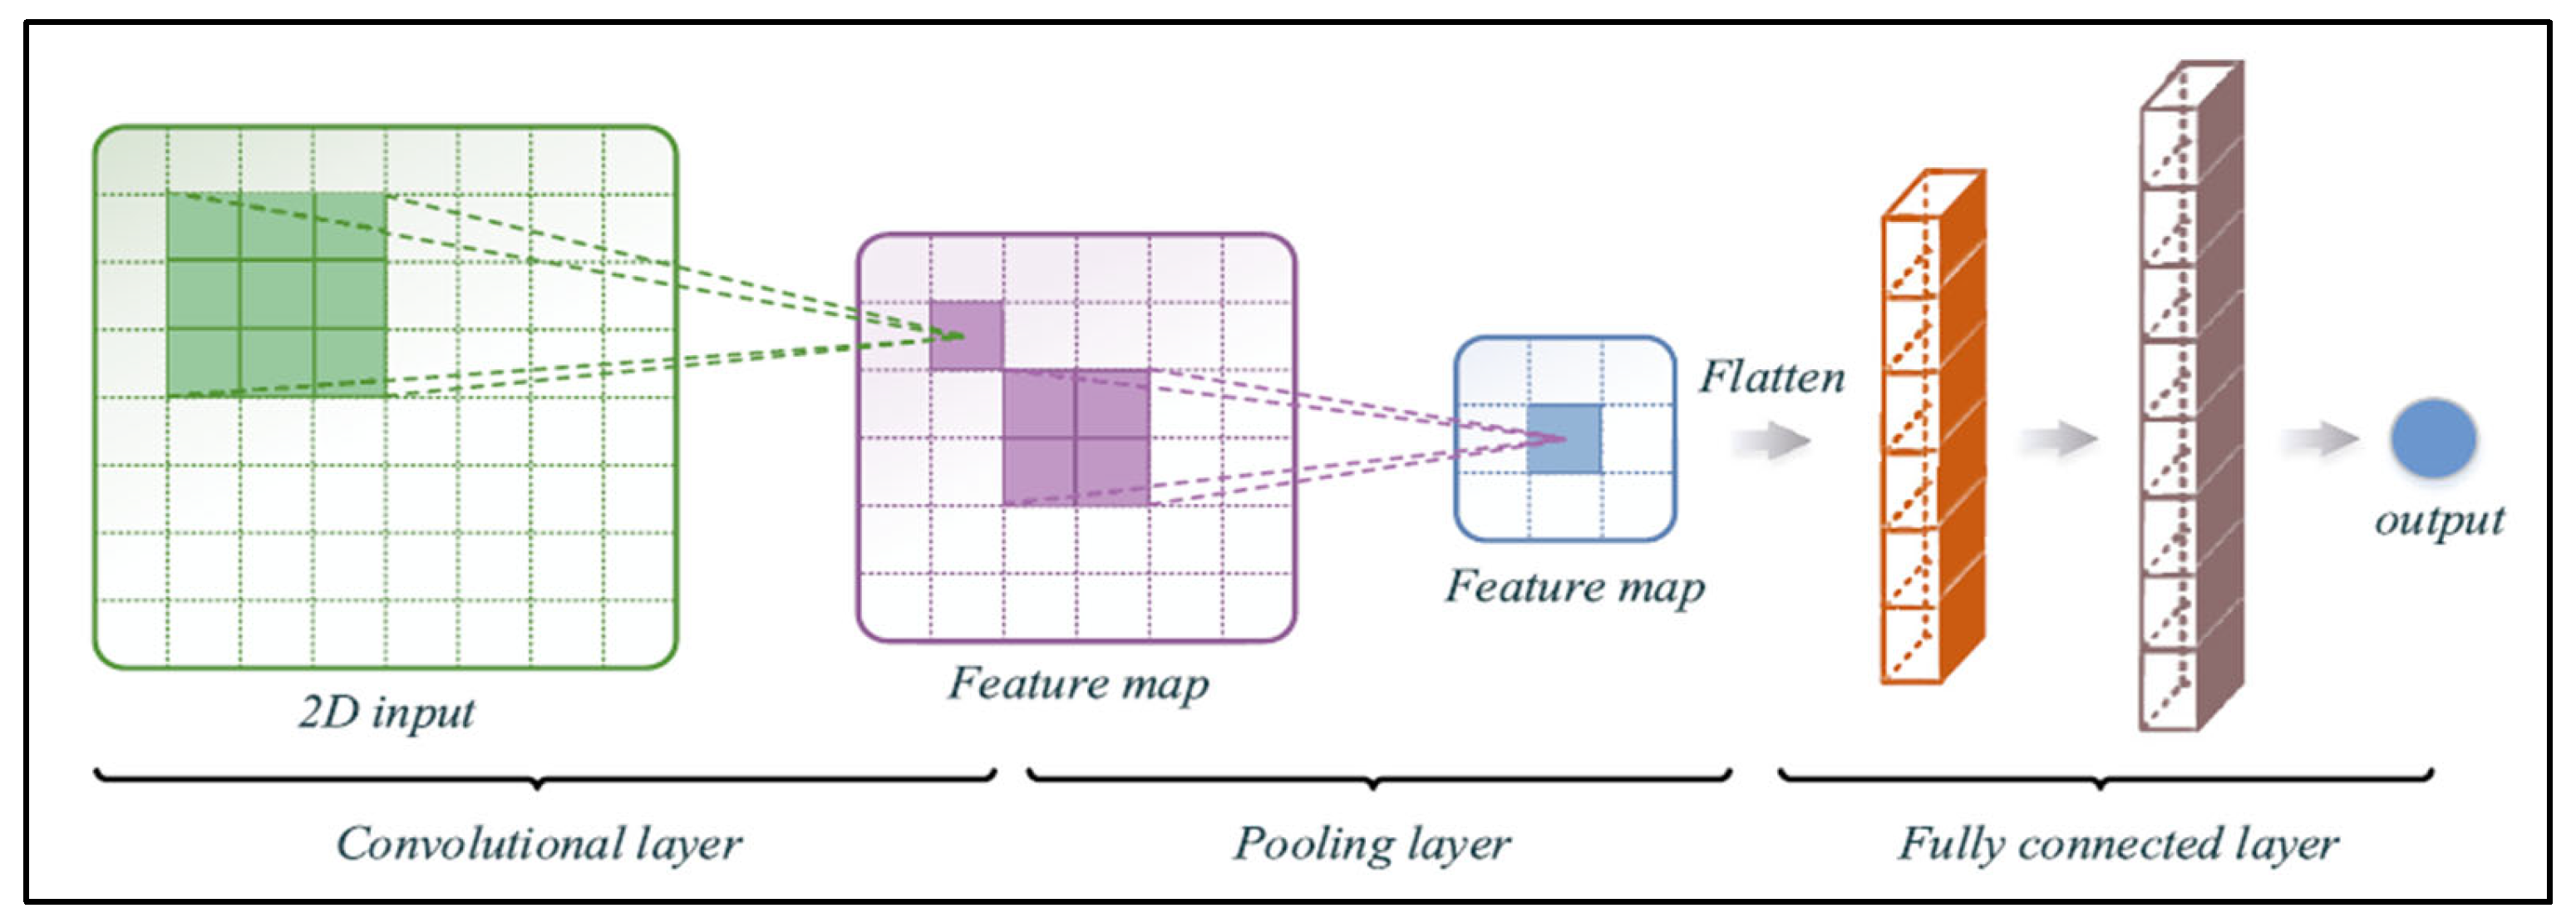
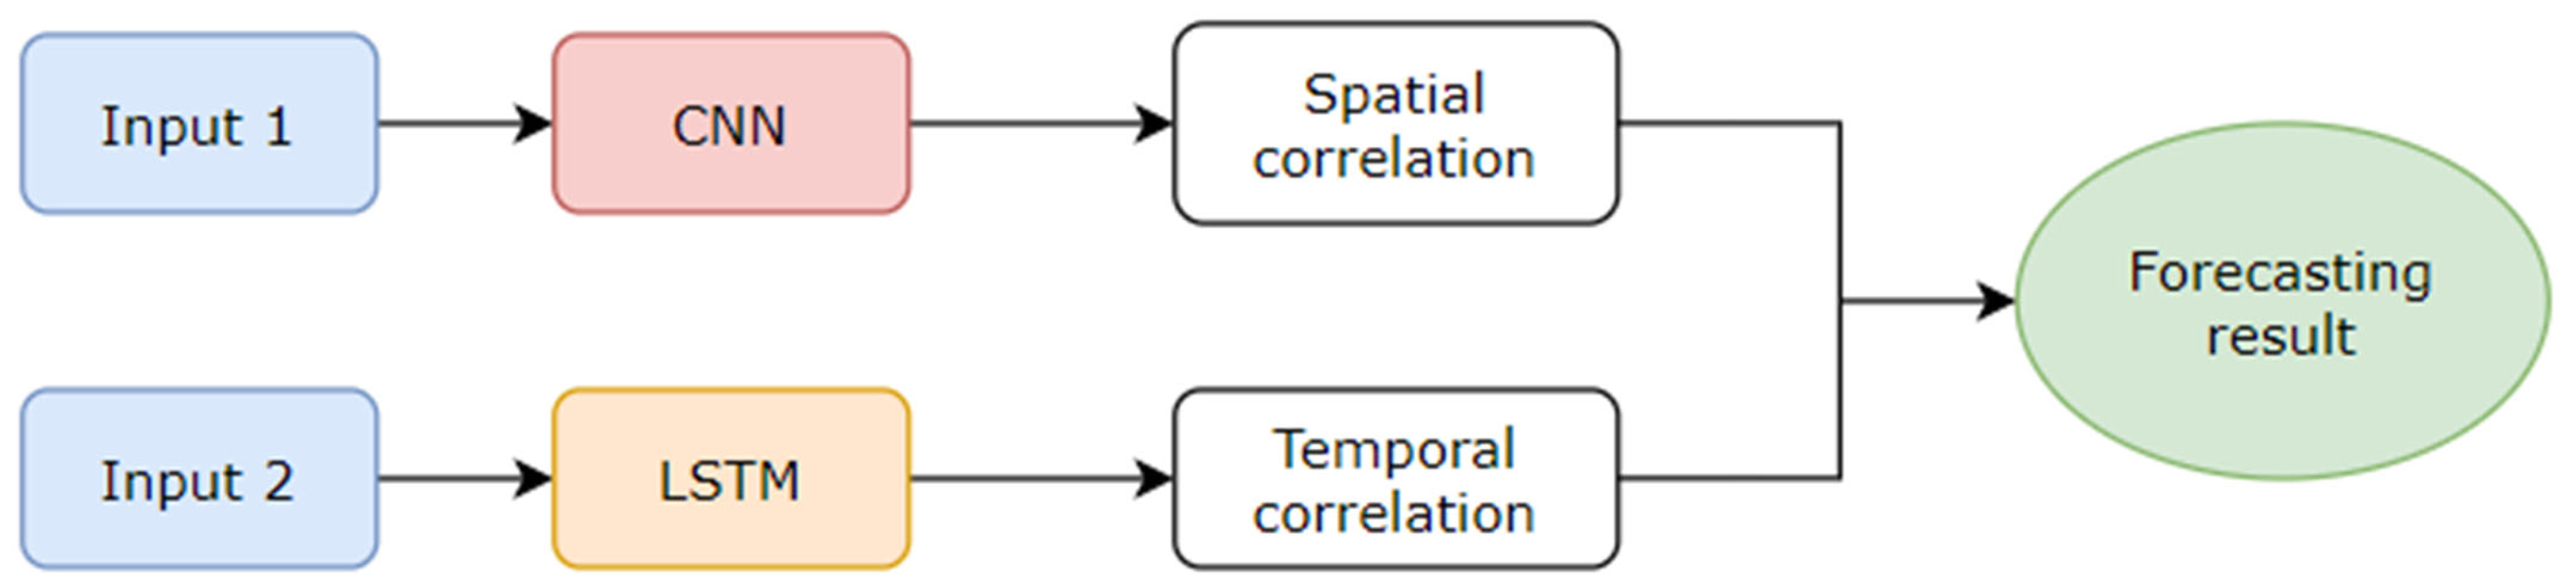
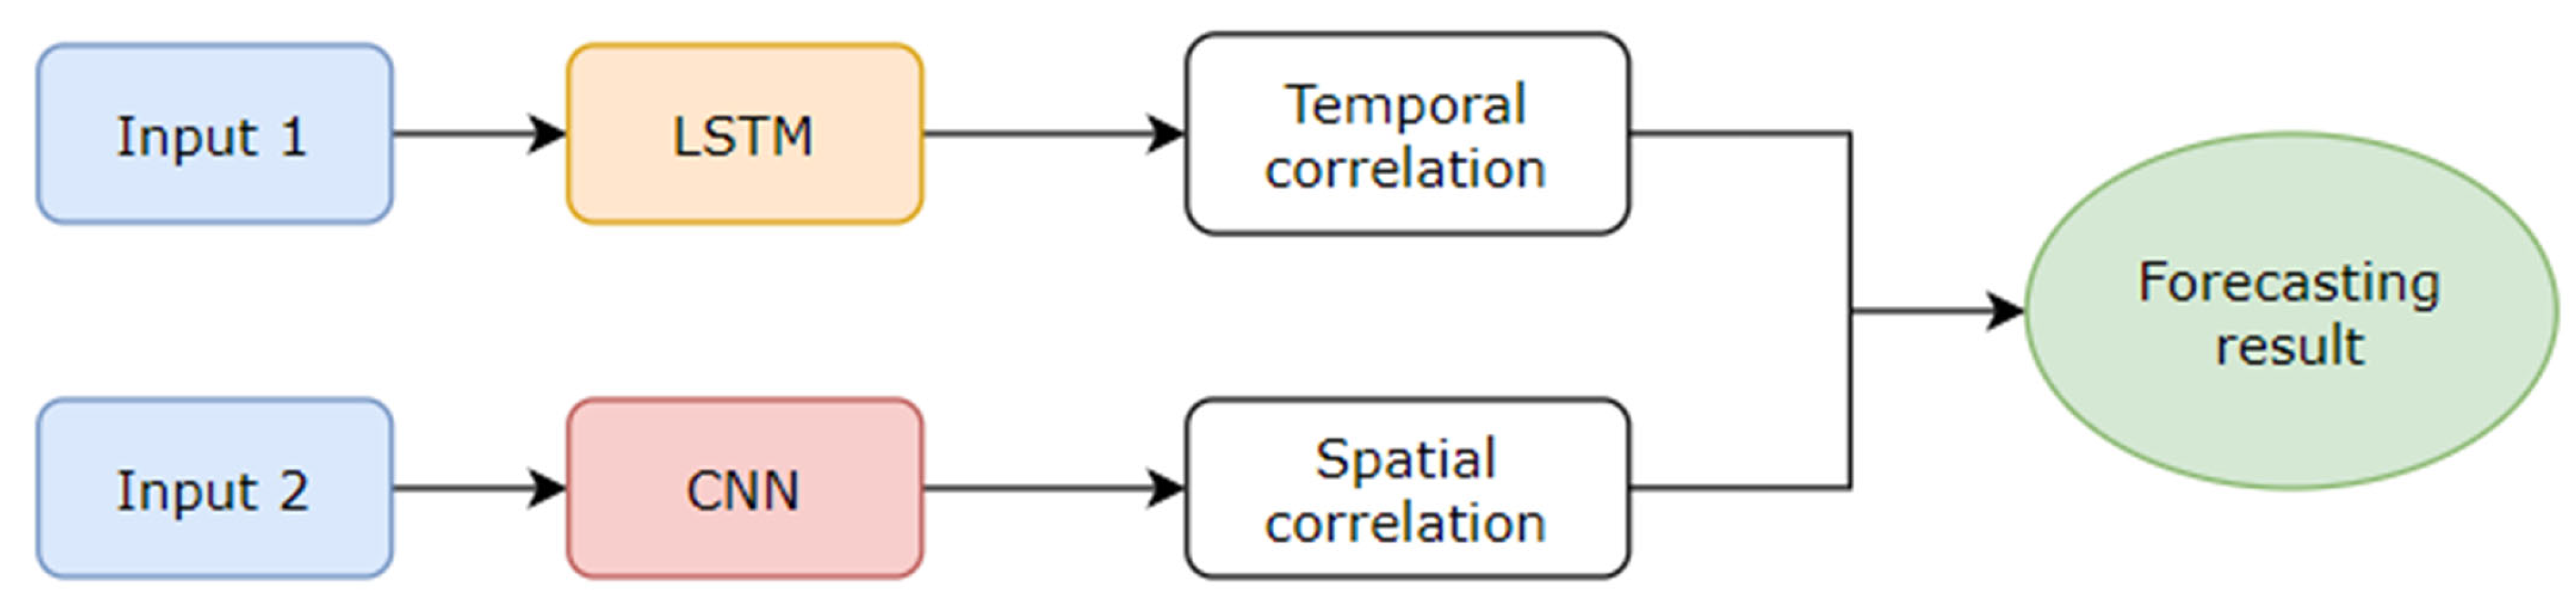
- In terms of predicting solar irradiance, hybrid models outperform standalone models. In particular, the evaluation measures of hybrid models are significantly lower than those of standalone models. Among the hybrid models, CNN–LSTM requires complex input data, such as images, because it includes a CNN layer.
- When evaluating model performance, training time must be considered. Because hybrid models must extract two types of feature (i.e., spatial and temporal features), they take a longer time to process data compared to standalone models.
- The prediction accuracy for models that run a large batch size of data is lower when compared to other prediction models that use small data batch sizes. This is because more data are required to be extracted, and there is a more complicated process to produce the most accurate prediction.
Author Contributions
Funding
Data Availability Statement
Acknowledgments
Conflicts of Interest
References
- Kumari, P.; Toshniwal, D. Long short term memory—Convolutional neural network based deep hybrid approach for solar irradiance forecasting. Appl. Energy 2021, 295, 117061. [Google Scholar] [CrossRef]
- Das, U.K.; Tey, K.S.; Seyedmahmoudian, M.; Mekhilef, S.; Idris, M.Y.I.; Van Deventer, W.; Horan, B.; Stojcevski, A. Forecasting of photovoltaic power generation and model optimization: A review. Renew. Sustain. Energy Rev. 2018, 81, 912–928. [Google Scholar] [CrossRef]
- Chen, H.; Chang, X. Photovoltaic power prediction of LSTM model based on Pearson feature selection. Energy Rep. 2021, 7, 1047–1054. [Google Scholar] [CrossRef]
- Wang, F.; Yu, Y.; Zhang, Z.; Li, J.; Zhen, Z.; Li, K. Wavelet decomposition and convolutional LSTM networks based improved deep learning model for solar irradiance forecasting. Appl. Sci. 2018, 8, 1286. [Google Scholar] [CrossRef]
- Zhu, T.; Guo, Y.; Li, Z.; Wang, C. Solar radiation prediction based on convolution neural network and long short-term memory. Energies 2021, 14, 8498. [Google Scholar] [CrossRef]
- Mukhtar, M.; Oluwasanmi, A.; Yimen, N.; Qinxiu, Z.; Ukwuoma, C.C.; Ezurike, B.; Bamisile, O. Development and Comparison of Two Novel Hybrid Neural Network Models for Hourly Solar Radiation Prediction. Appl. Sci. 2022, 12, 1435. [Google Scholar] [CrossRef]
- Cesar, L.B.; Silva, R.A.E.; Callejo, M.Á.M.; Cira, C.I. Review on Spatio-Temporal Solar Forecasting Methods Driven by In Situ Measurements or Their Combination with Satellite and Numerical Weather Prediction (NWP) Estimates. Energies 2022, 15, 4341. [Google Scholar] [CrossRef]
- Zhang, R.; Ma, H.; Hua, W.; Saha, T.K.; Zhou, X. Data-Driven Photovoltaic Generation Forecasting Based on a Bayesian Network with Spatial-Temporal Correlation Analysis. IEEE Trans. Ind. Inform. 2020, 16, 1635–1644. [Google Scholar] [CrossRef]
- Wang, F.; Lu, X.; Mei, S.; Su, Y.; Zhen, Z.; Zou, Z.; Zhang, X.; Yin, R.; Duić, N.; Shafie-Khah, M.; et al. A satellite image data based ultra-short-term solar PV power forecasting method considering cloud information from neighboring plant. Energy 2022, 238, 121946. [Google Scholar] [CrossRef]
- Li, P.; Zhou, K.; Lu, X.; Yang, S. A hybrid deep learning model for short-term PV power forecasting. Appl. Energy 2020, 259, 114216. [Google Scholar] [CrossRef]
- Wang, K.; Qi, X.; Liu, H. A comparison of day-ahead photovoltaic power forecasting models based on deep learning neural network. Appl. Energy 2019, 251, 113315. [Google Scholar] [CrossRef]
- Guermoui, M.; Melgani, F.; Gairaa, K.; Mekhalfi, M.L. A comprehensive review of hybrid models for solar radiation forecasting. J. Clean. Prod. 2020, 258, 120357. [Google Scholar] [CrossRef]
- Kumari, P.; Toshniwal, D. Deep learning models for solar irradiance forecasting: A comprehensive review. J. Clean. Prod. 2021, 318, 128566. [Google Scholar] [CrossRef]
- Rajagukguk, R.A.; Ramadhan, R.A.; Lee, H.-J. A review on deep learning models for forecasting time series data of solar irradiance and photovoltaic power. Energies 2020, 13, 6623. [Google Scholar] [CrossRef]
- Tawn, R.; Browell, J. A review of very short-term wind and solar power forecasting. Renew. Sustain. Energy Rev. 2022, 153, 111758. [Google Scholar] [CrossRef]
- Ahmed, R.; Sreeram, V.; Mishra, Y.; Arif, M. A review and evaluation of the state-of-the-art in PV solar power forecasting: Techniques and optimization. Renew. Sustain. Energy Rev. 2020, 124, 109792. [Google Scholar] [CrossRef]
- Wang, H.; Liu, Y.; Zhou, B.; Li, C.; Cao, G.; Voropai, N.; Barakhtenko, E. Taxonomy research of artificial intelligence for deterministic solar power forecasting. Energy Convers. Manag. 2020, 214, 112909. [Google Scholar] [CrossRef]
- Dodiya, M.; Shah, M. A systematic study on shaping the future of solar prosumage using deep learning. Int. J. Energy Water Resour. 2021, 5, 477–487. [Google Scholar] [CrossRef]
- Khan, N.; Ullah, F.U.M.; Haq, I.U.; Khan, S.U.; Lee, M.Y.; Baik, S.W. Ab-net: A novel deep learning assisted framework for renewable energy generation forecasting. Mathematics 2021, 9, 2456. [Google Scholar] [CrossRef]
- Ullah, F.; Khan, N.; Hussain, T.; Lee, M.; Baik, S. Diving deep into short-term electricity load forecasting: Comparative analysis and a novel framework. Mathematics 2021, 9, 611. [Google Scholar] [CrossRef]
- Muhammad, A.; Lee, J.M.; Hong, S.W.; Lee, S.J.; Lee, E.H. Deep Learning Application in Power System with a Case Study on Solar Irradiation Forecasting. In Proceedings of the International Conference on Artificial Intelligence in Information and Communication (ICAIIC), Jeju Island, Republic of Korea, 13–16 April 2019. [Google Scholar]
- El Alani, O.; Abraim, M.; Ghennioui, H.; Ghennioui, A.; Ikenbi, I.; Dahr, F.-E. Short term solar irradiance forecasting using sky images based on a hybrid CNN–MLP model. Energy Rep. 2021, 7, 888–900. [Google Scholar] [CrossRef]
- Srivastava, S.; Lessmann, S. A comparative study of LSTM neural networks in forecasting day-ahead global horizontal irradiance with satellite data. Sol. Energy 2018, 162, 232–247. [Google Scholar] [CrossRef]
- Suresh, V.; Janik, P.; Rezmer, J.; Leonowicz, Z. Forecasting Solar PV Output Using Convolutional Neural Networks with a Sliding Window Algorithm. Energies 2020, 13, 723. [Google Scholar] [CrossRef]
- Fan, H.; Jiang, M.; Xu, L.; Zhu, H.; Cheng, J.; Jiang, J. Comparison of long short term memory networks and the hydrological model in runoff simulation. Water 2020, 12, 175. [Google Scholar] [CrossRef]
- Zang, H.; Liu, L.; Sun, L.; Cheng, L.; Wei, Z.; Sun, G. Short-term global horizontal irradiance forecasting based on a hybrid CNN-LSTM model with spatiotemporal correlations. Renew. Energy 2020, 160, 26–41. [Google Scholar] [CrossRef]
- Chandola, D.; Gupta, H.; Tikkiwal, V.A.; Bohra, M.K. Multi-step ahead forecasting of global solar radiation for arid zones using deep learning. Procedia Comput. Sci. 2020, 167, 626–635. [Google Scholar] [CrossRef]
- Ağbulut, Ü.; Gürel, A.E.; Biçen, Y. Prediction of daily global solar radiation using different machine learning algorithms: Evaluation and comparison. Renew. Sustain. Energy Rev. 2021, 135, 110114. [Google Scholar] [CrossRef]
- Jalali, S.M.J.; Ahmadian, S.; Kavousi-Fard, A.; Khosravi, A.; Nahavandi, S. Automated Deep CNN-LSTM Architecture Design for Solar Irradiance Forecasting. IEEE Trans. Syst. Man Cybern. Syst. 2022, 52, 54–65. [Google Scholar] [CrossRef]
- Bhatt, A.; Ongsakul, W.; Nimal, M.; Singh, J.G. Sliding window approach with first-order differencing for very short-term solar irradiance forecasting using deep learning models. Sustain. Energy Technol. Assess. 2022, 50, 101864. [Google Scholar] [CrossRef]
- Ghimire, S.; Deo, R.C.; Raj, N.; Mi, J. Deep solar radiation forecasting with convolutional neural network and long short-term memory network algorithms. Appl. Energy 2019, 253, 113541. [Google Scholar] [CrossRef]
- Gao, B.; Huang, X.; Shi, J.; Tai, Y.; Zhang, J. Hourly forecasting of solar irradiance based on CEEMDAN and multi-strategy CNN-LSTM neural networks. Renew. Energy 2020, 162, 1665–1683. [Google Scholar] [CrossRef]
- Qing, X.; Niu, Y. Hourly day-ahead solar irradiance prediction using weather forecasts by LSTM. Energy 2018, 148, 461–468. [Google Scholar] [CrossRef]
- Mukhoty, B.P.; Maurya, V.; Shukla, S.K. Sequence to sequence deep learning models for solar irradiation forecasting; Sequence to sequence deep learning models for solar irradiation forecasting. arXiv 2019, arXiv:1904.1308. [Google Scholar]
- Zhou, H.; Liu, Q.; Yan, K.; Du, Y. Deep Learning Enhanced Solar Energy Forecasting with AI-Driven IoT. Wirel. Commun. Mob. Comput. 2021, 2021, 9249387. [Google Scholar] [CrossRef]
- Tovar, M.; Robles, M.; Rashid, F. PV power prediction, using CNN-LSTM hybrid neural network model. Case of study: Temixco-Morelos, México. Energies 2020, 13, 6512. [Google Scholar] [CrossRef]
- Tao, C.; Lu, J.; Lang, J.; Peng, X.; Cheng, K.; Duan, S. Short-term forecasting of photovoltaic power generation based on feature selection and bias compensation–lstm network. Energies 2021, 14, 3086. [Google Scholar] [CrossRef]
- Zhou, H.; Zhang, Y.; Yang, L.; Liu, Q.; Yan, K.; Du, Y. Short-Term photovoltaic power forecasting based on long short term memory neural network and attention mechanism. IEEE Access 2019, 7, 78063–78074. [Google Scholar] [CrossRef]
- Wang, K.; Qi, X.; Liu, H. Photovoltaic power forecasting based LSTM-Convolutional Network. Energy 2019, 189, 116225. [Google Scholar] [CrossRef]
- Institute of Electrical and Electronics Engineers. Beijing Section and Institute of Electrical and Electronics Engineers. In Proceedings of the ICSESS 2018 9th International Conference on Software Engineering and Service Science, Beijing, China, 23–25 November 2018. [Google Scholar]
- Zaouali, K.; Rekik, R.; Bouallegue, R. Deep Learning Forecasting Based on Auto-LSTM Model for Home Solar Power Systems. In 20th International Conference on High Performance Computing and Communications, 16th International Conference on Smart City and 4th International Conference on Data Science and Systems, HPCC/SmartCity/DSS 2018; Institute of Electrical and Electronics Engineers (IEEE): Piscataway, NJ, USA, 2019; pp. 235–242. [Google Scholar] [CrossRef]
- Sharadga, H.; Hajimirza, S.; Balog, R.S. Time series forecasting of solar power generation for large-scale photovoltaic plants. Renew. Energy 2020, 150, 797–807. [Google Scholar] [CrossRef]
- Wen, L.; Zhou, K.; Yang, S.; Lu, X. Optimal load dispatch of community microgrid with deep learning based solar power and load forecasting. Energy 2019, 171, 1053–1065. [Google Scholar] [CrossRef]
- Liu, C.-H.; Gu, J.-C.; Yang, M.-T. A Simplified LSTM Neural Networks for One Day-Ahead Solar Power Forecasting. IEEE Access 2021, 9, 17174–17195. [Google Scholar] [CrossRef]
- Konstantinou, M.; Peratikou, S.; Charalambides, A. Solar photovoltaic forecasting of power output using lstm networks. Atmosphere 2021, 12, 124. [Google Scholar] [CrossRef]
- Li, Y.; Ye, F.; Liu, Z.; Wang, Z.; Mao, Y. A Short-Term Photovoltaic Power Generation Forecast Method Based on LSTM. Math Math. Probl. Eng. 2021, 2021, 6613123. [Google Scholar] [CrossRef]
- Zhou, N.; Zhou, Y.; Gong, L.; Jiang, M. Accurate prediction of photovoltaic power output based on long short-term memory network. IET Optoelectron. 2020, 14, 399–405. [Google Scholar] [CrossRef]
- Kumar, D.S.; Yagli, G.M.; Kashyap, M.; Srinivasan, D. Solar irradiance resource and forecasting: A comprehensive review. IET Renew. Power Gener. 2020, 14, 1641–1656. [Google Scholar] [CrossRef]


| Ref. | Criteria | |||
|---|---|---|---|---|
| LSTM | Hybrid Model | Evaluation Metrics | Analysis of Past Studies | |
| [8] | X | − | √ | X |
| [9] | − | √ | √ | X |
| [10] | √ | − | √ | √ |
| [11] | − | − | √ | √ |
| [12] | X | − | √ | √ |
| [13] | − | √ | √ | √ |
| [14] | − | − | − | √ |
| Evaluation Metric | Equation |
|---|---|
| Error | |
| MAE | |
| MAPE | |
| MBE | |
| rMBE | |
| rRMSE | |
| RMSE |
| Ref. | Forecast Horizon | Time Interval | Model | Input Parameter | Historical Data Description | Error Metrics |
|---|---|---|---|---|---|---|
| [1] | Ahead by 1 h | Hourly | LSTM–CNN |
| 1 January 2015 to 31 December 2019 (5 years) | Average RMSE: Los Angeles: 57.983 W/m2 San Diego: 47.826 W/m2 San Francisco: 66.023 W/m2 |
| [29] |
| Hourly | MSCA–CLSTM | GHI | 2018 (1 year) | Average RMSE: Columbus: 0.0177 W/m2 San Antonio: 0.0183 W/m2 Detroit: 0.0183 W/m2 |
| [30] |
| 15 min | CNN–LSTM |
| 1 January 2016 to 1 January 2017 | RMSE (6 steps): 5.79–34.89 W/m2 |
| [31] | Multiple forecast horizon (1 day to 8 months) | 30 min | CLSTM | GSR | 1 January 2006 to 31 August 2018 | RMSE (W/m2): 1 day: 8.189 1 week: 16.011 2 weeks: 14.295 1 month: 32.872 |
| [26] | Ahead by 1 h | Hourly | CNN–LSTM |
| 1 January 2006 to 31 December 2012 | Average MAE: Dallas: 41.88 W/m2 San Jacinto: 52.00 W/m2 Zapata: 43.66 W/m2 Moore: 37.26 W/m2 Lamb: 37.20 W/m2 |
| [32] | Ahead by 1 h | Hourly | CEEMDAN-CNN–LSTM | Solar irradiance | 6 year data | Average RMSE: 38.49 W/m2 |
| [33] | Ahead hourly every day | Hourly | LSTM |
|
| RMSE: 76.245 W/m2 |
| [34] | Ahead by 1 h | Hourly | LSTM |
| 2000 to 2014 | Average 24-h RMSE: 80.0 W/m2 |
| Ref. | Forecast Horizon | Interval Data | Model | Input Variables | Historical Data Description | Size PV Power (kW) | Error Metrics |
|---|---|---|---|---|---|---|---|
| [35] |
| 7.5 min | CNN-ALSTM |
| October 2014 to September 2018 | N/A | Overall RMSE: 7.5 min: 1.30 15 min: 1.40 30 min: 2.04 |
| [36] |
| 10 min | 5D CNN–LSTM |
| 1 year data (2019–2020) | 1.70 | RMSE: 10 min: 0.0830 30 min: 0.2257 60 min: 0.4593 90 min: 0.7289 120 min: 1.0588 150 min: 1.4438 180 min: 2.0570 |
| [37] | 1 day | 15 min | BCLSTM + IFFS | Numerical weather prediction (NWP) data | 1 January 2017 to 31 December 2018 (2 years) | N/A | RMSE: 0.1075 kW |
| [38] |
| 7.5 min | ALSTM |
| October 2014 to September 2018 | 20.0 | Overall RMSE: 7.5 min: 1.39 15 min: 1.60 30 min: 1.81 60 min: 2.09 |
| [10] | Ahead by 1 h | 5 min | WPD–LSTM |
| 1 June 2014 to 12 June 2016 | 26.5 | Average RMSE: 0.2357 |
| [39] | N/A | 5 min | LSTM–CNN |
| Half-year data (53,280 samples) | N/A | RMSE: 0.621 |
| [40] | Ahead by 1 h | Hourly | PCA–LSTM | The dataset has 49 features
| The first 24 historical data points | N/A | NRMSE: 0.0472% |
| [41] |
| 15 min | Auto-LSTM |
| 2014–2015 (2 years) | 1.30 | Daily forecasting RMSE: Smart meter 1: 4.4414 Smart meter 2: 7.1925 |
| [42] | Ahead hourly | 15 min | LSTM | PV power | 13 January 2010 to 29 January 2010 | 20,000 | RMSE (ahead by 1 h): 0.841 |
| [43] | Ahead by 1 h | Hourly | DRNN–LSTM |
| 1 January 2018 to 1 February 2018 | 106.60 | RMSE: 7.536 |
| [44] | Ahead by 1 day | Every 1 min or 5 min | LSTM | PV power | One month | N/A | Average RMSE: 0.512 |
| [45] | Ahead by 1.5 h | 15 min | Stacked LSTM | PV power | 1 September 2016 to 31 January 2019 (84,768 observation) | N/A | RMSE: 0.09394 |
| [46] | Ahead by 1 h | Hourly | LSTM-FC |
| 1 January 2018 to 31 December 2018 | N/A | RMSE: 2.5605 |
| [47] | Ahead by 1 day | 5 min | EMD-SCA-LSTM |
| 1-year data (2017) | 5.83 | RMSE: 0.5283 kW MAE: 0.3063 kW R2: 0.9210 |
| Step Ahead | MAE (W/m2) | RMSE (W/m2) | MAPE (%) | R2 | ||||||||
|---|---|---|---|---|---|---|---|---|---|---|---|---|
| LSTM | CNN | CNN–LSTM | LSTM | CNN | CNN–LSTM | LSTM | CNN | CNN–LSTM | LSTM | CNN | CNN–LSTM | |
| 1 | 6.61 | 6.51 | 3.83 | 10.43 | 9.82 | 5.79 | 10.19 | 11.29 | 7.50 | 0.998 | 0.998 | 0.999 |
| 2 | 12.15 | 11.69 | 7.32 | 20.46 | 18.09 | 11.71 | 51.74 | 37.45 | 19.64 | 0.993 | 0.994 | 0.997 |
| 3 | 18.39 | 16.73 | 10.61 | 31.12 | 26.41 | 18.18 | 28.62 | 52.21 | 31.87 | 0.984 | 0.988 | 0.994 |
| 4 | 24.16 | 21.81 | 13.68 | 40.33 | 34.53 | 23.48 | 70.51 | 91.84 | 50.08 | 0.974 | 0.979 | 0.99 |
| 5 | 31.21 | 27.26 | 17.01 | 52.5 | 43.11 | 29.25 | 30.99 | 52.79 | 55.47 | 0.957 | 0.969 | 0.985 |
| 6 | 36.89 | 32.38 | 20.07 | 62.27 | 50.99 | 34.89 | 44.81 | 127.29 | 59.28 | 0.942 | 0.957 | 0.979 |
| Season | Types of Weather | Error | WPD–LSTM | LSTM | GRU | RNN | MLP |
|---|---|---|---|---|---|---|---|
| Winter | Sunny (Day 1) | MBE (kW) | −0.0055 | −0.0058 | 0.1588 | −0.0085 | −0.0284 |
| MAPE (%) | 1.7526 | 1.7744 | 2.1019 | 2.633 | 5.5833 | ||
| RMSE (kW) | 0.2466 | 1.2541 | 1.2399 | 1.2468 | 1.1944 | ||
| Cloudy (Day 2) | MBE (kW) | 0.1127 | −0.0497 | 0.0184 | −0.0901 | 0.2429 | |
| MAPE (%) | 1.7365 | 0.1276 | 1.9913 | 2.7622 | 6.1295 | ||
| RMSE (kW) | 0.1773 | 1.1279 | 0.2206 | 0.2868 | 0.6075 | ||
| Rainy (Day 3) | MBE (kW) | −0.0214 | −0.1913 | 0.1651 | −0.3158 | −0.0495 | |
| MAPE (%) | 6.7328 | 8.4150 | 10.8690 | 9.3110 | 10.7191 | ||
| RMSE (kW) | 0.4374 | 2.2336 | 2.0876 | 2.1223 | 1.9916 | ||
| Spring | Sunny (Day 4) | MBE (kW) | 0.1425 | −0.0239 | 0.0377 | −0.0240 | 0.3277 |
| MAPE (%) | 2.0973 | 1.3243 | 2.0199 | 3.1087 | 6.8559 | ||
| RMSE (kW) | 0.2250 | 0.1643 | 0.2456 | 0.3431 | 0.7173 | ||
| Cloudy (Day 5) | MBE (kW) | −0.0675 | 0.1165 | 0.5523 | 0.0711 | −0.2168 | |
| MAPE (%) | 8.1383 | 15.3881 | 14.9651 | 13.0762 | 15.4708 | ||
| RMSE (kW) | 0.1453 | 0.2759 | 0.6452 | 0.4222 | 0.3312 | ||
| Rainy (Day 6) | MBE (kW) | 0.0566 | 0.2304 | 0.5502 | 0.0674 | 0.1121 | |
| MAPE (%) | 3.8080 | 9.9553 | 14.8235 | 11.3013 | 8.3763 | ||
| RMSE (kW) | 0.2807 | 0.8107 | 1.0036 | 0.8604 | 0.7572 | ||
| Summer | Sunny (Day 7) | MBE (kW) | 0.0481 | 0.1115 | 0.2936 | −0.1382 | 0.3617 |
| MAPE (%) | 2.6031 | 8.4936 | 10.8292 | 8.8545 | 10.8997 | ||
| RMSE (kW) | 0.2664 | 0.9701 | 1.0748 | 0.8514 | 1.0822 | ||
| Cloudy (Day 8) | MBE (kW) | 0.0183 | 0.2012 | 0.5218 | −0.0583 | 0.1048 | |
| MAPE (%) | 3.4360 | 13.0028 | 11.8370 | 14.8472 | 11.5344 | ||
| RMSE (kW) | 0.2382 | 0.8398 | 0.9323 | 0.8812 | 0.7810 | ||
| Rainy (Day 9) | MBE (kW) | −0.0127 | 0.0924 | 0.4668 | −0.2068 | −0.3127 | |
| MAPE (%) | 3.8936 | 9.8571 | 12.5799 | 16.0052 | 14.7068 | ||
| RMSE (kW) | 0.1253 | 0.3009 | 0.5805 | 0.4993 | 0.4479 | ||
| Autumn | Sunny (Day 10) | MBE (kW) | −0.0799 | −0.2050 | 0.0959 | −0.1813 | 0.2752 |
| MAPE (%) | 2.0367 | 7.4015 | 8.3304 | 7.8951 | 8.3189 | ||
| RMSE (kW) | 0.1929 | 0.7395 | 0.8029 | 0.7778 | 0.7495 | ||
| Cloudy (Day 11) | MBE (kW) | 0.0049 | 0.1174 | 0.5692 | −0.1111 | 0.1729 | |
| MAPE (%) | 3.7923 | 5.0279 | 9.9234 | 7.0087 | 14.4850 | ||
| RMSE (kW) | 0.2576 | 1.0540 | 1.2110 | 1.1365 | 1.0643 | ||
| Rainy (Day 12) | MBE (kW) | 0.0029 | −0.0799 | 0.1202 | −0.3103 | 0.3244 | |
| MAPE (%) | 4.3427 | 8.3508 | 9.3104 | 7.3294 | 14.8202 | ||
| RMSE (kW) | 0.3903 | 2.4216 | 2.3687 | 2.4275 | 2.4343 |
| Season | Indicator | Methods | |||||||||
|---|---|---|---|---|---|---|---|---|---|---|---|
| C-C-L | C-L | C-S | C-B | C-A | LSTM | SVM | BP | ARIMA | Per. | ||
| Spring | RMSE (W/m2) | 42.87 | 56.76 | 64.97 | 64.46 | 79.88 | 79.63 | 84.62 | 82.20 | 112.46 | 126.76 |
| nRMSE (%) | 17.88 | 25.46 | 29.15 | 28.92 | 35.84 | 35.72 | 37.96 | 36.87 | 50.45 | 56.87 | |
| MAE (W/m2) | 22.80 | 37.74 | 36.09 | 35.98 | 41.84 | 42.21 | 51.09 | 41.87 | 63.77 | 76.89 | |
| Summer | RMSE (W/m2) | 47.60 | 55.15 | 58.73 | 65.07 | 82.44 | 70.62 | 73.09 | 70.94 | 110.09 | 125.63 |
| nRMSE (%) | 17.34 | 21.68 | 23.09 | 25.58 | 32.41 | 27.76 | 28.72 | 27.89 | 43.28 | 49.39 | |
| MAE (W/m2) | 26.80 | 36.76 | 37.60 | 39.44 | 43.09 | 39.12 | 41.14 | 35.66 | 65.76 | 80.06 | |
| Autumn | RMSE (W/m2) | 37.59 | 47.19 | 47.76 | 50.86 | 69.79 | 54.86 | 59.71 | 55.49 | 103.07 | 122.39 |
| nRMSE (%) | 17.65 | 19.59 | 19.83 | 21.11 | 28.98 | 22.78 | 24.79 | 23.04 | 42.79 | 50.81 | |
| MAE (W/m2) | 19.66 | 29.59 | 27.79 | 29.01 | 36.14 | 27.28 | 38.96 | 28.38 | 60.32 | 75.99 | |
| Winter | RMSE (W/m2) | 25.97 | 38.19 | 46.82 | 45.31 | 50.23 | 47.26 | 54.24 | 48.27 | 81.98 | 107.96 |
| nRMSE (%) | 15.73 | 19.60 | 24.04 | 23.26 | 25.79 | 24.26 | 27.85 | 24.78 | 42.09 | 55.42 | |
| MAE (W/m2) | 13.25 | 22.14 | 28.33 | 23.69 | 25.65 | 20.18 | 32.44 | 21.86 | 41.92 | 64.54 | |
| Annual | RMSE (W/m2) | 38.49 | 49.87 | 55.10 | 57.07 | 71.72 | 64.37 | 68.93 | 65.57 | 102.61 | 121.75 |
| nRMSE (%) | 17.23 | 21.85 | 24.14 | 25.00 | 31.42 | 28.20 | 30.20 | 28.73 | 44.96 | 53.34 | |
| MAE (W/m2) | 20.50 | 31.56 | 32.45 | 32.03 | 36.68 | 32.20 | 40.90 | 31.95 | 57.94 | 74.64 | |
| LSTM | CNN | CNN–LSTM | LSTM–CNN | |
|---|---|---|---|---|
| Training time (s) | 70.490 | 787.494 | 983.701 | 871.606 |
| Running time (s) | 5.439 | 5.425 | 8.692 | 7.196 |
| Model | Time (s) |
|---|---|
| 5D LSTM | 9.1394 |
| 2D CNN–LSTM | 8.0362 |
| 5D CNN–LSTM | 69.1148 |
Disclaimer/Publisher’s Note: The statements, opinions and data contained in all publications are solely those of the individual author(s) and contributor(s) and not of MDPI and/or the editor(s). MDPI and/or the editor(s) disclaim responsibility for any injury to people or property resulting from any ideas, methods, instructions or products referred to in the content. |
© 2023 by the authors. Licensee MDPI, Basel, Switzerland. This article is an open access article distributed under the terms and conditions of the Creative Commons Attribution (CC BY) license (https://creativecommons.org/licenses/by/4.0/).
Share and Cite
Jailani, N.L.M.; Dhanasegaran, J.K.; Alkawsi, G.; Alkahtani, A.A.; Phing, C.C.; Baashar, Y.; Capretz, L.F.; Al-Shetwi, A.Q.; Tiong, S.K. Investigating the Power of LSTM-Based Models in Solar Energy Forecasting. Processes 2023, 11, 1382. https://doi.org/10.3390/pr11051382
Jailani NLM, Dhanasegaran JK, Alkawsi G, Alkahtani AA, Phing CC, Baashar Y, Capretz LF, Al-Shetwi AQ, Tiong SK. Investigating the Power of LSTM-Based Models in Solar Energy Forecasting. Processes. 2023; 11(5):1382. https://doi.org/10.3390/pr11051382
Chicago/Turabian StyleJailani, Nur Liyana Mohd, Jeeva Kumaran Dhanasegaran, Gamal Alkawsi, Ammar Ahmed Alkahtani, Chen Chai Phing, Yahia Baashar, Luiz Fernando Capretz, Ali Q. Al-Shetwi, and Sieh Kiong Tiong. 2023. "Investigating the Power of LSTM-Based Models in Solar Energy Forecasting" Processes 11, no. 5: 1382. https://doi.org/10.3390/pr11051382