
Detailed Simulations of a Three-Stage Supercritical Carbon Dioxide Axial Compressor with a Focus on the Shrouded Stator Cavities Flow
1
Gas Turbine Simulation Laboratory, Department of Aerospace Engineering and Engineering Mechanics, University of Cincinnati, Cincinnati, OH 45221, USA
2
Department of Aerospace Engineering and Engineering Mechanics, University of Cincinnati, Cincinnati, OH 45221, USA
*
Authors to whom correspondence should be addressed.
Processes 2023, 11(5), 1358; https://doi.org/10.3390/pr11051358
Submission received: 12 March 2023
/
Revised: 18 April 2023
/
Accepted: 20 April 2023
/
Published: 28 April 2023
(This article belongs to the Special Issue New Advances in Heat Transfer and Fluid Flow)
Abstract
:This paper describes the findings of detailed simulations performed to investigate the impact of seal teeth cavity leakage flow on the aerodynamic and thermal performance of a three-stage supercritical CO axial compressor. The study compares a shrouded stator configuration (with cavities) to a cantilevered stator configuration (without cavities) to highlight their differences. High-fidelity computational fluid dynamics simulations were performed using non-linear harmonic (NLH) and mixing plane assumptions, considering various possible rotor/stator interface configurations for mixing plane calculations. The key performance parameters for each case were compared, and the best-performing configuration selected for further analysis. The individual stage performance parameters are also examined and compared between the cantilevered and shrouded configurations. It was observed that in the shrouded case, the leakage flow enters the cavity downstream of the stator trailing edge and gets entrained into the primary flow upstream of the stator, leading to boundary layer changes at the hub and degradation of stator and downstream rotor performance. Vortical flow structures were also observed in the stator wells, which tended to change the flow angles around the region, thereby affecting mixing and velocity distribution, resulting in a slight deterioration of compressor performance. Additionally, the study examines windage heating due to shear work from rotating walls, including the seal teeth surface. The amount of shear work done on the leakage flow and the corresponding rise in fluid temperature were quantified, tabulated, and further compared with a simple analytical model, showing good agreement between them and, hence, validating the numerical approach used.
1. Introduction
Due to increasing concern over global warming, there is a rising demand for energy storage systems that are both efficient and cost-effective, especially on a large scale. Supercritical carbon dioxide power cycles have emerged as a potential solution, offering several advantages, such as highly efficient and compact machinery compared to traditional Rankine cycles [1]. Additionally, carbon dioxide is an affordable, non-toxic, and non-flammable working fluid, making it ideal for energy and power generation applications. Despite the overwhelming interest in supercritical carbon dioxide cycles, there has been limited exploration into using this working fluid for compressors. In one of the earlier studies, Wang et al. [2] presented a design methodology for a compressor operating in a supercritical CO Brayton cycle. The authors applied a one-dimensional flow model to optimize the design of the compressor and demonstrated the importance of considering the variation in thermodynamic properties of sCO in the design process. Takagi et al. [3] investigated the flow characteristics of an axial sCO compressor blade using computational fluid dynamics. The study aimed to optimize and identify the optimal blade design for sCO compressors, given the unique thermodynamic properties of the fluid. The results identified the blade loading distribution as an important factor that affects the compressor performance, and the authors proposed a new blade shape that reduces the loading in the hub region to improve the efficiency of the compressor. In another study, Zhao et al. [4] also used CFD simulations to investigate the behavior of supercritical CO in a centrifugal compressor aimed at improving the design and performance of the compressor. The authors investigated the impact of the inlet pressure, blade angle, and fluid properties (density and viscosity) on the compressor’s efficiency and stability and highlighted the importance for designers to consider these factors. Liu et al. [5] conducted a preliminary design and model assessment of an sCO compressor using a 3D CFD model. The authors proposed a new compressor design that includes a twisted blade and a diffuser with a converging–diverging shape. The results showed that the proposed compressor design can achieve high efficiency and stable operation at high pressures.
The Gas Turbine Simulation Laboratory (GTSL) at the University of Cincinnati has designed an axial sCO compressor, which will be manufactured and tested at the Turbomachinery Laboratory at the University of Notre Dame, marking the first instance of a conventional axial compressor being tested with sCO [1]. The design method begins with a review of the key performance requirements for both full- and sub-scaled designs. The sub-scaled design is analyzed in detail to identify and address any potential issues that may arise with the full design and, hence, ensure significant time savings and greater confidence in performance analysis. The details of the design and optimization process for the first stage of supercritical CO have been presented by Matt et al. [1].
The full-scale compressor is comprised of nine stages with a hub radius of 0.2149 m and has a designed power output of 100 MW. The desired power output is 112.3 MW with a design mass flow rate of 517.16 kg/s and a total enthalpy rise of 217 KJ/kg. The flow is designed to exit at 0.25 Mach with no swirl operating at 9400 rpm. The adiabatic efficiency is targeted to be 91%. Due to the limitations in the testing facility at the University of Notre Dame, the model was scaled down to a three-stage design rated at 9.0 MW operating at 19,800 rpm [1,6]. The sub-scaled design consists of a total of seven rows: one IGV, three rotors, and three stators. The geometry details for the design are shown in Table 1.
In the operation of any turbomachinery, clearances are essential for the proper functioning of both rotating and stationary blade rows. However, these clearances result in the flows leaking across the rows driven by the adverse pressure gradient resulting in losses. Generally, stators can be configured in two ways: cantilevered and shrouded. The cantilevered stator is fixed only to the casing and is free at the hub. On the other hand, the shrouded stator is fixed at both ends, namely the casing and an annular foot ring at the hub that is concentric to the rotor. A labyrinth seal with multiple teeth, along with the abradable coating applied to the stator landing surface, is used to minimize the leakage and risks associated with rubbing. This also permits the compressor to run at much tighter clearance and has been shown to increase performance and efficiency.
In most modern turbomachines, shrouded configurations are preferred over conventional cantilevered stators, mainly due to their better mechanical stability. Several studies have been conducted to understand the impact of shrouded configuration on the performance and efficiency of the compressor. In one of the earliest works, Narain [7] investigated heat transfer characteristics in cylindrically shrouded cavities. The author presented a theoretical model for the heat transfer coefficient for turbulent boundary layer flow in a shrouded cavity. The effects of various parameters, such as coolant flow rate, swirl, and aspect ratio on the heat transfer coefficient are discussed. In another work, Hunter [8] studied the interaction between wheel space purge flow and gas path flow experimentally and computationally in a low-pressure turbine. In this study, detailed test measurements were acquired in a low-speed research turbine, providing a benchmark for the computational model. Unsteady computational analyses were carried out to model different combinations of the cavity seal and blade row geometries, allowing for separation of the flow physics involved in the interaction and, hence, providing researchers with the opportunity to investigate new ideas in reducing secondary flow.
Yoon et al. [9] examined the impact of stator hub configurations and stage design parameters on the aerodynamic performance of axial compressors. They used CFD simulations to understand the effects of shrouded and cantilevered stator configurations on the compressor’s performance. Mahmood and Turner [10] performed a CFD-based sensitivity study to understand the impact of varying seal teeth clearance on a one-and-a-half-stage axial compressor from an EEE design. The authors concluded that, as the clearance of the seal teeth cavity increased, the efficiency of the compressor decreased, with a maximum reduction of 0.86% observed for the largest clearance value analyzed. Wellborn and his team [11] used a four-stage NASA low-speed axial compressor in an experimental study to analyze the impact of shrouded stator cavity flows on multistage compressor performance and demonstrated the potential benefits of using shrouded stators with abradable coatings. Mansouri [12] analyzed the aerodynamic and heat transfer performances of a highly loaded transonic turbine rotor with an upstream generic rim seal cavity. He used CFD simulations to investigate the effects of the purge flow on the aero and thermal performances of a high-pressure turbine rotor and presents the co-relations between purge flow, cooling and sealing effectiveness, as well as losses. In another work, Liang et al. [13] developed a quasi-three-dimensional simulation tool, based on the circumferentially averaged method, to study the effect of seal cavity leakage flow on the aerodynamic performance of a multistage axial compressor, concluding that such a flow has a significant impact on the overall compressor performance. In a recent work, Ghimire et al. [6] used CFD simulations to investigate the effects on aerodynamic and thermal characteristics of an axial sCO compressor due to seal cavity leakage flow, employing a steady state mixing plane approach with both adiabatic and non-adiabatic walls. The authors demonstrated the presence of the hub blockage phenomenon and the worsening of the boundary layer, especially near the hub region, which resulted in some degradation of compressor performance.
Although the influence of hub leakage flow on the primary passage has been studied and documented in the public domain, the scarcity of information regarding the internal cavity geometry is attributed to the complexities of instrumenting this area for experimentation or modeling the entire cavity structure. Recently, Kamdar et al. [14] developed a coupled CFD model incorporating stator cavity wells for the PAX100 configuration at the Purdue 3-Stage (P3S) Axial Compressor Research Facility, which was successfully validated against experimental data. In their study, the authors investigated the impact of hub leakage flow on compressor performance, the interaction between the leakage flow and primary flow, and the leakage flow characteristics in the stator wells. Drawing inspiration from this framework, our study leverages the same computational approach and methodology, thereby signifying its appropriateness for this study.
However, the current body of literature primarily focuses on either centrifugal compressors, operated with sCO, or preliminary investigations of single-stage axial compressors. Moreover, studies pertaining to shrouded configurations predominantly consider axial compressors operating with air. The present study endeavors to contribute to this field by conducting a comprehensive flow simulation of a three-stage axial compressor employing both cantilevered and shrouded configurations. The primary objective is to obtain a deeper understanding of flow physics and examine the impact of each configuration on the compressor’s aerodynamic and thermal performance, with a significant emphasis on the shrouded configuration. It is noteworthy that this study represents the first-ever detailed investigation of sCO-operated multistage axial compressors, which makes it a unique contribution to the literature.
2. Three-Stage Design
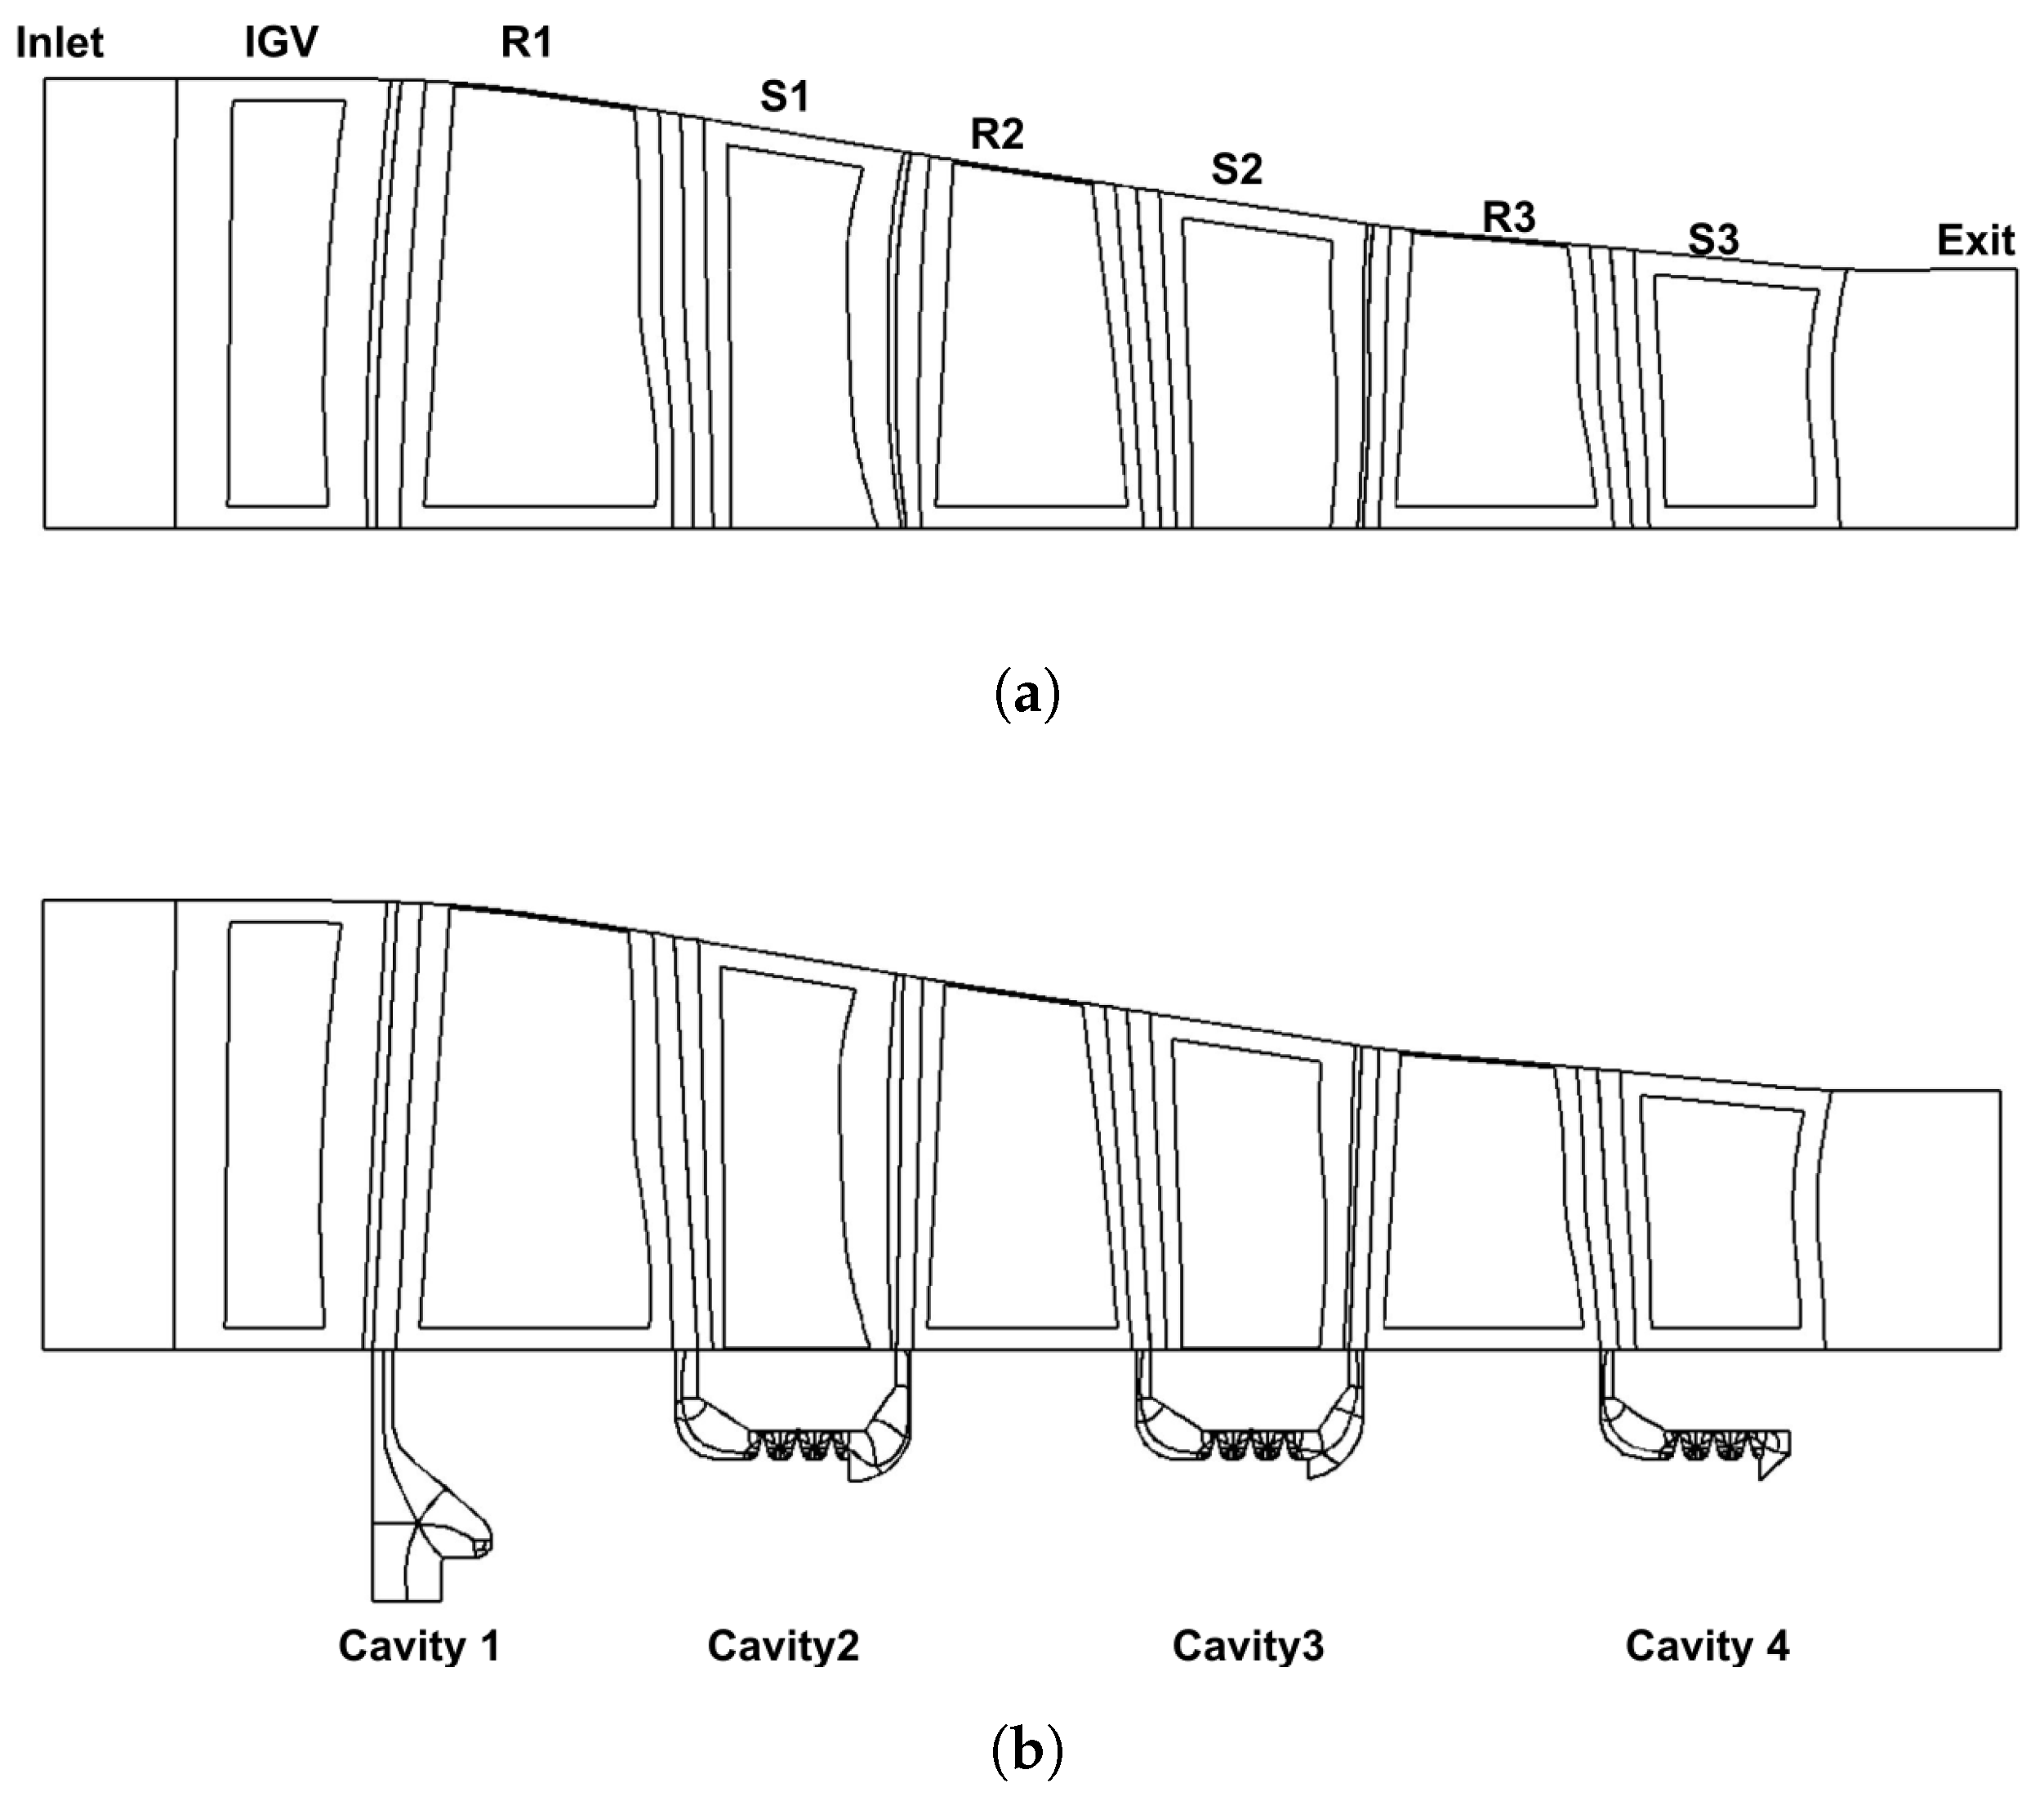
The design and analysis for this geometry began with the first stage, and, then, subsequent stages were added. The details of the geometry and analysis for the first stage are described in [1]. For the three stages, two cases were considered: one with a cantilevered configuration (without cavities) and the other with a shrouded configuration (with cavities). The geometry for these two designs is provided in Figure 1.
The design consists of 7 rows as shown in Figure 1a: an inlet guide vane, 3 rotors, and 3 stators. For the cantilevered configuration, there is a running clearance set between the hub and stators defined by the hub gap, while in a shrouded configuration, as shown in Figure 1b, the stators are fixed at both ends and, together with the rotor drum, form four cavities under the annulus foot rings. The rotor drums with labyrinth seal teeth rotate with a small clearance with the stator landing surface, which is coated with abradable materials. This allows for the clearance of the seal teeth to be much tighter than in the cantilevered case.
Table 1 shows the detailed geometrical parameters for the shrouded configuration. All sets of rows have a fillet of 1.6 mm at the hub. Towards the tip, rotors have a tip gap set as shown and stators have fillets. The span-wise points distribution, grid levels, and blade count are also tabulated. The seal teeth cavity gap is set at 50 μm. For the cantilevered configuration, instead of hub fillets, the hub gap is defined and is also set at the same 50 μm for equivalent comparison.
Autogrid was used to generate the structured mesh for the geometry with more than 10 levels of multi-grid. For the shrouded case, there are 72 million grid points compared to 60 million grid points for the cantilevered case. The variation in grid size can be attributed to the fact that there are full non-matching boundary connections at cavities, customized fillets, and multiple meridional control lines present in the mesh. The mesh size details are tabulated below in Table 2.
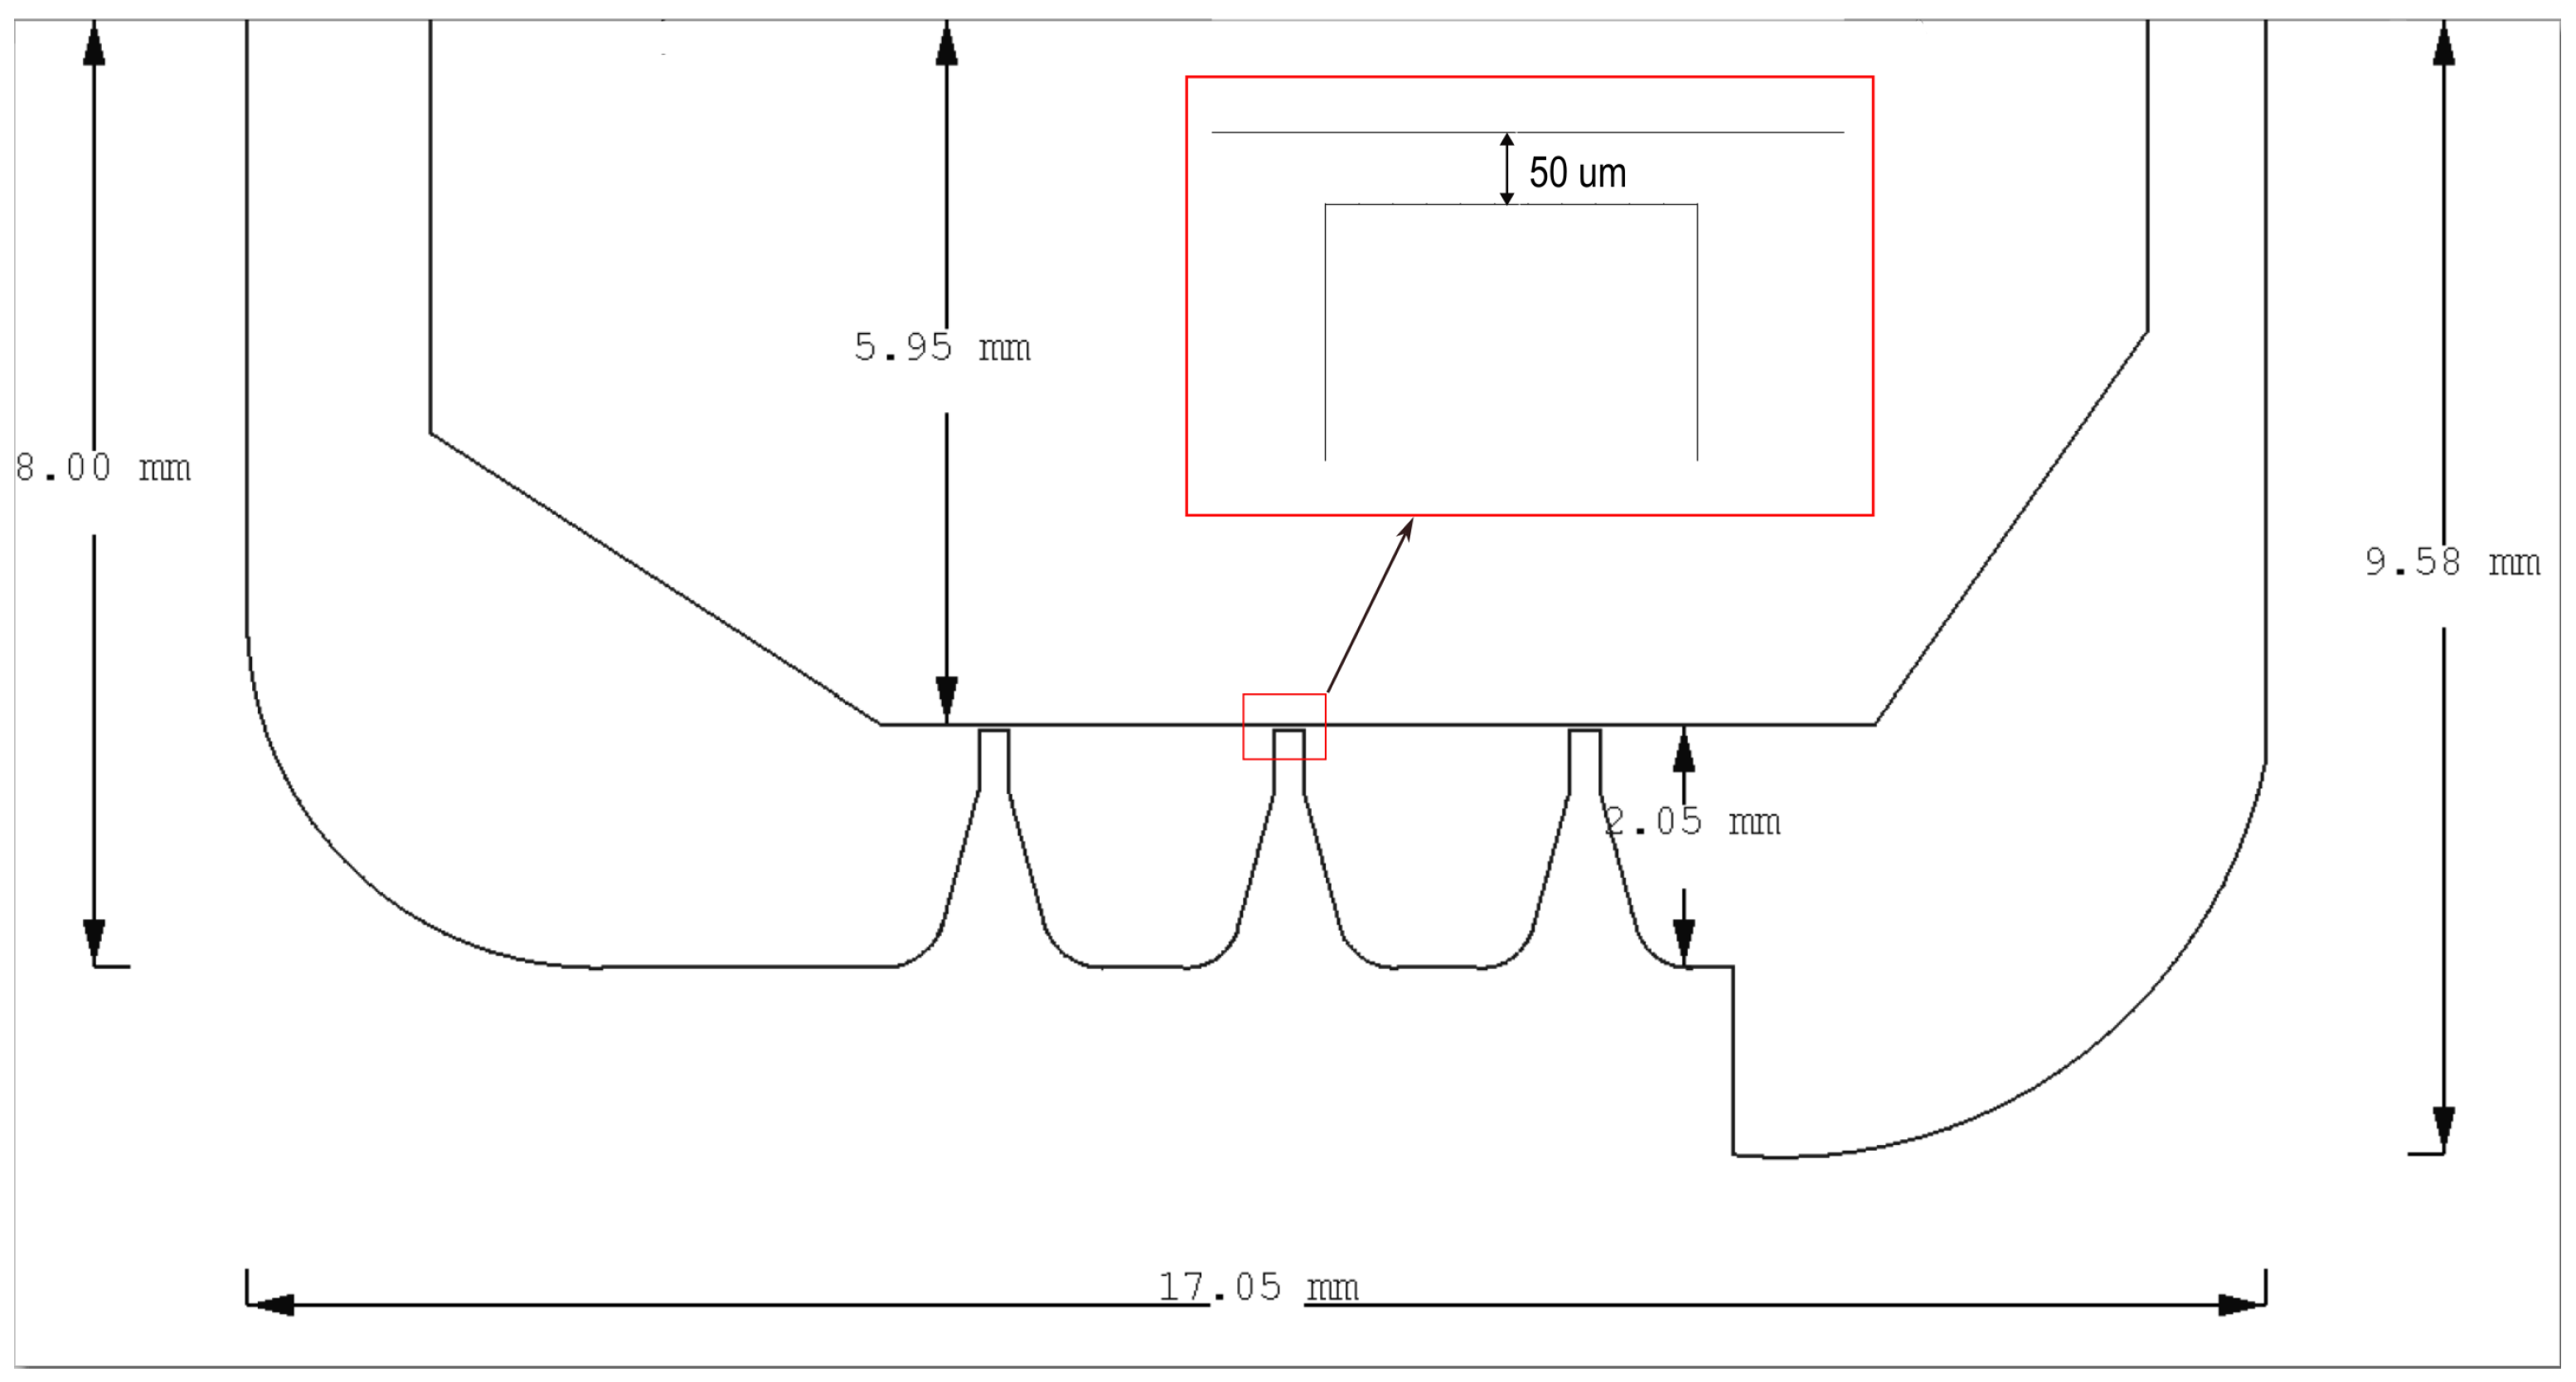
The detailed diagram of a representative cavity (Cavity 2) is shown below in Figure 2. The seal teeth gap is set at 50 μm, about 0.17% span for all cavities.
3. Numerical Setup
The design process for the 9-stage axial compressor commences with meanline and axisymmetric calculations. To this end, the Turbomachinery AXI-symmetric Design System (T-AXI) [15] is employed to conduct such calculations for both the full-scale 9-stage supercritical CO2 compressor and the sub-scaled three-stage design. Along with the results, files containing the parametric definitions of the 3D blade are also generated which is then used by T-Blade3, an in-house developed general parametric 3D blade geometry builder [16], to generate the 3D geometry of all blade rows for the compressor. The tool can create geometries based on a few basic parameters. Autogrid was used for generating the structured mesh and Cadence’s Fine/Turbo was used to perform high-fidelity CFD simulations. Turbulent Navier–Stokes was used as a flow model and the Spalart–Allmaras model was used for turbulence modeling. The boundary condition at inlet was defined by the total pressure profile generated from the estimation of the duct boundary layer at the University of Notre Dame’s testing facility and the total temperature was set to be 371.15 K. A turbulent viscosity ratio of 50 was defined at the inlet as a turbulent quantity. The mass imposed boundary condition was used at the outlet with a design mass flow rate of 127 kg/s and initial pressure of 6.28 MPa. The rotation speed of 19,800 rpm was set for rotors. While the primary flow converged within 10,000 iterations. It required 30,000 iterations on an AMD Ryzen Threadripper 3970X 32-Core Processor model utilizing 18 cores for full convergence of flow inside the cavities, taking approximately 200 h of wall clock time (about 8 days).
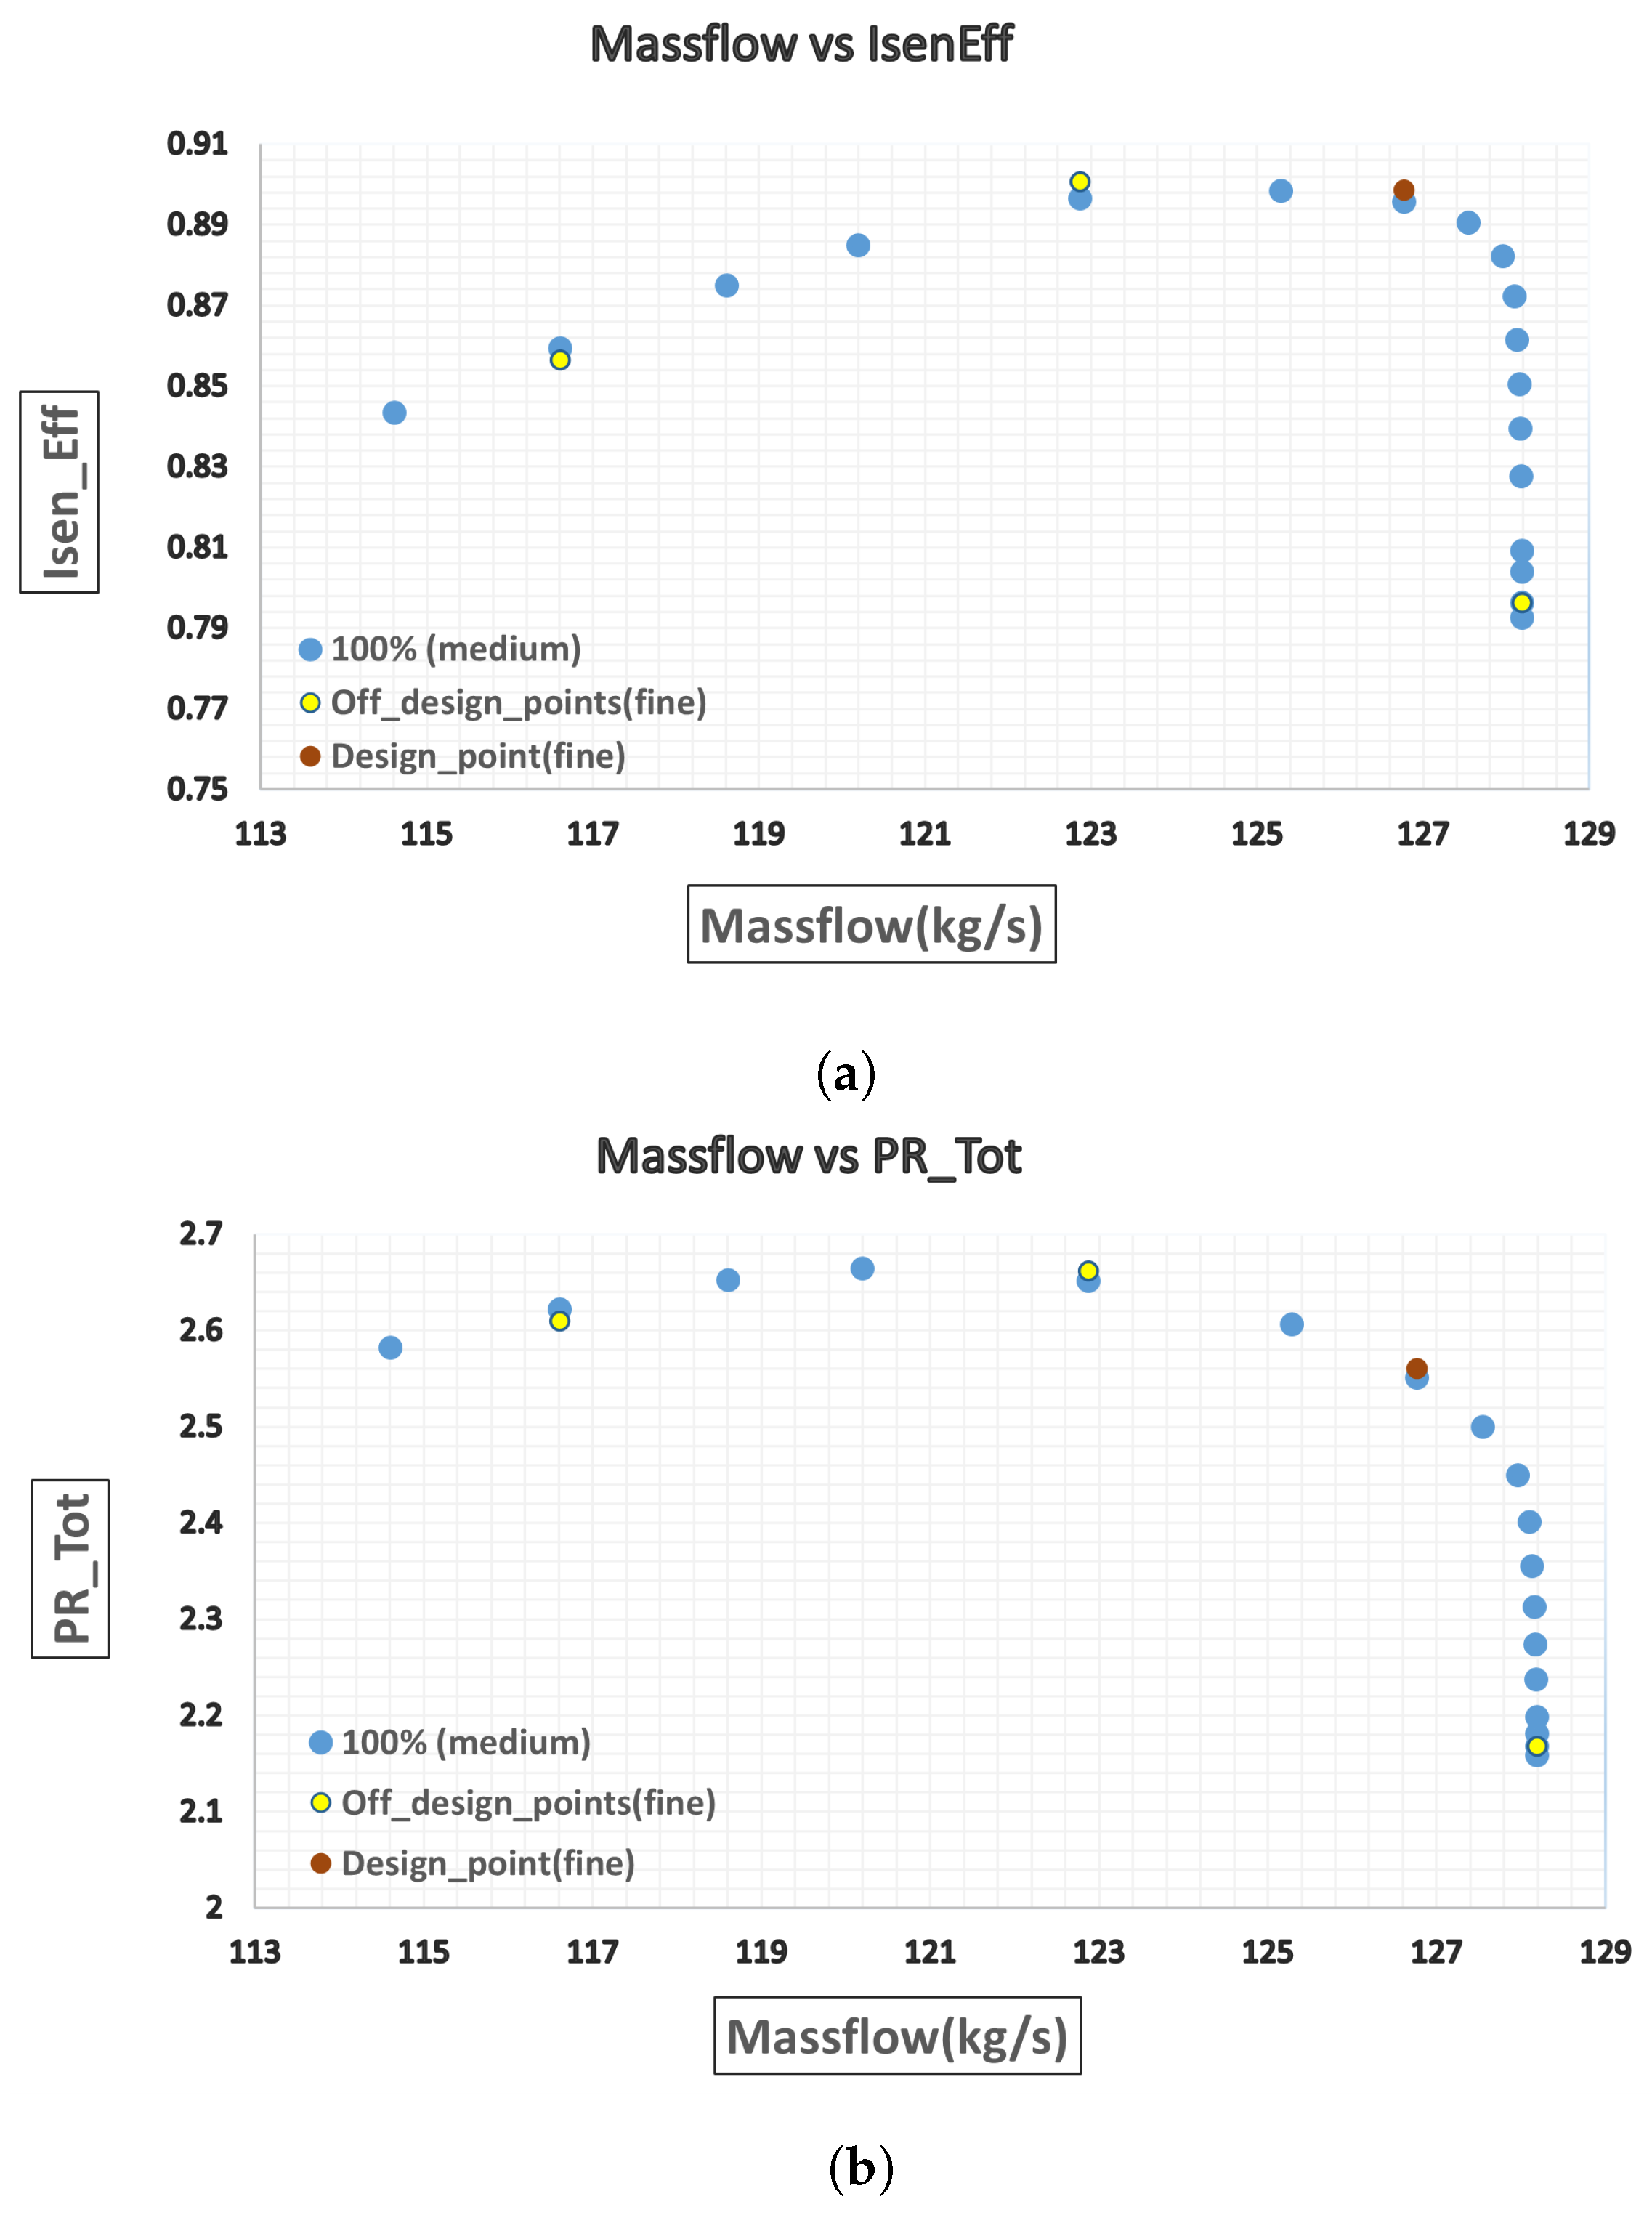
A grid dependency study was performed for the cantilevered three-stage configuration by plotting speed lines using medium and fine meshes. The medium mesh, which was one-eighth the size of the fine mesh, utilized every other point in all x, y, and z directions while doubling the y+ values. Speed lines were plotted for the medium mesh, while the design, and a few off-design points, were also plotted for the fine mesh to verify the accuracy of the medium mesh. Figure 3 depicts the speed lines for pressure ratio and isentropic efficiency for the medium mesh, as well as the design and off-design points for the fine mesh.
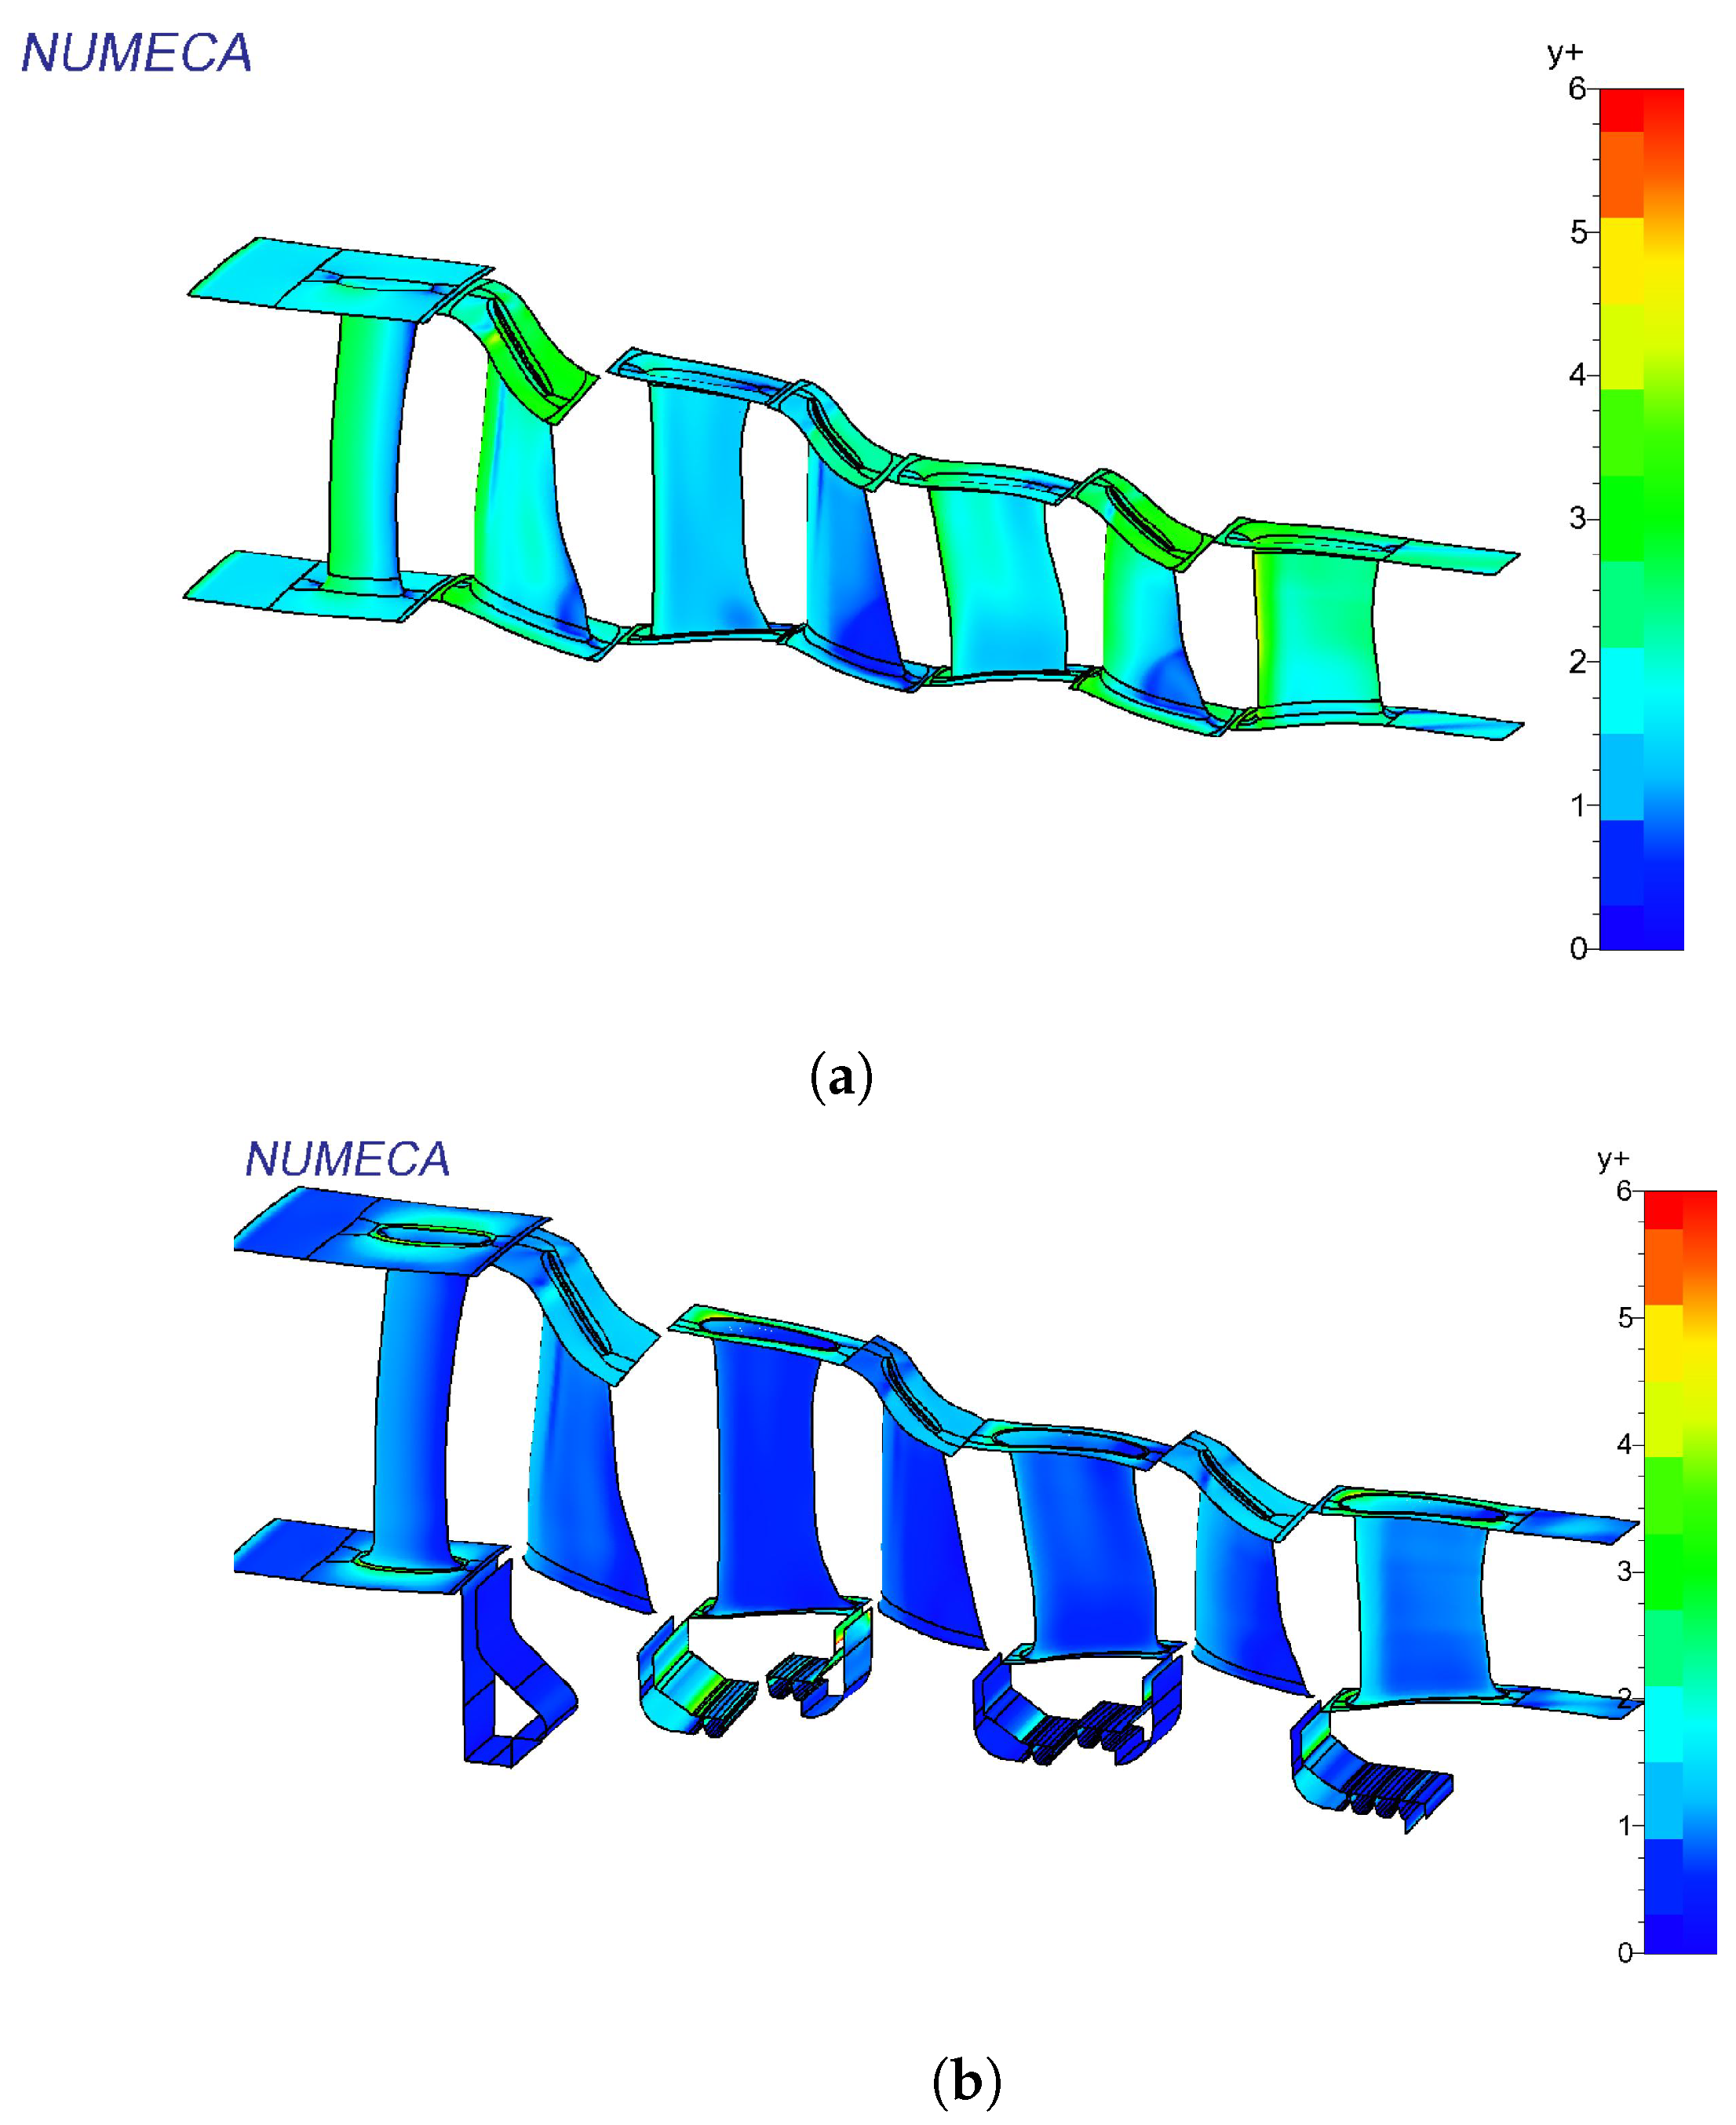
To ensure the appropriate resolution of flow within the boundary layer, 3D contour plots for y+ were examined. Figure 4 depicts the y+ distribution for both cases: (a) without cavities and (b) with cavities. Notably, the y+ values adhere to acceptable limits for design calculations. Specifically, for the SA turbulence model used, the y+ values conformed to the recommended value of <10, as stated in the Fine/Turbo user manual [17].
4. R/S Interfaces
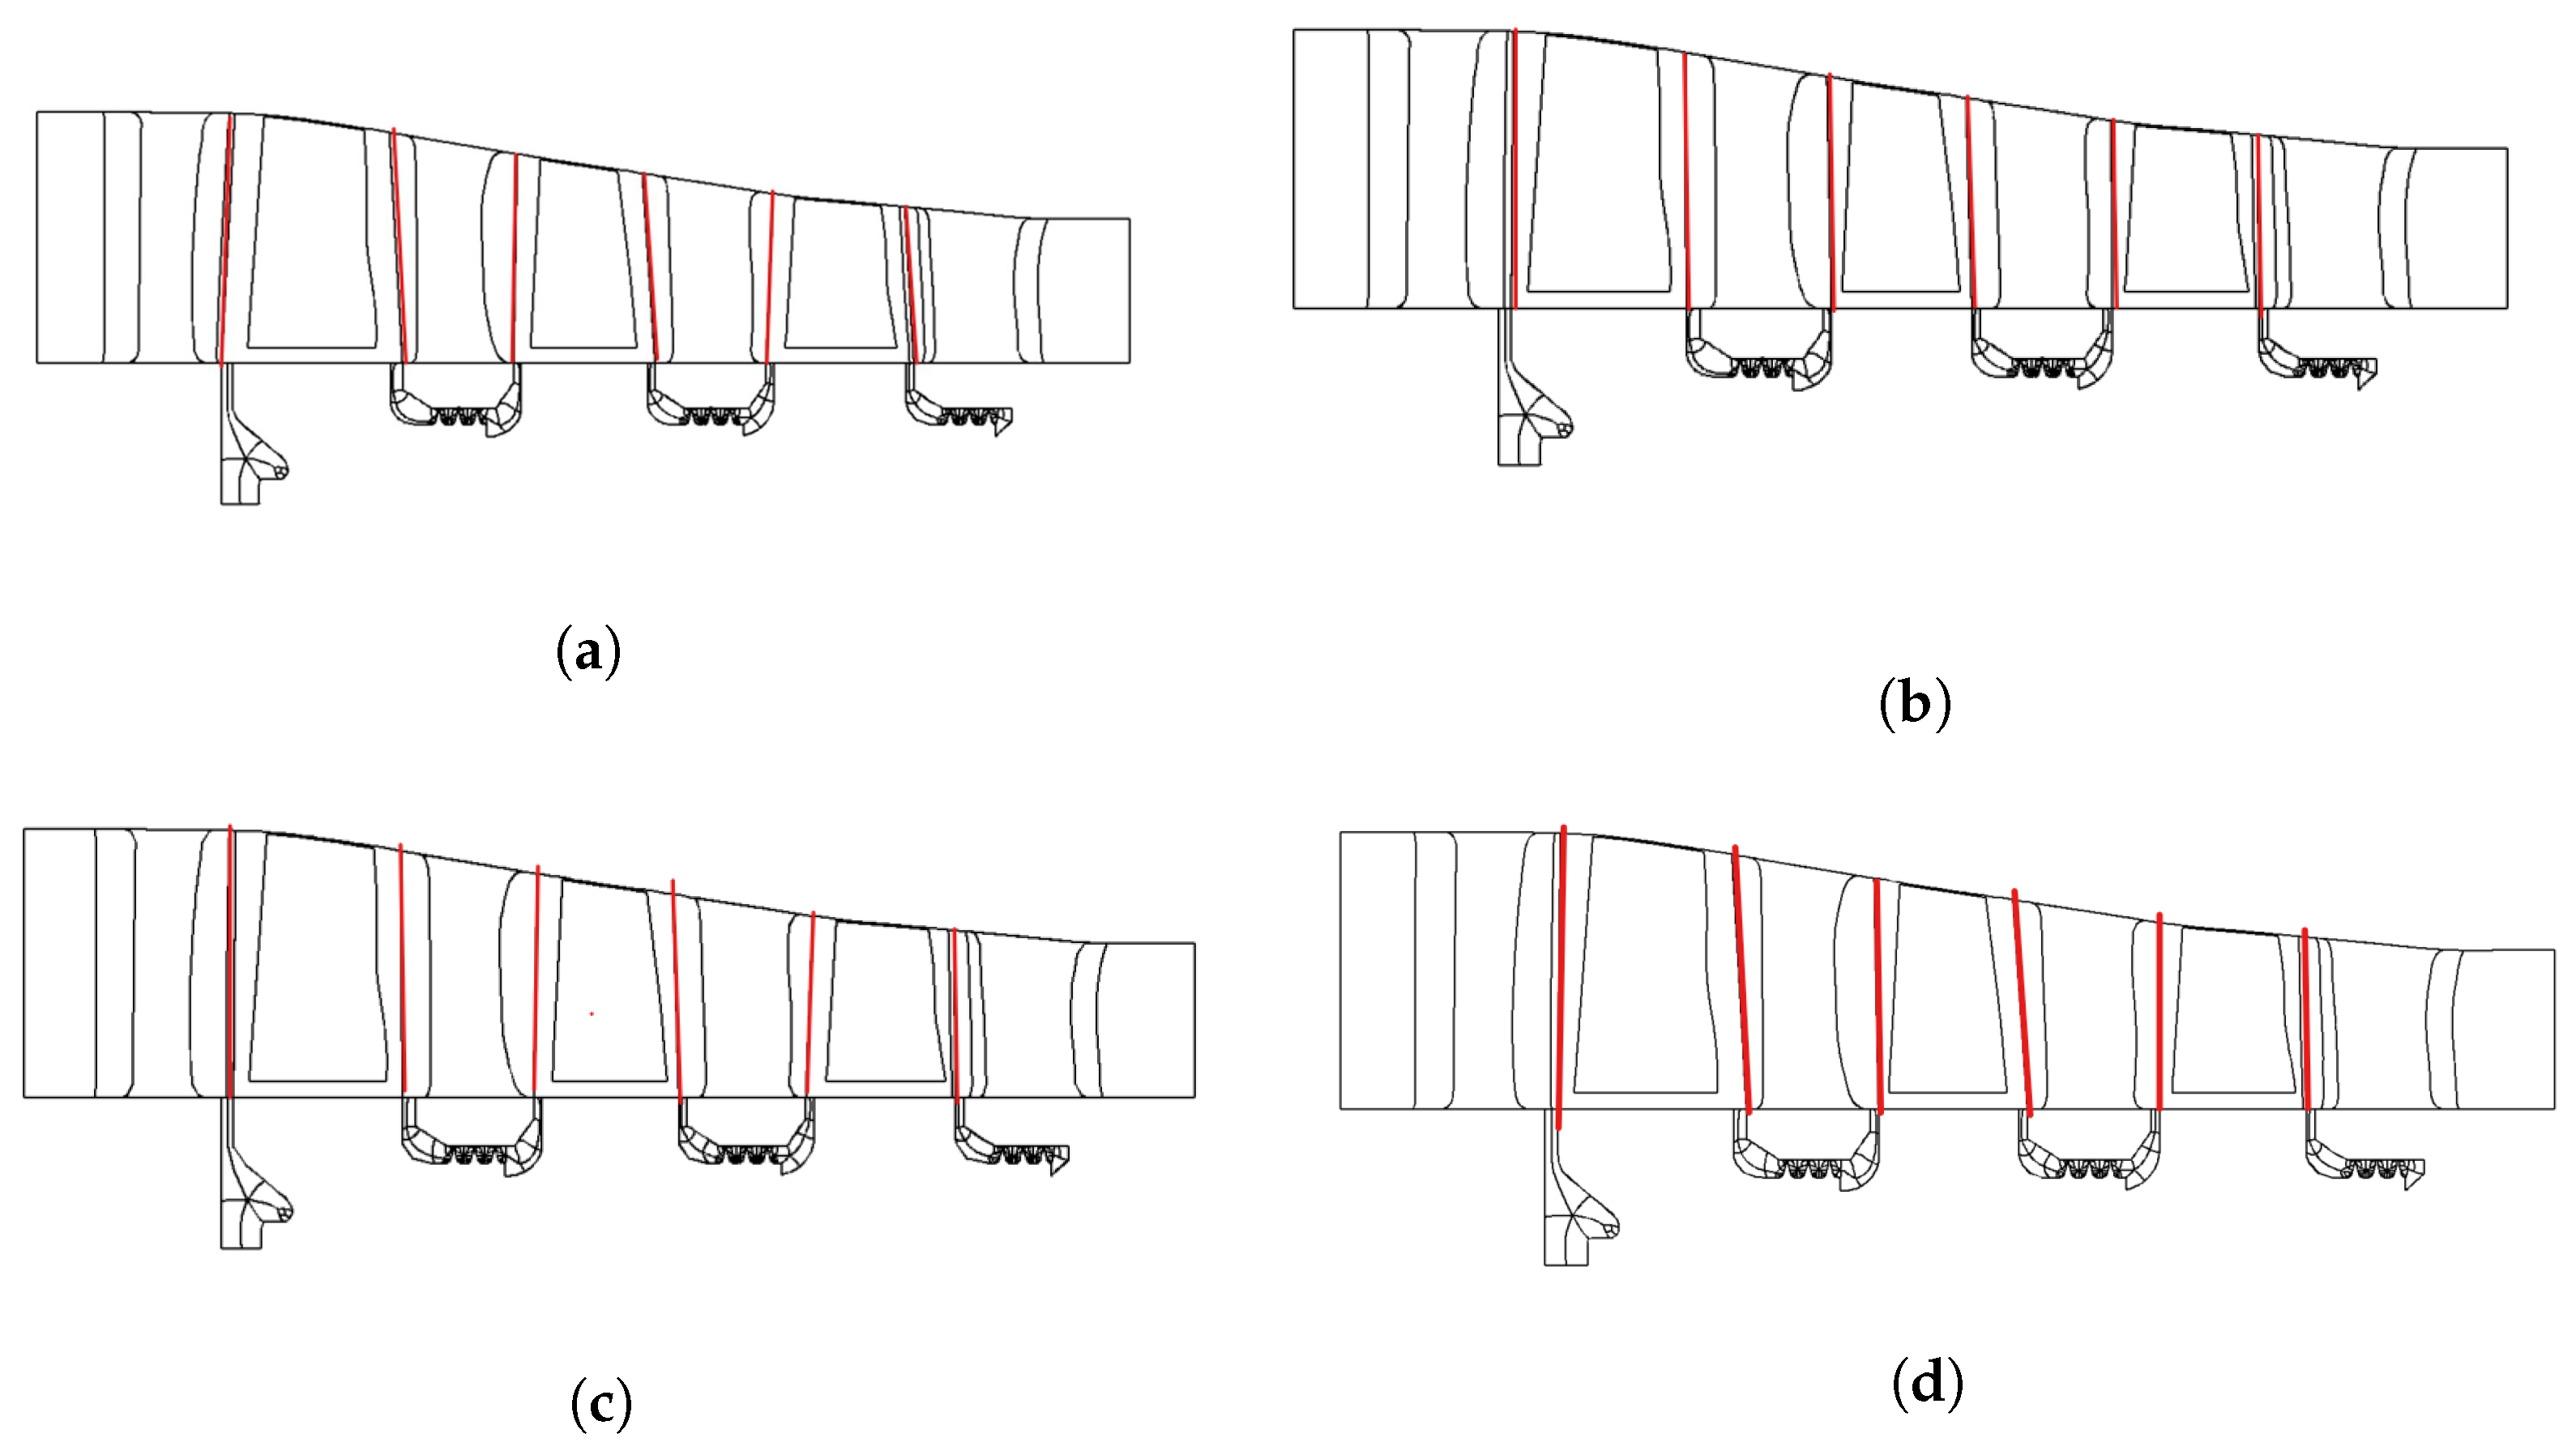
Studies have shown that the proper definition of the R/S interface is a critical factor that affects the flow through the cavity, given the influence of unsteady effects from both the upstream and downstream rotors. In this study, for the shrouded configuration, we investigate and analyze four possible configurations for the R/S interface, using mixing plane calculations. Figure 5 illustrates the four different cavity configurations, including those in a rotating frame (a), entirely in a stationary frame (b), or a combination of stationary/rotating frames (c and d). In (c), the upstream part of the cavity is in the stationary frame and the downstream part is in the rotating frame, while in (d), the configuration is reversed.
Further, we also employ the basic Non-Linear Harmonic (NLH) method, which is a hybrid method that provides an approximate unsteady solution at affordable calculation costs with reasonable accuracy. The NLH scheme was run with two harmonics and the results were compared with the mixing plane solutions. The efficiency, total pressure ratio, and mass flow for the cantilevered case, NLH case, and each of the four R/S configurations employing mixing plane assumptions are listed in Table 3. It was observed that the NLH method provided the optimal performance parameters.
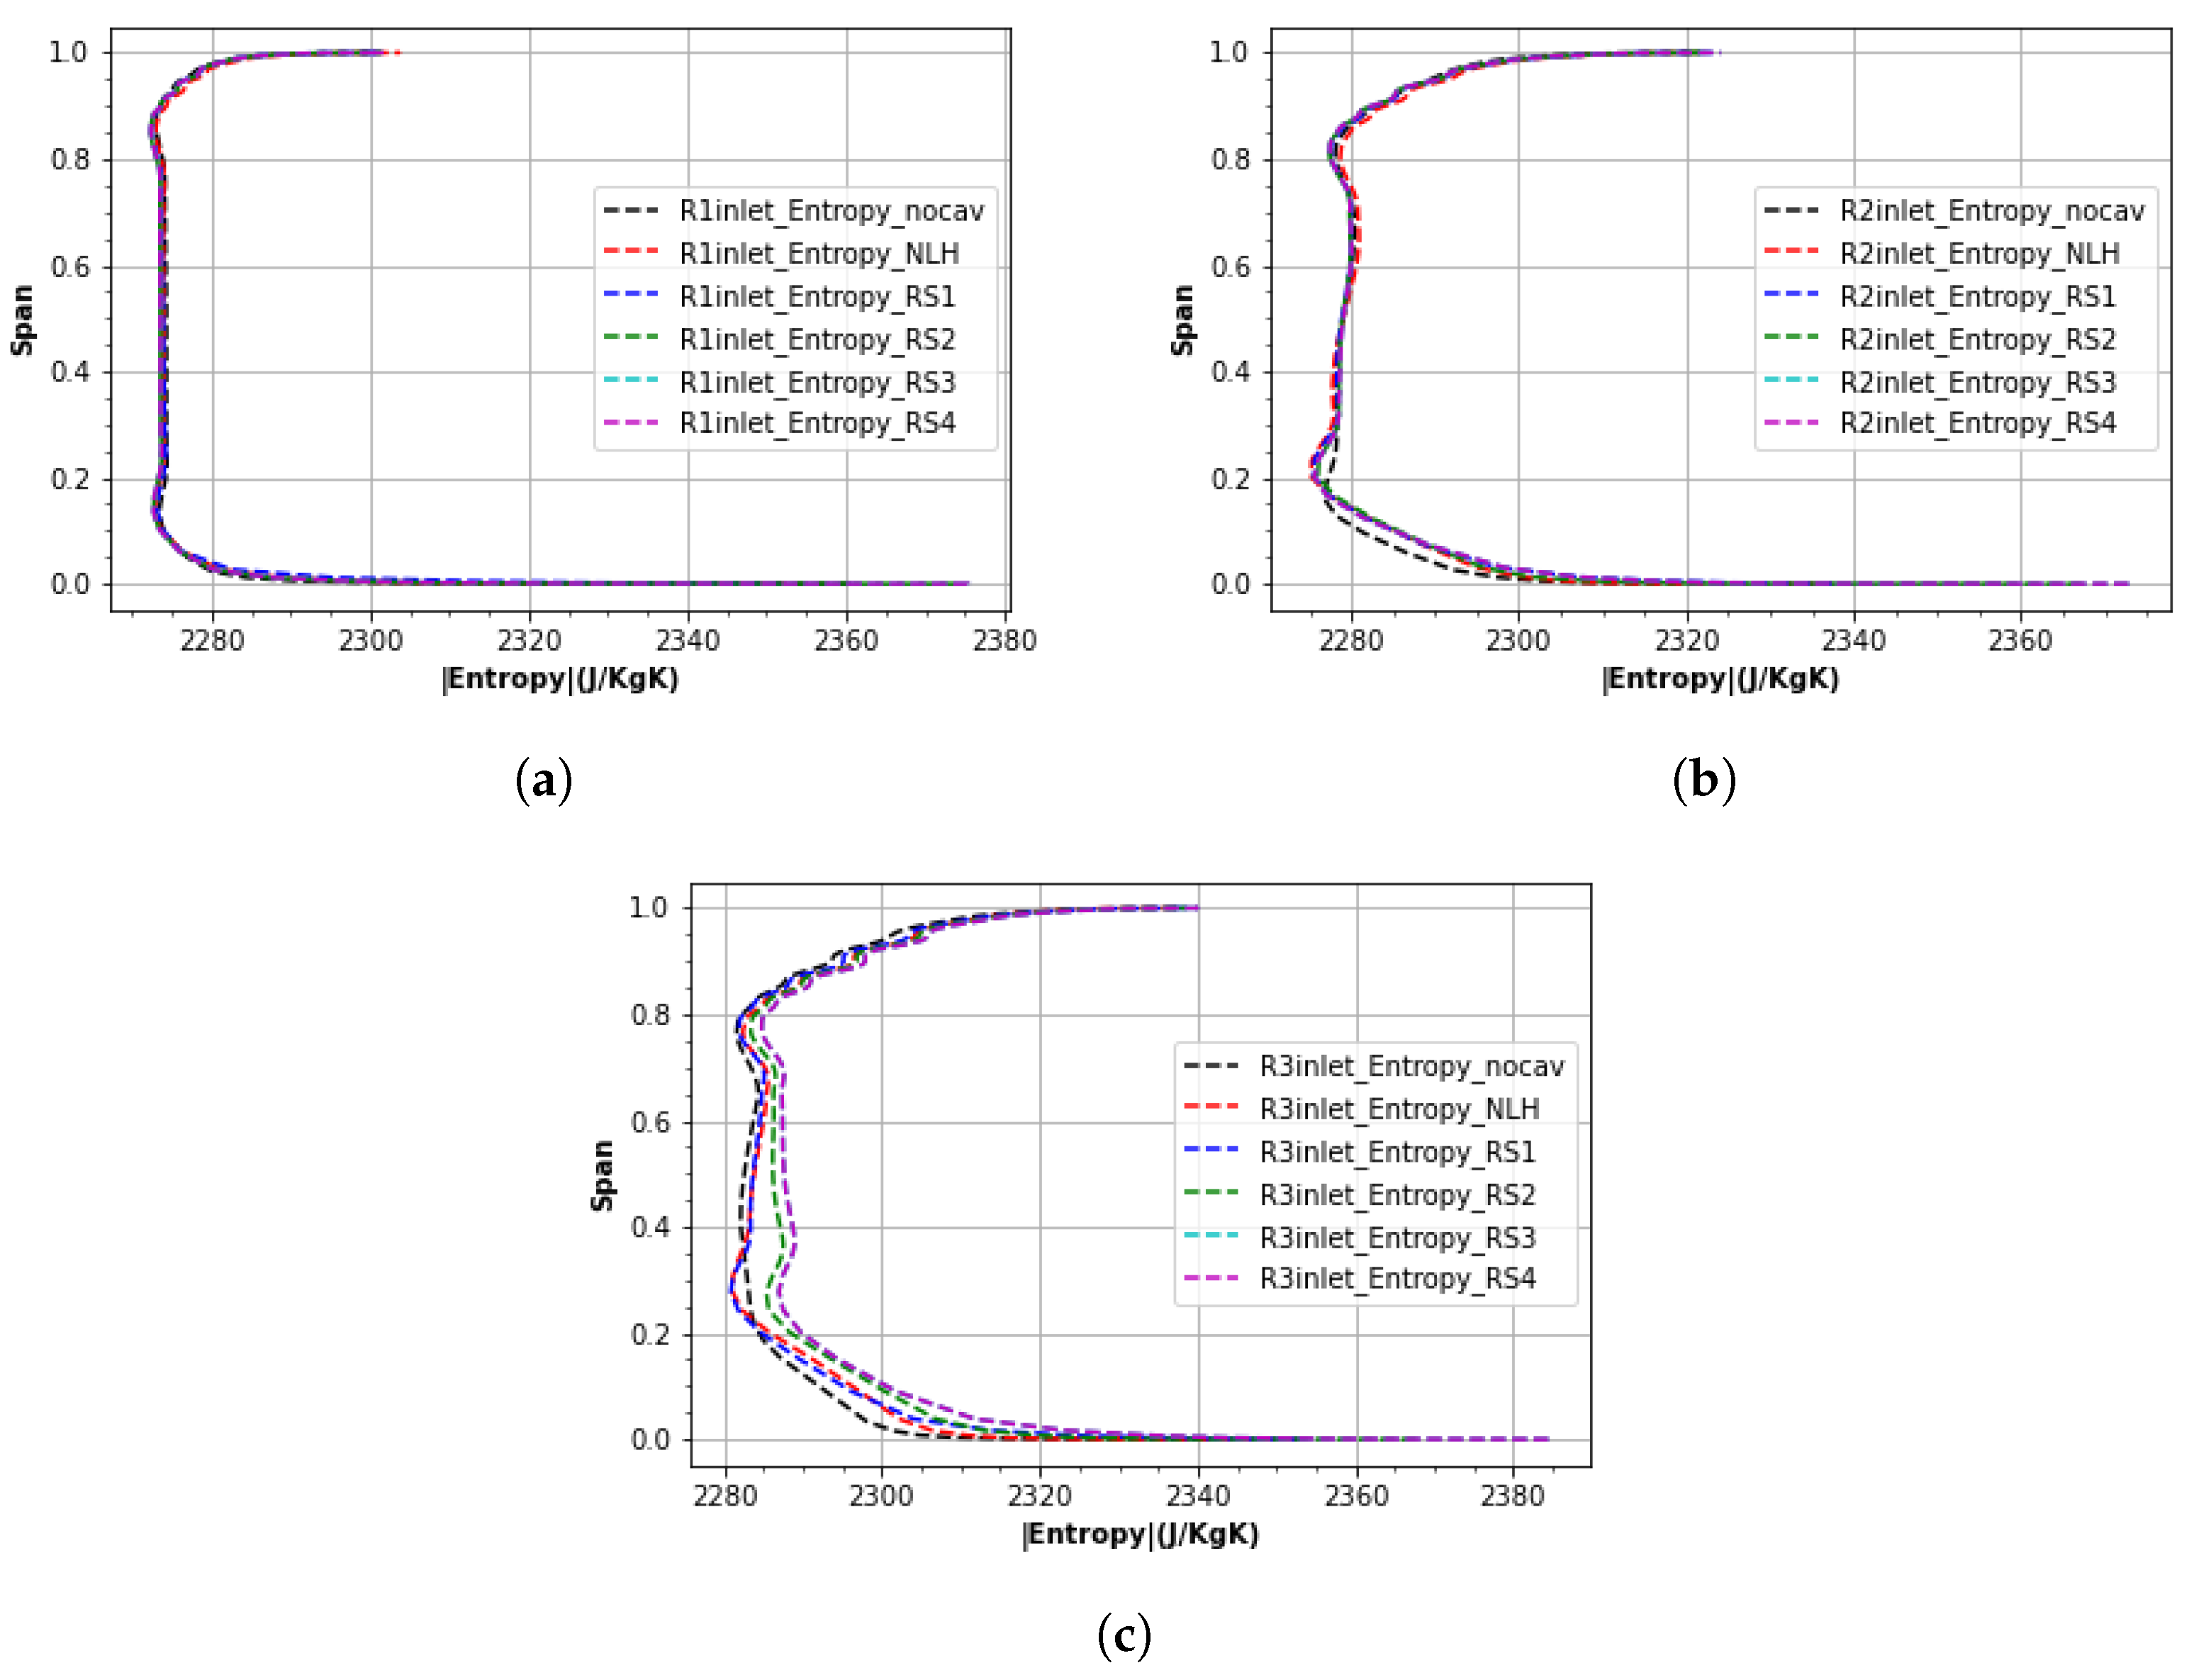
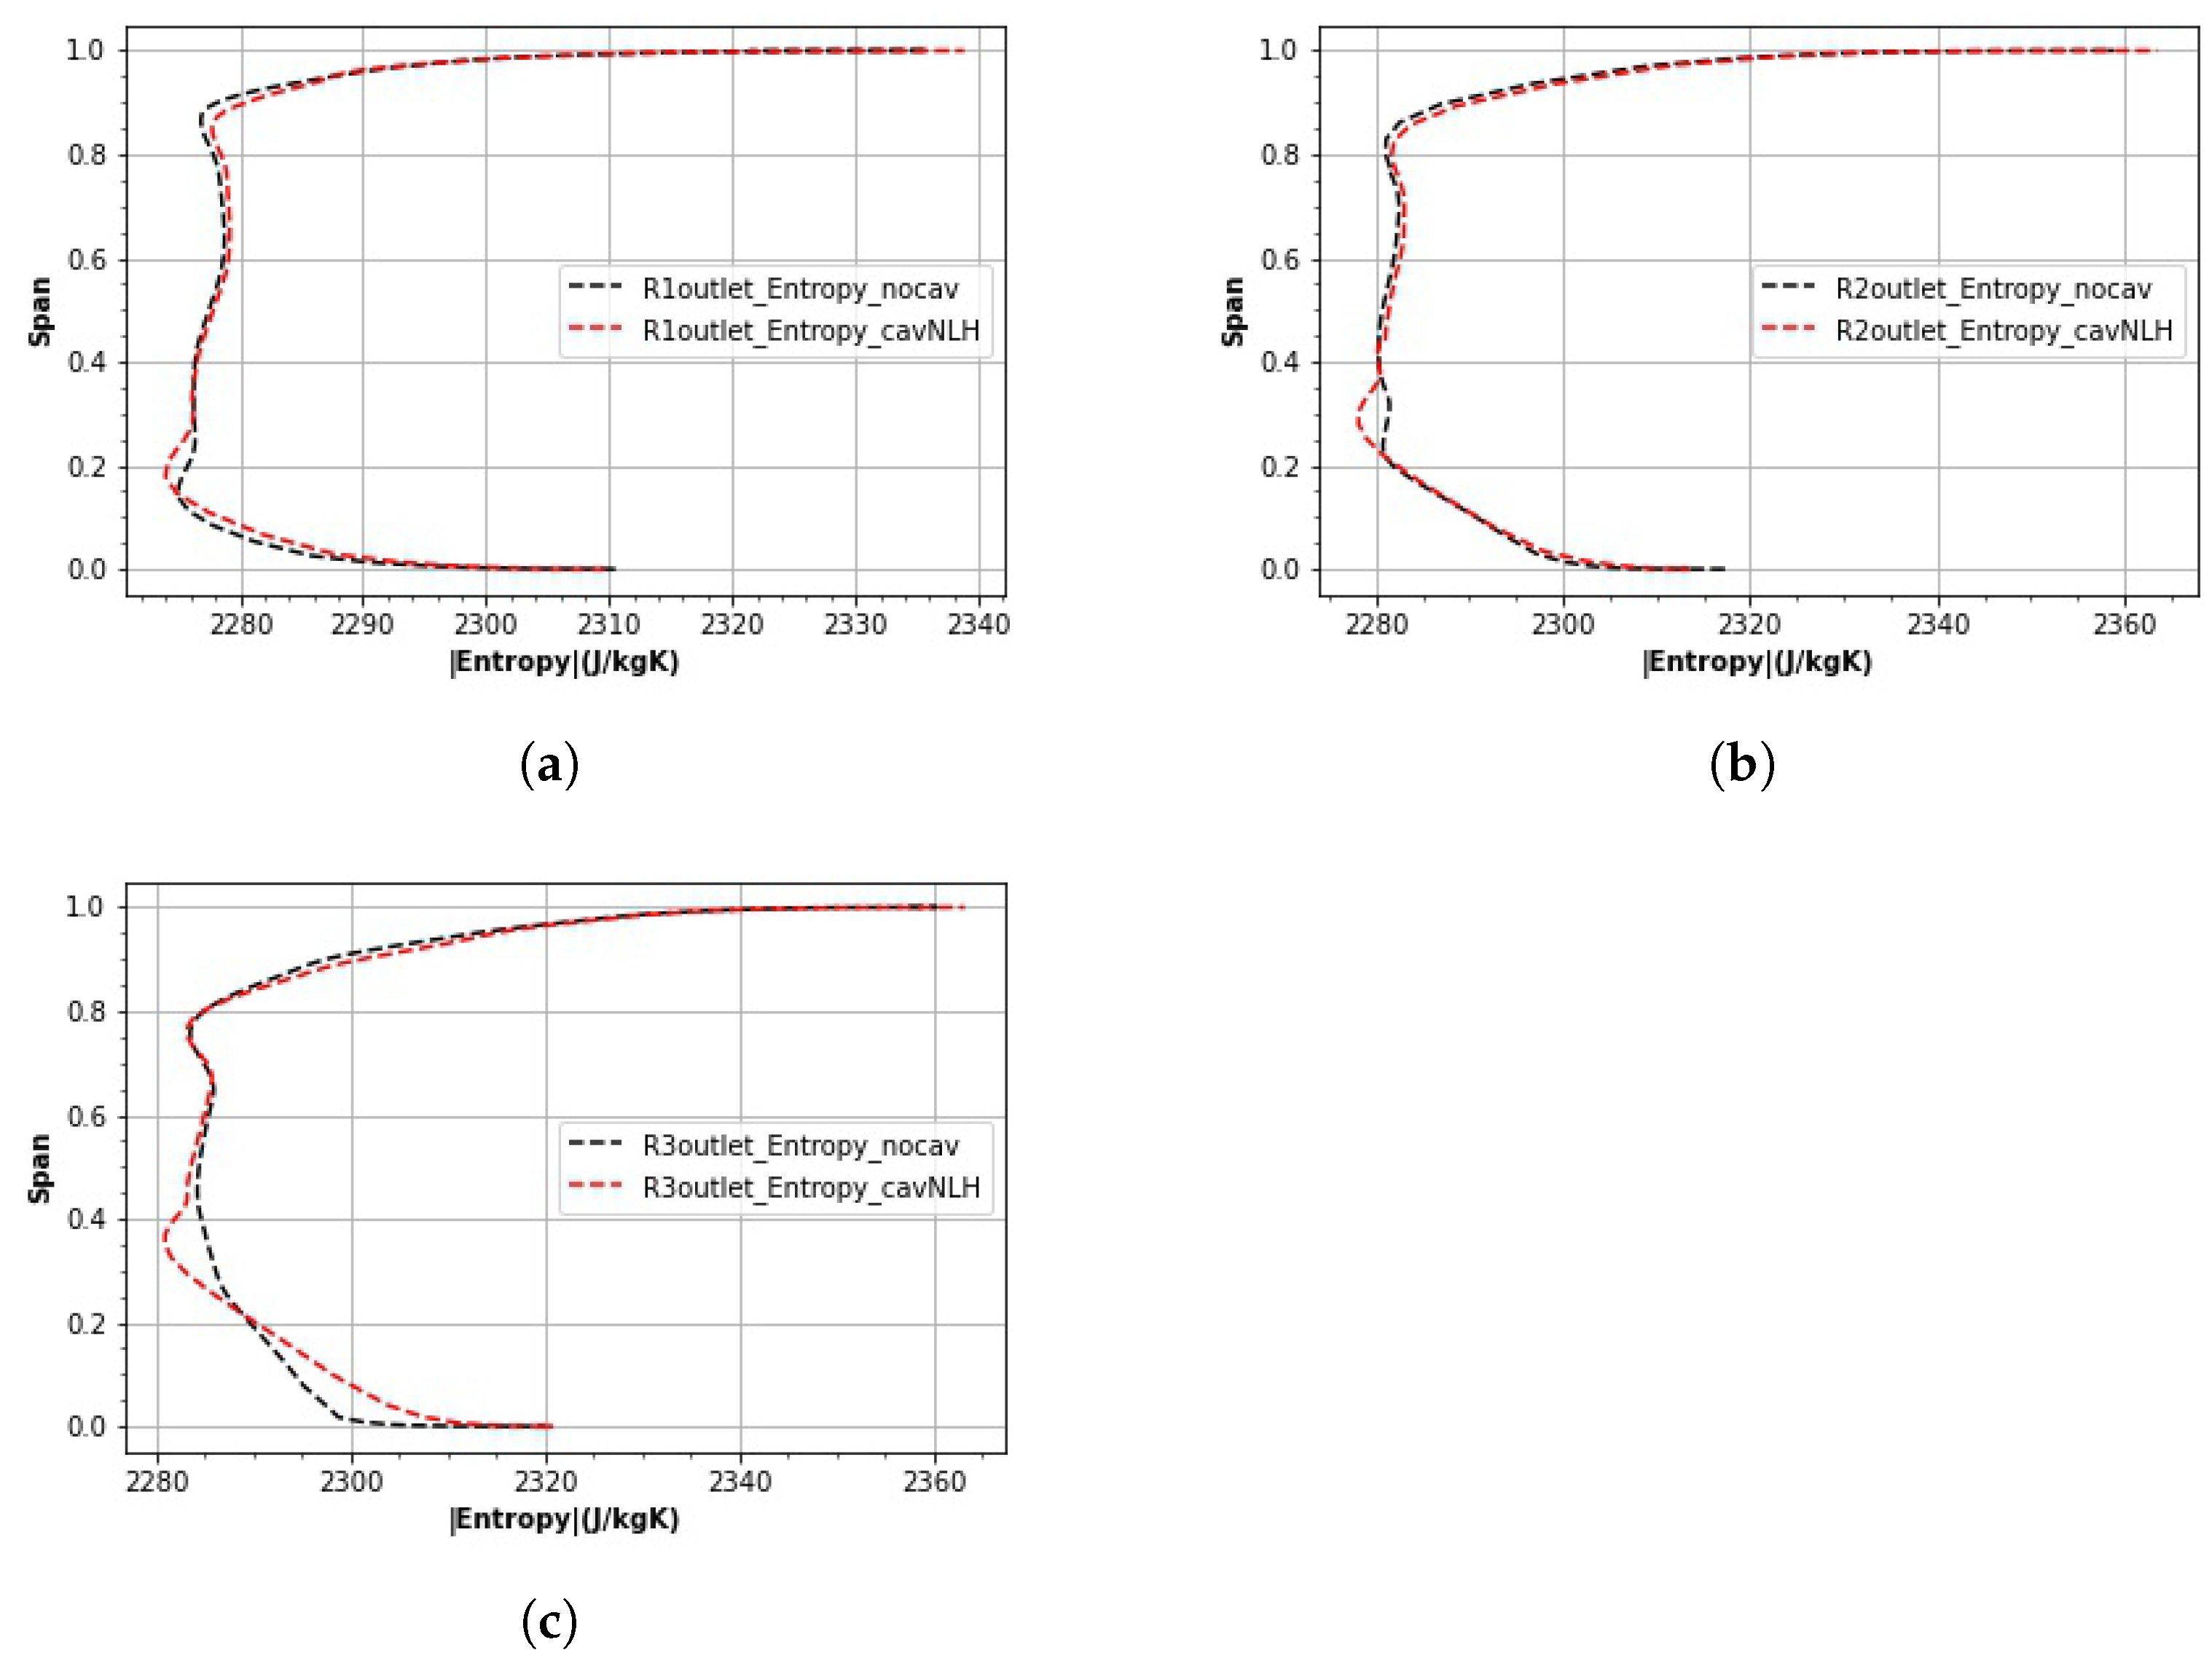
Understanding entropy generation is important when looking into losses generated in the process. Profile plots of entropy at the downstream rotor inlet are compared between the cantilevered case, four possible R/S configuration mixing plane cases and the NLH case to understand losses. This is shown by plotting tangentially mass-averaged span-wise entropy plots as shown in Figure 6 below. The plot shows that there was very small additional entropy generation around the first rotor hub region, due to the leakage flow for all configurations. There was some entropy generation around the second rotor up to about 20% span length for the shrouded configurations. However, the R/S interface definition did not seem to have more impact on the entropy distribution of the second rotor. From Figure 6c, We can clearly see the difference in entropy generation for different R/S interfaces at Rotor3 and the effect can be seen all the way up to 80% span length. Among the shrouded cases, the NLH case had the least entropy generation around the hub region.
Considering the optimal performance parameters and minimum losses of the NLH case, as well as its capability to account for perturbations from adjacent rows and be independent of the R/S interface definition, the NLH solution was deemed more accurate and realistic. Consequently, it was selected for the conducting of a comprehensive analysis of the leakage flow.
5. Stage Performance
It is also critical to look into the individual stage performance and overall performance metrics to understand the effect of seal teeth cavity leakage flow. The leakage mass flow in each cavity was computed from the simulations and tabulated in Table 4. For comparison, it should be noted that the mass flow within the second cavity amounted to 0.07 kg/s. By comparison, that of the main flow was 127 kg/s. The resultant leakage mass flow rate comprised a mere 0.06% of the overall mass flow, indicating a very small amount.
We also tabulated individual stage performance parameters to look into the impact of seal teeth cavity leakage flow on each of the stages. The mass-averaged total pressure, total temperature, and isentropic efficiency were computed at the inlet and outlet planes of each stage from the CFD simulations, and ratios calculated, using the relations shown below (Equations (1)–(3)), and tabulated in Table 5. Since the working fluid was supercritical CO, a meanline code, coupled with thermodynamic tables generated by NIST REFPROP [18], was used to calculate the stage efficiencies [19]. The same tables were also used by the Fine/Turbo to define fluid properties.
6. Near Hub Performance
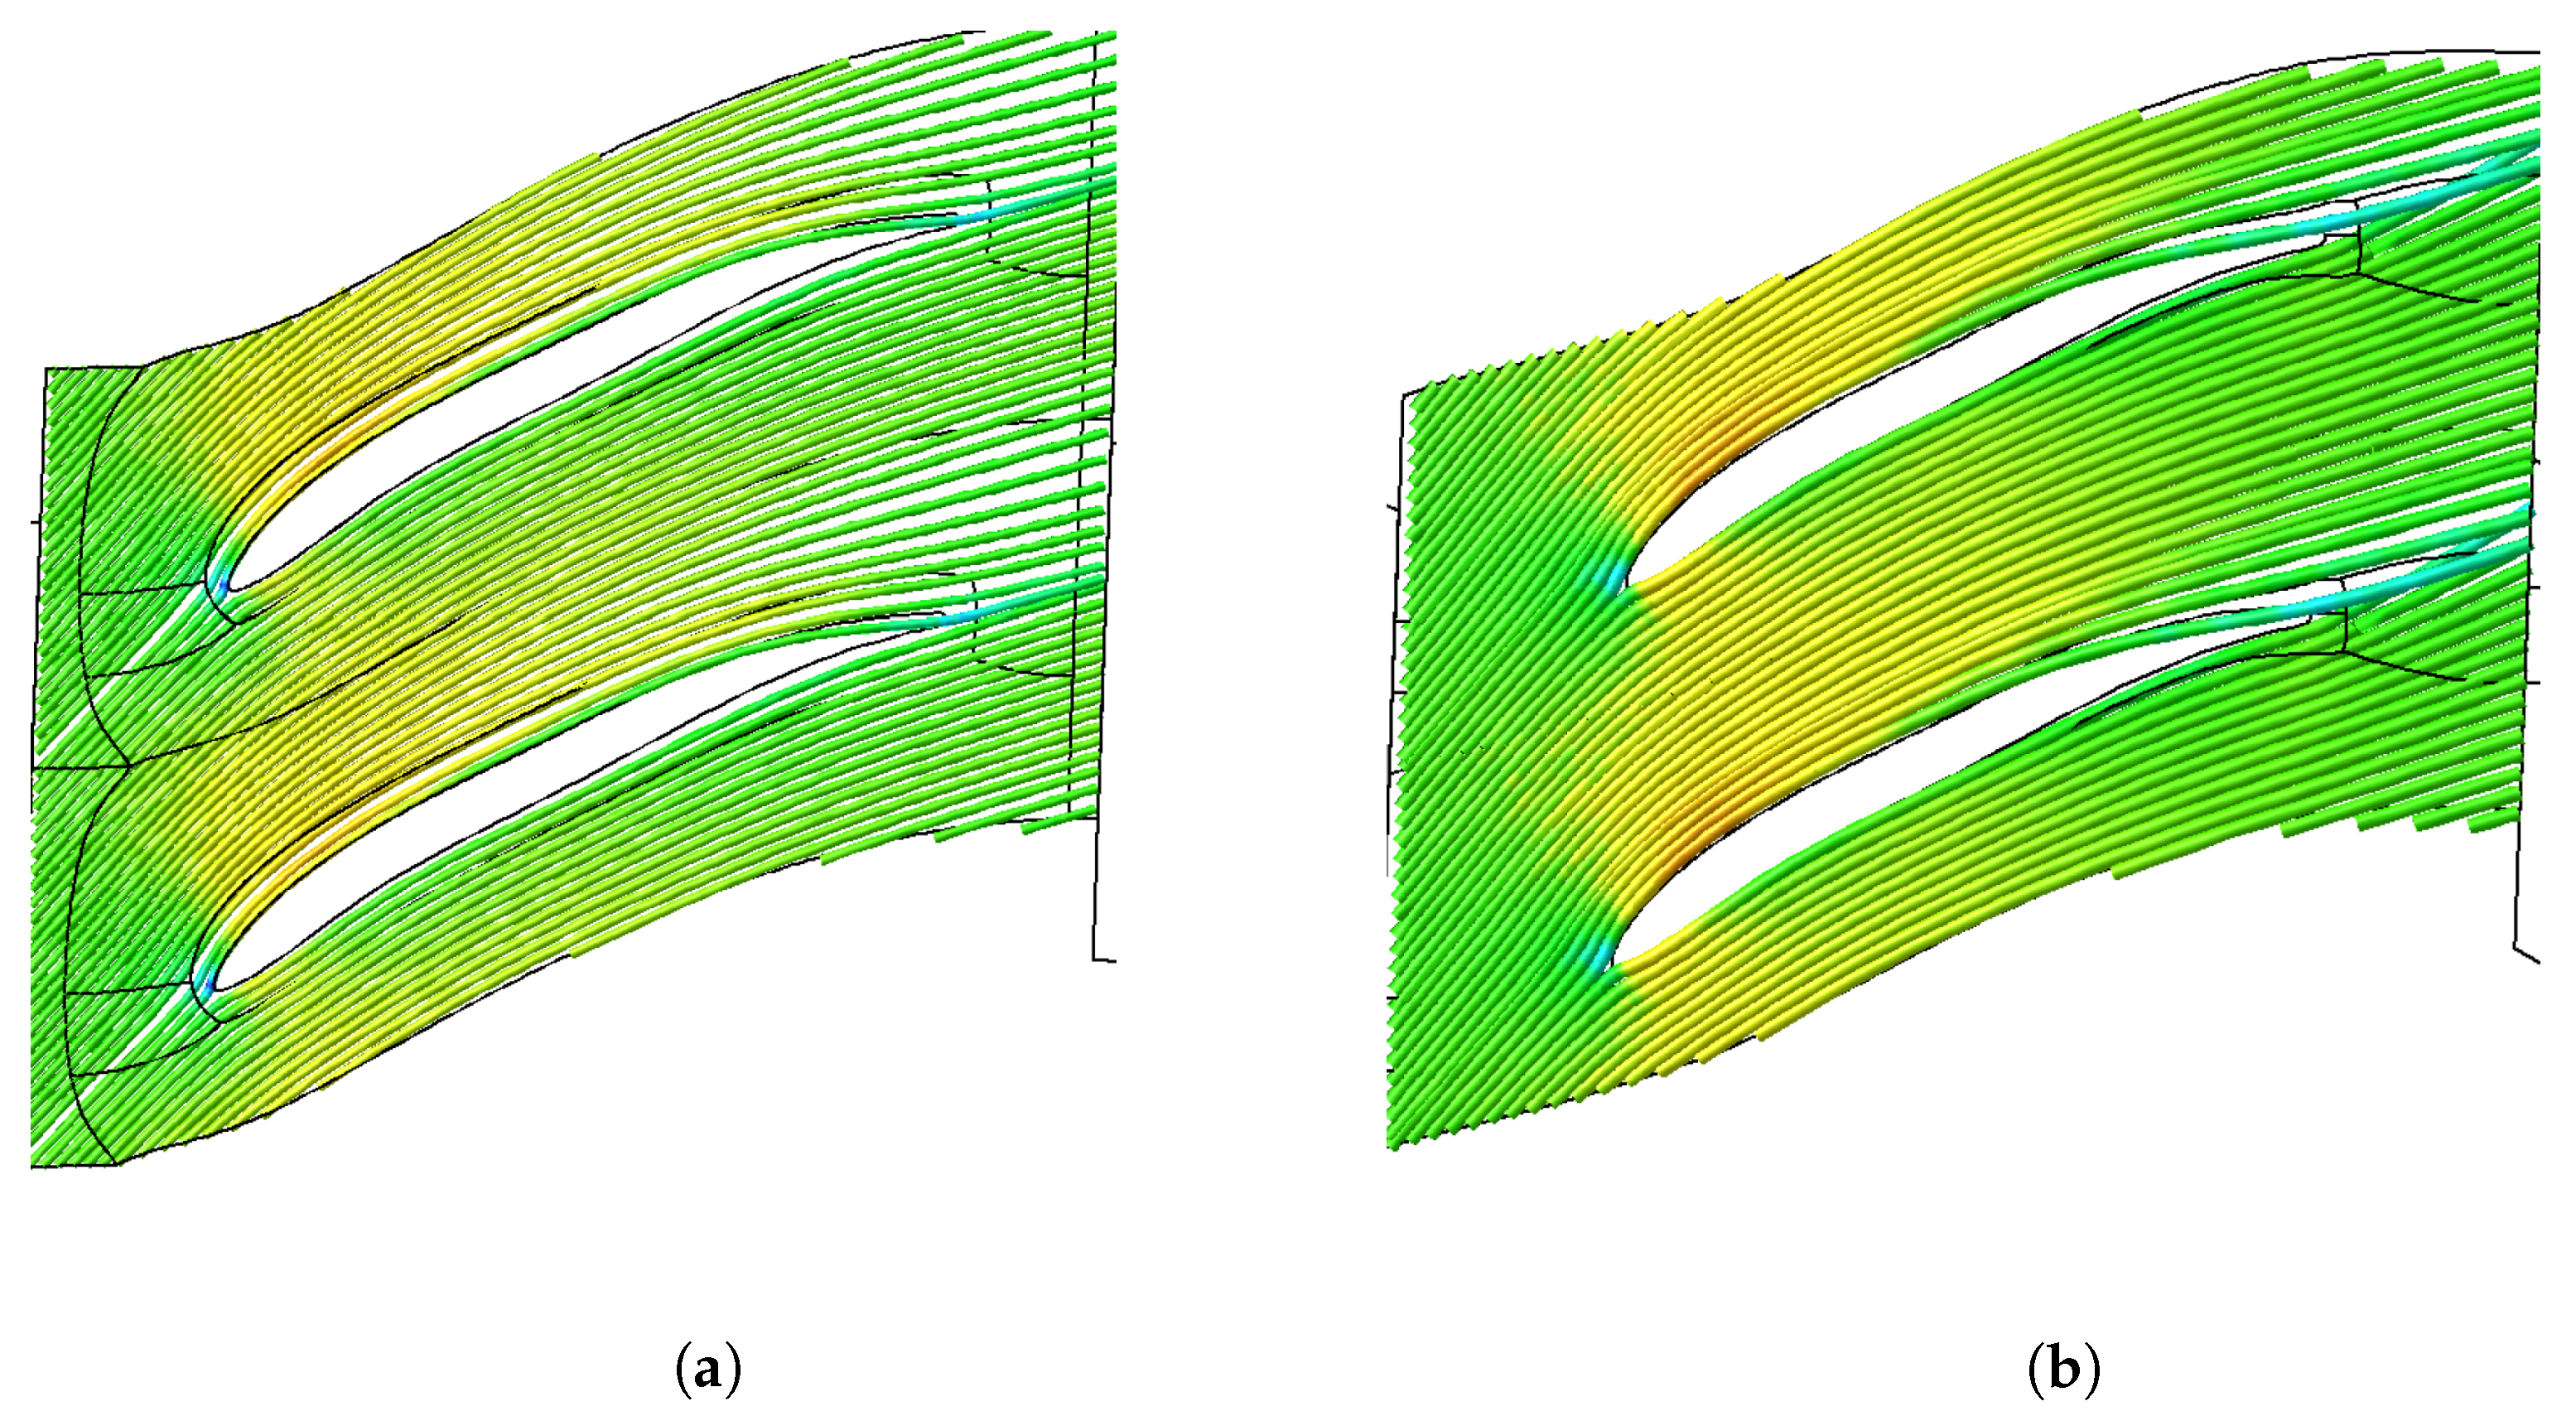
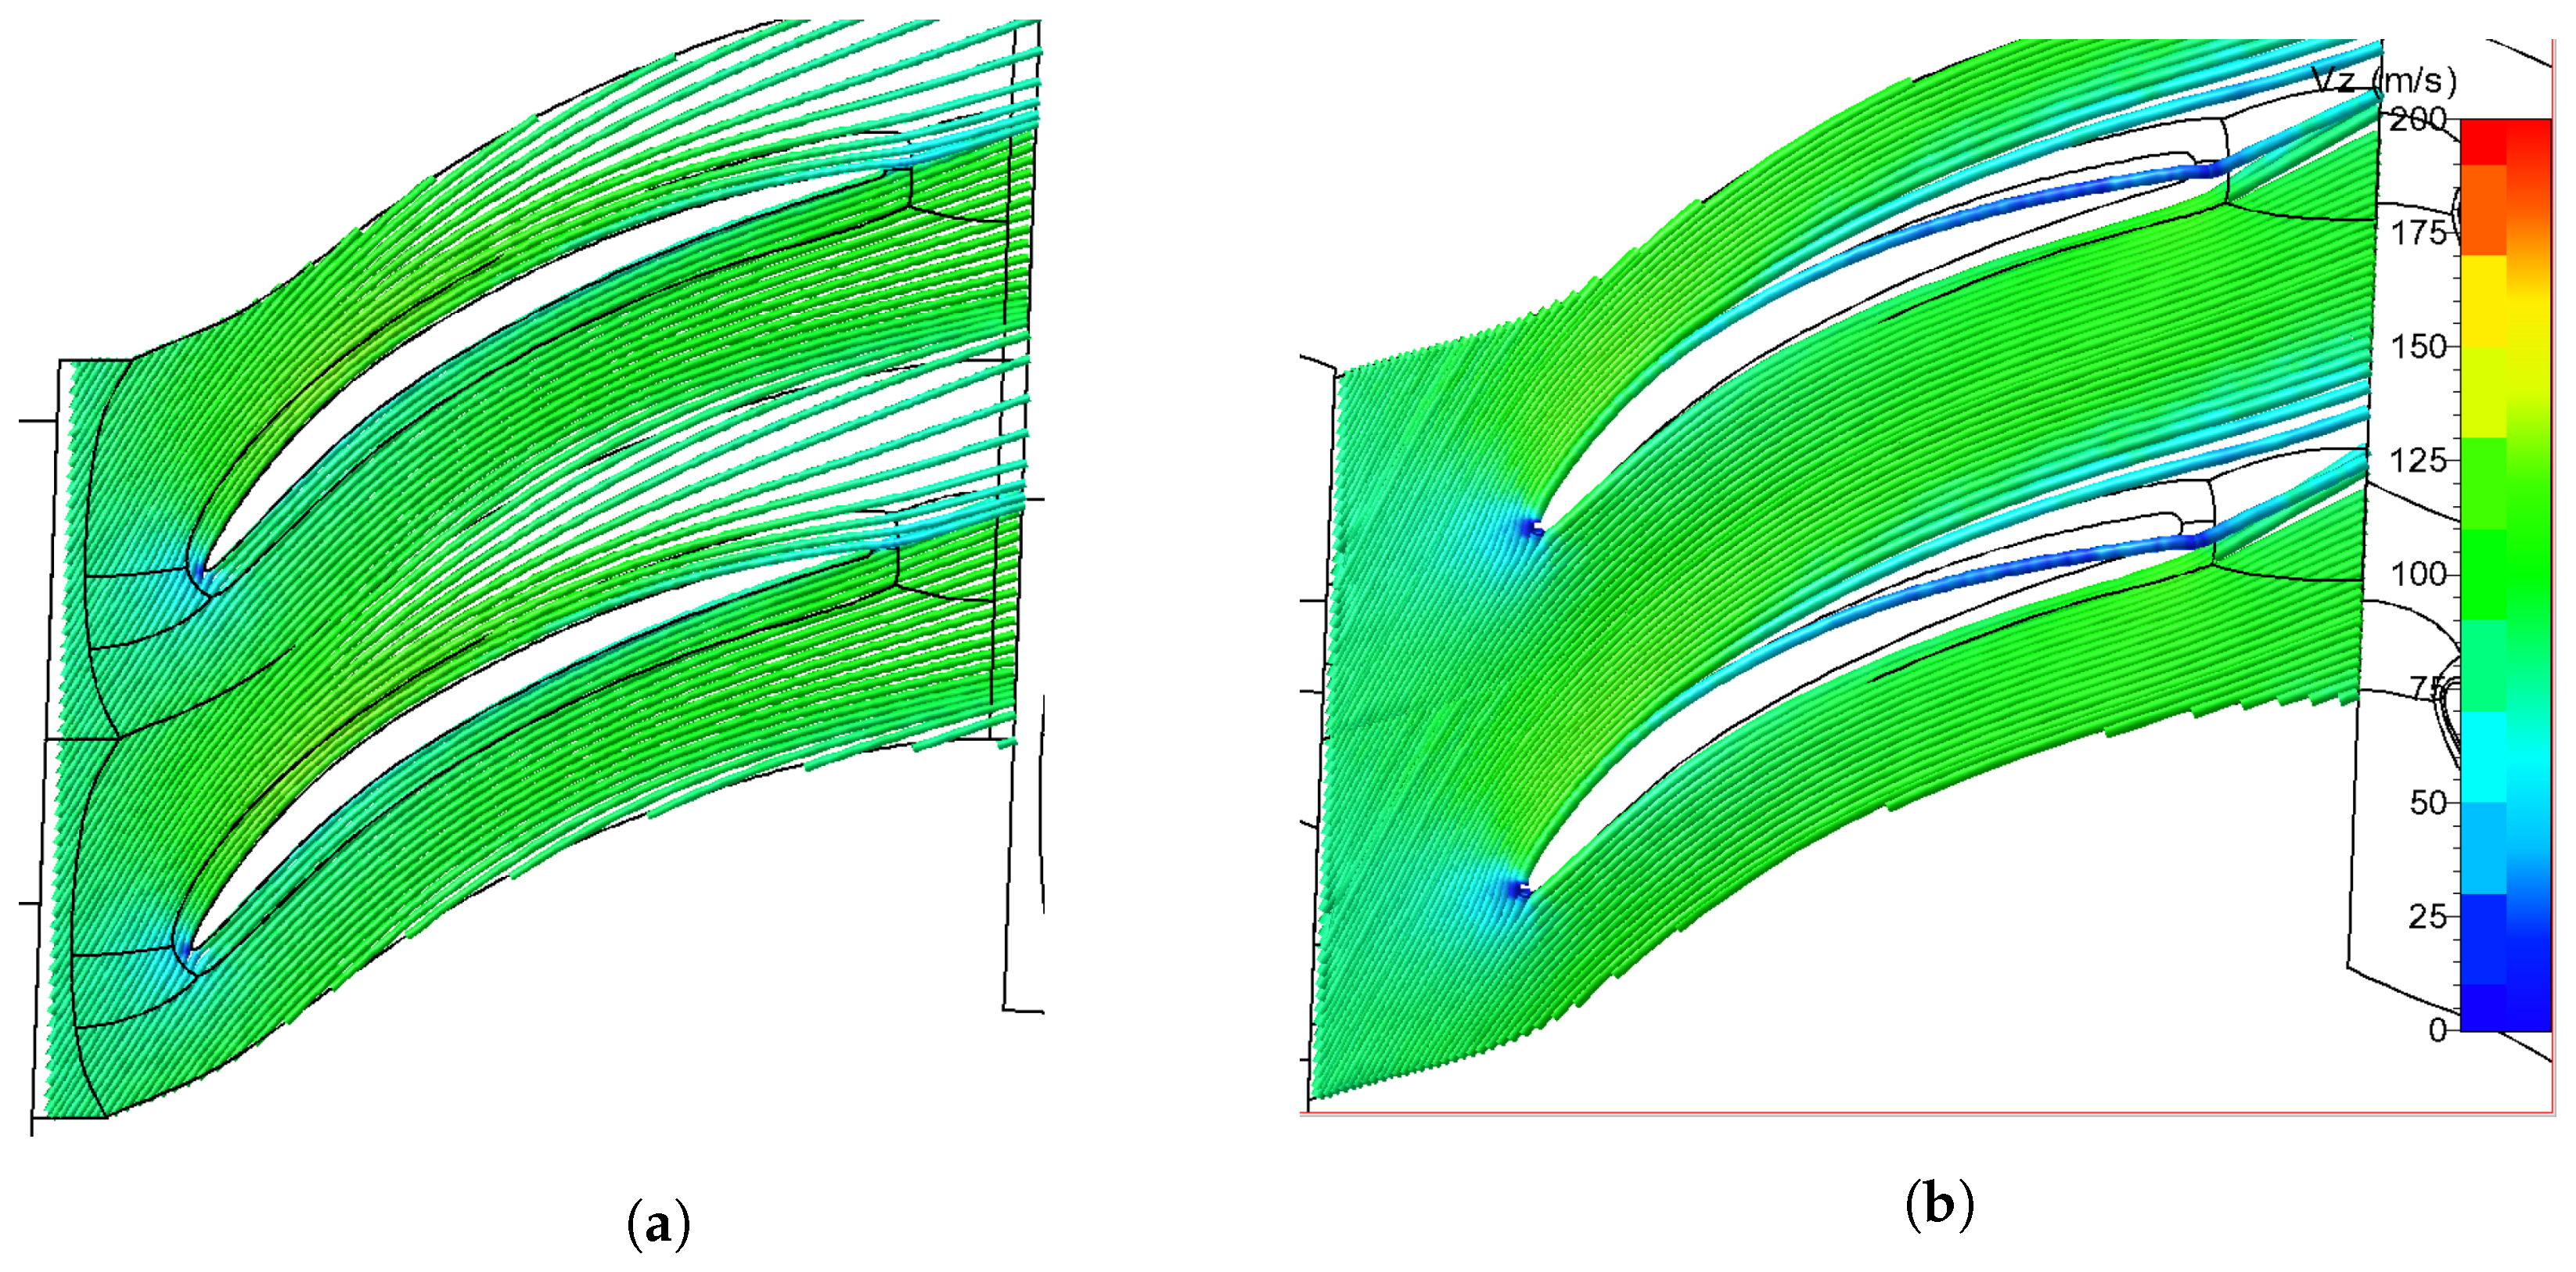
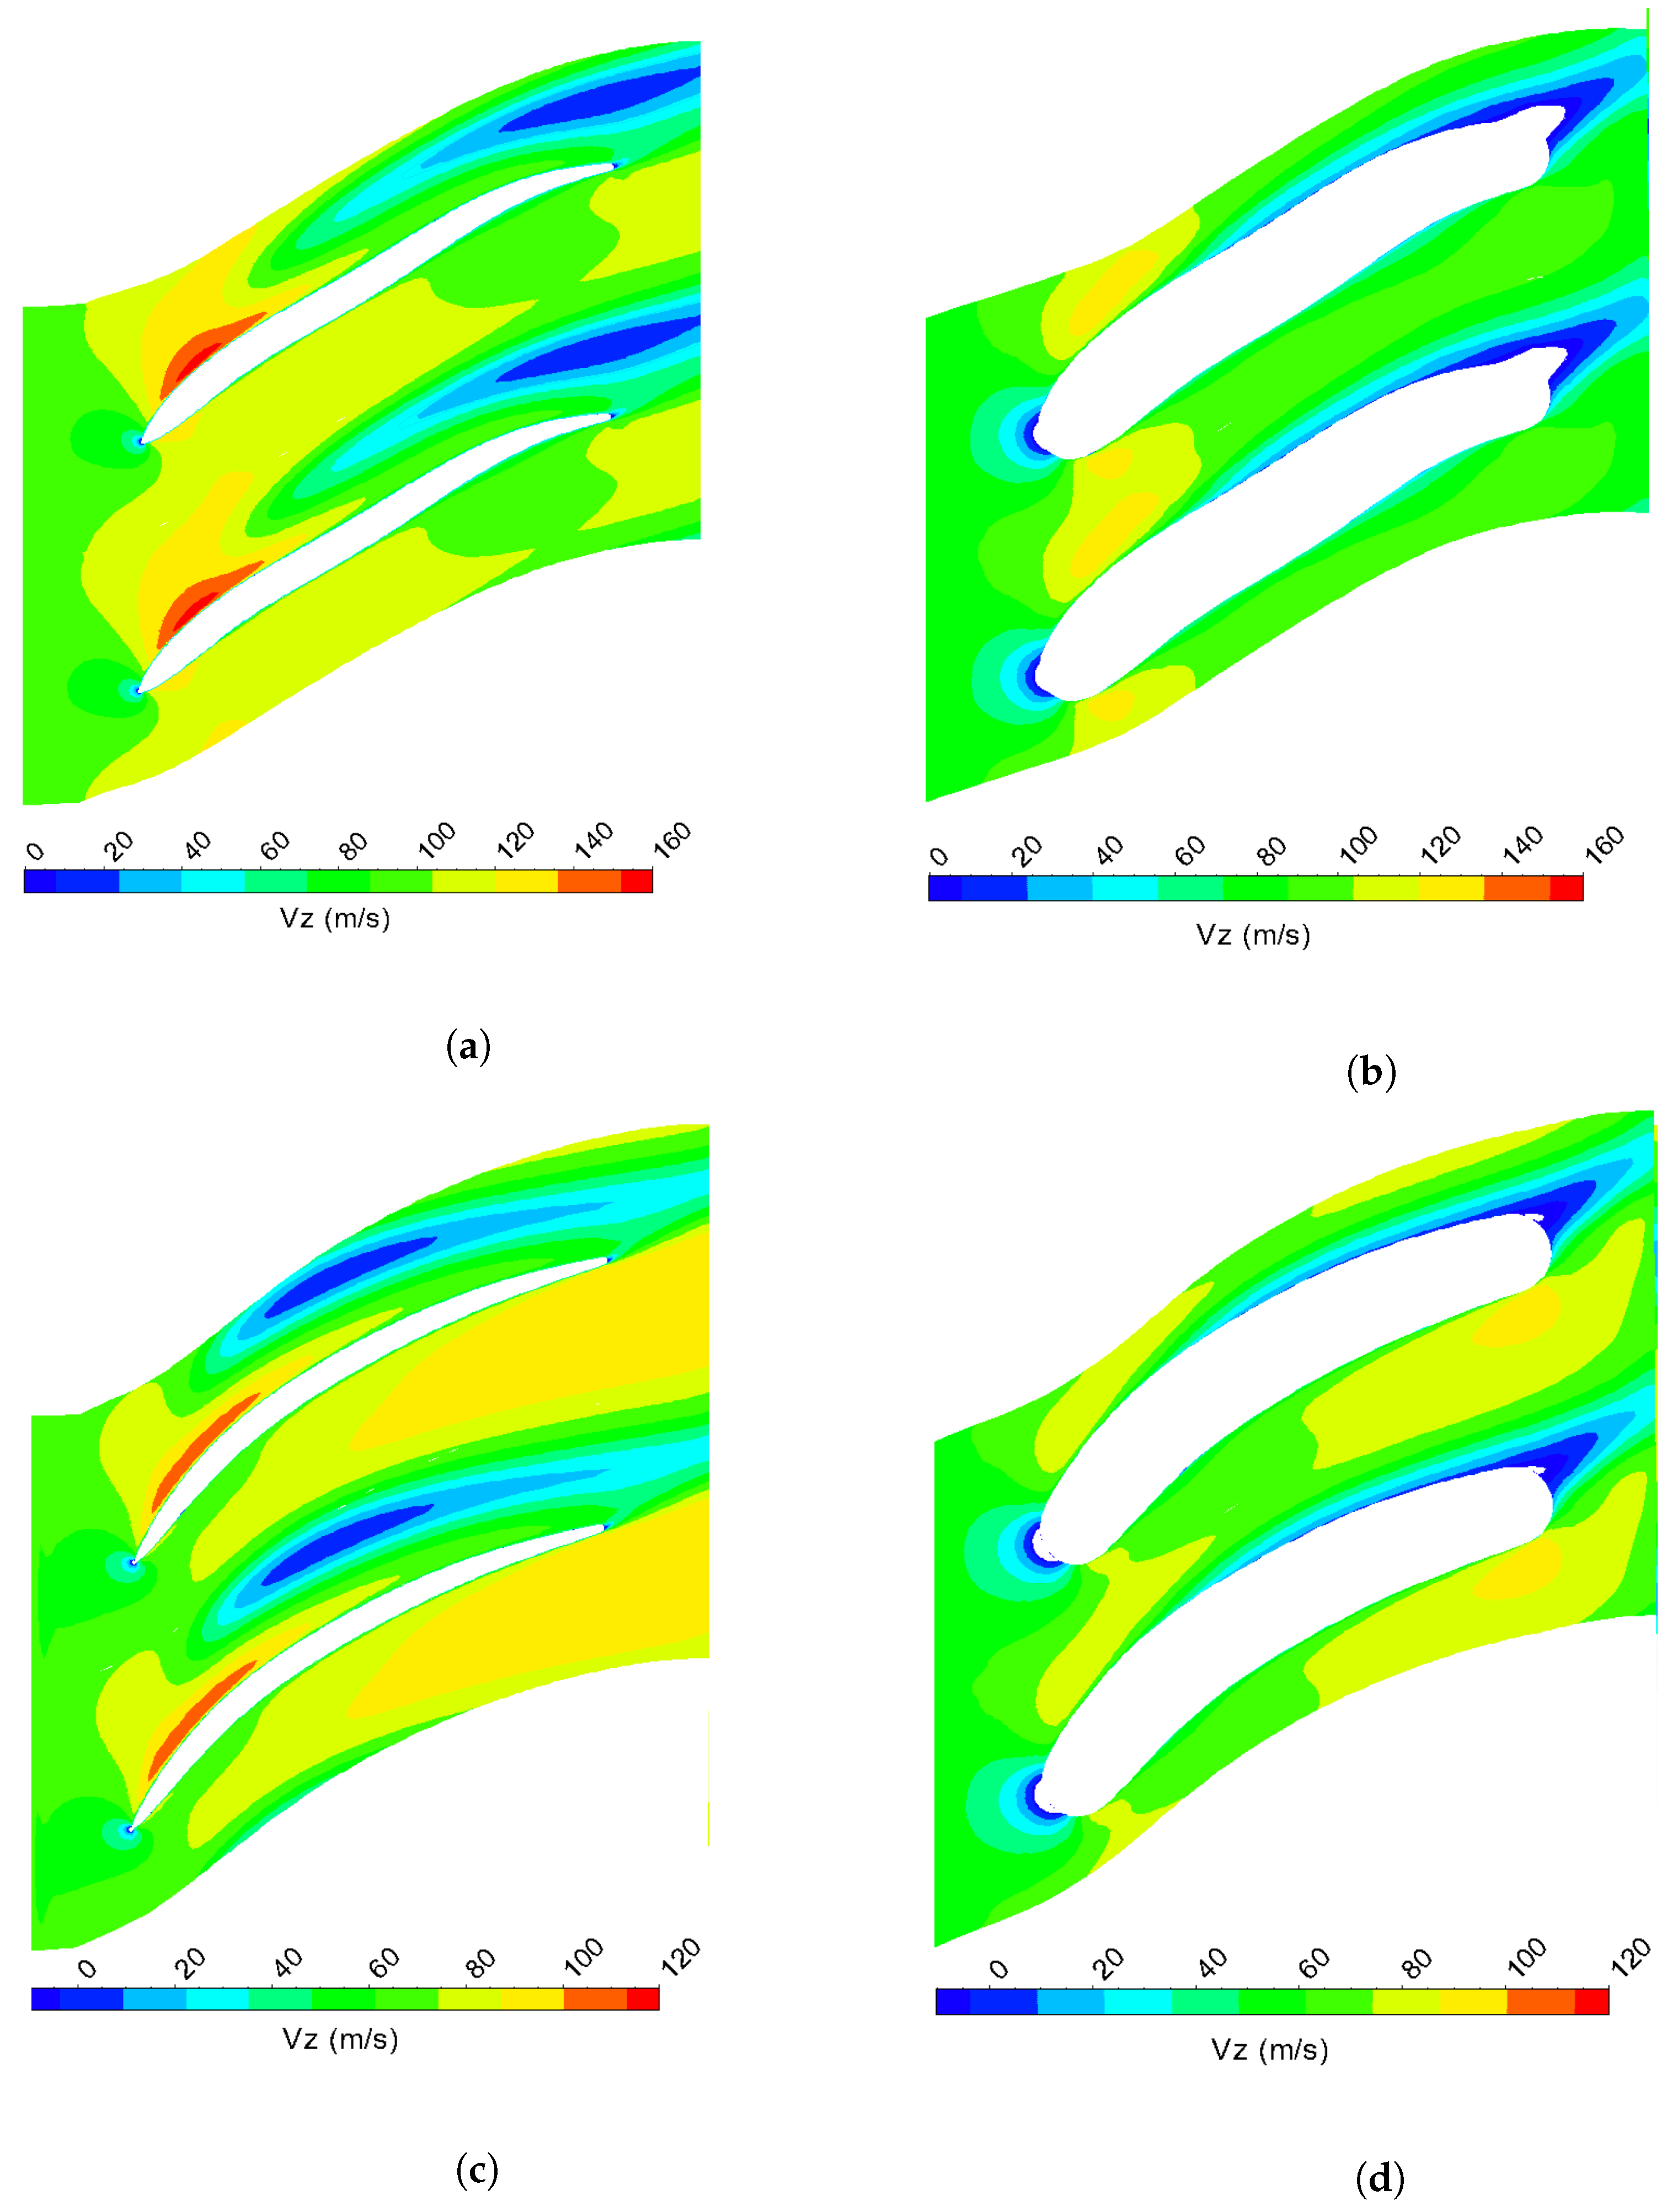
As the leakage flow entered the downstream cavity connection and was re-injected to the upstream connection at the hub interface, the leakage flow, comprised of low-momentum fluid, seemed to deteriorate the compressor’s performance in the vicinity of the hub section. As the amount of leakage flow was very small compared to the primary flow, upon radial entry to the primary flow, the low momentum flow tended to accumulate around the hub section, resulting in blockage of the hub region and, consequently, deteriorating the boundary layer. The flow tended to get overturned tangentially from the blade pressure side to the suction side due to the cross-channel pressure gradient. To understand this, stream tubes colored with axial velocity were plotted for the stators, as shown in Figure 7 and Figure 8. We can see streamlines turning from the pressure side to the suction side mostly around the trailing edge region. This effect was seen slightly for the first stator and more pronounced for the second stator. This effect is expected to be more significant when running with a larger seal teeth gap and increased mass flow through the cavities. This phenomenon was also explained by Wellborn et al. [11].
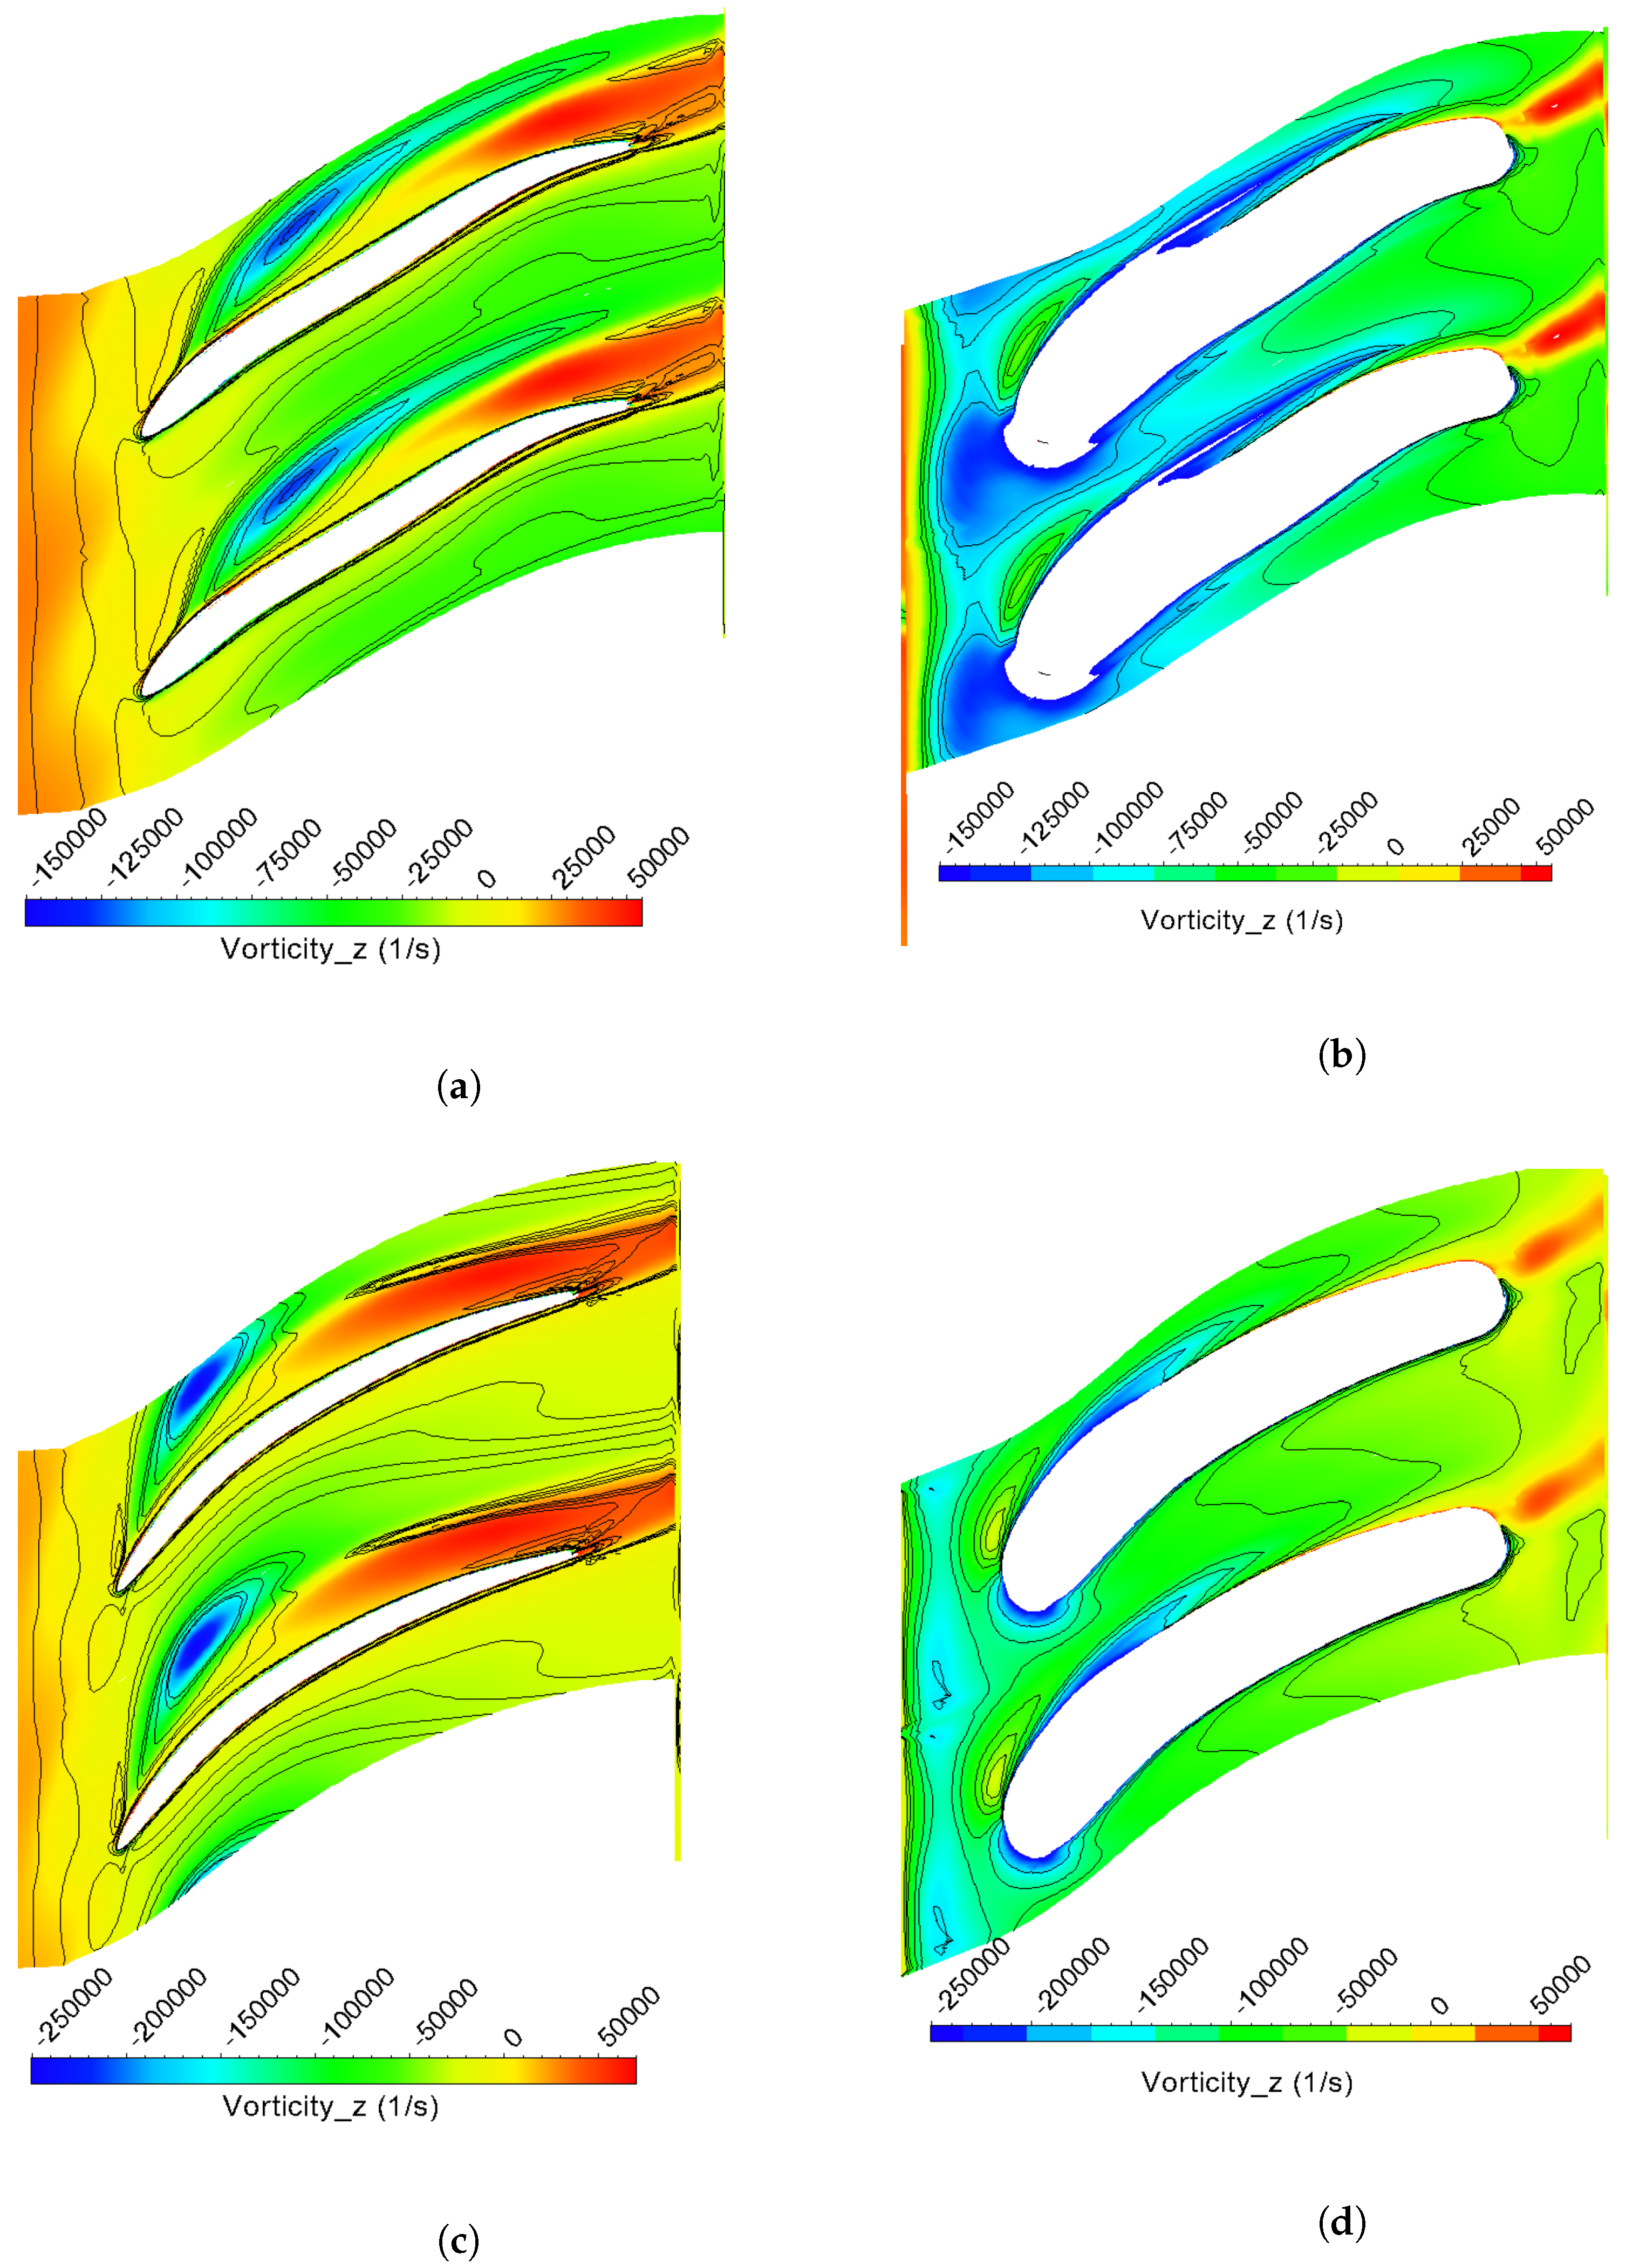
To gain insights into the flow circulation in the hub region, the axial component of vorticity is shown in a blade-to-blade plot at 1% span, as in Figure 9. The visualization reveals the formation of strong clockwise vortices in bands, particularly in the cavity connection upstream of the leading edge of the stators. This observation indicates how the flow is being injected into the main flow through the cavities. Moreover, axial vorticities are also evident at the trailing edge of the stators, and present, to some extent, in both configurations. These findings suggest that the flow behavior in the hub region is complex, resulting from the occurrence of a combination of injection and entrainment phenomena.
The vorticity is defined as the curl of the the velocity and is a measure of the rotation of the fluid element in a flow.
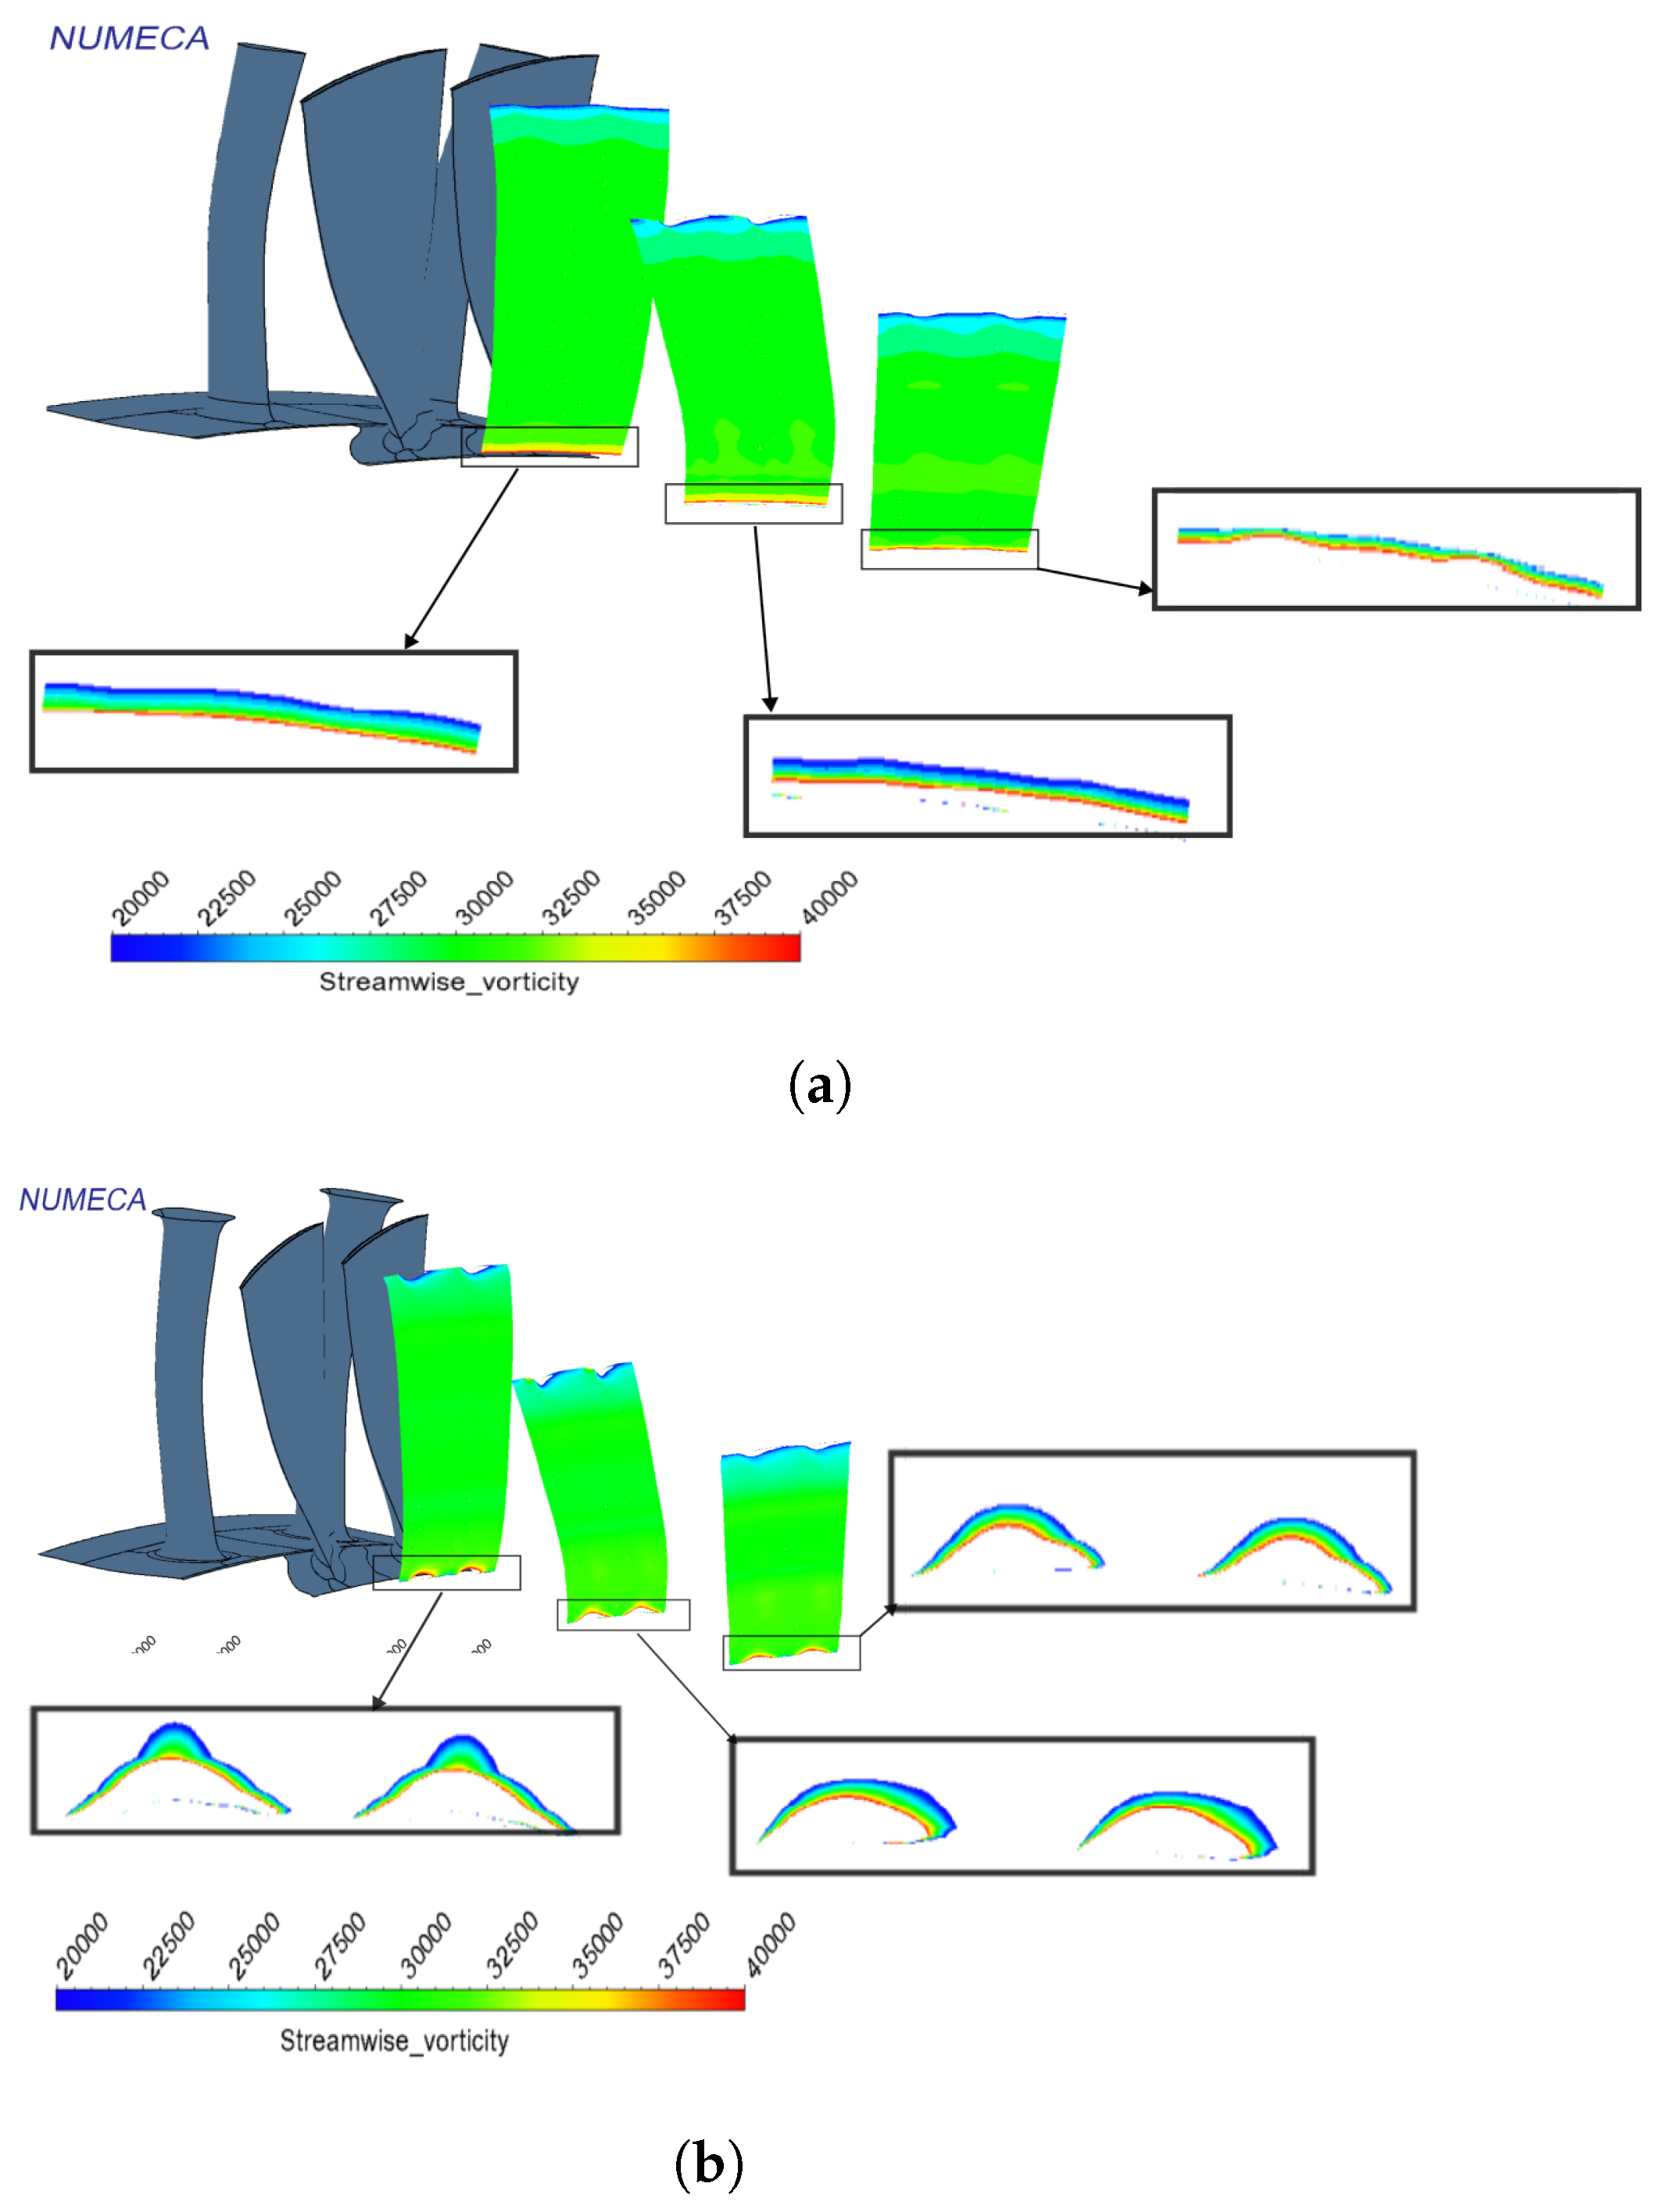
Streamwise vorticity is the component of vorticity in the direction of velocity and can be written as:
where, ‘’ is the vorticity, ‘’ is the absolute velocity and ‘’ is streamwise vorticity. It indicates the vortical flow that is perpendicular to the velocity vector, quantifying the degree to which the flow is rotating or swirling about the center of the vortex. Figure 10 presents the plots for streamwise vorticity. The cross-stream contour plots were generated at a location just upstream of each stator leading edge, where cavity upstream connections exist. A careful examination of the figures reveals that, unlike the cantilevered configuration, bands of vortices were observed, indicating the manner in which the flow was being radially injected into the primary flow. This phenomenon is also evident in the radial velocity plots presented subsequently.
Further plotting the span-wise entropy at rotor outlets provided more insight into the losses created in the hub region near rotor outlets, mostly due to the cavity flow being re-injected just downstream of the rotor outlets. We can see some slight entropy change on Rotor1 and Rotor2 around the hub region and a noticeable change up to about 20% span at Rotor3, when compared with the cantilevered case. This is shown in Figure 11 below.
7. Leakage Flow Characteristics
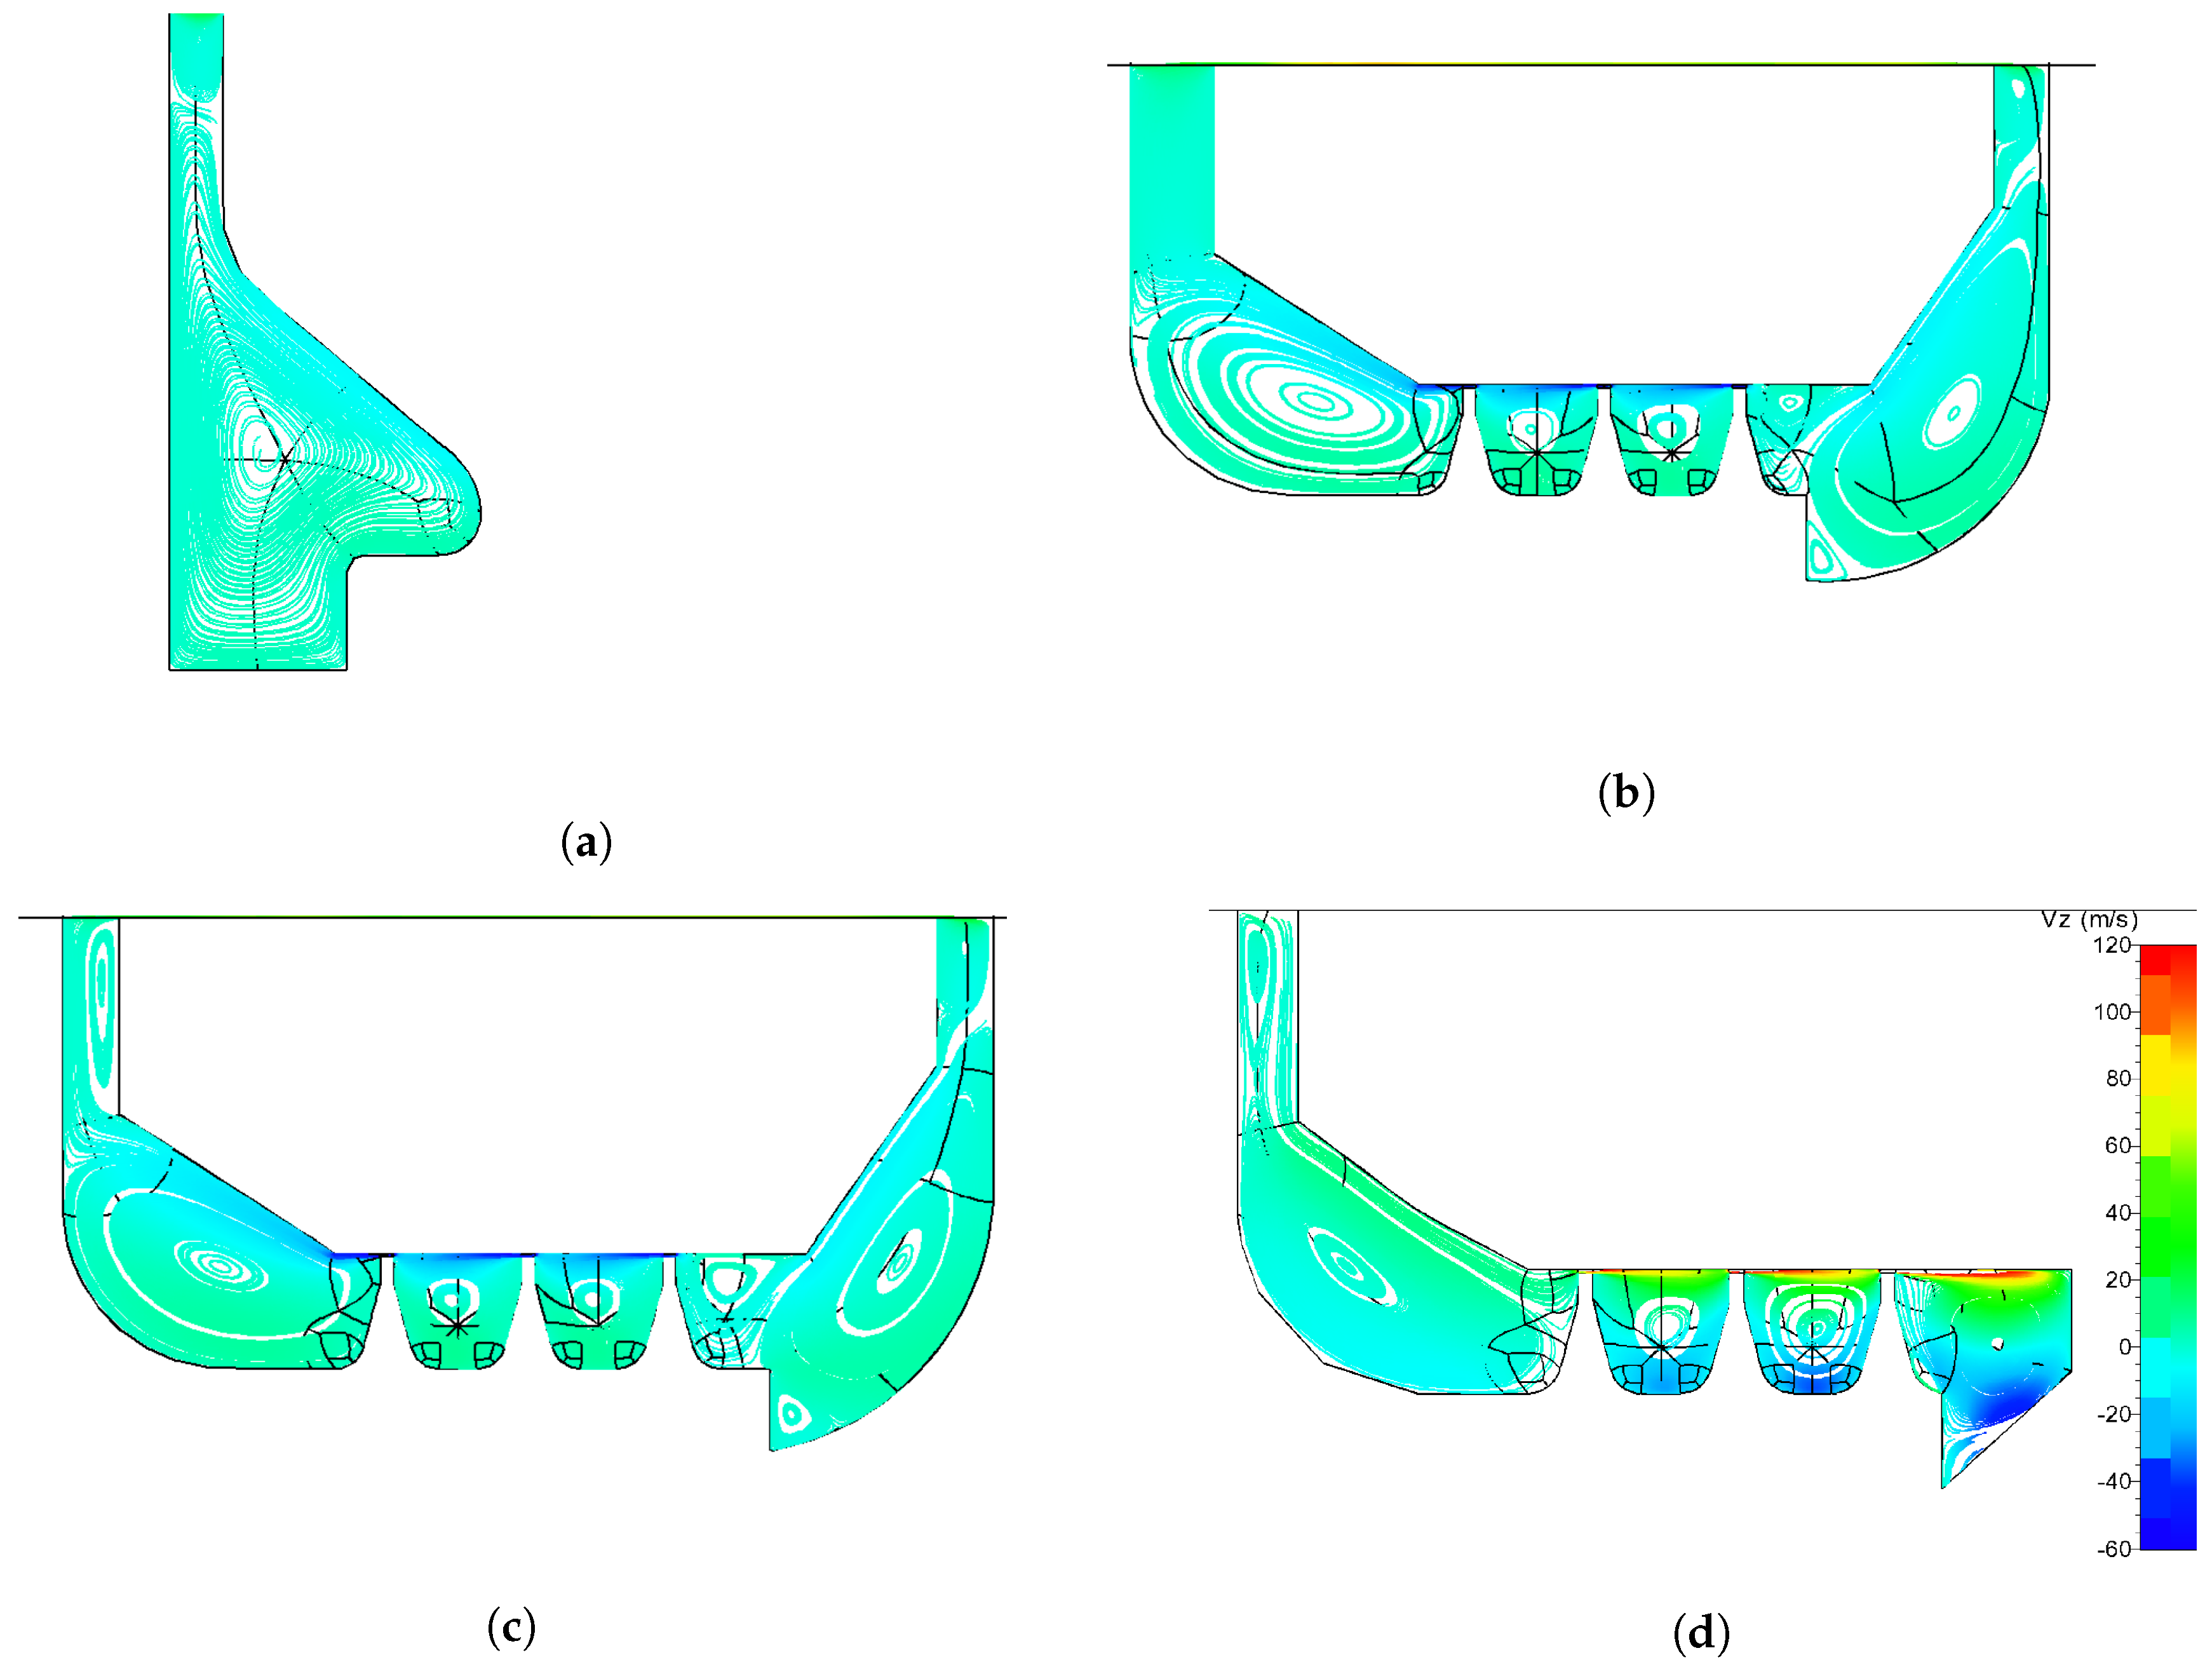
The leakage flow enters the cavity from the downstream location due to the pressure differential and then mixes with the primary flow at the upstream cavity connection. The cavity has a specific structure and flow path that creates vortical flow structures at both the upstream and downstream cavity connections and between the seal teeth. Figure 12 shows the meridional plots of tangentially mass-averaged axial velocity-colored streamlines that show these vortices, which influence the flow conditions of the leakage flow within the cavity. In Figure 12b,c of the same plot, two large vortices are observed just before entering and immediately after exiting the labyrinth seal teeth. Additionally, vortices are present between the seal teeth at each bucket, and small vortices can be seen at the upstream and downstream cavity connections. These vortices play a crucial role in determining the angles of the flow entering and exiting the cavity. This is demonstrated in the radial and axial velocity plots at the hub, shown in the following figures.
The axial velocity contour is graphically represented at 1% span in Figure 13. The axial velocity contour contour plots for Stator1 are presented in Figure 13a,b for the cantilevered and shrouded configurations, respectively. Similarly, Figure 13c,d illustrates the axial velocity contours for Stator2. Focusing on the region of cavity connections, it was observed that there existed a slight deficit of axial velocity in the shrouded configuration at both upstream and downstream cavity connections. This could be attributed to the flow being radially entrained at upstream cavity connections and the fluid being taken out of downstream cavity sections, which, consequently, affected the axial velocity associated with the primary flow.
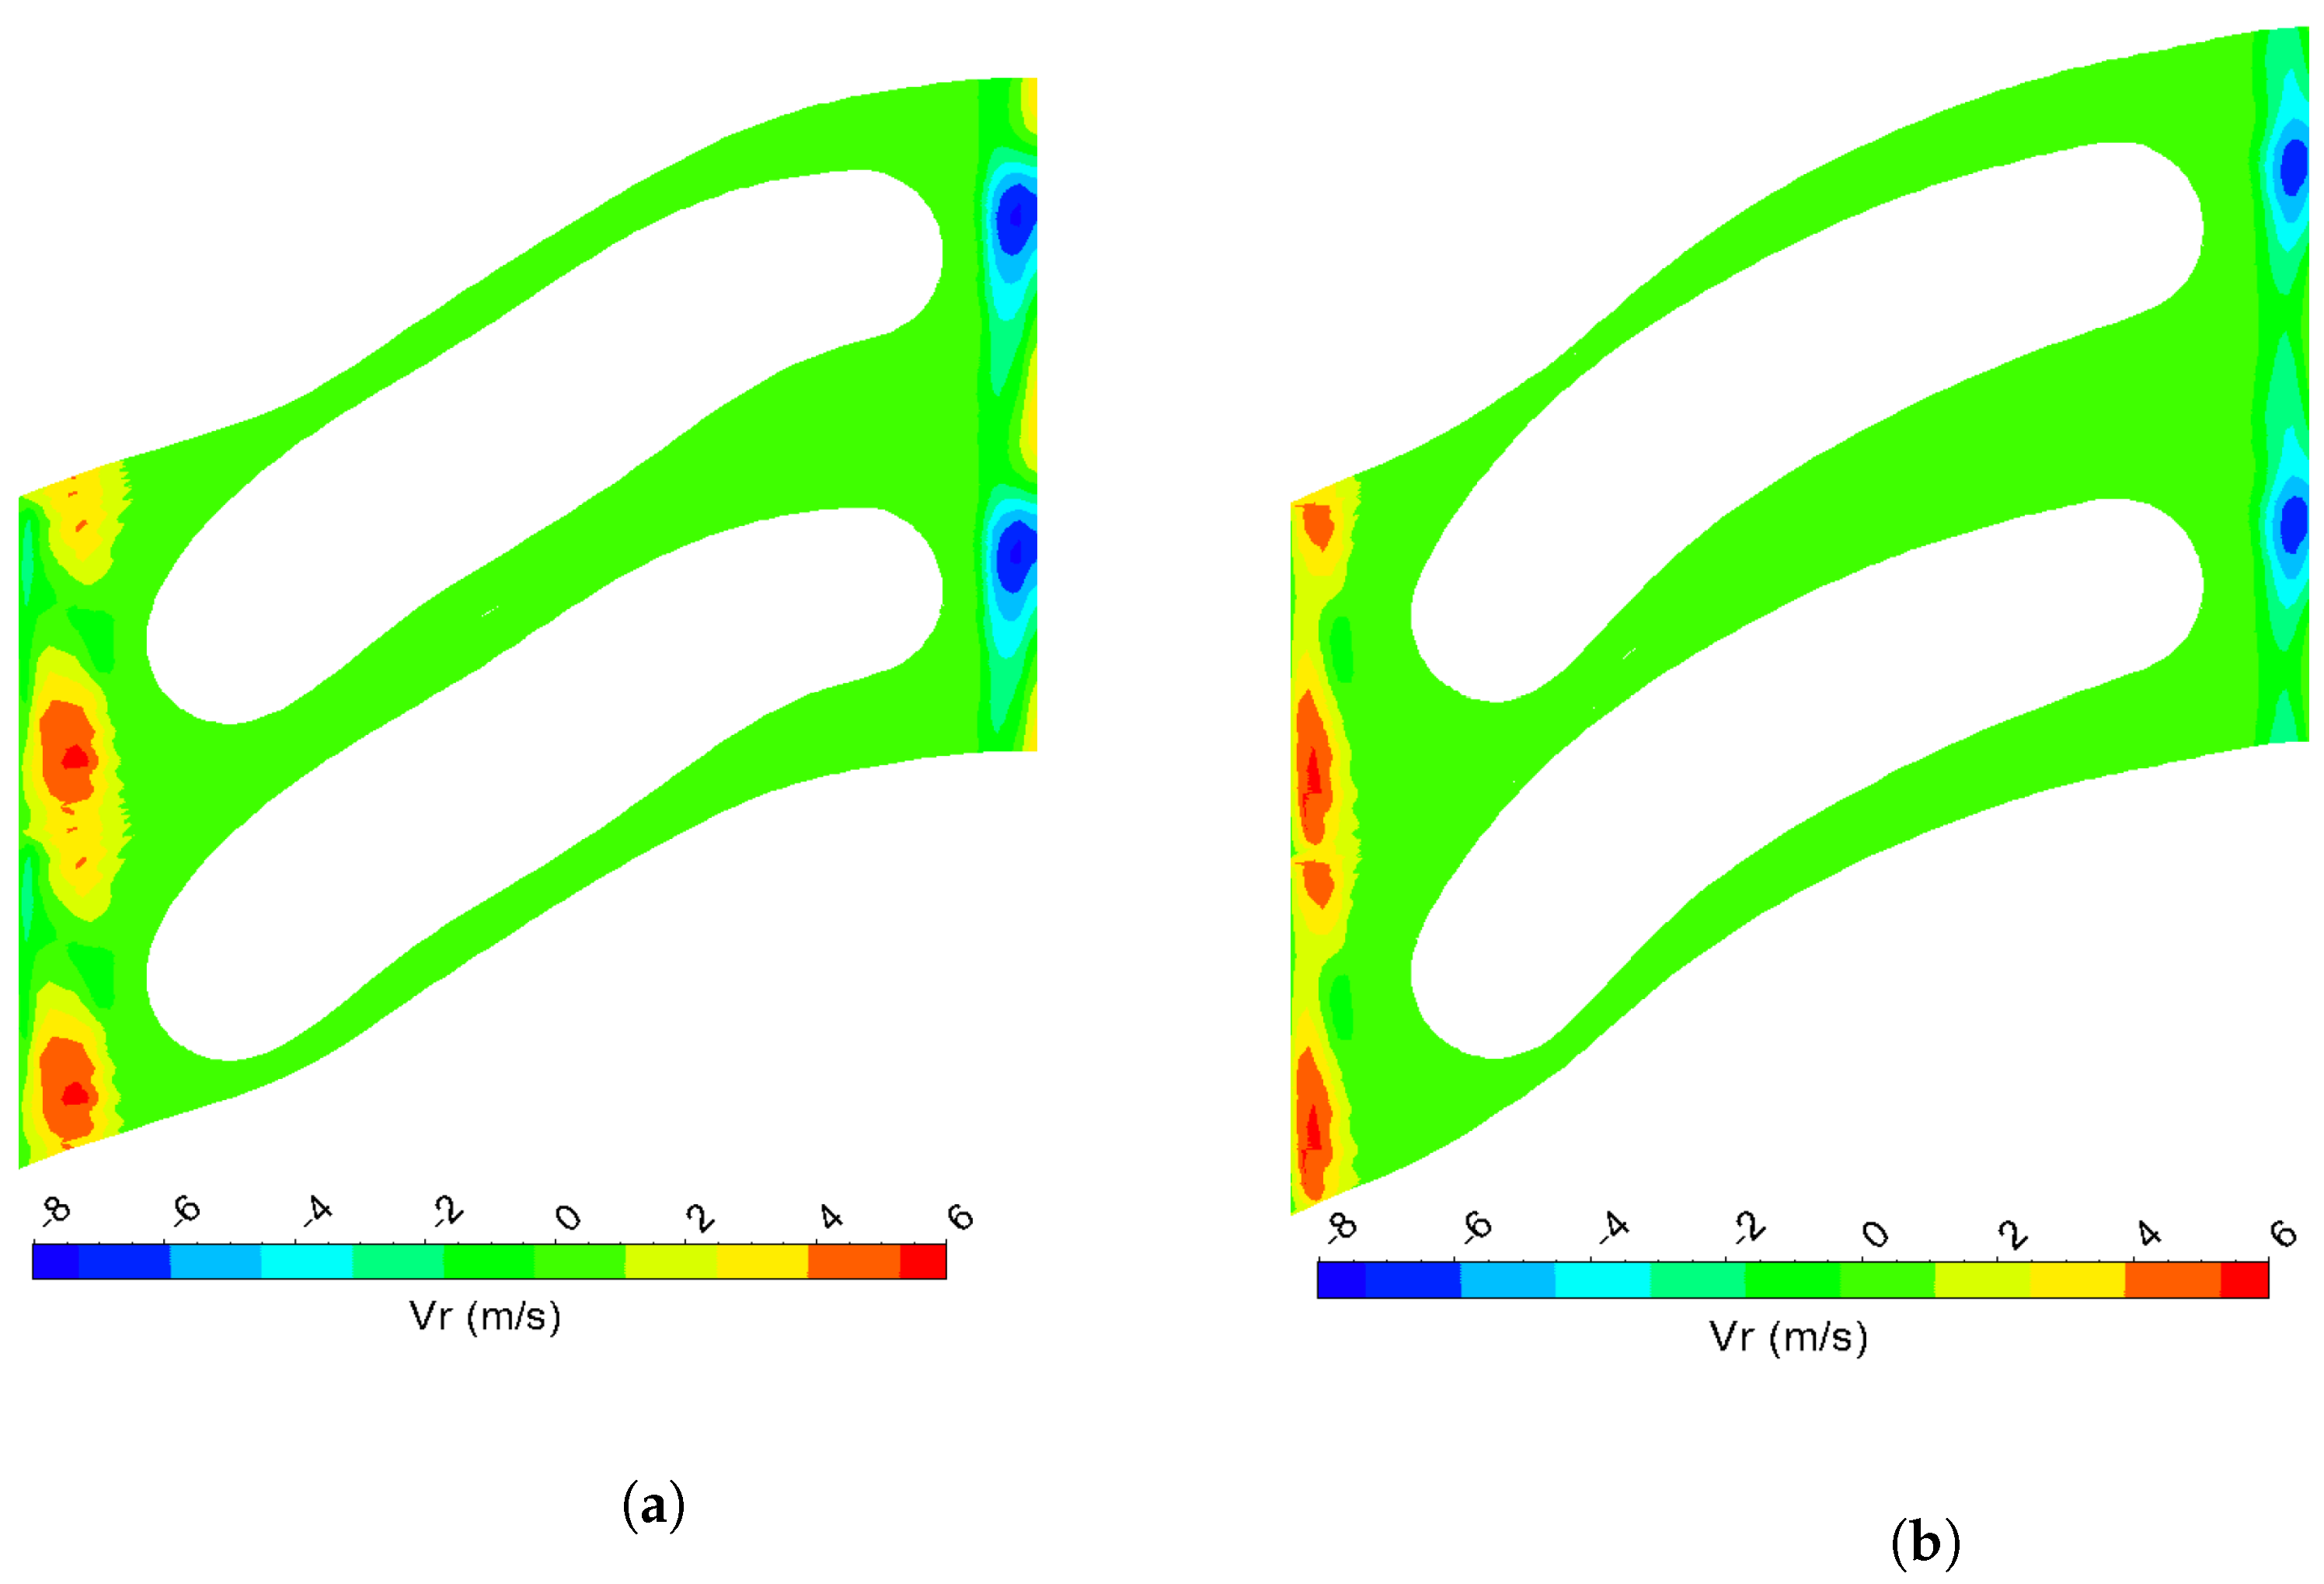
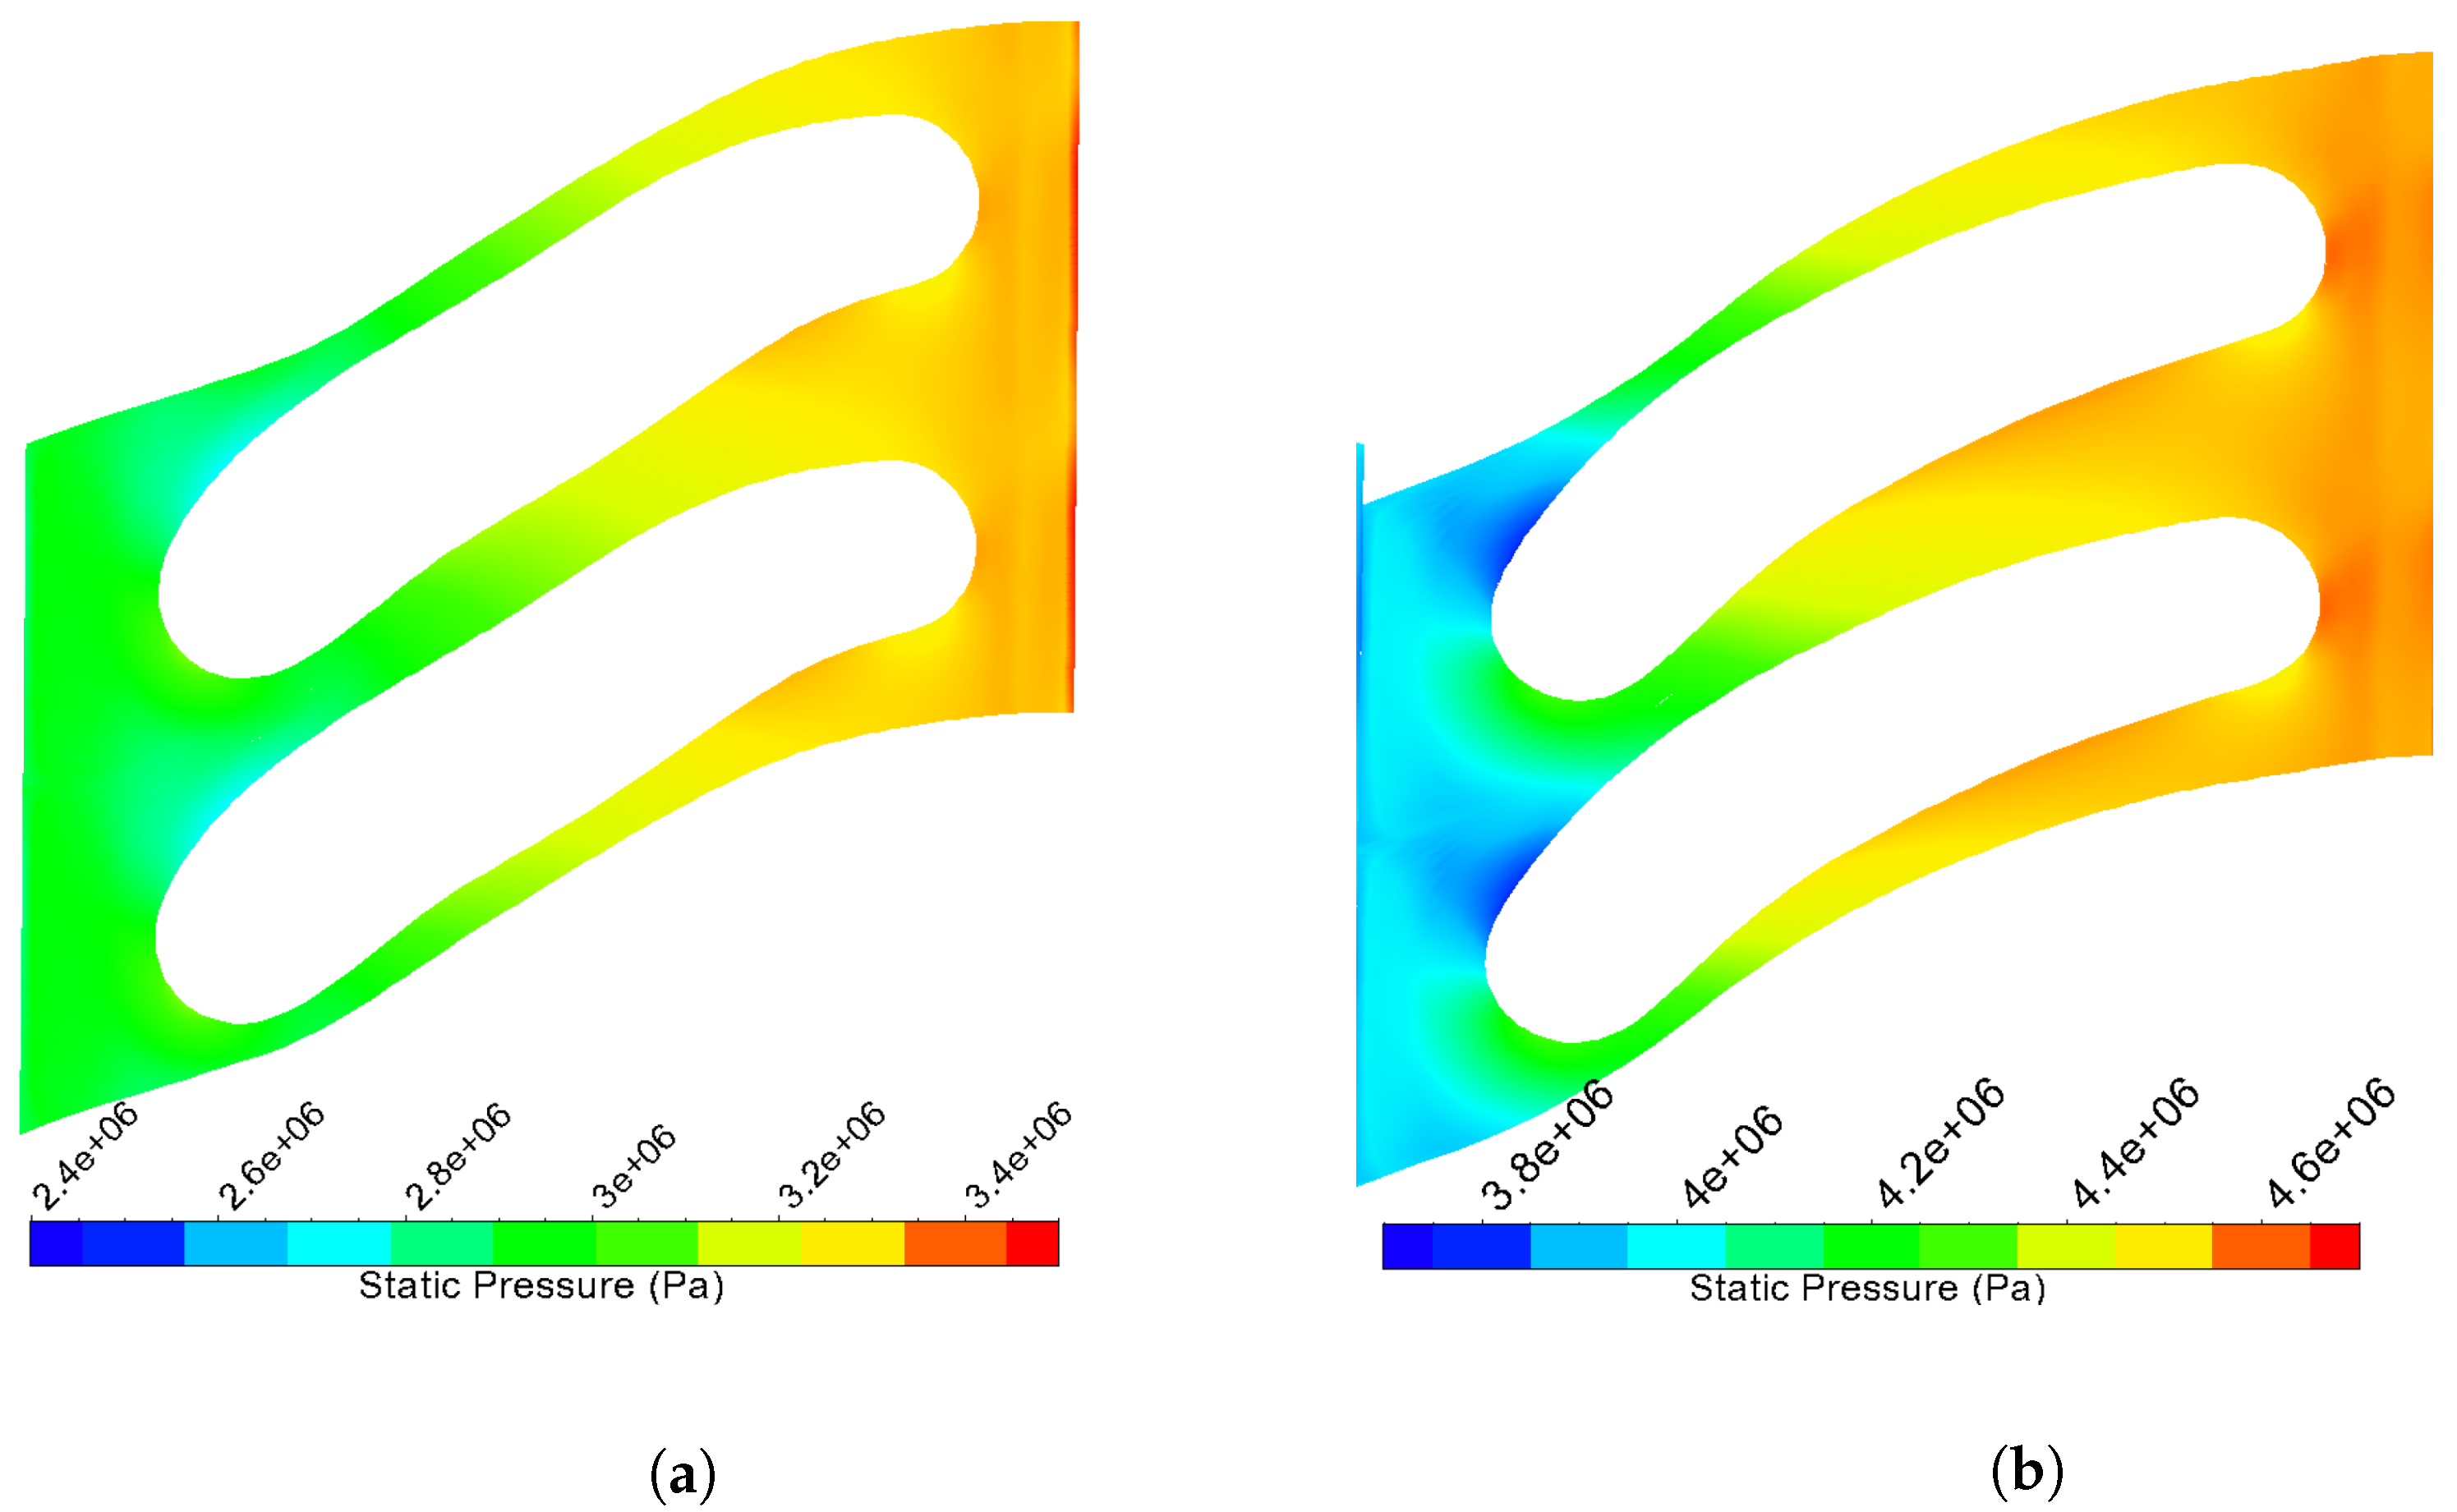
Figure 14 presents the radial velocity contour plotted at the hub, depicting the radial velocity distribution for the shrouded configuration. Observations revealed a discernible increase in radial velocity at upstream cavity connections, accompanied by a corresponding decrease at downstream cavity connections. Such a pattern can be attributed to the flow being radially taken out and re-injected through the downstream and upstream cavity connections, respectively. The figure on the left (a) depicts the radial velocity contour for Stator1, while the one on the right (b) shows the radial velocity contour for Stator2. The discrete patches suggest the presence of vortices present in the incoming and outgoing cavity flows. It is also critical to understand the static pressure distribution in the hub region, both upstream and downstream of the stator, as this pressure distribution drives the leakage flow through the cavity. To visualize the static pressure distribution, Figure 15 displays the contour plots of static pressure plotted at the hub of the stators.
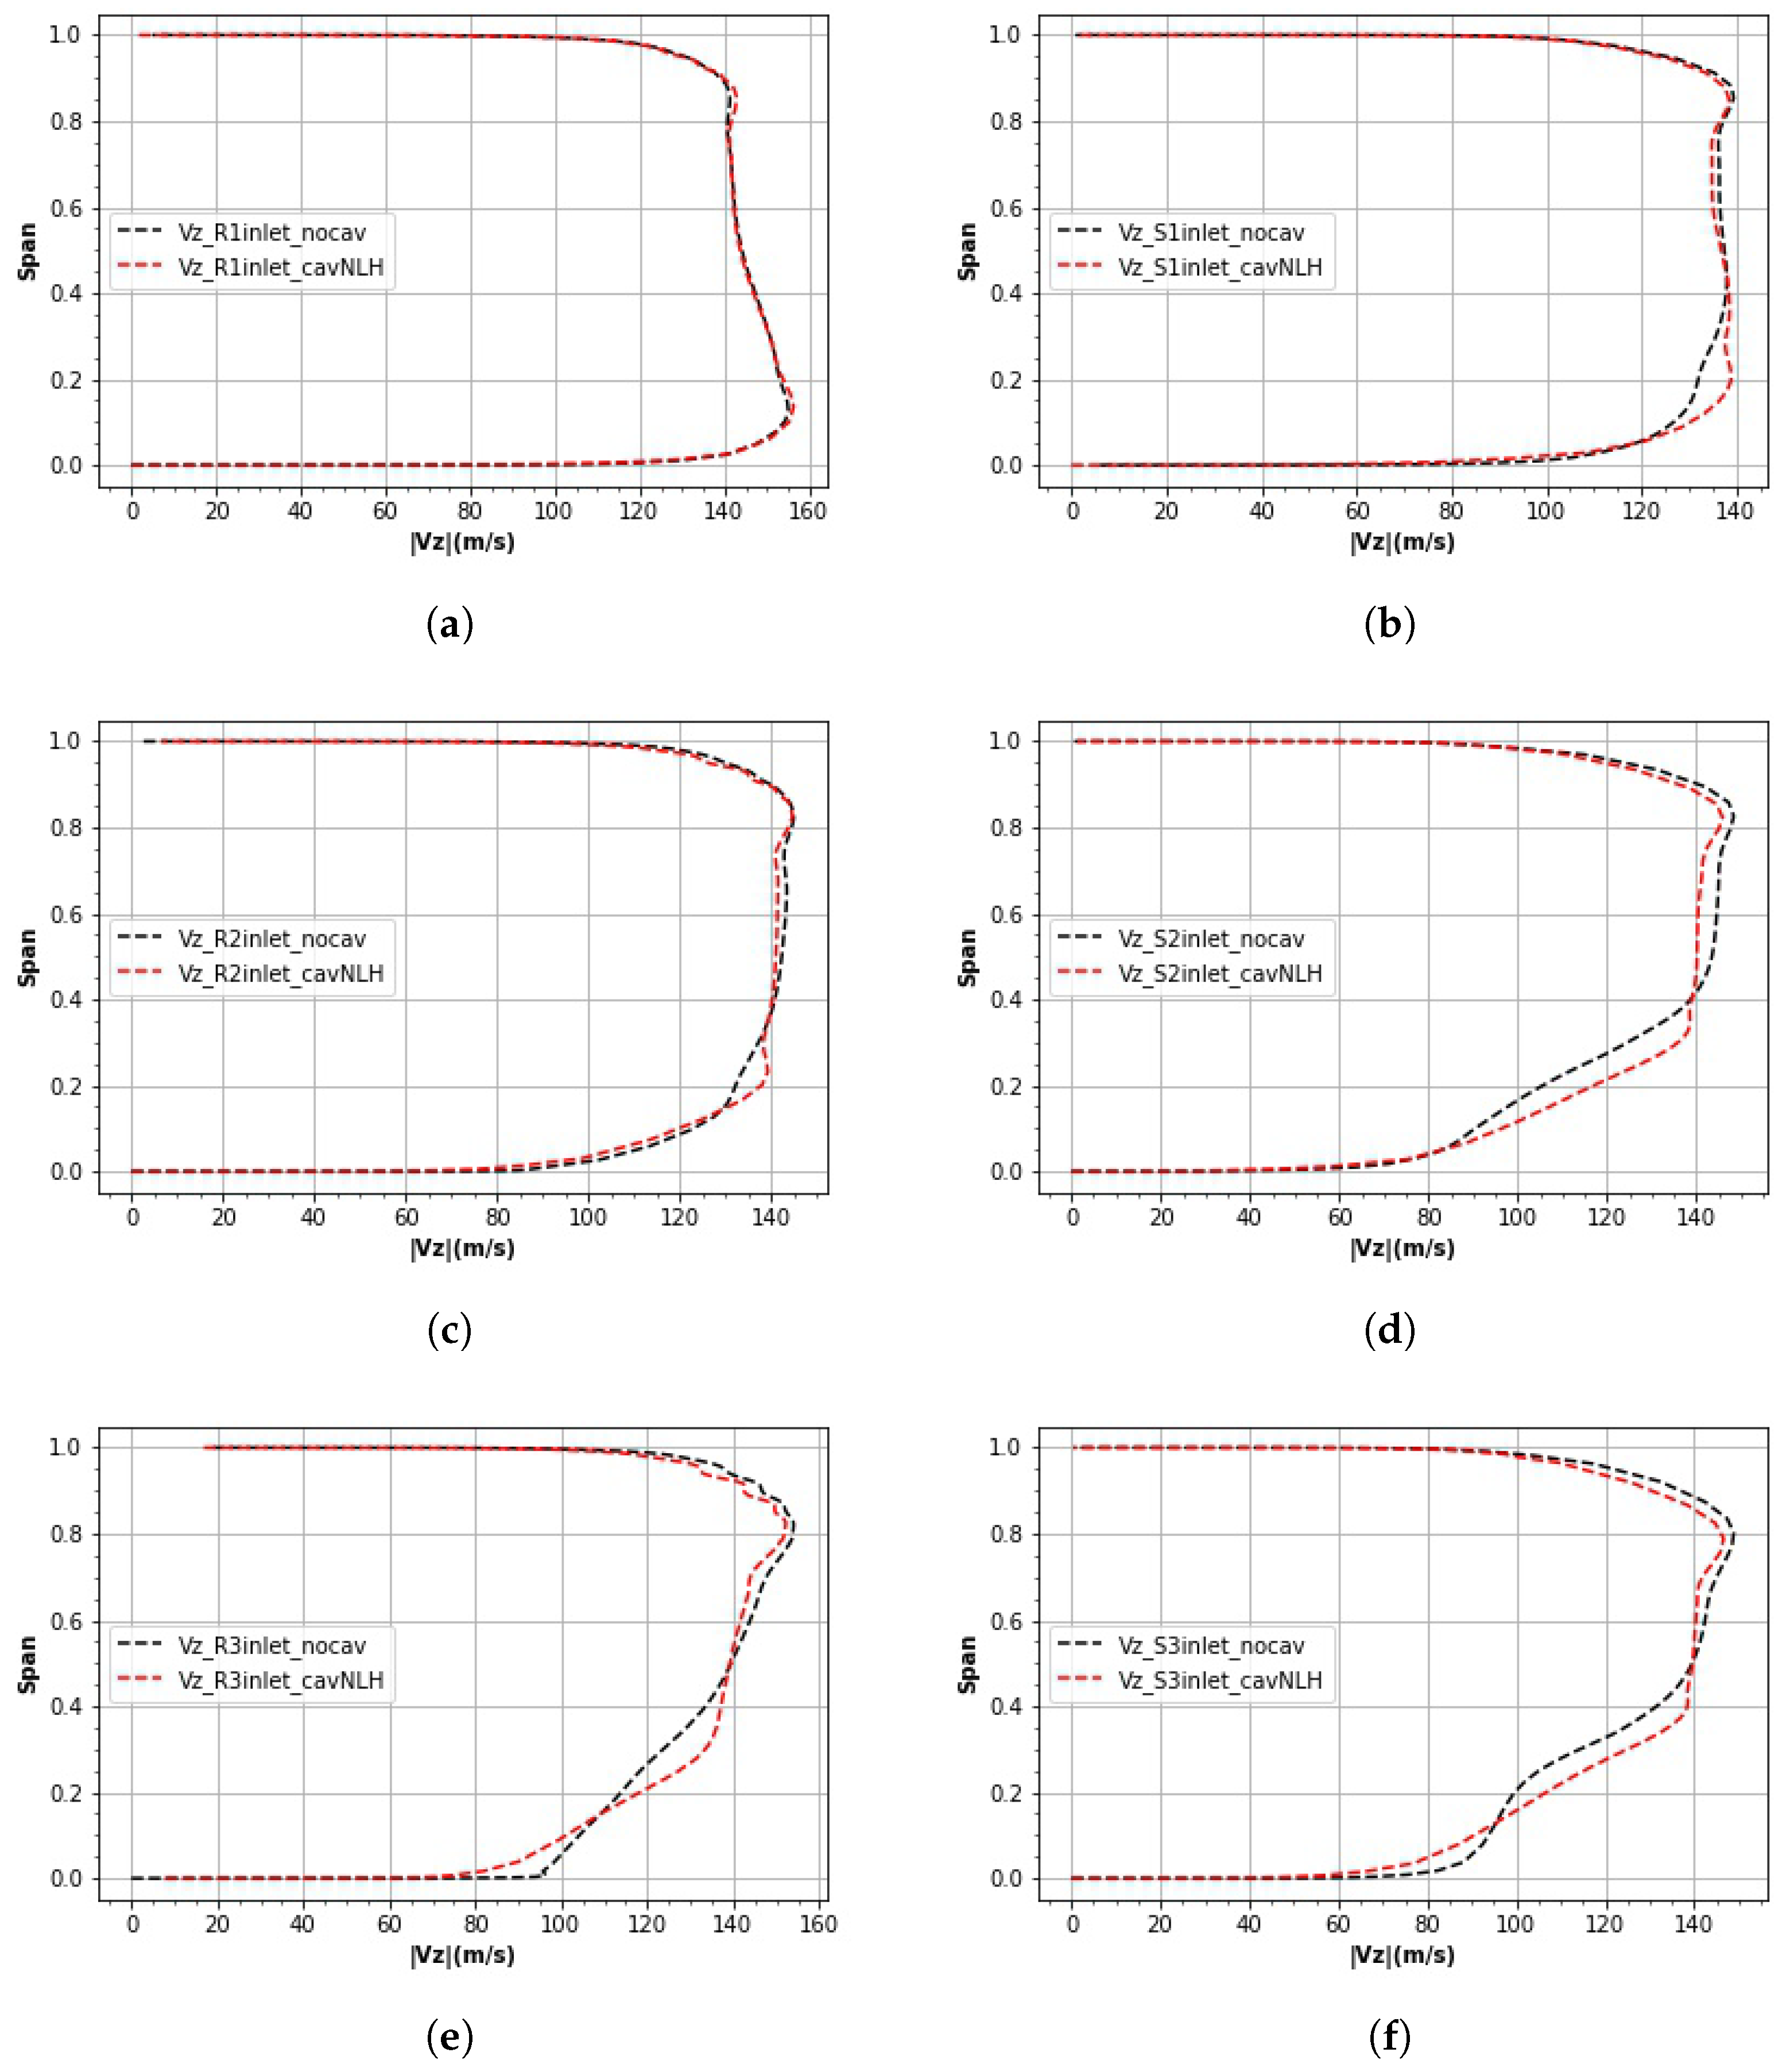
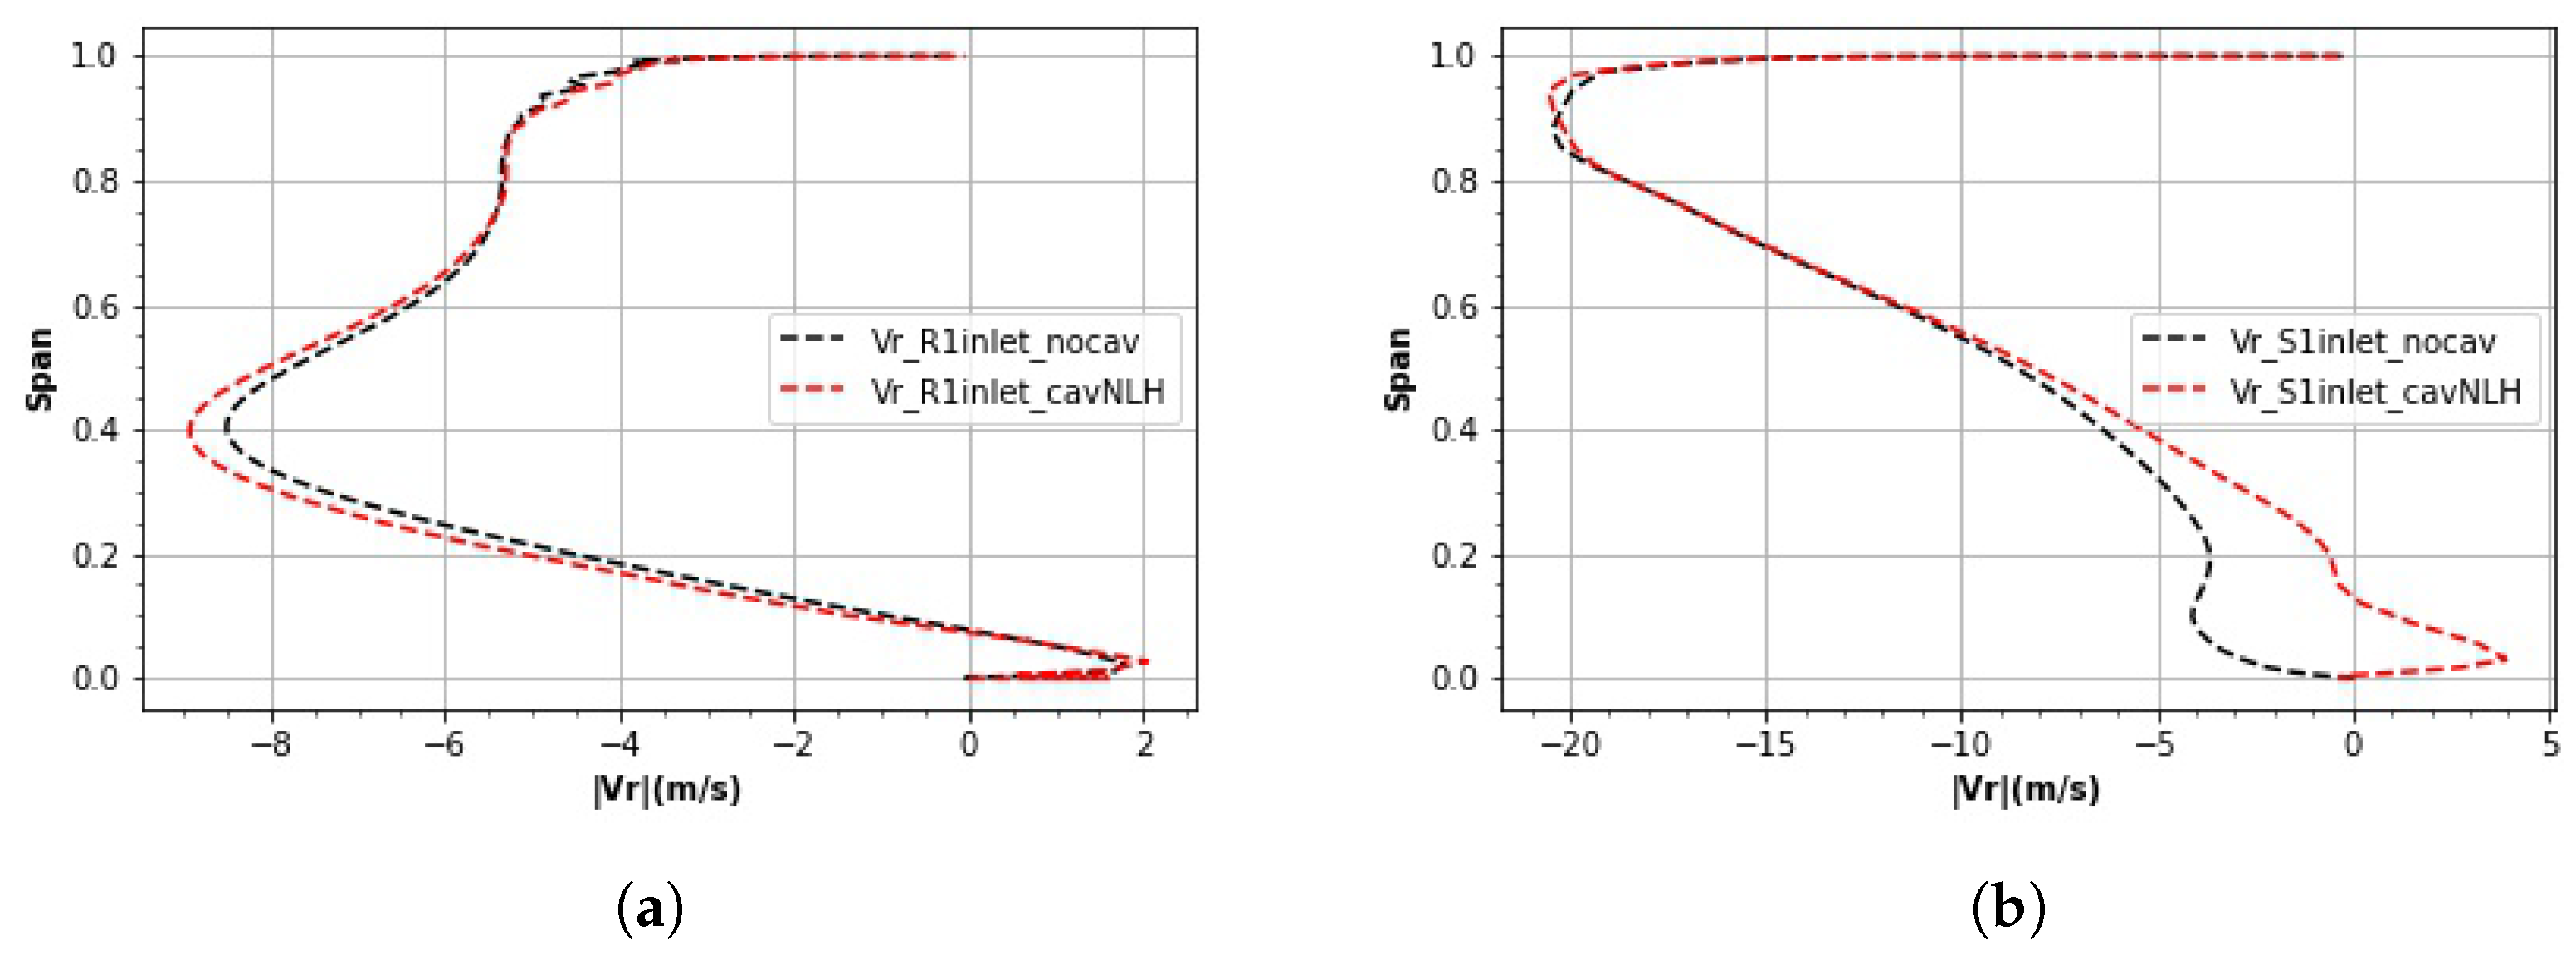
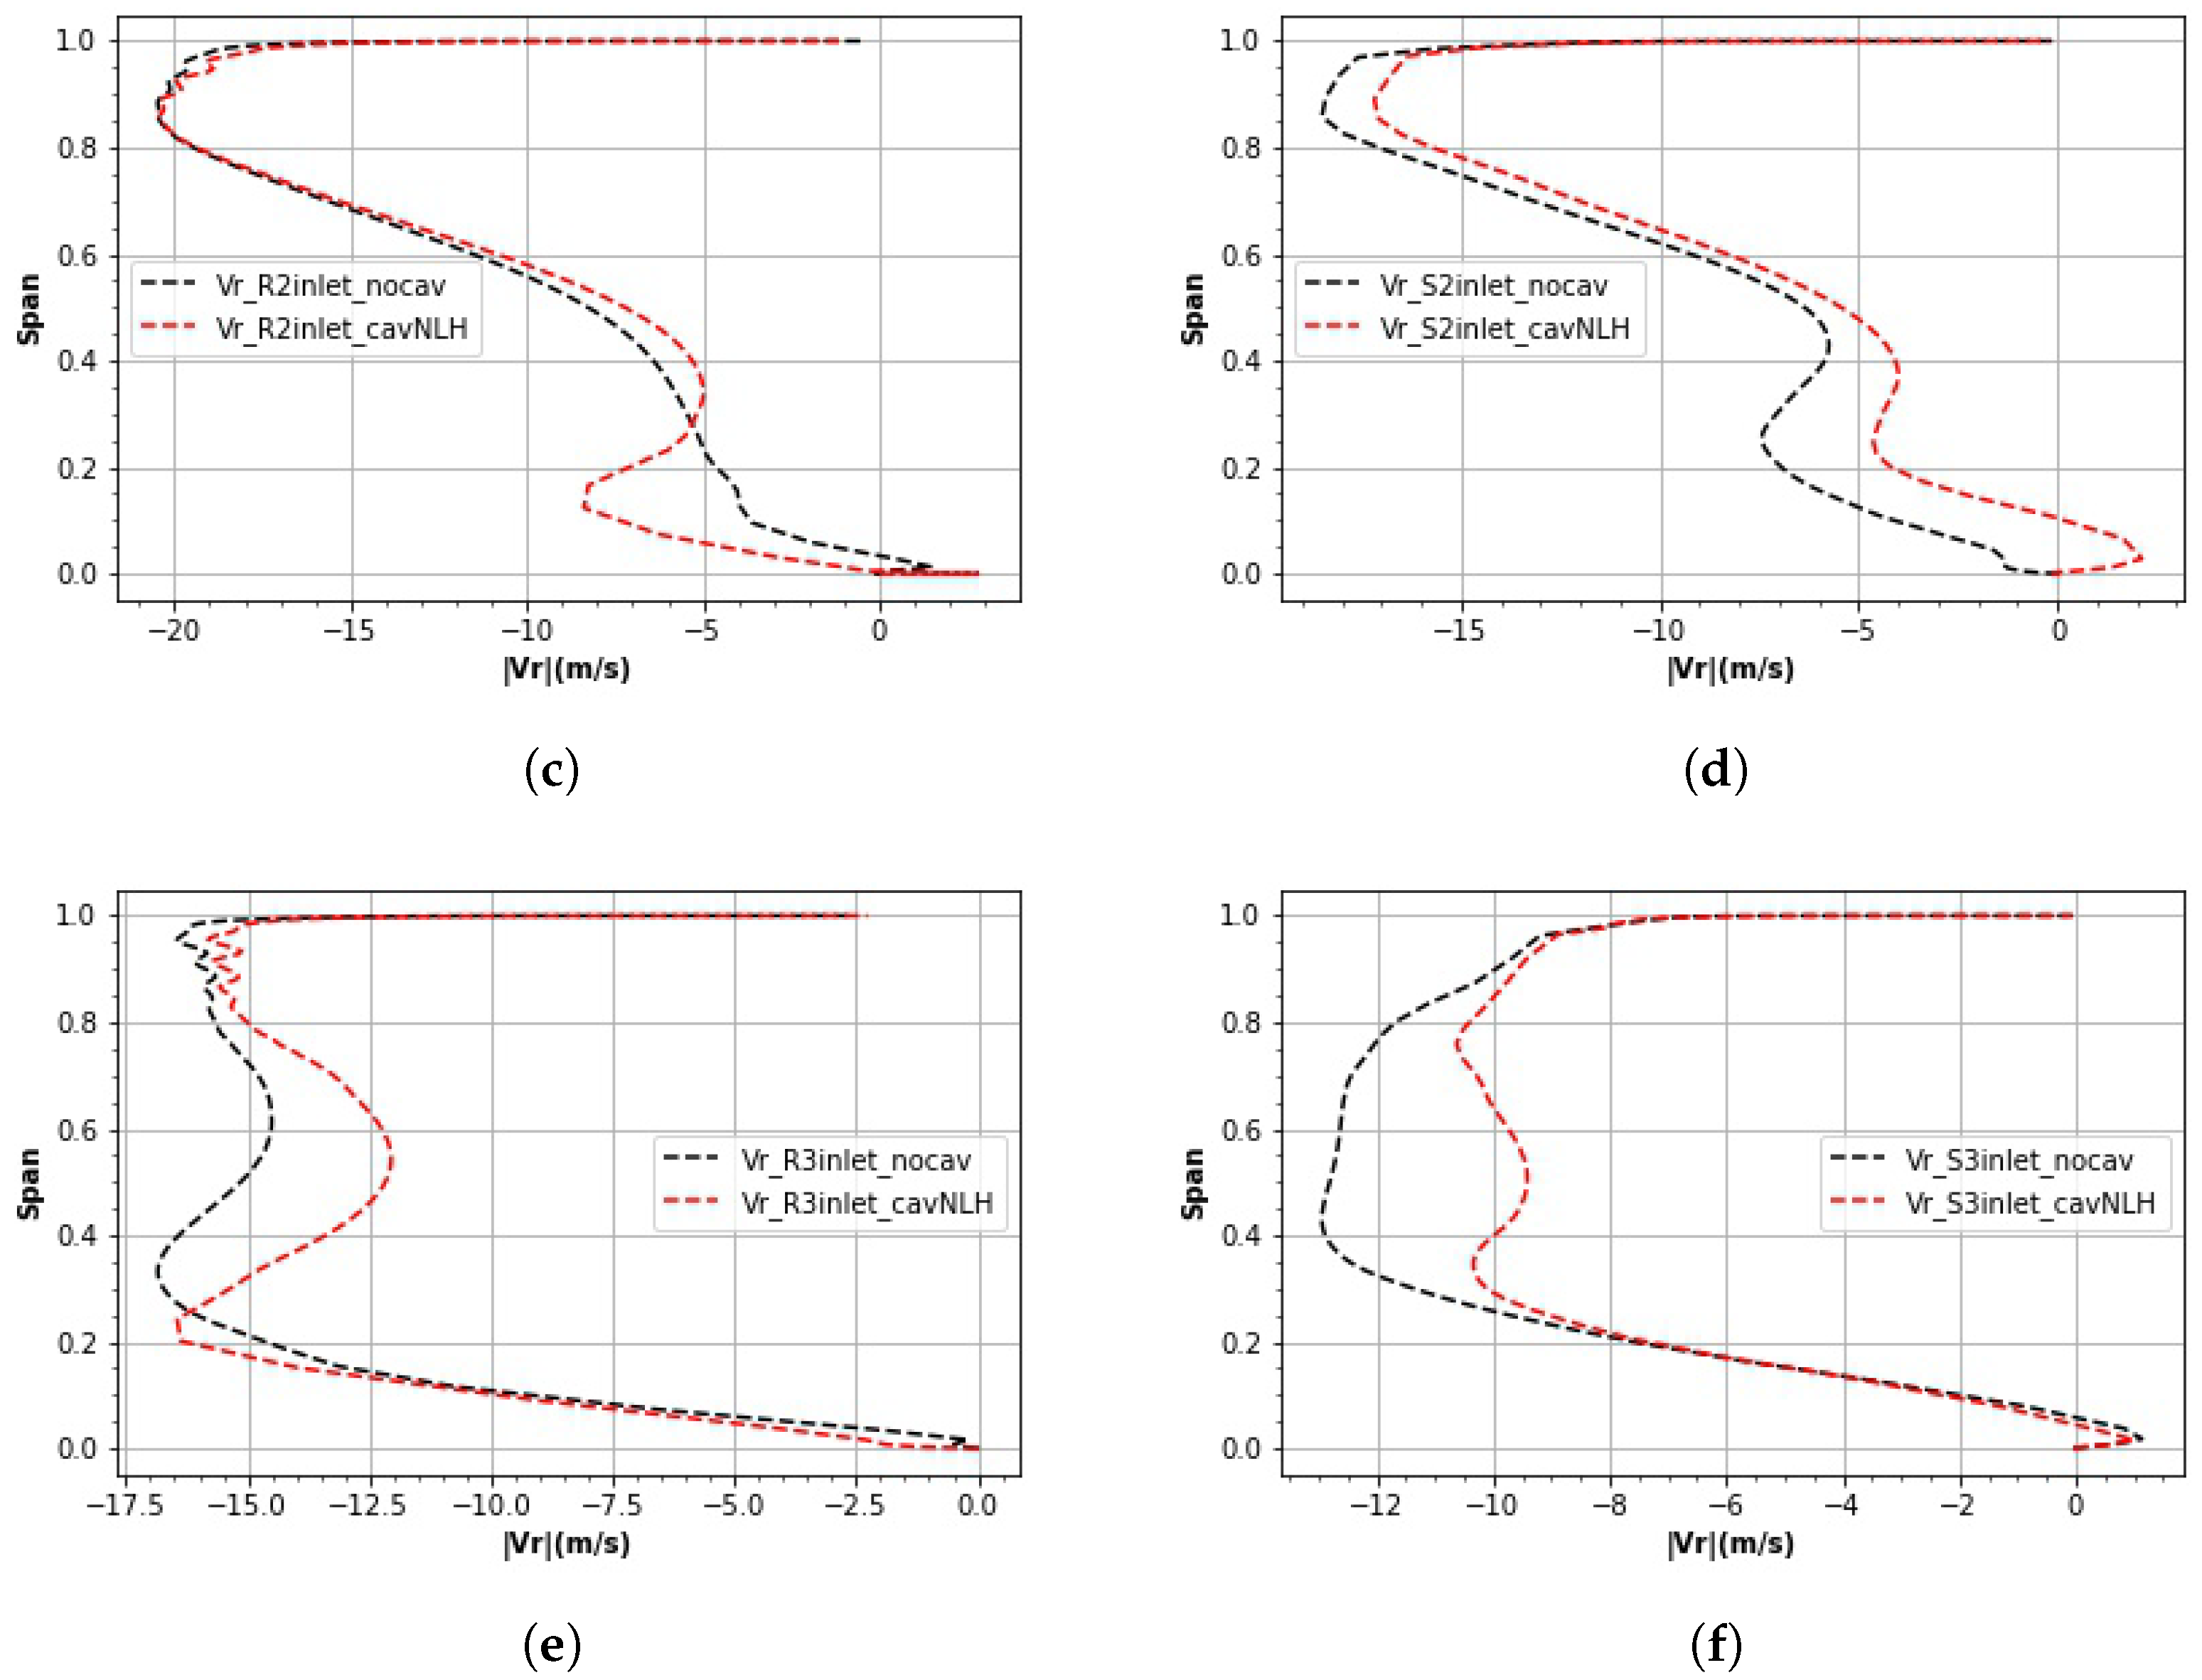
To gain a deeper understanding of the flow behavior, span-wise plots of axial and radial velocities were also generated at the rotor and stator inlets for both cantilevered and shrouded configurations, as illustrated in Figure 16 and Figure 17. The visualizations reveal the presence of an axial velocity deficit in the hub region, with a slight increase towards the upper portion of the span for both rotors and stators. While this effect was relatively small in the first and second stages, it became more pronounced in the third stage for both Stator3 and Rotor3. Additionally, there was an increase in radial velocities (negative direction) observed at the rotor inlets, where the flow entered inside the cavity. Conversely, a positive increase in radial velocity was observed where the flow was entrained into the primary flow. These observations suggest that the flow behavior in the hub region is complex and highly dependent on the geometric configuration and flow conditions.
8. Windage Heating
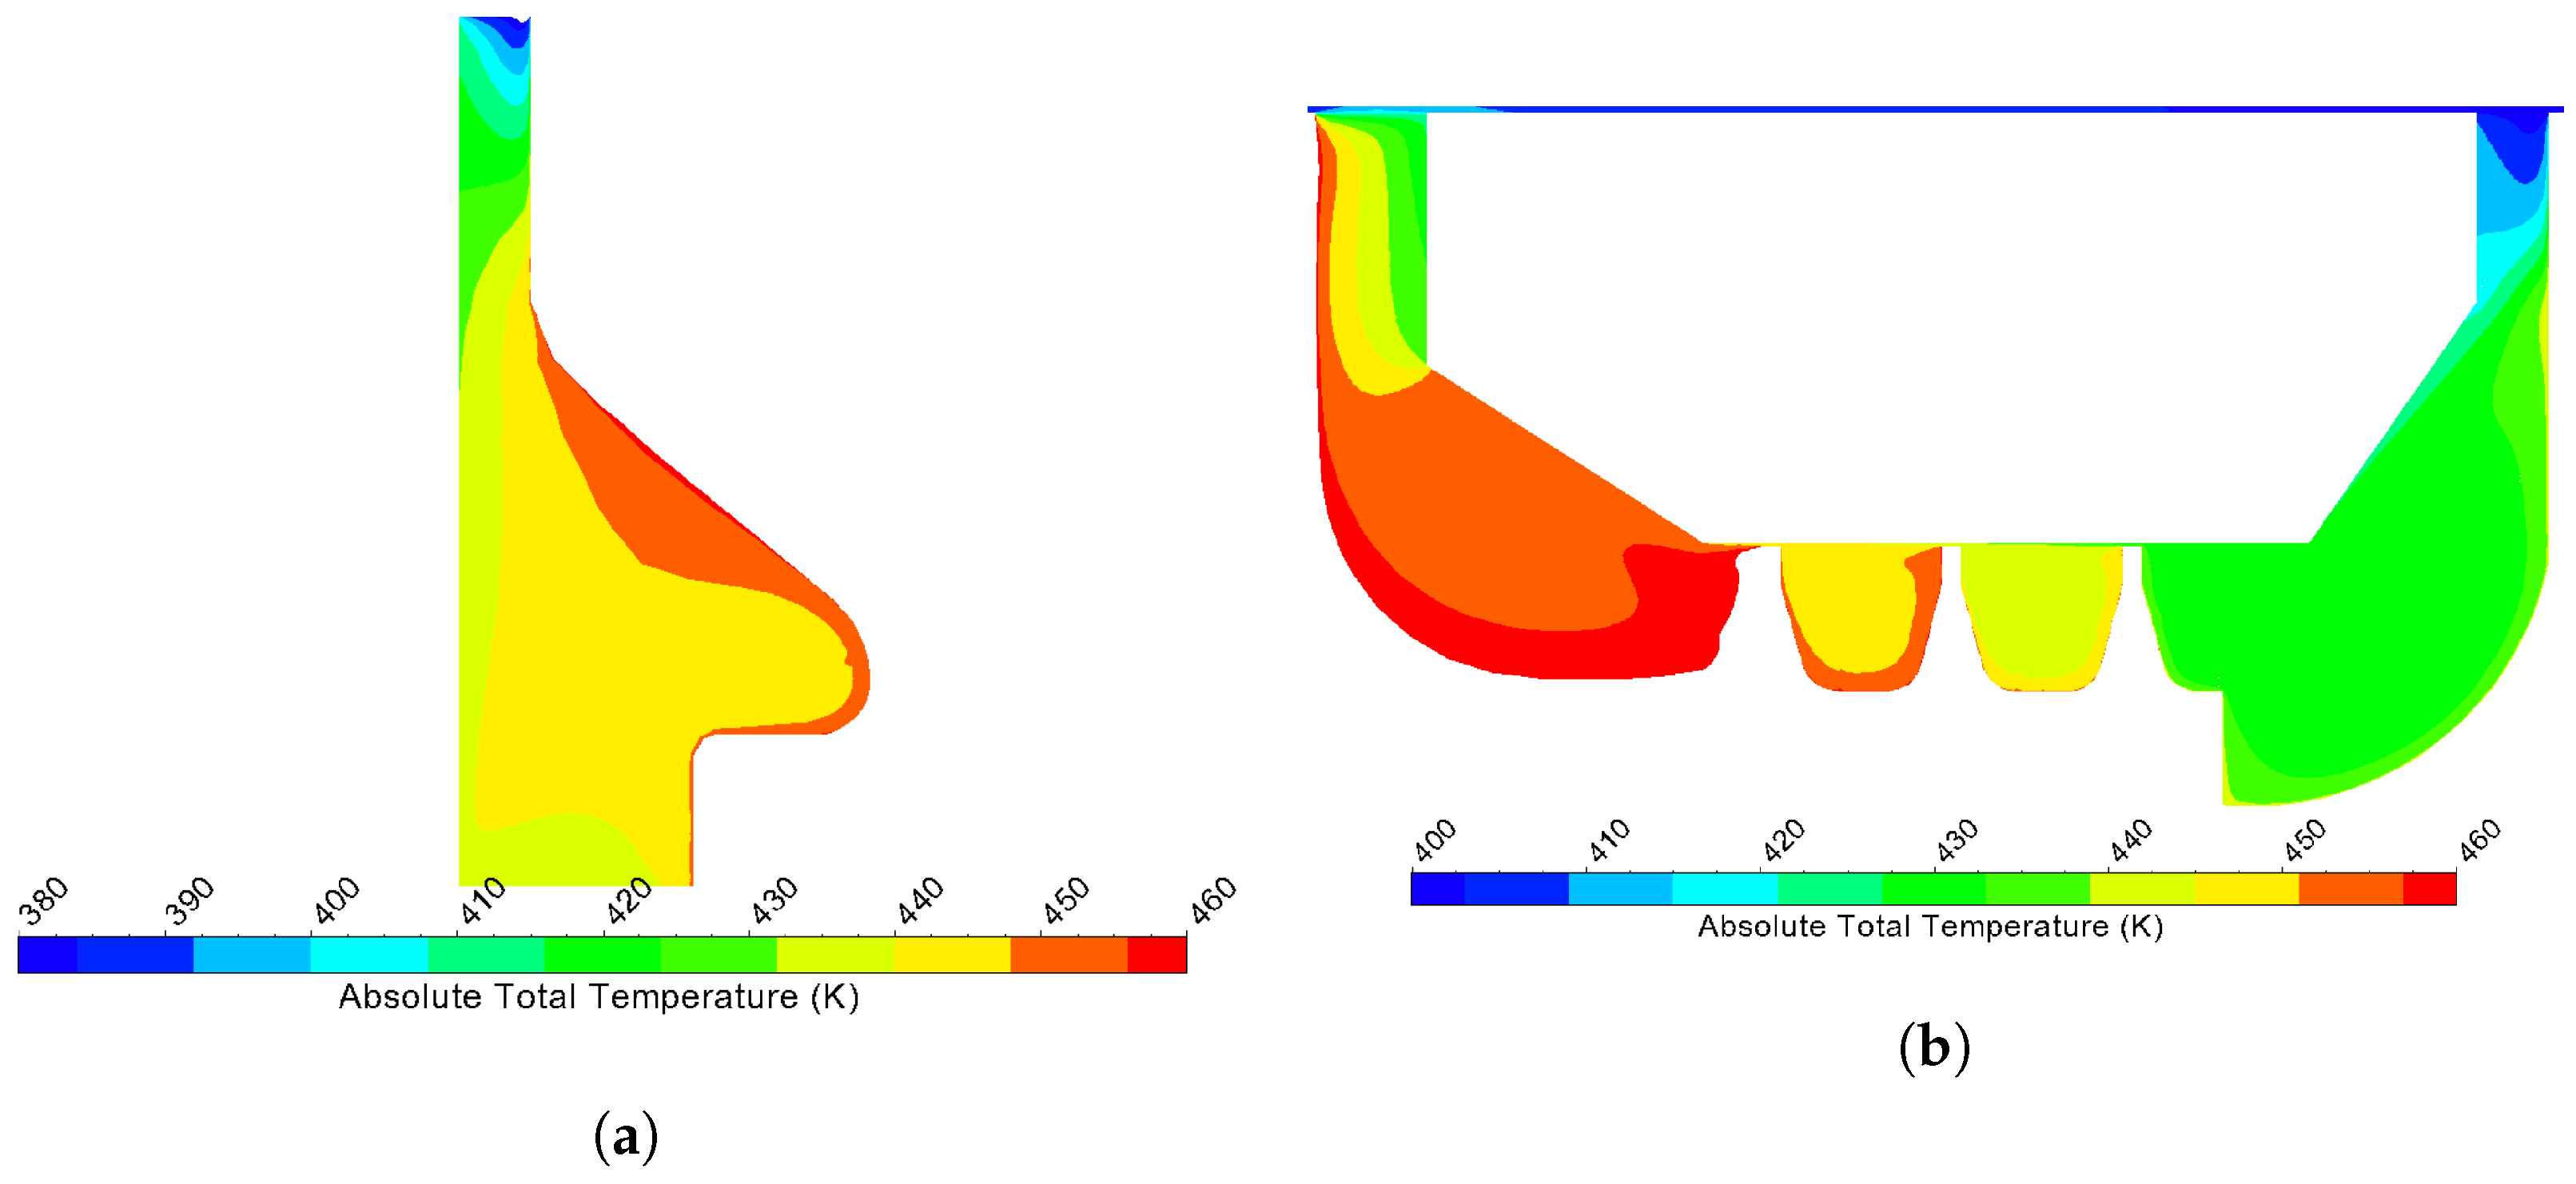
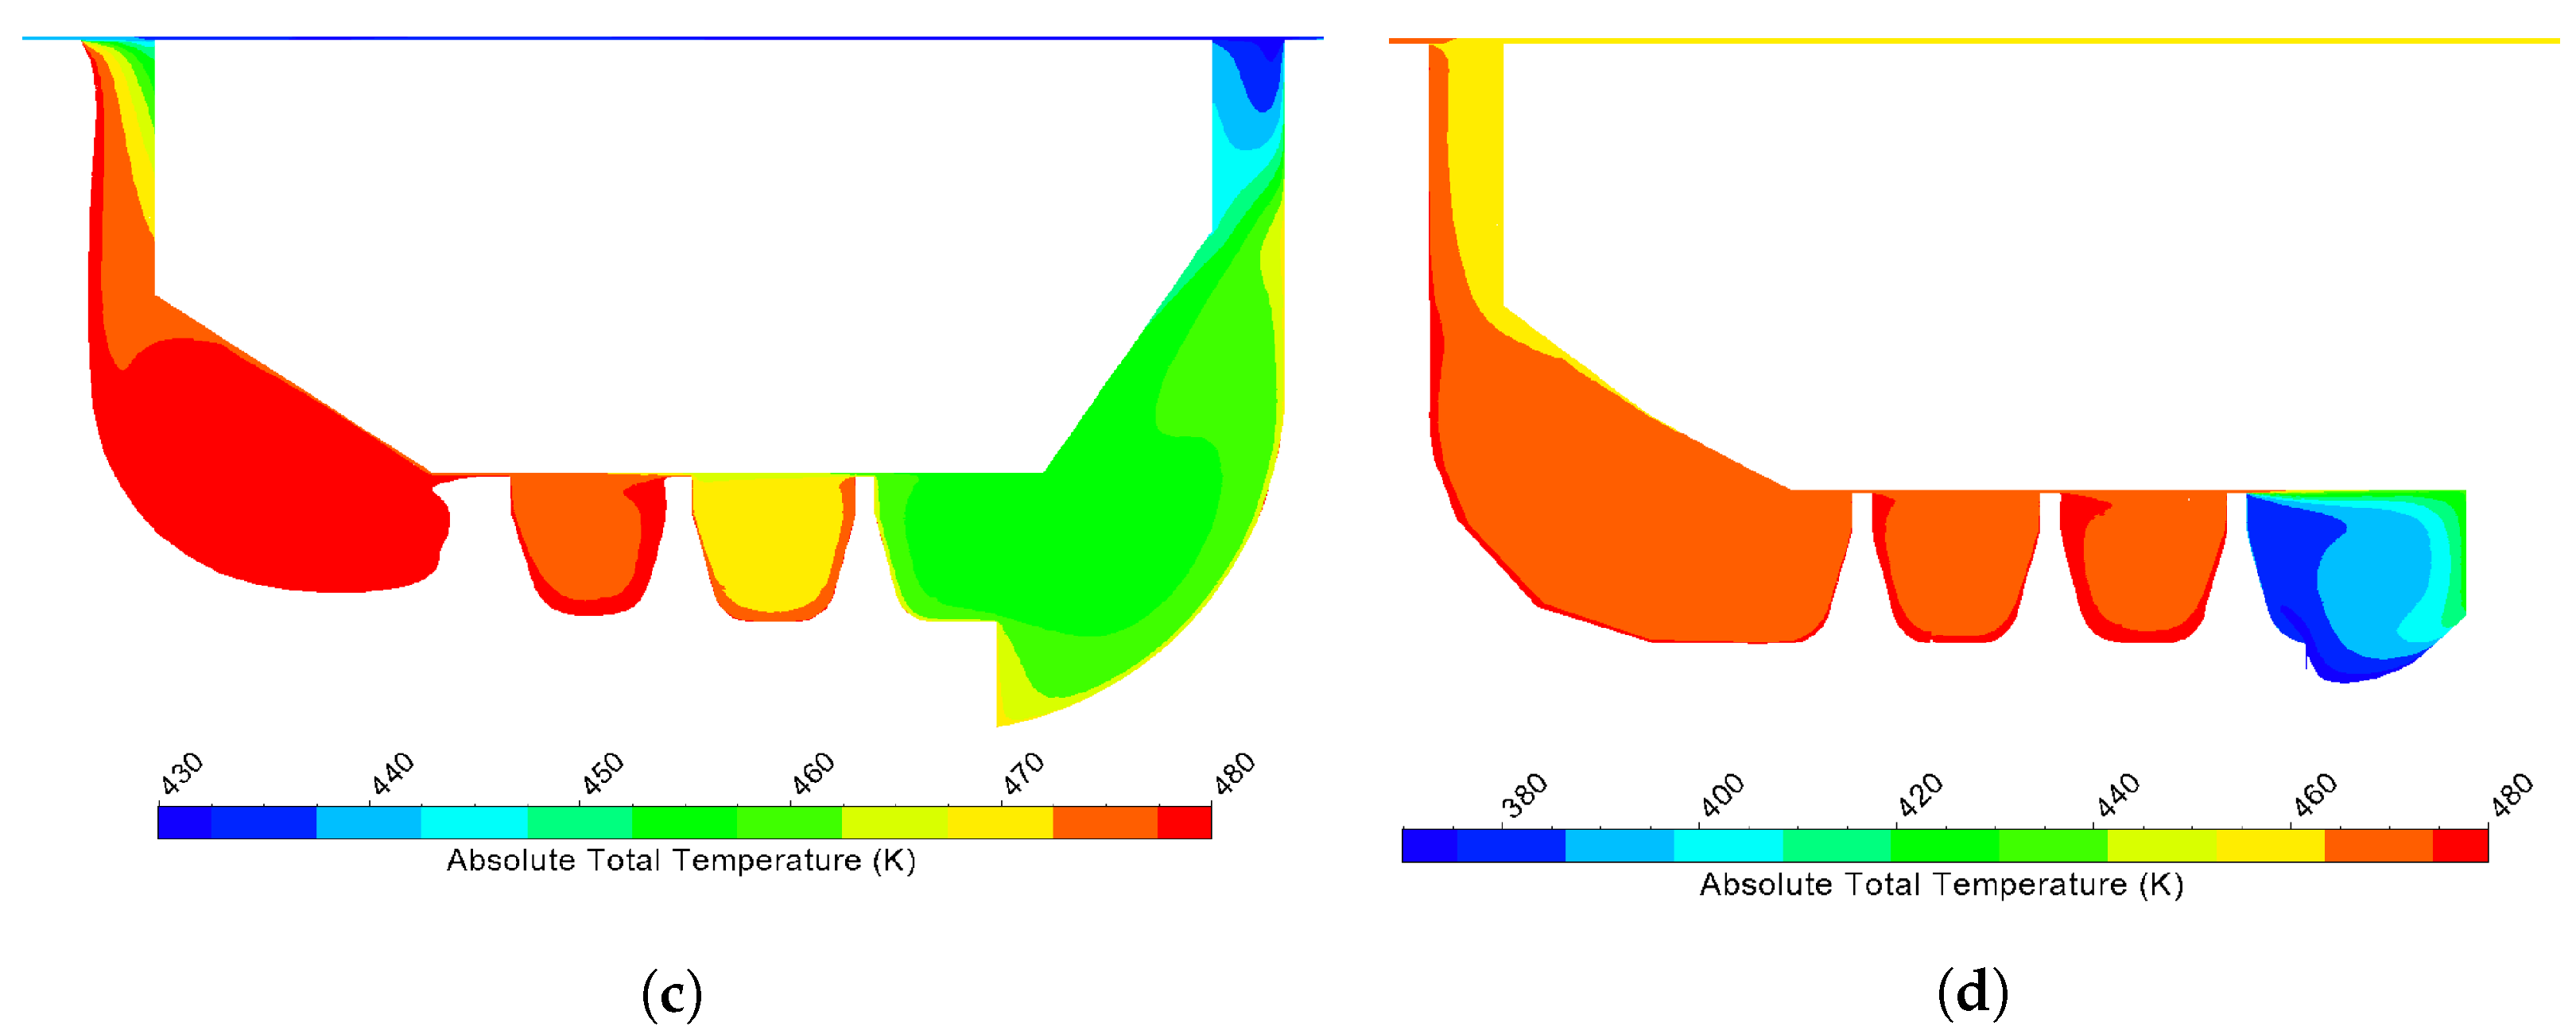
Windage Heating is a phenomenon that happens when the leakage flow passes through the rotating and stationary end wall thereby imparting shear work into the fluid which leads to a rise in temperature. Windage heating can have a significant impact on the performance and efficiency of the compressor. The heated leakage flow can increase the temperature of the stator blades, which can lead to thermal expansion and distortion. This can affect the clearance between the rotor and stator blades, causing changes in the flow pattern and reducing the efficiency of the turbomachine. Figure 18, depicts the tangentially mass-averaged contour plots that illustrate the absolute total temperature distribution across the cavities. An increase in total temperature was observed as the flow passed through the cavity because of the shear work imparted to the flow.
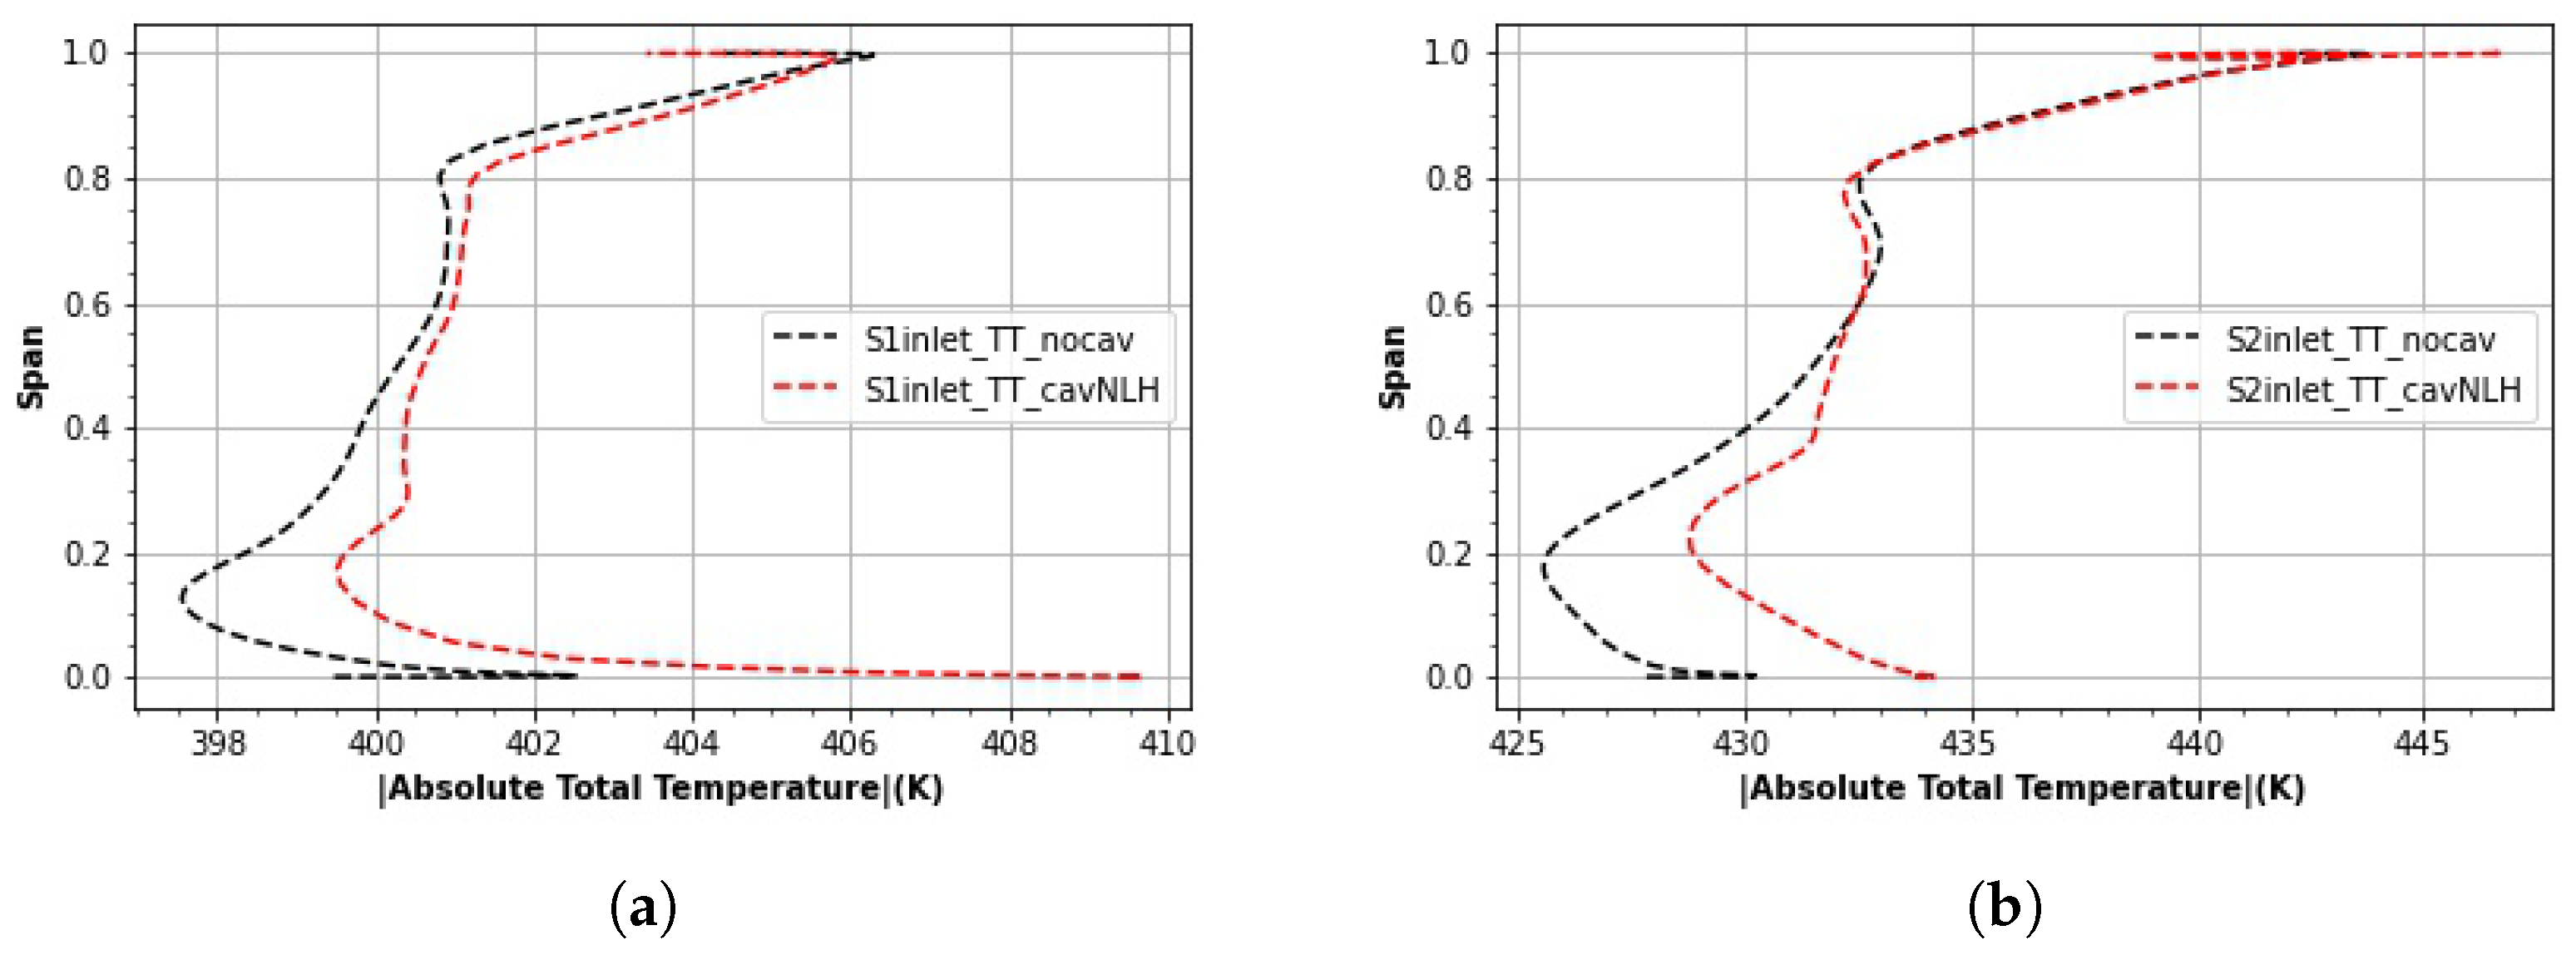
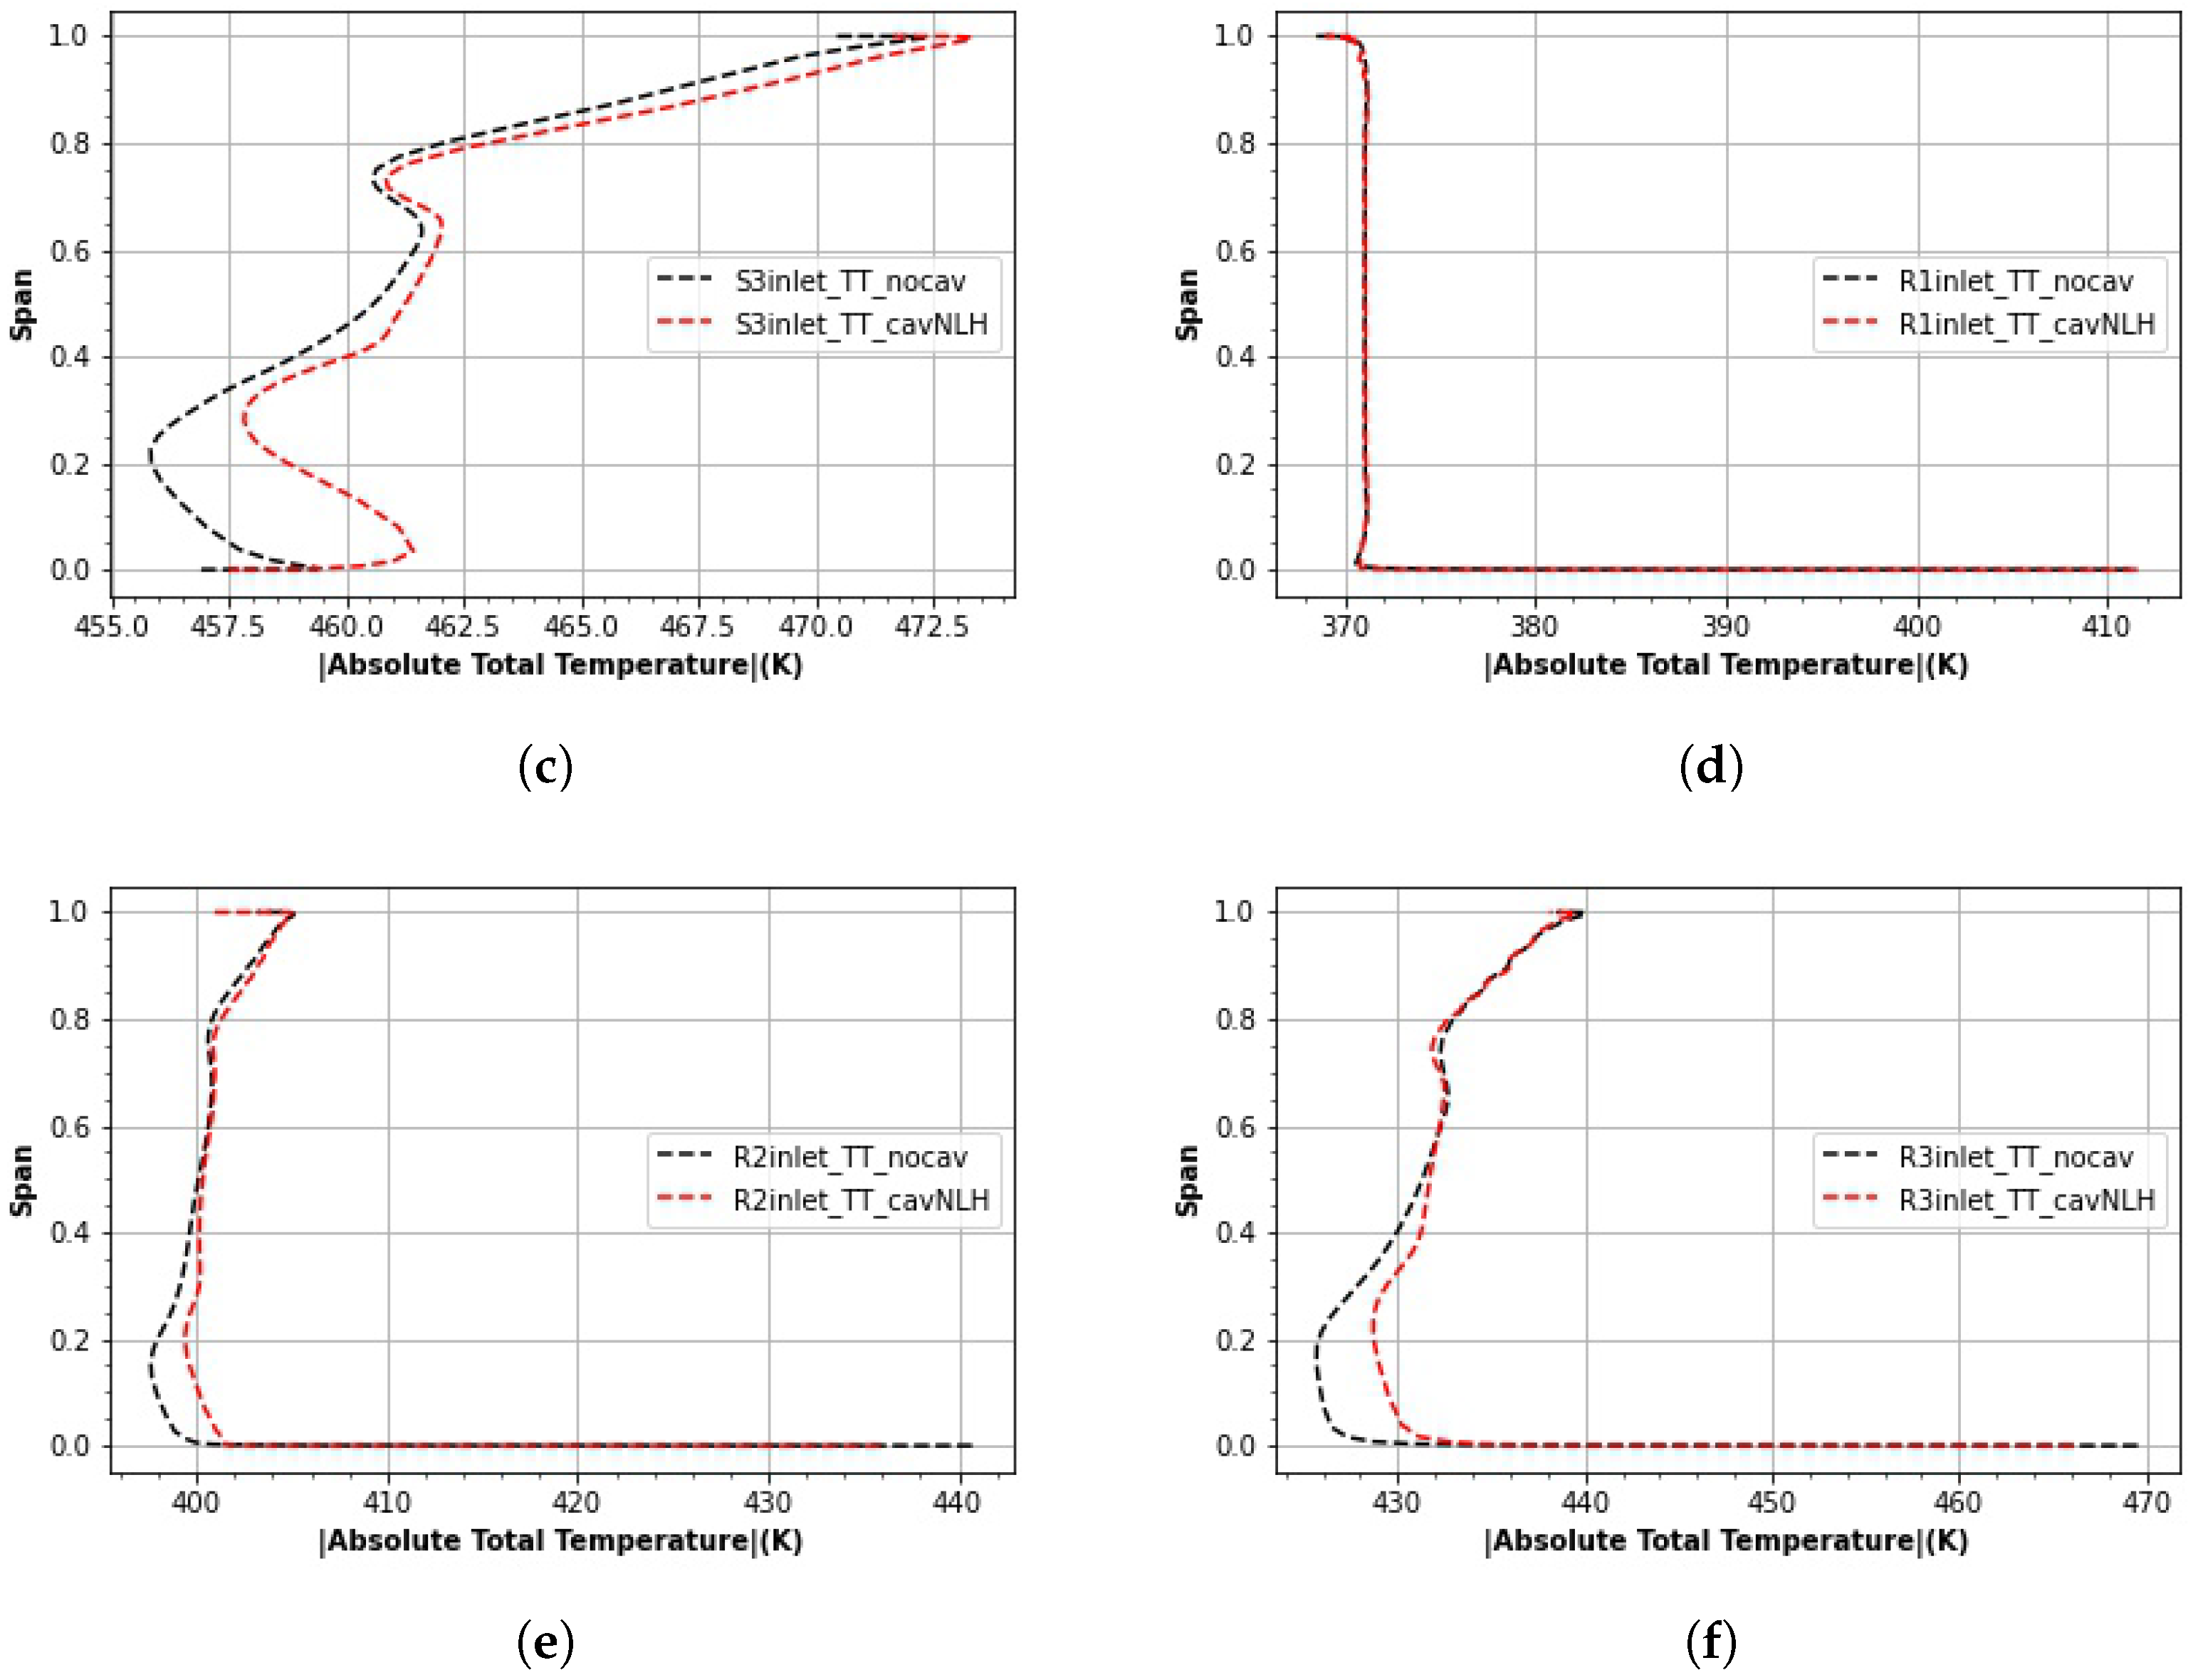
Further, radial span-wise plots of total temperature are provided to quantify and compare the total temperature near the hub section for the cantilevered and shrouded cases. The span-wise total temperature plots are plotted for both the rotor and stator inlets. Some observable total temperature rise occurred, mainly at the lower span of the stator inlets in Figure 19a–c, which is where the shear heated leakage flow enters the main flow. We can still see some slight rise in total temperature at rotor inlets in Figure 19d–f which can be attributed to the high-temperature flow from stator inlets driven towards the rotor inlet by the compressor.
The total enthalpy gain across the cavity flow corresponds to the total shear work done in the process. A weighted integral for total enthalpy, as shown in Equation (6), was calculated at upstream and downstream cavity connections and multiplied by mass flow rate to determine the total enthalpy rise.
The tabulations for the total enthalpy for cavities are shown below in Table 6. The results showed that the total enthalpy rise for the third cavity was lower than for the first one. The amount of shear work done was similar as the geometry and the wall velocity were very similar but since the mass flow was higher for the third cavity, the total enthalpy rise and temperature rise were lower.
A simple analytical model was also considered to determine the approximate shear work done on the cavity by assuming two flat plates separated by the average distance of the cavity surfaces. The upper plate was held stationary while the lower plate was assumed to move at the velocity of the rotating cavity surface. The Reynold’s number was calculated by following Equation (7). The necessary fluid properties were obtained from REFPROP.
where is the density of fluid, v is the velocity of the rotating surface, and y is the reference length (seal teeth gap). Spalding’s formula, with surface roughness as presented by Shabbir et al. [20], was used to correlate terms of skin friction coefficients and Reynold’s number and was then used to calculate the rise in temperature.
Equations (8)–(13) shown below were used to calculate the approximate shear work and the corresponding rise in temperature.
Using the energy equation, the total enthalpy changes for a viscous, compressible fluid with heat conduction can be written as follows:
If Equation (9) is integrated over a region moving with the fluid and Reynold’s Transport Theorem is used to transport over a fixed control volume which, in our case, is the cavity geometry (Figure 2), we obtain [21]:
Assuming the flow to be steady state, boundaries to be adiabatic and no body forces to be present, the equation reduces to:
The viscous stress-resultant only works on moving boundaries and, hence, is only non-zero on moving boundaries. For our control volume, we have one inlet and one outlet, and assuming the mass flow is constant, the integral reduces to:
Since variation was very small across the inlet and outlet, REFPROP was used to calculate the average value of at the inlet and outlet and denoted by . The total temperature increase is then related by:
The results are tabulated in Table 7 and are also compared with the CFD results. For a crude model, the results compared well for both Cavity 2 and Cavity 3.
9. Discussion and Conclusions
A sub-scaled three-stage, 9 MW axial sCO compressor, with a cantilevered configuration, was designed, using a CFD-based optimization strategy. The compressor for testing is being manufactured with the shrouded stator configuration, the detailed simulations of which are presented in this work, to explore the effects of the shrouded configuration on overall compressor functioning. The detailed simulations were performed with the NLH method, which represents an approximate unsteady analysis and details the flow physics and characteristics of leakage flow through seal teeth cavities. The simulations were run assuming adiabatic solid walls, and the aerodynamic and thermal effects of leakage flow were analyzed in both cantilevered and shrouded stator configurations and compared where applicable. For the study, different possible R/S interface combinations were considered, each was evaluated and the key performance parameters were computed to understand the influence of R/S interface definition. The R/S configuration with cavities in the rotating frame was found to perform best among the mixing plane cases, with an efficiency difference of 0.65% compared to the NLH case. Since the NLH case accommodates the approximate unsteady phenomenon and is independent of R/S interface effects, it was selected for further detailed analysis. While running NLH with two harmonics, the efficiency remained consistent with that of the cantilevered stator case. Conversely, a diminution in the efficiency of 0.56% was observed when assuming the mixing plane approach with cavities in the rotor interface, as compared to the cantilevered configuration.
The investigation showed a worsening of the boundary layer near the hub, evidenced by deteriorated stator wakes and an increase in entropy observed upstream of the stators around the hub region, suggestive of the presence of a hub blockage phenomenon. A substantial entropy rise of 30 J/(kg-K) was observed on the hub just upstream of Rotor3, equating to approximately six times the specific entropy rise across the entire third stage. Further analysis of vorticities showed the presence of vortices in the upstream and downstream cavity connections which indicated how the flow was being entrained and injected back into the main flow and, hence, introducing some losses.
Furthermore, a detailed analysis of the flow inside the cavity revealed the formation of multiple large vortical structures, which modified the flow entering and exiting the cavity. These structures contributed to a decrease in axial velocity and an increase in the radial velocity of the main flow, particularly in the hub region. As a result, there were losses in performance and an increase in entropy observed at the upstream cavity connections.
Windage heating caused by shear work was also investigated, by examining total temperature contours at the cavities and quantifying the amount of shear work done. The results showed an increase in the total temperature of the leakage flows across the cavity due to the presence of the phenomenon of windage heating. Specifically, an increase of up to 16.68 K was observed across the second cavity, while a temperature rise of 8.75 K was observed across the third cavity. A total enthalpy rise of 1.217 kW was observed across the second cavity, while an enthalpy rise of 1.093 KW was found across the third cavity. The approximate analytical solution was also calculated to compare with the computational results and was also in close agreement with a 9% difference in enthalpy rise and a 19% difference in total temperature rise for the second cavity and a 13% and 31% difference for enthalpy rise and total temperature rise, respectively, for the third cavity. This finding additionally testified to the effectiveness of the numerical and analytical methods used for this study and provided validation of the approach used.
This investigation sheds light on the impact of employing a shrouded stator configuration on the aerodynamic and thermal performances of an sCO axial compressor, compared to the conventional cantilevered stator configuration. As the current design entails a nominal seal teeth gap of only 0.17% of the span, the potential influence of larger clearances on compressor performance warrants further exploration. Accordingly, future endeavors aim to scrutinize the effects of varying seal teeth clearances and to evaluate the feasibility of parameterizing and optimizing seal teeth cavities alongside blades.
Author Contributions
M.T. put forward the idea and supervised the research work. S.G. conducted the detailed simulation, post-processed the results, and drafted the manuscript. Both authors discussed the results and reviewed the manuscript. All authors have read and agreed to the published version of the manuscript.
Funding
This material is based upon work supported by the U.S. Department of Energy’s Office of Energy Efficiency and Renewable Energy (EERE) under the Solar Energy Technologies Office Award Number DE-EE0008997. However, the views expressed herein do not necessarily represent the views of the U.S. Department of Energy or the United States Government.
Data Availability Statement
Not applicable.
Conflicts of Interest
The authors declare no conflict of interest.
Nomenclature
| Massflow rate | |
| A | Area |
| Total Enthalpy | |
| Volume | |
| Viscosity | |
| Density | |
| Shear Stress | |
| p | Pressure |
| v | Fluid Velocity |
| V | Surface Velocity |
| Cp | Specific heat at constant pressure |
| f | Body force |
| q | Heat flux |
| TT | Total Temperature |
| Cf | Coefficient of friction |
| Subscripts | |
| in | at inlet |
| out | at outlet |
| m | mean |
| w | wall |
| tot | total |
| stg | stage |
| Abbreviations | |
| TPR | Total Pressure Ratio |
| TTR | Total Temperature Ratio |
| NLH | Non-linear Harmonic |
| CFD | Computational Fluid Dynamics |
References
- Ha, M.; Holder, J.; Ghimire, S.; Ringheisen, A.; Turner, M.G. Detailed Design and Optimization of the First Stage of an Axial Supercritical CO2 Compressor. In Proceedings of the Volume 10C: Turbomachinery—Design Methods and CFD Modeling for Turbomachinery; Ducts, Noise, and Component Interactions, Rotterdam, The Netherlands, 13–17 June 2022; p. V10CT32A036. [Google Scholar] [CrossRef]
- Wang, Y.; Guenette, G.; Hejzlar, P.; Driscoll, M. Compressor Design for the Supercritical CO2 Brayton Cycle. In Proceedings of the 2nd International Energy Conversion Engineering Conference, Providence, RI, USA, 16–19 August 2004. [Google Scholar] [CrossRef]
- Takagi, K.; Muto, Y.; Ishizuka, T.; Aritomi, M.; Kikura, H. Research on Flow Characteristics of Supercritical CO2 Axial Compressor Blades by CFD Analysis. In Proceedings of the Volume 4: Codes, Standards, Licensing and Regulatory Issues, Student Paper Competition, Brussels, Belgium, 1 January 2009; pp. 565–572. [Google Scholar] [CrossRef]
- Zhao, H.; Deng, Q.; Zheng, K.; Zhang, H.; Feng, Z. Numerical Investigation on the Flow Characteristics of a Supercritical CO2 Centrifugal Compressor. In Proceedings of the Volume 3B: Oil and Gas Applications; Organic Rankine Cycle Power Systems, Supercritical CO2 Power Cycles, Wind Energy, Düsseldorf, Germany, 16–20 June 2014; p. V03BT36A013. [Google Scholar] [CrossRef]
- Liu, Z.; Luo, W.; Zhao, Q.; Zhao, W.; Xu, J. Preliminary Design and Model Assessment of a Supercritical CO2 Compressor. Appl. Sci. 2018, 8, 595. [Google Scholar] [CrossRef]
- Ghimire, S.; Ringheisen, A.; Turner, M.G. Aerothermal Investigation of Seal Teeth Cavity Leakage Flow in Supercritical CO2 Compressor. In Proceedings of the AIAA SCITECH 2023 Forum, National Harbor, MD, USA, 23–27 January 2023. [Google Scholar] [CrossRef]
- Narain, J.P. Heat transfer in cylindrical shrouded cavities. Comput. Fluids 1977, 5, 61–71. [Google Scholar] [CrossRef]
- Hunter, S. Source Term Modeling of End Wall Cavity Flow Effects on Gaspath Aerodynamics in an Axial Flow Turbine. Ph.D. Thesis, The University of Cincinnati, Cincinnati, OH, USA, 1998. [Google Scholar]
- Yoon, S.; Selmeier, R.; Cargill, P.; Wood, P. Effect of the Stator Hub Configuration and Stage Design Parameters on Aerodynamic Loss in Axial Compressors. J. Turbomach. 2015, 137, 091001. [Google Scholar] [CrossRef]
- Mahmood, S.M.H.; Turner, M.G. Modeling Capability for Cavity Flows in an Axial Compressor. In Proceedings of the Volume 2B: Turbomachinery, Charlotte, NC, USA, 26–30 June 2017; p. V02BT41A028. [Google Scholar] [CrossRef]
- Wellborn, S.R.; Okiishi, T.H. The Influence of Shrouded Stator Cavity Flows on Multistage Compressor Performance. J. Turbomach. 1999, 121, 486–497. Available online: https://asmedigitalcollection.asme.org/turbomachinery/article-pdf/121/3/486/5841115/486_1.pdf (accessed on 2 February 2023). [CrossRef]
- Mansouri, Z. Aerodynamic and heat transfer performances of a highly loaded transonic turbine rotor with upstream generic rim seal cavity. Propuls. Power Res. 2021, 10, 317–331. [Google Scholar] [CrossRef]
- Liang, D.; Jin, D.; Gui, X. Investigation of Seal Cavity Leakage Flow Effect on Multistage Axial Compressor Aerodynamic Performance with a Circumferentially Averaged Method. Appl. Sci. 2021, 11, 3937. [Google Scholar] [CrossRef]
- Kamdar, N.; Lou, F.; Key, N.L. Details of Shrouded Stator Hub Cavity Flow in a Multistage Axial Compressor Part 2: Leakage Flow Characteristics in Stator Wells. J. Eng. Gas Turbines Power 2022, 144, 011027. [Google Scholar] [CrossRef]
- Turner, M.G.; Merchant, A.; Bruna, D. A Turbomachinery Design Tool for Teaching Design Concepts for Axial-Flow Fans, Compressors, and Turbines. In Proceedings of the Volume 1: Combustion and Fuels, Education, Barcelona, Spain, 8–11 May 2006; pp. 937–952. [Google Scholar] [CrossRef]
- Sharma, M. Tblade3-Readme (Version 1.2); GTSL-UC 2019. Available online: https://github.com/GTSL-UC/T-Blade3 (accessed on 2 February 2023).
- Cadence Design Systems. Fine/Turbo User Guide (Version 13.2) [Software Manual]; Cadence Design Systems, Inc.: San Jose, CA, USA, 2013. [Google Scholar]
- Huber, M.L.; Lemmon, E.W.; Bell, I.H.; McLinden, M.O. The NIST REFPROP Database for Highly Accurate Properties of Industrially Important Fluids. Ind. Eng. Chem. Res. 2022, 61, 15449–15472. [Google Scholar] [CrossRef] [PubMed]
- Wells, K.; Turner, M.G. Open Source Axial Compressor Mean-Line Design Tool for Supercritical Carbon Dioxide. In Proceedings of the Volume 10: Supercritical CO2, Virtual, 7–11 June 2021; p. V010T30A024. [Google Scholar] [CrossRef]
- Shabbir, A.; Turner, M.G. A Wall Function for Calculating the Skin Friction With Surface Roughness. In Proceedings of the Volume 5: Turbo Expo 2004, Parts A and B, Vienna, Austria, 14–17 June 2004; pp. 1661–1671. [Google Scholar] [CrossRef]
- Lyman, F.A. On the Conservation of Rothalpy in Turbomachines. J. Turbomach. 1993, 115, 520–525. [Google Scholar] [CrossRef]
Figure 1.
Three-stage design (a) Cantilevered configuration (without cavities) and (b) Shrouded configuration (with cavities).
Figure 1.
Three-stage design (a) Cantilevered configuration (without cavities) and (b) Shrouded configuration (with cavities).

Figure 2.
Dimensions of Cavity 2.

Figure 3.
Grid dependency study for fine and medium meshes. (a) Isentropic efficiency and (b) Total pressure ratio.
Figure 3.
Grid dependency study for fine and medium meshes. (a) Isentropic efficiency and (b) Total pressure ratio.

Figure 4.
The y+ value comparison (a) Cantilevered configuration (without cavities) and (b) Shrouded configuration (with cavities).
Figure 4.
The y+ value comparison (a) Cantilevered configuration (without cavities) and (b) Shrouded configuration (with cavities).

Figure 5.
Rotor–Stator Configurations. (a) RS-1 (Cavities in the rotating frame). (b) RS-2 (Cavities in the stationary frame). (c) RS-3 (Cavities in the stationary/rotating frames). (d) RS-4 (Cavities in the rotating/stationary frames).
Figure 5.
Rotor–Stator Configurations. (a) RS-1 (Cavities in the rotating frame). (b) RS-2 (Cavities in the stationary frame). (c) RS-3 (Cavities in the stationary/rotating frames). (d) RS-4 (Cavities in the rotating/stationary frames).

Figure 6.
Tangentially mass-averaged entropy comparison at the rotor inlets. (a) at Rotor1 inlet. (b) at Rotor2 inlet. (c) at Rotor3 inlet.
Figure 6.
Tangentially mass-averaged entropy comparison at the rotor inlets. (a) at Rotor1 inlet. (b) at Rotor2 inlet. (c) at Rotor3 inlet.

Figure 7.
Stream tubes drawn along S1 (Stator 1). (a) for Cantilevered Case (b) For Shrouded (NLH) case.
Figure 7.
Stream tubes drawn along S1 (Stator 1). (a) for Cantilevered Case (b) For Shrouded (NLH) case.

Figure 8.
Stream tubes drawn along S2 (Stator 2). (a) for Cantilevered Case (b) For Shrouded (NLH) case.
Figure 8.
Stream tubes drawn along S2 (Stator 2). (a) for Cantilevered Case (b) For Shrouded (NLH) case.

Figure 9.
Axial component of vorticity plotted at 1% span. (a) at Stator 1 (cantilevered) and (b) at Stator 1 (shrouded) (c) at Stator 2 (cantilevered) (d) at Stator2 (shrouded).
Figure 9.
Axial component of vorticity plotted at 1% span. (a) at Stator 1 (cantilevered) and (b) at Stator 1 (shrouded) (c) at Stator 2 (cantilevered) (d) at Stator2 (shrouded).

Figure 10.
Cross-stream streamwise vorticity plots just upstream of stator leading edge (a) for cantilevered configuration (without cavities) and (b) for shrouded configuration (with cavities).
Figure 10.
Cross-stream streamwise vorticity plots just upstream of stator leading edge (a) for cantilevered configuration (without cavities) and (b) for shrouded configuration (with cavities).

Figure 11.
Tangentially mass-averaged entropy comparison at the rotor outlets. (a) at Rotor1 outlet. (b) at Rotor2 outlet. (c) at Rotor3 outlet.
Figure 11.
Tangentially mass-averaged entropy comparison at the rotor outlets. (a) at Rotor1 outlet. (b) at Rotor2 outlet. (c) at Rotor3 outlet.

Figure 12.
Vortical flow structures in Cavities (a) Cavity-1. (b) Cavity-2. (c) Cavity-3. (d) Cavity-4.
Figure 12.
Vortical flow structures in Cavities (a) Cavity-1. (b) Cavity-2. (c) Cavity-3. (d) Cavity-4.

Figure 13.
Axial velocity plotted at 1% span (a) at Stator1 (cantilevered) and (b) at Stator1 (shrouded) (c) at Stator2 (cantilevered) (d) at Stator2 (shrouded).
Figure 13.
Axial velocity plotted at 1% span (a) at Stator1 (cantilevered) and (b) at Stator1 (shrouded) (c) at Stator2 (cantilevered) (d) at Stator2 (shrouded).

Figure 14.
Radial velocity plotted at hub (a) at Stator1 and (b) at Stator2.

Figure 15.
Static pressure contour plots at hub (a) for Stator1 and (b) for Stator2.

Figure 16.
Tangentially mass-averaged span-wise axial velocity plots. (a) at Rotor1 inlet. (b) at Stator1 inlet. (c) at Rotor2 inlet. (d) at Stator2 inlet. (e) at Rotor3 inlet. (f) at Stator3 inlet.
Figure 16.
Tangentially mass-averaged span-wise axial velocity plots. (a) at Rotor1 inlet. (b) at Stator1 inlet. (c) at Rotor2 inlet. (d) at Stator2 inlet. (e) at Rotor3 inlet. (f) at Stator3 inlet.

Figure 17.
Tangentially mass-averaged span-wise radial velocity plots. (a) at Rotor1 inlet. (b) at Stator1 inlet. (c) at Rotor2 inlet. (d) at Stator2 inlet. (e) at Rotor3 inlet. (f) at Stator3 inlet.
Figure 17.
Tangentially mass-averaged span-wise radial velocity plots. (a) at Rotor1 inlet. (b) at Stator1 inlet. (c) at Rotor2 inlet. (d) at Stator2 inlet. (e) at Rotor3 inlet. (f) at Stator3 inlet.


Figure 18.
Total temperature contour in Cavity flow. (a) Cavity-1, (b) Cavity-2, (c) Cavity-3, (d) Cavity-4.
Figure 18.
Total temperature contour in Cavity flow. (a) Cavity-1, (b) Cavity-2, (c) Cavity-3, (d) Cavity-4.


Figure 19.
Tangentially mass-averaged span-wise total temperature plots. (a) at Stator1 inlet. (b) at Stator2 inlet. (c) at Stator3 inlet. (d) at Rotor1 inlet. (e) at Rotor2 inlet. (f) at Rotor3 inlet.
Figure 19.
Tangentially mass-averaged span-wise total temperature plots. (a) at Stator1 inlet. (b) at Stator2 inlet. (c) at Stator3 inlet. (d) at Rotor1 inlet. (e) at Rotor2 inlet. (f) at Rotor3 inlet.


Table 1.
Gap and Fillet data for Three-stage Design.
| Row | Span-Wise Points | Grid Level | Hub Fillet (mm) | Tip Gap (mm) | Tip Fillet (mm) | Blade Count |
|---|---|---|---|---|---|---|
| IGV | 193 | 12 | 1.6 | - | 1.6 | 43 |
| Rotor1 | 289 | 18 | 1.6 | 0.201 | - | 69 |
| Stator1 | 193 | 12 | 1.6 | - | 1.6 | 114 |
| Rotor2 | 305 | 20 | 1.6 | 0.192 | - | 88 |
| Stator2 | 193 | 15 | 1.6 | - | 1.6 | 112 |
| Rotor3 | 305 | 20 | 1.6 | 0.186 | - | 83 |
| Stator3 | 193 | 15 | 1.6 | - | 1.6 | 101 |
Table 2.
Mesh details for cantilevered and shrouded three-stage design.
| Cantilevered | Shrouded | |
|---|---|---|
| (without Cavity) | (with Cavity) | |
| First Cell Width | m | m |
| IGV | 3.82 million | 3.5 million |
| Rotor1 | 9.9 million | 7 million |
| Stator1 | 8.6 million | 6.5 million |
| Rotor2 | 11 million | 8.5 million |
| Stator2 | 8 million | 6.2 million |
| Rotor3 | 10 million | 8.5 million |
| Stator3 | 8 million | 7.2 million |
| Cavity1 | - | 3 million |
| Cavity2 | - | 7.5 million |
| Cavity3 | - | 8 million |
| Cavity4 | - | 6.5 million |
| Total Grid Points | 60 million | 72 million |
Table 3.
Comparison of performance parameters for possible configurations.
| Configuration | Efficiency | Pressure Ratio | Massflow (kg/s) |
|---|---|---|---|
| Cantilevered | 89.46 | 2.538 | 127.10 kg/s |
| NLH-Shrouded | 89.60 | 2.549 | 127.22 kg/s |
| RS-1 | 88.95 | 2.455 | 127.20 kg/s |
| RS-2 | 87.33 | 2.434 | 127.20 kg/s |
| RS-3 | 87.62 | 2.425 | 127.21 kg/s |
| RS-4 | 85.54 | 2.384 | 127.25 kg/s |
Table 4.
Mass flow through cavities.
| Flow | Mass Flow (kg/s) | Percentage of Main Flow (%) |
|---|---|---|
| Main Flow | 127.20 | 100 |
| Cavity 1 | 0.0014 | 0.0011 |
| Cavity 2 | 0.071 | 0.056 |
| Cavity 3 | 0.098 | 0.077 |
| Cavity 4 | 0.38 | 0.299 |
Table 5.
Stage Performance Parameters.
| Configuration | Stage | ||||||
|---|---|---|---|---|---|---|---|
| Cantilevered | First | 1.380 | 1.079 | 0.904 | 2.5382 | 1.2412 | 0.8946 |
| Second | 1.380 | 1.077 | 0.901 | ||||
| Third | 1.335 | 1.068 | 0.905 | ||||
| Shrouded | First | 1.389 | 1.081 | 0.900 | 2.5491 | 1.2419 | 0.8960 |
| Second | 1.382 | 1.078 | 0.903 | ||||
| Third | 1.330 | 1.067 | 0.910 |
Table 6.
Total temperature and shear work calculations.
| Cav1_in | Cav2_out | Cav2_in | Cav3_out | Cav3_in | Cav4_in | |
|---|---|---|---|---|---|---|
| (kg/s) | ||||||
| (kJ/kg) | 559.54 | 601.36 | 582.49 | 618.993 | 607.38 | 630.98 |
| Periodicity | 43 | 114 | 114 | 112 | 112 | 101 |
| (kW) | 2.647 | 38.797 | 37.580 | 58.235 | 57.142 | 132.691 |
| (kW) | - | 1.217 | 1.093 | - | ||
| (K) | 373.736 | 418.614 | 401.936 | 440.092 | 431.344 | 457.337 |
| (K) | - | 16.678 | 8.748 | - | ||
Table 7.
Approximate analytical solution for the second cavity.
| Cavity 2 | Cavity 3 | |||||
|---|---|---|---|---|---|---|
| Analytical | CFD | Difference (%) | Analytical | CFD | Difference (%) | |
| (kg/s) | - | - | ||||
| (kW) | 1.343 | 1.217 | 9.4 | 1.198 | 1.093 | 12.6 |
| (K) | 20.60 | 16.678 | 19 | 12.60 | 8.748 | 30.5 |
Disclaimer/Publisher’s Note: The statements, opinions and data contained in all publications are solely those of the individual author(s) and contributor(s) and not of MDPI and/or the editor(s). MDPI and/or the editor(s) disclaim responsibility for any injury to people or property resulting from any ideas, methods, instructions or products referred to in the content. |
© 2023 by the authors. Licensee MDPI, Basel, Switzerland. This article is an open access article distributed under the terms and conditions of the Creative Commons Attribution (CC BY) license (https://creativecommons.org/licenses/by/4.0/).
Share and Cite
MDPI and ACS Style
Ghimire, S.; Turner, M. Detailed Simulations of a Three-Stage Supercritical Carbon Dioxide Axial Compressor with a Focus on the Shrouded Stator Cavities Flow. Processes 2023, 11, 1358. https://doi.org/10.3390/pr11051358
AMA Style
Ghimire S, Turner M. Detailed Simulations of a Three-Stage Supercritical Carbon Dioxide Axial Compressor with a Focus on the Shrouded Stator Cavities Flow. Processes. 2023; 11(5):1358. https://doi.org/10.3390/pr11051358
Chicago/Turabian StyleGhimire, Saugat, and Mark Turner. 2023. "Detailed Simulations of a Three-Stage Supercritical Carbon Dioxide Axial Compressor with a Focus on the Shrouded Stator Cavities Flow" Processes 11, no. 5: 1358. https://doi.org/10.3390/pr11051358
Note that from the first issue of 2016, this journal uses article numbers instead of page numbers. See further details here.