
Design of a RGB-Arduino Device for Monitoring Copper Recovery from PCBs


Abstract
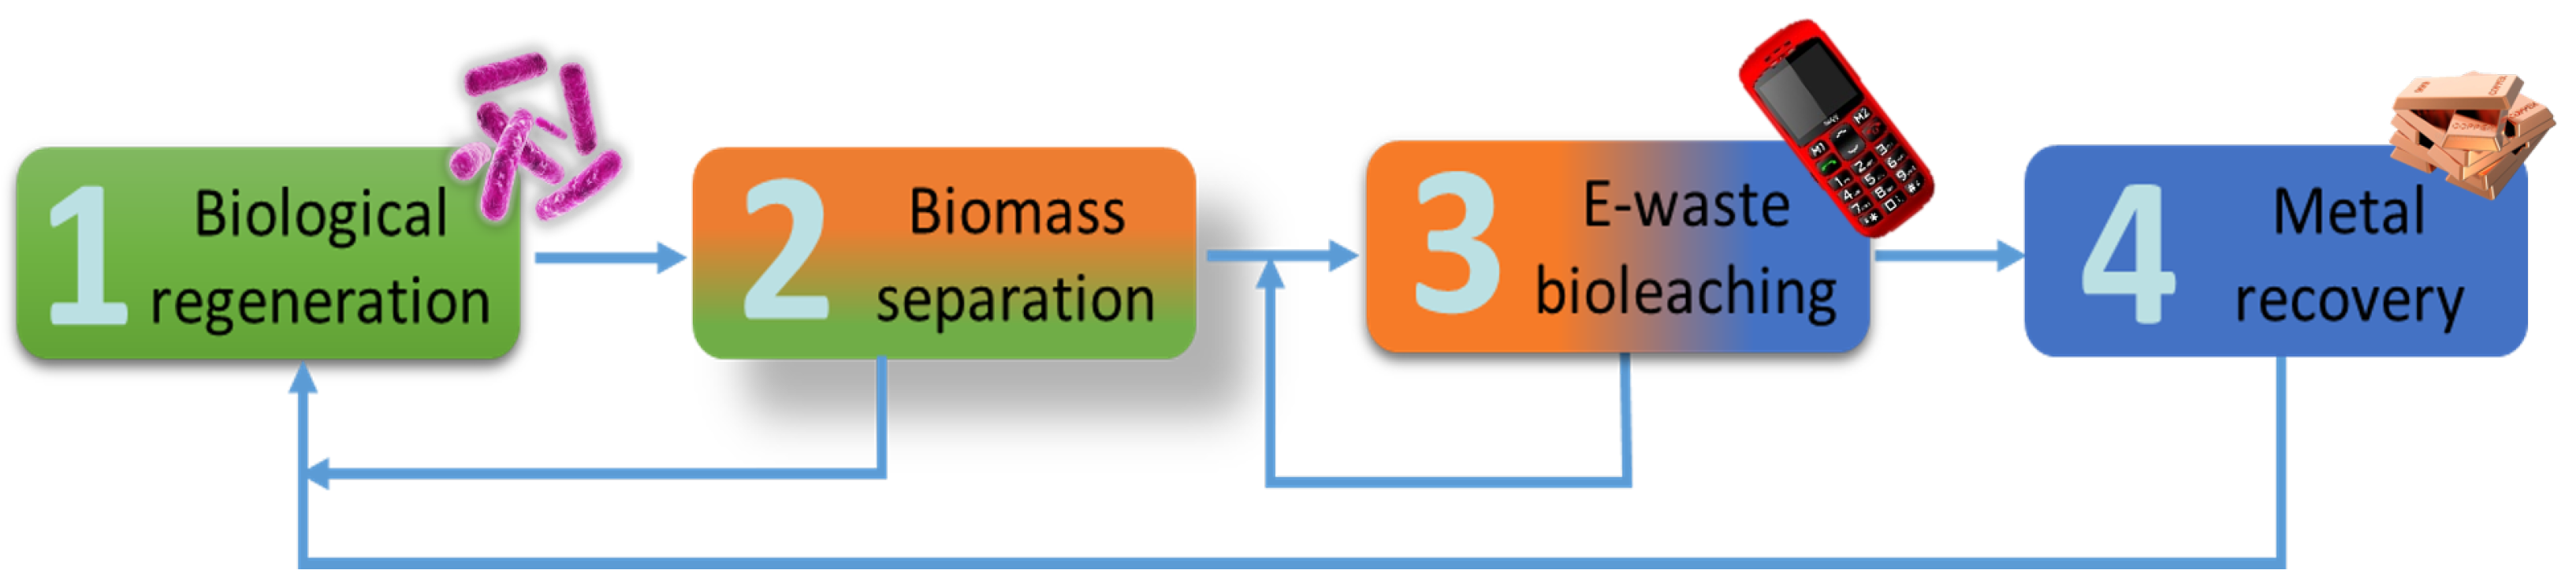
:1. Introduction
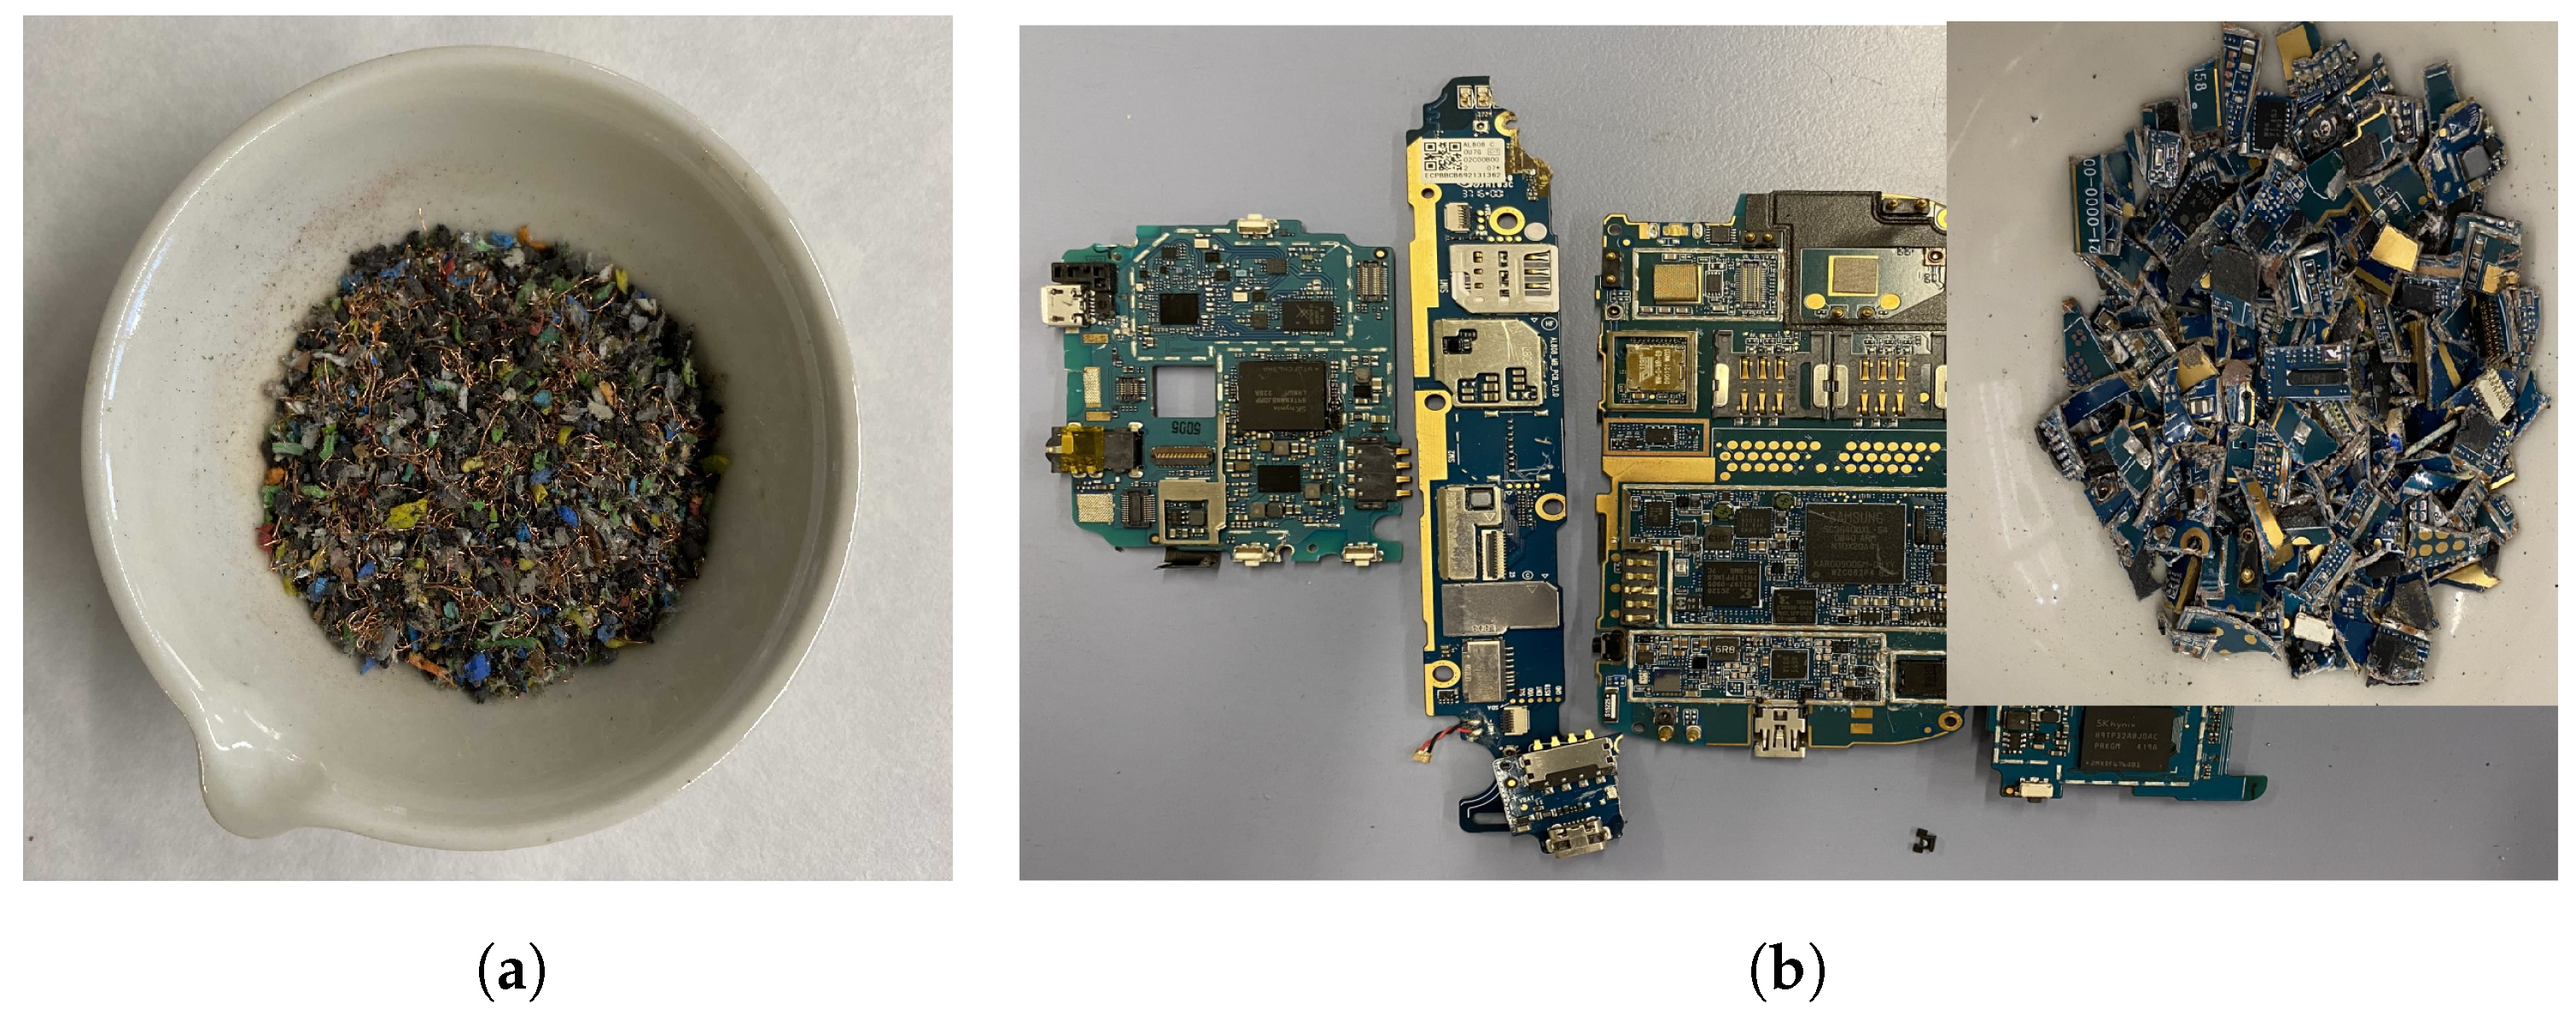
2. Materials and Methods
2.1. Experimental Designs and Analysis Methods
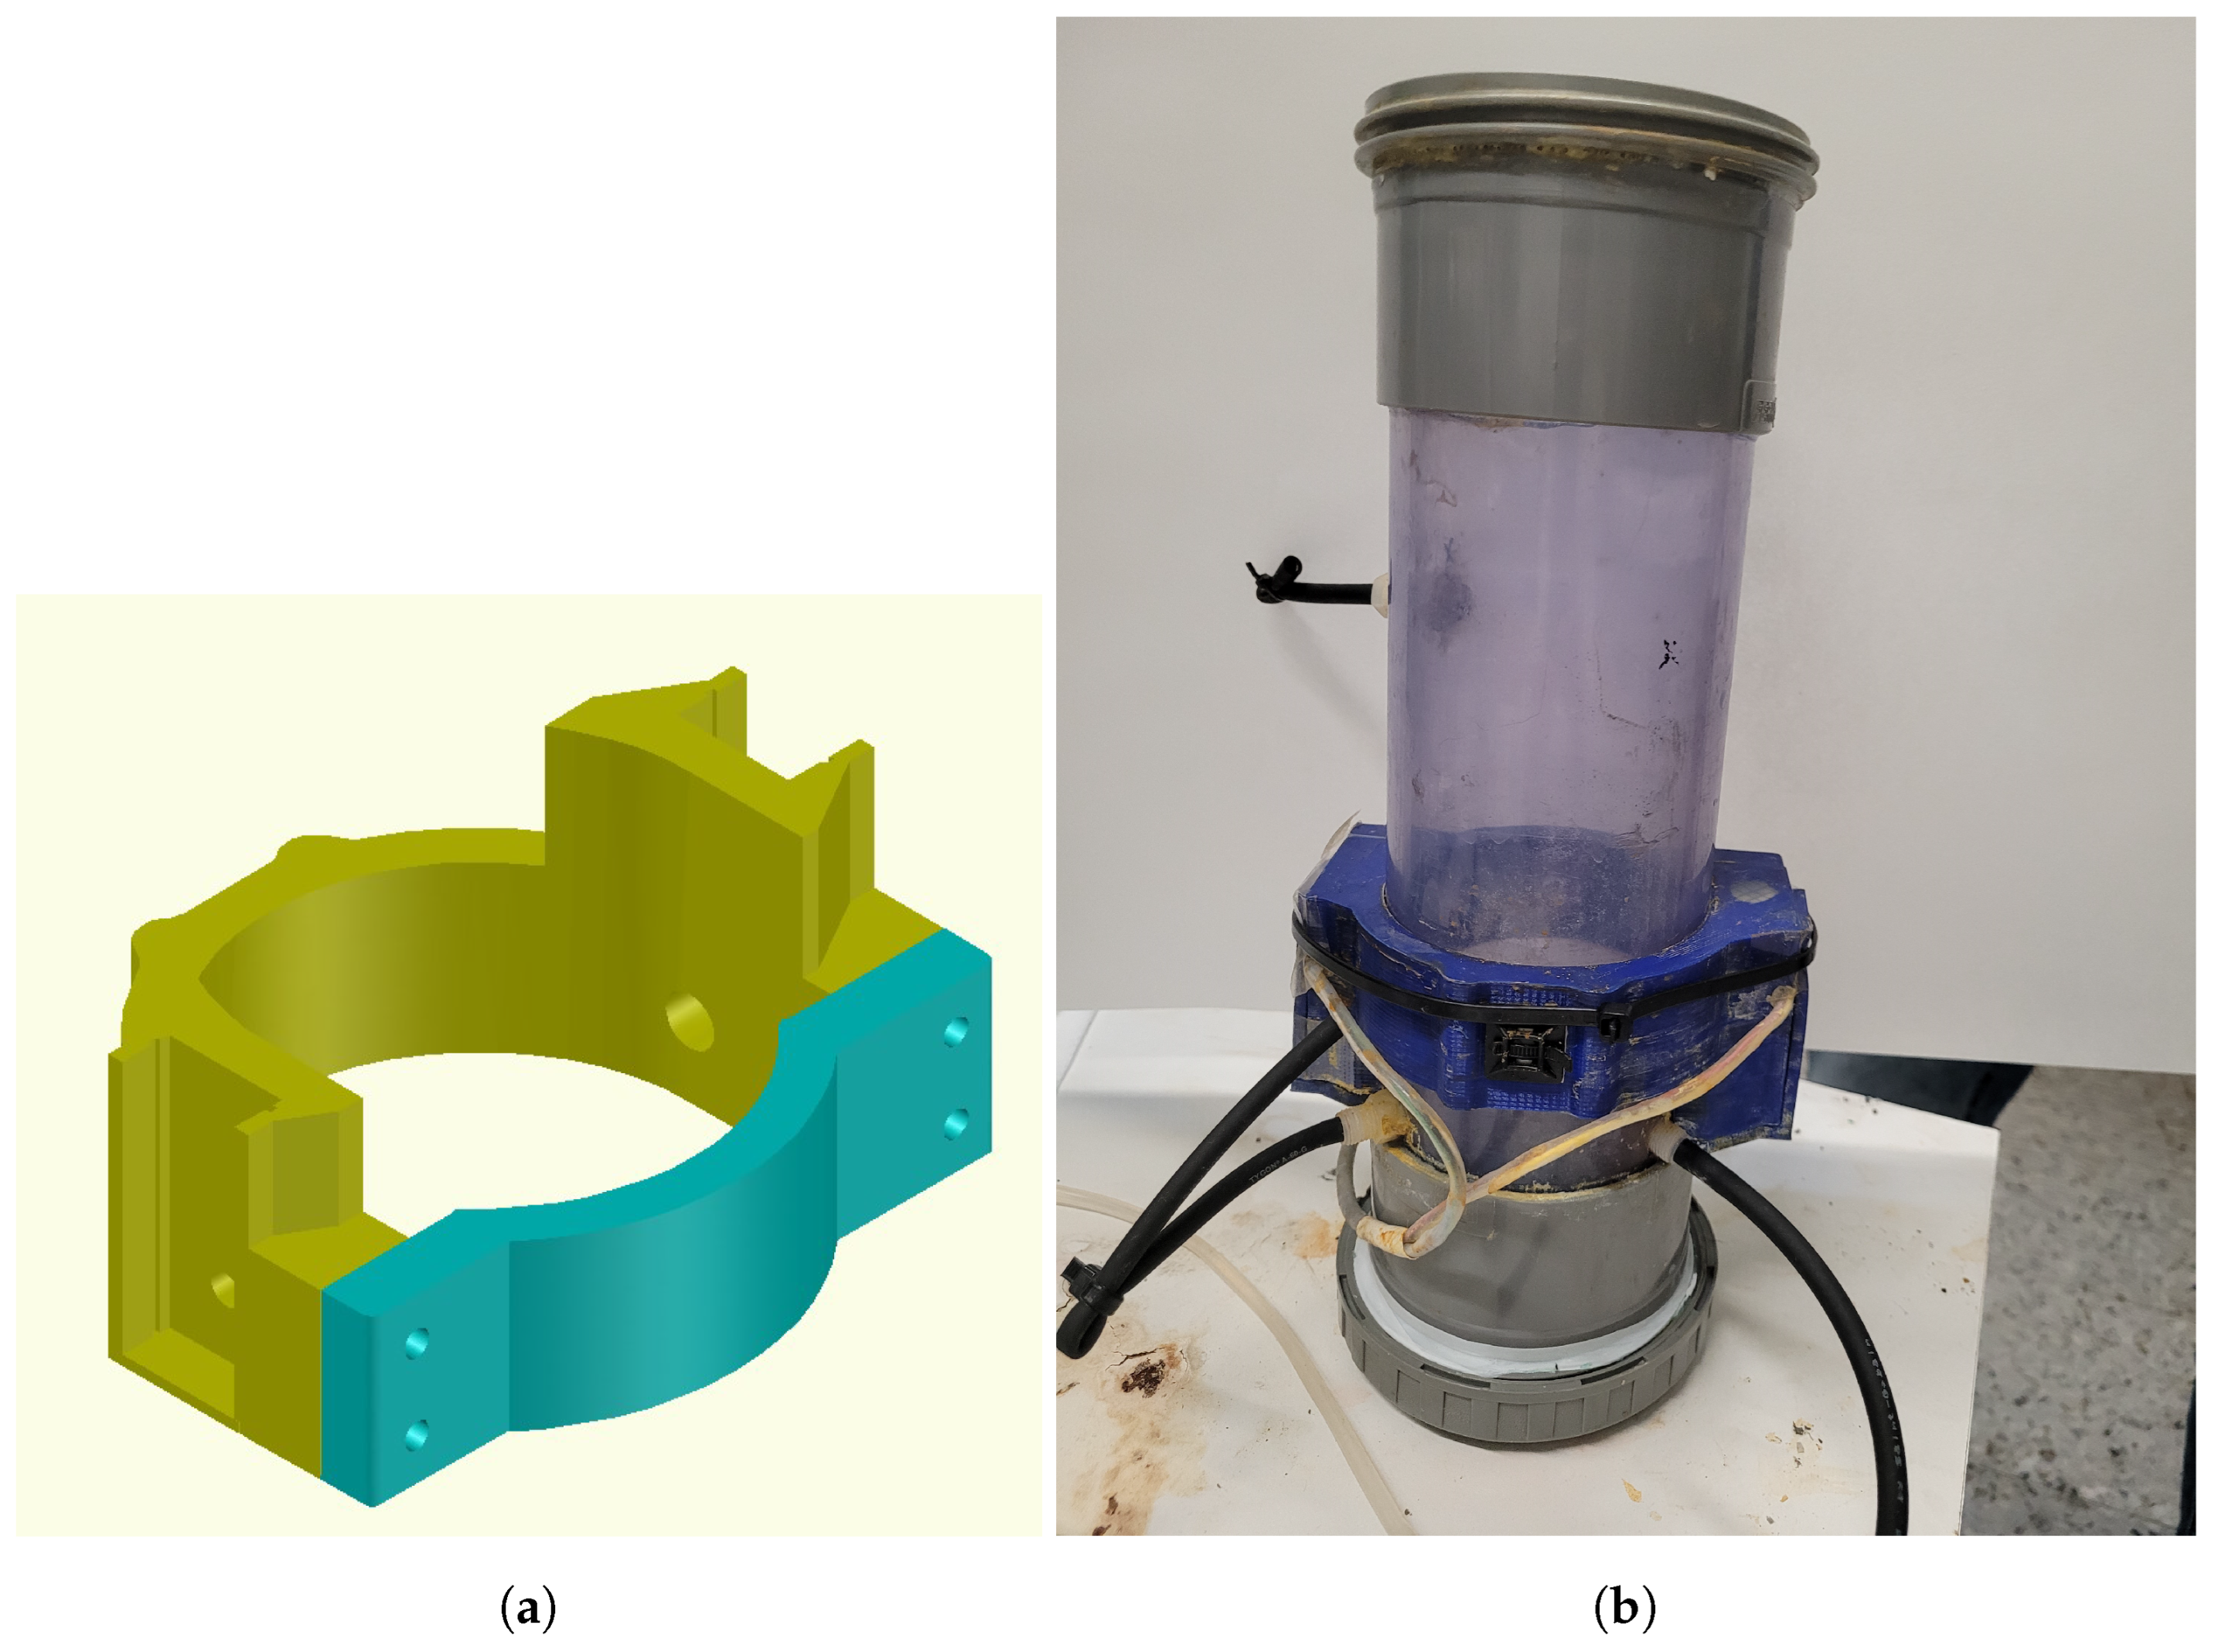
2.2. Developed Measurement System
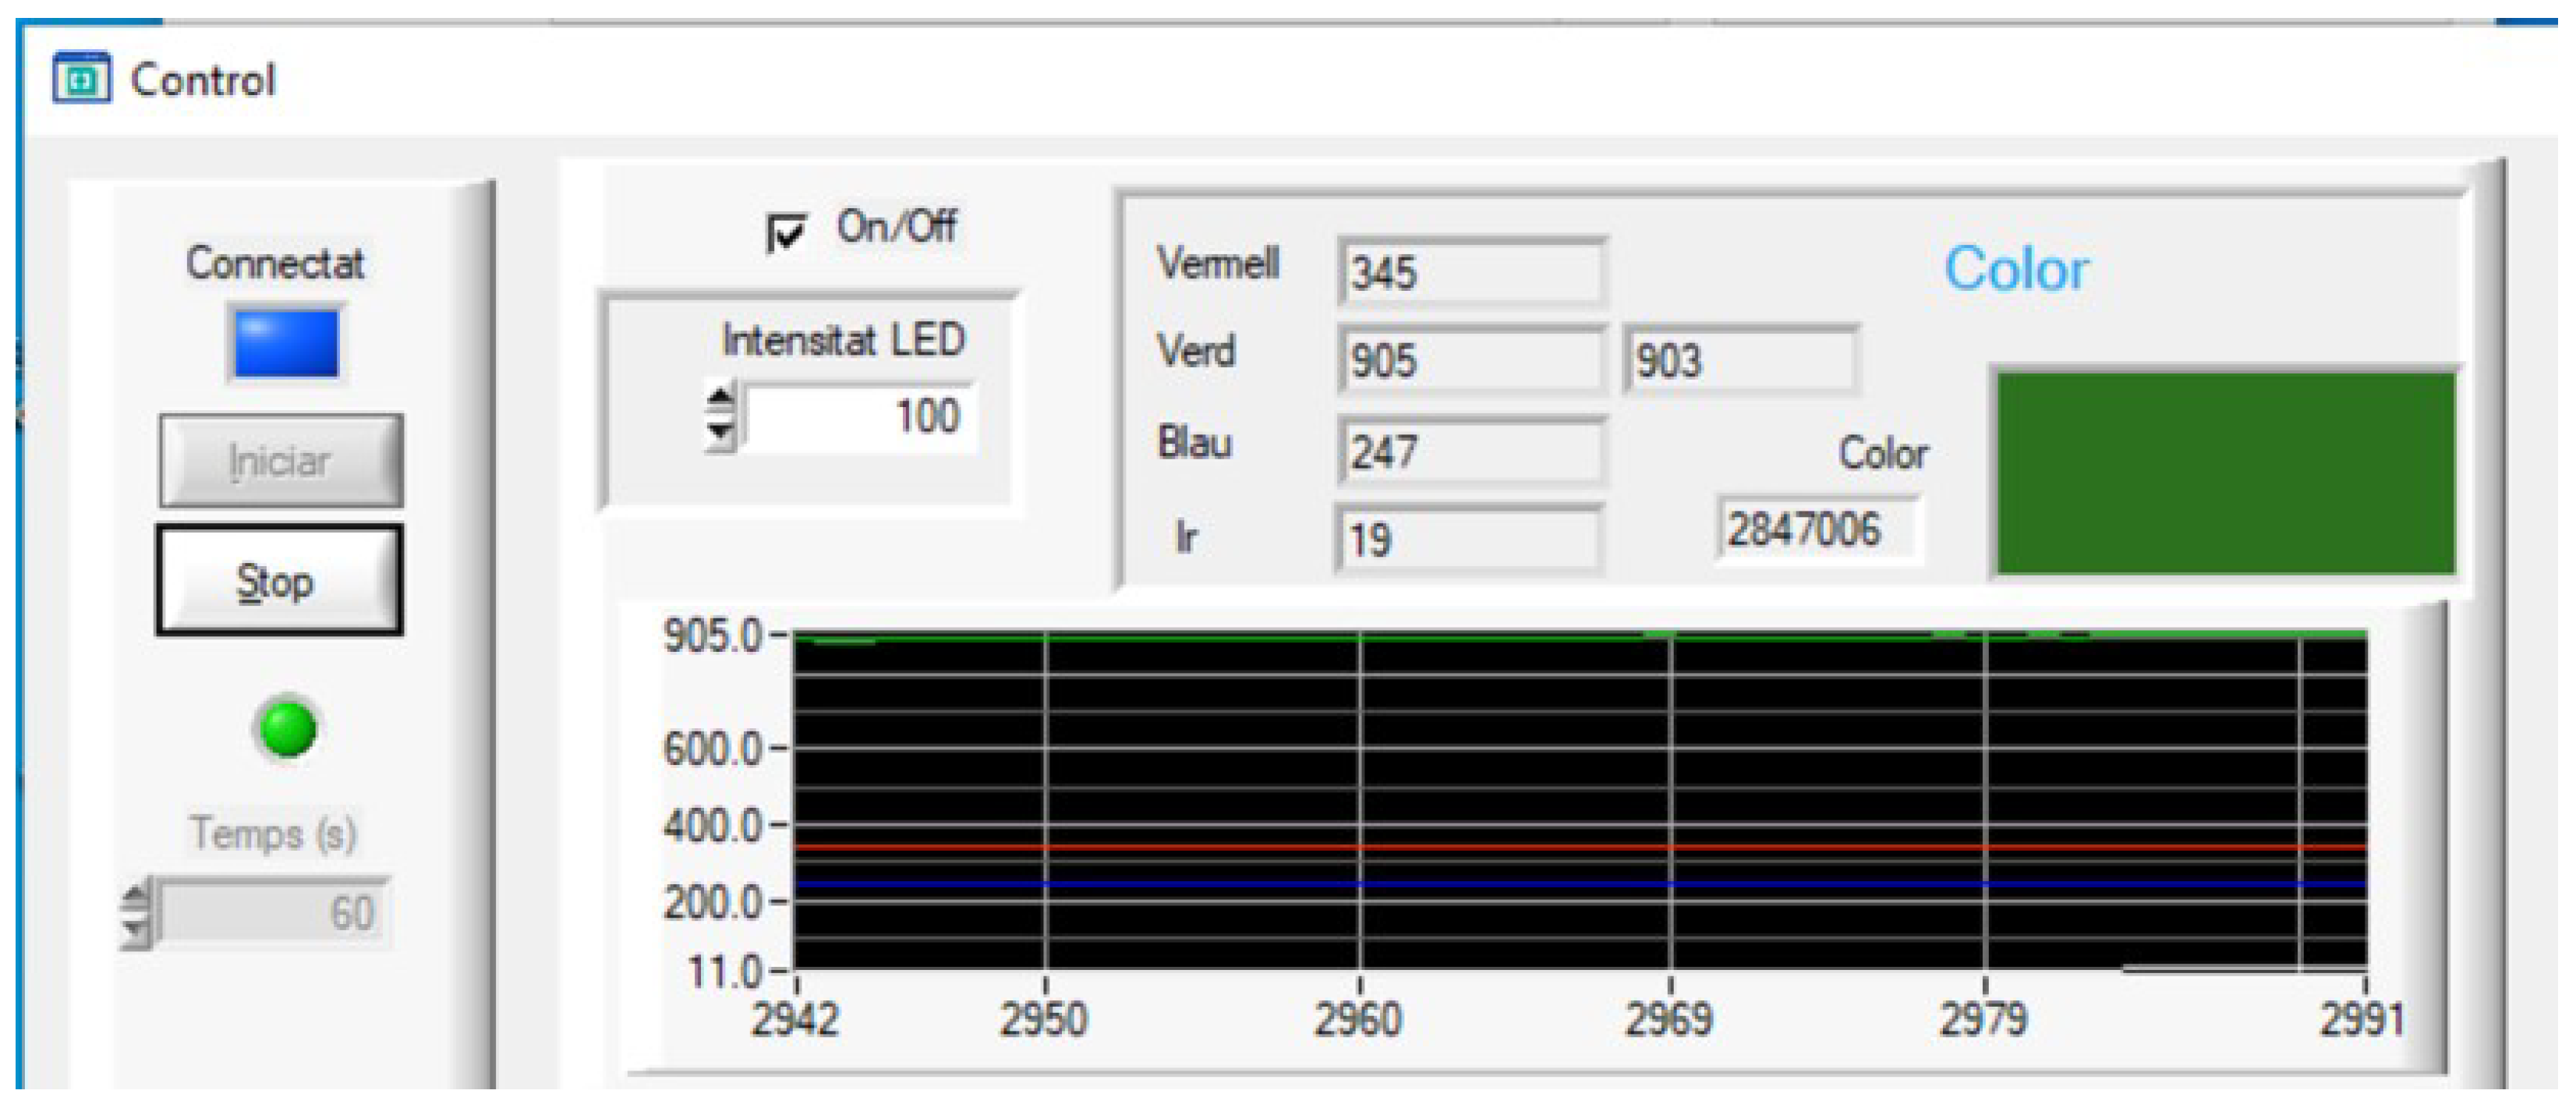
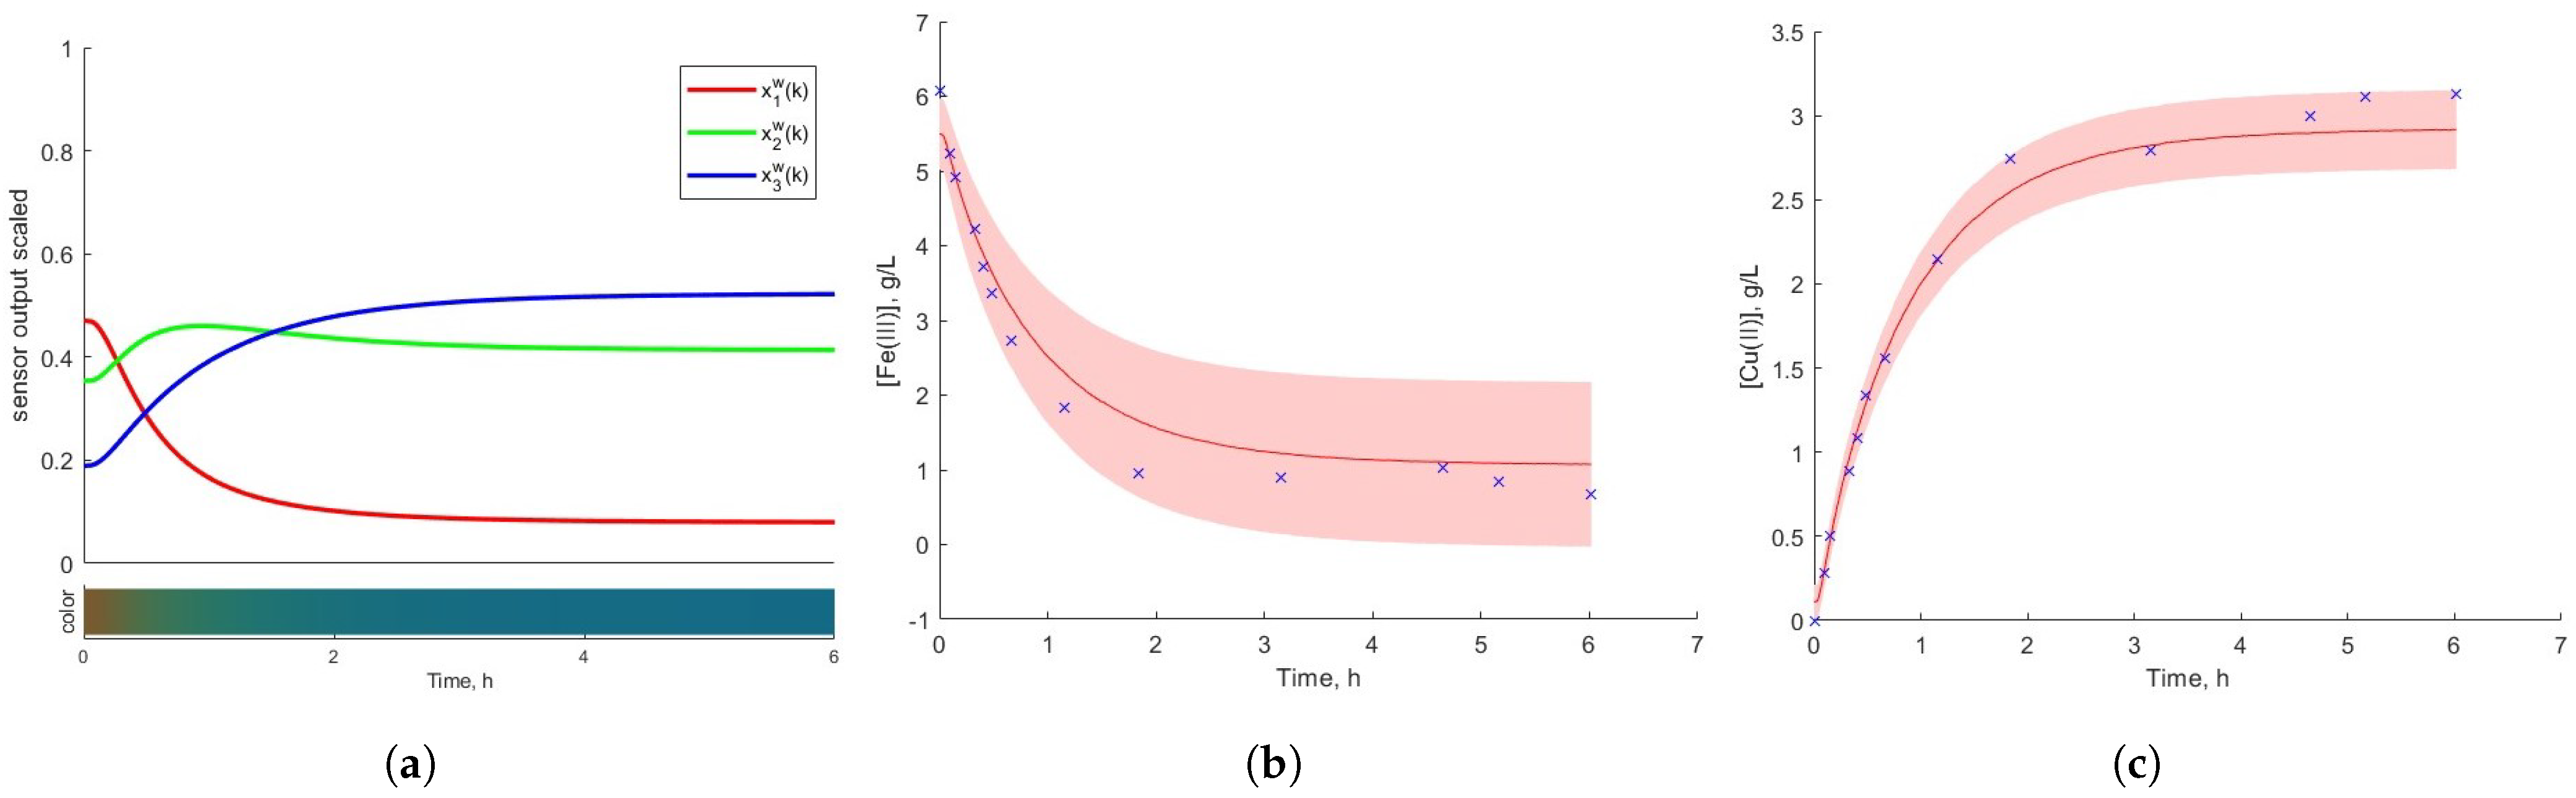
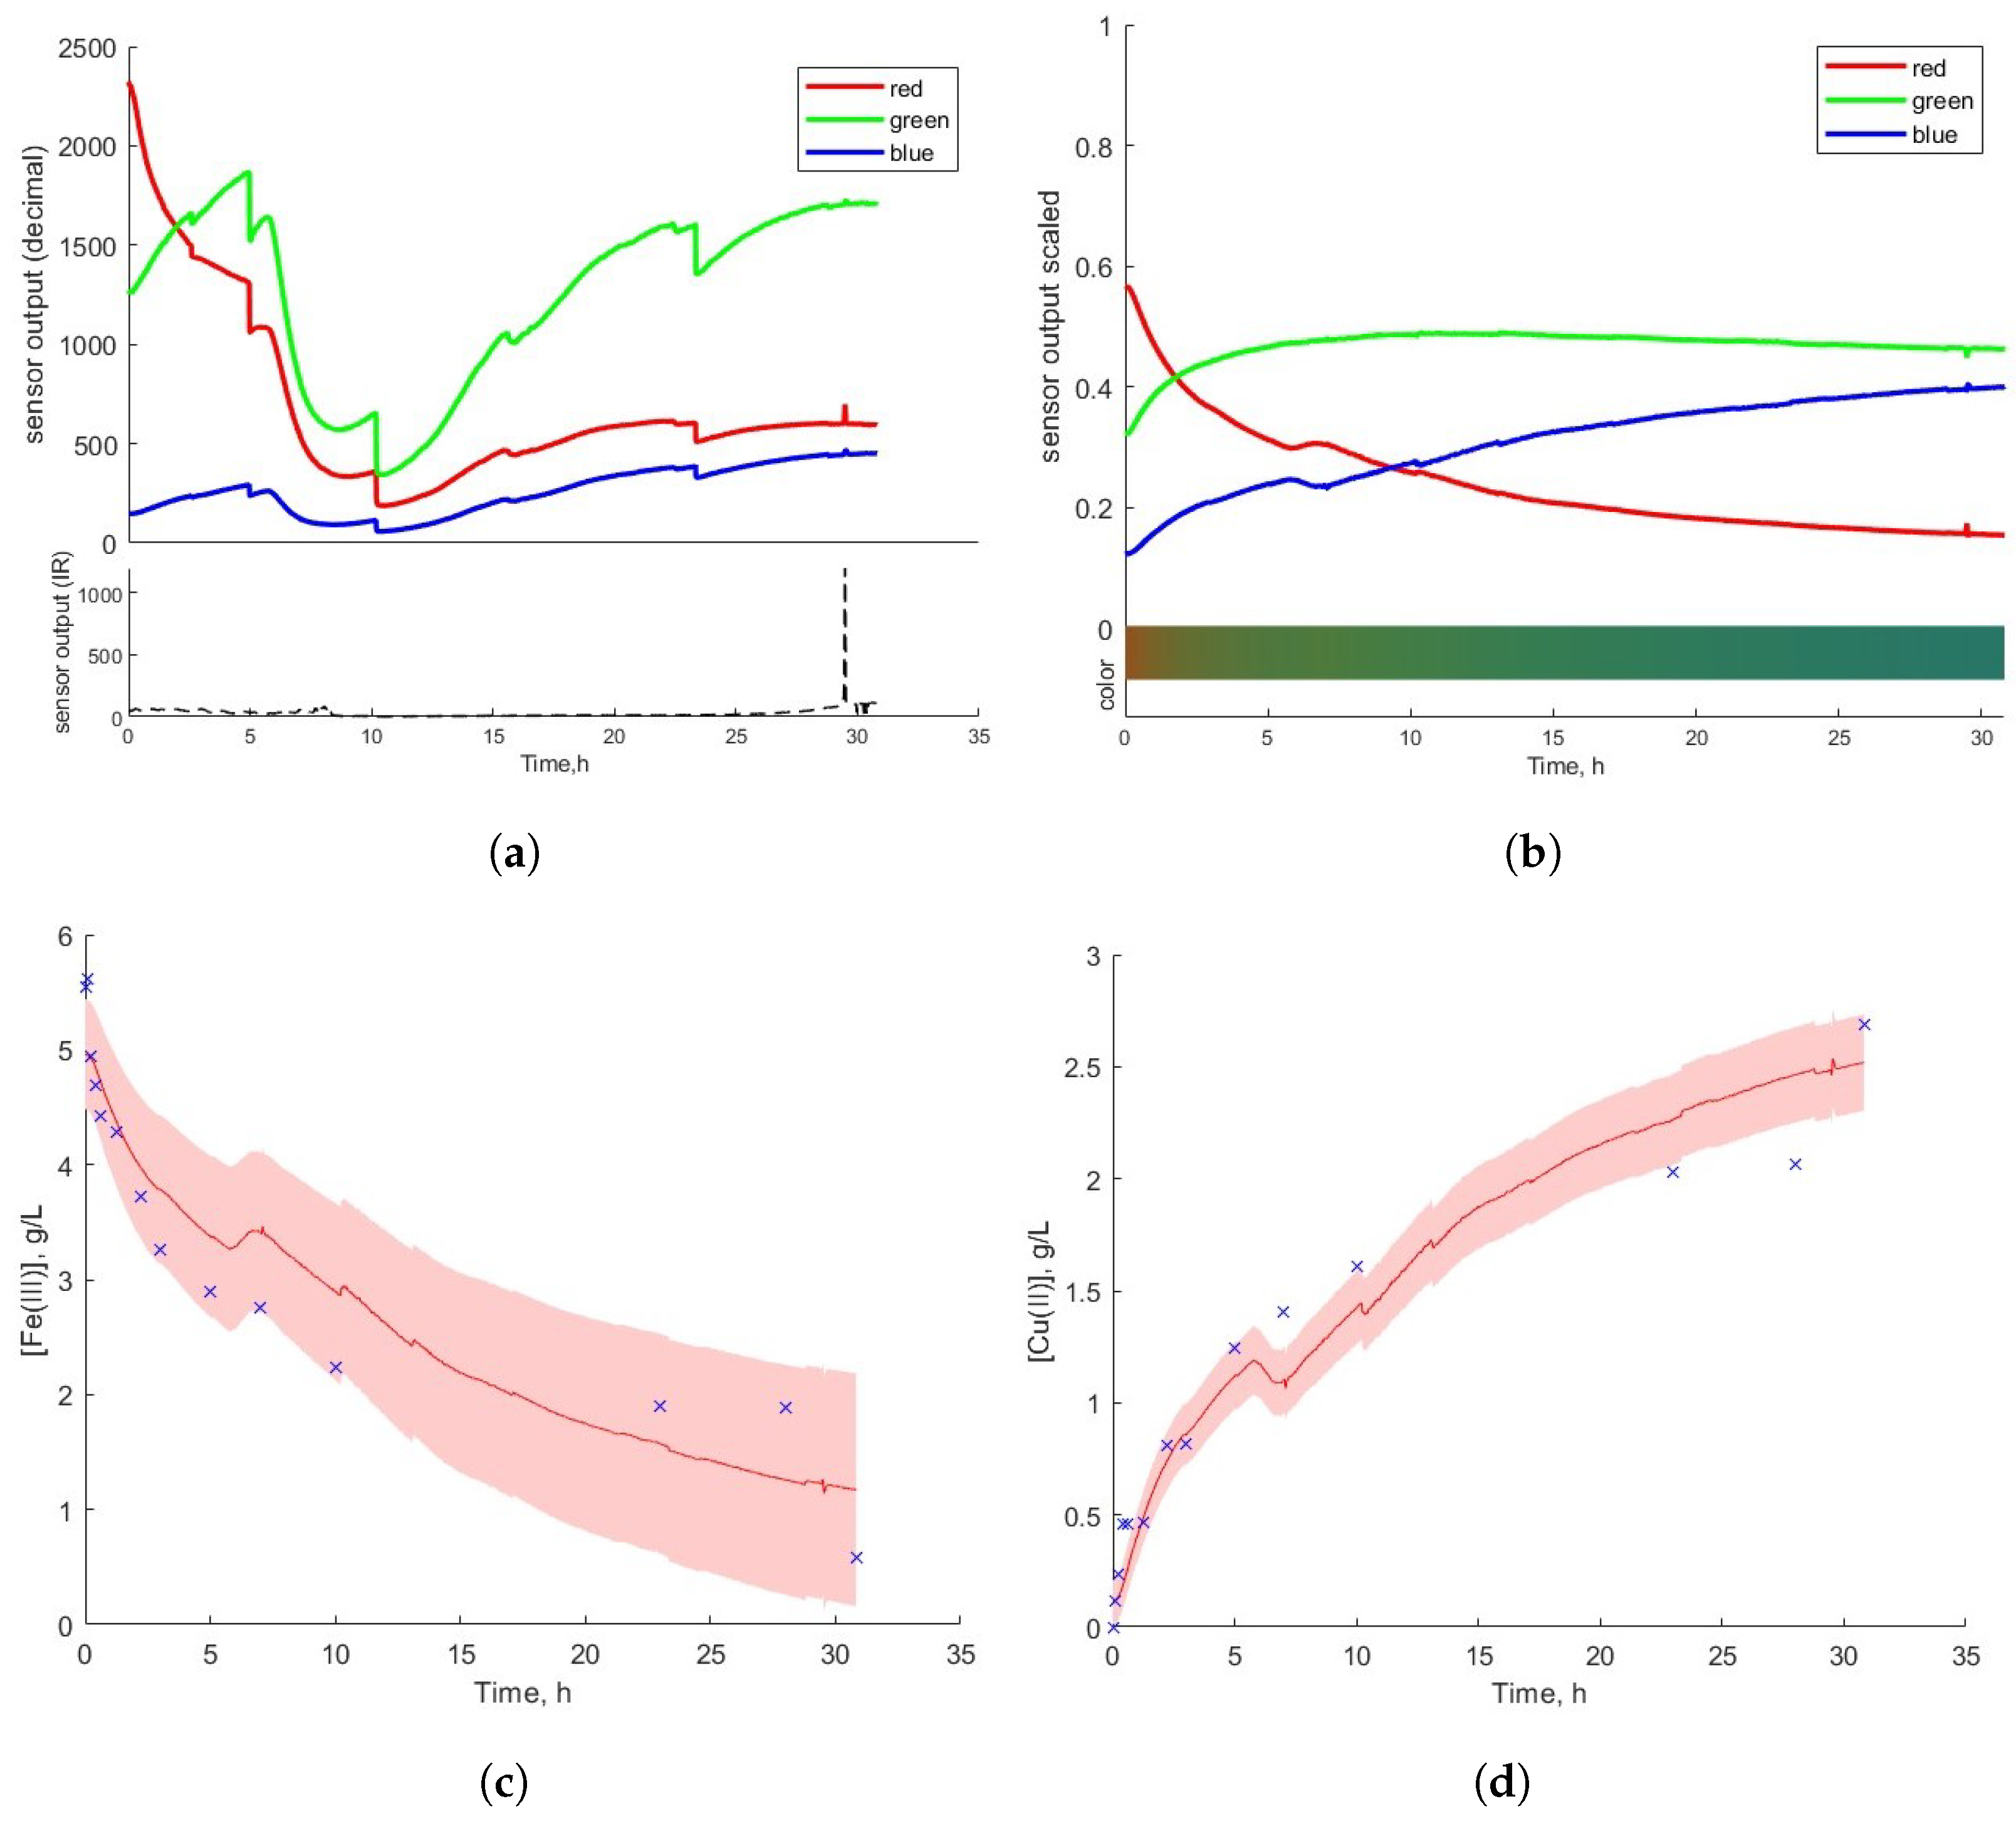
Data Acquisition and Control System
| Algorithm 1 Data acquisition and data processing |
|
2.3. Sensor Calibration and Color Reproducing
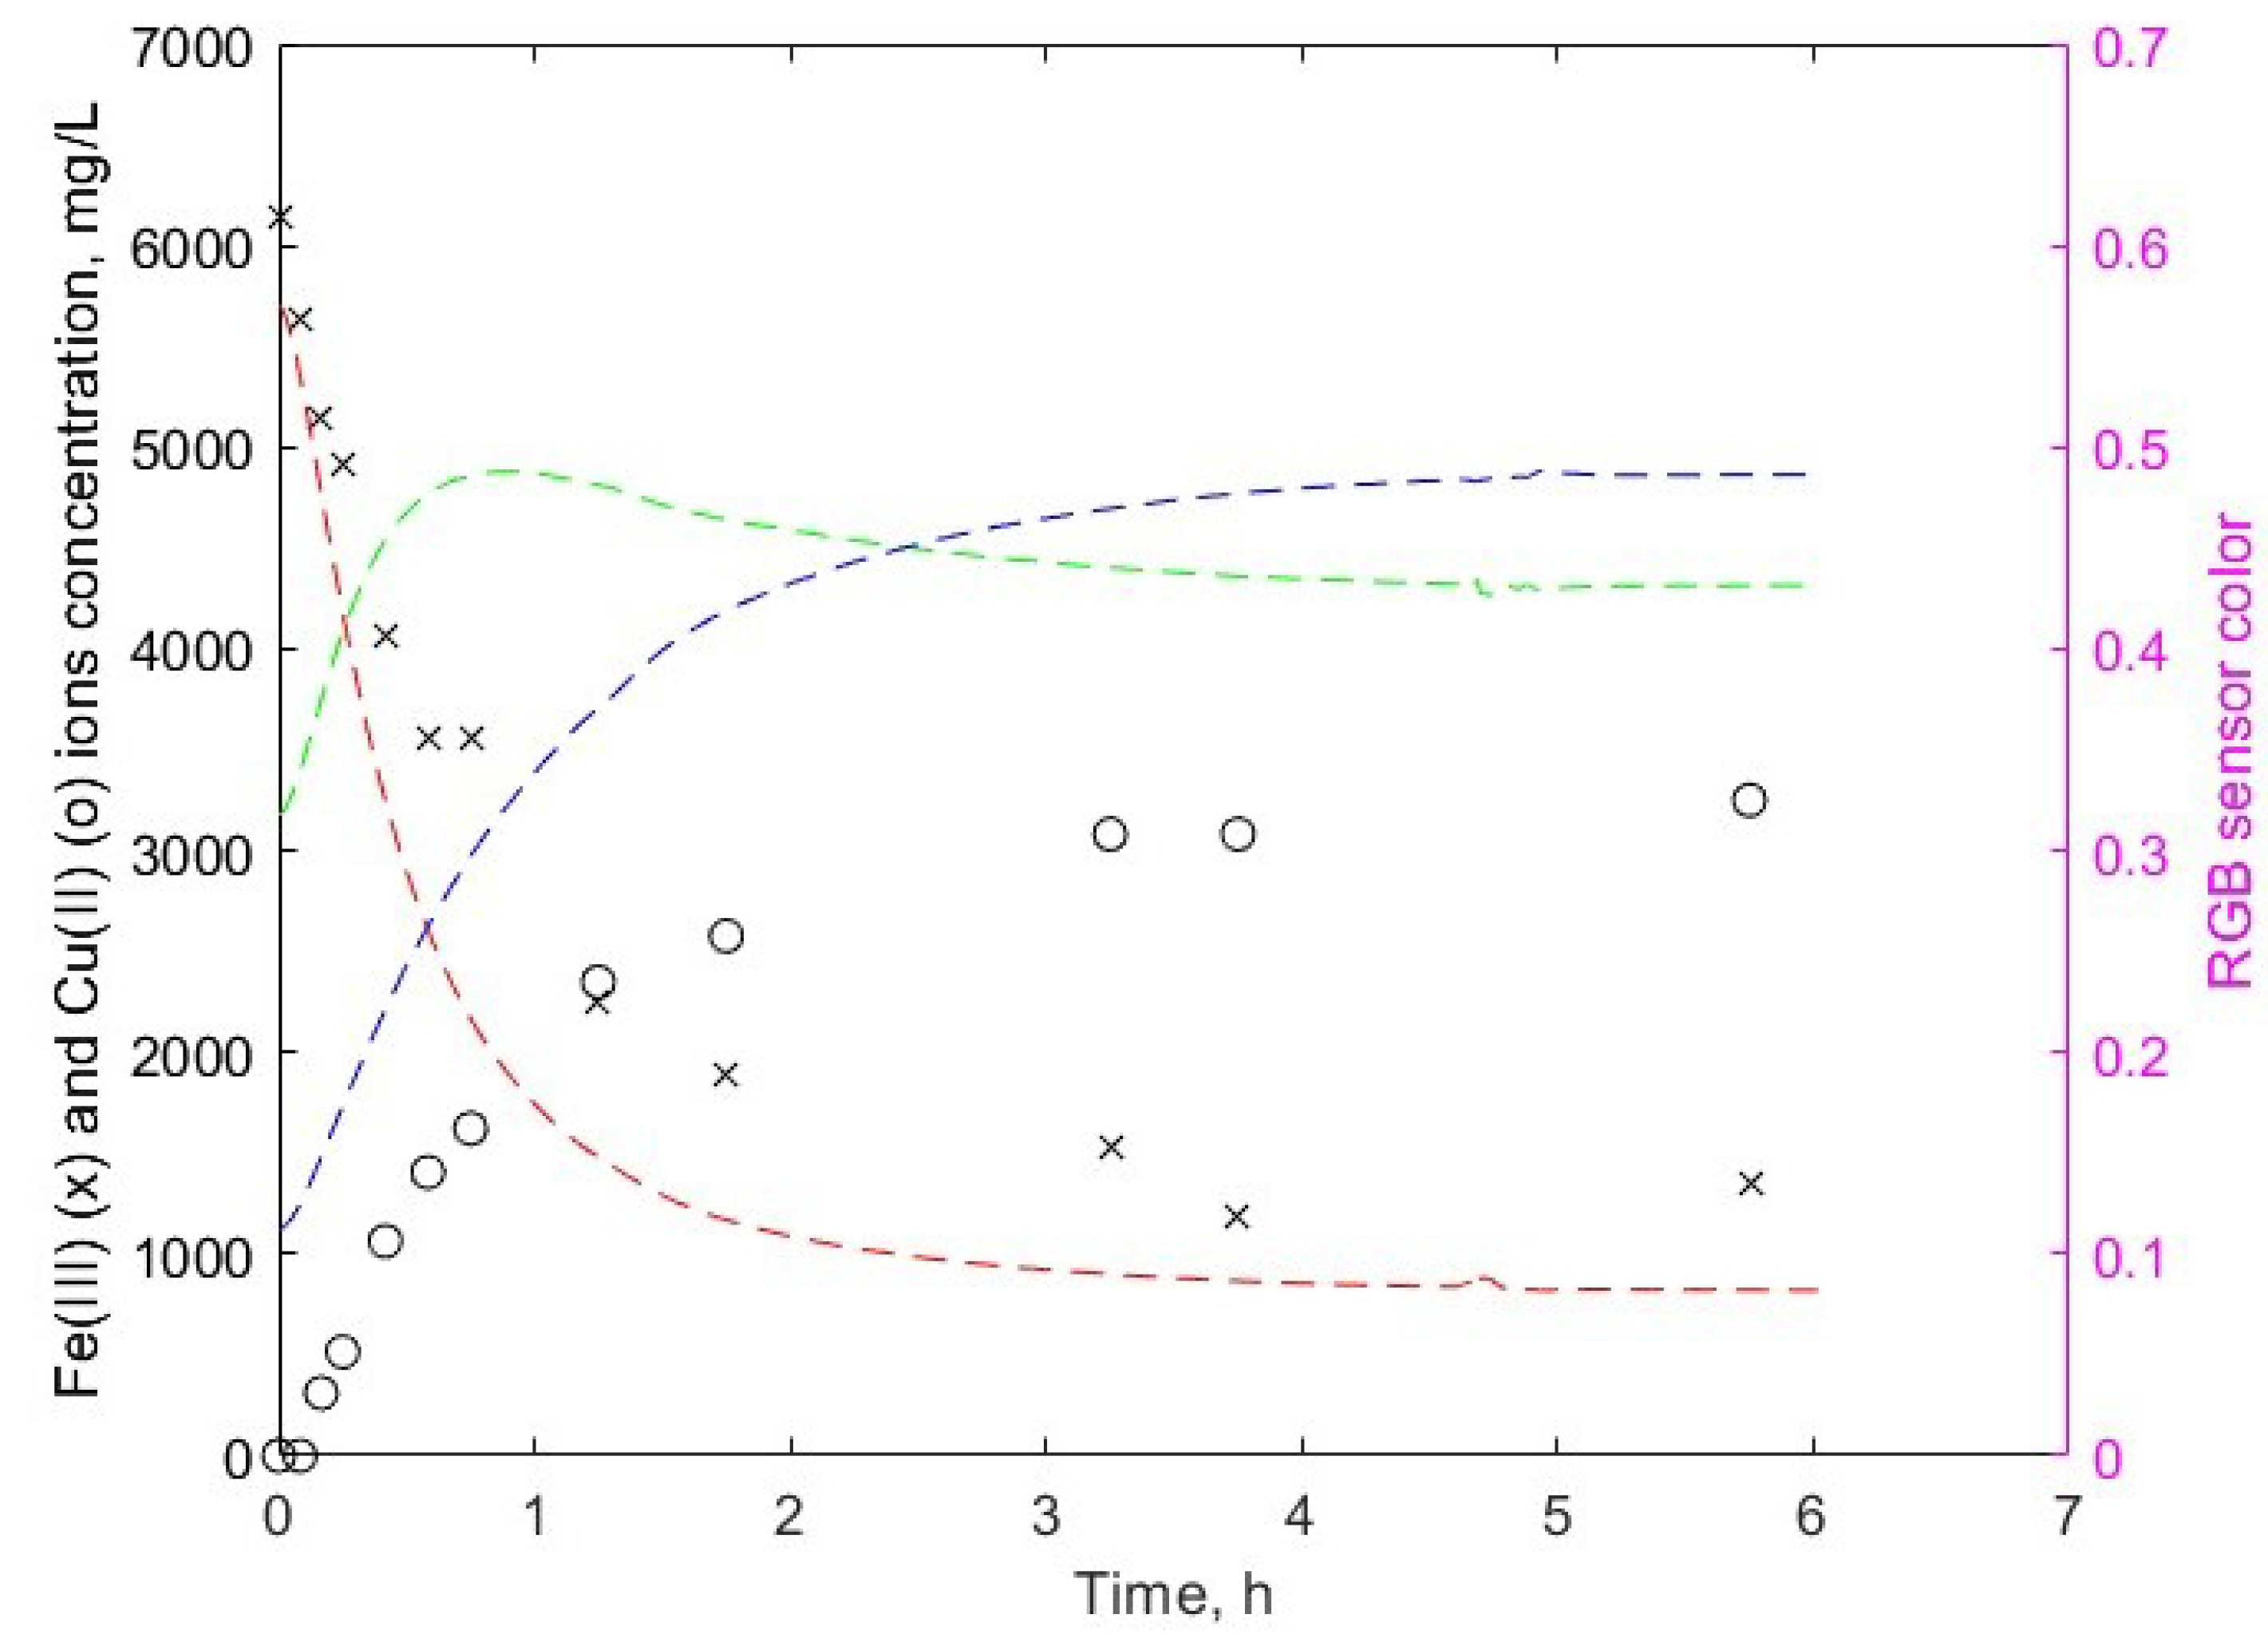
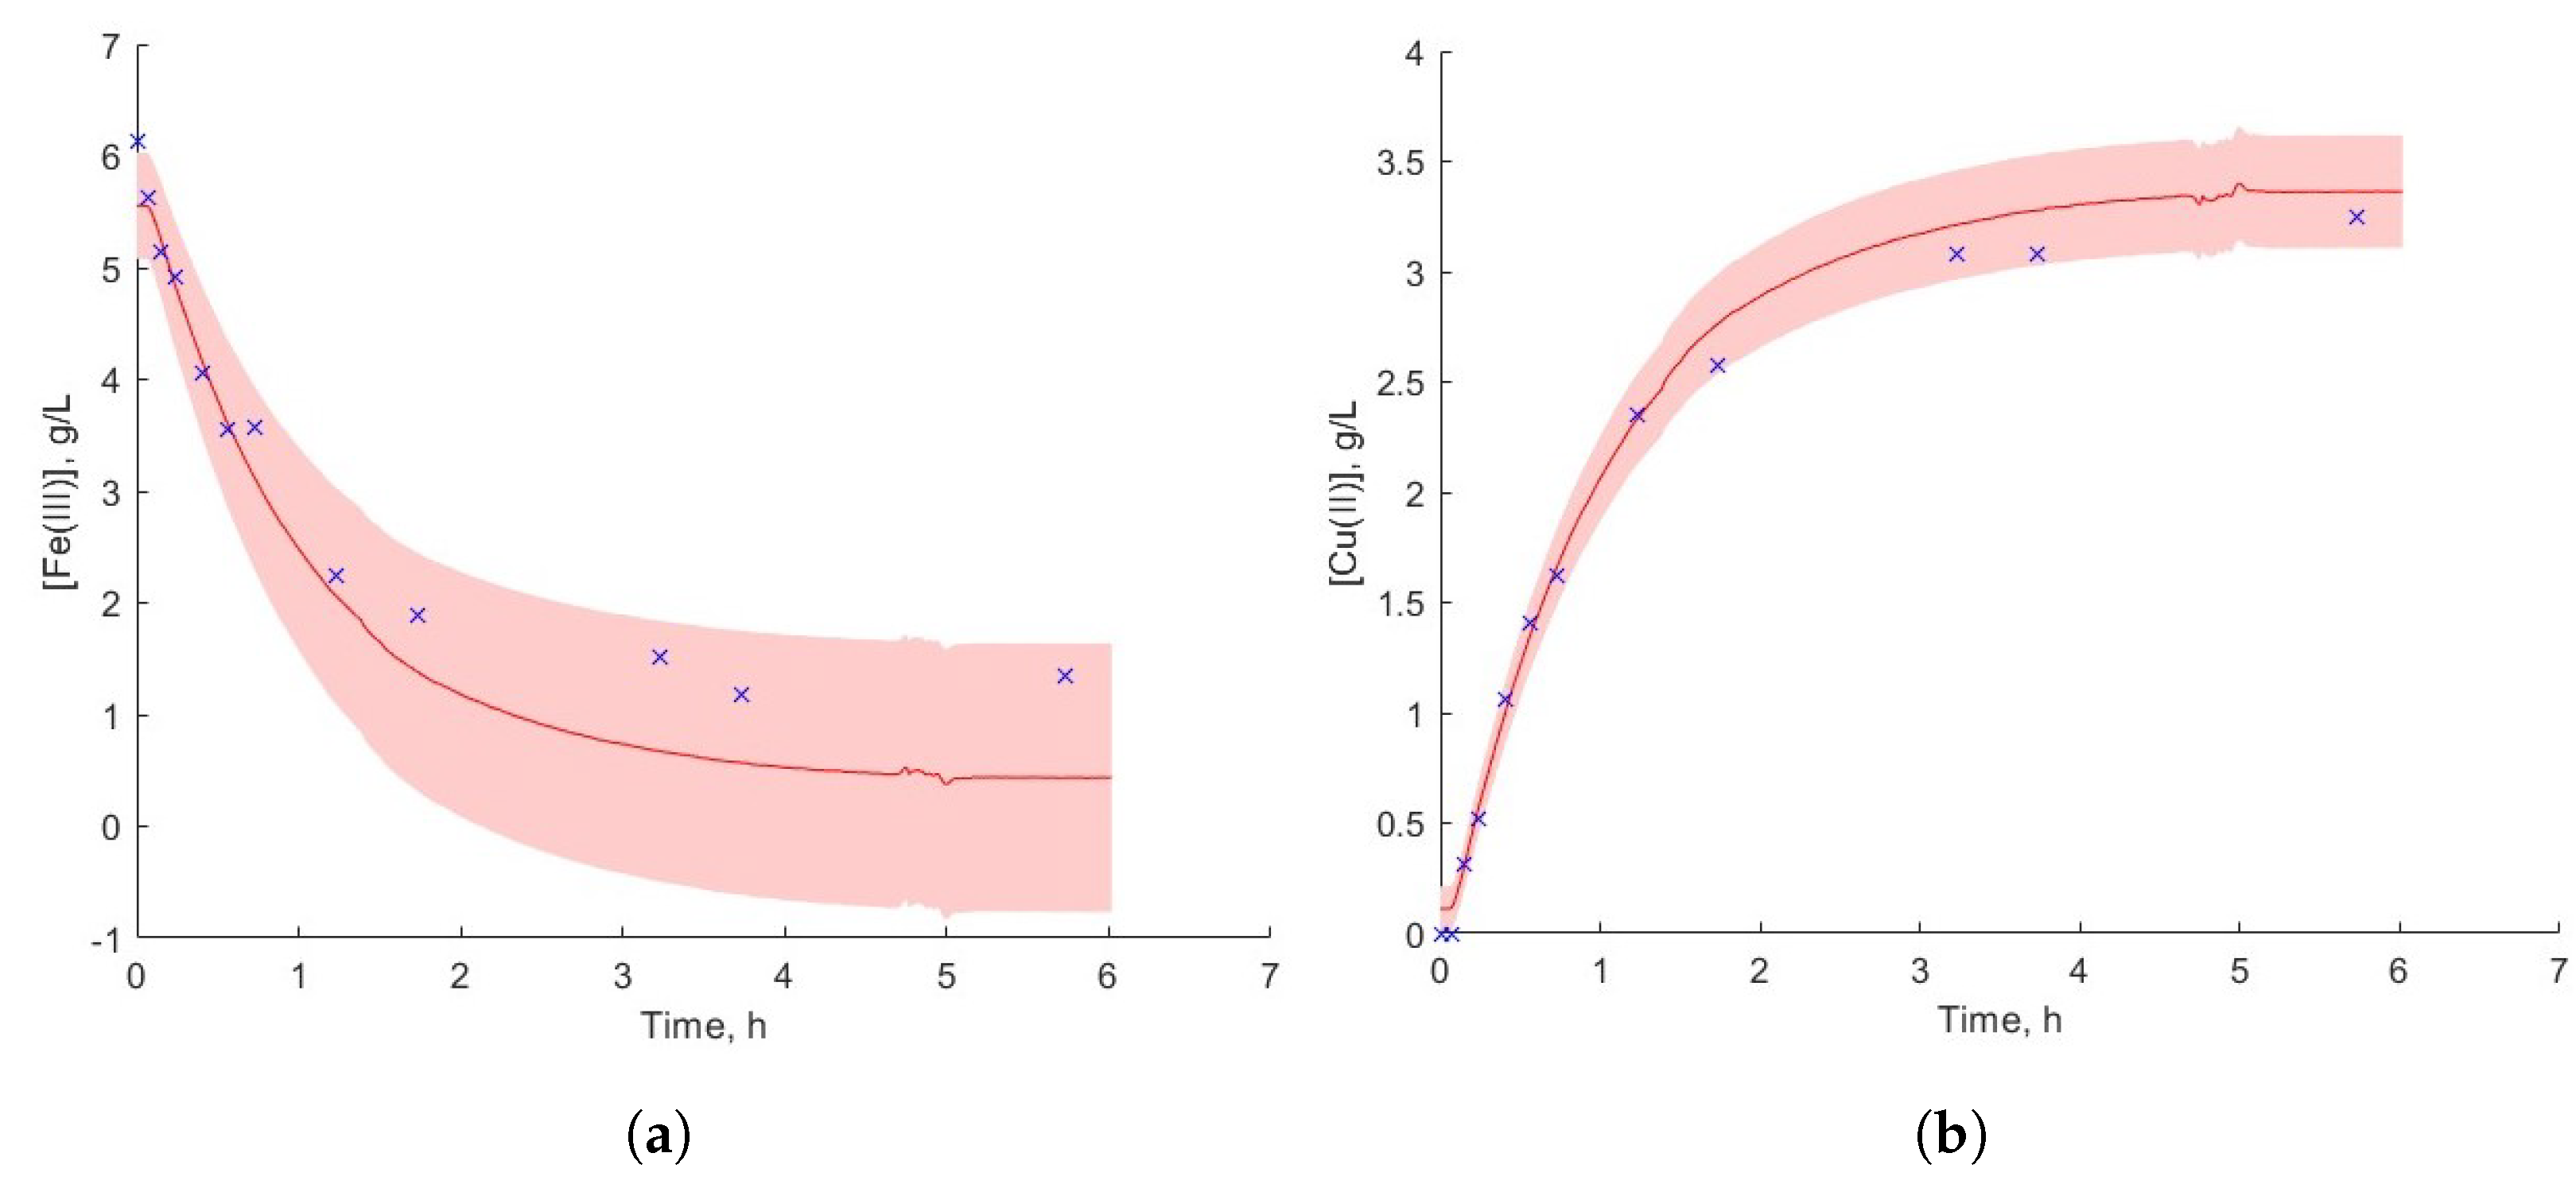
2.4. Sensor Response Related Fe(III) and Cu(II) Ions Concentration
3. Results
3.1. Copper Percentage of PB and EC
3.2. Correlation Analysis and Estimation of the Regressor Coefficients
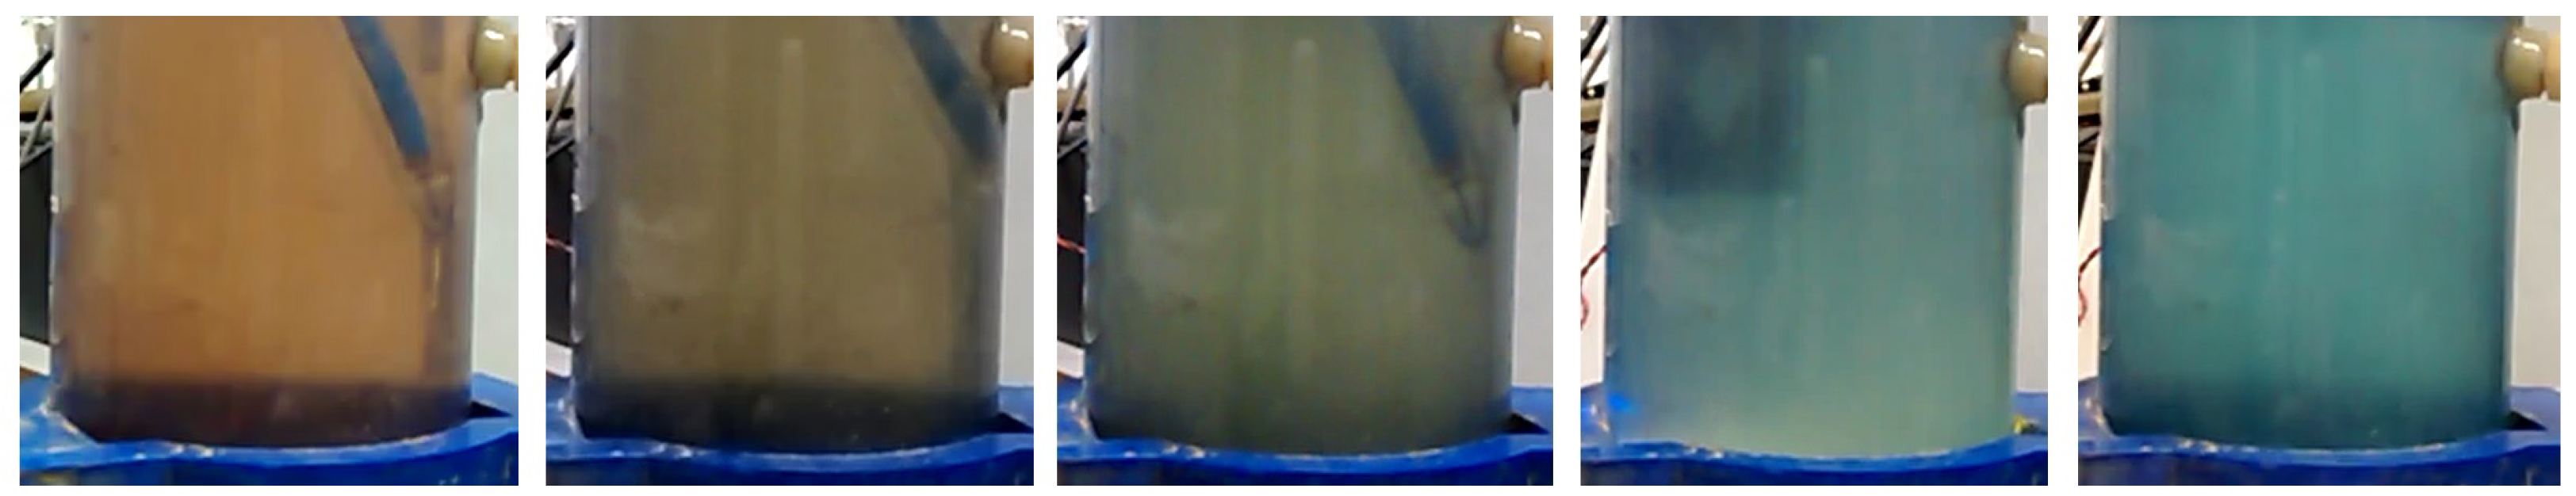
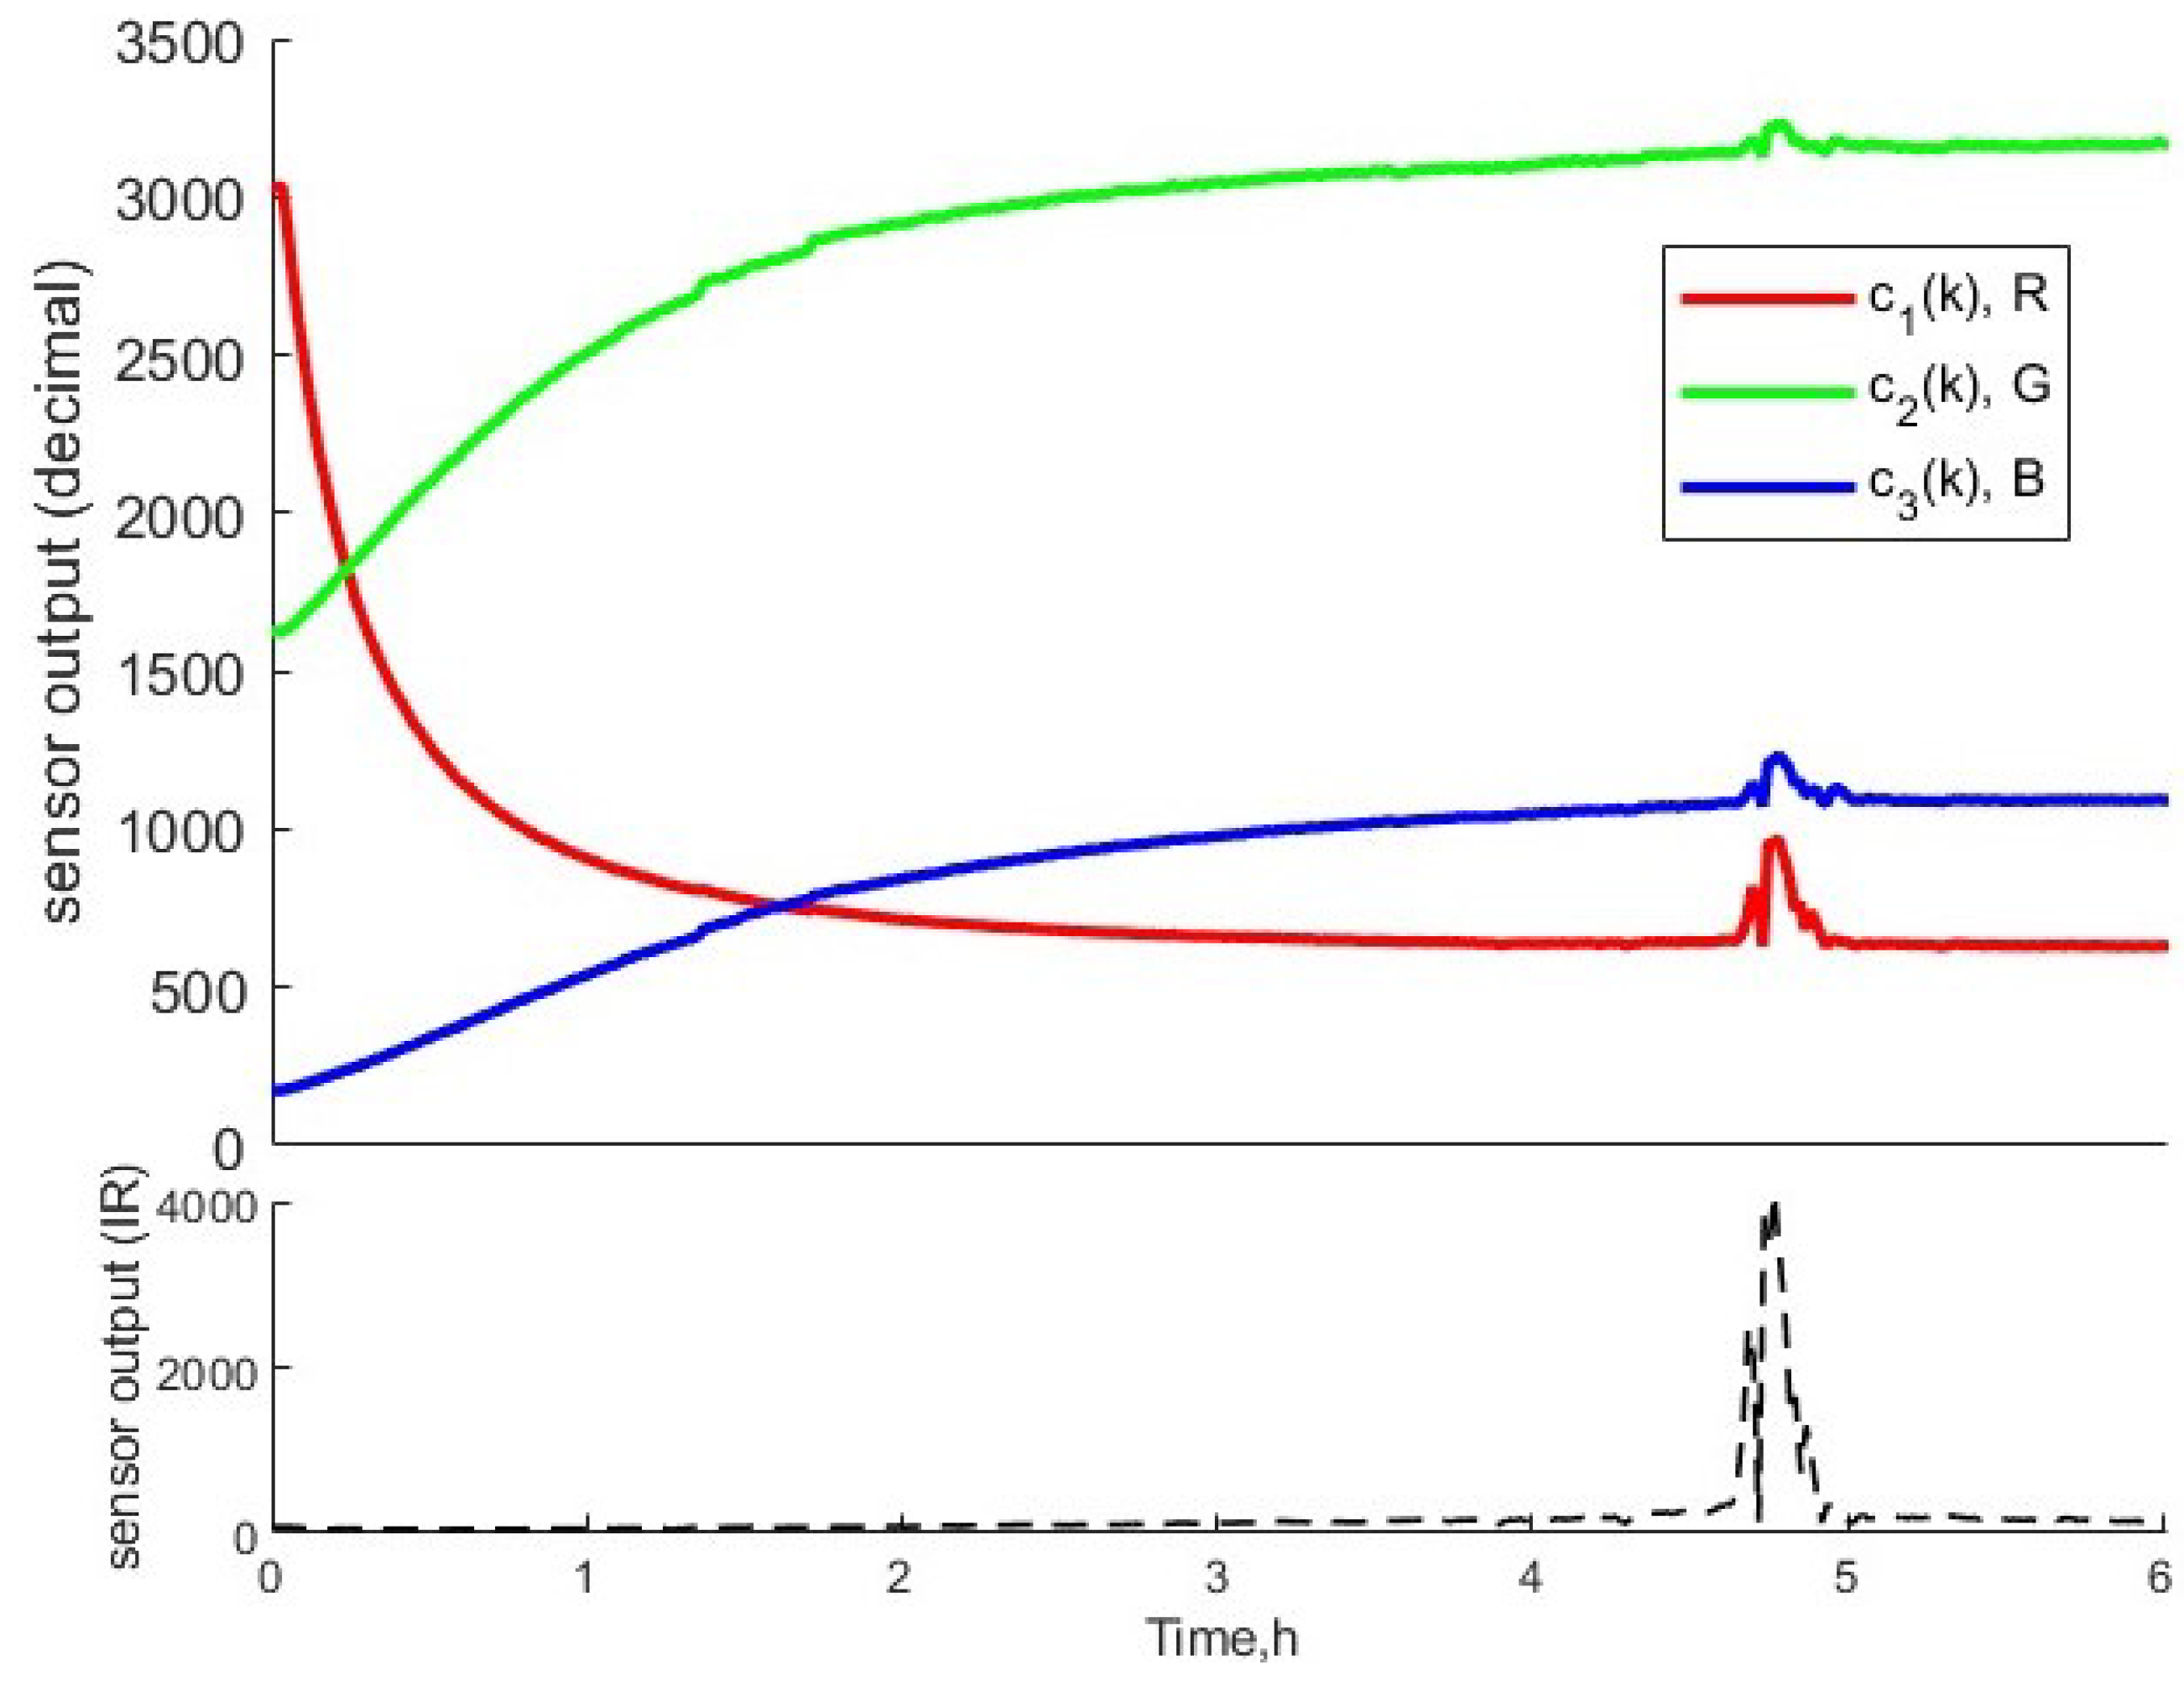
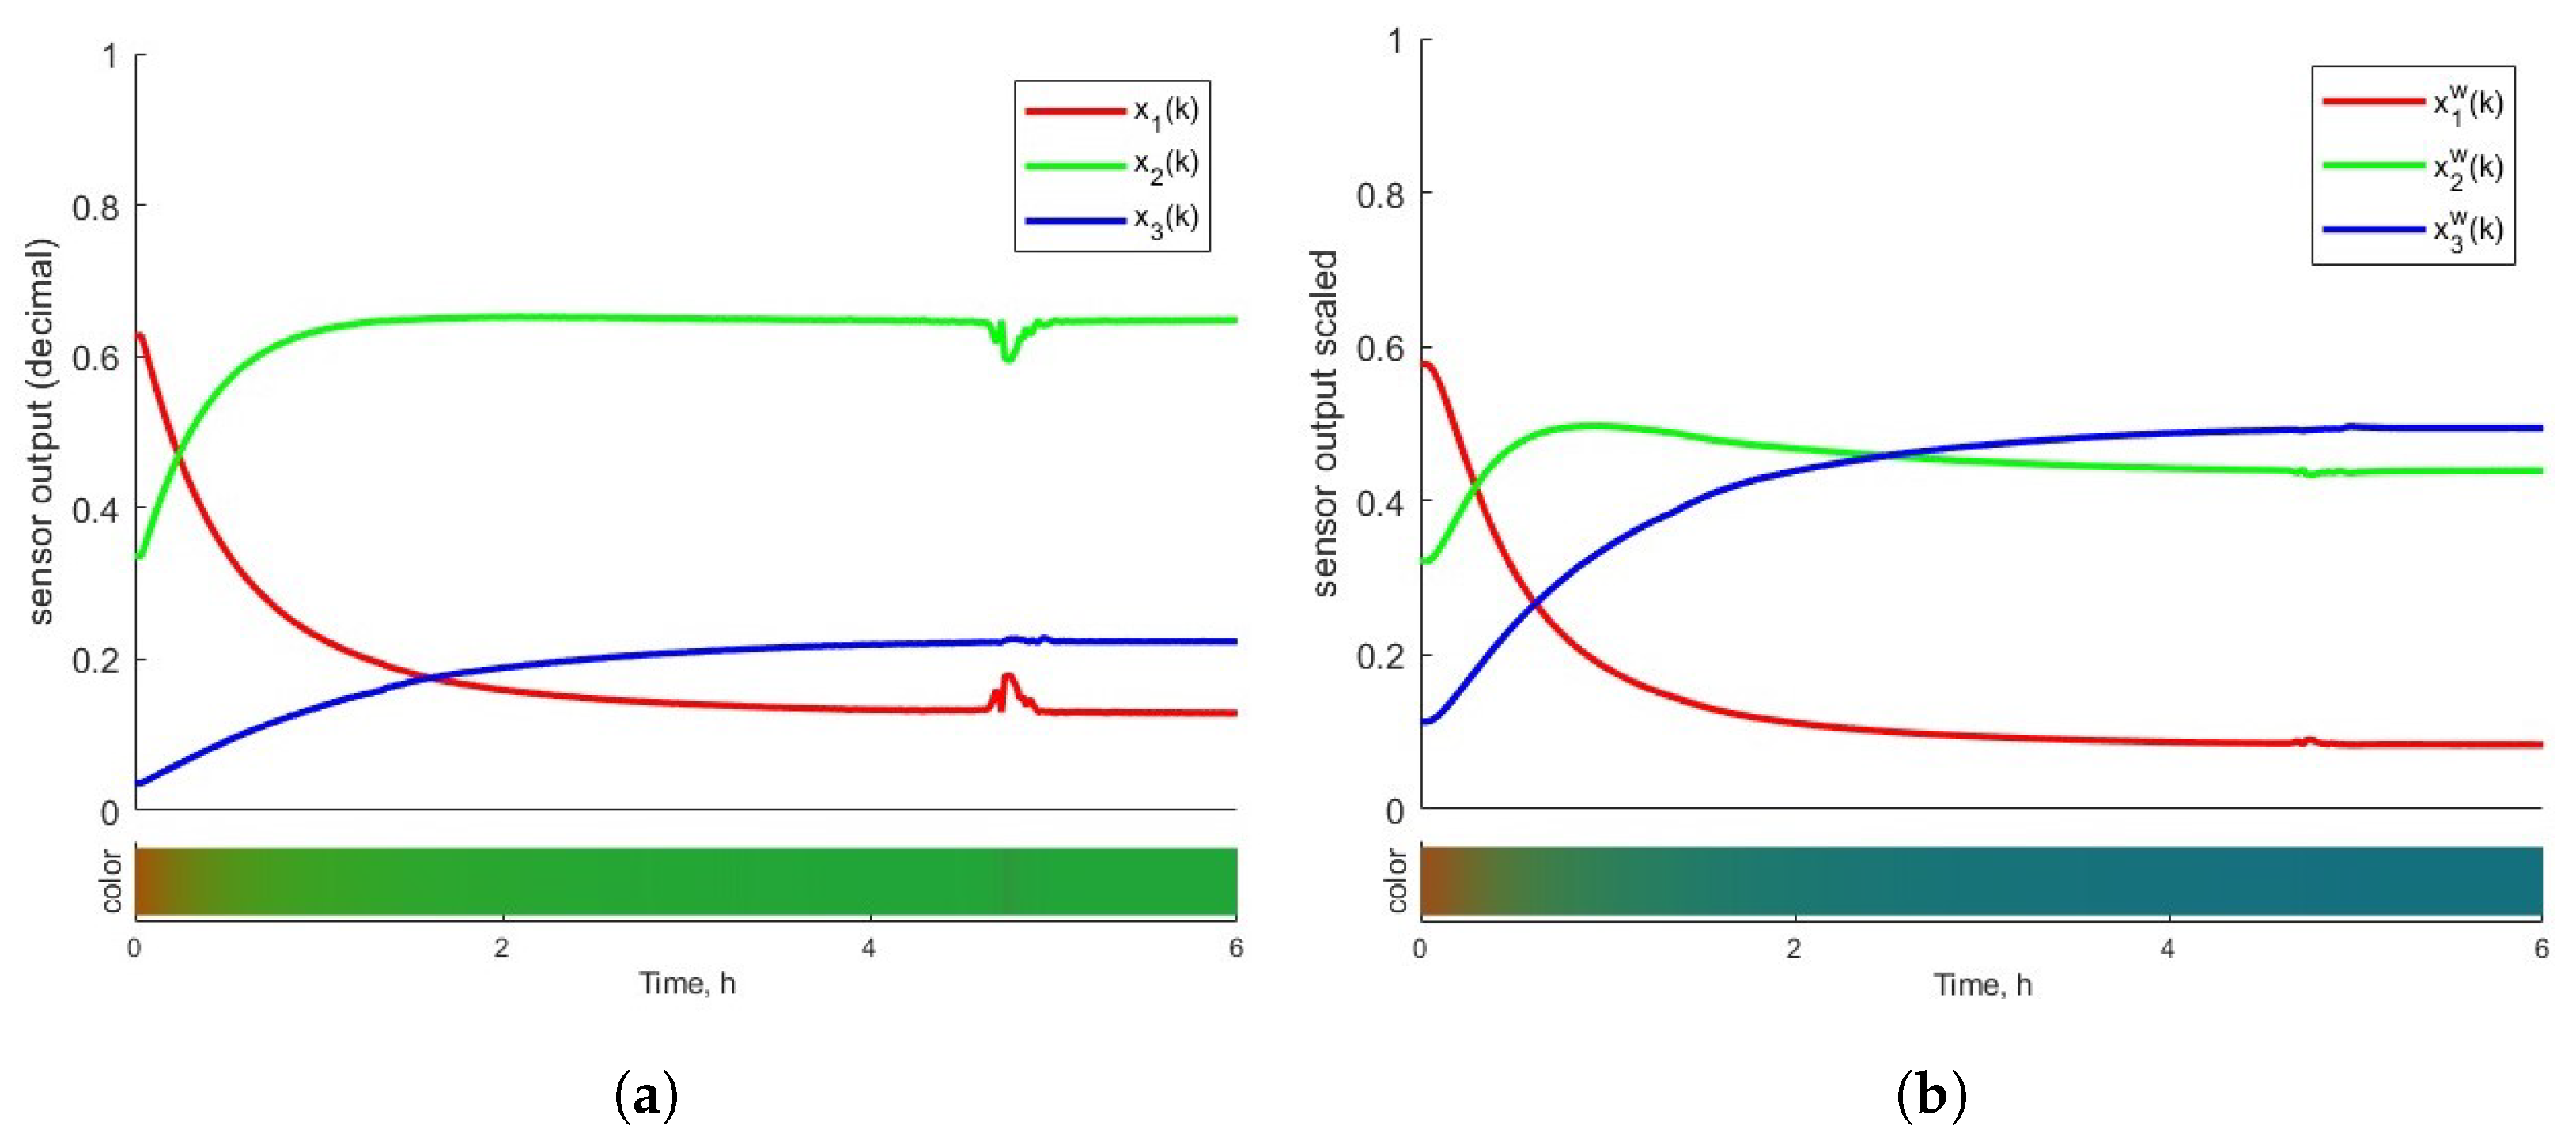
3.3. Sensor Behavior in the Presence of e-Waste
4. Discussion and Conclusions
Author Contributions
Funding
Data Availability Statement
Conflicts of Interest
Abbreviations
| EC | Electrical cable |
| I2C | Iter-Integrated Circuit |
| IR | Infrared |
| LED | Light-emitting diode |
| LIB | Lithium batteries |
| LS | Least square |
| PB | Phone boards |
| PCB | Printed circuit boards |
| RGB | Red, Green, Blue |
| SSE | Sum of the square error |
| TIA | Transimpedance gain amplifier |
| UV–Vis | Ultraviolet-visible |
| WMP | Waste mobile phone |
References
- Forti, V.; Balde, C.P.; Kuehr, R.; Bel, G. The Global E-Waste Monitor 2020: Quantities, Flows and the Circular Economy Potential; United Nations University (UNU)/United Nations Institute for Training and Research (UNITAR)-co-hosted SCYCLE Programme: Bonn, Germany; International Telecommunication Union (ITU): Geneva, Switzerland; International Solid Waste Association (ISWA): Rotterdam, The Netherlands, 2020. [Google Scholar]
- Wu, C.; Awasthi, A.K.; Qin, W.; Liu, W.; Yang, C. Recycling value materials from waste PCBs focus on electronic components: A review on technologies, obstruction and prospects. J. Environ. Chem. Eng. 2022, 10, 108516. [Google Scholar] [CrossRef]
- Murthy, V.; Ramakrishna, S. A Review on Global E-Waste Management: Urban Mining towards a Sustainable Future and Circular Economy. Sustainability 2022, 14, 647. [Google Scholar] [CrossRef]
- Liu, C.; Lin, J.; Cao, H.; Zhang, Y.; Sun, Z. Recycling of spent lithium-ion batteries in view of lithium recovery: A critical review. J. Clean. Prod. 2019, 228, 801–813. [Google Scholar] [CrossRef]
- Welfens, M.J.; Nordmann, J.; Seibt, A. Drivers and barriers to return and recycling of mobile phones. Case studies of communication and collection campaigns. J. Clean. Prod. 2016, 132, 108–121. [Google Scholar] [CrossRef]
- Gu, F.; Guo, J.; Yao, X.; Summers, P.A.; Widijatmoko, S.D.; Hall, P. An investigation of the current status of recycling spent lithium-ion batteries from consumer electronics in China. J. Clean. Prod. 2017, 161, 765–780. [Google Scholar] [CrossRef]
- Gu, F.; Summers, P.A.; Hall, P. Recovering materials from waste mobile phones: Recent technological developments. J. Clean. Prod. 2019, 237, 117657. [Google Scholar] [CrossRef]
- Singh, N.; Duan, H.; Yin, F.; Song, Q.; Li, J. Characterizing the materials composition and recovery potential from waste mobile phones: A comparative evaluation of cellular and smart phones. ACS Sustain. Chem. Eng. 2018, 6, 13016–13024. [Google Scholar] [CrossRef]
- Hao, J.; Wang, Y.; Wu, Y.; Guo, F. Metal recovery from waste printed circuit boards: A review for current status and perspectives. Resour. Conserv. Recycl. 2020, 157, 104787. [Google Scholar] [CrossRef]
- Singh, N.; Duan, H.; Ogunseitan, O.A.; Li, J.; Tang, Y. Toxicity trends in E-Waste: A comparative analysis of metals in discarded mobile phones. J. Hazard. Mater. 2019, 380, 120898. [Google Scholar] [CrossRef]
- Petkova, M. Weekly Data: Copper Demand Is Outrunning Supply. Available online: https://www.energymonitor.ai/tech/networks-grids/copper-demand-is-outrunning-supply (accessed on 3 October 2022).
- Krishnan, S.; Zulkapli, N.S.; Kamyab, H.; Taib, S.M.; Din, M.F.B.M.; Abd Majid, Z.; Chaiprapat, S.; Kenzo, I.; Ichikawa, Y.; Nasrullah, M.; et al. Current technologies for recovery of metals from industrial wastes: An overview. Environ. Technol. Innov. 2021, 22, 101525. [Google Scholar] [CrossRef]
- Fathima, A.; Tang, J.Y.B.; Giannis, A.; Ilankoon, I.; Chong, M.N. Catalysing electrowinning of copper from E-waste: A critical review. Chemosphere 2022, 298, 134340. [Google Scholar] [CrossRef] [PubMed]
- Rai, V.; Liu, D.; Xia, D.; Jayaraman, Y.; Gabriel, J.C.P. Electrochemical approaches for the recovery of metals from electronic waste: A critical review. Recycling 2021, 6, 53. [Google Scholar] [CrossRef]
- Valix, M. Bioleaching of electronic waste: Milestones and challenges. In Current Developments in Biotechnology and Bioengineering; Elsevier: Amsterdam, The Netherlands, 2017; pp. 407–442. [Google Scholar]
- Rawlings, D.E. Heavy metal mining using microbes. Annu. Rev. Microbiol. 2002, 56, 65–91. [Google Scholar] [CrossRef] [PubMed]
- Benzal, E.; Solé, M.; Lao, C.; Gamisans, X.; Dorado, A. Elemental copper recovery from e-wastes mediated with a two-step bioleaching process. Waste Biomass Valorization 2020, 11, 5457–5465. [Google Scholar] [CrossRef]
- Benzal, E.; Cano, A.; Solé, M.; Lao-Luque, C.; Gamisans, X.; Dorado, A. Copper recovery from PCBs by Acidithiobacillus ferrooxidans: Toxicity of bioleached metals on biological activity. Waste Biomass Valorization 2020, 11, 5483–5492. [Google Scholar] [CrossRef]
- Madriz, L.; Cabrerizo, F.M.; Vargas, R. Exploring chemical kinetics at home in times of pandemic: Following the bleaching of food dye allura red using a smartphone. J. Chem. Educ. 2021, 98, 2117–2121. [Google Scholar] [CrossRef]
- Fernandes, G.M.; Silva, W.R.; Barreto, D.N.; Lamarca, R.S.; Gomes, P.C.F.L.; da S Petruci, J.F.; Batista, A.D. Novel approaches for colorimetric measurements in analytical chemistry–A review. Anal. Chim. Acta 2020, 1135, 187–203. [Google Scholar] [CrossRef]
- Malkurthi, S.; Yellakonda, K.V.R.; Tiwari, A.; Hussain, A.M. Low-cost Color Sensor for Automating Analytical Chemistry Processes. In Proceedings of the 2021 IEEE Sensors, Sydney, Australia, 31 October–3 November 2021; pp. 1–4. [Google Scholar]
- de Carvalho Oliveira, G.; Machado, C.C.S.; Inácio, D.K.; da Silveira Petruci, J.F.; Silva, S.G. RGB color sensor for colorimetric determinations: Evaluation and quantitative analysis of colored liquid samples. Talanta 2022, 241, 123244. [Google Scholar] [CrossRef]
- Regalado, R.G.; Cruz, J.C.D. Soil pH and nutrient (nitrogen, phosphorus and potassium) analyzer using colorimetry. In Proceedings of the 2016 IEEE Region 10 Conference (TENCON), Singapore, 22–25 November 2016; pp. 2387–2391. [Google Scholar]
- Ren, H.; Zhang, Q.; Meng, Z.; Ling, R.; Qin, W.; Wu, Z. Online monitoring strategies for colorimetric detection of cadmium ions and pH based on gold nanomaterials with a low-cost color sensor. ACS Sustain. Chem. Eng. 2021, 9, 5924–5932. [Google Scholar] [CrossRef]
- Hasnul Hadi, M.H.; Ker, P.J.; Thiviyanathan, V.A.; Tang, S.G.H.; Leong, Y.S.; Lee, H.J.; Hannan, M.A.; Jamaludin, M.Z.; Mahdi, M.A. The amber-colored liquid: A review on the color standards, methods of detection, issues and recommendations. Sensors 2021, 21, 6866. [Google Scholar] [CrossRef]
- Benzal-Montes, E. Study and Optimisation of Copper Bioleaching Process for Electronic Waste Valorisation. Ph.D. Thesis, Universitat Politècnica de Catalunya (UPC), Barcelona, Spain, 2021. [Google Scholar]
- Oktavia, B.; Lim, L.W.; Takeuchi, T. Simultaneous Determination of Fe(III) and Fe(II) Ions via Complexation with Salicylic Acid and 1,10-Phenanthroline in Microcolumn Ion Chromatography. Anal. Sci. 2008, 24, 1487–1492. [Google Scholar] [CrossRef] [PubMed]
- MIKROE. COLOR 8 CLICK. 2022. Available online: https://www.mikroe.com/color-8-click (accessed on 2 February 2022).
- MIKROE. LED DRIVER 2 CLICK. 2022. Available online: https://www.mikroe.com/led-driver-2-click (accessed on 2 February 2022).
- DFROBOT. pH Meter. Available online: https://wiki.dfrobot.com/PH_meter_SKU__SEN0161_k (accessed on 2 February 2022).
- Nusairat, J.F. Sense HAT. In Rust for the IoT: Building Internet of Things Apps with Rust and Raspberry Pi; Apress: Berkeley, CA, USA, 2020; pp. 429–481. [Google Scholar]
- BH1749NUC. Digital 16bit Serial Output Type Color Sensor IC. 2017. Available online: https://fscdn.rohm.com/en/products/databook/datasheet/ic/sensor/light/bh1749nuc-e.pdf (accessed on 2 February 2022).
- CREE. XLamp XP-E2 LED. Available online: https://assets.cree-led.com/a/ds/x/XLamp-XPE2.pdf (accessed on 2 February 2022).
- Vertan, C.; Boujemaa, N. Color texture classification by normalized color space representation. In Proceedings of the 15th International Conference on Pattern Recognition, ICPR-2000, Barcelona, Spain, 3–7 September 2000; Volume 3, pp. 580–583. [Google Scholar]


| Reaction Time (), min | [Fe(III)], mg/L | [Cu(II)], mg/L |
|---|---|---|
| 0 | 6134.6 | 0.0 |
| 5 | 5632.2 | ∼0.0 |
| 10 | 5144.2 | 310.66 |
| 15 | 4915.9 | 514.71 |
| 25 | 4064.9 | 1063.42 |
| 35 | 3557.7 | 1405.33 |
| 45 | 3564.9 | 1622.24 |
| 75 | 2247.6 | 2348.35 |
| 105 | 1882.2 | 2577.21 |
| 195 | 1521.6 | 3081.80 |
| 225 | 1185.1 | 3081.8 |
| 345 | 1341.3 | 3250.00 |
| Waste Type | Sample | Copper Concentration (%) | Average Copper Concentration (%) |
|---|---|---|---|
| Sample 1 | 34.1 | ||
| Sample 2 | 38.5 | ||
| PB | Sample 3 | 37.1 | 37.5 ± 2.04 % |
| Sample 4 | 39.9 | ||
| Sample 5 | 38.8 | ||
| Sample 1 | 20.8 | ||
| Sample 2 | 24.8 | ||
| EC | Sample 3 | 22.0 | 22.5 ± 1.53 % |
| Sample 4 | 23.2 | ||
| Sample 5 | 21.8 |
| Ions Concentration | |||
|---|---|---|---|
| Fe(III) | 0.9468 | 0.4101 | 0.9741 |
| Cu(II) | 0.9603 | 0.3898 | 0.9960 |
| Model Coefficients | Metrics | |||
|---|---|---|---|---|
| i | SSE | |||
| 1 | −13.68 | −0.5773 | 0.9202 | 4.8645 |
| (−15.61, −11.74) | (−1.054, −0.1011) | |||
| 2 | 8.684 | 0.1107 | 0.9909 | 0.2199 |
| (8.272, 9.096) | (0.0093, 0.2119) | |||
| Fe(III) Ions Estimation | Cu(II) Ions Estimation | |||
|---|---|---|---|---|
| Scenario | SSE | SSE | ||
| Exp-EC | 0.7990 | 8.8096 | 0.9725 | 0.4314 |
| Exp-PB | 0.6781 | 9.6226 | 0.968 | 0.8329 |
Disclaimer/Publisher’s Note: The statements, opinions and data contained in all publications are solely those of the individual author(s) and contributor(s) and not of MDPI and/or the editor(s). MDPI and/or the editor(s) disclaim responsibility for any injury to people or property resulting from any ideas, methods, instructions or products referred to in the content. |
© 2023 by the authors. Licensee MDPI, Basel, Switzerland. This article is an open access article distributed under the terms and conditions of the Creative Commons Attribution (CC BY) license (https://creativecommons.org/licenses/by/4.0/).
Share and Cite
Morell, J.; Escobet, A.; Dorado, A.D.; Escobet, T. Design of a RGB-Arduino Device for Monitoring Copper Recovery from PCBs. Processes 2023, 11, 1319. https://doi.org/10.3390/pr11051319
Morell J, Escobet A, Dorado AD, Escobet T. Design of a RGB-Arduino Device for Monitoring Copper Recovery from PCBs. Processes. 2023; 11(5):1319. https://doi.org/10.3390/pr11051319
Chicago/Turabian StyleMorell, Joan, Antoni Escobet, Antonio David Dorado, and Teresa Escobet. 2023. "Design of a RGB-Arduino Device for Monitoring Copper Recovery from PCBs" Processes 11, no. 5: 1319. https://doi.org/10.3390/pr11051319