
Reducing the Scrap Rate on a Production Process Using Lean Six Sigma Methodology
by
 ,
,
Ioana-Cătălina Enache
1,*,
Oana Roxana Chivu
2,
Ana-Maria Rugescu
1,
Elena Ionita
1 and
Ionut Valentin Radu
1 1
Department of Engineering Graphics and Industrial Design, Faculty of Aerospace Engineering, University Politehnica of Bucharest, Splaiul Independenței, 313, 060042 Bucharest, Romania
2
Faculty of Industrial Engineering and Robotics, University Politehnica of Bucharest, Splaiul Independent, ei Nr., 313, 060042 Bucharest, Romania
*
Author to whom correspondence should be addressed.
Processes 2023, 11(4), 1295; https://doi.org/10.3390/pr11041295
Submission received: 15 March 2023
/
Revised: 1 April 2023
/
Accepted: 13 April 2023
/
Published: 21 April 2023
(This article belongs to the Section Manufacturing Processes and Systems)
Abstract
:The aim of this case study is to implement the Lean Six Sigma methodology to reduce the scrap rate of the edge-bending process of a metal door case used in the assembly process of refrigeration appliances. This study was initiated because the assembly process of refrigerators does not work at maximum capacity due to the scrap that occurs for this component. Losses have direct effects on a company’s profits and on its competitiveness on the market. This research provides an overview of the identification of the most optimal and useful tools that can be used in each context; this will help to establish a protocol which can be applied in similar contexts. Although this study is limited to one process, the results will have direct effects on the assembly line of the organization. The purpose of this study is to increase the capability of the process and to improve the efficiency of the delivery of the component parts to the assembly line. This case study provides further evidence of the effectiveness of the use of the Six Sigma methodology in identifying and reducing scrap rates.
1. Introduction
Competitiveness is a word that dominates business, and its benefits represent the basis for the functioning and strong development of industries and organizations [1]. The development of goods exchanges and globalization have led to the establishment of improved methods of ensuring the success of organizations across world markets, for the higher and higher expectations of clients, while also ensuring a primary place when it comes to competition [2]. Productivity is a word that will define the development directions of any organization, whose aims should be to obtain adequate profits and to ensure continuous development [3]. They need to evaluate and efficiently use all available resources, thus offering their clients high-quality products at a fair price.
The quality tools provided by Lean management can be used to increase economic productivity and to eliminate waste [4]. Six Sigma methodology is a common tool used in Lean management. In the literature, there are many case studies exemplifying successful applications of this methodology in all industrial fields and beyond [5,6,7,8].
By applying Six Sigma methodology, many organizations around the world succeed in improving the capability of their business processes through defect reduction or elimination and profit improvement [9].
Defining the variation in a process using statistical concepts makes Six Sigma a tool that can determine the inherent errors in a process that can lead to the risk of scrap occurring [10]. Six Sigma might be seen as a philosophy of management of quality as well as a methodology concentrated on the reduction in variations by increasing the capability of the process known as sigma levels [11].
To facilitate the improvement of a process, Six Sigma methodology is based on going through an interconnected phase that involves defining, measuring, analyzing, improving, and controlling the inputs and outputs of the system process [12].
Six Sigma methodology is a robust continuous improvement strategy which uses traditional quality management techniques, and it has gained worldwide recognition because it helps organizations to save money [13,14].
This paper is organized as follows: Section 2 includes aspects of the improvement process and the Six Sigma approach developed in the literature; Section 3 contains the research methodology by which the implementation of the Six Sigma approach is achieved; Section 4 describes the steps for the implementation of Six Sigma by using the DMAIC approach to eliminate the scrap rate for the edge-bending process of metal door cases; and in the last section, we present the conclusion of this paper.
2. Literature Review
Through a continuous improvement using quality tools and waste, all non-value-added activities (known as Muda) can be identified and eliminated [15,16]. According to Womack’s definition, “Lean gives you the ability to produce more by using less–less human effort, equipment, time and space, while at the same time getting closer to the objective, which is to meet the exact need of the customer” [17]. Lean can be used in a production system to increase productivity by minimizing waste (Muda) with less human effort in the factory, less financial resources, less space, and less equipment to manufacture the same product [18,19]. The most commonly applied tools of Lean that are focused on eliminating the Muda by maximizing the value are:
- Just in time (JIT)—based on reducing flow times [22];
- Total productive maintenance (TPM)—a concept used for the maintenance of installations and equipment [23];
- Kaizen is focused on continuous improvement and involves all employees [24];
- Plan do check act (PDCA)—a four-step continuous improvement tool [25];
- Value stream mapping (VSM)—material and information flow mapping [26];
- Jidoka—describes a set of system design principles [27].
The key to satisfying the client is to understand and accurately define the term quality. Juran says that an organization should first understand the implications of the word quality in order to know how to obtain it [28]. The organization’s policies of a continuous improvement of quality and productivity aim to maximize equipment and production efficiency. Lean provides organizations with the opportunity to reduce flows [29], non-conformities [30], costs [31], material losses [32], defective parts [33] and the subsequent warranty costs [34], reduce the dissatisfaction of clients [35], unproductive times [36], spend less time introducing a new product onto the market [37], increase the yield [38] and the productive capacity [39], and to improve the performance of delivery [40].
The seven Muda are:
- Muda due to transport;
- Muda due to unnecessary movements;
- Muda due to over processing;
- Muda due to excess inventory;
- Muda due to scrap;
- Muda due to waiting.
While using a set of practices, Lean focuses on gradually eliminating waste, while Six Sigma is a project-driven strategy.
There are two types of problem-solving methodology in Six Sigma: one is DMAIC, and another is DMADV [41].
DMAIC (Define > Measure > Analyze > Improve > Control) is a quality approach based on information to improve the process according to the Deming cycle, which consists of five interconnected stages [42].
DMADV (Define > Measure > Analyze > Design > Verify) is an information-based quality procedure for planning items and procedures. This strategy allows the creation of new structures of elements or procedural plans for the design of a new product [43].
- The define step is where we first identify the issue that needs to be fixed. This requires time and careful, thorough planning, but it will provide a framework for the entire improvement process. You must now draft a precise proclamation that states the issue and establishes the parameters for the process of improvement. A project chart is typically used to identify and record the project’s goals, define its success, describe the anticipated effects of the project, and make responsibilities and expectations clear. No matter the method used to record the actions taken during the DMAIC definition stage, it is crucial to record every detail that aids in project management throughout the following stage.
- The measurement stage, which is the second stage of the DMAIC, is where methods are chosen to offer baseline measurements that are quantifiable and can be compared to results and post-improvement outcomes. It is based on data-driven concepts. Processes are now recorded, and a starting point for improvement is established. It is crucial to comprehend how the process is currently operating to determine where to go with improvement efforts. A project’s progress can be seen in real-time thanks to measurement. The group should decide on the best measurement techniques and data collection intervals. Measuring is a crucial component of the DMAIC process since it shows whether something needs to be modified or changed and whether progress has been made.
- Analyze, which identifies the problem’s primary cause, is the following phase in the DMAIC process. Finding later solutions that genuinely target and address the recognized problem requires an understanding of the real causes or reasons behind the issue. Many issues plague many procedures. Focusing on the reasons rather than the effects or symptoms of the problem helps ensure that the real causes become the focus of change, keeping the process itself at the center of the DMAIC process.
- The improvement phase of the DMAIC process clarifies the steps to be taken to solve the issue. The DMAIC model’s previously established plans and actions are currently being carried out. Process improvement is not a straightforward, linear process; rather, it is taking action, measuring the effectiveness of that action, and then changing that activity as necessary to achieve progress. The relevant risks must be recognized, documented, and addressed throughout the improvement efforts, and this stage requires evidence to back it. To maintain effectiveness, rigor, and transparency, it is crucial to monitor improvement initiatives throughout the project.
- Control is the DMAIC model’s final stage. The control stage decides how to keep the improvement going and ensure it does not worsen over time. How can the advantages be preserved, converted into best practices, and integrated into the enhanced procedure? Plans for monitoring and responding are created throughout the monitoring phase to keep track of advancements, respond to subpar performance, and guarantee project goals are reached.
Many academics from all over the world have proposed numerous projects and/or models to address a variety of problems utilizing LSS, Six Sigma, and Lean. The organization will deliver a Lean Six Sigma (LSS) integrated implementation that is oriented to reduce scrap and increase productivity. By combining these two approaches, you can increase organizational effectiveness and efficiency as well as speed up the process of achieving a high performance [44]. We outline the technique suggested to create the case study in the following chapter.
3. Methodology
An LSS project will be created based on the literature to decrease scrap for the edge-bending process of a metal door case. The implementation of the LSS methodology depends on setting objectives at the organizational level.
The organization invests in staff training, in the development of state-of-the-art systems and equipment, and in the development of projects that lead to increased productivity and customer satisfaction. Through its actions, it aims to be the European market leader in the refrigeration segment. On this organization’s assembly lines, different refrigerators models are produced and exported all over Europe. The strategic direction of the organization is to increase the efficiency of equipment used in production systems that are used to produce repetitive batches of specific refrigeration components.
In this article, through the systematic implementation of DMAIC steps, the mitigation of scrap was achieved by using a specific diagnostic tool such as a project charter, VOC, process maps, cause and effect diagram, R&R GAGE, and Pareto diagram. The objective of this approach is to improve the process of edge bending for the metal door case.
In the definition phase, starting from a problem identified through the use of specific tools, the identification of the root cause will be pursued. Starting from an identified problem, describe all the inputs and outputs of the process to obtain a clearer picture of it. In the measurement phase, the necessary data will be collected to see what the capability of the process is. The data obtained in the measurement phase are used in the next step to identify the actual cause of the metal door case scrap. In the fourth phase, the necessary solutions specific to the identified problems are identified. These will be tested and standardized. In the final phase, new measurements will be made aimed at validating previously implemented solutions.
We concentrate on the following at the define stage:
- Identification of the issue, the aim, and the improvement opportunities;
- Determining the project’s duration;
- Determining the parties involved and affected;
- Forming the project team;
- Determining and mapping the procedures;
- A description of the parties demands that are mentioned;
- Every detail must be confirmed;
- Definition of the stage’s actions and plans must be acknowledged.
The measurement phase will be implemented to:
- Create measurement and data collection techniques to show advancements and improvements;
- Develop a plan for data collecting that specifies the frequency and the person or people in charge;
- Identify the necessary data.
Following the analytical step, we will:
- Conduct a root cause analysis;
- Assess the process’s specifics;
- Measure and record data;
- Determine the underlying causes;
- Examine the issue’s root causes;
- Start preparing improvement-related actions.
Improve steps include:
- Create viable solutions;
- Specify the advantages that could create a result;
- Create updated procedures and plans;
- Create a solution, plan how it will be executed, measure the improvements made, and share plans and updates with all parties involved;
- Record the plans, progress, and outcomes.
The last step of the process is carried out to:
- Verify and record improvements;
- Record the improved procedure;
- Examine whether the project’s goals have been met;
- Celebrate and communicate project accomplishments;
- Keep improving and using DMAIC process lessons;
- One or more tools were used for the development of a project, in the different steps.
The instruments that can be used for each level of the Six Sigma process are listed in Table 1.
4. Six Sigma Methodology Implementation
In this case study, we aim to use the Six Sigma approach to reduce metal waste obtained by bending the edges of a metal component. A certain model of refrigeration appliance’s doors is assembled using the metal part that we are examining. The 3D model of the profile to be examined is shown in Figure 1.
4.1. Definition Stage
The component that is the source of the waste that we want to remove of has been identified and examined during the defining step, along with the method utilized to obtain the metal used for the refrigerator door.
Before starting the optimization process, it was noted that the production level had decreased during the previous 12 months due to the metal casing of the doors of the refrigeration in the model that was submitted for study. These flaws were discovered in the region where the metal door case is bent laterally.
The aim of the project is to:
- Reduce door scraps from bending the edges of the analyzed models.
- Improve the execution of the metal door casing.
- Elimination of the causes of dimensional deviations for the metal door casing.
Customer feedback, in our opinion, is crucial to quality. Market research phases that are qualitative and quantitative typically make up VOC studies.
To better comprehend the needs and wants of the client, it is typically carried out at the beginning or conclusion of every new product, process, or service design endeavor [45].
The VOC procedure yields notable outcomes and advantages for product makers.
VOC offers the following benefits:
- A complete understanding of the client’s expectations;
- A future shared language for the team; crucial information for creating appropriate design specifications for the novel good or service;
- An excellent starting point for the creation of new products.
To establish the demands, the team carefully studied the VOC in Table 2.
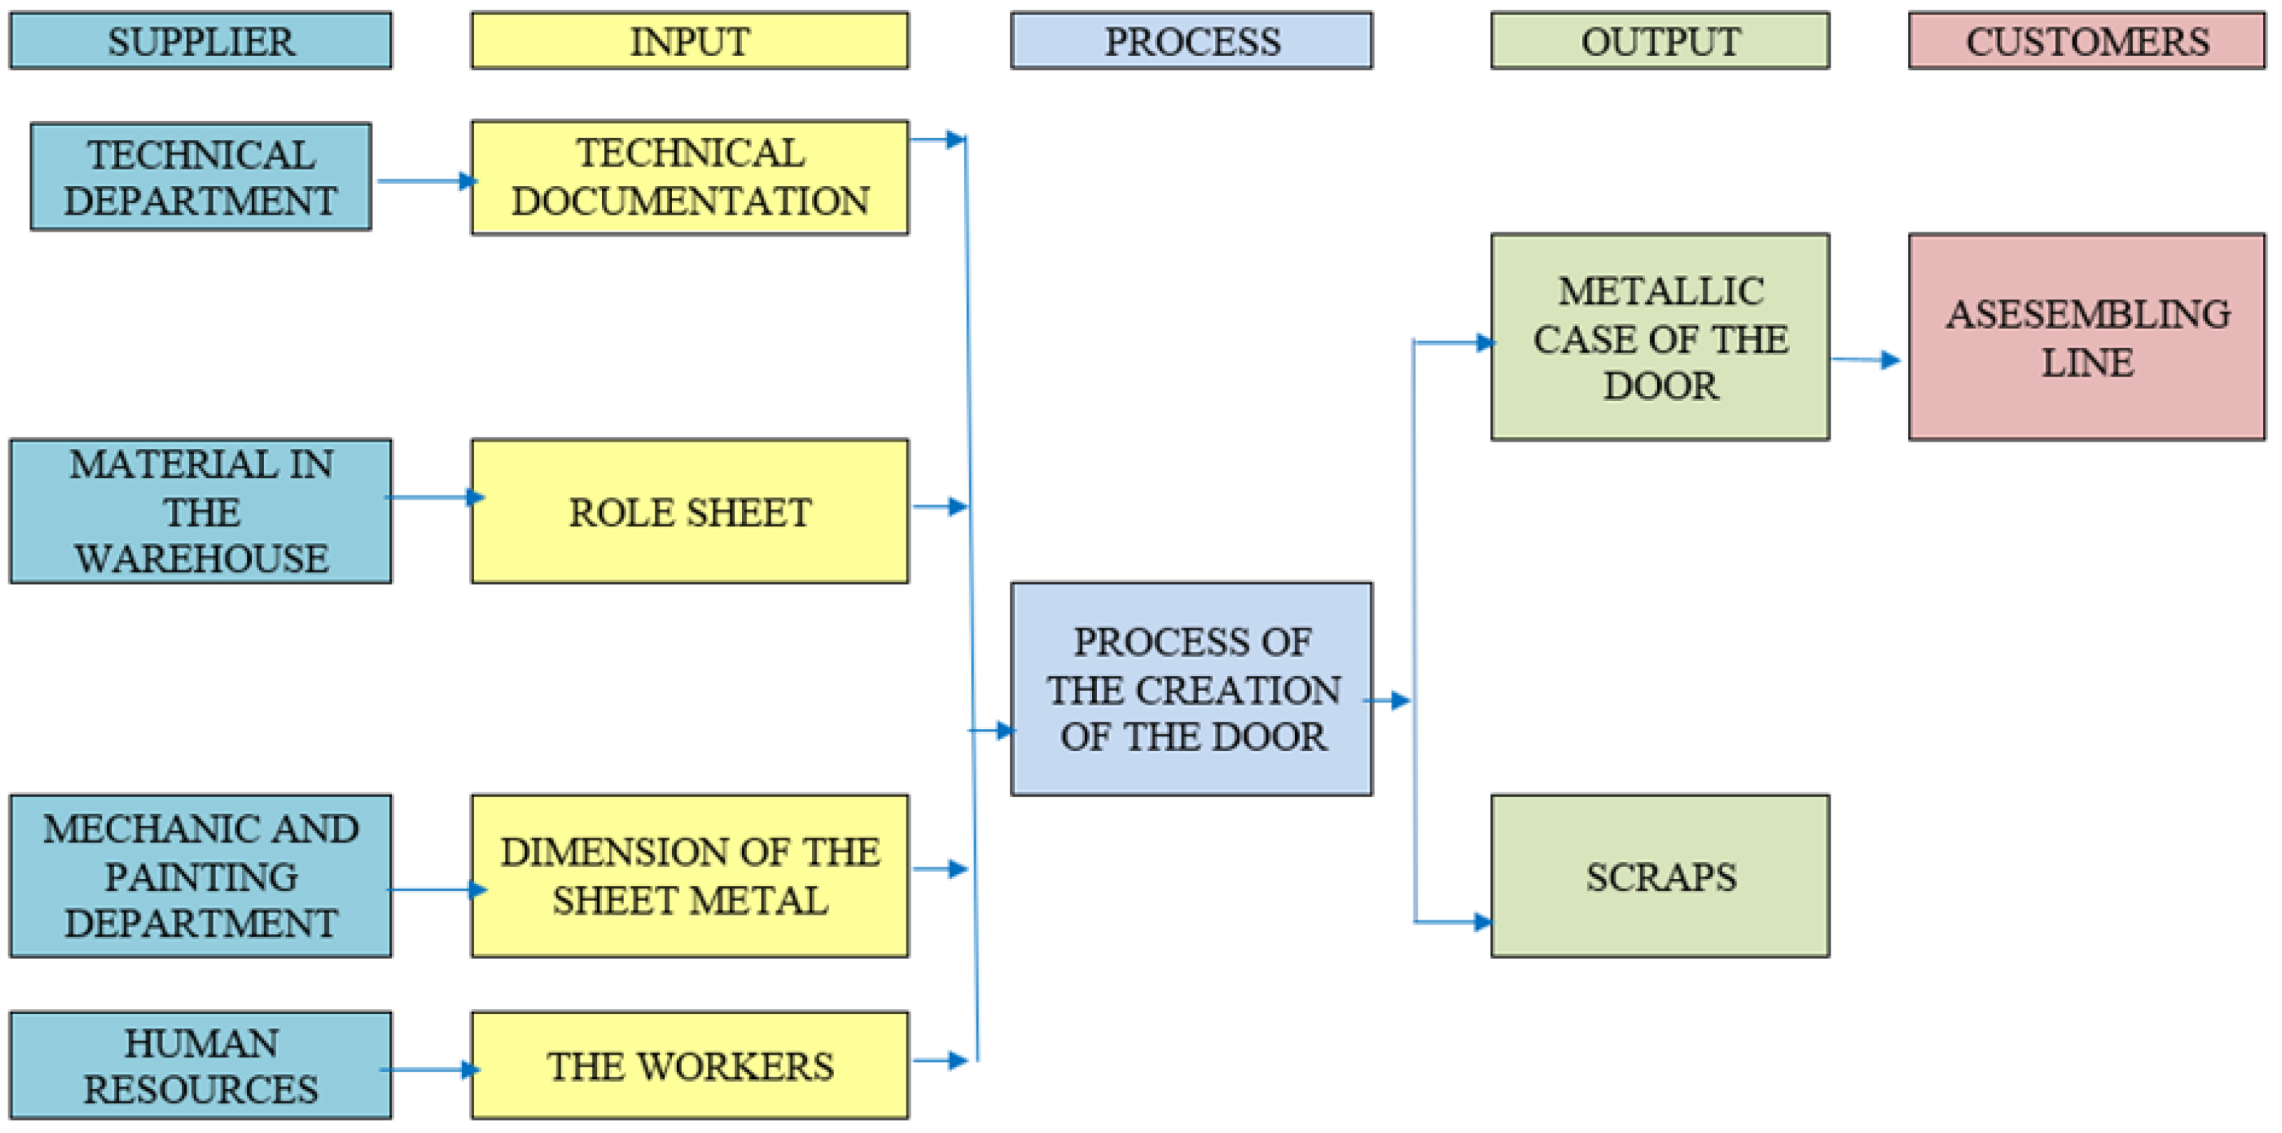
By dividing the application area into small chunks, the SIPOC diagram may be used to classify the interactions between various entities and each process.
It is a frequently used tool in the DMAIC process development phase that provides the team with a summary of its present process so that it can establish an alternative approach.
This diagram can also provide information on internal and external providers, as well as the inputs and outputs of goods, services, or information.
This diagram emphasizes the inputs and outputs of the process rather than each phase individually (Figure 2).
4.2. Measure Stage
The inputs, actions, and outputs of a process can be represented visually using a step-by-step process map. The approach is clarified using this graphical representation and illustrative descriptions. We can now view some of the process’s specifics, which can help us when making decisions. This graph also allows us to pinpoint the advantages and disadvantages of the process under study (Figure 3).
The cause-and-effect diagram, sometimes referred to as the fishbone diagram or Ishikawa, can aid in the definition phase by helping us comprehend the process being studied. At this point, the procedures listed below must be followed to create the Ishikawa diagram:
- The problem statement needs to be succinct and understandable. It indicates the effect that must be positioned “in the mouth of the fish”.
- The primary categories of the problem’s causes can be seen from the main arrow. They are depicted as the primary arrow’s branches.
- BRAINSTORM is used to identify every potential root cause of the issue. A cause can fall under a variety of headings. Primary and secondary causes for the process under analysis are defined in Figure 4.
To attain a high performance, we can identify priorities in a process with the aid of the priority matrix, also known as the Eisenhower matrix. This resource is a table listing all the actions that will be taken during the procedure under study. A score from 0 to 10 will be assigned to each step for the effort made to remove scrap during the bending process, and a score from 0 to 100 will be used to show the impact (Table 3).
It is necessary to conduct a Gage R&R analysis to estimate the system’s internal variation. The measurement system must be validated by a calibration procedure in order for this measurement to be taken precisely. Calibration has an impact on the measurement system, rendering it worthless when precision is poor. This phase is crucial because an inadequate measurement system increases the probability of incorrect Six Sigma technique implementation.
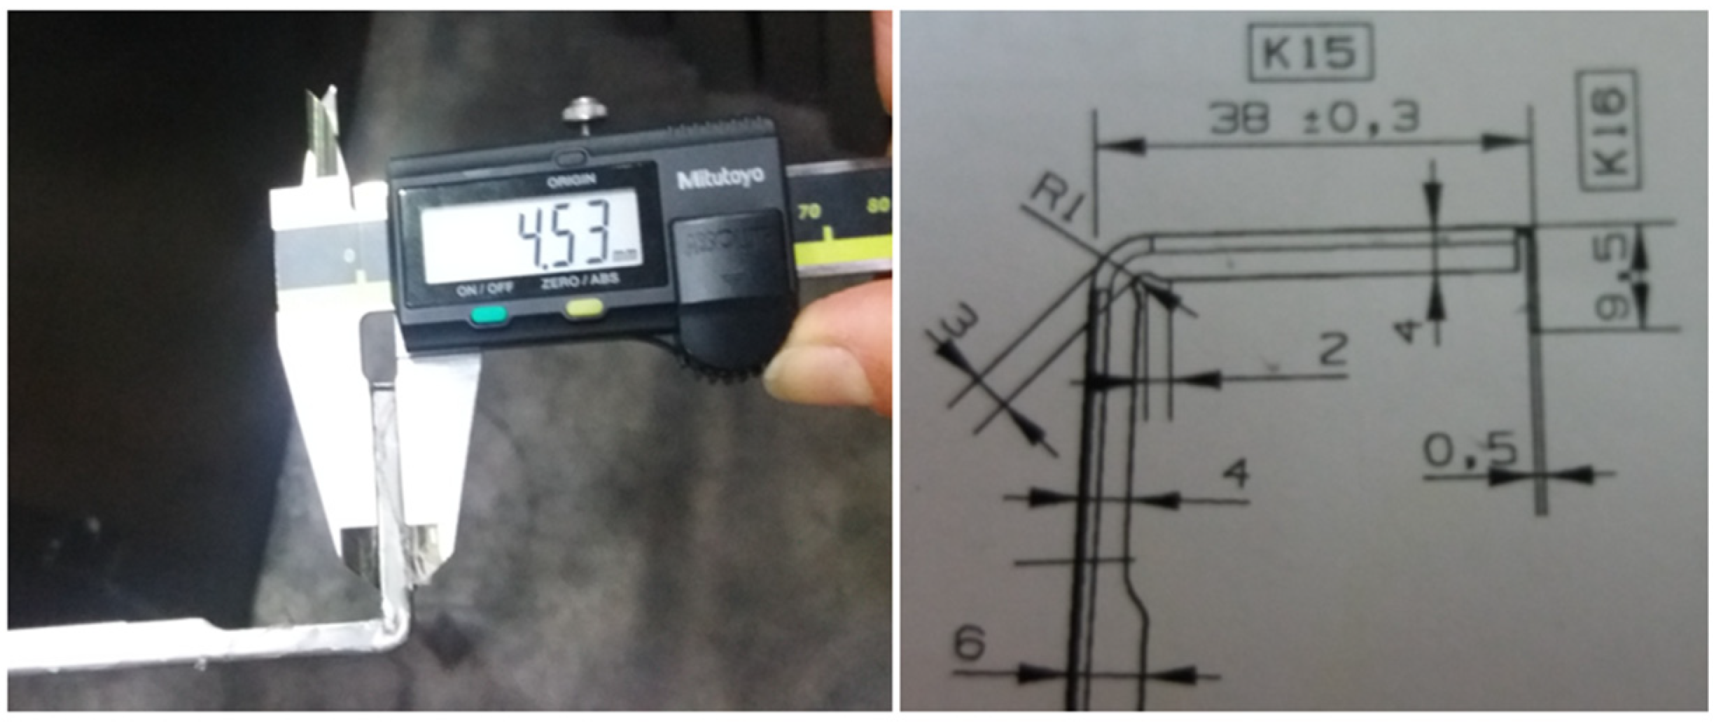
Two operators were chosen to carry out eight sets of measurements twice each for the Gage R&R study. For the metal case’s sheet metal thickness, measurements were taken. According to the product drawing, the sheet’s thickness in the measured region should be 4 mm (Figure 5).
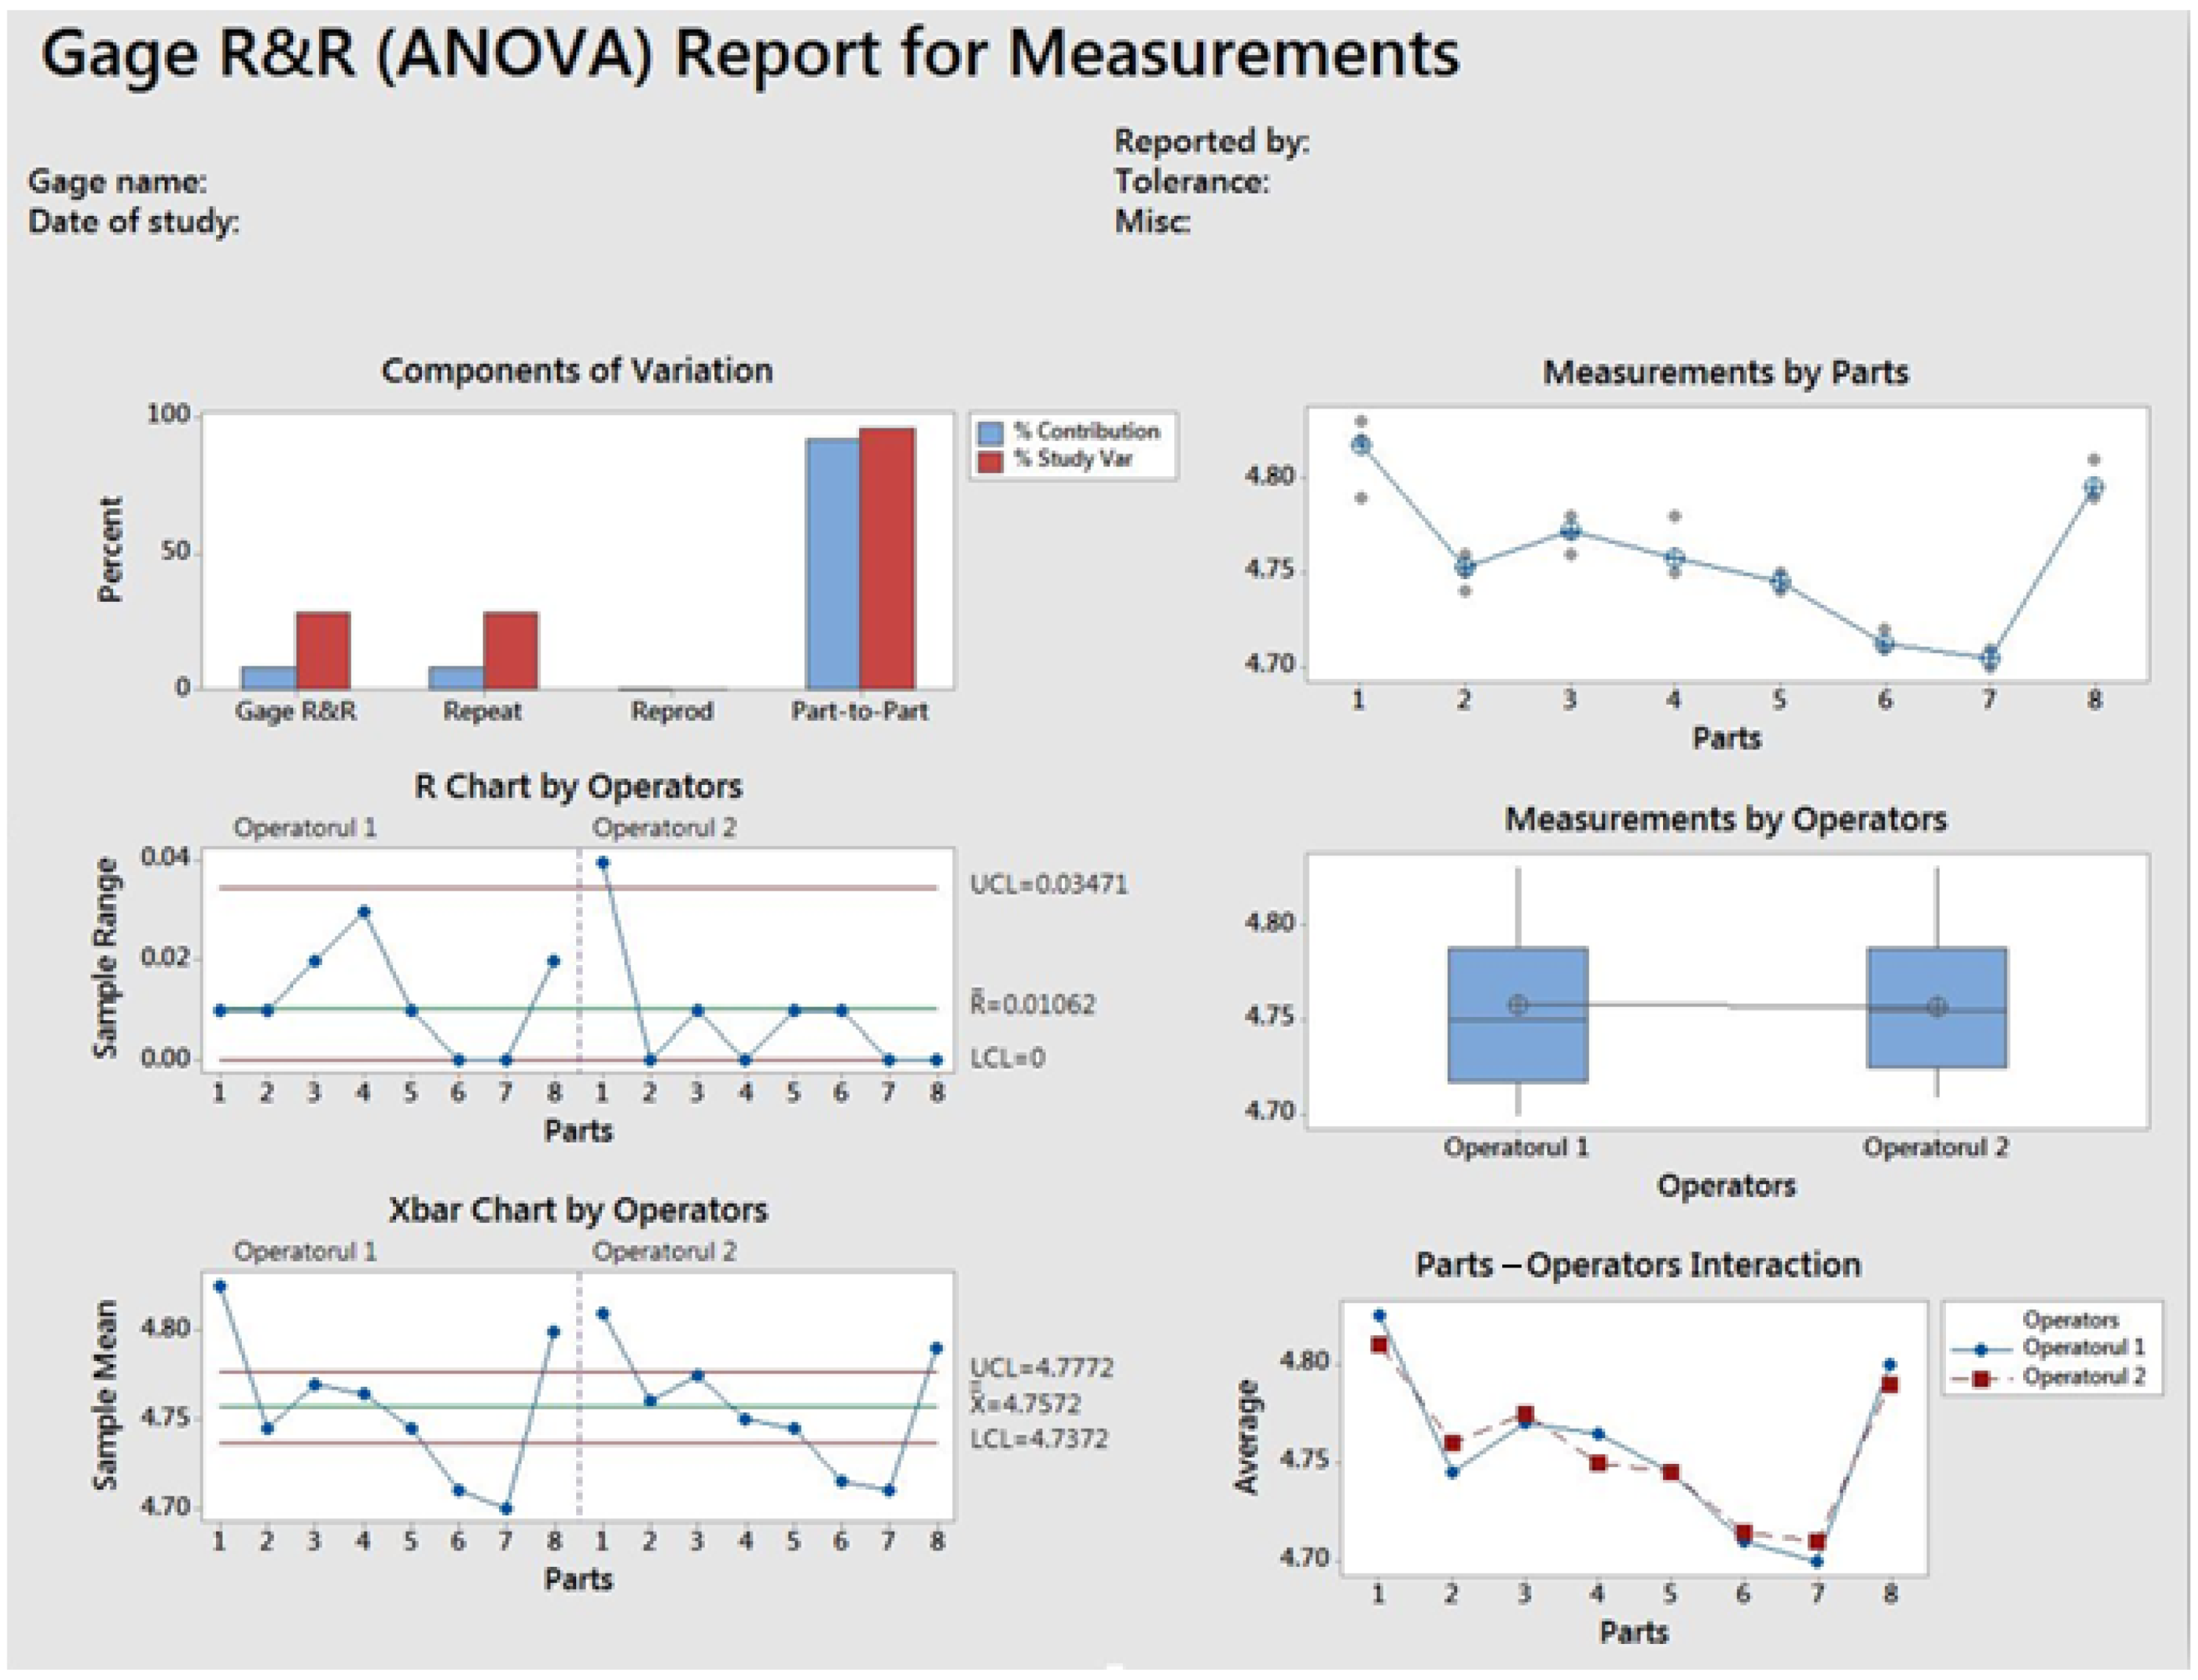
The measurements taken by the two operators are displayed in Table 4. Based on the measurements, we find that the average value of the measured values is 4.75 mm.
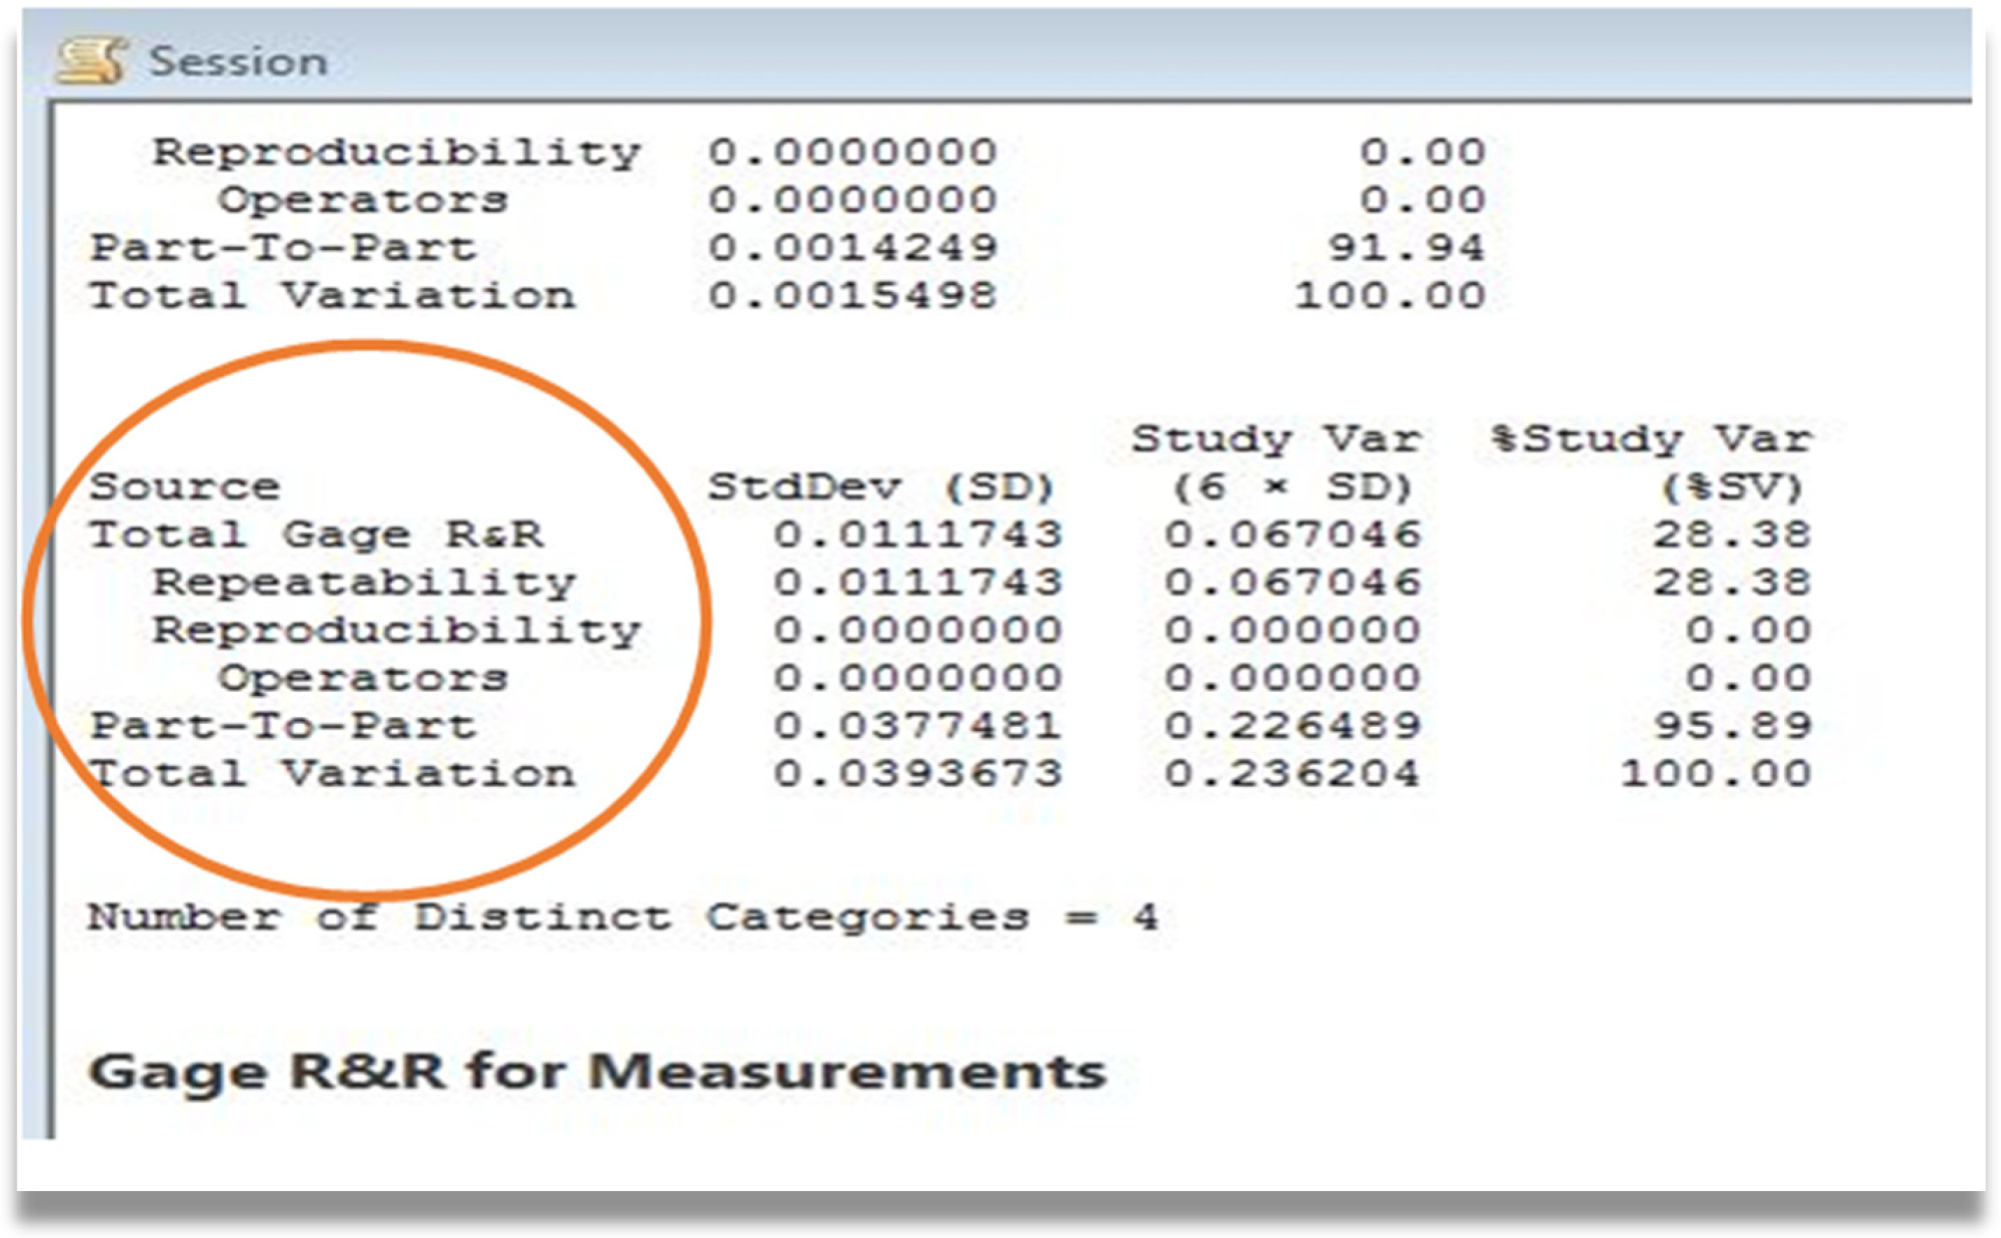
Two crucial components of Gage R&R are repeatability and reproducibility. Repeatability is the variation in the measurements made using the same tool or person on the same object or specimen under the same conditions, while reproducibility is the variation brought about when using different tools, operators, or laboratories to measure the same specimen or replicated specimen [46]. The sets of values derived from the measurements were input into Minitab to compare the two sets of data and determine their repeatability and reproducibility (Figure 6 and Figure 7).
We discover that there is not much of a difference in the numbers measured by the two operators using a statistical analysis application such as Minitab. According to the study, the measuring system is acceptable because the repeatability and reproducibility values are less than 30%. The measuring step counts the number of visually identifiable scraps in the examined product. Over 22 days, data were collected. The total number of parts manufactured and the total number of scraps reported on the measurement day are shown in Table 5 for a period of only 10 days.
A percentage of 2.96 scraps was calculated in Table 6 based on the total number of products obtained and the number of scraps recorded in the 22 days during which the measurements were performed. This means that for every million products manufactured, 29,629 scraps will be reported.
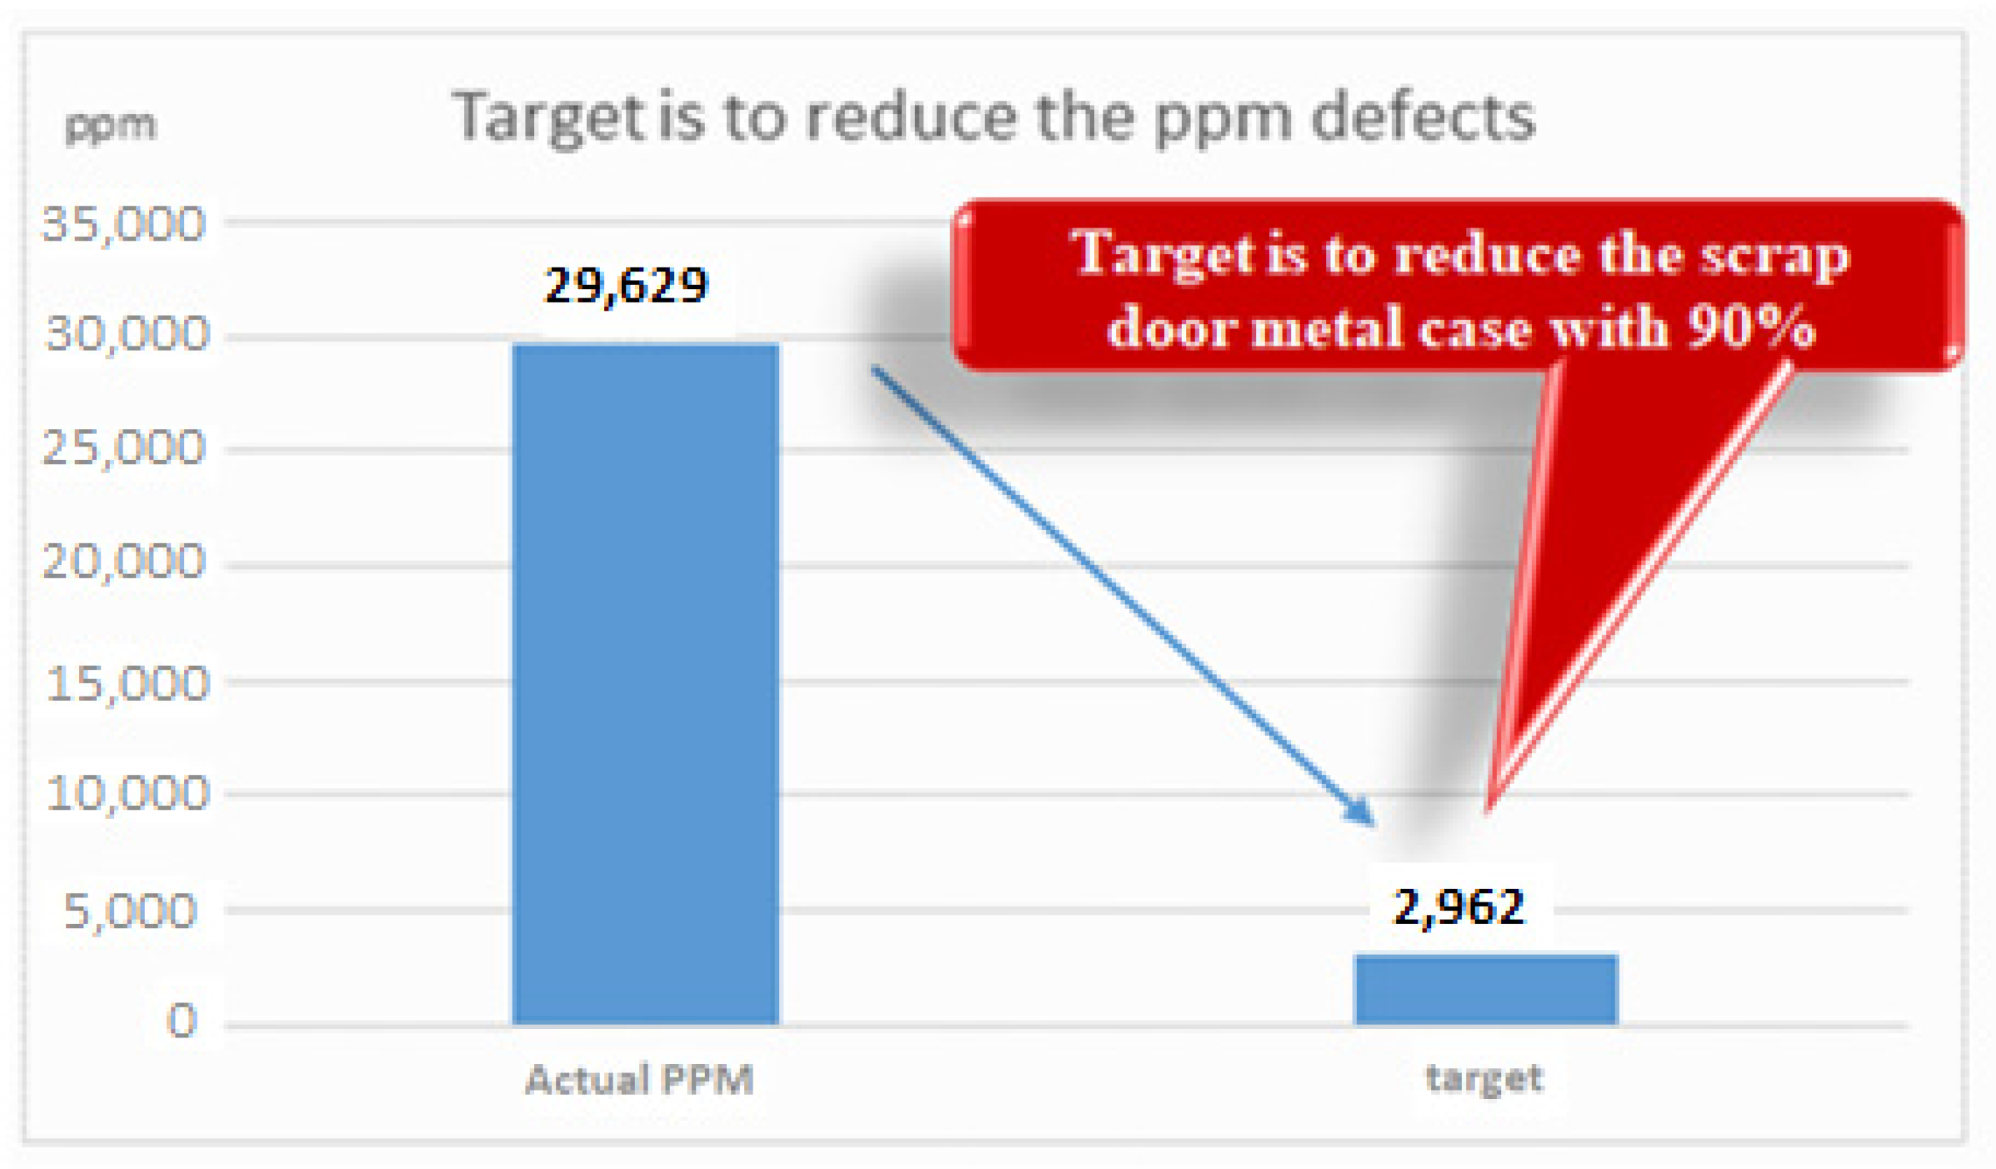
After defining the objectives, we must set a target that we are interested in accomplishing. Figure 8 shows that there are 29,629 parts per a million scraps currently. We aim to lower that figure to 2962 parts per millions of scraps, which would indicate a reduction of up to 90% in the amount of scrap reported.
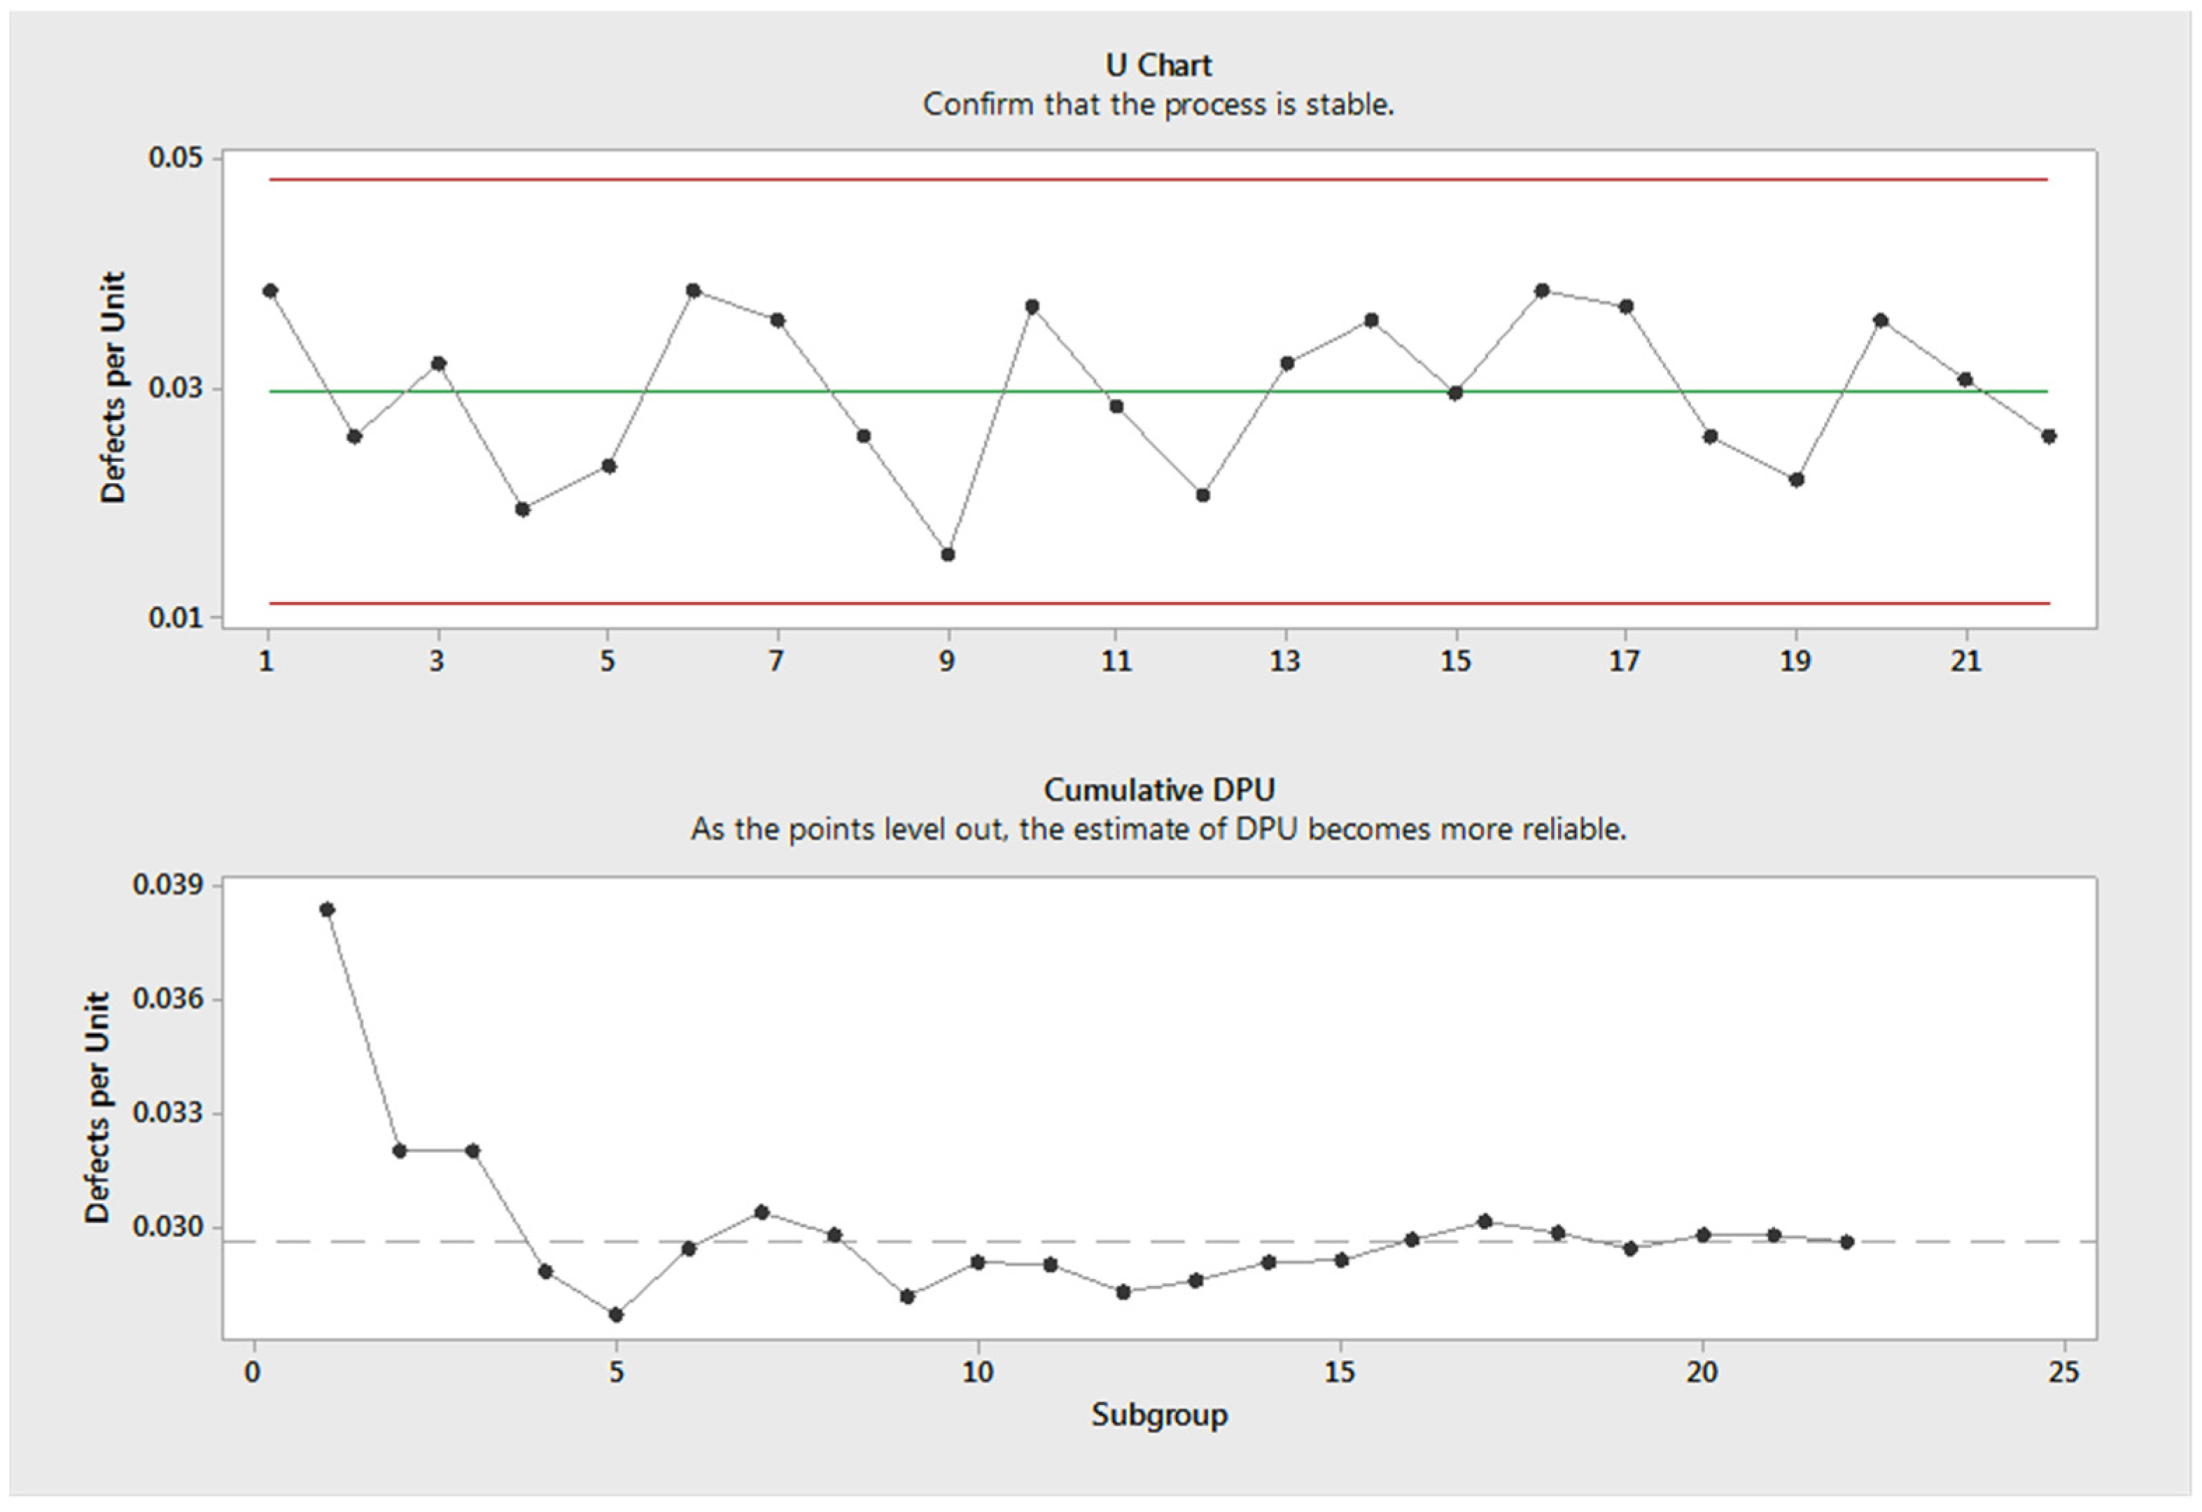
Poisson capacity analysis is used to determine if the unit failure rate (DPU) meets the customer’s requirements. This analysis is used when scrap is registered, and each registered part can have several scraps. The goal of this analysis (Figure 9) was to determine if the process is controllable, to estimate the defect rate per unit for each sample and for all samples (mean DPU), and to show that the DPU default rate is stable.
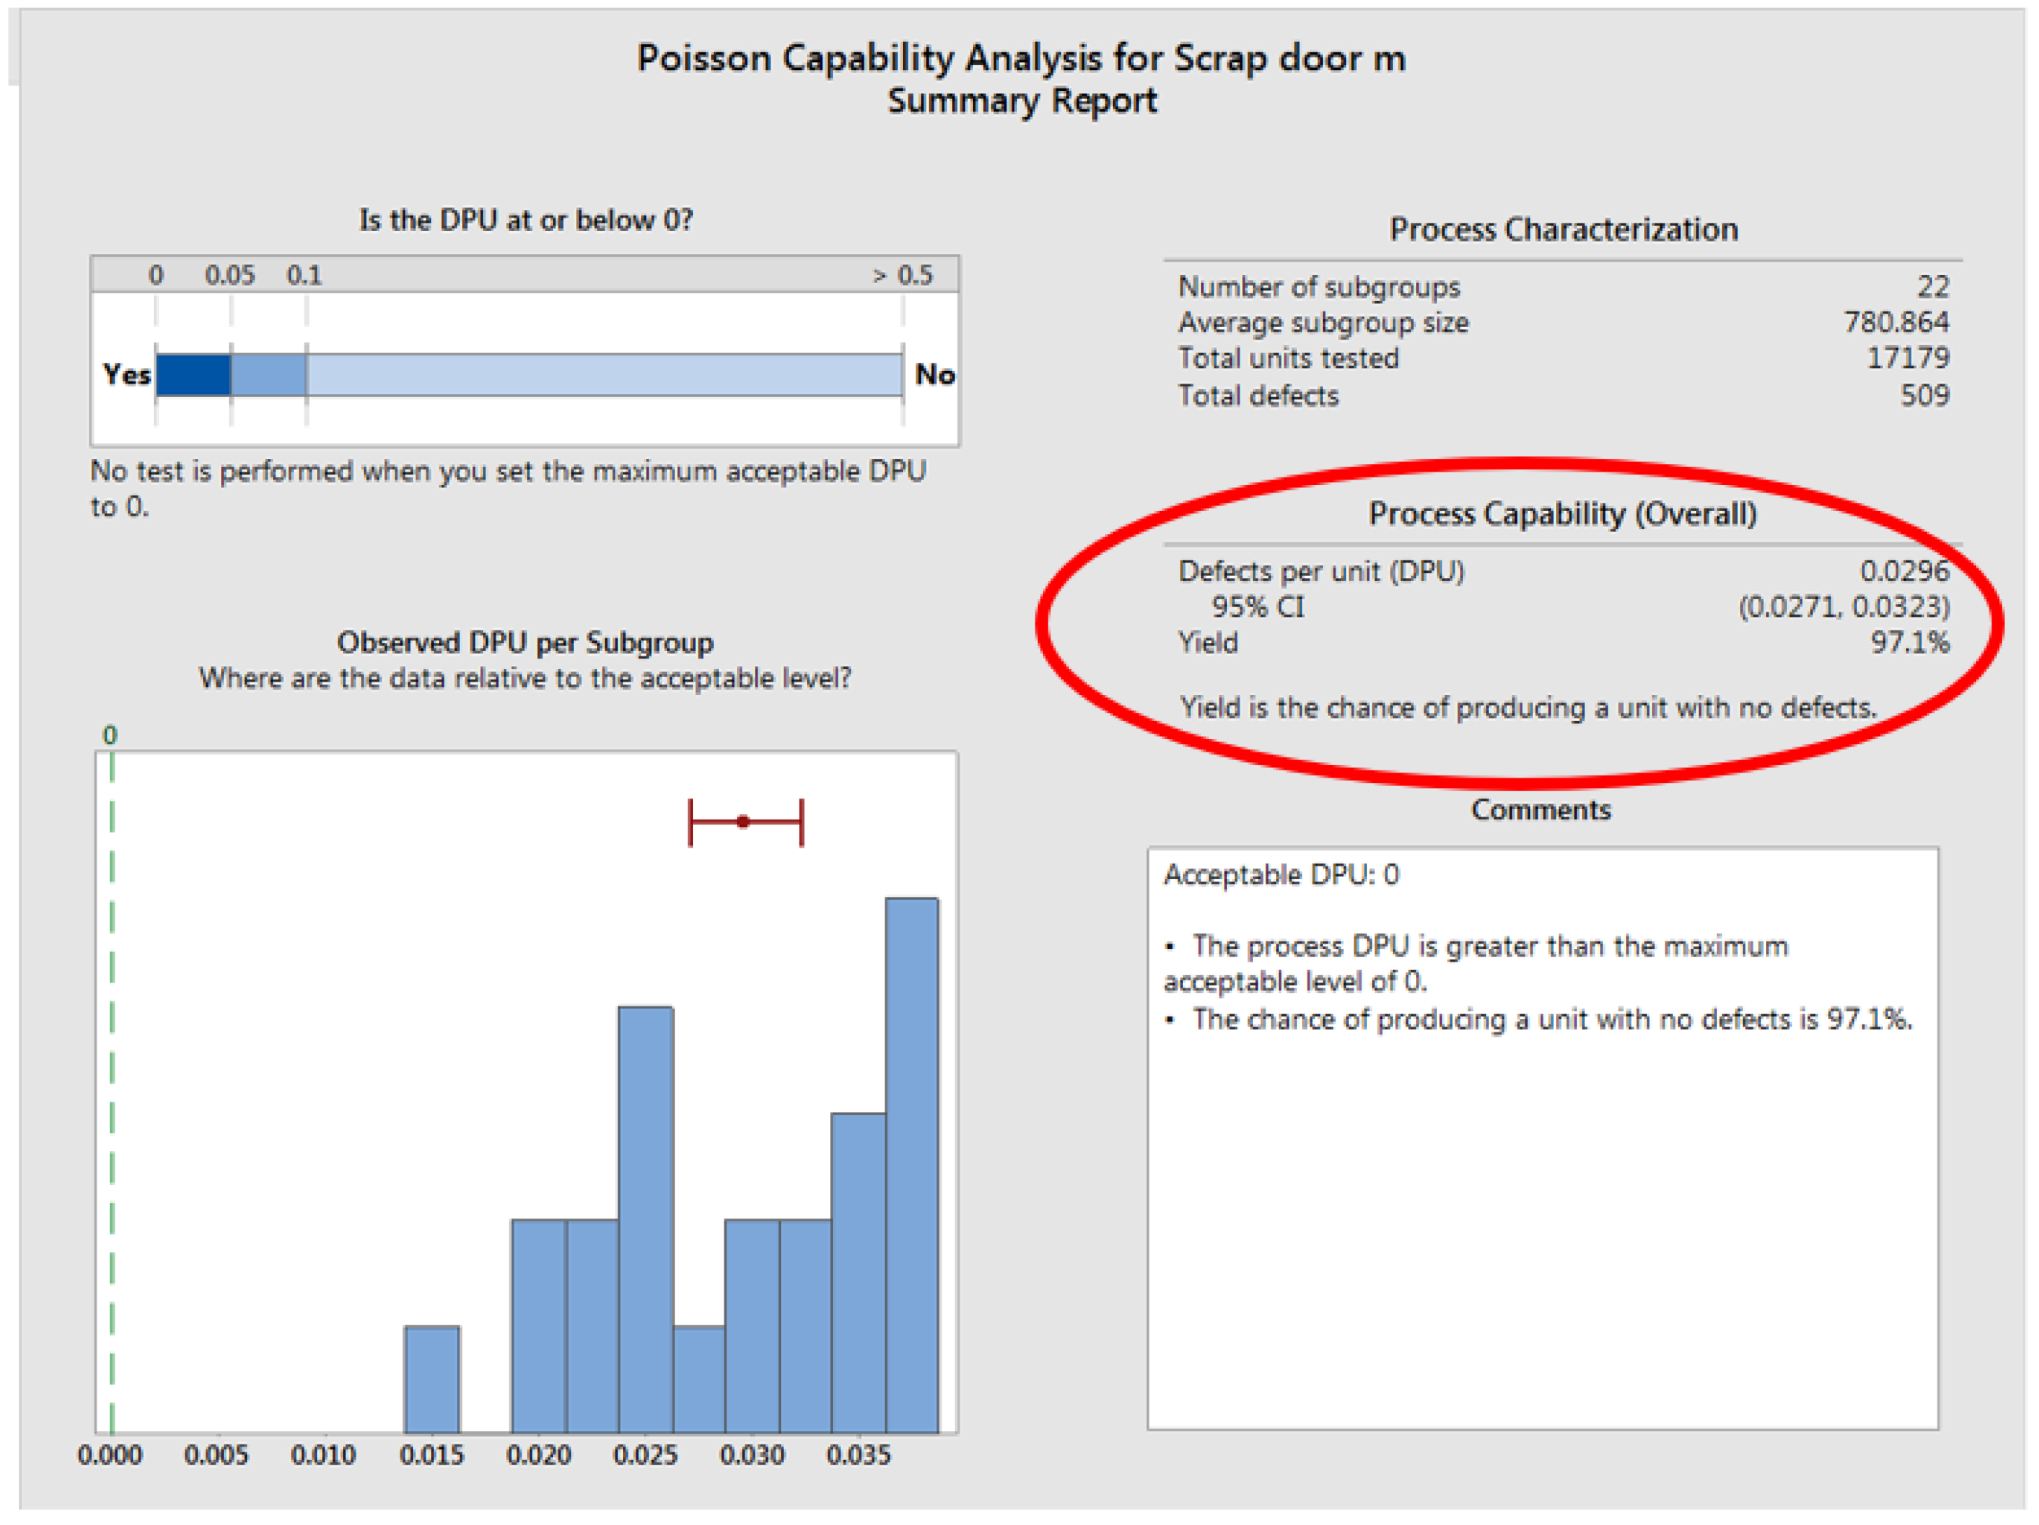
Using our measurements, Figure 10 shows that we have 2.96% defaults.
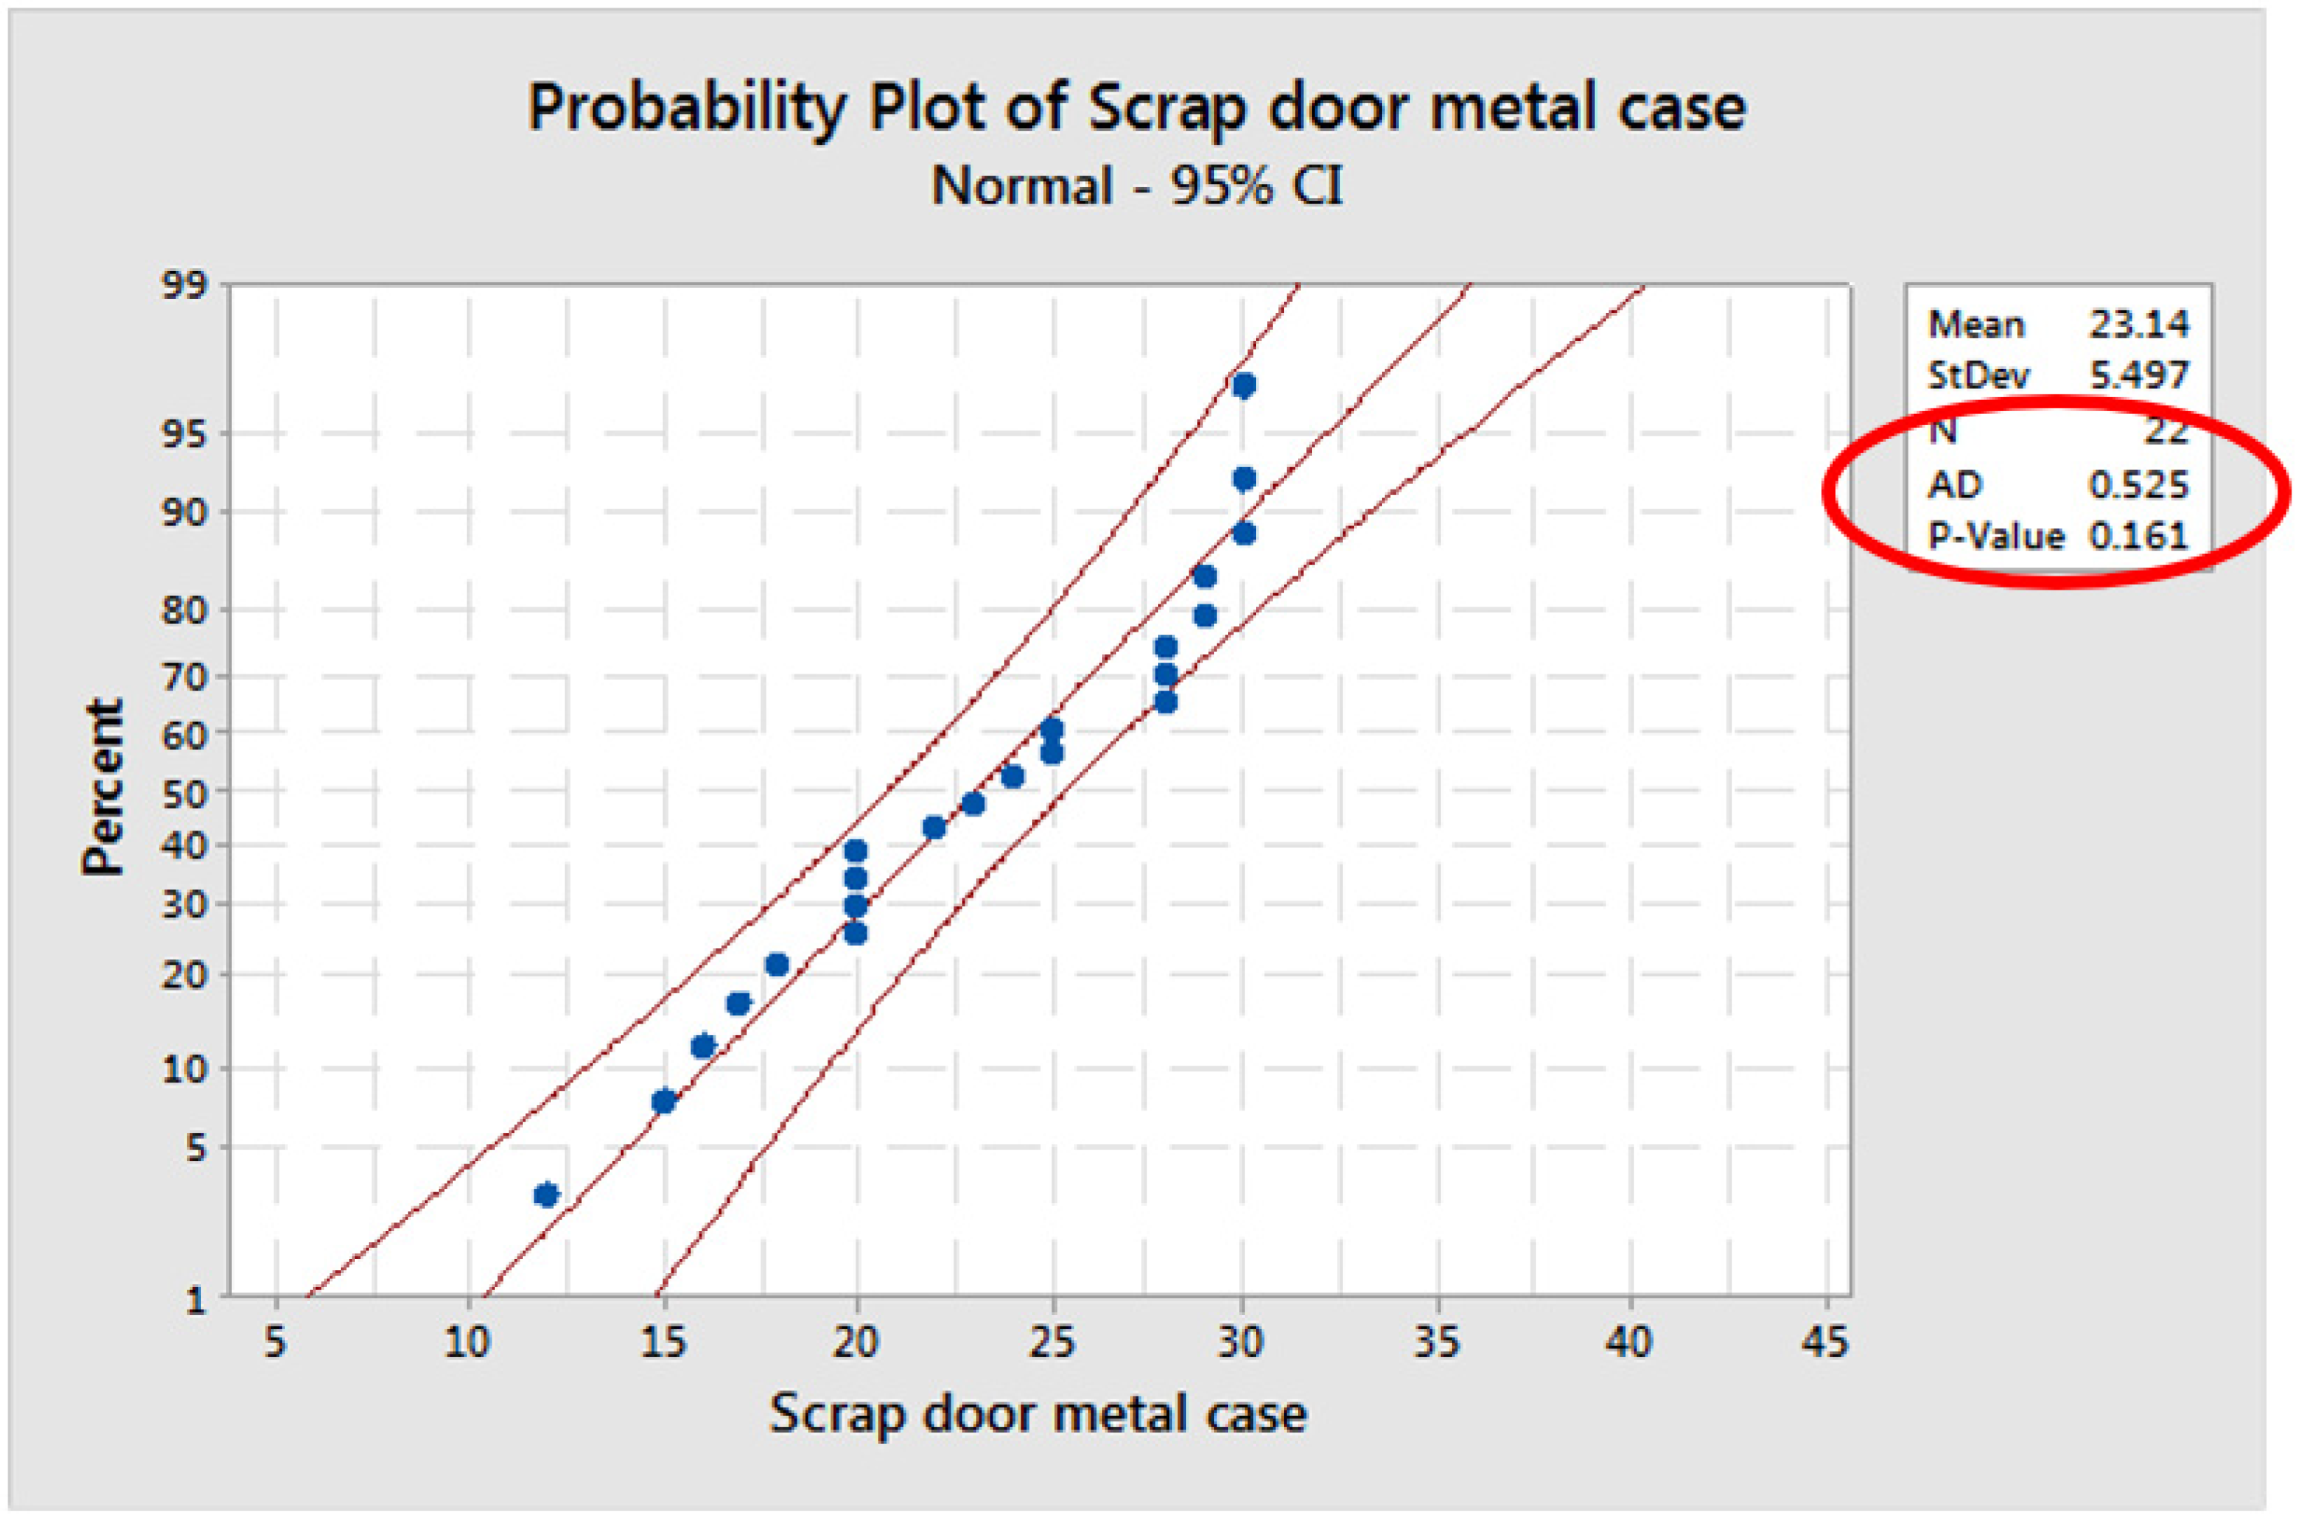
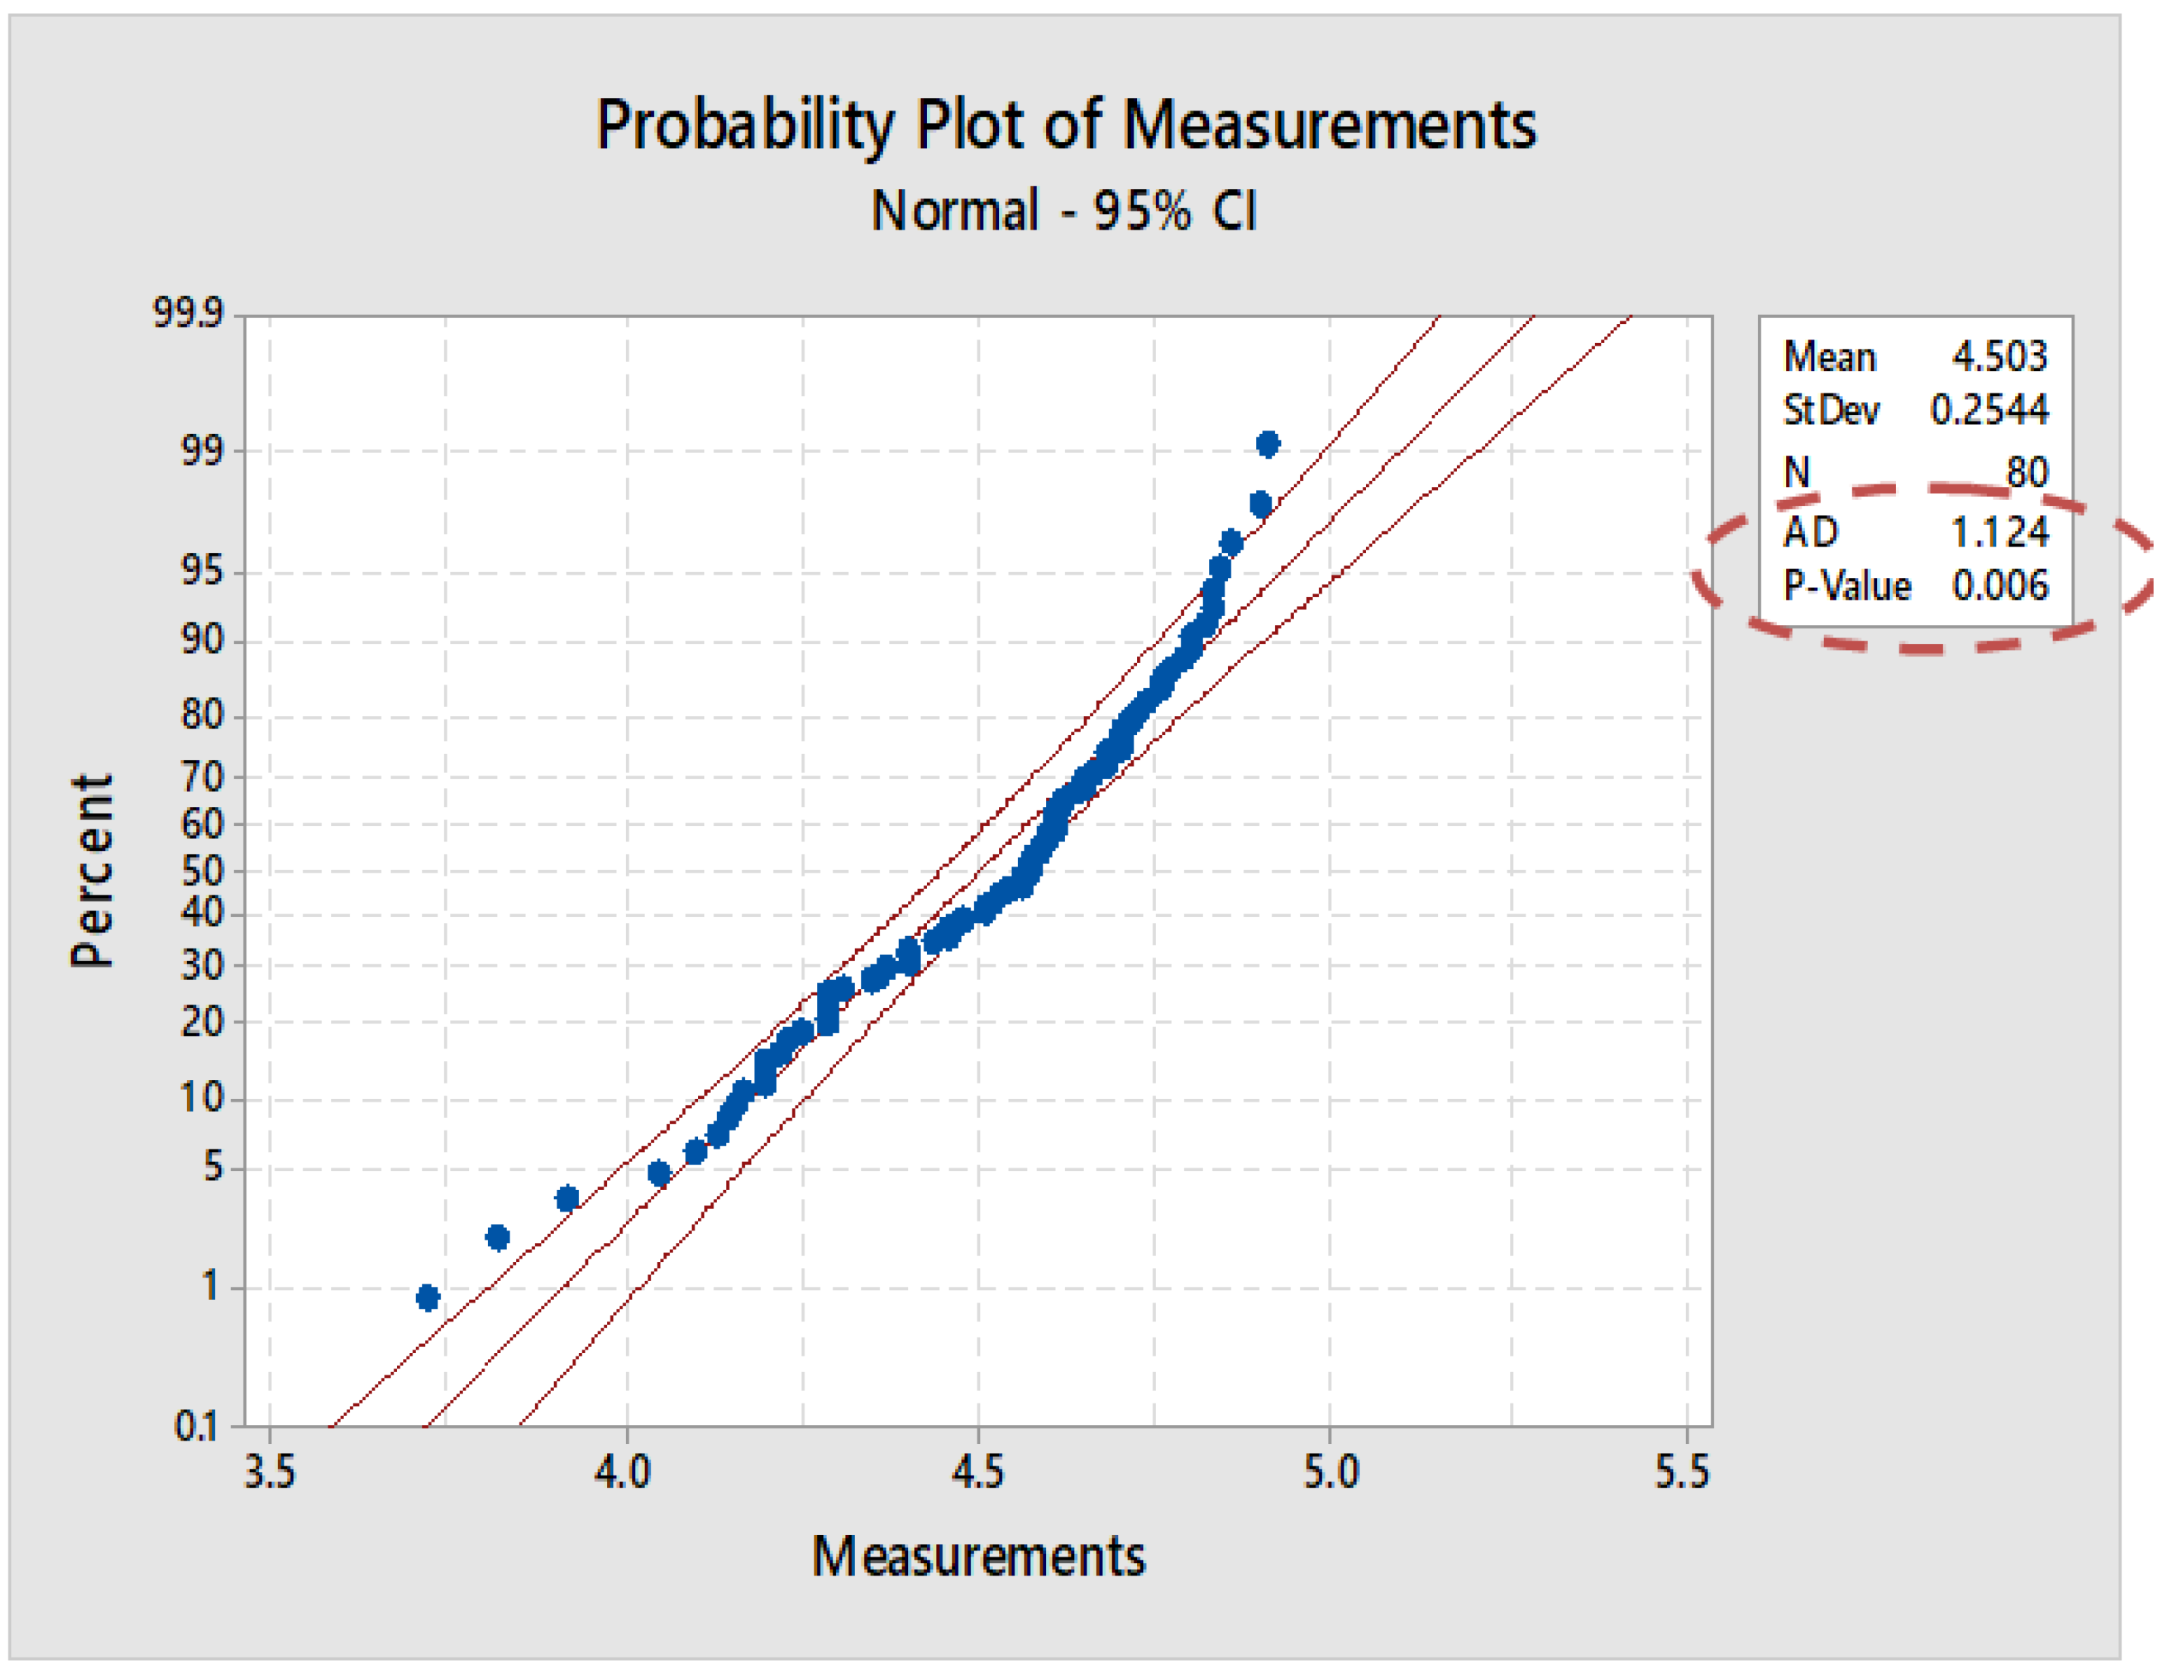
Under the given conditions, the goal is as clear as possible, that is, it is desired to eliminate the number of scraps that appear in the process of bending the metal case. The degree to which the data collected follow a normal distribution must be examined through analysis. The Minitab application was used to build a normal probability graph (Figure 11). We can use this graph to determine whether the data are regularly distributed. According to the research, there is a 97.1% possibility of generating a part without any flaws.
Figure 12 shows that the data are normally distributed. The cumulative probability (pi) is associated with each data point plotted in order and can be calculated for our study using Equation (1).
where:
- n—data points.
- i—value for each of the n data points.
The two statements that make up hypothesis testing are the null hypothesis and the alternative hypothesis. The alternative could indicate whether at least one group is more than, smaller than, or not equal to the other groups, while the null hypothesis indicates that all the groups are equal. A p-value greater than 0.05 means you cannot reject the idea that the data groups are like each other. This indicates that there is a good chance that they are comparable or that they share the same originating source (distribution), or that you lack the data necessary to statistically verify any potential differences. Equation (2) shows that the p-value obtained is greater than 0.05, which means that the two groups compared are similar.
The two statements that make up hypothesis testing are the null hypothesis and the alternative hypothesis. The alternative could indicate whether at least one group is more than, smaller than, or not equal to the other groups, while the null hypothesis indicates that all groups are equal to one another. A p-value greater than 0.05 means you cannot reject the idea that the data groups are like each other. This indicates that there is a good chance that they are comparable or that they share the same originating source (distribution), or that you lack the data necessary to statistically verify any potential differences. Equation (2) shows that the p-value obtained is greater than 0.05, which means that the two groups compared are similar.
p = 0.161 > 0.05
4.3. Analyse Stage
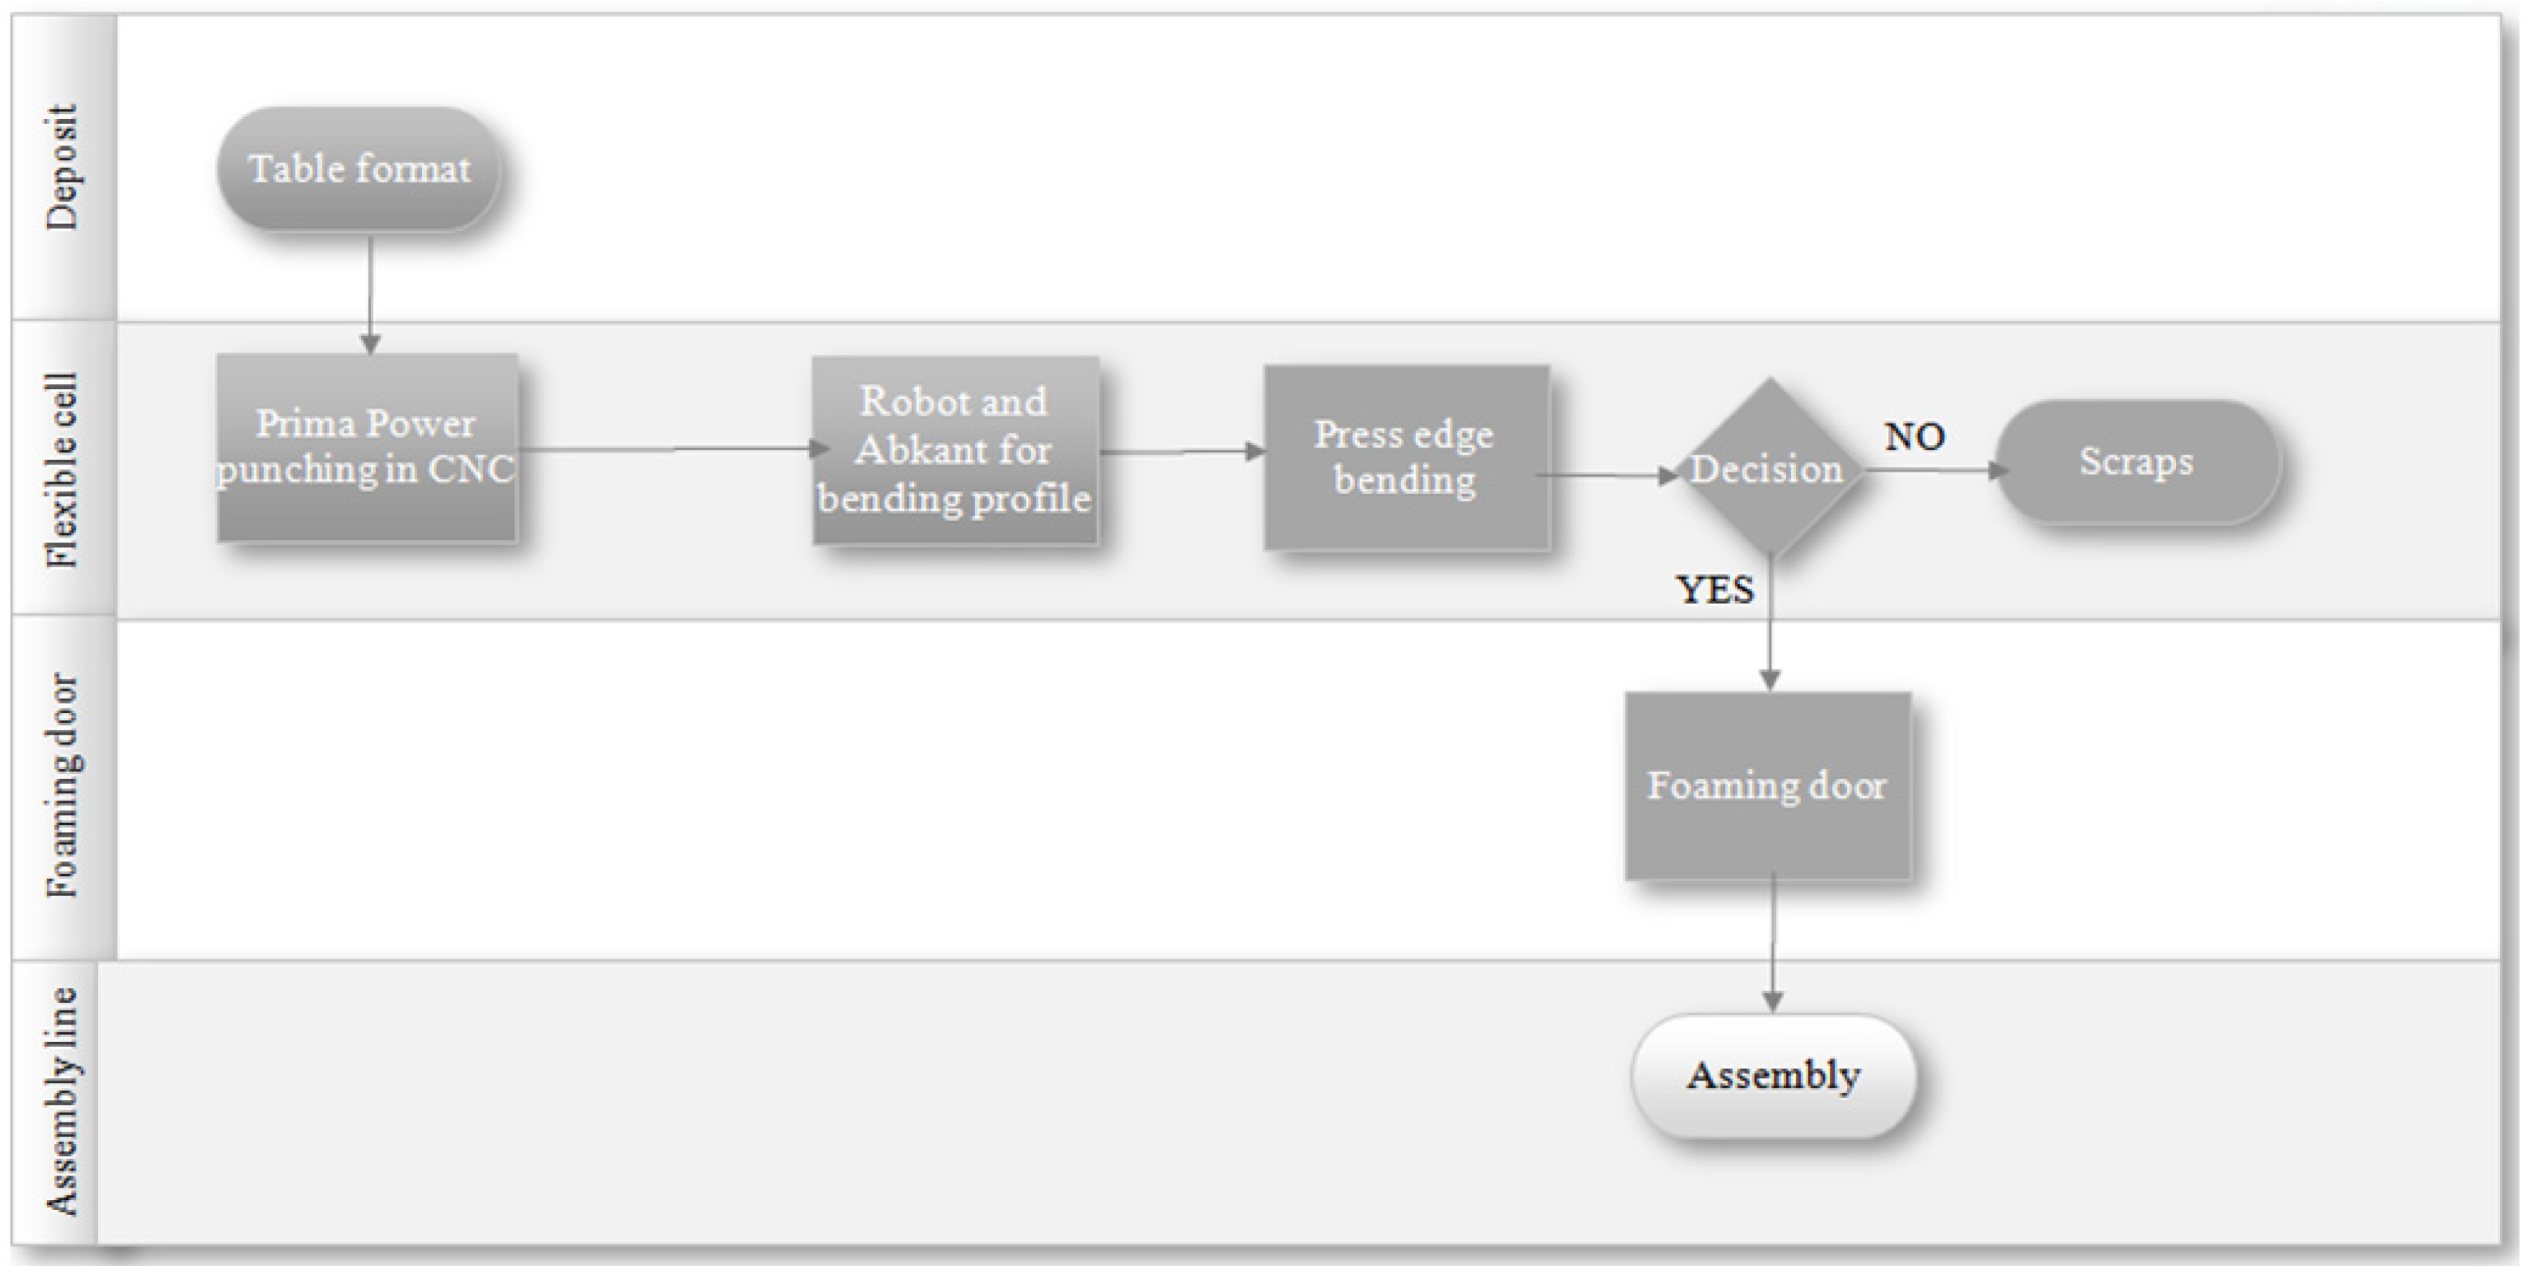
It is vital to make a process map of the techniques we look at to comprehend how the metal casing is made (Figure 13).
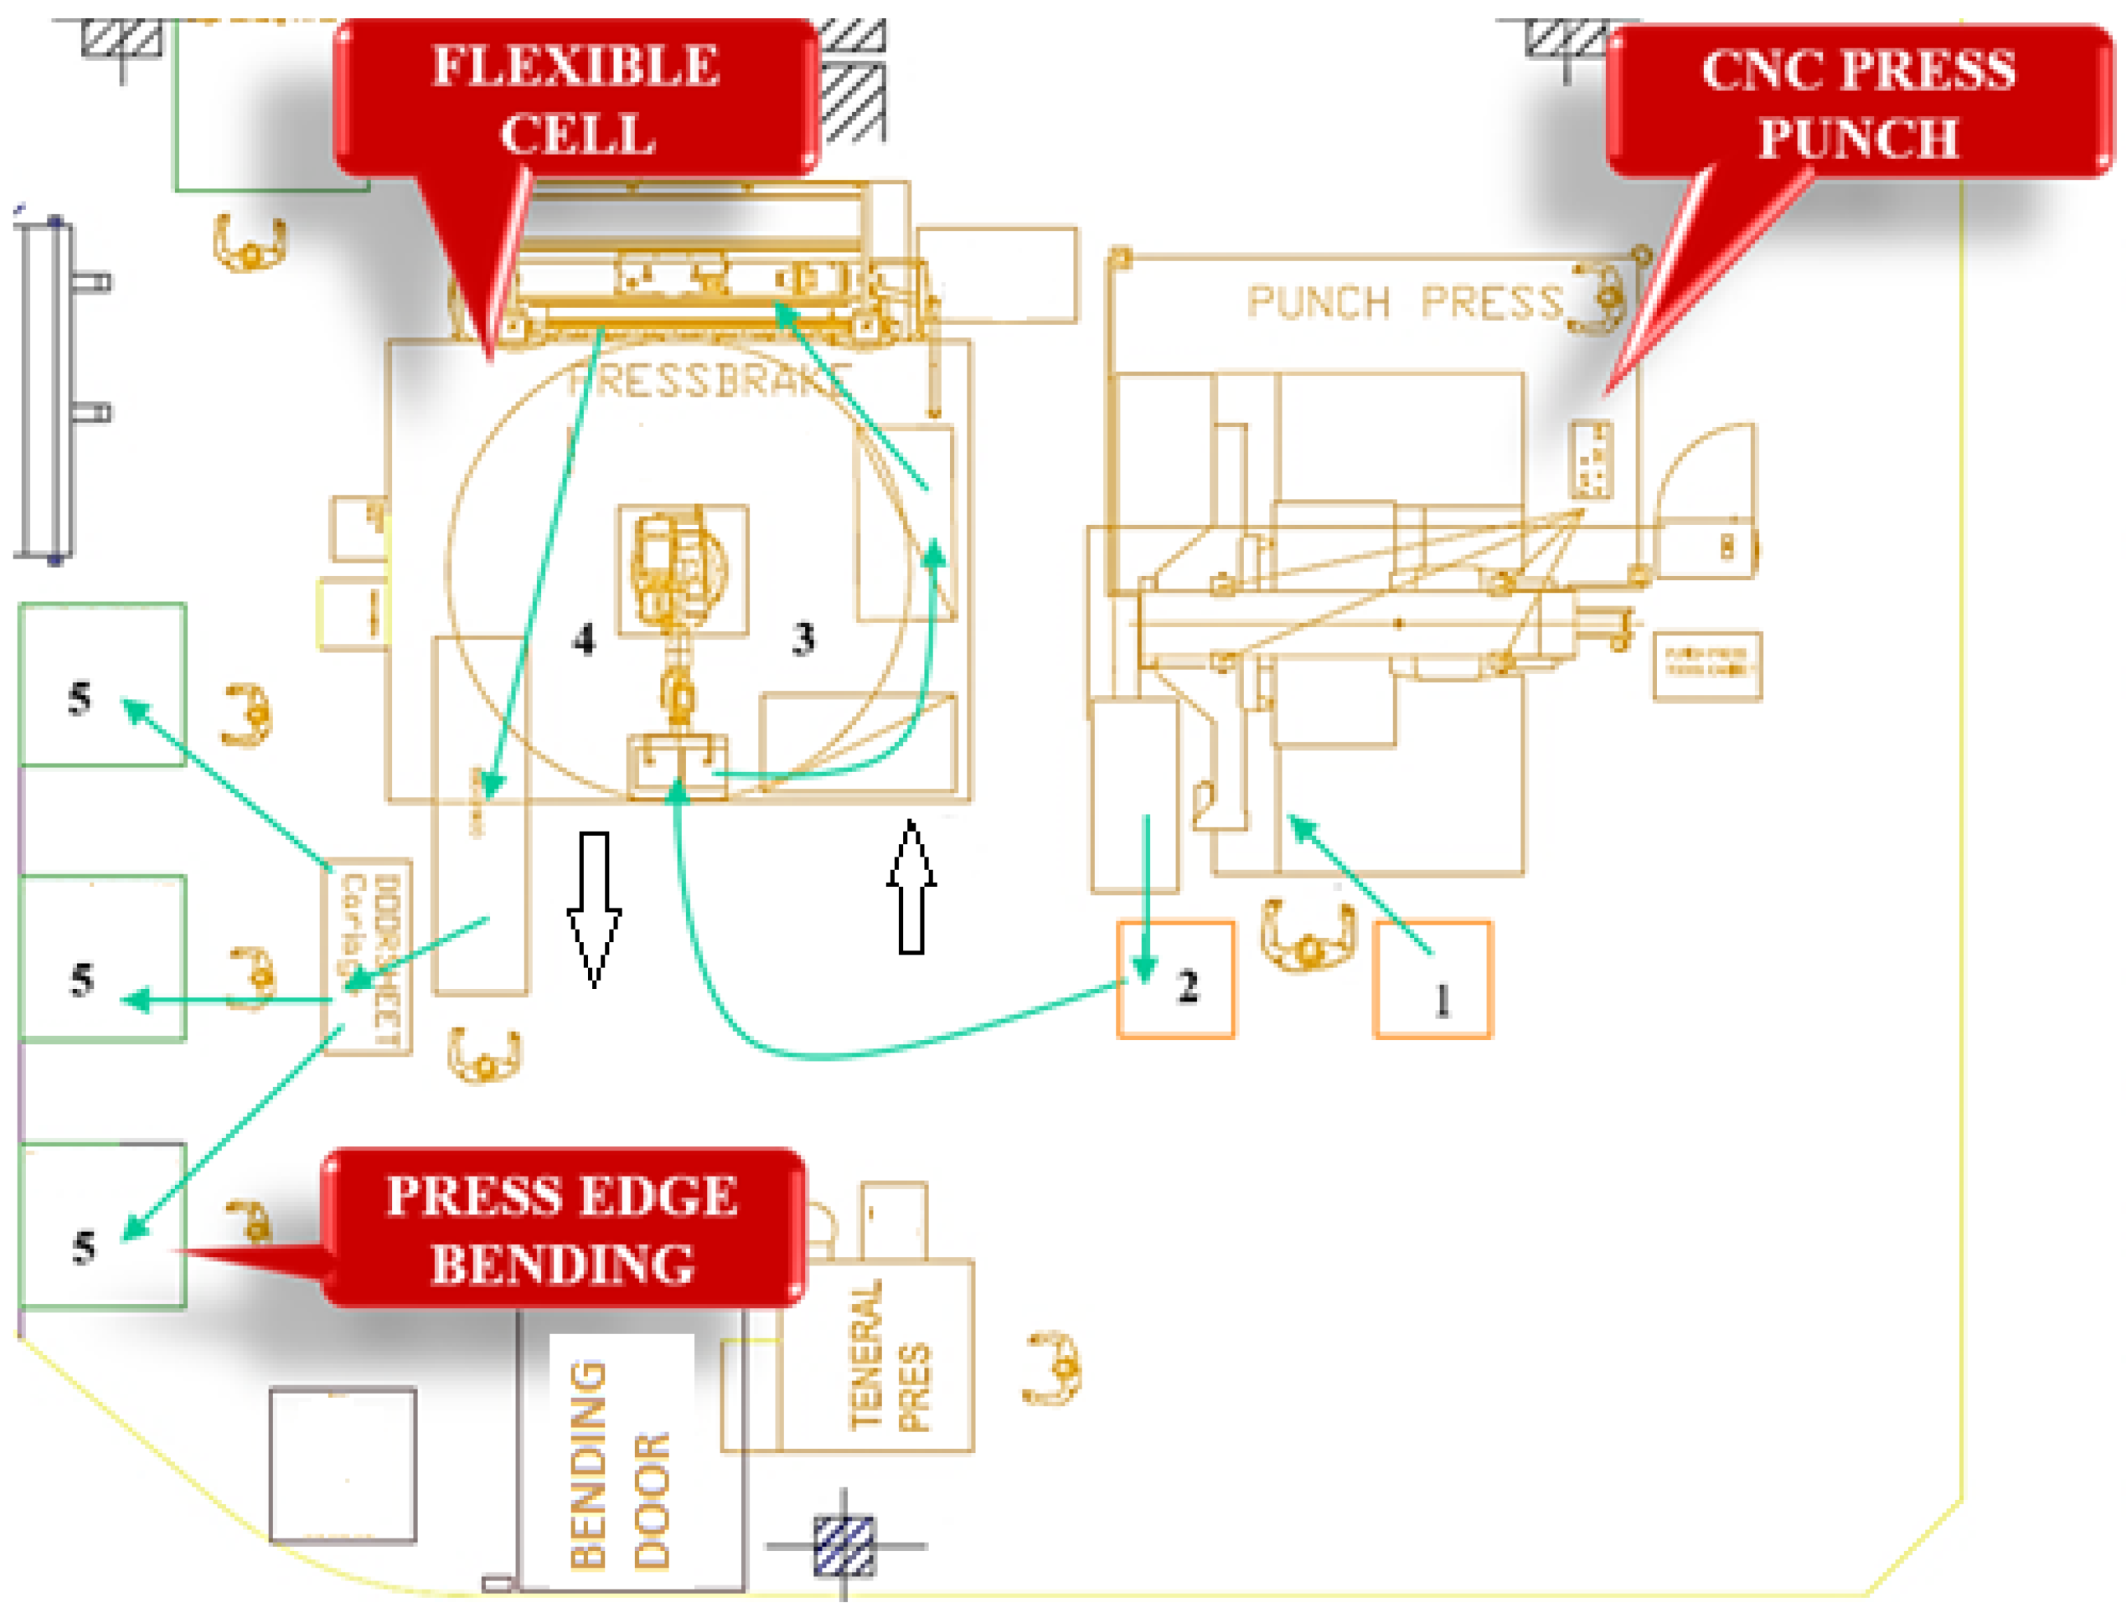
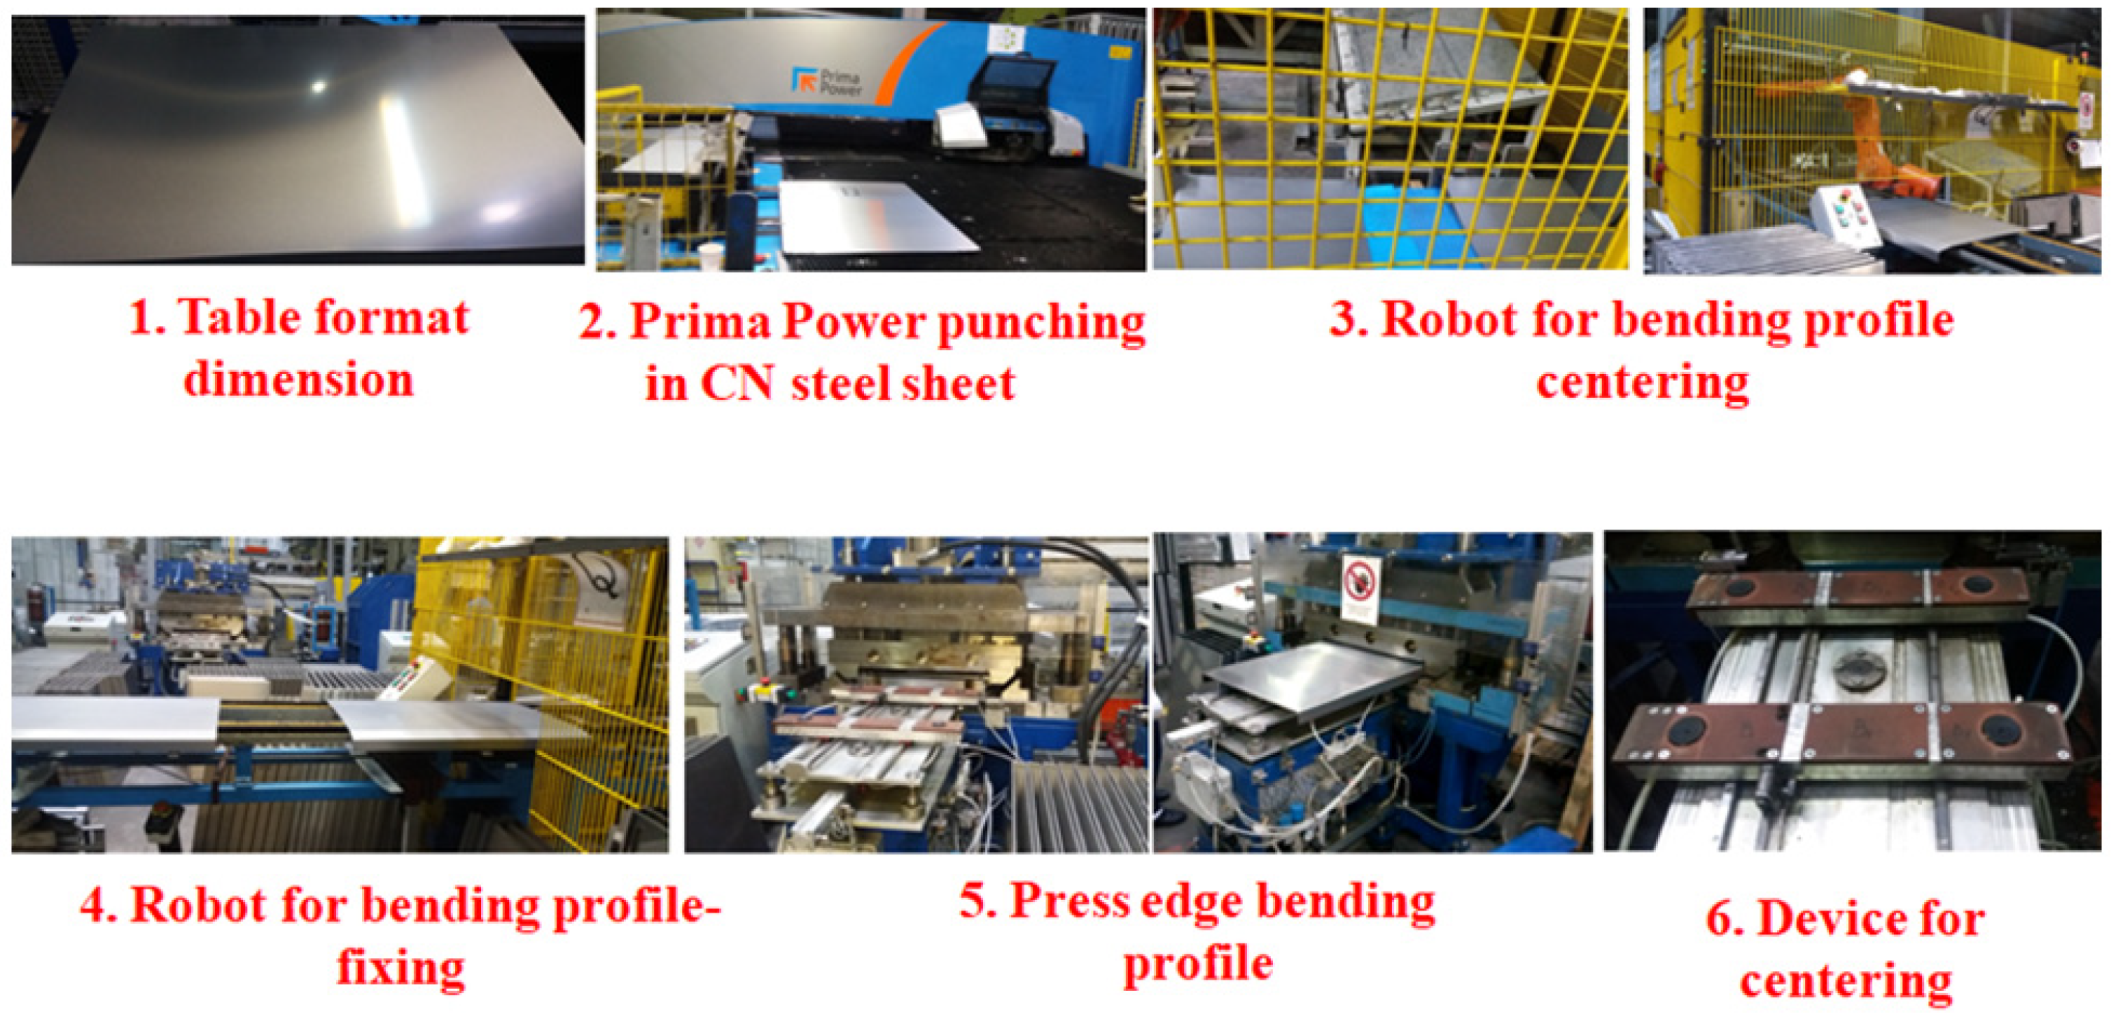
Each stage must be described in detail (Figure 14) to comprehend the process and conduct a better analysis of it. The selection of the best solutions for the process’s improvement will result from a thorough investigation of it. The table format comes in from another section and is stored on the operator’s worktable (1). The table is positioned by the operator on the CNC press punch (2). After the punching process, the same operator places the sheet form on the pallet. The pallet is placed on the feeder of the flexible cell, which will center and bend the sides of the sheet format (3). After finishing the bending process in the flexible cell, the robot places the sheet format on the evacuation conveyor (4), which is picked up by the operator and processed on the edge bending press (5) using a device for centering (6).
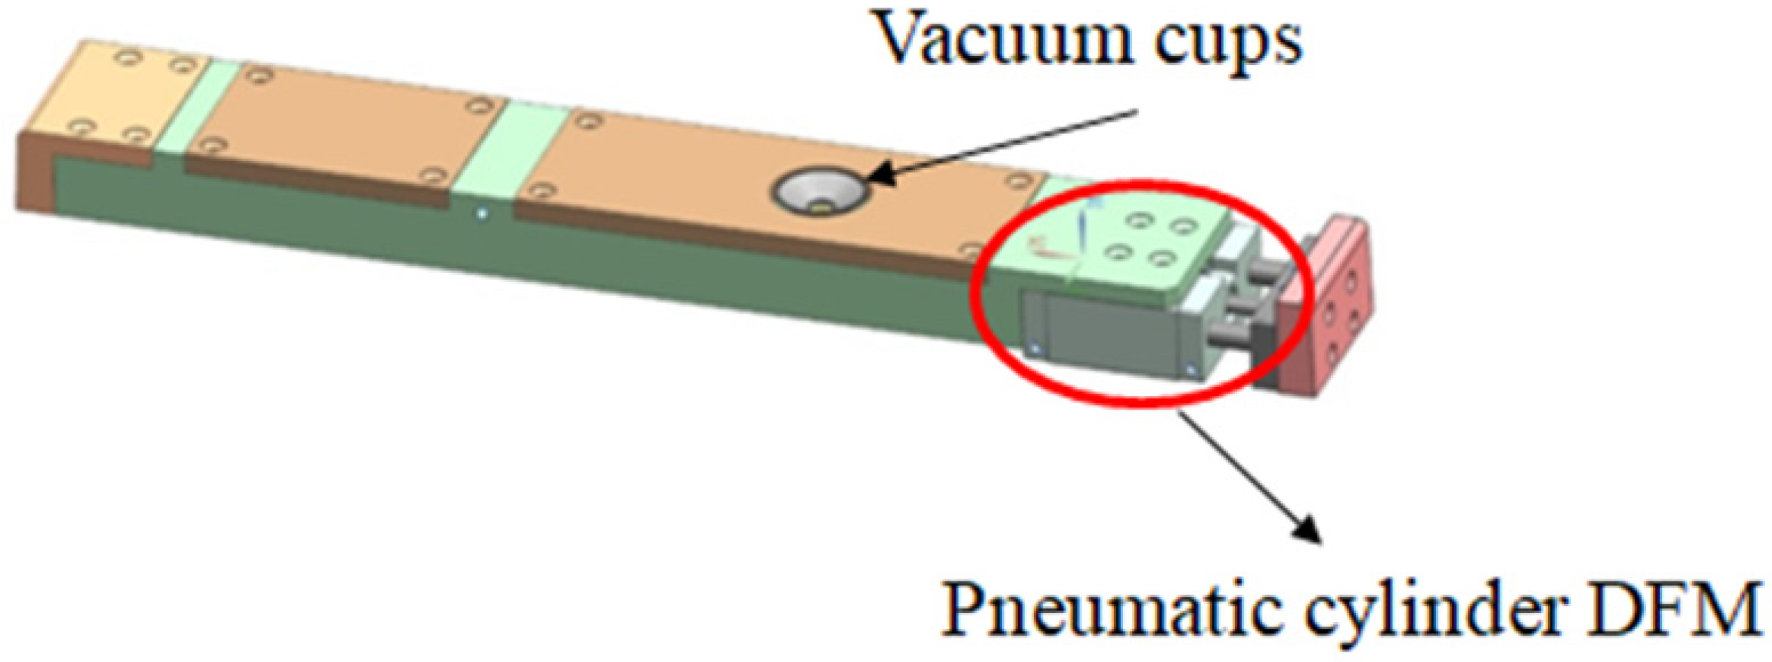
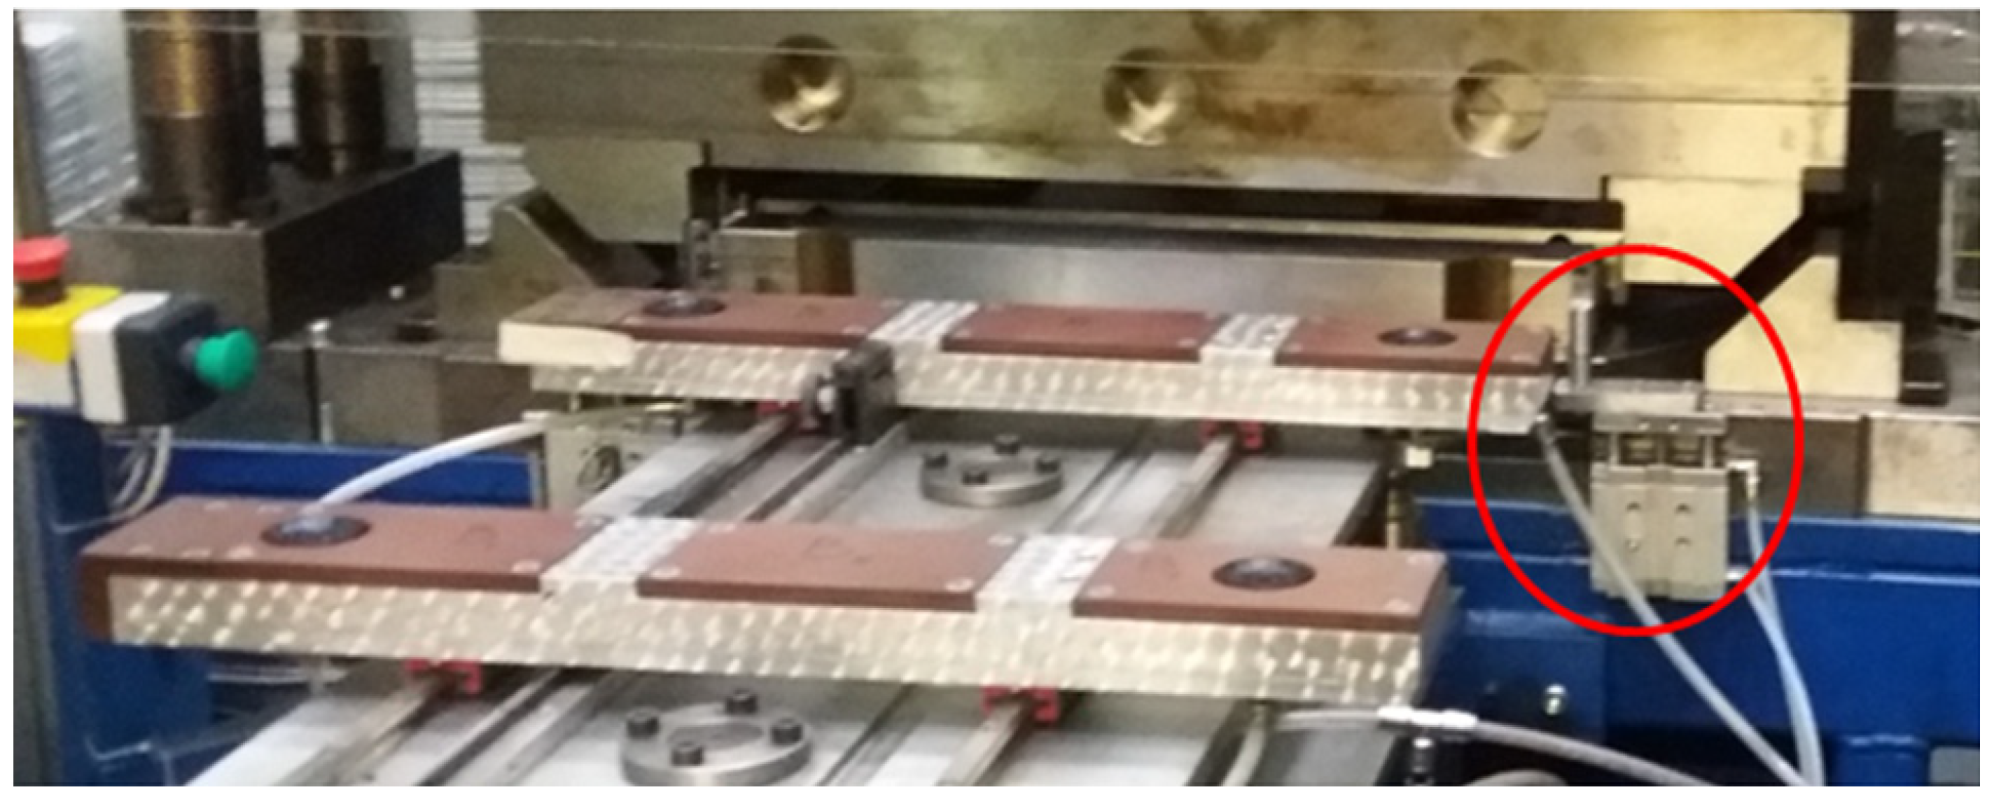
The sheet metal plates are decentralized to the side by the DFM pneumatic cylinder; this was discovered while examining the circumstance. Figure 15 shows the DFM pneumatic cylinder. The discrepancy was due to the reduced number of vacuum cups. Figure 15 shows the DFM pneumatic cylinder and the areas where the vacuum cups are located.
The problem is the wrong position of the pad. One problem is related to the adjustment of the sheet metal during the punching process. When the operator removes the metal casing from the door of the flexible cell, he has not placed it in the initial stop position (Figure 16).
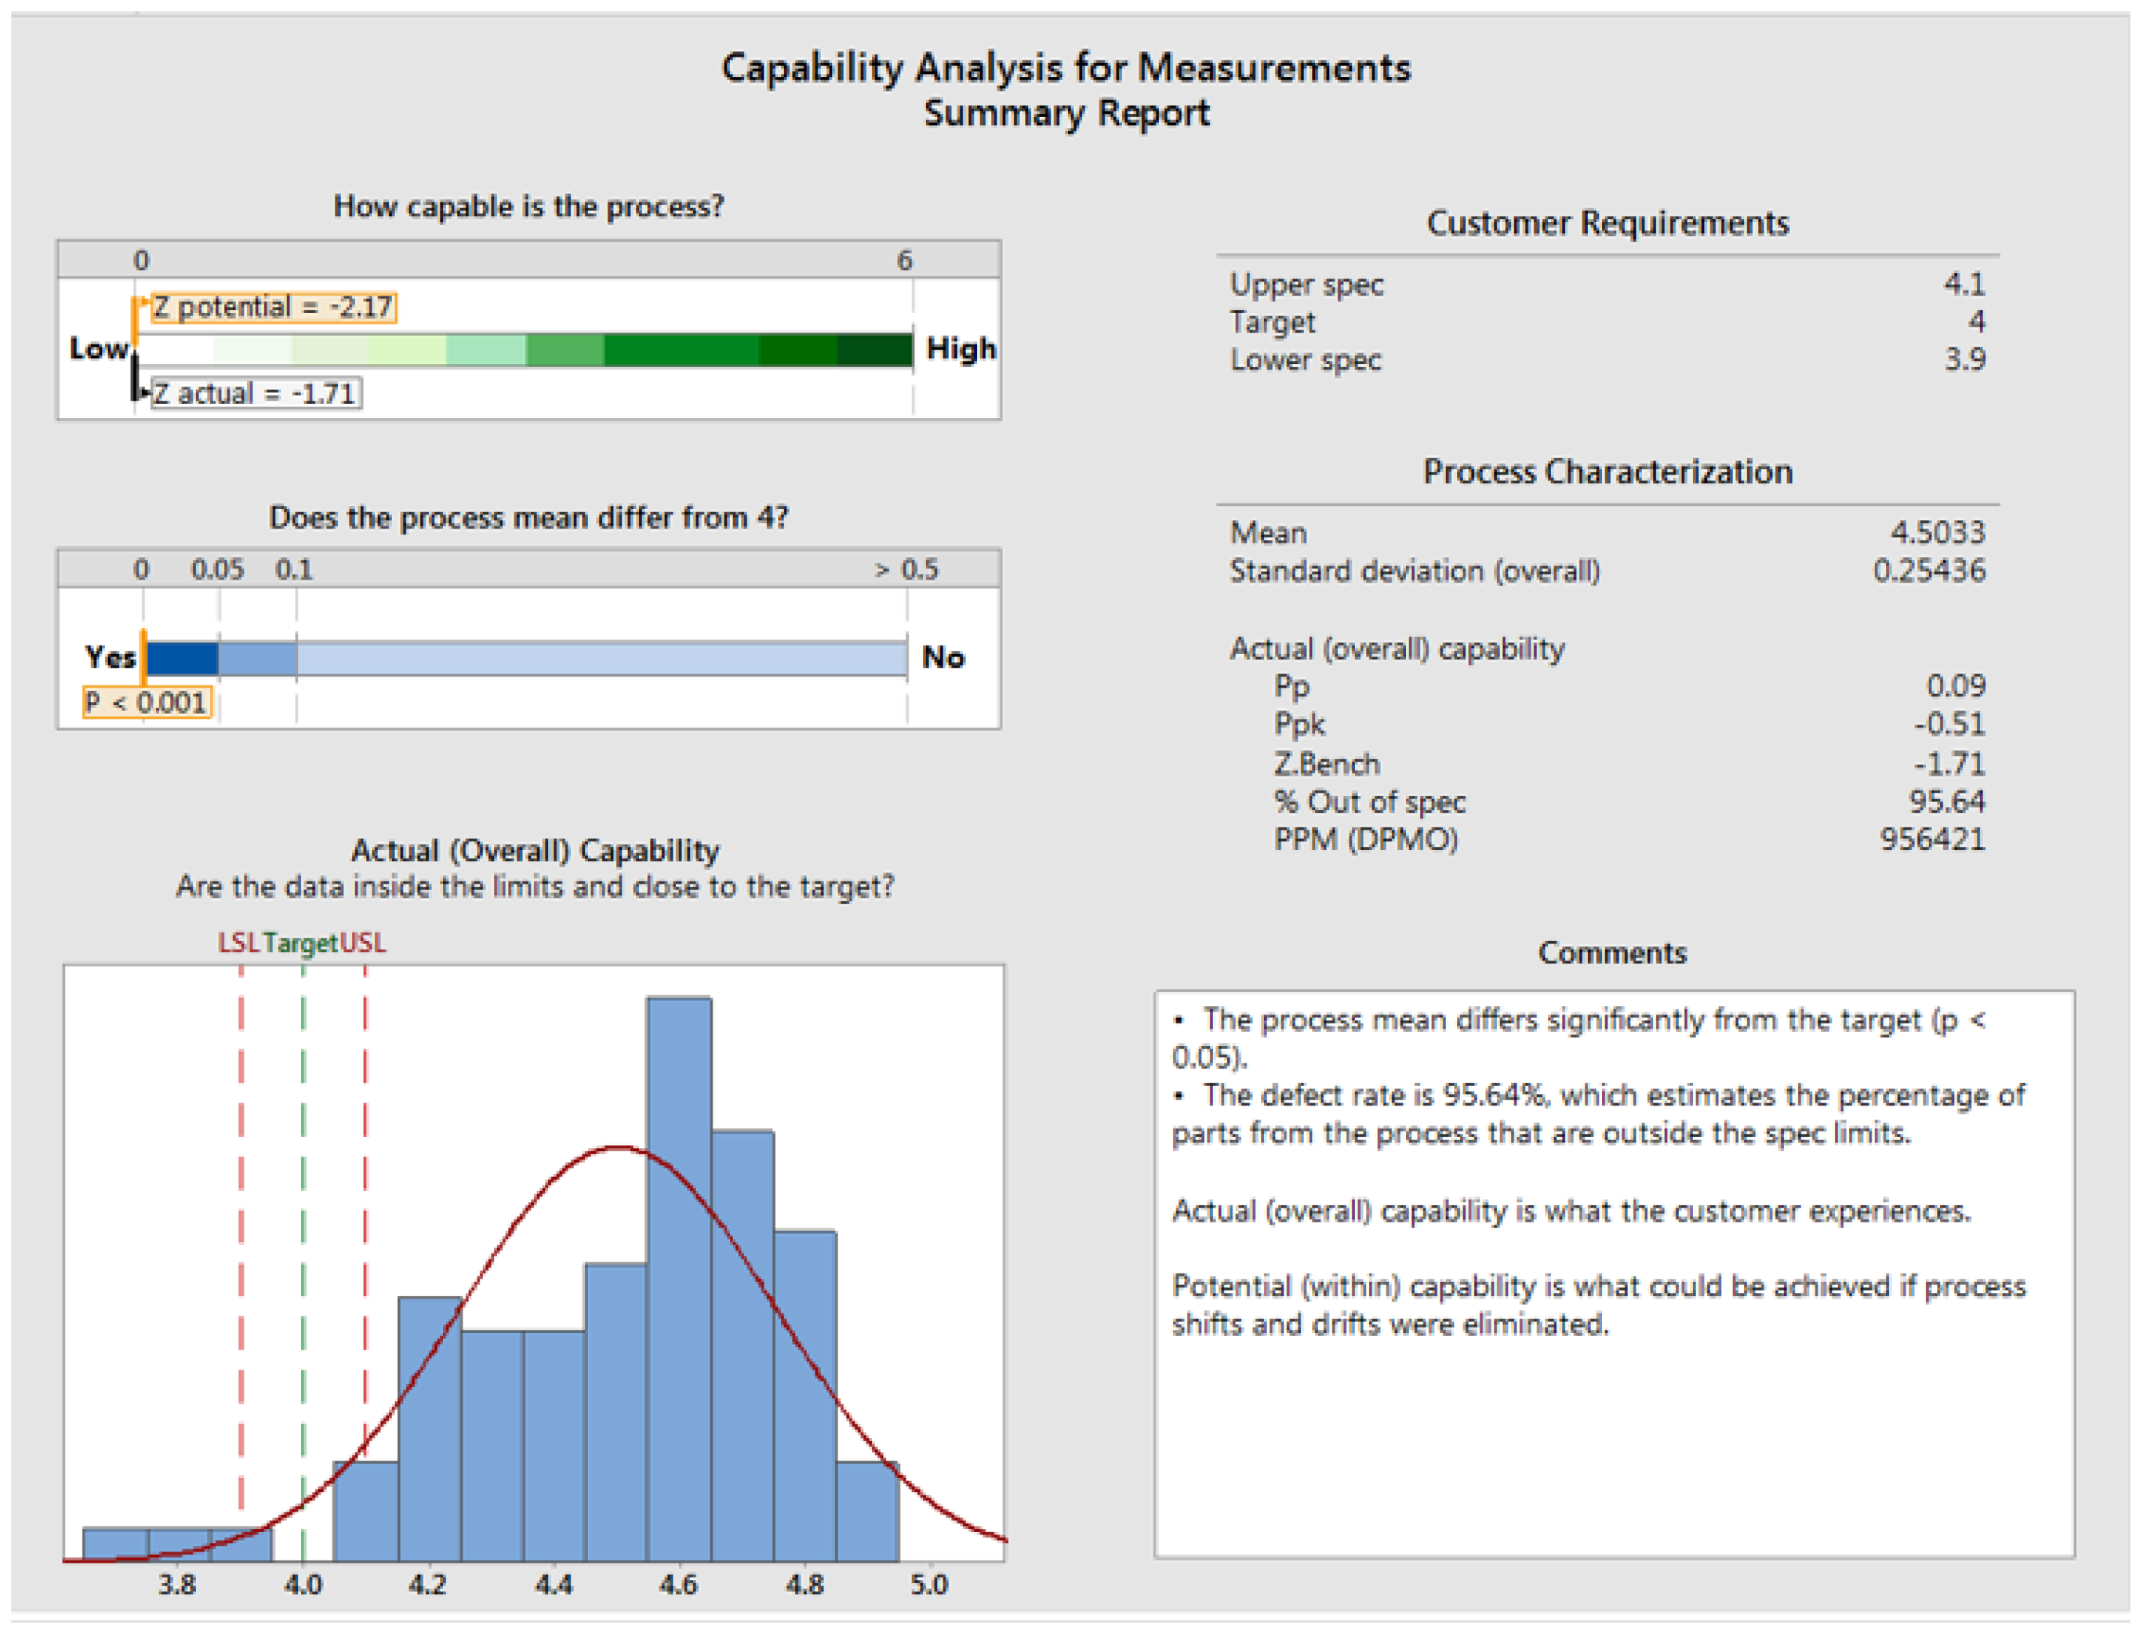
According to the execution drawing, which is exemplified in Figure 5, the bending dimension must be 4 mm (−0.1 + 0.1); the dimensions were not respected if we analyze Table 5.
p = 0.006 < 0.05
Poison distribution analysis is required for the measurements made by both operators.
4.4. Improvement Stage
In this phase, a plan of the solutions that can be implemented will be drawn up to optimize the process (Table 7). Starting with the stated issue, the causes found in the earlier stages will be listed. For each cause, a solution for improvement will be devised, and the results will be presented.
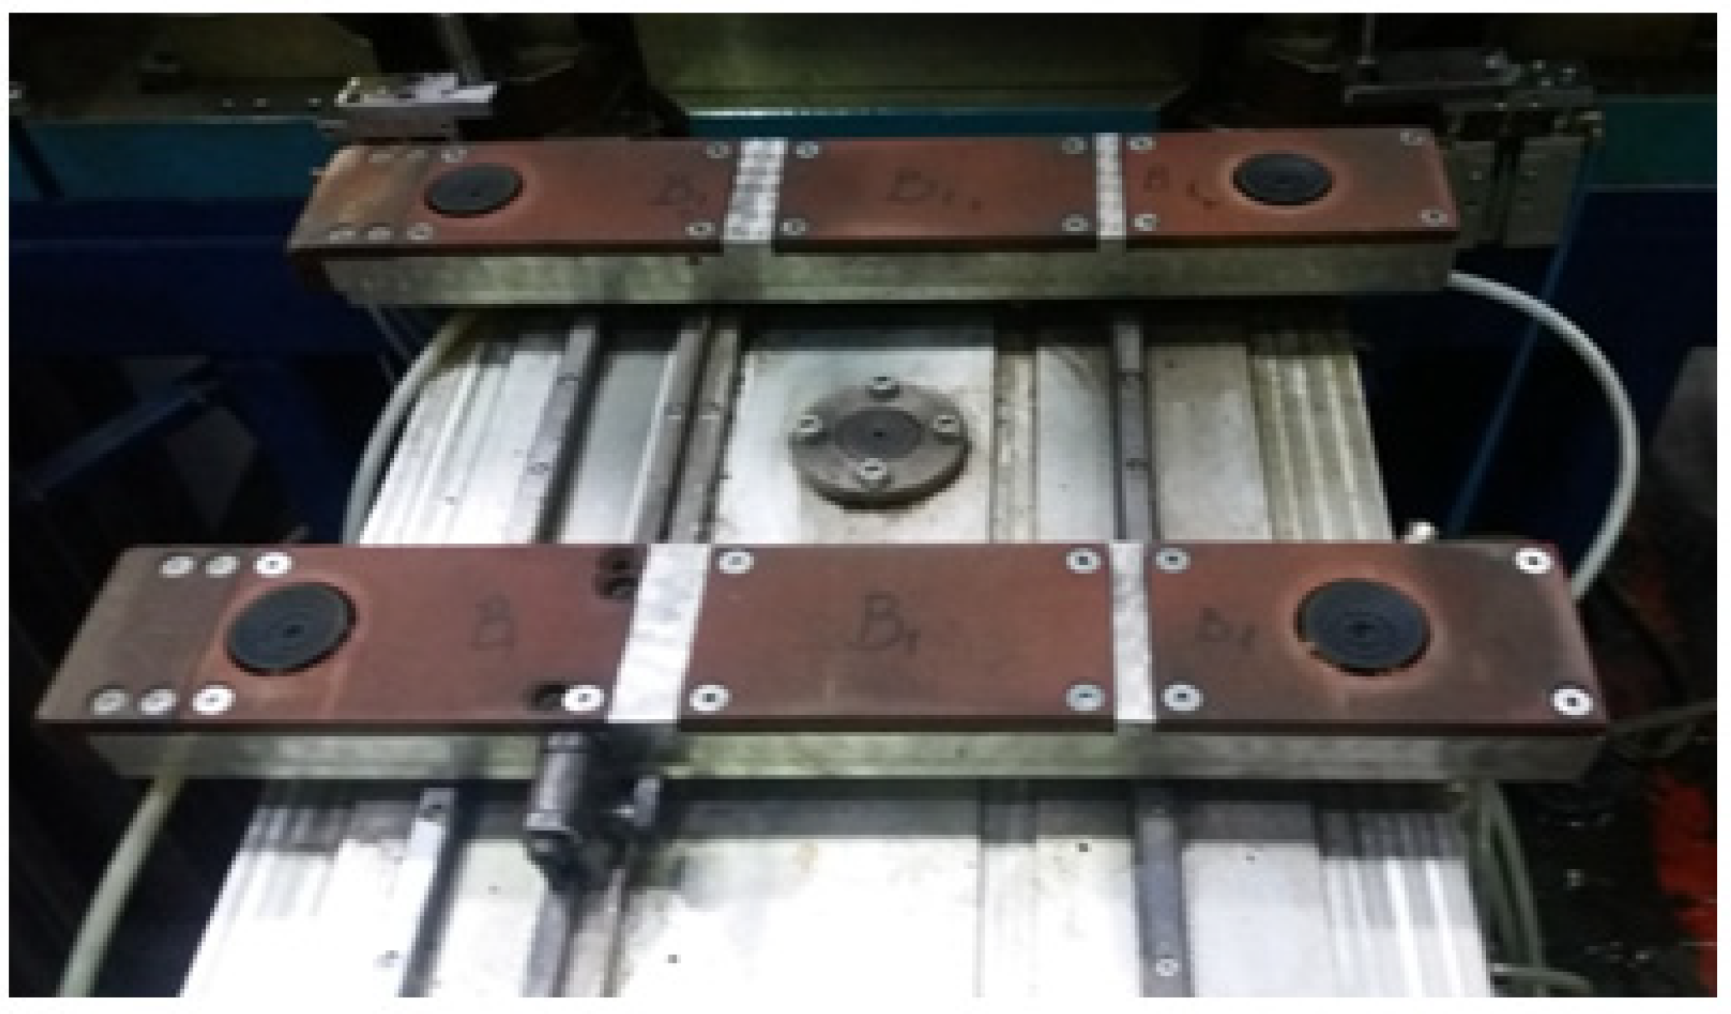
During the analysis phase, it was discovered that the press’s pneumatic cylinder, which prevents the steel sheet from being properly centered, was used to bend steel sheets laterally. The pneumatic cylinder was removed from the process to improve it, and a new vacuum cup was created to increase the locking force (Figure 20). After improvement, we achieved a good efficient centering and locking system during the edge bending operation.
4.5. Control Stage
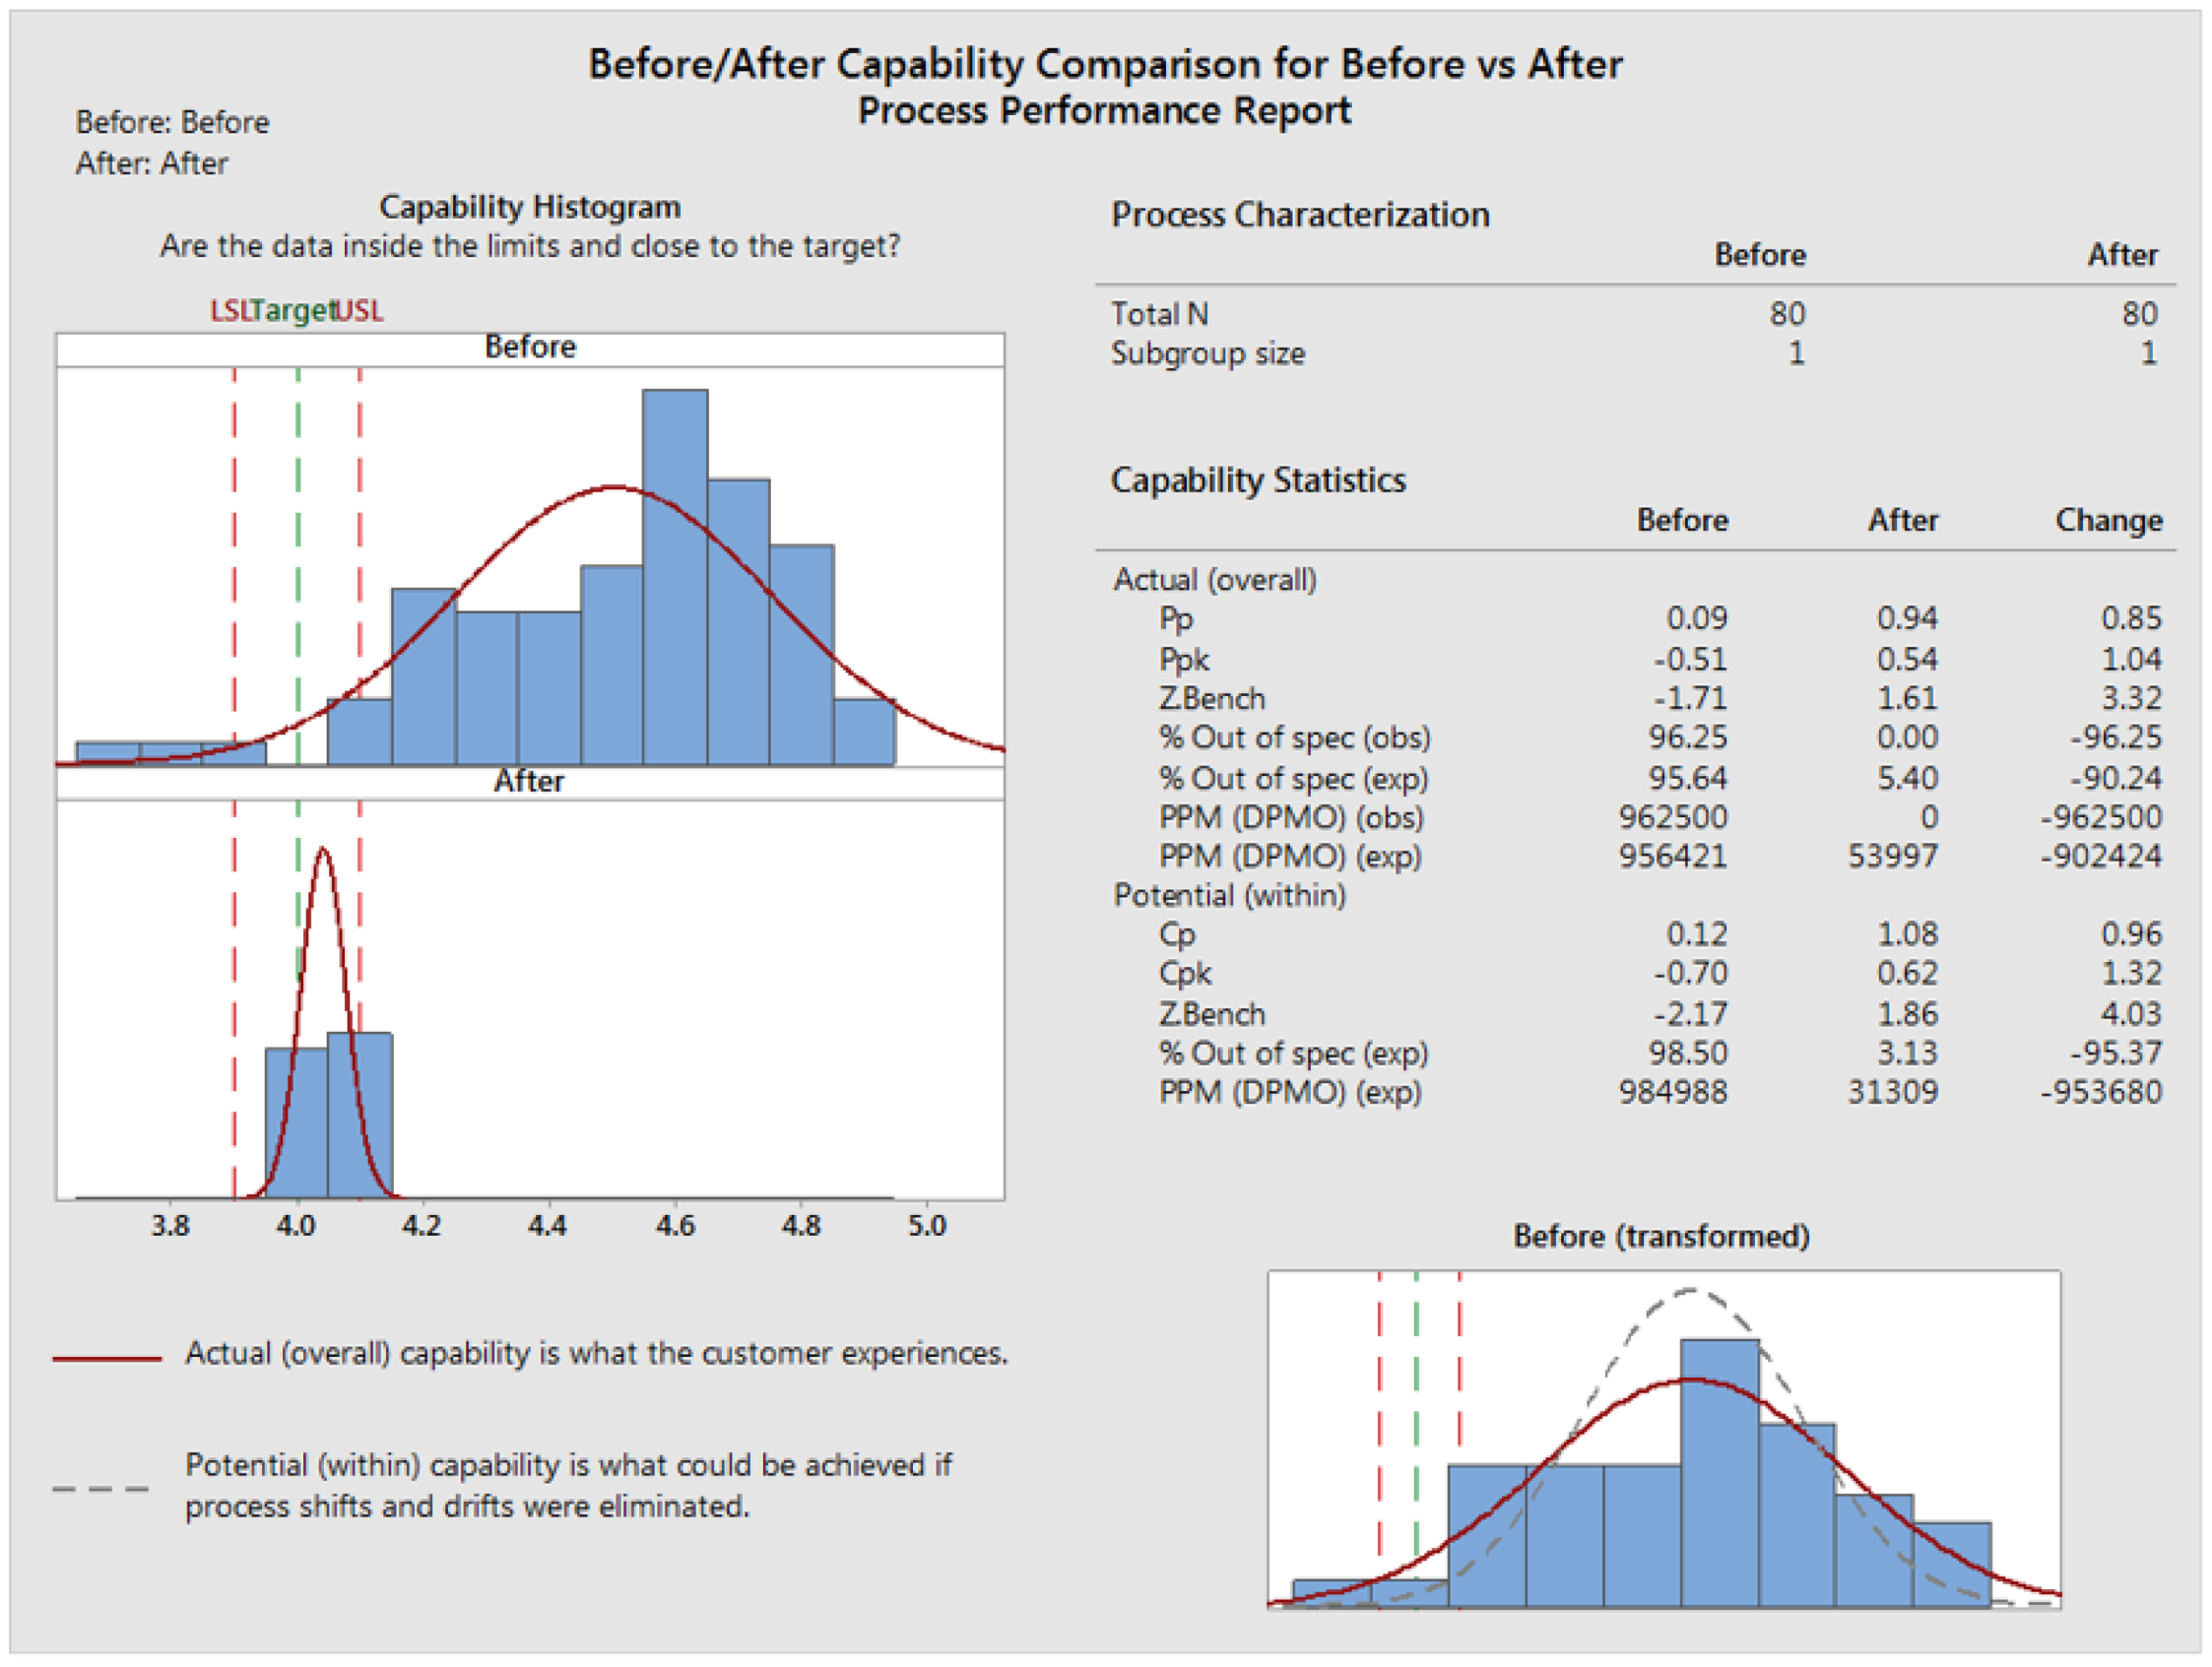
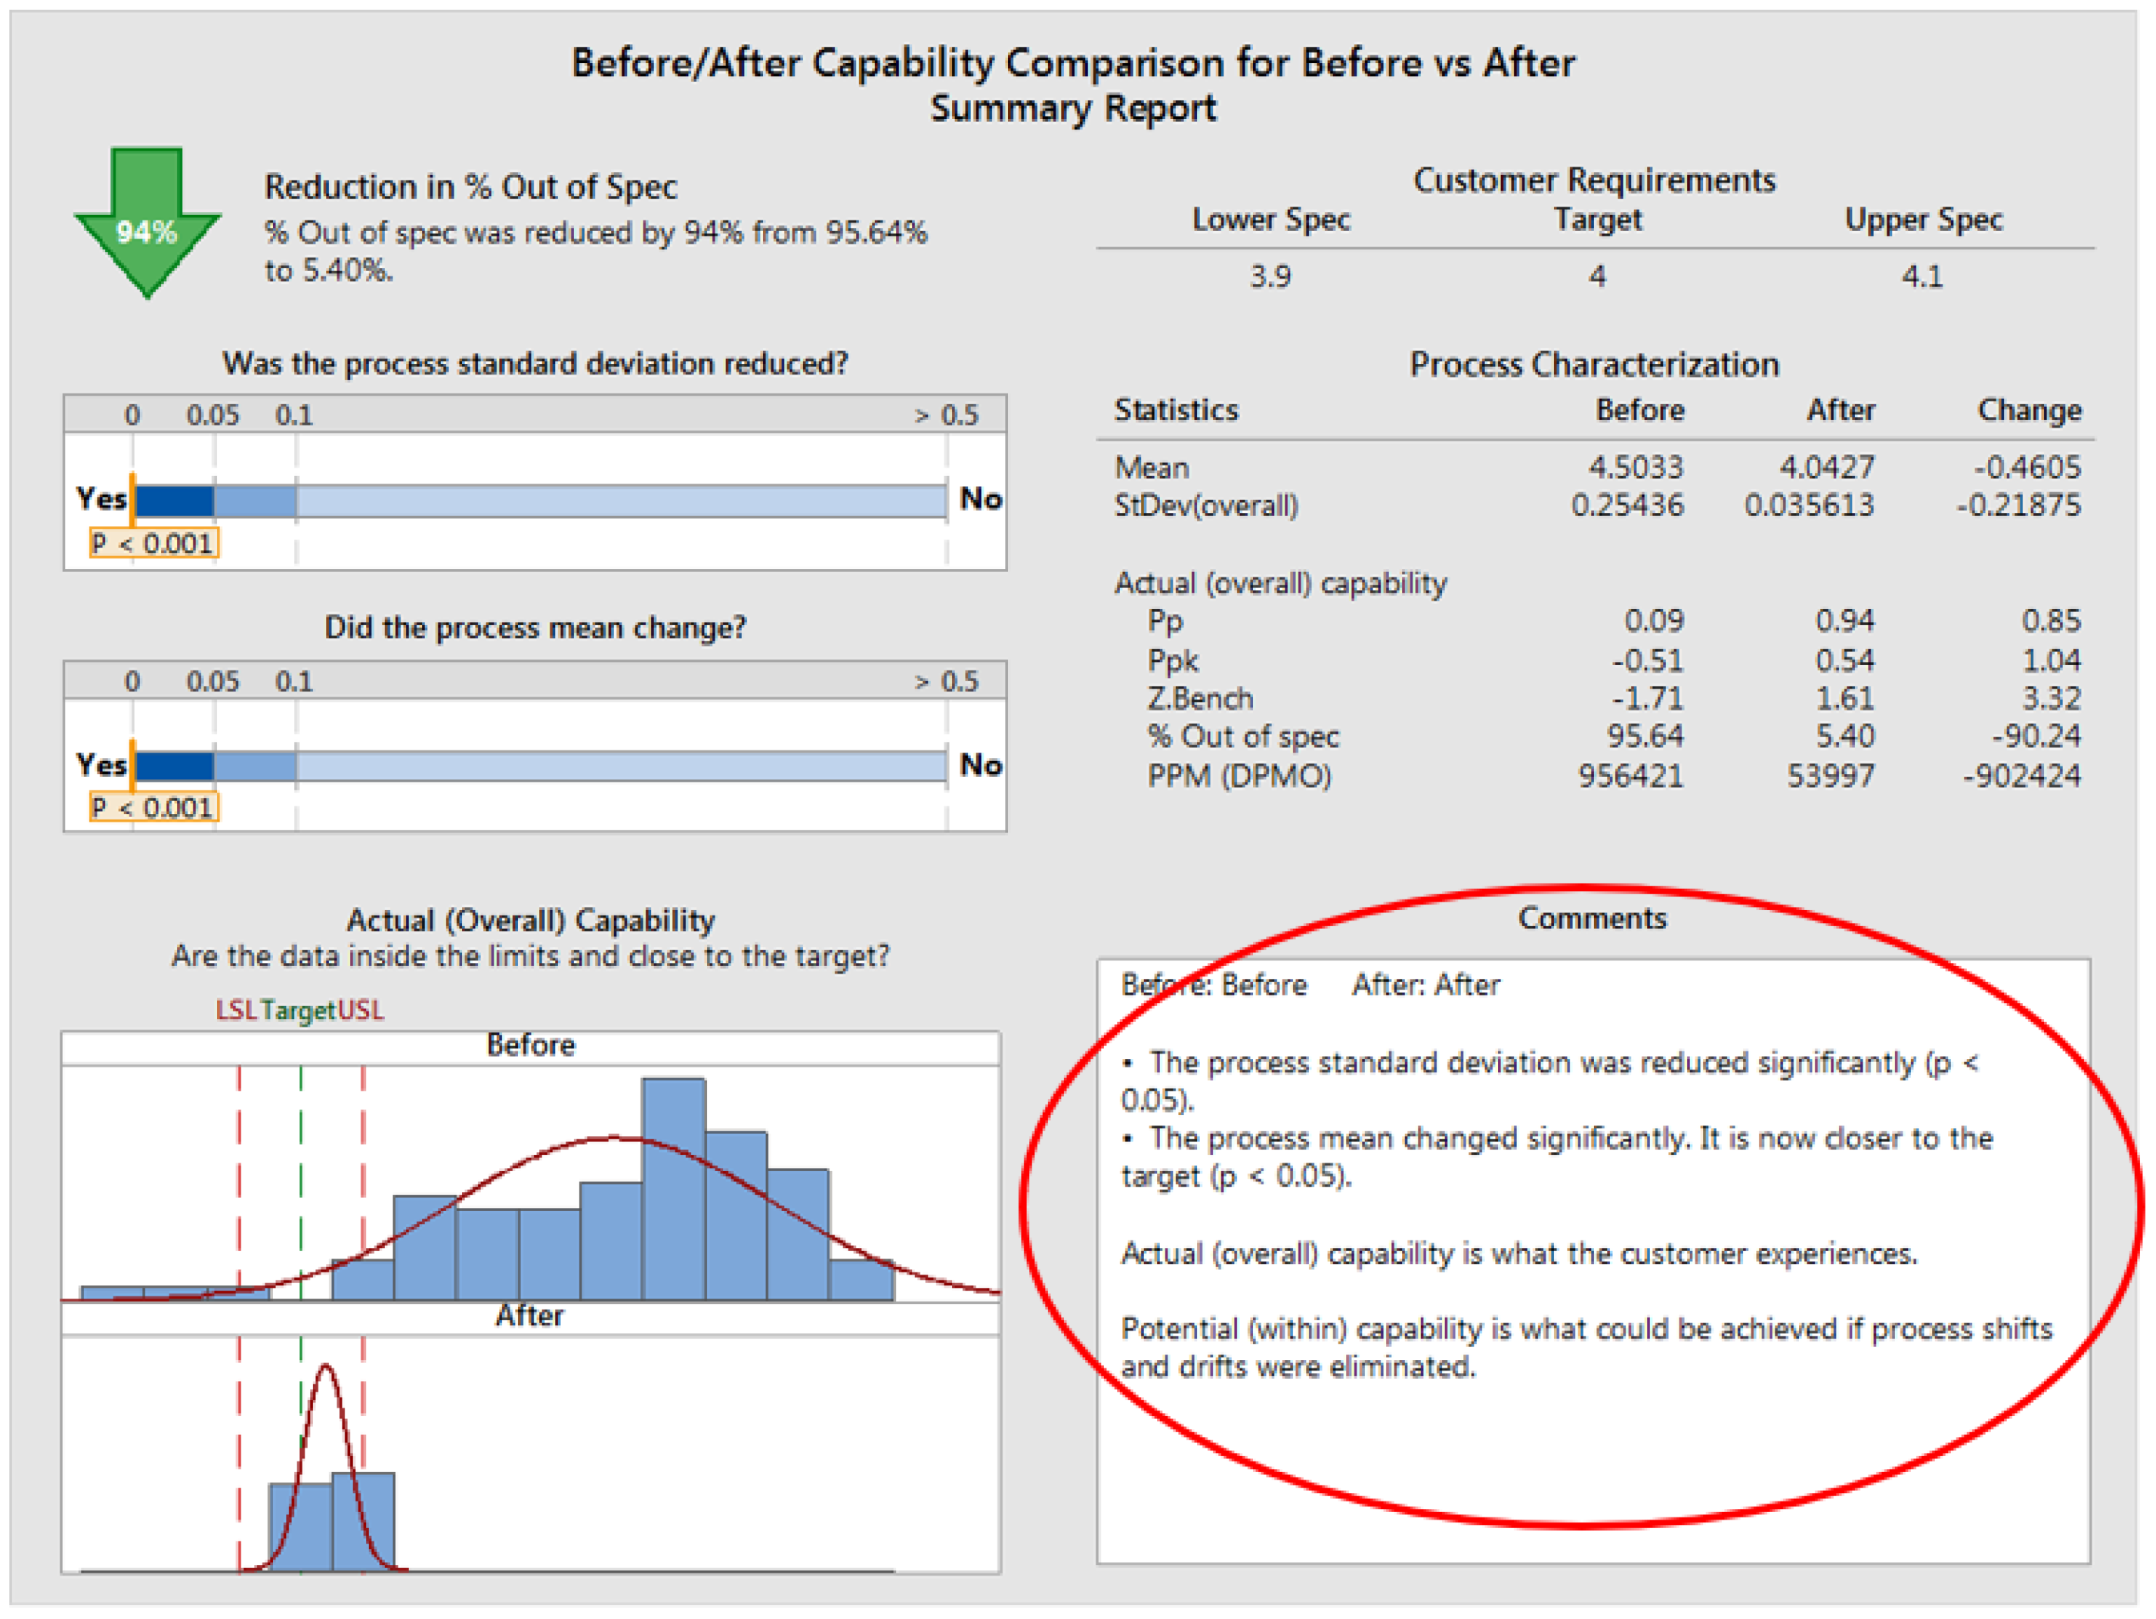
A new set of measurements were taken for the area where the bending happens after all the solutions suggested during the analytical phase had been put into practice. The capability of the process was compared to the earlier capability analysis for the new data set to produce a performance report (Figure 21).
This performance ratio shows that the standard deviation has been significantly reduced (Figure 22). The process mean has changed too: the actual overall capacity is what is in line with the customer’s experience, and the potential capacity is what could be achieved if the process shunt changes were eliminated. The scarp obtained for the studied process was observed (Table 9) after the solutions had been used for 22 days.
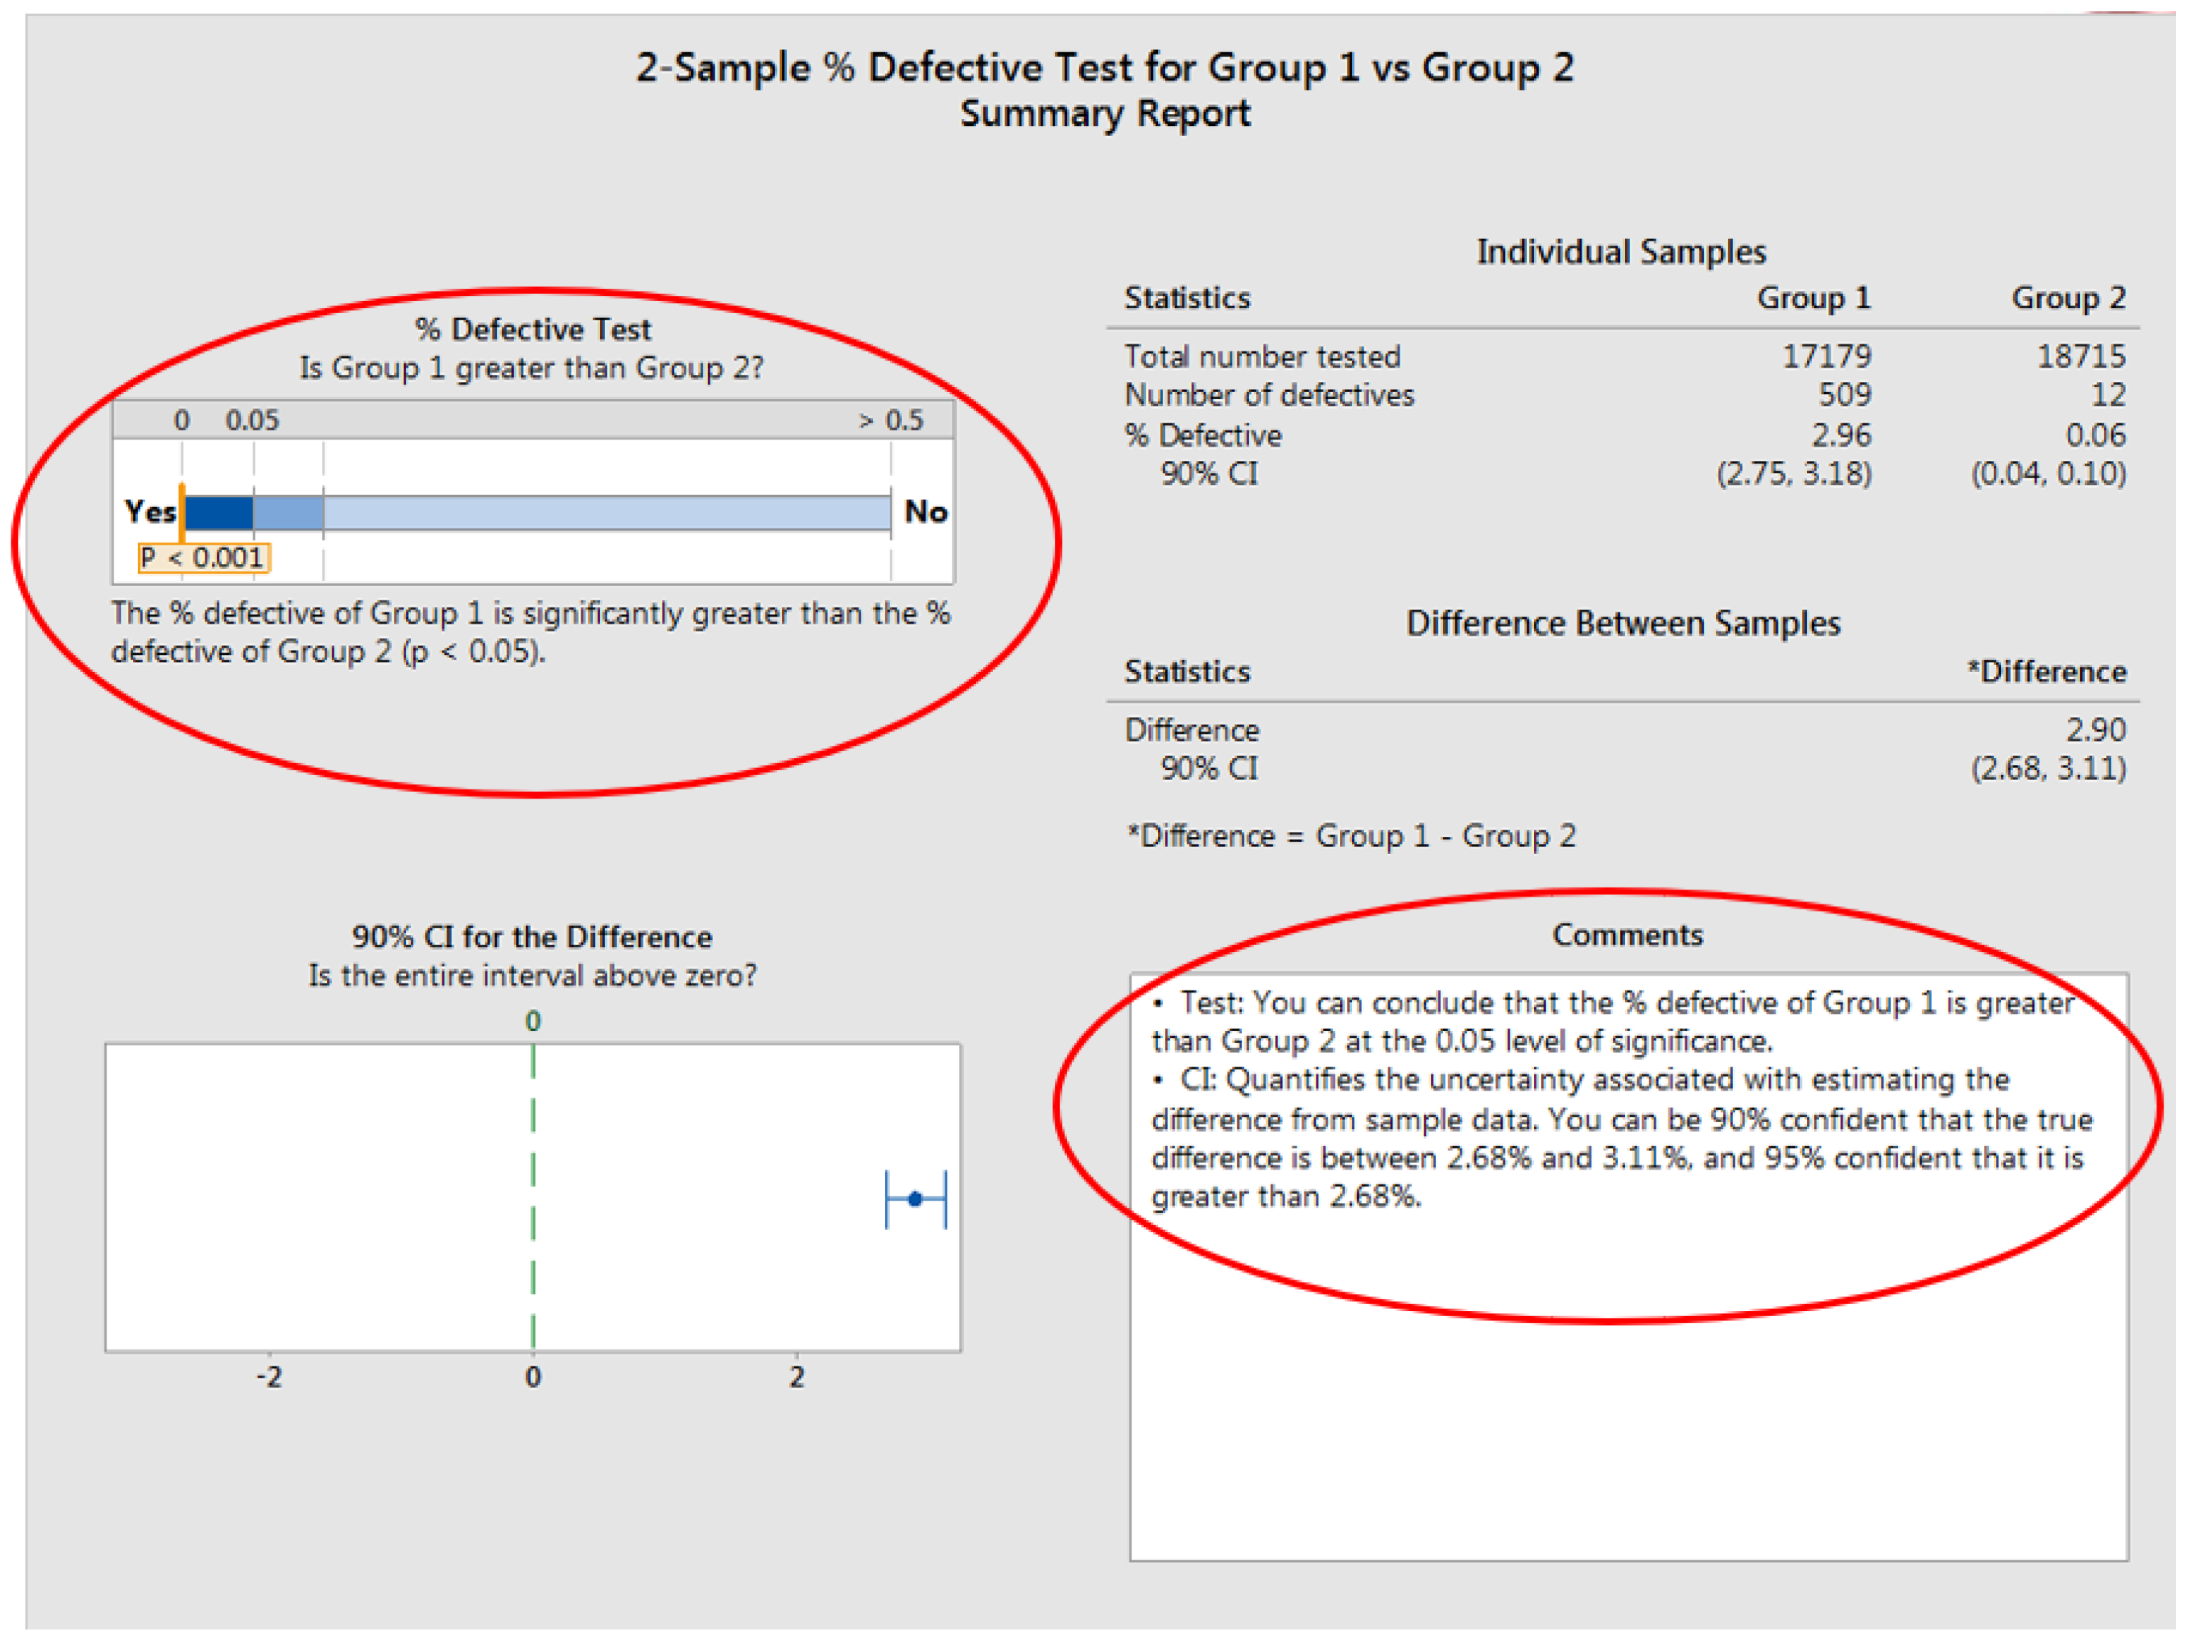
To determine whether the mentioned solutions are successful in lowering the amount of scrap, a before-and-after comparison analysis is required. For this comparison (Figure 23), we used two samples, and we can consider two hypotheses.
- (1)
- The first hypothesis Ho: pBefore = pAfter
- (2)
- The second hypothesis Ha: pBefore ≠ pAfter
Minitab software was used to compare the first set of measurements with the second set of measurements taken after the implementation of the solutions.
As we can currently see with the impact of the measures addressed, a comparison between the groups of measures taken before and after the improvement phase is crucial. The comparison reveals that the two sets of measurements differ in an obvious and significant way. From the statistical check, we can conclude that the percentage defective of the first measurements is greater than the measurements made after improvements at 0.05 significance. We can be 90% confident that the real difference between the two samples is between 2.68% and 3.11%, and 95% confident that it is greater than 2.68%. We can be confident that the solutions suggested will help us achieve the goals we have set because of this statistical analysis. The new solutions suggested must be standardized at the organizational level to be accepted.
An extra vacuum cup has been added to the centering tool for sheet steel (Figure 24). For the new centering device, an edge bending adjustment dimension was established for the metal door case.
5. Conclusions
This project’s goal was to lower the incidence of the scrap rate for the edge-bending process of metal door cases. The authors have taken a methodical approach to this issue by employing the Six Sigma approach under the stages that have been specified in the specialized literature.
This project’s goal was to lower the incidence of the scrap rate for the edge-bending process of the metal door case. The authors have taken a methodical approach to this issue by employing the Six Sigma approach in accordance with the stages that have been specified in the specialized literature.
The process under study was greatly enhanced by utilizing the five steps of Definition, Measurement, Analysis, Improvement, and Control. Ishikawa diagrams, ANOVA, SIPOC, comparative studies, capacity measurement graphs, and comparison diagrams, as well as statistical analyses, were some of the tools that were used.
The Six Sigma approach is not an easy procedure for anyone to develop; it takes employees who have received some training in addition to their standard training.
The quality of employee training is crucial to the endeavor to apply the Six Sigma approach. Since the Six Sigma method is based on data analysis, data collection and interpretation are crucial to the successful completion of the project that has been selected for optimization. Data from the studied process are correctly analyzed to provide decisions. Based on the quantifiable data and impartial judgments, solutions are produced.
In this case study, the implementation of the Lean strategy in Six Sigma led to the achievement of the objective of reducing the scrap rate for the edge-bending process of the metal door case because the Lean methodology focused on identifying and eliminating non-compliant steps in the process and Six Sigma focused on eliminating waste. It is a managerial strategy with a team focus that combines several techniques and concepts into a single effective theory in order to increase performance by removing waste.
For the process studied, a reduction in the number of wastes of up to 90% was obtained. This means that the stated objective has been achieved and the Lean Six Sigma methodology has been successfully implemented.
Reducing variability and enhancing process capabilities show that productivity has grown as a result of removing the scrap-causing variables.
We suggest conducting research in the future to utilize the Six Sigma technique to enhance other organizational processes. The organization can benefit from the application of the Six Sigma approach. It is an approach that may be used consistently and customized to the requirements of the organization.
Author Contributions
Conceptualization, I.-C.E.; methodology, E.I. and O.R.C.; software, I.V.R. and A.-M.R.; validation, I.V.R. and I.-C.E.; investigation, E.I. and O.R.C.; resources, I.V.R. and I.-C.E.; data curation, A.-M.R. and E.I.; writing—original draft preparation, A.-M.R. and I.-C.E.; writing—review and editing, I.-C.E. and I.V.R.; visualization, O.R.C.; supervision, I.-C.E.; funding acquisition, I.-C.E. and I.V.R. All authors have read and agreed to the published version of the manuscript.
Funding
This research was funded by the Polytechnic University of Bucharest.
Data Availability Statement
Not applicable.
Conflicts of Interest
The authors declare no conflict of interest.
References
- Habib, A.M.; Rizvan, R.; Ahmed, S. Implementing lean manufacturing for improvement of operational performance in a labeling and packaging plant: A case study in Bangladesh. Results Eng. 2023, 17, 100818, ISSN 2590-1230. [Google Scholar] [CrossRef]
- Marques, C.; Lopes, N.; Santos, G.; Delgado, I.; Delgado, P. Improving operator evaluation skills for defect classification using training strategy supported by attribute agreement analysis. Measurement 2018, 119, 129–141, ISSN 0263-2241. [Google Scholar] [CrossRef]
- Antosz, K.; Jasiulewicz-Kaczmarek, M.; Waszkowski, R.; Machado, J. Application of Lean Six Sigma for sustainable maintenance: Case study. IFAC-PapersOnLine 2022, 55, 181–186, ISSN 2405-8963. [Google Scholar] [CrossRef]
- da Silva Gomes, F.; Camargo, P.R.; da Motta Reis, J.S.; Diogo, G.M.; Cardso, R.P.; de Barros, J.G.M.; de Souza Sampaio, N.A.; Barbosa, L.C.; Santos, G. The Main Benefits of Application of Six Sigma for Productive Excellence. Qual. Innov. Prosper. 2022, 26, 151–167. [Google Scholar] [CrossRef]
- Maware, C.; Okwu, M.O.; Adetunji, O. A systematic literature review of lean manufacturing implementation in manufacturing-based sectors of the developing and developed countries. Int. J. Lean Six Sigma 2022, 13, 521–556. [Google Scholar] [CrossRef]
- Prakash, S.; Kumar, S.; Soni, G.; Mahto, R.V.; Pandey, N. A decade of the international journal of lean six sigma: Bibliometric overview. Int. J. Lean Six Sigma 2022, 13, 295–341. [Google Scholar] [CrossRef]
- Patel, M.; Desai, D.A. Critical review and analysis of measuring the success of six sigma implementation in manufacturing sector. Int. J. Qual. Reliab. Manag. 2018, 35, 1519–1545. [Google Scholar] [CrossRef]
- Gijo, E.V.; Antony, J.; Kumar, M.; McAdam, R.; Hernandez, J. An application of six sigma methodology for improving the first pass yield of a grinding process. J. Manuf. Technol. Manag. 2014, 25, 125–135. [Google Scholar] [CrossRef]
- Sudheer, D.; Kulkarni, N.D.; Prasanna, S.; Mirunalini, C.; Akshaya, R.D.; Kousalya, N.; Agalya, A. Enhancing the process capability of machining process of boring tool holder by application of six sigma methodology. Mater. Today Proc. 2023, 52, 329–338, ISSN 2214-7853. [Google Scholar] [CrossRef]
- The Council for Six Sigma Certification. Six Sigma: A Complete Step-by-Step Guide: A Complete Training & Reference Guide for White Belts, Yellow Belts, Green Belts, and Black Belts. 2018. Available online: https://www.sixsigmacouncil.org/wp-content/uploads/2018/08/Six-Sigma-A-Complete-Step-by-Step-Guide.pdf (accessed on 4 February 2023).
- Purba, H.H.; Nindiani, A.; Trimarjoko, A.; Jaqin, C.; Hasibuan, S.; Tampubolon, S. Increasing Sigma levels in productivity improvement and industrial sustainability with Six Sigma methods in manufacturing industry: A systematic literature review. Adv. Prod. Eng. Manag. 2021, 16, 307–325. [Google Scholar] [CrossRef]
- Breyfogle, F.W., III. Implementing Six Sigma: Smarter Solutions Using Statistical Methods, 2nd ed.; John Wiley & Sons: Hoboken, NJ, USA, 2003. [Google Scholar]
- Kosina, J. The Process to Estimate Economical Benefits of Six Sigma Projects. Qual. Innov. Prosper. 2013, 17, 16–27. [Google Scholar] [CrossRef]
- Pulakanam, V. Costs and Savings of Six Sigma Programs: An Empirical Study. Qual. Manag. J. 2012, 19, 39–54. [Google Scholar] [CrossRef]
- Prieto, C.; Navarro, R.; Gonzalez, A. ReductionWaste by Combining Lean Manufacturing and Six Sigma in an Electronics Industry. Res. J. Appl. Sci. Eng. Technol. 2014, 8, 1558–1562. [Google Scholar] [CrossRef]
- Sundararajan, N.; Terkar, R. Improving productivity in fastener manufacturing through the application of Lean-Kaizen principles. Mater. Today Proc. 2022, 62, 1169–1178. [Google Scholar] [CrossRef]
- Womack, J.; Jones, D.T.; Roos, D. The Machine that Changed the World: The Story of Lean Production—Toyota’s Secret Weapon in the Global Car Wars That is Revolutionizing World Industry. Undefined. 1991 [pdf] Semantic Scholar. Available online: https://www.semanticscholar.org/paper/The-machine-thatchanged-the-world%3A-the-story-of-Womack-Jones/4cac51c7ab0b49824feab0b5645b22eb22b378e5 (accessed on 4 February 2023).
- Psomas, E.; Antony, J. Research gaps in lean manufacturing: A systematic literature review. Int. J. Qual. Reliab. Manag. 2019, 36, 815–839. [Google Scholar] [CrossRef]
- Salonitis, K.; Tsinopoulos, C. Drivers and Barriers of Lean Implementation in the Greek Manufacturing Sector. Procedia CIRP 2016, 57, 189–194. [Google Scholar] [CrossRef]
- Daryl, P.; Alfnes, E.; Semini, M. The application of lean production control methods within a process-type. In Production Management Systems; Springer: Berlin/Heidelberg, Germany, 2009. [Google Scholar]
- Omogbai, O.; Salonitis, K. The Implementation of 5S Lean Tool Using System Dynamics Approach. Procedia CIRP 2017, 60, 380–385. [Google Scholar] [CrossRef]
- Ezema, C.N.; Okafor, E.C.; Hyacinth, I.C. A Review of the Implementation of JIT Algorithms and Models in Production Systems. J. Appl. Adv. Res. 2017, 2, 122. [Google Scholar] [CrossRef]
- Ahmad, M.F.; Zakuan, N.; Jusoh, A.; Takala, J. Relationship of TQM and Business Performance with Mediators of SPC, Lean Production and TPM. Procedia-Soc. Behav. Sci. 2012, 65, 186–191, ISSN 1877-0428. [Google Scholar] [CrossRef]
- Androniceanu, A.; Enache, I.-C.; Valter, E.-N.; Raduica, F.-F. Increasing Energy Efficiency Based on the Kaizen Approach. Energies 2023, 16, 1930. [Google Scholar] [CrossRef]
- Garza-Reyes, J.A.; Torres Romero, J.; Govindan, K.; Cherrafi, A.; Ramanathan, U. A PDCA-based approach to Environmental Value Stream Mapping (E-VSM). J. Clean. Prod. 2018, 180, 335–348, ISSN 0959-6526. [Google Scholar] [CrossRef]
- Narke, M.M.; Jayadeva, C.T. Value Stream Mapping: Effective Lean Tool for SMEs. Mater. Today Proc. 2020, 24, 1263–1272, ISSN 2214-7853. [Google Scholar] [CrossRef]
- Romero, D.; Gaiardelli, P.; Powell, D.; Wuest, T.; Thürer, M.; Rethinking, J. Systems under Automation & Learning Perspectives in the Digital Lean Manufacturing World. IFAC-PapersOnLine 2019, 52, 899–903, ISSN 2405-8963. [Google Scholar] [CrossRef]
- Juran, J.; Godfre, A.B. Juran’s Quality Handbook, 5th ed.; McGraw-Hill: New York, NY, USA, 2018; ISBN 007034003X. [Google Scholar]
- Velásquez, M.; Zabala, N.; Neira-Rodado, D.; Baldovino Obredor, T.; Mercado-Caruso, N. Design of lean-based strategies to improve the flow of materials in the value chain of a furniture company in Colombia. Procedia Comput. Sci. 2022, 203, 502–507, ISSN 1877-0509. [Google Scholar] [CrossRef]
- Sanchez, N.Y.E.; Santos, P.Y.S.; Lastra, G.E.M.; Flores, J.C.Q.; Merino, J.C.A. Implementation of Lean and Logistics Principles to Reduce Non-conformities of a Warehouse in the Metalworking Industry. In Proceedings of the 10th International Conference on Industrial Technology and Management (ICITM), Cambridge, UK, 26–28 March 2021; pp. 89–93. [Google Scholar] [CrossRef]
- Posteucă, A.; Zapciu, M. Setup time and cost reduction in conditions of low volume and overcapacity. U.P.B. Sci. Bull. 2015, 77, 2015, ISSN 1454-2358. [Google Scholar]
- Braglia, M.; Gallo, M.; Marrazzini, L. A lean approach to address material losses: Materials cost deployment (MaCD). Int. J. Adv. Manuf. Technol. 2021, 113, 565–584. [Google Scholar] [CrossRef]
- Condé, G.C.P.; Oprime, P.C.; Pimenta, M.L.; Sordan, J.E.; Bueno, C.R. Defect reduction using DMAIC and Lean Six Sigma: A case study in a manufacturing car parts supplier. Int. J. Qual. Reliab. Manag. 2023. [Google Scholar] [CrossRef]
- Afonso, H.; Cabrita, R.M. Developing a Lean Supply Chain Performance Framework in a SME: A Perspective Based on the Balanced Scorecard. Procedia Eng. 2015, 131, 270–279, ISSN 1877-7058. [Google Scholar] [CrossRef]
- Van Assen, M.F. Lean, process improvement and customer-focused performance. The moderating effect of perceived organisational context. Total Qual. Manag. Bus. Excell. 2021, 32, 57–75. [Google Scholar] [CrossRef]
- Carvalho, C.; Leite, L. Application of Lean Manufacturing to Reduce Unproductive Times in a Valve Spring Inspection and Packaging Cell. Int. J. Adv. Eng. Res. Sci. 2021, 8, 305–323. [Google Scholar] [CrossRef]
- Milutinović, R.; Stošić, B.; Tomašević, I. Integrating lean principles into new product development projects. In Proceedings of the XVII International Scientific Conference on Industrial Systems (IS’17), Novi Sad, Serbia, 4–6 October 2017; Available online: https://www.iim.ftn.uns.ac.rs/is17/papers/47.pdf (accessed on 7 March 2023).
- Nestor, E.; Caicedo, S.; Guisselle, A.G.L.; Jairo, R.M.-T.; Ramirez Polo, L.E. A planning model of crop maintenance operations inspired in lean manufacturing. Comput. Electron. Agric. 2020, 179, 105852, ISSN 0168-1699. [Google Scholar] [CrossRef]
- Khayrullina, M.V.; Kislitsyna, O.A.; Chuvaev, A.V. Production Systems Continuous Improvement Modelling. Qual. Innov. Prosper. 2015, 19, 73–86. [Google Scholar] [CrossRef]
- Brajesh, K.K.; Guddakesh, K.C.; Mohd, A. Implication of lean philosophies in signing supplier quality agreement: An empirical study. Mater. Today Proc. 2022, 63, 335–340, ISSN 2214-7853. [Google Scholar] [CrossRef]
- Arunesh, P.; Chintan, C. Understanding basics of Six Sigma. Int. J. Eng. Res. Technol. 2020, 9, 5. [Google Scholar] [CrossRef]
- Smętkowska, M.; Mrugalska, B. Using Six Sigma DMAIC to Improve the Quality of the Production Process: A Case Study. Procedia-Soc. Behav. Sci. 2018, 238, 590–596, ISSN 1877-0428. [Google Scholar] [CrossRef]
- Pendokhare, D.G.; Taqui, Q. A Review of DMADV: Methodology, Customer Satisfaction and Research Area. Int. J. Sci. Eng. Res. 2015, 6, 1536, ISSN 2229-5518. [Google Scholar]
- Salah, S.; Rahim, A.; Carretero, J.A. The integration of Six Sigma and lean management. Int. J. Lean Six Sigma 2010, 1, 249–274. [Google Scholar] [CrossRef]
- Burdick, R.K.; Borror, C.M.; Montgomery, D.C. Design and Analysis of Gauge R&R Studies: Making Decisions with Confidence Intervals in Random and Mixed ANOVA Models; Society for Industrial and Applied Mathematics: Philadelphia, PA, USA, 2005. [Google Scholar] [CrossRef]
- Griffin, A.; Hauser, J.R. The Voice of the Customer. Mark. Sci. 1993, 12, 1–27. [Google Scholar] [CrossRef]
Figure 1.
The metal door case.

Figure 2.
SIPOC Diagram.

Figure 3.
The process map.

Figure 4.
Ishikawa diagram.

Figure 5.
Performed measurements.

Figure 6.
Graphical report of the measurements taken.

Figure 7.
Measures rapport—ANOVA.

Figure 8.
Identification of the target.

Figure 9.
Diagnostic report—Poisson capacity analysis for scrap door.

Figure 10.
P Chart of scrap metal door case—identification of the number of defaults per million.

Figure 11.
Poisson capability analysis for scrap door—DPU identification.

Figure 12.
Probability diagram for the scrap.

Figure 13.
Map of the process.

Figure 14.
Details of the process.

Figure 15.
Identifying the problem of centering.

Figure 16.
The stop position of the engine.

Figure 17.
Probability diagram for the measurements taken.

Figure 18.
Capability analysis for measurements.

Figure 19.
Analysis of the capacity for the measurements taken.

Figure 20.
Optimization of the centering process.

Figure 21.
Before/after capability comparison.

Figure 22.
Performance report.

Figure 23.
The difference between the two series of actions.

Figure 24.
The new device for centering.


Table 1.
Tools that were used in the Six Sigma steps.
| Used Tools | Define | Measure | Analyze | Improvement | Control |
|---|---|---|---|---|---|
| Project charter | x | ||||
| VOC | x | ||||
| Process maps and flowcharts | x | x | |||
| Cause and effect diagram | x | ||||
| Priority matrix | x | ||||
| Pareto diagram for the priority matrix | x | ||||
| Data collection plan | x | ||||
| R&R GAGE | x | ||||
| Process capability analysis | x | ||||
| Hypothesis tests, confidence intervals | x | ||||
| Regression analysis, other multivariate methods | x | ||||
| Failure modes and effects analysis | x | ||||
| Designed experiences | x | x | |||
| SPC and process control plans | x | x | x | ||
| Implementation plan | x | ||||
| Before/after analysis | x | ||||
| Control of the main objective of the project | x | ||||
| Standardization | x |
Table 2.
VOC.
| VOC | Needs | CTQ | Specifications |
|---|---|---|---|
| Material | Qualitative | Following the technical specifications | Yes |
| Form | Geometrical stability | Following the technical design | Yes |
| Geometry | Respecting the specific tasks | Following the technical design—existing | 1038.5 mm (−1 + 0.5) |
| Following the technical design— the quota for the bending | 4 mm (−0.1 + 0.1) | ||
| Aspect | According to the norms | Following the technical specifications | Yes/No |
| Documentation technique | Existing | Technical documentation—work plan | Yes |
| Dimensional control documentation | Yes |
Table 3.
Priority matrix.
| No. | Priorities | The Effort Necessaire to Eliminate the Flows Determined by the Bending Process | Total |
|---|---|---|---|
| 1 | Process parameters | 3 | 30 |
| 2 | Daily measure | 1 | 10 |
| 3 | Operator | 6 | 40 |
| 4 | Process | 6 | 50 |
| 5 | Dimension of the metal sheet | 3 | 30 |
| 6 | Quality of the metal sheet | 3 | 30 |
| 7 | Device for centering the metal sheet | 9 | 90 |
| 8 | Stamping positions | 9 | 90 |
| 9 | Deviation | 9 | 90 |
| TOTAL | 49 | 490 |
Table 4.
Two operators’ collective measures.
| No. | Operator | Measurements [mm] |
|---|---|---|
| 1 | Operator 1 | 4.83 |
| 2 | Operator 1 | 4.75 |
| 3 | Operator 1 | 4.78 |
| 4 | Operator 1 | 4.75 |
| 5 | Operator 1 | 4.71 |
| 6 | Operator 1 | 4.70 |
| 7 | Operator 1 | 4.81 |
| 8 | Operator 1 | 4.79 |
| 9 | Operator 2 | 4.76 |
| 10 | Operator 2 | 4.77 |
| 11 | Operator 2 | 4.75 |
| 12 | Operator 2 | 4.74 |
| 13 | Operator 2 | 4.72 |
| 14 | Operator 2 | 4.71 |
| 15 | Operator 2 | 4.79 |
| 16 | Operator 2 | 4.73 |
Table 5.
Incidence of scrap related to the number of parts produced.
| Day | Operation | No. of Manufactured Products | No. of Scrap Reported |
|---|---|---|---|
| 1 | Bending of the edges | 782 | 30 |
| 2 | Bending of the edges | 780 | 20 |
| 3 | Bending of the edges | 781 | 25 |
| 4 | Bending of the edges | 779 | 15 |
| 5 | Bending of the edges | 780 | 18 |
| 6 | Bending of the edges | 782 | 30 |
| 7 | Bending of the edges | 781 | 28 |
| 8 | Bending of the edges | 778 | 20 |
| 9 | Bending of the edges | 783 | 12 |
| 10 | Bending of the edges | 782 | 29 |
Table 6.
Identified PPM.
| Production Verified | Visual Check Scrap | Percent (%) | ppm |
|---|---|---|---|
| 17,179 | 509 | 2.96 | 29,629 |
Table 7.
Solutions plan.
| Problem | Causes | Solutions | Advantages |
|---|---|---|---|
| Scraps from the door of the metal case | Device for the centering of the sheet | Elimination of the pneumatic cylinder (for the lateral edge) | Creation of the new devices |
| Deviation | Improve the locking force by increasing the number of suction cups | Creation of new devices | |
| Position of the stamp | Good adjustment of punching matrices | Ensuring a better process | |
| Process | Operation of bending using CNC Abkant and robot | Fabrication of the device for the final form of the metal case of the door | |
| Operator | Initial stop position. Centering of the lateral edge of the metal case of the door | Ensuring a better process |
Table 8.
Corrective actions.
| Analyze | Problems/Non-Compliant | Corrective/Preventive Actions | |
|---|---|---|---|
| Bending of the edges of the metal case | Bad positioning of the buffer | Good adjustment of punching matrices |  |
| Adjustment of the centering devices of the sheet during the stamping process | Bending operations using CNC Abkant and robot |  | |
| When the operator retrieves the metallic case of the door, he did not position it in the initial stop position | Initial stop position. Centering of the lateral edge of the metallic case of the door |  |
Table 9.
The number of scraps obtained after the implementation of the solutions.
| Day No. | Production/Shift | Scrap Metal Door Case |
|---|---|---|
| 1 | 854 | 0 |
| 2 | 845 | 3 |
| 3 | 852 | 0 |
| 4 | 851 | 0 |
| 5 | 847 | 2 |
| 6 | 846 | 0 |
| 7 | 849 | 0 |
| 8 | 850 | 0 |
| 9 | 853 | 1 |
| 10 | 844 | 0 |
| 11 | 847 | 0 |
| 12 | 855 | 0 |
| 13 | 856 | 2 |
| 14 | 847 | 0 |
| 15 | 852 | 0 |
| 16 | 853 | 0 |
| 17 | 856 | 1 |
| 18 | 851 | 0 |
| 19 | 856 | 0 |
| 20 | 849 | 3 |
| 21 | 850 | 0 |
| 22 | 852 | 0 |
| Total | 18,715 | 12 |
Disclaimer/Publisher’s Note: The statements, opinions and data contained in all publications are solely those of the individual author(s) and contributor(s) and not of MDPI and/or the editor(s). MDPI and/or the editor(s) disclaim responsibility for any injury to people or property resulting from any ideas, methods, instructions or products referred to in the content. |
© 2023 by the authors. Licensee MDPI, Basel, Switzerland. This article is an open access article distributed under the terms and conditions of the Creative Commons Attribution (CC BY) license (https://creativecommons.org/licenses/by/4.0/).
Share and Cite
MDPI and ACS Style
Enache, I.-C.; Chivu, O.R.; Rugescu, A.-M.; Ionita, E.; Radu, I.V. Reducing the Scrap Rate on a Production Process Using Lean Six Sigma Methodology. Processes 2023, 11, 1295. https://doi.org/10.3390/pr11041295
AMA Style
Enache I-C, Chivu OR, Rugescu A-M, Ionita E, Radu IV. Reducing the Scrap Rate on a Production Process Using Lean Six Sigma Methodology. Processes. 2023; 11(4):1295. https://doi.org/10.3390/pr11041295
Chicago/Turabian StyleEnache, Ioana-Cătălina, Oana Roxana Chivu, Ana-Maria Rugescu, Elena Ionita, and Ionut Valentin Radu. 2023. "Reducing the Scrap Rate on a Production Process Using Lean Six Sigma Methodology" Processes 11, no. 4: 1295. https://doi.org/10.3390/pr11041295
Note that from the first issue of 2016, this journal uses article numbers instead of page numbers. See further details here.