
Review of Motion Simulation of Particulate Matter in the Respiratory System and Further CFD Simulations on COVID-19

Abstract
:1. Introduction
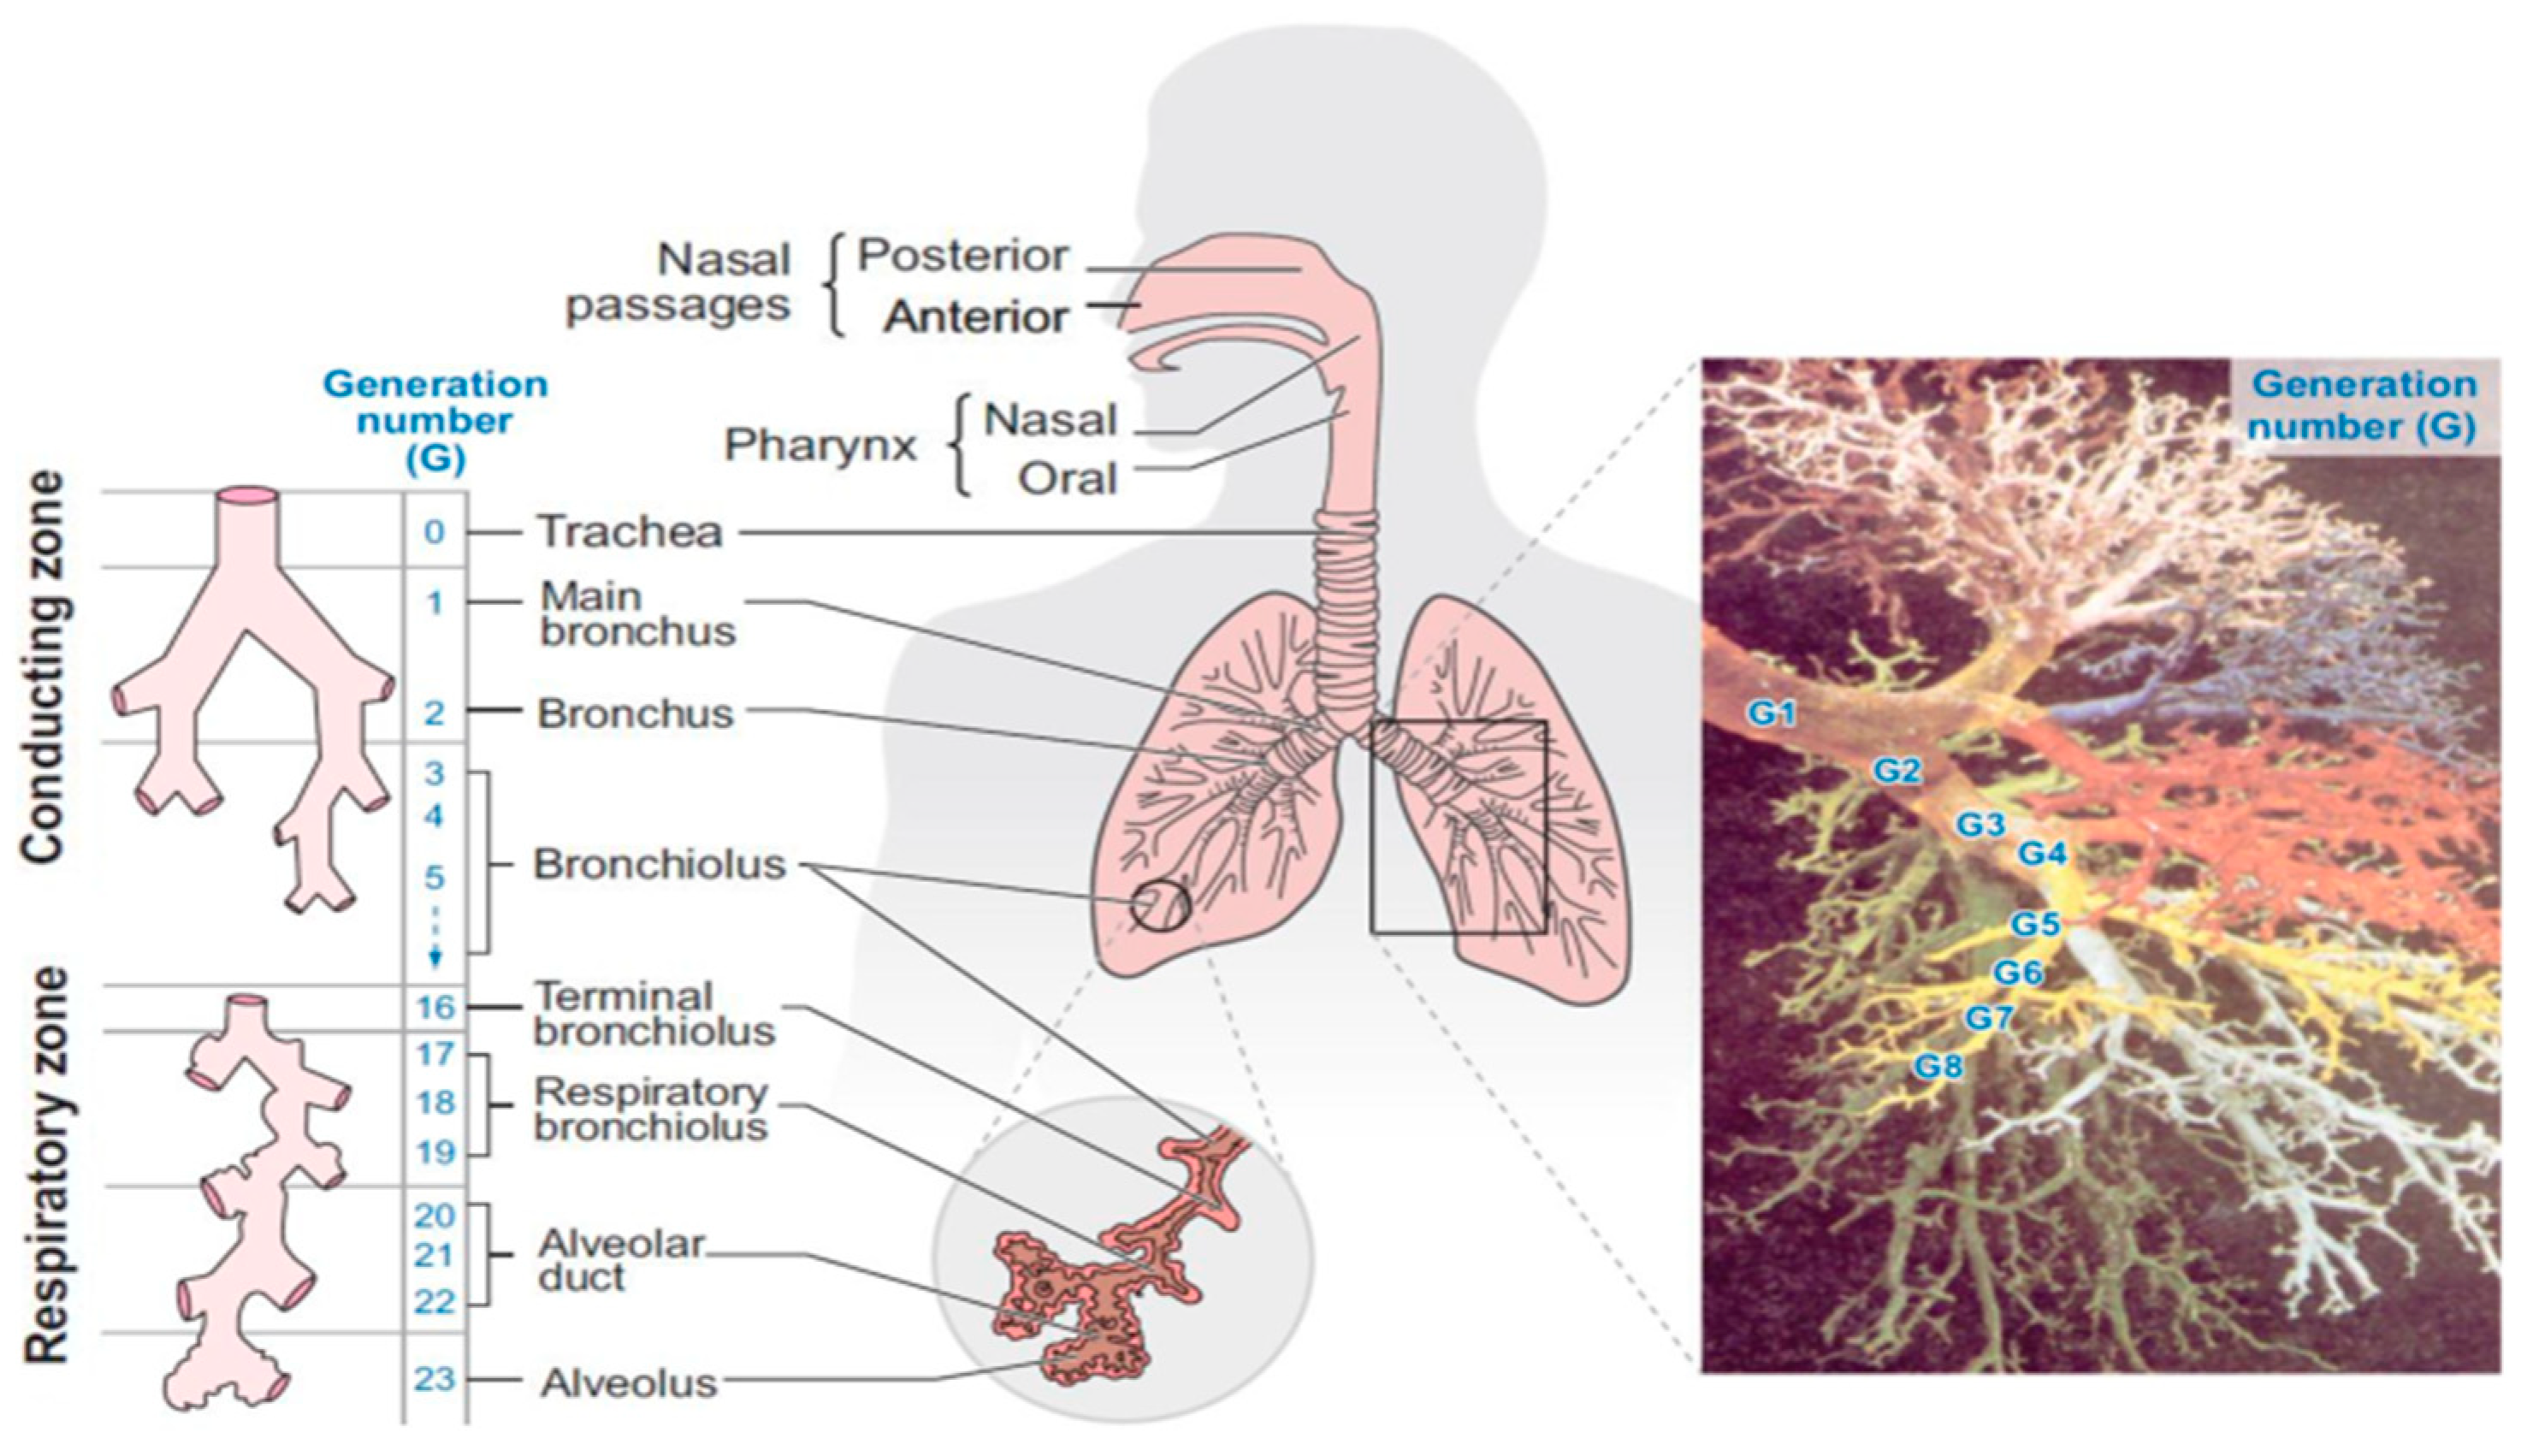
Respiratory System
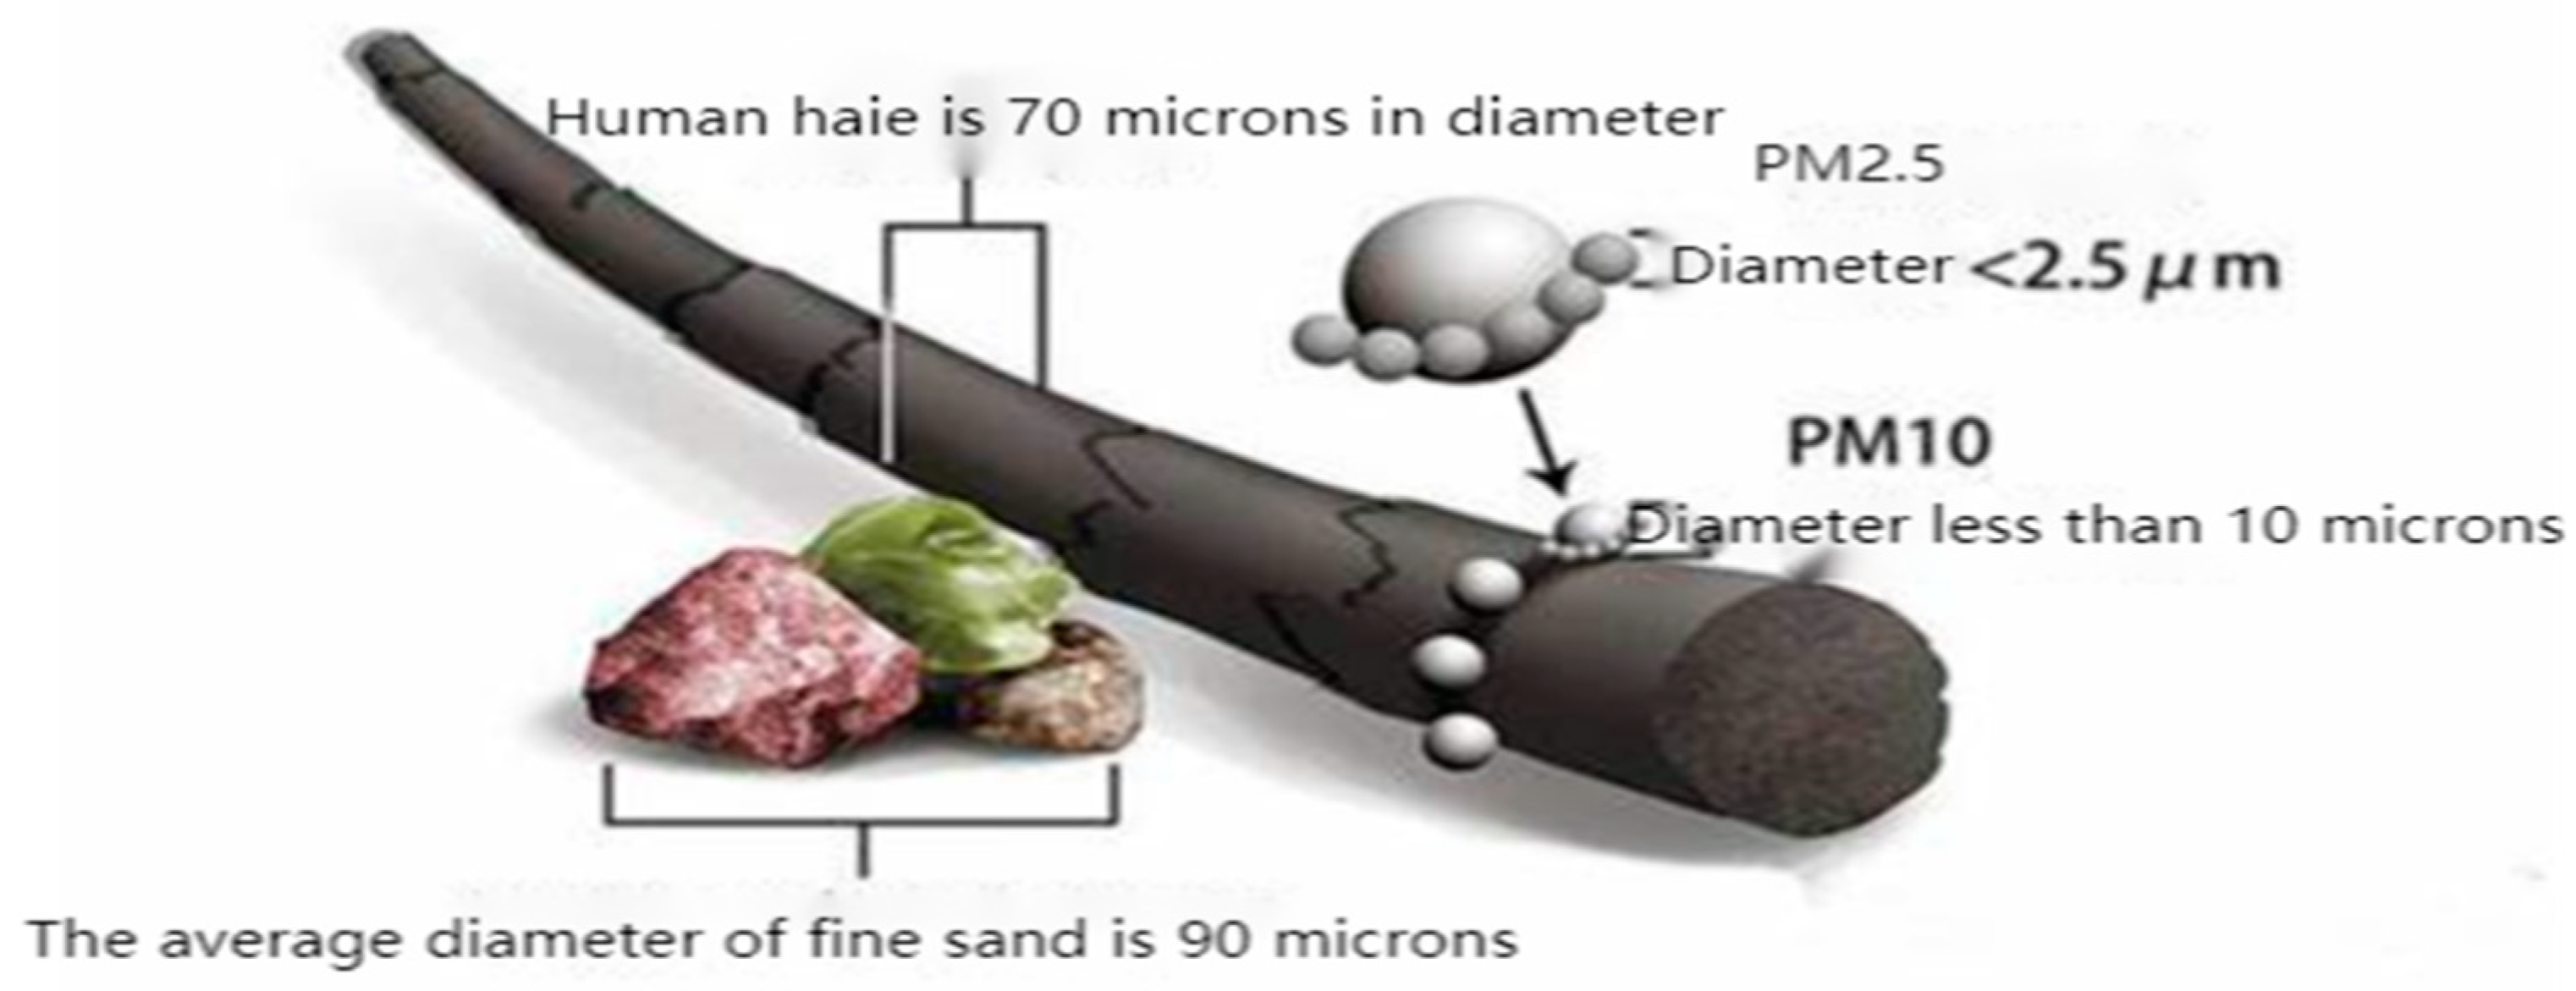
2. Effects of Particulate Matter on the Human Body
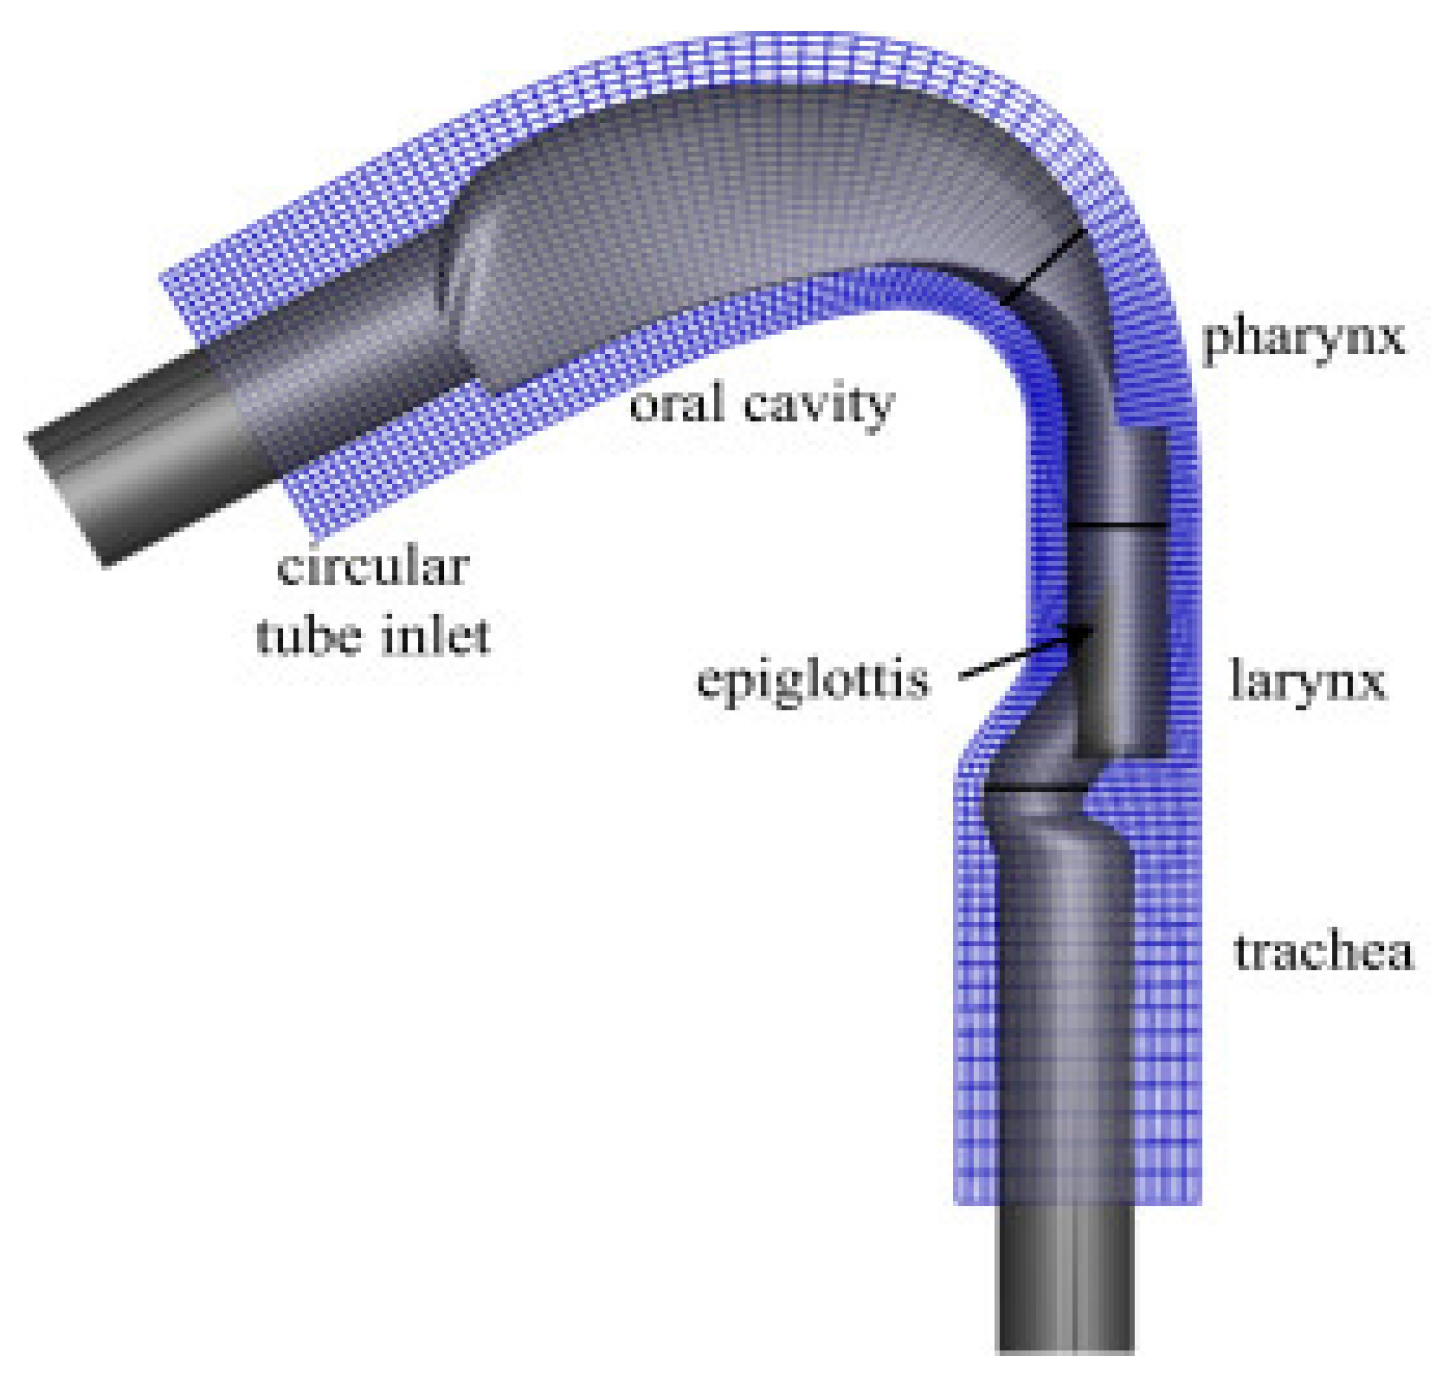
3. Deposition of Respirable Particles in the Upper Respiratory Tract
4. Deposition of Respirable Particulate Matter in the Bronchial Tubes
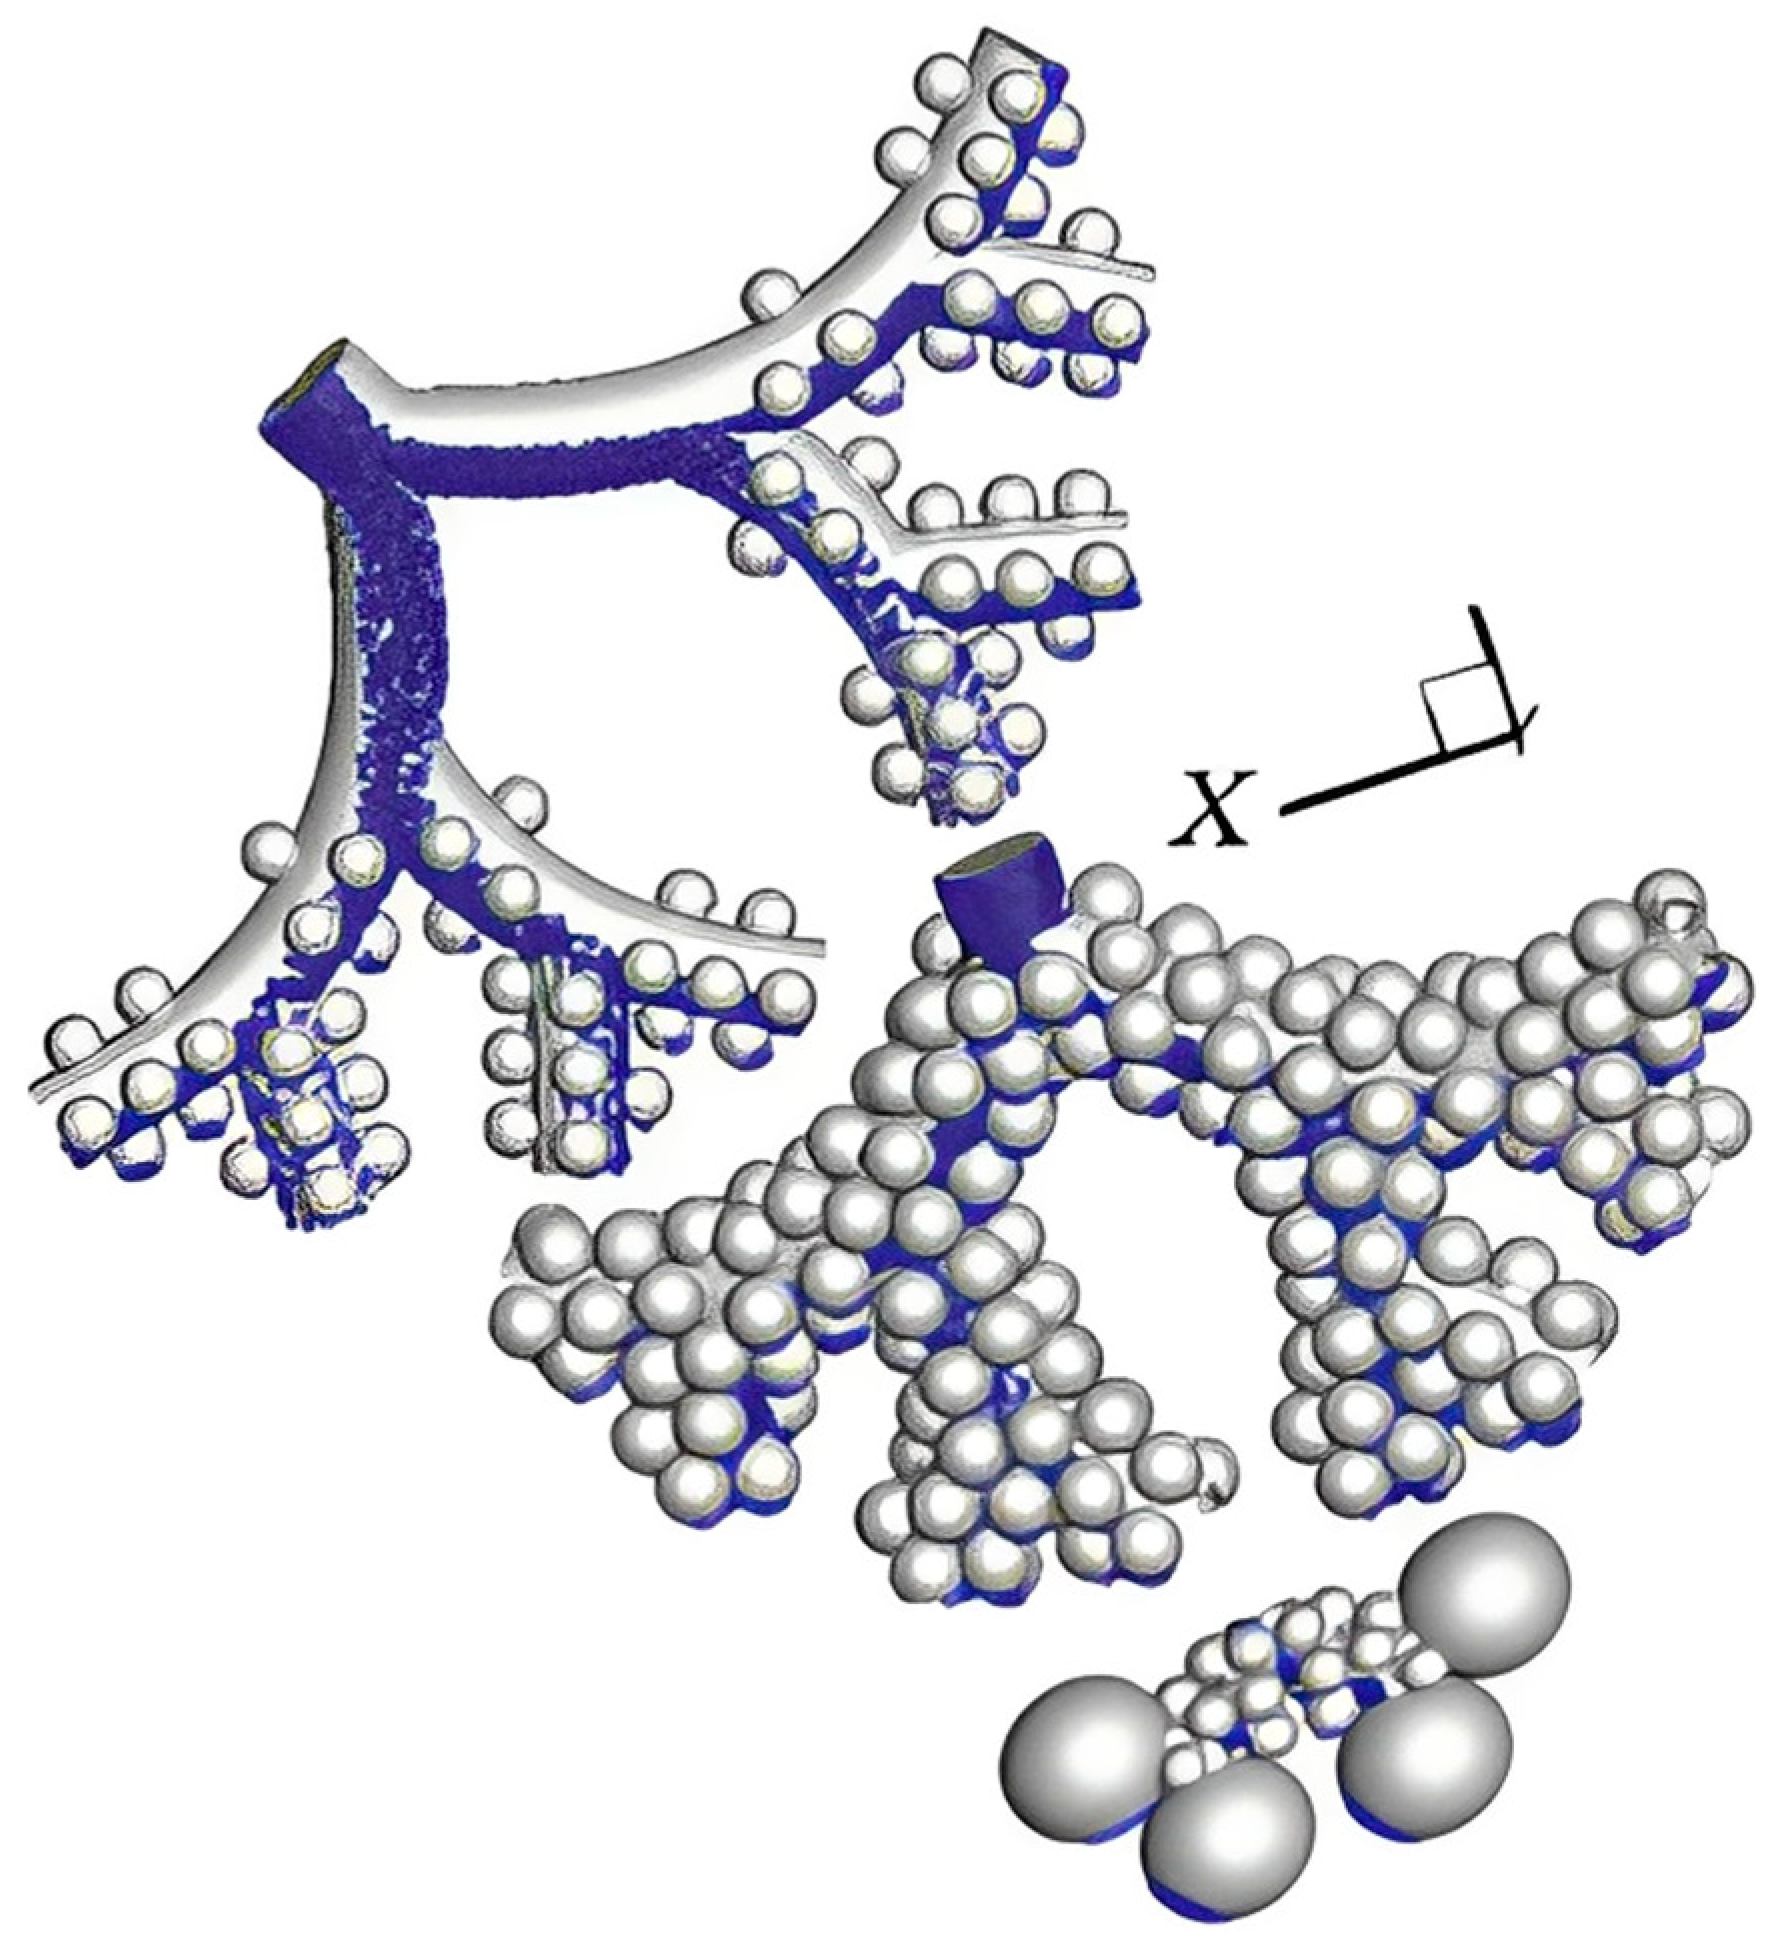
5. Deposition of Respirable Particulate Matter in the Alveolar Region of the Lung
6. The Main Research Situation in the Past Five Years
7. Deposition of Respirable Particulate Matter in Pathological Models
8. Simulation of COVID-19 Models
9. Future Key Research Directions and Contents
10. Conclusions
Author Contributions
Funding
Data Availability Statement
Conflicts of Interest
References
- WHO. Clinical Management of Severe Acute Respiratory Infection When Novel Coronavirus (COVID-19) Infection is Suspected: Interim Guidance [EB/OL]. Available online: https://apps.who.int/iris/handle/10665/330893 (accessed on 28 January 2020).
- WHO. Naming the Coronavirus Disease (COVID-19) and the Virus that Causes it [EB/OL]. Available online: https://www.who.int/emerg-encies/diseases/novel-coronavirus-2019/technical-guidance (accessed on 25 January 2021).
- Postma, M.J.; Chhatwal, J. COVID-19 health economics: Looking back and scoping the future. Value Health 2022, 25, 695–696. [Google Scholar] [CrossRef] [PubMed]
- Johns Hopkins University. COVID-19 Dashboard by the Center for Systems Science and Engineering at Johns Hopkins University [EB/OL]. Available online: https://coronavirus.jhu.edu/map.html (accessed on 4 May 2022).
- Chan, J.F.; Yuan, S.F.; Kok, K.; Hin, C.; Jin, Y.; Fanf, X.; Jiel, L.B.; Cyril, C.Y.Y.; Rosana, W.S.P.; HoiWah, T.M.; et al. A familial cluster of pneumonia associated with the 2019 novel coronavirus indicating person-to-person transmission: A study of a family cluster. Lancet 2020, 395, 514–523. [Google Scholar] [CrossRef] [PubMed]
- Wu, S.L.; Mertens, A.N.; Crider, Y.S.; Nguyen, A.; Pokpongkiat, N.N.; Djajadi, S.; Seth, A.; Hsiang, M.S.; Colford, J.M., Jr.; Reingold, A.; et al. Substantial underestimation of SARS-CoV-2 infection in the United States. Nat. Commun. 2020, 11, 4507. [Google Scholar] [CrossRef] [PubMed]
- Zhu, N.; Zhang, D.; Wang, W.; XingW, L.; Bo, Y.; Jingdong, S.; Xiang, Z.; Baoying, H.; Weifeng, S.; Roujian, L.; et al. A novel coronavirus from patients with pneumonia in China, 2019. N. Engl. J. Med. 2020, 382, 727–733. [Google Scholar] [CrossRef]
- Chen, N.; Zhou, M.; Dong, X.; Qu, J.; Gong, F.; Han, Y.; Qiu, Y.; Wang, J.; Liu, Y.; Wei, Y.; et al. Epidemiological and clinical characteristics of 99 cases of 2019 novel coronavirus pneumonia in Wuhan, China: A descriptive study. Lancet 2020, 395, 507–513. [Google Scholar] [CrossRef]
- Yang, X.; Yu, Y.; Xu, J.; Shu, H.; Xia, J.; Liu, H.; Wu, Y.; Zhang, L.; Yu, Z.; Fang, M.; et al. Clinical course and outcomes of critically ill patients with SARS-CoV-2 pneumonia in Wuhan, China: A single-centred, retrospective, observational study. Lancet Respir. 2020, 8, 475–481. [Google Scholar] [CrossRef]
- WHO. Q&A on Coronaviruses (COVID-19) [EB/OL]. Available online: https://www.who.int/emergencies/diseases/novel-coronavirus-2019/question-and-answers-hub/q-a-detail/q-a-coronaviruses (accessed on 25 January 2021).
- Chin, A.; Chu, J.L.; Perera, M.; Hui, K.; Yen, H.L.; Chan, M. Stability of SARS-CoV-2 in different environmental conditions. Lancet Microbe 2020, 1, 1–5. [Google Scholar] [CrossRef]
- Stefanou, M.I.; Palaiodimou, L.; Bakola, E.; Smyrnis, N.; Papadopoulou, M.; Paraskevas, G.P.; Rizos, E.; Boutati, E.; Grigoriadis, N.; Krogias, C.; et al. Neurological manifestations of long-COVID syndrome: A narrative review. Ther. Adv. Chronic Dis. 2022, 13, 20406223221076890. [Google Scholar] [CrossRef]
- Centers for Disease Control and Prevention (CDC). Post-COVID Conditions: Information for Healthcare Providers [EB/OL]. Available online: https://www.cdc.gov/coronavirus/2019-ncov/hcp/clinical-care/post-covid-conditions.html (accessed on 3 November 2022).
- Soriano, J.B.; Murthy, S.; Marshall, J.C.; Relan, P.; Diaz, J.V.; on behalf of the WHO Clinical Case Definition Working Group on Post-COVID-19 Condition. A clinical case definition of post COVID-19 condition by a Delphi consensus. Lancet Infect. Dis. 2022, 22, e102–e107. [Google Scholar] [CrossRef]
- National Institute for Health and Care Excellence. COVID-19 Rapid Guideline: Managing the Long-Term Effects of COVID-19 [M/CD]. NICE. Available online: https://www.nice.org.uk/guidance/ng188/resources/COVID19-rapidguideline-managing-the-longterm-effects-of-COVID19-pdf-51035515742 (accessed on 3 November 2022).
- Davis, H.E.; Assaf, G.S.; McCorkell, L.; Wei, H.; Low, R.J.; Re’em, Y.; Redfield, S.; Austin, J.P.; Akrami, A. Characterizing long COVID in an international cohort:7 months of symptoms and their impact. eClinicalMedicine 2021, 38, 101019. [Google Scholar] [CrossRef]
- Thompson, E.J.; Williams, D.M.; Walker, A.J.; Mitchell, R.E.; Niedzwiedz, C.L.; Yang, T.C.; Huggins, C.F.; Kwong, A.S.; Silverwood, R.J.; Di Gessa, G.; et al. Long COVID burden and risk factors in 10 UK longitudinal studies and electronic health records. Nat. Commun. 2022, 13, 3528. [Google Scholar] [CrossRef] [PubMed]
- COVID-19 Mental Disorders Collaborators. Global prevalence and burden of depressive and anxiety disorders in 204 countries and territories in 2020 due to the COVID-19 pandemic. Lancet 2021, 398, 1700–1712. [Google Scholar] [CrossRef] [PubMed]
- Montefusco, L.; Ben Nasr, M.; D’Addio, F.; Loretelli, C.; Rossi, A.; Pastore, I.; Daniele, G.; Abdelsalam, A.; Maestroni, A.; Dell’Acqua, M.; et al. Acute and long-term disruption of glycometabolic control after SARS-CoV-2 infection. Nat. Metab. 2021, 3, 774–785. [Google Scholar] [CrossRef] [PubMed]
- Mehandru, S.; Merad, M. Pathological sequelae of long-haul COVID. Nat. Immunol. 2022, 23, 194–202. [Google Scholar] [CrossRef] [PubMed]
- Bowe, B.; Xie, Y.; Xu, E.; Al-Aly, Z. Kidney outcomes in long COVID. J. Am. Soc. Nephrol. 2021, 32, 2851–2862. [Google Scholar] [CrossRef]
- Weng, J.; Li, Y.; Li, J.; Shen, L.; Zhu, L.; Liang, Y.; Lin, X.; Jiao, N.; Cheng, S.; Huang, Y.; et al. Gastrointestinal sequelae 90 days after discharge for COVID-19. Lancet Gastroenterol. Hepatol. 2021, 6, 344–346. [Google Scholar] [CrossRef]
- Freeman, E.E.; McMahon, D.E.; Lipoff, J.B.; Rosenbach, M.; Kovarik, C.; Desai, S.R.; Harp, J.; Takeshita, J.; French, L.E.; Lim, H.W.; et al. The spectrum of COVID-19-associated dermatologic manifestations: An international registry of 716 patients from 31 countries. J. Am. Acad. Dermatol. 2020, 83, 1118–1129. [Google Scholar] [CrossRef] [PubMed]
- Sanyaolu, A.; Marinkovic, A.; Prakash, S.; Zhao, A.; Balendra, V.; Haider, N.; Jain, I.; Simic, T.; Okorie, C. Post-acute sequelae in COVID-19 survivors: An overview. SN Compr. Clin. Med. 2022, 4, 91. [Google Scholar] [CrossRef]
- Truffaut, L.; Demey, L.; Bruyneel, A.V.; Roman, A.; Alard, S.; de Vos, N.; Bruyneel, M. Post-discharge critical COVID-19 lung function related to severity of radiologic lung involvement at admission. Respir. Res. 2021, 22, 29. [Google Scholar] [CrossRef]
- Kleinstreuer, C.; Zhang, Z.; Donohue, J.F. Targeted drug-aerosol delivery in the human respiratory system. Annu. Rev. Biomed. Eng. 2008, 10, 195–220. [Google Scholar] [CrossRef]
- Respiration in Human Beings. Available online: http://www.tutorvista.com/biology/respiration-in-human-beings (accessed on 12 January 2023).
- Lintermann, A.; Schröder, W. Simulation of aerosol particle deposition in the upper human tracheobronchial tract. Eur. J. Mech. -B/Fluids 2017, 63, 73–89. [Google Scholar] [CrossRef]
- Zhang, T.; Gao, B.; Zhou, Z.; Chang, Y. The movement and deposition of PM 2.5 in the upper respiratory tract for the patients with heart failure: An elementary CFD study. Biomed. Eng. Online 2016, 15, 138. [Google Scholar] [CrossRef] [PubMed]
- Djojodihardjo, H.; Ahmed, R.I. CFD simulation of Coandfi effect on the upper respiratory system. J. Med. Imaging Health Inf. 2016, 6, 1526–1535. [Google Scholar]
- Anderson, H.R.; Atkinson, R.W.; Peacock, J.L.; Marston, L.; Konstantinou, K. ; World Health Organization. Meta-Analysis of Time Series Studies and Panel Studies of Particulate Matter (PM) and Ozone; WHO Regional Office for Europe: København, Denmark, 2004; pp. 1–73.
- Oberdorster, G.; Utell, M.J. Ultrafine particles in the urban air: To the respiratory tract-and beyond? Environ. Health Perspect. 2002, 110, 440–441. [Google Scholar] [CrossRef]
- Brunekreef, B. Air pollution and life expectancy: Is there a relation? Occup. Environ. Med. 1997, 54, 781–784. [Google Scholar] [CrossRef]
- Pope Iii, C.A.; Burnett, R.T.; Thun, M.J.; Calle, E.E.; Krewski, D.; Ito, K.; Thurston, G.D. Lung cancer, cardiopulmonary mortality, and long-term exposure to fine particulate air pollution. J. Am. Med. Assoc. 2002, 287, 1132–1141. [Google Scholar] [CrossRef]
- Rogers, J.F.; Dunlop, A.L. Air pollution andvery low birth weight infants: A target population. Pediatrics 2006, 118, 156–164. [Google Scholar] [CrossRef]
- Samet, J.M.; Dominici, F.; Curriero, F.C.; Coursac, M.S.; Scott, L.Z. Fine particulate air pollution and mortality in 20 U.S. cities, 1987–1994. N. Engl. J. Med. 2000, 343, 1742–1749. [Google Scholar] [CrossRef]
- Jungblut, D.; Queisser, G.; Wittum, G. Inertia based filtering of high resolution images using a gpu cluster. Comput. Vis. Sci. 2012, 14, 181–186. [Google Scholar] [CrossRef]
- Tsai, S.S.; Chang, C.C.; Yang, C.Y. Fine particulate air pollution and hospital admissions for chronic obstructive pulmonary disease: A case-crossover study in Taipei. Int. J. Environ. Res. Public Health 2013, 10, 6015–6026. [Google Scholar] [CrossRef]
- Tian, Y.; Xiang, X.; Juan, J.; Sun, K.; Song, J.; Cao, Y.; Hu, Y. Fine particulate air pollution and hospital visits for asthma in Beijing, China. Environ. Pollut. 2017, 230, 227–233. [Google Scholar] [CrossRef] [PubMed]
- Turner, M.C.; Krewski, D.; Pope Iii, C.A.; Chen, Y.; Gapstur, S.M.; Thun, M.J. Long-term ambient fine particulate matter air pollution and lung cancer in a large cohort of never-smokers. Am. J. Respir. Crit. Care Med. 2011, 184, 1374–1381. [Google Scholar] [CrossRef] [PubMed]
- Dockery, D.W.; Pope, C.A.; Xu, X.; James, H.W.; Martha, E.F.; Benjamin, G.F.; Frank, E.S. An association between air pollution and mortality in six U. S. cities. N. Engl. J. Med. 1993, 329, 1753–1759. [Google Scholar] [CrossRef] [PubMed]
- Baur, X.; Sanyal, S.; Abraham, J.L. Mixed-dust pneumoconiosis: Review of diagnostic and classification problems with presentation of a work-related case. Sci. Total Environ. 2019, 652, 413–421. [Google Scholar] [CrossRef] [PubMed]
- Mandrioli, D.; Schlünssen, V.; Adam, B.; Cohen, R.A.; Colosio, C.; Chen, W.; Fischer, A.; Godderis, L.; Goen, T.; Ivanov, I.D.; et al. WHO/ILO work-related burden of disease and injury: Protocol for systematic reviews of occupational exposure to dusts and/or fibres and of the effect of occupational exposure to dusts and/or fibres on pneumoconiosis. Environ. Int. 2018, 119, 174–185. [Google Scholar] [CrossRef]
- Guo Xinbiao; Wei Hongying. Research progress on health effects of atmospheric PM2.5. Sci. Bull. 2013, 58, 1171–1177. [Google Scholar]
- The epidemiological characteristics of an outbreak of 2019 novel coronavirus diseases (COVID-19) in China. Zhonghua Liu Xing Bing Xue Za Zhi 2020, 41, 145–151. [CrossRef]
- Luo, J.; Rizvi, H.; Egger, J.V.; Preeshagul, I.R.; Wolchok, J.D.; Hellmann, M.D. Impact of PD-1 Blockade on Severity of COVID-19 in Patients with Lung Cancers. Cancer Discov. 2020, 10, 1121–1128. [Google Scholar] [CrossRef]
- Liu, Y.; Kan, H.; Xu, J.; Rogers, D.; Li, P.; Ye, X.; Chen, R.; Zhang, Y.; Wang, W. Temporal relationship between hospital admissions for pneumonia and weather conditions in Shanghai, China: A time-series analysis. BMJ Open 2014, 4, e004961. [Google Scholar] [CrossRef]
- Barreca, A.I. Climate change, humidity, and mortality in the United States. J. Environ. Econ. Manag. 2012, 63, 19–34. [Google Scholar] [CrossRef]
- Tao, Y.; Song, J.; Qiang, L.; Wang, Y.; Li, Z. Time series research on meteorological factors and measles incidence in Chengguan District of Lanzhou City. Chin. Environ. Sci. 2014, 34, 2964–2969. [Google Scholar]
- Jaakkola, K.; Saukkoriipi, A.; Jokelainen, J.; Juvonen, R.; Kauppila, J.; Vainio, O.; Ziegler, T.; Ronkko, E.; Jaakkola, J.; Ikaheimo, T. Decline in temperature and humidity increases the occurrence of influenza in cold climate. Environ. Health 2014, 13, 22. [Google Scholar] [CrossRef] [PubMed]
- Chung, J.Y.; Honda, Y.; Hong, Y.C.; Pan, X.C.; Guo, Y.L.; Kim, H. Ambient temperature and mortality: An international study in four capital cities of East Asia. Sci. Total Environ. 2009, 408, 390–396. [Google Scholar] [CrossRef] [PubMed]
- Bahmanzadeh, H.; Abouali, O.; Faramarzi, M.; Ahmadi, G. Numericalsimulation of airflow and micro-particle deposition in human nasalairway pre-and post-virtual sphenoidotomy surgery. Comput. Biol. Med. 2015, 61, 8–18. [Google Scholar] [CrossRef]
- Wang, S.; Gu, X.; Xu, S. Research progress in numerical simulation of physical field and gas-solid two-phase flow in the nasal cavity. Int. J. Otorhinolaryngol.-Head Neck Surg. 2016, 40, 65–70. [Google Scholar]
- Su, Y.; Liu, Y.; Sun, X. Numerical simulation study of nasal airflow field in healthy Chinese. Chin. Dep. Otorhinolaryngol. Head Neck Surg. 2015, 562, 545–547. [Google Scholar]
- Cui, X.; Gutheil, E.; Baumann, I. CFD Study of the Flow Field and Particle Dispersion and Deposition in the Upper Human Respiratory System. Ph.D. Thesis, Ruperto-Carola University of Heidelberg, Heidelberg, Germany, 2012. [Google Scholar]
- Jeong, S.J.; Kim, W.S.; Sung, S.J. Numerical investigation on the flow characteristics and aerodynamic force of the upper airway of patient with obstructive sleep apnea using computational fluid dynamics. Med. Eng. Phys. 2007, 29, 637–651. [Google Scholar] [CrossRef]
- Wang, Y.; Wang, J.; Liu, Y.; Yu, S.; Sun, X.; Li, S.; Shen, S.; Zhao, W. Fluid-structure interaction modeling of upper airways before and after nasal surgery for obstructive sleep apnea. Int. J. Numer. Method Biomed Eng. 2012, 28, 528–546. [Google Scholar] [CrossRef]
- Cisonni, J.; Lucey, A.D.; King, A.J.; Islam, S.M.S.; Lewis, R.; Mithran, G. Numerical simulation of pharyngeal airflow applied to obstructive sleep apnea: Effect of the nasal cavity in anatomically accurate airway models. Med. Biol. Eng. Comput. 2015, 53, 1129–1139. [Google Scholar] [CrossRef]
- Cheng, Y.S.; Zhou, Y.; Chen, B.T. Particle deposition in a cast of human oral airways. Aerosol Sci. Technol. 1999, 31, 286–300. [Google Scholar] [CrossRef]
- Grgic, B.; Finlay, W.H.; Heenan, A.F. Regional aerosol deposition and flow measurements in an idealized mouth and throat. J. Aerosol Sci. 2004, 35, 21–32. [Google Scholar] [CrossRef]
- Martonen, T.; Zhang, Z.; Lessmann, R.C. Fluid Dynamics of the Human Larynx and Upper TB Airways. Aerosol Sci. Technol. 1993, 19, 133–156. [Google Scholar] [CrossRef]
- Xi, J.; Yuan, J.E.; Yang, M.; Si, X.; Zhou, Y.; Cheng, Y.S. Parametric study on mouth-throat geometrical factors on deposition of orally inhaled aerosols. J. Aerosol Sci. 2016, 99, 94–106. [Google Scholar] [CrossRef]
- Grgic, B.; Martin, A.R.; Finlay, W.H. The effect of unsteady flow rate increase on in vitro mouth–throat deposition of inhaled boluses. J. Aerosol Sci. 2006, 37, 1222–1233. [Google Scholar] [CrossRef]
- Kim, C.S.; Fisher, D.M. Deposition characteristics of aerosol particles in sequentially bifurcating airway models. Aerosol Sci. Technol. 1999, 31, 198–220. [Google Scholar] [CrossRef]
- Zhou, Y.; Cheng, Y.S. Particle deposition in a cast of human tracheobronchial airways. Aerosol Sci. Technol. 2005, 39, 492–500. [Google Scholar] [CrossRef]
- Li, F.S.; Xu, X.X.; Sun, D.; Zhao, X.G.; Yang, M.; Tan, S.L. Experimental study on deposition of aerosol particles in human upper respiratory tract model. Med. Biomech. 2013, 56, 135–141. [Google Scholar]
- Phuong, N.L.; Ito, K. Investigation of flow pattern in upper human airway including oral and nasal inhalation by PIV and CFD. Build. Environ. 2015, 94, 504–515. [Google Scholar] [CrossRef]
- Jia, L.; Zhang, L.; Yu, S. Deposition of non-spherical microparticles in the human upper respiratory tract. Particuology 2018, 36, 185–189. [Google Scholar] [CrossRef]
- Kiasadegh, M.; Emdad, H.; Ahmadi, G.; Abouali, O. Transient numerical simulation of airflow and fibrous particles in a human upper airway model. J. Aerosol Sci. 2020, 140, 105480. [Google Scholar] [CrossRef]
- Huang, J.; Zhang, L. Numerical simulation of micro-particle deposition in a realistic human upper respiratory tract model during transient breathing cycle. Particuology 2011, 9, 424–431. [Google Scholar] [CrossRef]
- Chen, X.; Kleinstreuer, C.; Zhong, W.; Zhou, X. Effects of thermal airflow and mucus-layer interaction on hygroscopic droplet deposition in a simple mouth–throat model. Aerosol Sci. Technol. 2018, 52, 900–912. [Google Scholar] [CrossRef]
- Taherian, S.; Rahai, H.; Gomez, B.Z.; Waddington, T. Particulates depositions in patient-specific simulations of respiratory system. In Proceedings of the ASME 2014 International Mechanical Engineering Congress and Exposition, Montreal, QC, Canada, 14–20 November 2014; Volume 3. [Google Scholar]
- Van Rhein, T.; Alzahrany, M.; Banerjee, A.; Salzman, G. Fluid flow and particle transport in mechanically ventilated airways. Part I. Fluid flow structures. Med. Biol. Eng. Comput. 2016, 54, 1085–1096. [Google Scholar] [CrossRef] [PubMed]
- Sracic, M.K. Modeled regional airway deposition of inhaled particles in athletes at exeron. J. Aerosol Sci. 2016, 99, 54–63. [Google Scholar] [CrossRef]
- Islam, M.S.; Saha, S.C.; Sauret, E.; Gu, Y.T. Effects of velocity on diesel exhaust particle transpot tiand deposition in the central airways of the human lung. ACCM 2015, 18, 175–187. [Google Scholar]
- Rahimi-Gorji, M.; Pourmehran, O.; Gorji-Bandpy, M.; Gorji, T.B. CFD simulation of airflow behavior and particle transport and deposition in different breathing conditions through the realistic model of human airways. J. Mol. Liq. 2015, 209, 121–133. [Google Scholar] [CrossRef]
- Yu, S.; Wang, J.; Sun, X. Numerical Simulation of Particle Deposition in the Respiratory Tract. Med. Biomech. 2016, 31, 193–198. [Google Scholar]
- Dastan, A.; Abouali, O.; Ahmadi, G. CFD simulation of total and regional fiber deposition in human nasal cavities. J. Aerosol Sci. 2014, 69, 132–149. [Google Scholar] [CrossRef]
- Sturm, R. Bioaerosols in the lungs of subjects with different ages-part 1: Deposition modeling. J. Transl. Med. 2016, 4, 211. [Google Scholar] [CrossRef]
- Kleinstreuer, C.; Zhang, Z.; Kim, C.S. Combined inertial and gravitational deposition of microparticles in small model airways of a human respiratory system. J. Aerosol Sci. 2007, 38, 1047–1061. [Google Scholar] [CrossRef]
- Nicolaou, L. Inertial and gravitational effects on aerosol deposition in the conducting airways. J. Aerosol Sci. 2018, 120, 32–51. [Google Scholar] [CrossRef]
- Tian, L.; Ahmadi, G. Transport and deposition of nano-fibers in human upper tracheobronchial airways. J. Aerosol Sci. 2016, 91, 22–32. [Google Scholar] [CrossRef]
- Feng, Y.; Kleinstreuer, C.; Rostami, A. Evaporation and condensation of multicomponent electronic cigarette droplets and conventional cigarette smoke particles in an idealized G3–G6 triple bifurcating unit. J. Aerosol Sci. 2015, 80, 58–74. [Google Scholar] [CrossRef]
- Chen, X.; Zhong, W.; Zhou, X.; Jin, B.; Sun, B. CFD–DEM simulation of particle transport and deposition in pulmonary airway. Powder Technol. 2012, 228, 309–318. [Google Scholar] [CrossRef]
- Deng, Q.; Ou, C.; Shen, Y.M.; Xiang, Y.; Miao, Y.; Li, Y. Health effects of physical activity as predicted by particle deposition in the human respiratory tract. Sci. Total Environ. 2019, 657, 819–826. [Google Scholar] [CrossRef]
- Li, R.; Zhao, X.; Liu, Y. Numerical simulation and experimental research progress of inhalable particulate matter deposition in the human respiratory system. J. Biomed. Eng. 2017, 34, 637–642. [Google Scholar]
- Kabilan, S.; Suffield, S.R.; Recknagle, K.P.; Jacob, R.E.; Einstein, D.R.; Kuprat, A.P.; Carson, J.P.; Colly, S.M.; Saunders, J.H.; Hines, S.A.; et al. Computational fluid dynamics modeling of Bacillus anthracis spore deposition in rabbit and human respiratory airways. J. Aerosol Sci. 2016, 99, 64–77. [Google Scholar] [CrossRef]
- Islam, M.S.; Saha, S.C.; Sauret, E.; Gu, Y.T. Numerical investigation of diesel exhaust particle transport and deposition in up to 17 generations of the lung airway. In Proceedings of the 20th Australasian Fluid Mechanics Conference 2016, Perth, Australia, 5–8 December 2016. [Google Scholar]
- Available online: https://baike.baidu.com/item/%E8%82%BA%E8%85%BA%E6%B3%A1/10975738 (accessed on 10 January 2023).
- Moskal, A. Modeling of he influence of tissue mechanical properties on the process of aerosol particles deposition in a model of human alveolus. J. Drug Deliv. Sci. Technol. 2012, 22, 153–159. [Google Scholar]
- Darquenne, C.; Harrington, L.; Prisk, G.K. Alveolar duct expansion greatly enhances aerosol deposition: A three-dimensional computational fluid dynamics study. Philos Trans. A Math Phys. Eng. Sci. 2009, 367, 2333–2346. [Google Scholar] [CrossRef]
- Sznitman, J.; Heimsch, F.; Heimsch, T.; Rusch, D.; Rösgen, T. Three-dimensional convective alveolar flow induced by rhythmic breathing motion of the pulmonary acinus. J. Biomech. Eng. 2007, 129, 658–665. [Google Scholar] [CrossRef]
- Sznitman, J.; Heimsch, T.; Wildhaber, J.H.; Tsuda, A.; Rösgen, T. Respiratory flow phenomena and gravitational deposition in a three-dimensional space-filling model of the pulmonary acinar tree. J. Biomech. Eng. 2009, 131, 031010. [Google Scholar] [CrossRef] [PubMed]
- Haber, S.; Yitzhak, D.; Tsuda, A. Gravitational deposition in a rhythmically expanding and contracting alveolus. Natl. Libr. Medcine 2003, 95, 657–671. [Google Scholar] [CrossRef] [PubMed]
- Ching, J.; Kajino, M. Aerosol mixing state matters for particles deposition in human respiratory system. Sci. Rep. 2018, 8, 8864. [Google Scholar] [CrossRef] [PubMed]
- Darquenne, C. Deposition Mechanisms. J. Aerosol Med. Pulm. Drug Deliv. 2020, 33, 181–185. [Google Scholar] [CrossRef]
- Deng, Q.; Deng, L.; Miao, Y.; Guo, X.; Li, Y. Particle deposition in the human lung: Health implications of particulate matter from different sources. Environ. Res. 2019, 169, 237–245. [Google Scholar] [CrossRef]
- Manojkumar, N.; Srimuruganandam, B.; Nagendra, S.S. Application of multiple-path particle dosimetry model for quantifying age specified deposition of particulate matter in human airway. Ecotoxicol. Environ. Saf. 2019, 168, 241–248. [Google Scholar] [CrossRef]
- Manojkumar, N.; Srimuruganandam, B. Age-specific and seasonal deposition of outdoor and indoor particulate matter in human respiratory tract. Atmos. Pollut. Res. 2022, 13, 101298. [Google Scholar] [CrossRef]
- Khan, S.; Gurjar, B.R.; Sahu, V. Deposition modeling of ambient particulate matter in the human respiratory tract. Atmos. Pollut. Res. 2022, 13, 101565. [Google Scholar] [CrossRef]
- Liu, M.; Guo, W.; Zhao, L.; Yang, H.; Fang, Q.; Li, M.; Shu, J.; Chen, S.; Lai, X.; Yang, L.; et al. Association of personal fine particulate matter and its respiratory tract depositions with blood pressure in children: From two panel studies. J. Hazard. Mater. 2021, 416, 126120. [Google Scholar] [CrossRef]
- Zoladz, J.A.; Nieckarz, Z. Marathon race performance increases the amount of particulate matter deposited in the respiratory system of runners: An incentive for “clean air marathon runs”. PeerJ 2021, 9, e11562. [Google Scholar] [CrossRef]
- Khajeh-Hosseini-Dalasm, N.; Longest, P.W. Deposition of particles in the alveolar airways: Inhalation and Breath-Hold with pharmaceutical aerosols. J. Aerosol Sci. 2015, 79, 15–30. [Google Scholar] [CrossRef]
- Kolanjiyil, A.V.; Kleinstreuer, C. Modeling Airflow and Particle Deposition in a Human Acinar Region. Comput. Math. Methods Med. 2019, 2019, 5952941. [Google Scholar] [CrossRef] [PubMed]
- Schittny, J.C.; Mund, S.I.; Stampanoni, M. Evidence and structural mechanism for late lung alveolarization. Am. J. Physiol. Lung Cell. Mol. Physiol. 2008, 294, L246–L254. [Google Scholar] [CrossRef] [PubMed]
- Moraes, C.; Mehta, G.; Lesher-Perez, S.C.; Takayama, S. Organs-on-a-chip: A focus on compartmentalized microdevices. Ann. Biomed. Eng. 2012, 40, 1211–1227. [Google Scholar] [CrossRef] [PubMed]
- Muneswarao, J.; Verma, A.K.; Hassali, M.A.A. Global initiative for chronic obstructive lung disease (GOLD) 2018 report: Highlighting an incorrect information. Pulm. Pharmacol. Ther. 2018, 49, 10. [Google Scholar] [CrossRef]
- Zhang, S.; Zhang, M.; Feng, G. PCDD/Fs pollution in the workshop of automobile foundry and assessment of respiratory exposure of workshop workers. China Environ. Sci. 2015, 35, 3779–3785. [Google Scholar]
- Samarghandi, A.; Ioachimescu, O.C.; Qayyum, R. Association between peak inspiratory flow rate and hand grip muscle strength in hospitalized patients with acute exacerbation of chronic obstructive pulmonary disease. PLoS ONE 2020, 15, e0227737. [Google Scholar] [CrossRef]
- Darquenne, C.; Lamm, W.J.; Fine, J.M.; Corlet, R.A.; Gelenny, R. Total and regional deposition of inhaled aerosols in supine healthy subjects and subjects with mild-to-moderate COPD. J. Aerosol Sci. 2016, 99, 27–39. [Google Scholar] [CrossRef]
- Ganguly, K.; Carlander, U.; Garessus, E.D.; Fridén, M.; Eriksson, U.G.; Tehler, U.; Johanson, G. Computational modeling of lung deposition of inhaled particles in chronic obstructive pulmonary disease (COPD) patients: Identification of gaps in knowledge and data. Crit. Rev. Toxicol. 2019, 49, 160–173. [Google Scholar] [CrossRef]
- Wang, Y.B.; Watts, A.B.; Peters, J.I.; Williams, R.O. The impact of pulmonary diseases on the fate of inhaled medicines—A review. Int. J. Pharm. 2014, 461, 112–128. [Google Scholar] [CrossRef]
- Zhuang Jiawei; Diao Yongfa; Chu Minghao; Shen Henggen. Movement and deposition characteristics of inhalable particulate matter in different obstructive airways. Chin. Environ. Sci. 2021, 41, 3349–3359. [Google Scholar]
- Tohidi, R.; Sajadi, B.; Ahmadi, G. The effect of nasal airway obstruction on the dispersion and deposition of inhaled volatile droplets in the human nasal cavity: A numerical study. J. Aerosol Sci. 2020, 150, 105650. [Google Scholar] [CrossRef]
- Zhang, W.; Xiang, Y.; Lu, C.; Deng, Q. Numerical modeling of particle deposition in the conducting airways of asthmatic children. Med. Eng. Phys. 2020, 76, 40–46. [Google Scholar] [CrossRef] [PubMed]
- Luo, H.Y.; Liu, Y.; Yang, X.L. Particle deposition in obstructed airways. J. Biomech. 2007, 40, 3096–3104. [Google Scholar] [CrossRef]
- Prinz, A.L.; Richter, D.J. Long-term exposure to fine particulate matter air pollution: An ecological study of its effect on COVID-19 cases and fatality in Germany. Environ. Res. 2022, 204, 111948. [Google Scholar] [CrossRef]
- Bianconi, V.; Bronzo, P.; Banach, M.; Sahebkar, A.; Mannarino, M.; Pirro, M. Particulate matter pollution and the COVID-19 outbreak: Results from Italian regions and provinces. Arch. Med. Sci. 2020, 16, 985–992. [Google Scholar] [CrossRef]
- Mehmood, K.; Iqbal, M.; Abrar, M.M. Can exposure to PM2.5 particles increase the incidence of coronavirus disease 2019 (COVID-19)? Sci. Total Environ. 2020, 741, 140441. [Google Scholar] [CrossRef]
- Abrar, M.M.; Iqbal, M.; Haider, E.; Shoukat, H.M.H. Can PM2.5 pollution worsen the death rate due to COVID-19 in India and Pakistan? Sci. Total Environ. 2020, 742, 140557. [Google Scholar]
- Renard, J.B.; Surcin, J.; Annesi-Maesano, I.; Delaunay, G.; Poincelet, E.; Dixsaut, G. Relation between PM2.5 pollution and COVID-19 mortality in Western Europe for the 2020–2022 period. Sci. Total Environ. 2022, 848, 157579. [Google Scholar] [CrossRef]
- Rodríguez-Urrego, D.; Rodríguez-Urrego, L. Air quality during the COVID-19: PM2.5 analysis in the 50 most polluted capital cities in the world. Environ. Pollut. 2020, 266, 115042. [Google Scholar] [CrossRef]
- Mathew, T.; Madhavi, N. Air Quality During COVID-19: Analysis of Particulate Matter for a Coastal Urban Station Visakhapatnam (India). Lett. Appl. Nano Biosci. 2020, 10, 1925–1935. [Google Scholar]
- Cruz, R.; Lima-Silva, A.E.; Bertuzzi, R.; Hoinaski, L. Exercising under particulate matter exposure: Providing theoretical support for lung deposition and its relationship with COVID-19. Environ. Res. 2021, 202, 111755. [Google Scholar] [CrossRef] [PubMed]
- Workman, A.D.; Jafari, A.; Xiao, R.; Bleier, B.S. Airborne aerosol olfactory deposition contributes to anosmia in COVID-19. PLoS ONE 2021, 16, e0244127. [Google Scholar] [CrossRef] [PubMed]
- Davis, M.E.; Chen, Z.; Dong, M.S. Nanoparticle therapeutics:an emerging treatment modality for cancer. Nat. Rev. Drug Discov. 2008, 7, 771–782. [Google Scholar] [CrossRef]
- Kreuter, J. Nanoparticulate systems for brain delivery of drugs. Adv. Drug Deliv. Rev. 2001, 47, 65–81. [Google Scholar] [CrossRef]
- Broday, D. Deposition of ultrafine particles at carinal ridges of the upper bronchial airways. Aerosol Sci. Technol. 2004, 38, 991–1000. [Google Scholar] [CrossRef]
- Isaacs, K.K.; Martonen, T.B. Particle deposition in children’s lungs: Theory and experiment. J. Aerosol Med. 2005, 18, 337–353. [Google Scholar] [CrossRef]
- Feng, Y.; Xu, Z.; Haghnegahdar, A. Computational Fluid·Particle Dynamics Modeling for Unconventional Inhaled Aerosols in Human Respiratory Systems. Aerosols Sci. Case Stud. 2016, 35, 49–84. [Google Scholar]


| Sleep Problems Before and After the Patient’s Illness | ||
|---|---|---|
| Sleep Symptom | Experienced During Illness (of All Participants) | Had Symptom before Illness |
| Insomnia | 60% (67.1 to 70.1%) | 21% |
| Night Sweats | 41% (39.2 to 42.4%) | 16% |
| Awakened Feeling | 36% (34.5 to 37.6%) | n/a |
| Unable to Breathe | ||
| Restless Legs | 18% (16.6 to 19%) | 14% |
| Sleep Apnea | 10% (9.5 to 12.8%) | 34% |
| Vivid Dreams | 33% (31.5 to 34.5%) | 23% |
| Nightmares | 26% (24.3 to 27.1%) | 20% |
| Lucid dreams | 15% (14.2 to 16.6%) | 34% |
| Test Results for Latent Disease | ||||
|---|---|---|---|---|
| Virus | Positive | Positive (Past) | Negative | Total Tested |
| Epstein-Barr (EBV) | 40 | 309 | 231 | 580 |
| Lyme Disease | 7 | 34 | 366 | 407 |
| Cytomegalovirus (CMV) | 4 | 85 | 204 | 293 |
| Inspiration Flow Rate (L/min) | |||
|---|---|---|---|
| Lacation | 15 | 30 | 60 |
| Venteicular folds | 1600 | 3200 | 6400 |
| Vocal folds | 1970 | 3100 | 4740 |
| Trachea | 1160 | 2320 | 4640 |
| Main bronchi | 855 | 1710 | 3420 |
| SBP | DBP | MAP | Prehypertension | Hypertension | |||
|---|---|---|---|---|---|---|---|
| Exposure level | % Change (95% CI) | % Change (95% CI) | % Change (95% CI) | Case/Total | Odds ratio (95% CI) | Case/Total | Odds ratio (95% CI) |
| PM2.5 | |||||||
| T1 (1.14–26.62 μm/m3) | Ref. | Ref. | Ref. | 21/263 | Ref. | 30/263 | Ref. |
| T2 (26.73–49.26 μg/m3) | 1.47 (−0.07, 3.02) | 2.00 (−0.22, 4.22) | 1.75 (0.05, 3.45) | 29/266 | 1.37 (0.75, 2.52) | 45/266 | 1.28 (0.76, 2.15) |
| T3 (49.41–341.60 μg/m3) | 3.62 (1.84, 5.40) | 5.14 (2.55, 7.72) | 4.44 (2.47, 6.42) | 36/265 | 2.25 (1.13, 4.47) | 77/265 | 2.03 (1.17, 3.53) |
| P-trend | ≤0.001 | ≤0.001 | ≤0.001 | 0.023 | 0.013 | ||
| ET | |||||||
| TI (2.82–68.26 μg) | Ref. | Ref. | Ref. | 16/264 | Ref. | 20/264 | Ref. |
| T2 (68.41–154.55 μg) | 2.66 (1.04, 4.29) | 1.46 (2.15, 6.76) | 3.64 (1.87, 5.41) | 27/265 | 2.34 (1.23, 4.44) | 37/265 | 2.02 (1, 4.09) |
| T3 (154.89–1644.8 μg) | 4.85 (2.91, 6.78) | 8.32 (5.54, 11.09) | 6.86 (4.74, 8.98) | 43/265 | 4.39 (2.03, 9.47) | 95/265 | 3.78 (1.77, 8.07) |
| P-trend | ≤0.001 | ≤0.001 | ≤0.001 | ≤0.001 | ≤0.001 | ||
| TB | |||||||
| T1 (0.67–12.85 μg) | Ref. | Ref. | Ref. | 18/264 | Ref. | 25/264 | Ref. |
| T2 (12.96–25.14 μg) | 1.86 (0.33, 3.39) | 2.98 (0.79, 5.18) | 2.50 (0.82, 4.18) | 28/265 | 1.67 (0.87, 3.22) | 44/265 | 1.63 (0.90, 2.94) |
| T3 (25.15–190.61 μg) | 4.49 (2.74, 6.24) | 5.99 (3.44, 8.54) | 5.35 (3.41, 7.30) | 40/265 | 3.22 (1.56, 6.63) | 83/265 | 2.27 (1.24, 4.14) |
| P-trend | ≤0.001 | ≤0.001 | ≤0.001 | ≤0.002 | ≤0.006 | ||
| AR | |||||||
| T1 (0.91–19.66 μg) | Ref. | Ref. | Ref. | 17/264 | Ref. | 20/264 | Ref. |
| T2 (18.7–39.34 μg) | 1.62 (0.04, 3.20) | 3.93 (1.68, 6.18) | 2.90 (1.18, 4.62) | 29/265 | 1.79 (0.93, 3.45) | 36/265 | 1.81 (0.95, 3.43) |
| T3 (39.53–319.54 μg) | 4.54 (2.64, 6.44) | 7.68 (4.95, 10.41) | 6.35 (4.27, 8.44) | 40/265 | 2.41 (1.15, 5.05) | 96/265 | 3.35 (1.72, 6.54) |
| P-trend | ≤0.001 | ≤0.001 | ≤0.001 | ≤0.017 | ≤0.001 |
| Anthropometric Data | |||||||
|---|---|---|---|---|---|---|---|
| Health Status | Subject No. | Gender | Age | Height, m | Weight, kg | FEV Predicted | FEV/FVC |
| H | 1 | M | 35 | 1.70 | 68 | 1.13 | 0.88 |
| H | 2 | M | 52 | 1.65 | 97 | 1.17 | 0.79 |
| H | 3 | M | 47 | 1.83 | 89 | 0.85 | 0.74 |
| H | 4 | M | 26 | 1.83 | 82 | 0.94 | 0.8 |
| H | 5 | M | 34 | 1.93 | 100 | 1.04 | 0.84 |
| H | 6 | M | 21 | 1.68 | 54 | 0.89 | 0.73 |
| H | 7 | M | 21 | 1.73 | 64 | 0.95 | 0.81 |
| C | 1 | M | 57 | 1.64 | 70 | 0.60 | 0.56 |
| C | 2 | M | 55 | 1.78 | 66 | 0.56 | 0.48 |
| C | 3 | M | 45 | 1.80 | 83 | 0.69 | 0.67 |
| C | 4 | M | 54 | 1.87 | 84 | 0.58 | 0.52 |
| C | 5 | M | 62 | 1.88 | 87 | 0.67 | 0.47 |
| C | 6 | M | 45 | 1.78 | 75 | 0.83 | 0.66 |
| Variable | Basic Model | Standardized Coefficients | State Fixed Effects Model | Standardized Coefficients |
|---|---|---|---|---|
| Distance to Ischgl | −1.892 | −0.4349298 | −1.802 | −0.4141894 |
| Distance to nearest German hotspot | 1.782 | 0.1530381 | 1.955 | 0.1679186 |
| Nursing home places per 100 k inhabitants at 75 and older | 0.017 | 0.03517896 | 0.047 | 0.09850678 |
| Share of people >75 years | 3709.915 | 0.0668369 | 1551.69 | 0.02795485 |
| Population density | 0.275 | 0.2033308 | 0.167 | 0.1234201 |
| Commuter flow | −0.004 | −0.09751138 | −0.003 | −0.0743129 |
| Avg. PM10, 2002 to 2020 | 52.381 | 0.1689943 | 36.08 | 0.1164028 |
| Avg. Income 2002 to 2018 | 4.772 | 0.01166486 | 10.994 | 0.02687409 |
| East Germany | 544.945 | 0.2241532 | ||
| Border with Czech Republic | 1900.803 | 0.3644518 | 1422.722 | 0.2727866 |
| Constant | 1600.346 | |||
| Fixed effects | NO | YES | ||
| Observations | 400 | 400 | ||
| Adj. R2 | 0.463 | 0.145 | ||
| F Statistic | 35.406 | 10.166 |
| Variable | Basic Model | Standardized Coefficients | State Fixed Effects Model | Standardized Coefficients |
|---|---|---|---|---|
| Distance to Ischgl | −1.892 | −0.4349298 | −1.802 | −0.4141894 |
| Distance to nearest German hotspot | 1.782 | 0.1530381 | 1.955 | 0.1679186 |
| Nursing home places per 100 k inhabitants at 75 and older | 0.017 | 0.035117896 | 0.047 | 0.09850678 |
| Share of people >75 years | 3709.915 | 0.668369 | 1551.69 | 0.02795485 |
| Population density | 0.275 | 0.2033308 | 0.167 | 0.1234201 |
| Commuter flow | −0.004 | −0.09751138 | −0.003 | −0.0743129 |
| Avg. PM10, 2002 to 2020 | 52.381 | 0.1689943 | 36.08 | 0.1164028 |
| Avg. Income 2002 to 2018 | 4.772 | 0.01166486 | 10.994 | 0.02687409 |
| East Germany | 544.945 | 0.2241532 | ||
| Border with Czech Republic | 1900.803 | 0.3644518 | 1422.722 | 0.2727866 |
| Constant | 1600.346 | |||
| Fixed effects | NO | YES | ||
| Observations | 400 | 400 | ||
| Adj. R2 | 0.463 | 0.145 | ||
| F Statistic | 35.406 | 10.166 |
Disclaimer/Publisher’s Note: The statements, opinions and data contained in all publications are solely those of the individual author(s) and contributor(s) and not of MDPI and/or the editor(s). MDPI and/or the editor(s) disclaim responsibility for any injury to people or property resulting from any ideas, methods, instructions or products referred to in the content. |
© 2023 by the authors. Licensee MDPI, Basel, Switzerland. This article is an open access article distributed under the terms and conditions of the Creative Commons Attribution (CC BY) license (https://creativecommons.org/licenses/by/4.0/).
Share and Cite
Zhu, D.; Gires, E.; Dong, H.; Chen, A.; Ahmad, K.A. Review of Motion Simulation of Particulate Matter in the Respiratory System and Further CFD Simulations on COVID-19. Processes 2023, 11, 1281. https://doi.org/10.3390/pr11041281
Zhu D, Gires E, Dong H, Chen A, Ahmad KA. Review of Motion Simulation of Particulate Matter in the Respiratory System and Further CFD Simulations on COVID-19. Processes. 2023; 11(4):1281. https://doi.org/10.3390/pr11041281
Chicago/Turabian StyleZhu, Di, Ezanee Gires, Huizhen Dong, Aolin Chen, and Kamarul Arifin Ahmad. 2023. "Review of Motion Simulation of Particulate Matter in the Respiratory System and Further CFD Simulations on COVID-19" Processes 11, no. 4: 1281. https://doi.org/10.3390/pr11041281