1. Introduction
Hypoid gears are a special type of spiral bevel gear, having skew rotation axes, higher coincidence, and greater carrying capacity as well as flexible space arrangement [
1,
2]. Hypoid gears are widely used in aerospace, automobile, engineering machinery, and other fields for motion and power transmission between intersecting or staggering axes [
3]. The tooth surface accuracy directly affects the meshing performance of hypoid gears and performances (e.g., transmission efficiency, noise, motion accuracy, and service life) of the equipment it belongs to. With the rapid development of the automobile and other equipment manufacturing industries, the demand for high-performance and low-cost hypoid gears is also increasing more and more. It is very important to control the heat treatment deformation reasonably, ensure the tooth surface accuracy, improve the gear meshing performance and production efficiency, reduce the production cost, and obtain good economic benefits, which is also one of the urgent issues to be solved in the hypoid gear manufacturing and even in the gear industry.
The current single-tooth surface detection technology can truly and quantitatively express the tooth surface error information by using digital precision measurement and feedback correction technologies. Compared with the traditional rolling detection technology of the tooth surfaces, the detection efficiency and accuracy are obviously improved. Combined with that, many scholars have deeply studied the digital measurement [
4,
5,
6,
7] and feedback correction [
8,
9,
10,
11,
12,
13,
14,
15,
16] technologies of the hypoid gear tooth surface errors. Undeniably, the related research results have provided a good theoretical foundation and solutions for improving the tooth surface quality before heat treatment of the hypoid gears and have been widely used in the tooth surface machining and detection of hypoid gears in enterprises. However, there have been few scholars or actual papers that have studied how to achieve the tooth surface quality control of the same batch of hypoid gears after heat treatment with digital precision measurement and feedback correction technologies.
It is well known that heat treatment is an important process link to ensuring and improving the comprehensive performance of the hypoid gears. In actual hypoid gears manufacturing, the heat treatment process can significantly reduce tooth flank machining accuracy, due to the comprehensive influence of various factors [
17,
18]. The real tooth flank form geometry inevitably deviates from their theoretical or objective one, which directly affects the efficiency and quality of the subsequent finishing process, as well as the meshing performance and service life of the hypoid gears. It is noteworthy that in order to control the deformation of the tooth surface after heat treatment, the orthogonal test method is traditionally used to summarize the heat treatment deformation laws and influencing factors of the hypoid gear tooth surfaces, which are time-consuming, labor-intensive, and a waste of the production costs. Based on this consideration, in order to improve production efficiency and reduce production costs, the tooth surfaces of hypoid gears are often not inspected one by one after the batch heat treatment in most gear enterprises. The tooth surface quality detection of the whole batch of hypoid gears only depends on a small number of sampled product data. However, owing to the small number of tooth surface detection data and the unknown probability distribution of that, it is difficult to estimate and evaluate the change trends and laws of the tooth surfaces after heat treatment with the traditional statistical methods. How to use the advanced statistical theory and method to evaluate the whole batch machining quality of tooth surfaces after heat treatment is particularly urgent. Unfortunately, there is still limited research in this area.
Excitedly, although there have complex influencing factors and deformation laws of the tooth surfaces after heat treatment, for the same batch of hypoid gears with the same gear material, numerical control gear milling method, and heat treatment specifications, the statistics change trends of the tooth surfaces heat treatment deformation can be analyzed completely with the batch detection of tooth surface errors and the statistics of the small sample data. As a mathematical statistics method, bootstrap is a method that can resample the small sample data to generate large samples and simulate overall sample characteristics, with the feature of approximation estimation of the whole sample based on the existing small sample data [
19,
20,
21]. In view of that, many scholars have carried out useful studies on the application of bootstrap and achieved good research results, especially in the prediction and evaluation of gear performance. For instance, Wang et al. [
22] presented a small sample vibration of gearbox prediction method based on the grey system theory and the bootstrap theory, characterized the vibration base feature of tooth modification gearbox by developing the dynamic uncertainty, the estimated true value, and the systematic error measurement to indirectly dynamically evaluate the tooth modification effect, and the computer simulation and experiment results showed that the proposed prediction method could effectively predict the vibration base feature of the tooth modification gearbox. Based on the bootstrapping algorithm and the generative adversarial network, Li et al. [
23] proposed a generative model to generate admissible data by using the existing data and evaluate the gear safety factors of the automobile transmissions, and the data generated by the model had wider spaces than other oversampling methods and outperform in safety identifications. Chen et al. [
24] adopted the bootstrap resampling method to randomly extract the samples from the training set and train the parameter-optimized random forest model to identify the different fault modes of the planetary gear, which significantly improved the recognition accuracy and efficiency of the five different fault modes (healthy state, root crack, broken teeth, missing teeth and wear) of the planetary gear.
The above research work shows that the bootstrap statistics method has advantages in the small sample statistics really and can effectively predict the change trends of the big samples. However, there are few research reports on the efficient and accurate change laws statistics of the batch gear tooth surface errors after heat treatment by using the bootstrap statistics theory. In view of this, combining the tooth surface precision measurement technology with the bootstrap statistics theory, for the same batch hypoid gears with the same gear material, numerical control gear milling method, and heat treatment specifications, a bootstrap-based statistics scheme of tooth surface errors after heat treatment is proposed in this paper, which is aimed to achieve the change laws statistics and the effective evaluation of tooth surface errors for the whole batch hypoid gears after heat treatment. Hopefully, this research will also provide an effective mathematical statistics method for the tooth surface deformation control of the same batch of hypoid gears after heat treatment, so as to meet the mass production demands of the hypoid gears with high efficiency, high accuracy, and low costs in the automobiles and other equipment manufacturing industries.
The rest of the paper is organized as follows. The bootstrap-based statistics scheme of the tooth surface errors after heat treatment is constructed in
Section 2.
Section 3 describes the bootstrap statistics model for the batch tooth surface errors and elaborates on the calculation of the probability eigenvalues, the setting of the confidence interval, and the optimization of the bootstrap parameters.
Section 4 describes the mean value difference surface construction method of the bootstrap sample. Application experiment of the bootstrap-based statistics scheme is described in
Section 5.
Section 6 discusses the contribution and future research directions of the article. Finally, in
Section 7, the conclusions are reported.
2. Bootstrap-Based Statistics Scheme of the Tooth Surface Errors after Heat Treatment
For the same batch of hypoid gears with the same gear material, numerical control gear milling method, and heat treatment specifications, there is a certain overall change raw for the gear and pinion tooth surfaces after heat treatment, which can be found and analyzed with the help of the batch tooth surface errors detection and the bootstrap mathematical statistics theory.
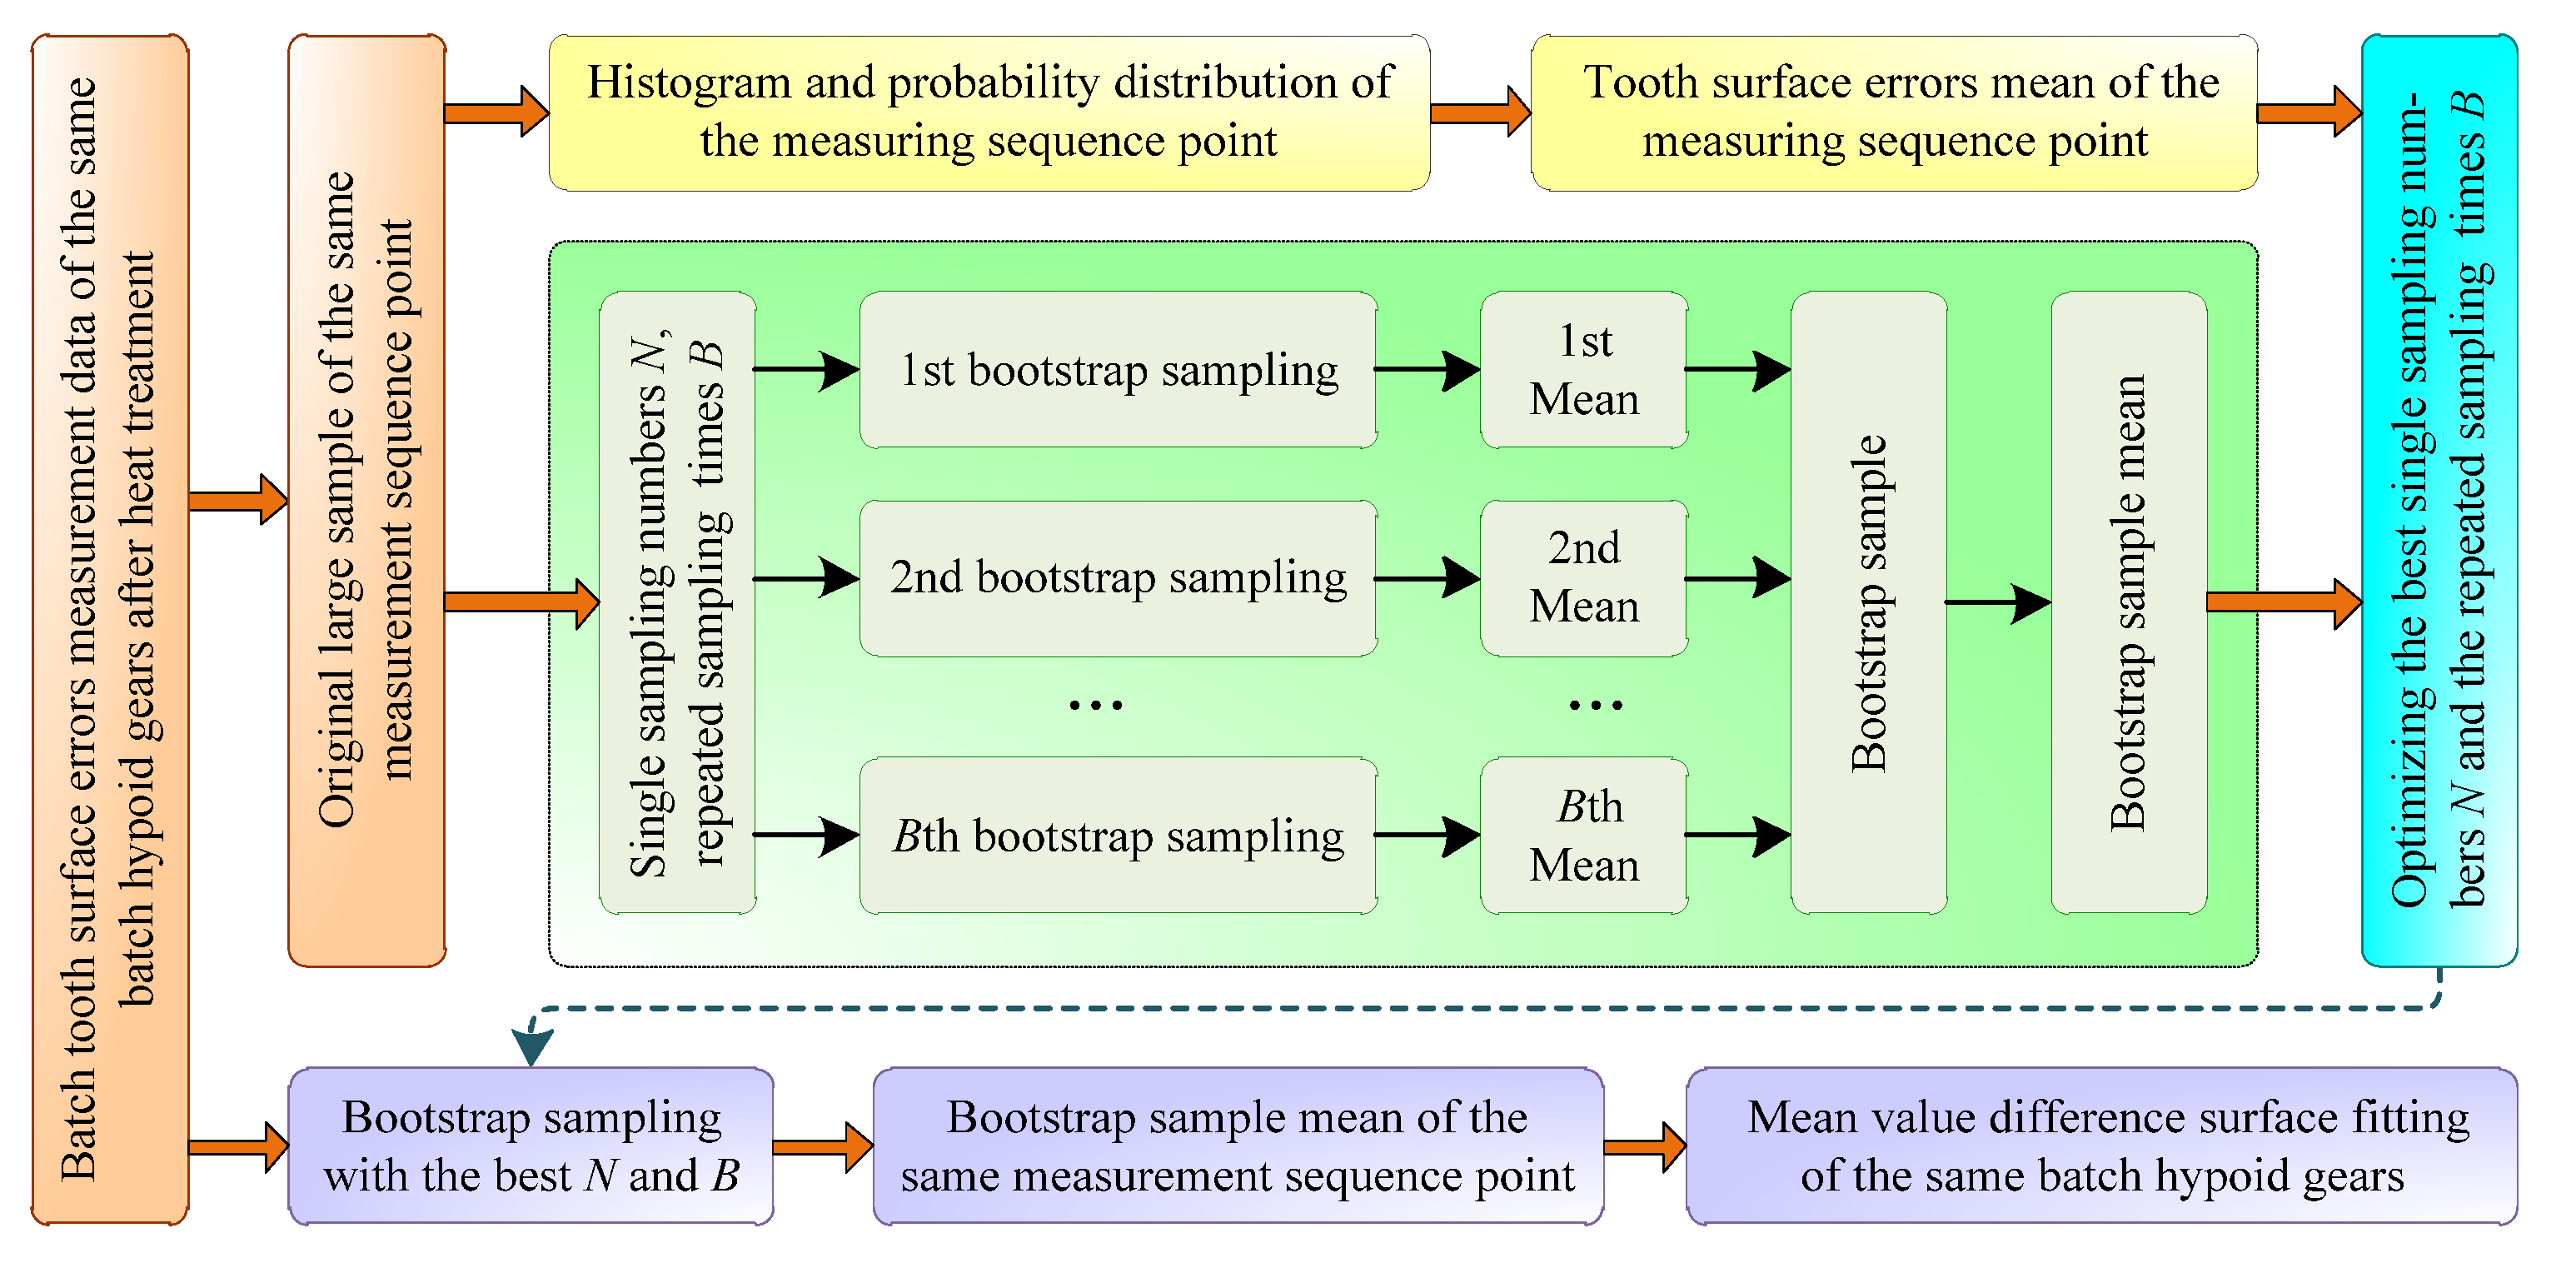
Firstly, for the same batch of hypoid gears after heat treatment, the tooth surfaces of not less than 100 pieces will be extracted and numbered. Then, the numbered tooth surface errors are measured sequentially based on the accurate measurement principle. For the 100 tooth surfaces numbered, the measurement data set of the same measurement sequence point on each tooth surface is defined as the original large sample of the same measurement sequence point. The histogram and probability distribution of the measurement sequence point can be solved, and the mathematical expectation (i.e., mean) of the tooth surface errors for the measurement sequence points can be solved through probability weighting. Finally, with this approach, the mean value of tooth surface errors for all measurement sequence points can be calculated.
On this basis, in the premise of ensuring reflect the large samples statistics effect of batch tooth surface deformation trend after heat treatment, in order to reduce the detection number of the deformed tooth surfaces after heat treatment, improve the detection efficiency, and reduce the labor intensity, the bootstrap statistical method is adopted. From the original large samples of the same measurement sequence points, the
measurement data are selected equiprobability and randomly to build a set of sample data. The
can be defined as single sampling numbers. It should be noted that in order to ensure the sample corresponding to the
has sufficiently representative of the overall sample, as well as the bootstrap statistical results, has better accuracy and reliability, the value range of
is from 5 to 20 based on the experience, and the selected
measurement data can be put back to the original large samples. In this way, the
times (e.g., 2000, 4000, 6000, 8000, and 10,000) resample can be extracted, and the corresponding mean value of each sample data can be calculated. Here, the
can be defined as the repeated sampling times, which are continuous. Only when
is taken sufficiently large, can more accurate bootstrap sampling results and the probability eigenvalue estimation results be obtained. Usually, the value of the
is at least 1000 [
25]. With that, the mean value of each set of sample data is arranged from small to large to construct the bootstrap sample data. The probability density function of bootstrap sample is solved with the histogram method, so as to calculate the mean values of corresponding bootstrap samples with different
and
.
Thus, the optimal values of
and
can be selected through the mean values comparative analysis between different bootstrap samples and the original large sample. With the help of this statistics method, for the batch deformed tooth surfaces of the hypoid gears after heat treatment, the statistics mean value of each measurement tooth surface sequence point can be calculated only through detecting the
deformed tooth surfaces and the
times resampling. On this basis, combined with the NURBS surface fitting method, a series of NURBS curves and the NURBS surface for the whole tooth surface can be fitted. In this way, for the same batch tooth surface errors of hypoid gears after heat treatment, the mean value difference surfaces of both the original large sample and the bootstrap sample can be fitted by NURBS. After that, by comparing and analyzing the fitted results of them, the feasibility and effectiveness of the bootstrap method statistics effect can be evaluated, which will provide a basis for the correction of tooth surface errors. The bootstrap-based statistics scheme of tooth surface errors after heat treatment is shown in
Figure 1.
3. Bootstrap Statistics Model for the Batch Tooth Surface Errors
3.1. Calculation of the Probability Eigenvalues
In order to save the tooth surface costs and measurement time of the same batch of hypoid gears after heat treatment, a small number of hypoid gear samples is selected and measured by serial number, and the tooth surface errors of each numbered measurement sequence point are obtained. Assume that the tooth surface errors of the first measuring point in the same sequence are
, so, the original sample of the tooth surface errors for the first measuring point can be constituted, which is shown in Equation (1).
In Equation (1), is the measured value of the th tooth surface errors of the first measuring point in the same sequence (), and is the total number of the measured tooth surfaces of that.
Take as the original sample, according to the principle of bootstrap sampling, the tooth surface error data are selected equiprobability and randomly from the to build the first bootstrap sample .
It should be noted that the selected data can be put back into the original large sample . That is, the will always remain in the pre-sampling state, no matter how many times it is sampled.
According to the sampling method of the first bootstrap sample
, the
bootstrap samples can be obtained through consecutive repeat sampling times
, and the total bootstrap sample
can be constituted, which is also called resample sample and represented by a vector in Equation (2).
In Equation (2),
is the
th bootstrap sample, and there
where,
is the sampling data of the
th bootstrap sample in
, and its mean value is shown in Equation (3).
The vector expression of the bootstrap sample mean value is shown in Equation (4).
In actual sampling simulation, the repeat sampling times is a big data set, and the simulated data are enough. Therefore, the data in can be sorted from small to large, and grouped at a certain interval to obtain the group median and calculate the frequency. Thus, the change trends of bootstrap statistics can be shown more intuitively with a histogram.
Combining Equations (3) and (4), the mean value and variance of the overall bootstrap sample can be obtained, which are shown in Equations (5) and (6), respectively.
Meanwhile, the mean value and variance of the original sample are shown in Equations (7) and (8), respectively.
According to Equations (5)–(8), the probability eigenvalues of each measurement sequence point of both the bootstrap sample and the original sample can be solved. The change trends of the whole original sample without prior conditions can also be clearly reflected through the probability eigenvalues of the bootstrap sample.
Through selecting the different and , continuous simulations and comparative analysis of the with , as well as the with , the best and can be finally optimized. After that, the bootstrap sample mean value and variance of tooth surface errors for each measurement sequence point can be calculated by the bootstrap statistics model. So, the tooth surface errors change trends of the whole batch hypoid gears after heat treatment can be estimated by extracting small sample data, which lays a foundation for its mean value difference surface construction.
3.2. Setting of the Confidence Interval
The credibility of the bootstrap method estimated parameters can be expressed with the confidence interval. For the sample eigenvalue estimated by the bootstrap method, the different confidence levels can be obtained by selecting different confidence levels. For the unknown parameters of mean and variance that need to be estimated by the bootstrap statistics method, the quantile method is adopted to solve its confidence interval in this paper.
Assume that the sample parameters estimation with the bootstrap statistics method is shown in Equation (9).
By arranging them from small to large, Equation (10) can be obtained.
Assuming the significance level is
(
), the confidence level is such as in Equation (11).
Note,
where,
and
are the estimation of quantiles
and
, and Equation (12) can be obtained.
So, the confidence interval of the bootstrap parameter can be obtained as . According to the confidence interval, the constraint probability of the value of sample probability eigenvalue can be realized, which achieves the authenticity and reliability analysis of the unknown sample estimation parameters.
3.3. Optimization of the Bootstrap Parameters
In mathematical statistics, the sample is generally considered a small sample when the number of samples is less than 30 [
26]. According to that, in the same batch of hypoid gears with the same gear material, numerical control gear milling method, and heat treatment specifications, firstly, the 20 pinions are randomly selected and numbered. Then, the tooth surface errors of the numbered pinions are measured sequentially based on the accurate measurement principle. Take the pinion concave surface as an example, the tooth surface error set of the same concave measurement sequence points is defined as an original sample. The pinion tooth surface errors (in mm) original sample of the same measurement sequence points are shown in
Table 1.
In
Table 1, there are 20 pinion tooth surfaces, and there are 225 tooth surface error data of corresponding different measurement sequence points on each tooth surface. According to the bootstrap statistics model, the bootstrap sample is obtained by resampling the original sample of the same measurement sequence point. Generally, in the bootstrap method, when
, the bootstrap sample will lack a sufficient representation of the original sample, its statistics results are highly arbitrary and not reliable. So, it is more appropriate when
[
27]. To ensure that the bootstrap statistics results are close to that of the actual sample and more clearly reflect the differences between different
, for the each tooth surface measurement point, the repeated bootstrap resampling is performed through proportionally selecting the different
(e.g., 5, 10, 15, and 20) and
(e.g., 2000, 4000, 6000, 8000, and 10,000), respectively, and the probability eigenvalue of each set of samples is calculated in turn, namely, the mean and variance of the bootstrap sample. The probability eigenvalues of the first measurement sequence point on the pinion concave surface with different
are shown in
Table 2, and the relative errors of variance between the bootstrap sample and the original sample are shown in
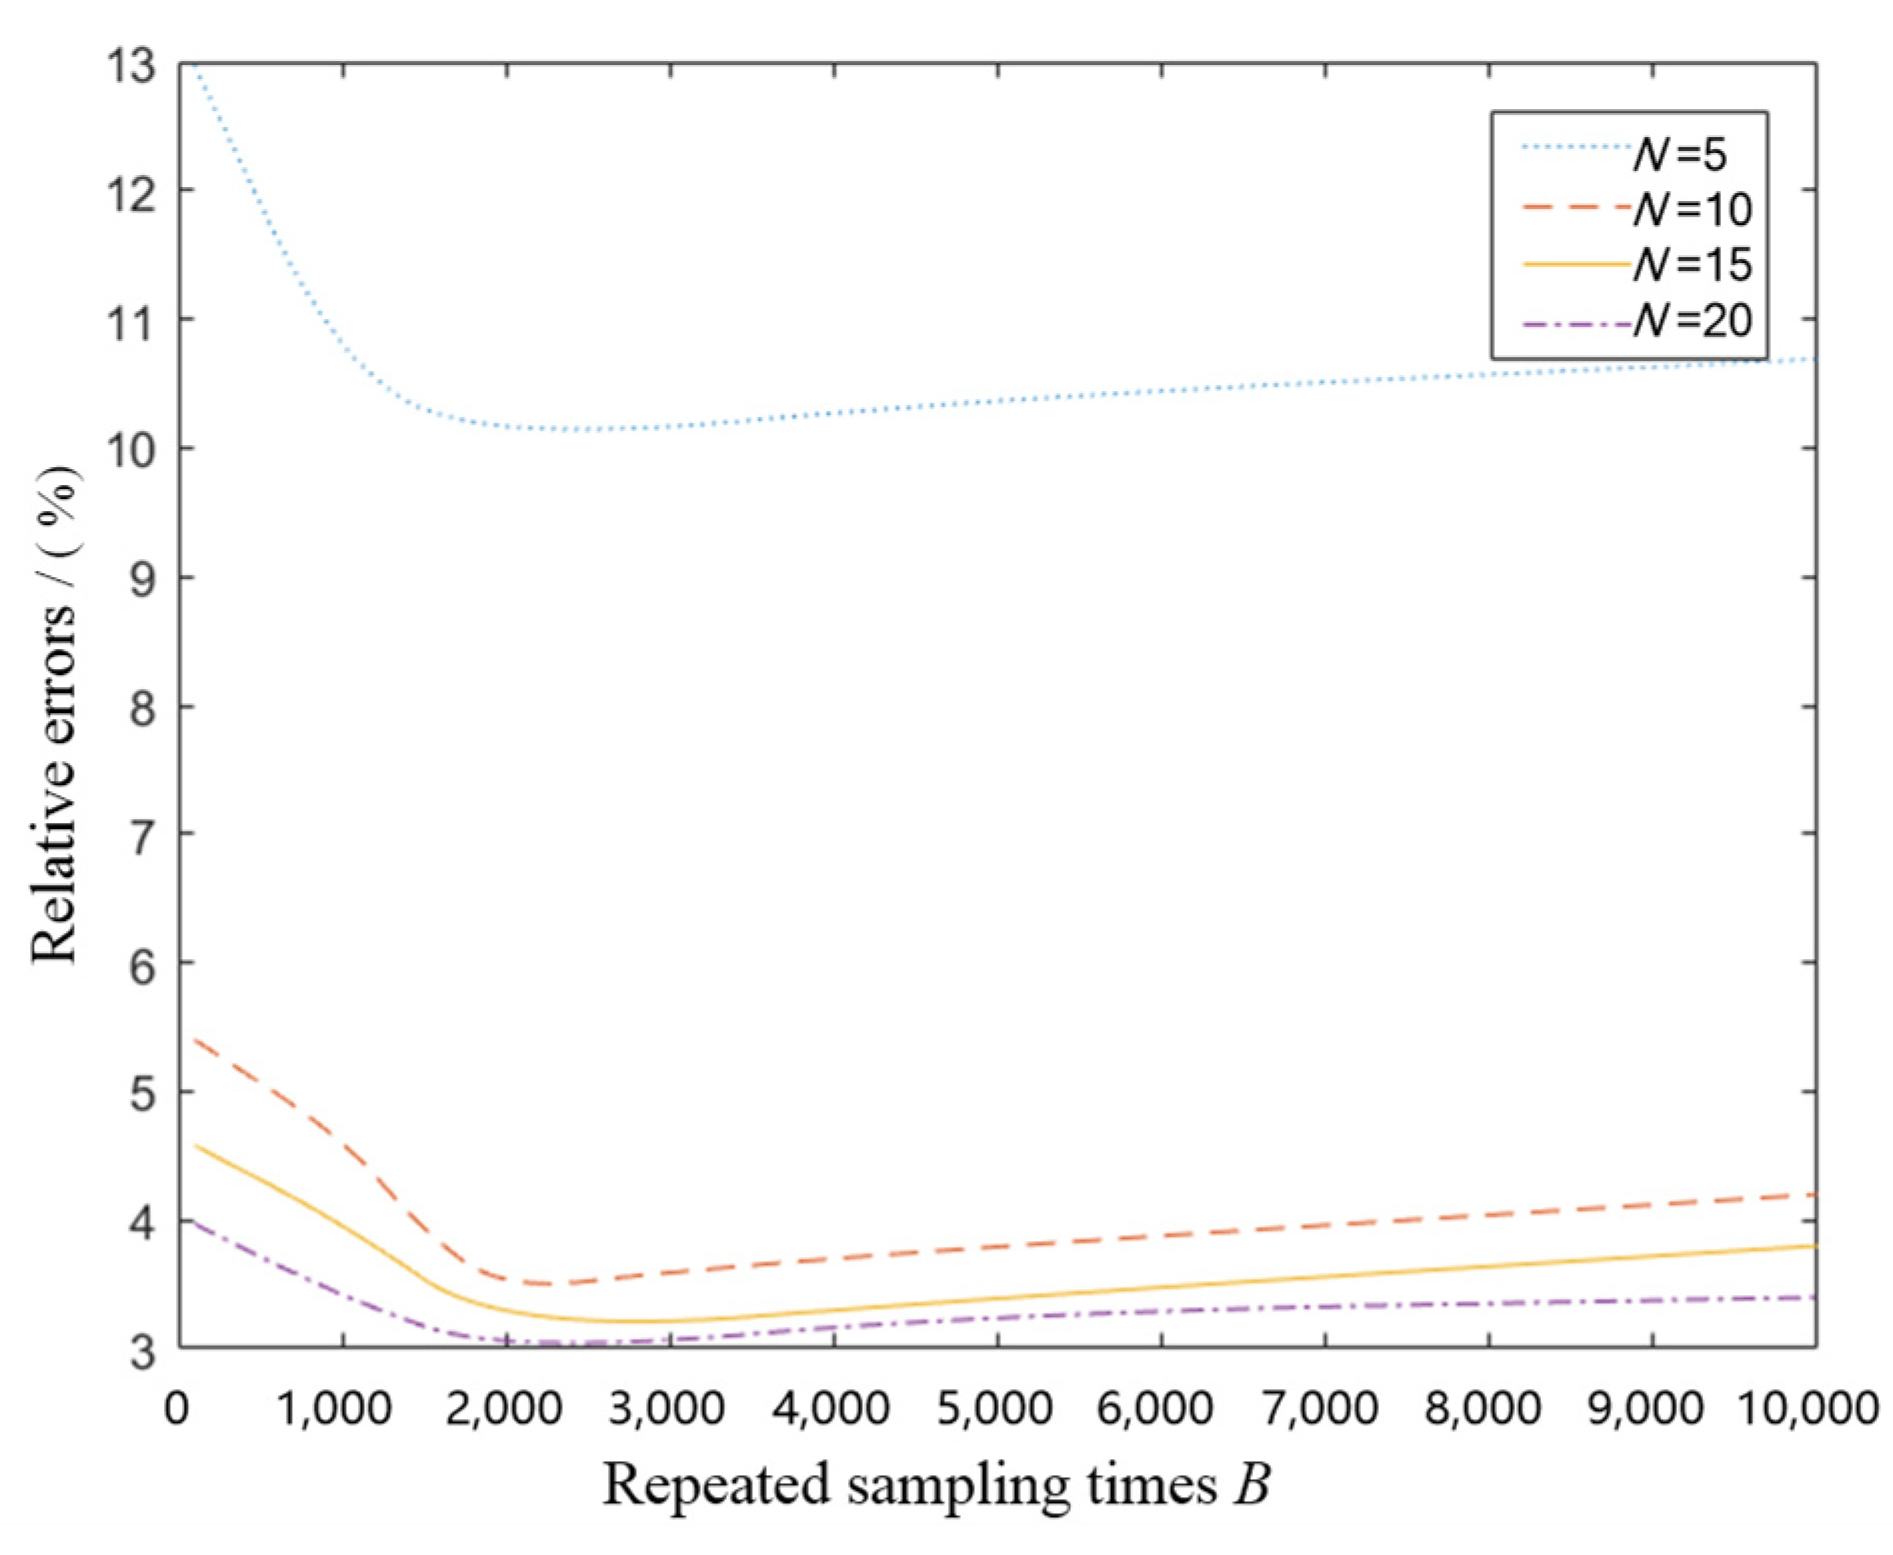
Figure 2.
From
Figure 2, it can be seen that the bootstrap method can also obtain effective calculation results only under the condition of a small sample. The relative errors of probability eigenvalues for the different
and
are clearly shown. Every different curve represents the relative error value for different
, which can clearly show the impact of the
and
on the relative errors. By comparing the different
, it can be found that with the increase in the
, a trend of decreasing first and then increasing in the relative error of variance. When the
is about 2000, the relative error is the smallest. Meanwhile, with the increasing of the single sampling numbers
of the bootstrap sample, a downward trend of the variance relative error is displayed generally. Take
as being 2000 as an example. When
increases from 5 to 10, the relative error of variance decreases by 6.59%. Comparatively, when
increases from 10 to 15, the relative error only decreases by 0.35%. It can effectively reflect the overall characteristics of the original sample when the
is 10. So, in order to reduce the numbers of the tooth surface measurement for the whole hypoid gears after heat treatment, improve the computational efficiency of the bootstrap probability eigenvalues, and reduce the production costs of the whole patch hypoid gears, the optimal
and
can be selected as 2000 and 10, respectively.
4. Mean Value Difference Surface Construction of the Bootstrap Sample
In order to reflect the change trends and laws of the whole batch hypoid gear tooth surface errors, it is necessary to use the interpolation technology to fit the tooth surface points bootstrap sampled, so as to obtain the parametric surface which can be expressed explicitly. In this paper, the NURBS surface fitting method is employed because of excellent overall smoothness, local regulation, and flexible characteristics, as well as a mainstream mathematical method for defining the shape of productions in ISO STEP standard [
28,
29,
30]. Meanwhile, NURBS surface fitting method can represent both free and analytical surfaces. NURBS surface can be seen as a control mesh composed of
control vertices, which is constructed by multiple NURBS curves in the direction
and
. It is a tensor product form of NURBS curves and the extension of the B-spline surface, and its definition is shown in Equation (13)
where,
represents the number of control vertices in direction
;
represents the number of control vertices in direction
;
and
represent the power of B-spline basis function;
represents the control vertex of the surface;
represents the weight factor;
denotes the B-spline basis function of degree
along the
direction; and
denotes the B-spline basis function of degree
along the
direction.
The basis function is given by the recursive definition derived by de-Boor and Cox, which is shown in Equation (14)
where the convention is
;
is the node,
is the power of B-spline, and the subscript
indicates the serial number of B-spline.
In this paper, the cubic NURBS surface fitting method is adopted, and the power of the basis function is selected to be cubic to make the surface meet the second-order continuous differentiability after digital fitting. Combined with the discrete tooth surface points bootstrap sampled and the cubic NURBS surface fitting, the tooth surface is reversed to approximate the true tooth surfaces of hypoid gears to the maximum extent, and the mean value difference surface for the actual tooth surfaces of the hypoid gears after heat treatment is obtained finally.
5. Application Experiment of the Bootstrap-Based Statistics Scheme
In analyzing the tooth surface errors deformation of hypoid gears after heat treatment by the traditional way, the finding of the tooth surface errors change trends needs to rely on a large number of data samples and multiple orthogonal tests. Comparatively, the bootstrap-based statistics scheme proposed in this paper can easily analyze the change trends of the tooth surface errors only needing to randomly select a small amount of test sample data from the overall sample. In order to more intuitively and accurately analyze the feasibility and practicability of the bootstrap statistics method in predicting the change laws of tooth surface errors after heat treatment, the bootstrap statistics application experiment of the batch tooth surface errors of hypoid gears is carried out in this paper.
5.1. Accurate Measurement of the Tooth Surface Errors
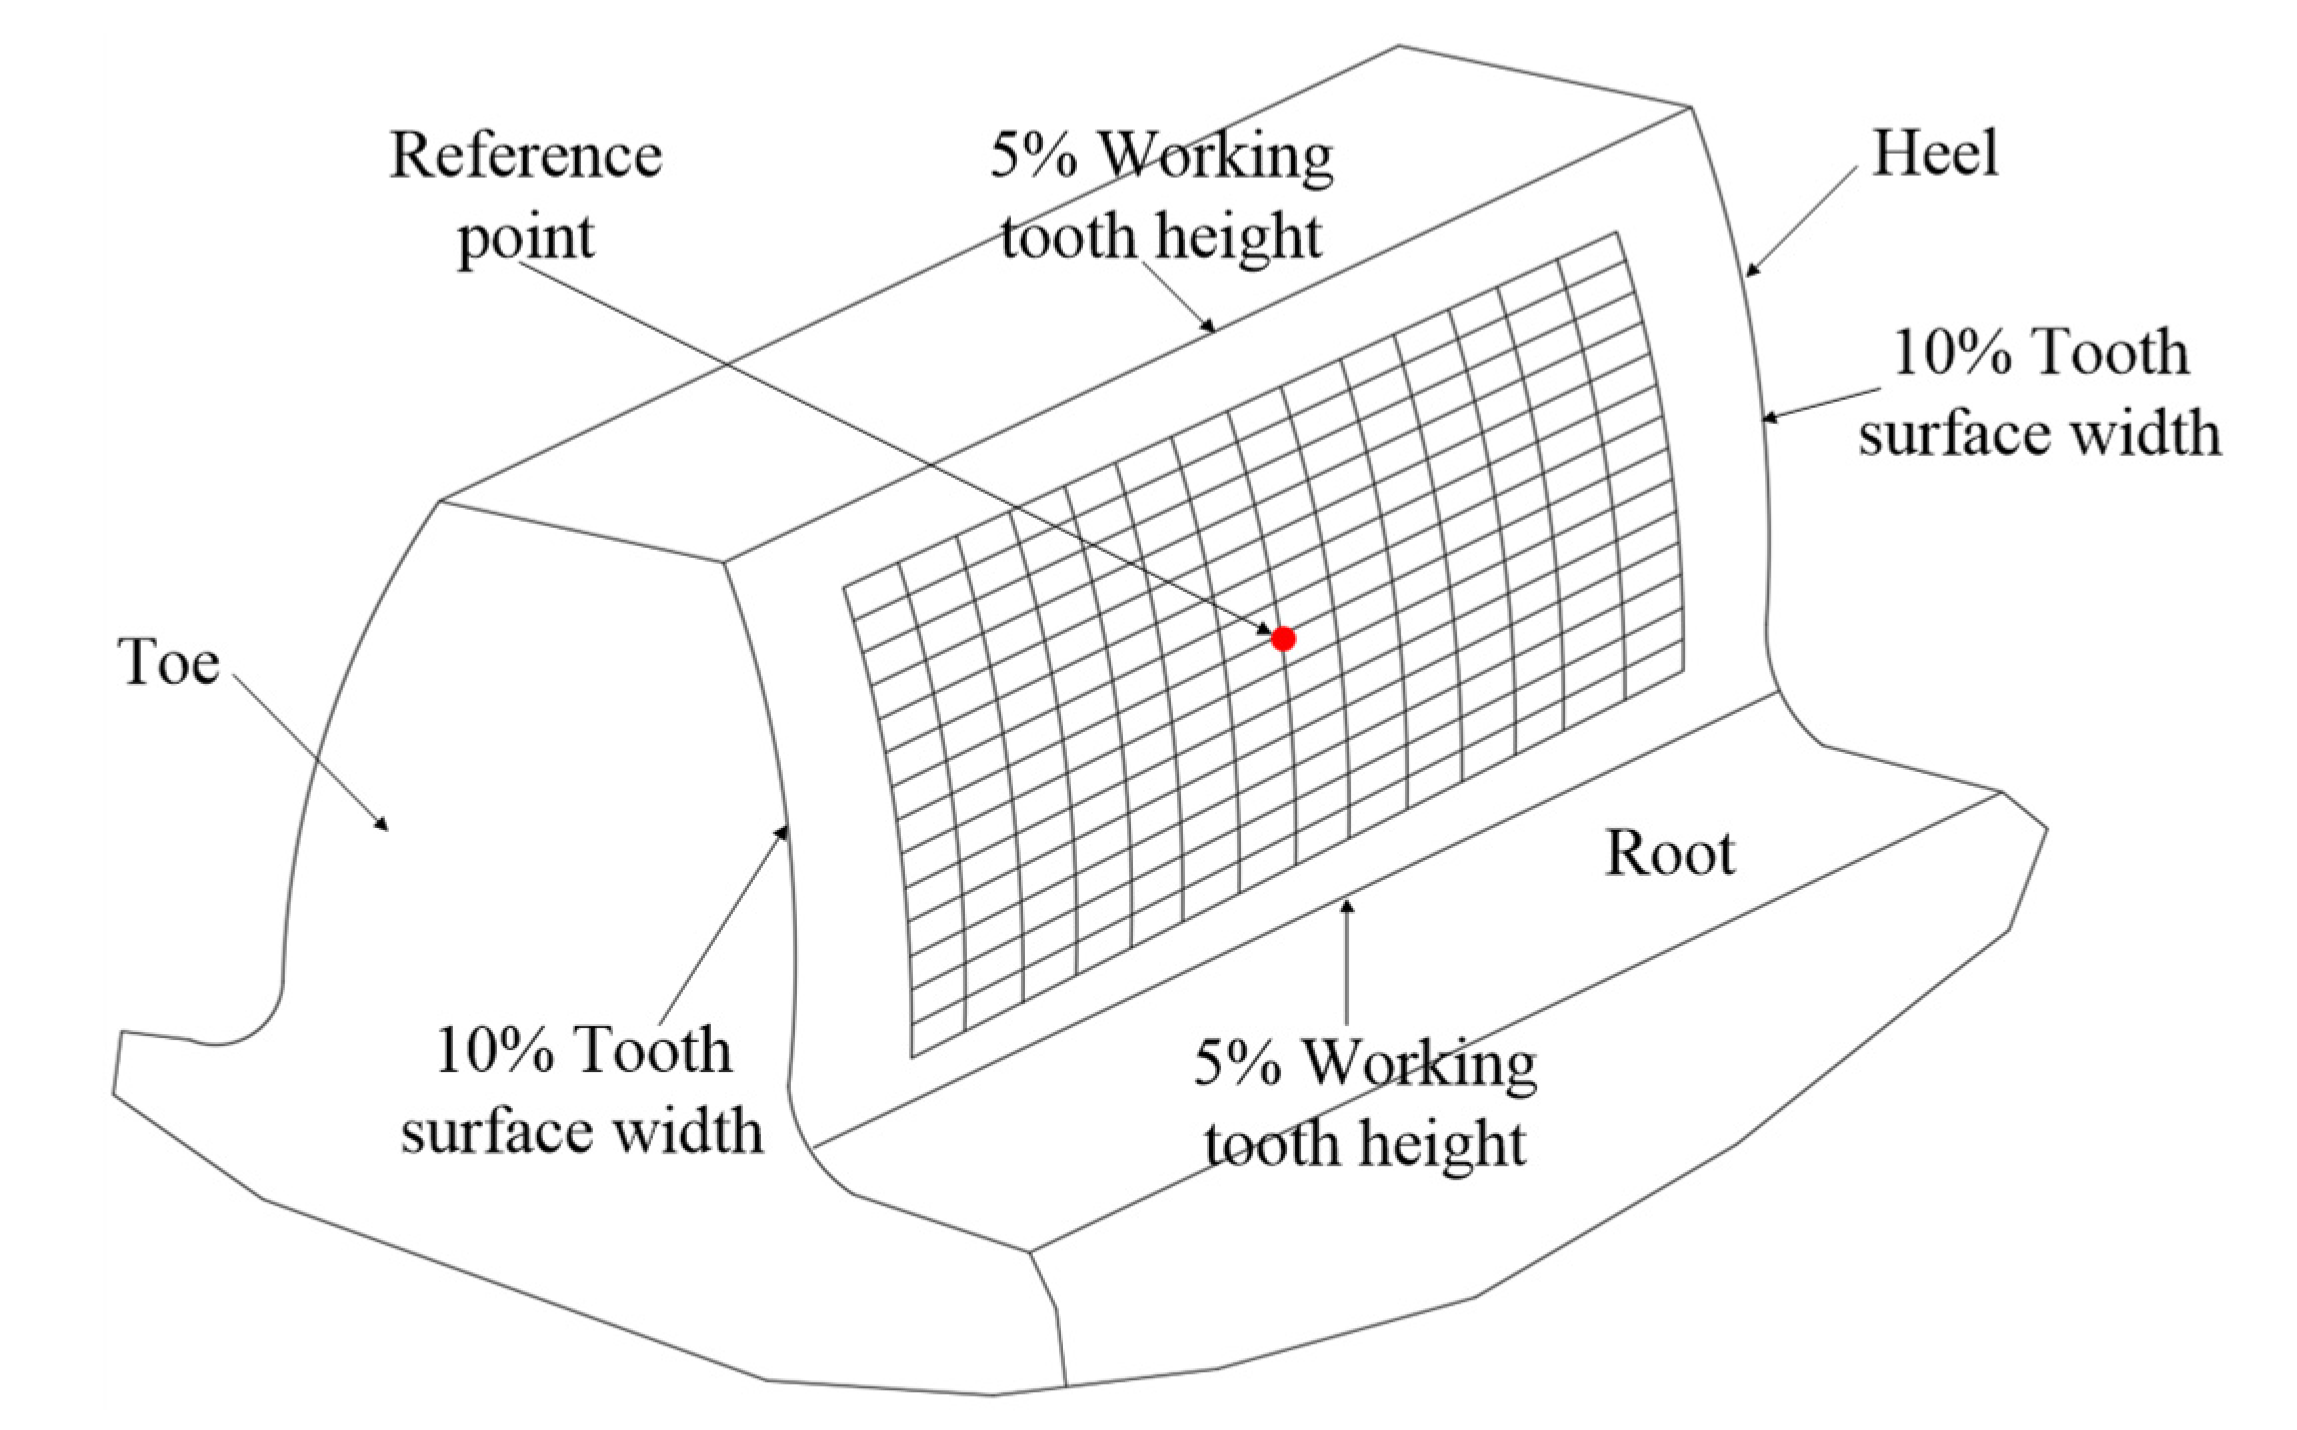
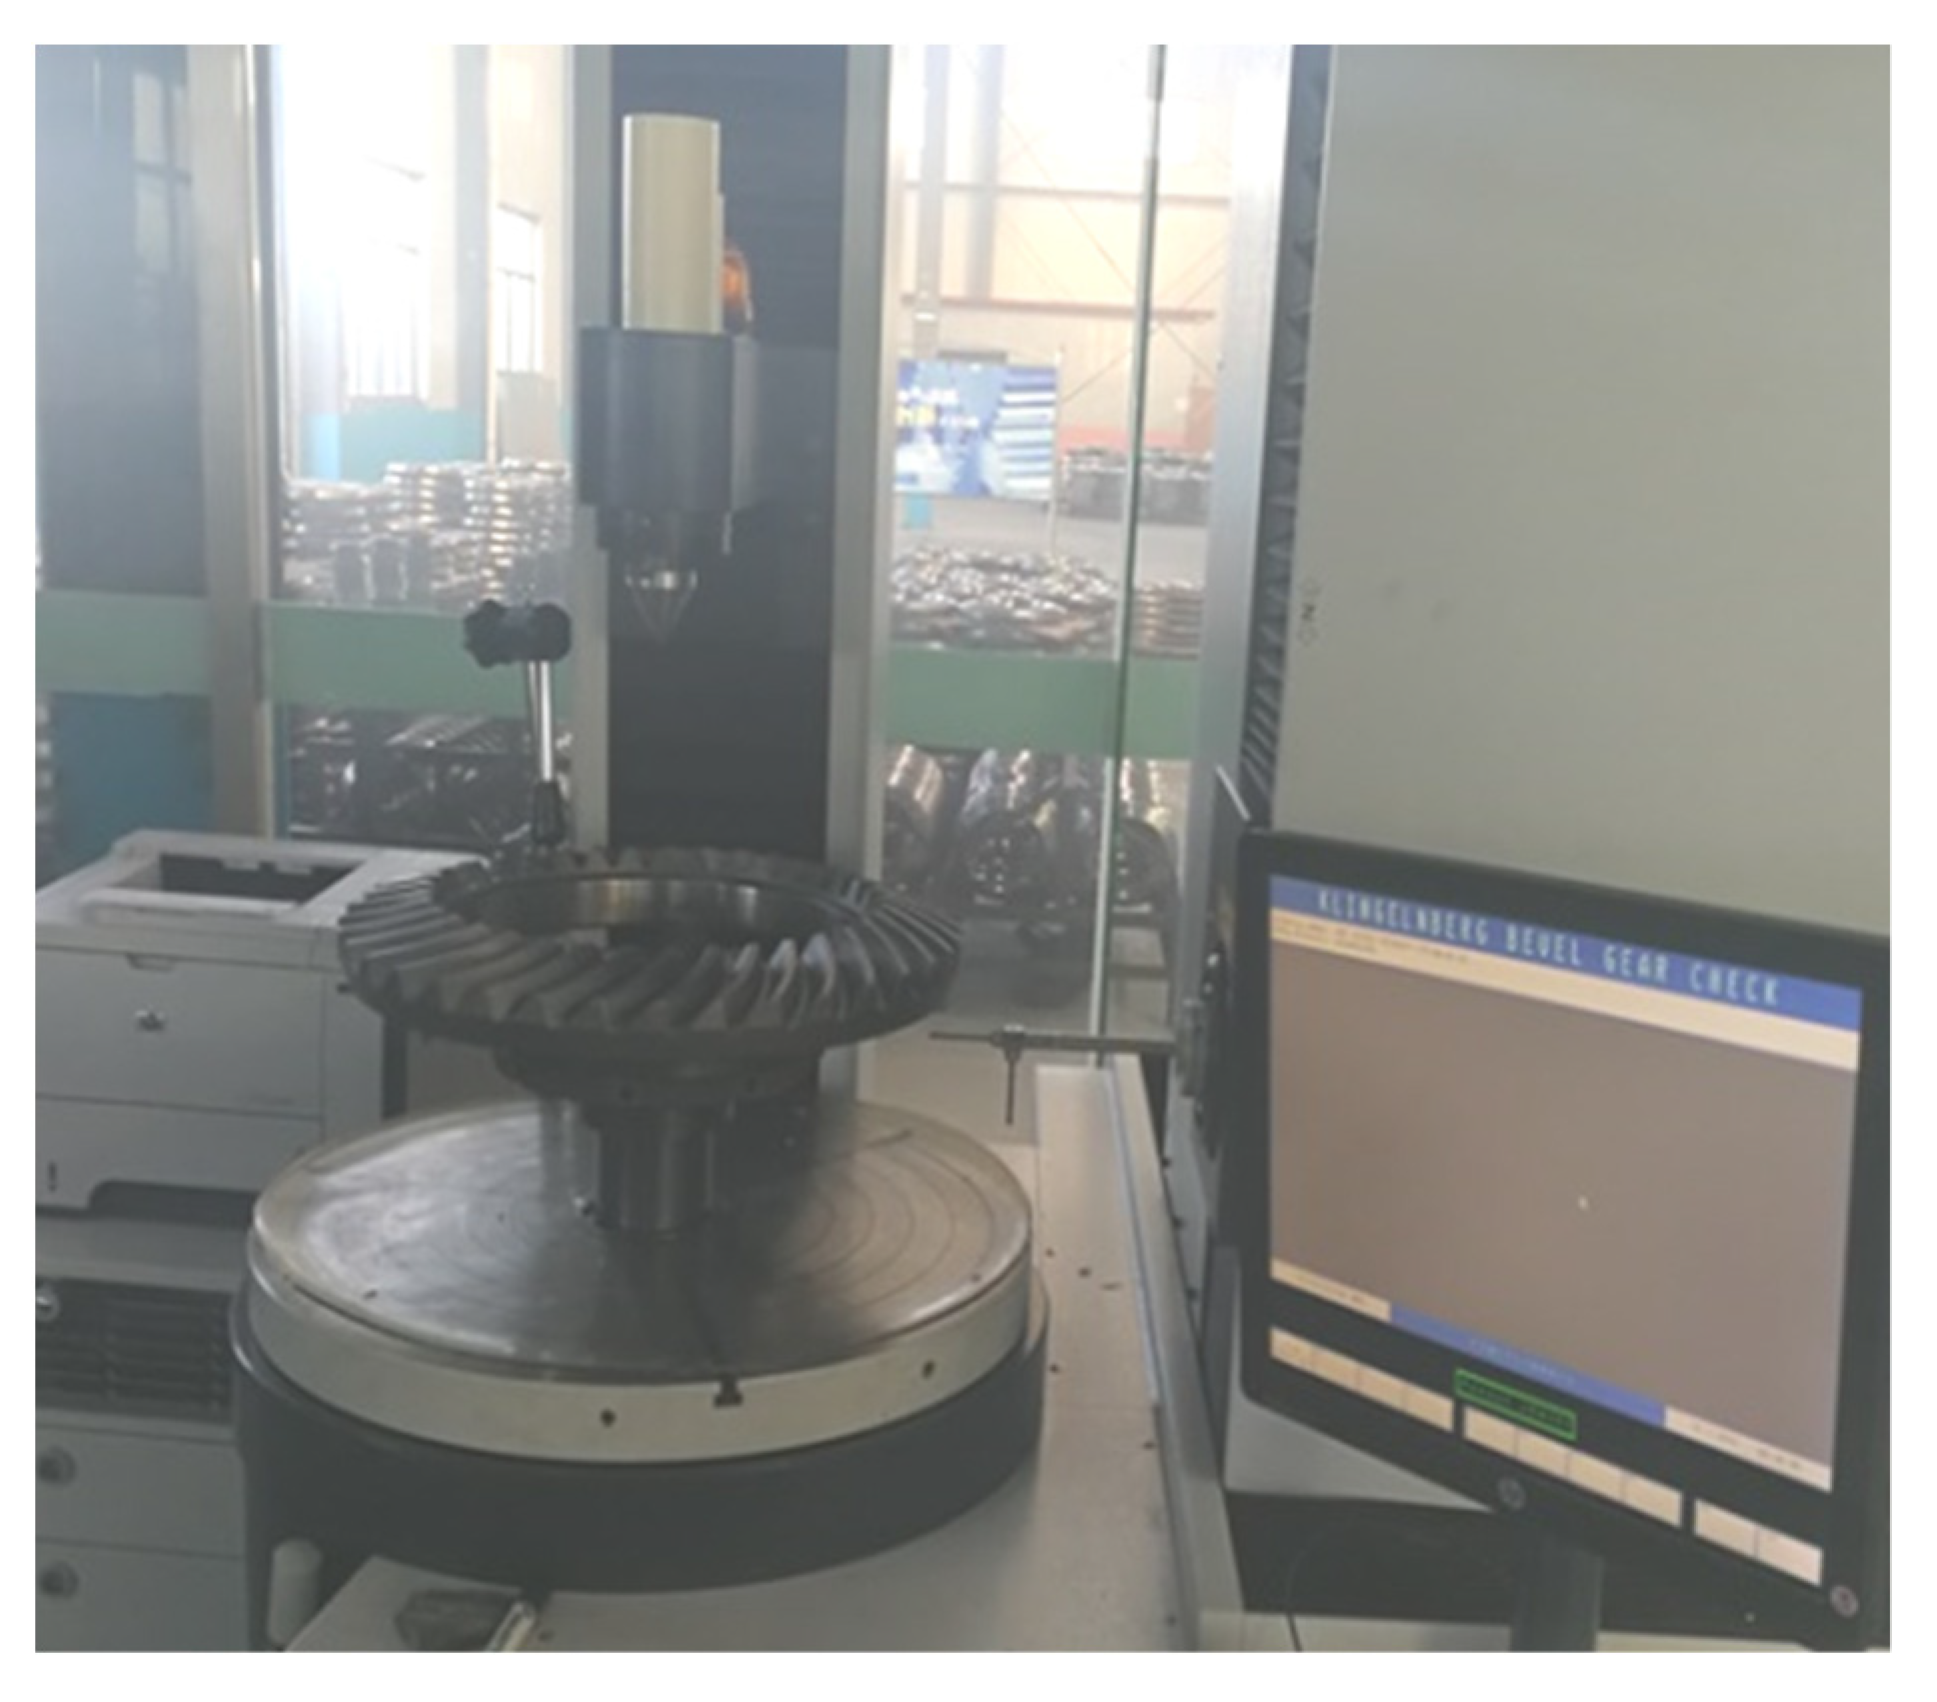
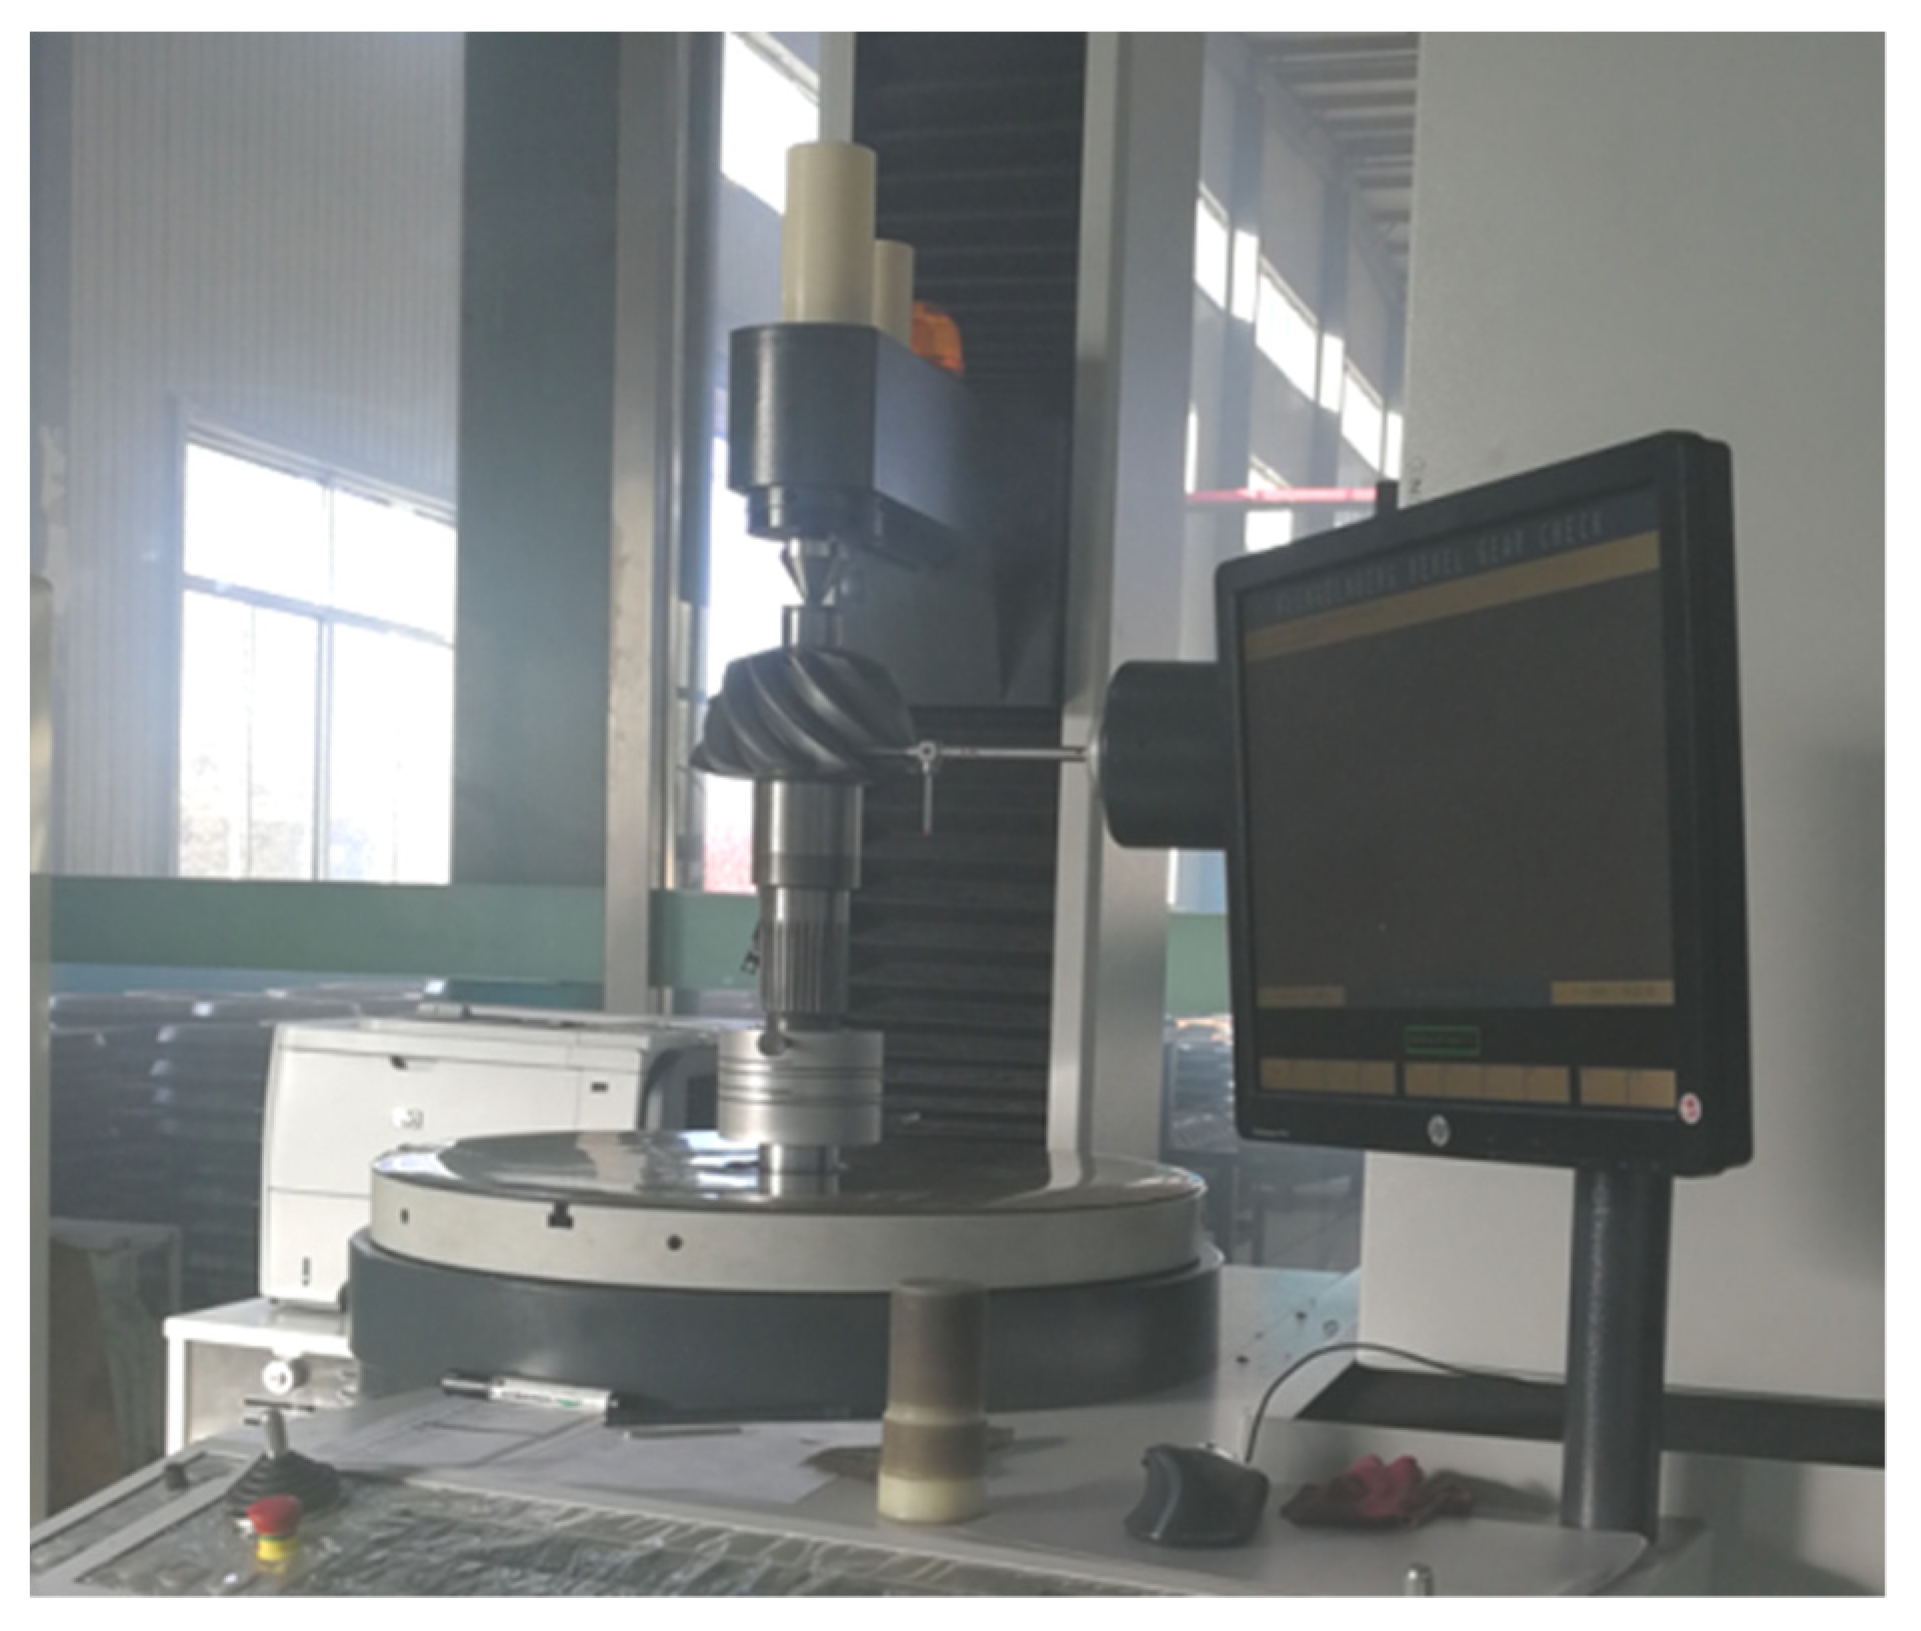
For the same batch of hypoid gears with the same gear material, numerical control gear milling method, and heat treatment specifications, in order to determine the statistics laws of whole batch tooth surface errors after heat treatment, it is necessary to accurately measure the tooth surface errors. It should be noted that the tooth surface error measurement of hypoid gears is based on a set of strictly defined grid points on the tooth surface. For this reason, the dot-matrix measurement method is selected in this paper. For the same batch of hypoid gears after heat treatment, the 30 pairs of gears and pinions are randomly selected. Then, the Klingelnberg P65 gear measuring center is employed, the measurement grid of that is planned by
, and the gears and pinions tooth surface errors are measured on that, respectively. The measurement grid planning of the gear measuring center is shown in
Figure 3, and the tooth surface errors measuring of gear and pinion after heat treatment are shown in
Figure 4 and
Figure 5, respectively.
Take the selected 20 test tooth surfaces as the research object, the tooth surface errors (in mm) of the corresponding measurement sequence points in gear concave surfaces and pinion convex surfaces are shown in
Table 3 and
Table 4, respectively.
5.2. Bootstrap Statistics of the Tooth Surface Errors Data
According to the values of N and B selected in
Section 3 (i.e.,
= 10, and
= 2000), the tooth surface errors bootstrap sampling results of tooth surface measurement sequence points are obtained by using the bootstrap statistics model. Take the first bootstrap sampling as an example, the first bootstrap sampling data (in mm) of all measurement sequence points in gear concave surfaces and pinion convex surfaces are shown
Table 5 and
Table 6, respectively.
Combining with the mean value and variance calculation methods of the bootstrap sample in
Section 3, for different measurement sequence points, the mean value and variance of the bootstrap samples are obtained according to their original sample, and the mean value and variance confidence intervals of the bootstrap sample with the confidence level of 0.05 is calculated. Take the first measurement sequence points in gear concave surfaces and pinion convex surfaces as an example, their bootstrap sample mean value and variance confidence intervals are, respectively, shown in
Table 7 and
Table 8, and their bootstrap sample mean value and variance histograms are shown in
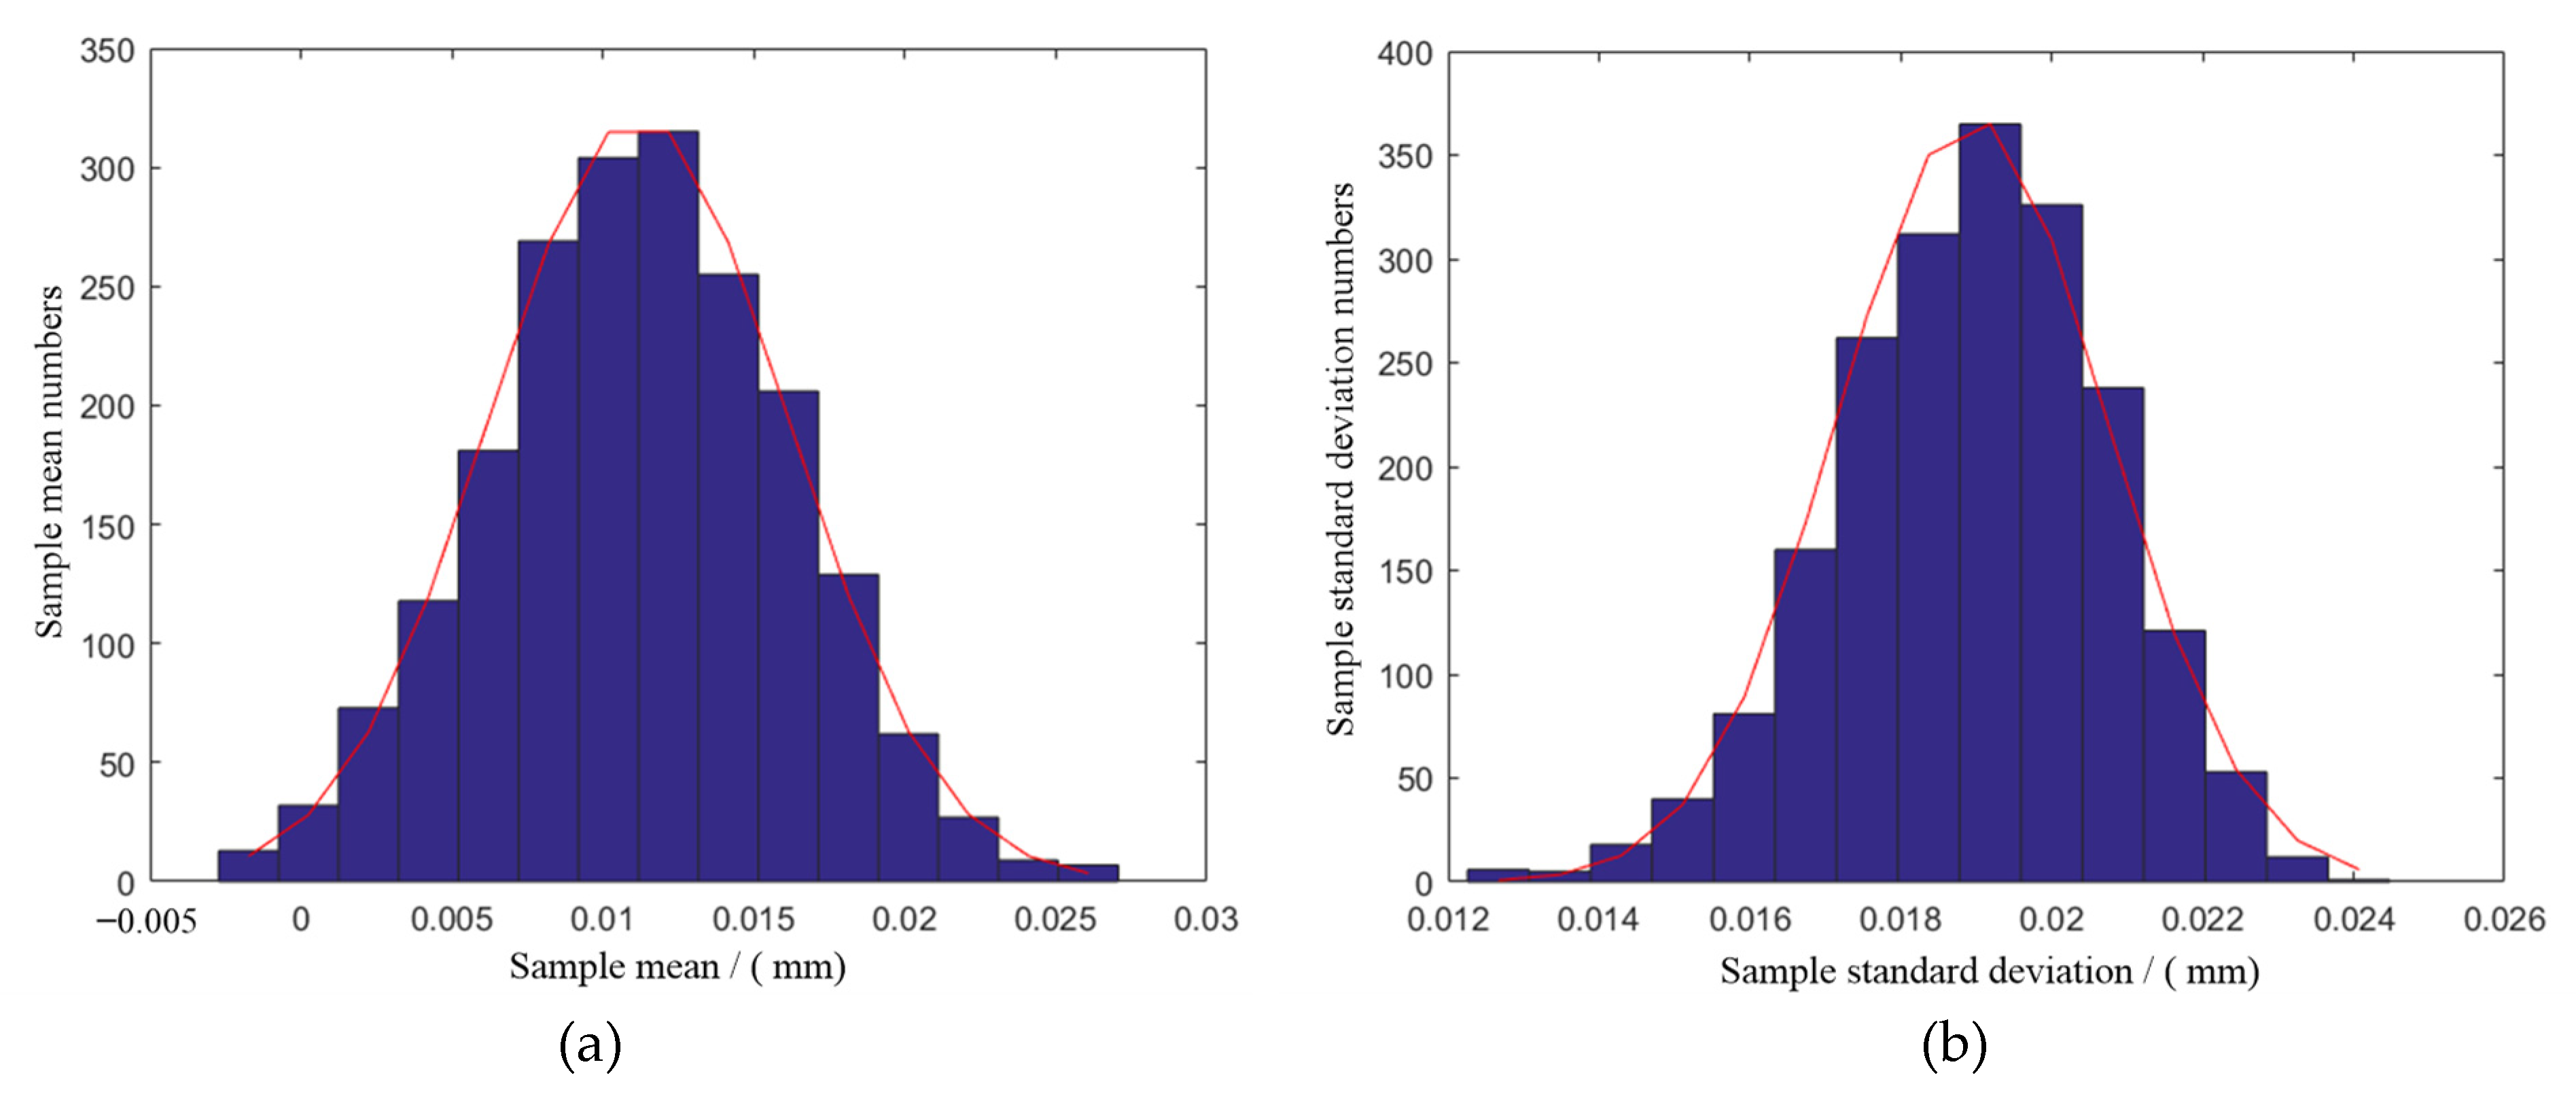
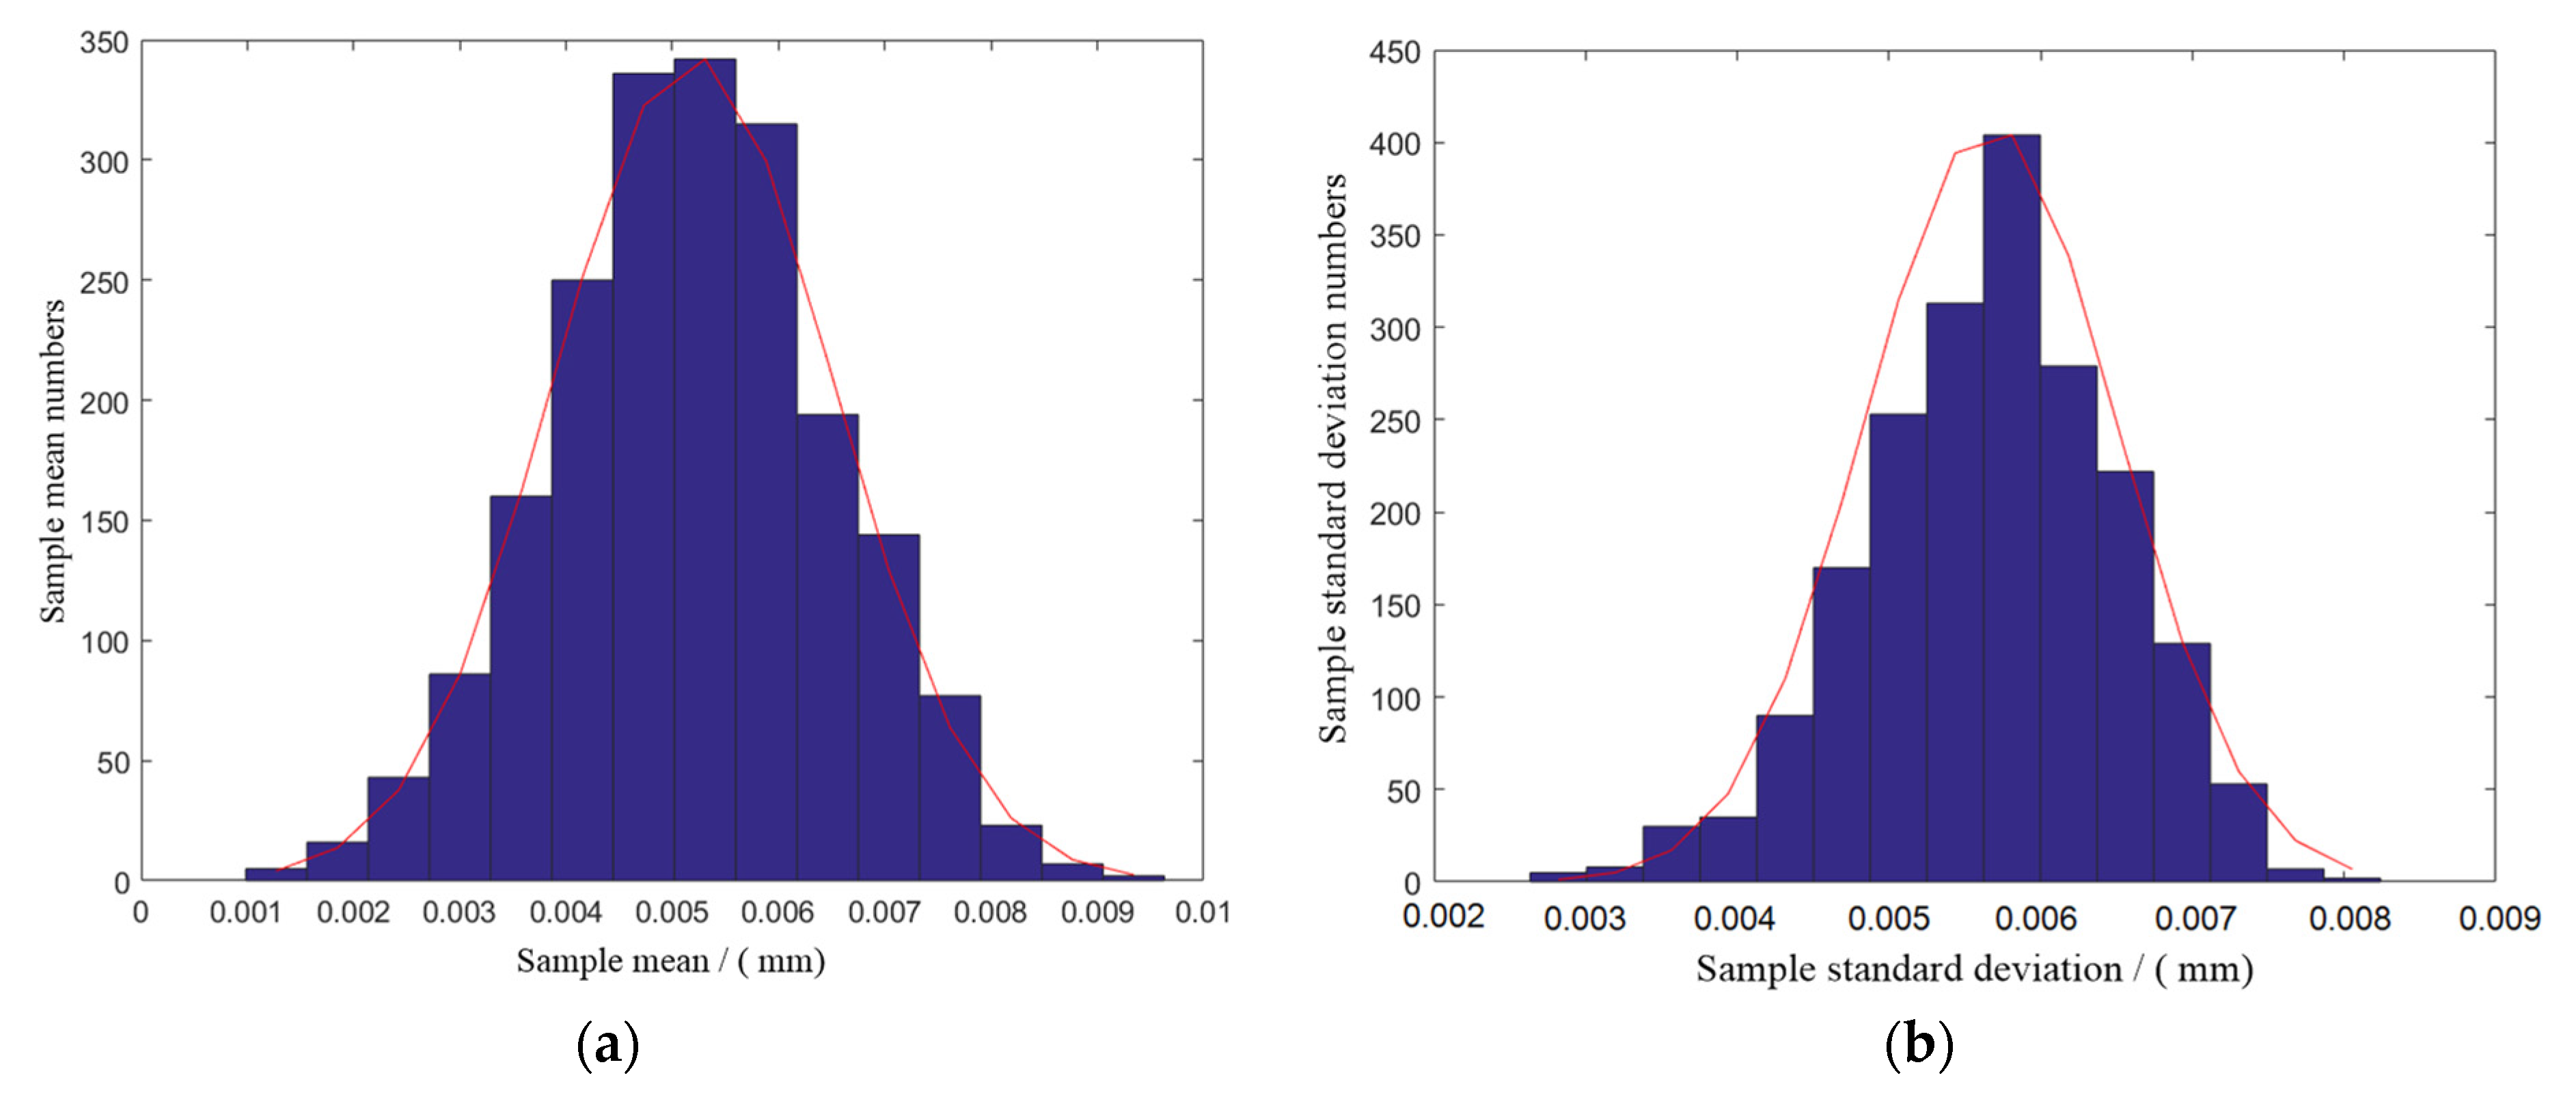
Figure 6 and
Figure 7, respectively.
In
Figure 6a and
Figure 7a, the abscissas are the group median value of bootstrap samples grouped at small to large intervals, and the ordinate is the number of data ordinate whose sample mean falls within the corresponding grouping interval. The area of each small rectangle in the histogram approximately reflects the frequency of the bootstrap sample means falling within the corresponding grouping interval. No matter the bootstrap sample mean value histograms in the gear concave surfaces or the pinion convex surfaces, there are few sample mean value data close to the two extremes; instead, most sample mean value data are near the middle. The entire sample mean value shows a distribution trend of large in the middle and small at both ends, which further demonstrates the necessity of setting confidence intervals to ensure that sample mean value data appears within a reasonable range as much as possible. Similarly, in
Figure 6b and
Figure 7b, the overall trends of the bootstrap sample variance histograms in the gear concave surfaces or the pinion convex surfaces are the same as the corresponding change trends of the bootstrap sample mean value histograms shown in
Figure 6a and
Figure 7a.
Furthermore, according to the red mean and variance curves in
Figure 6 and
Figure 7, it can be seen that the mean and variance of the bootstrap sample are all subject to the approximate normal distribution. The probabilistic characteristic values of the bootstrap samples clearly reflect the change trends of the whole tooth surface measurement sequence point samples under no prior conditions. It can effectively inherit the basic statistical characteristics of the original sample data. Therefore, the estimated true value of the bootstrap sample eigenvalues can be completely represented by the mean value. Based on this analysis, through the bootstrap statistics model, the bootstrap sample mean values of all measurement sequence points in gear concave surfaces and pinion convex surfaces are calculated, which is shown in
Table 9.
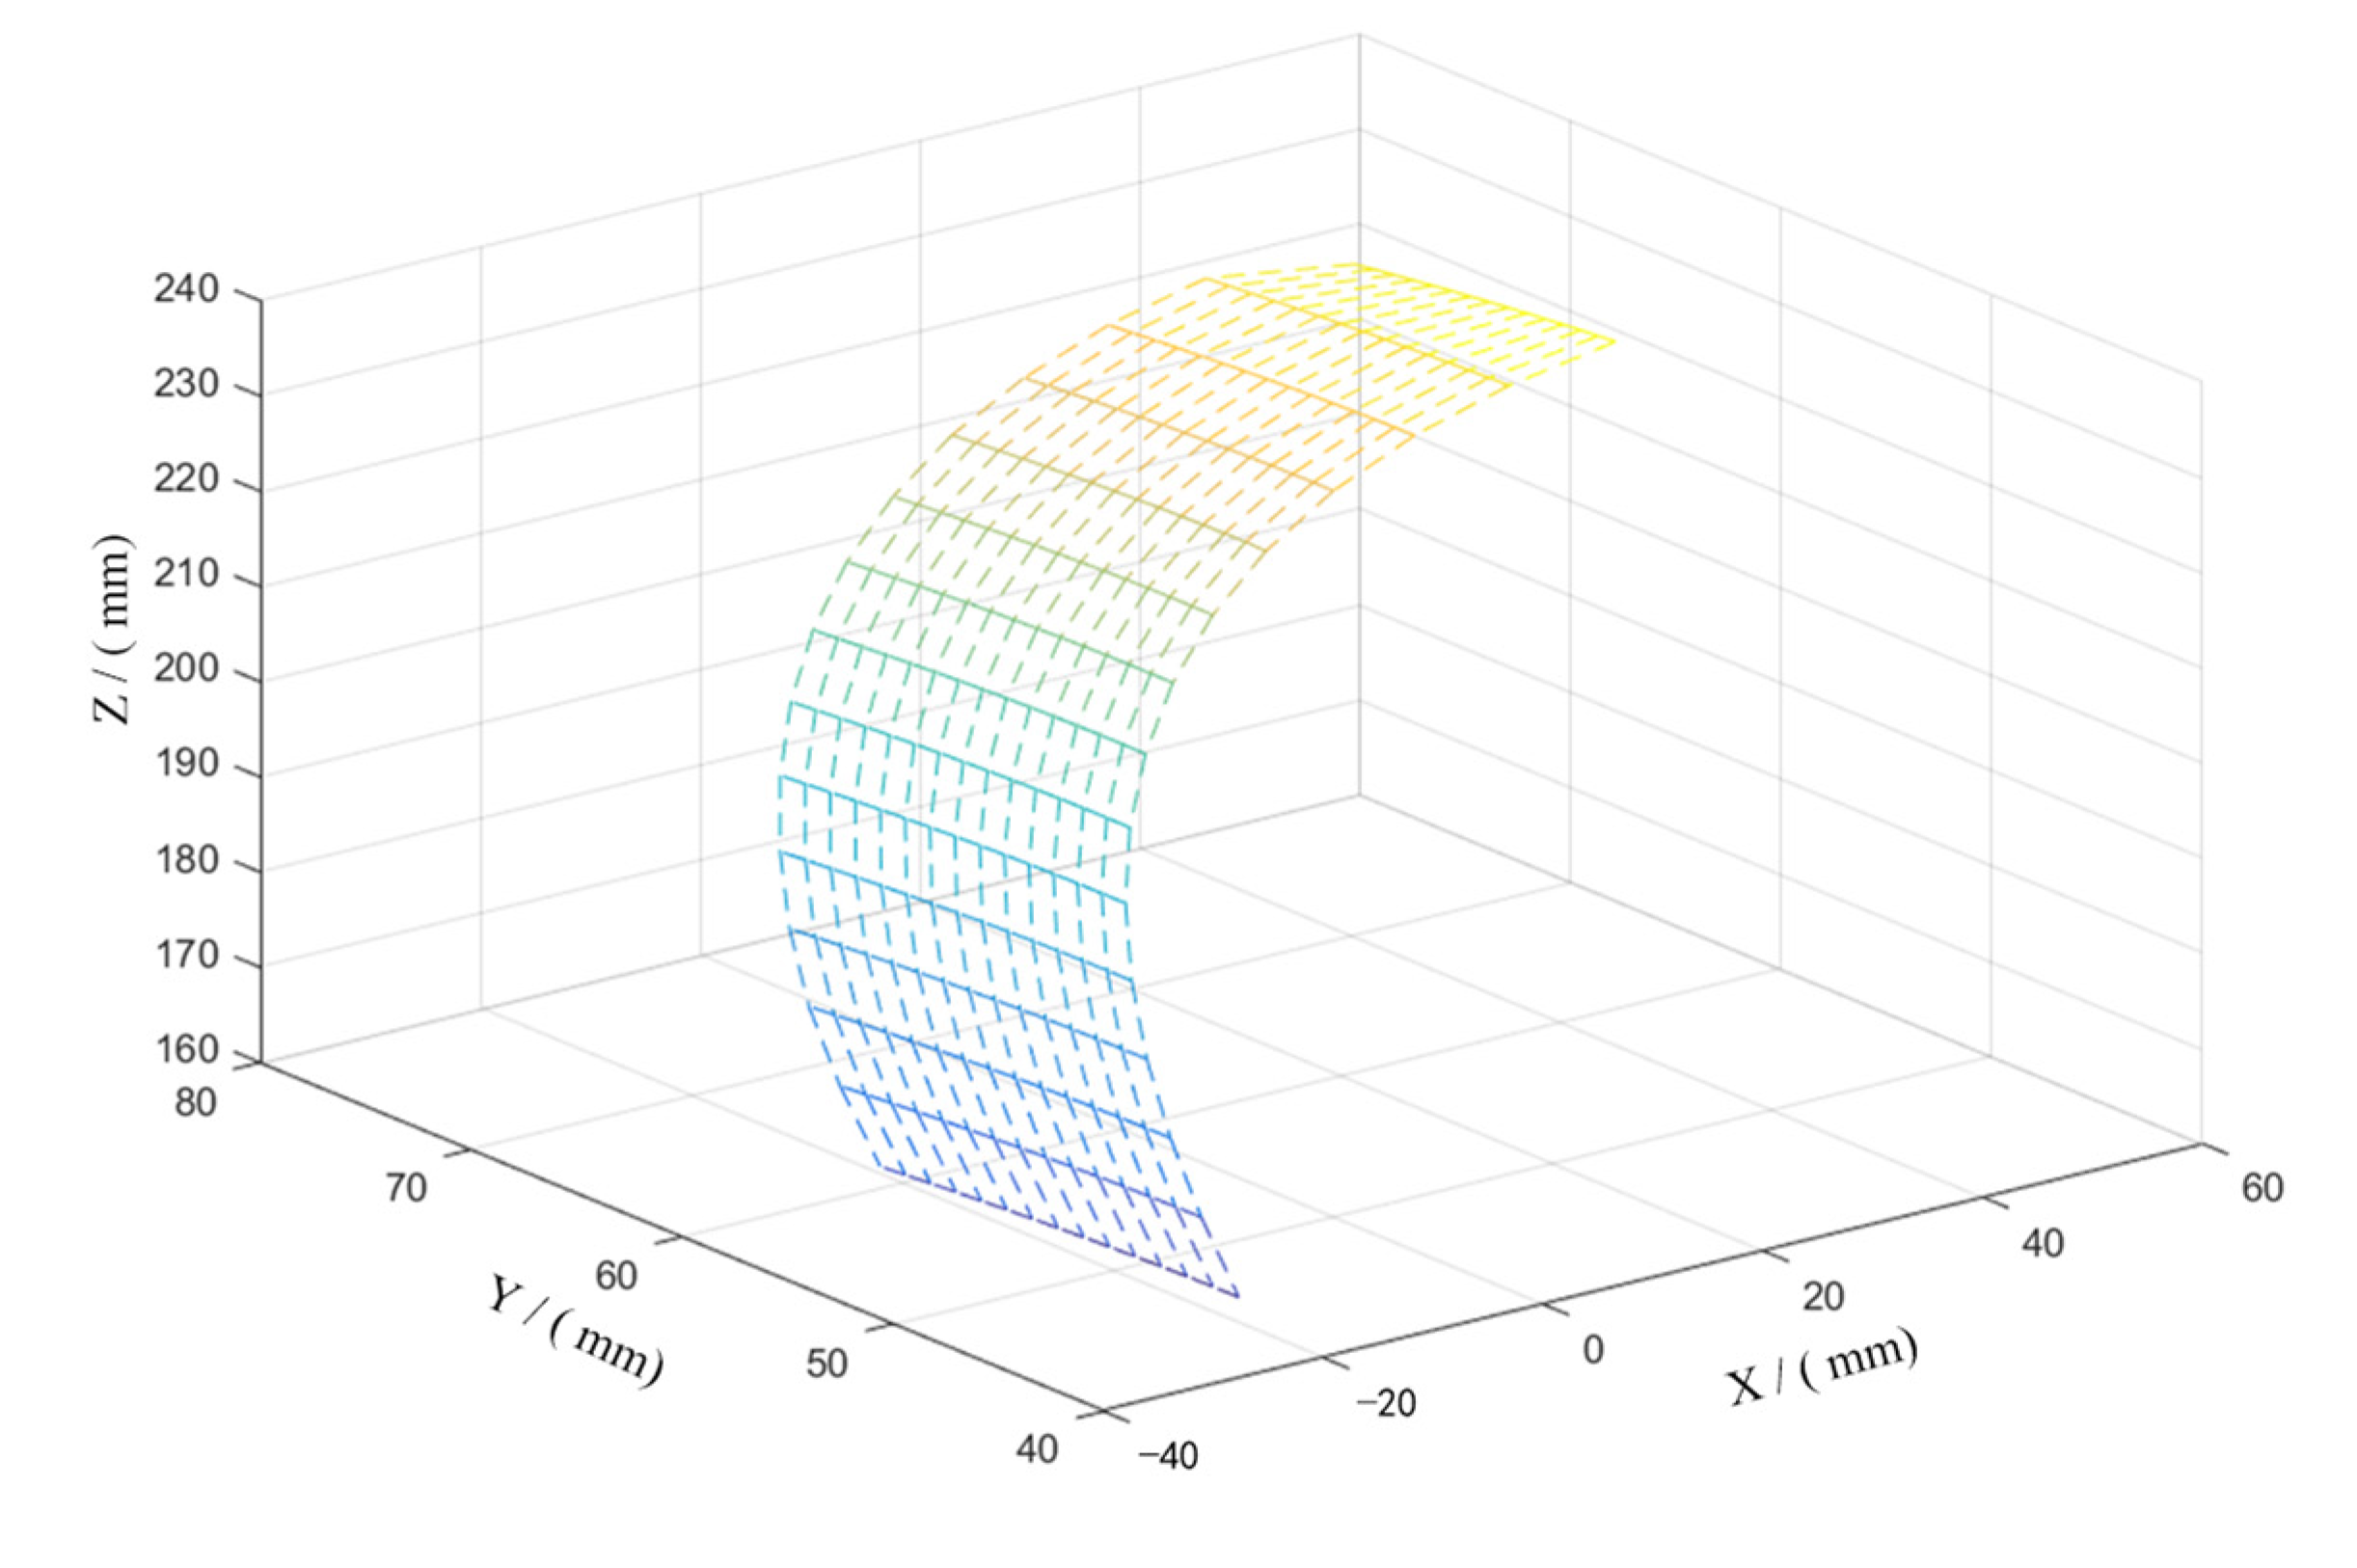
5.3. Analysis of the Bootstrap Statistics Results
According to
Table 3 and
Table 4, the original sample mean value of each tooth surface measurement sequence point in the gear concave surface and the pinion convex surface are calculated. On this basis, combined with
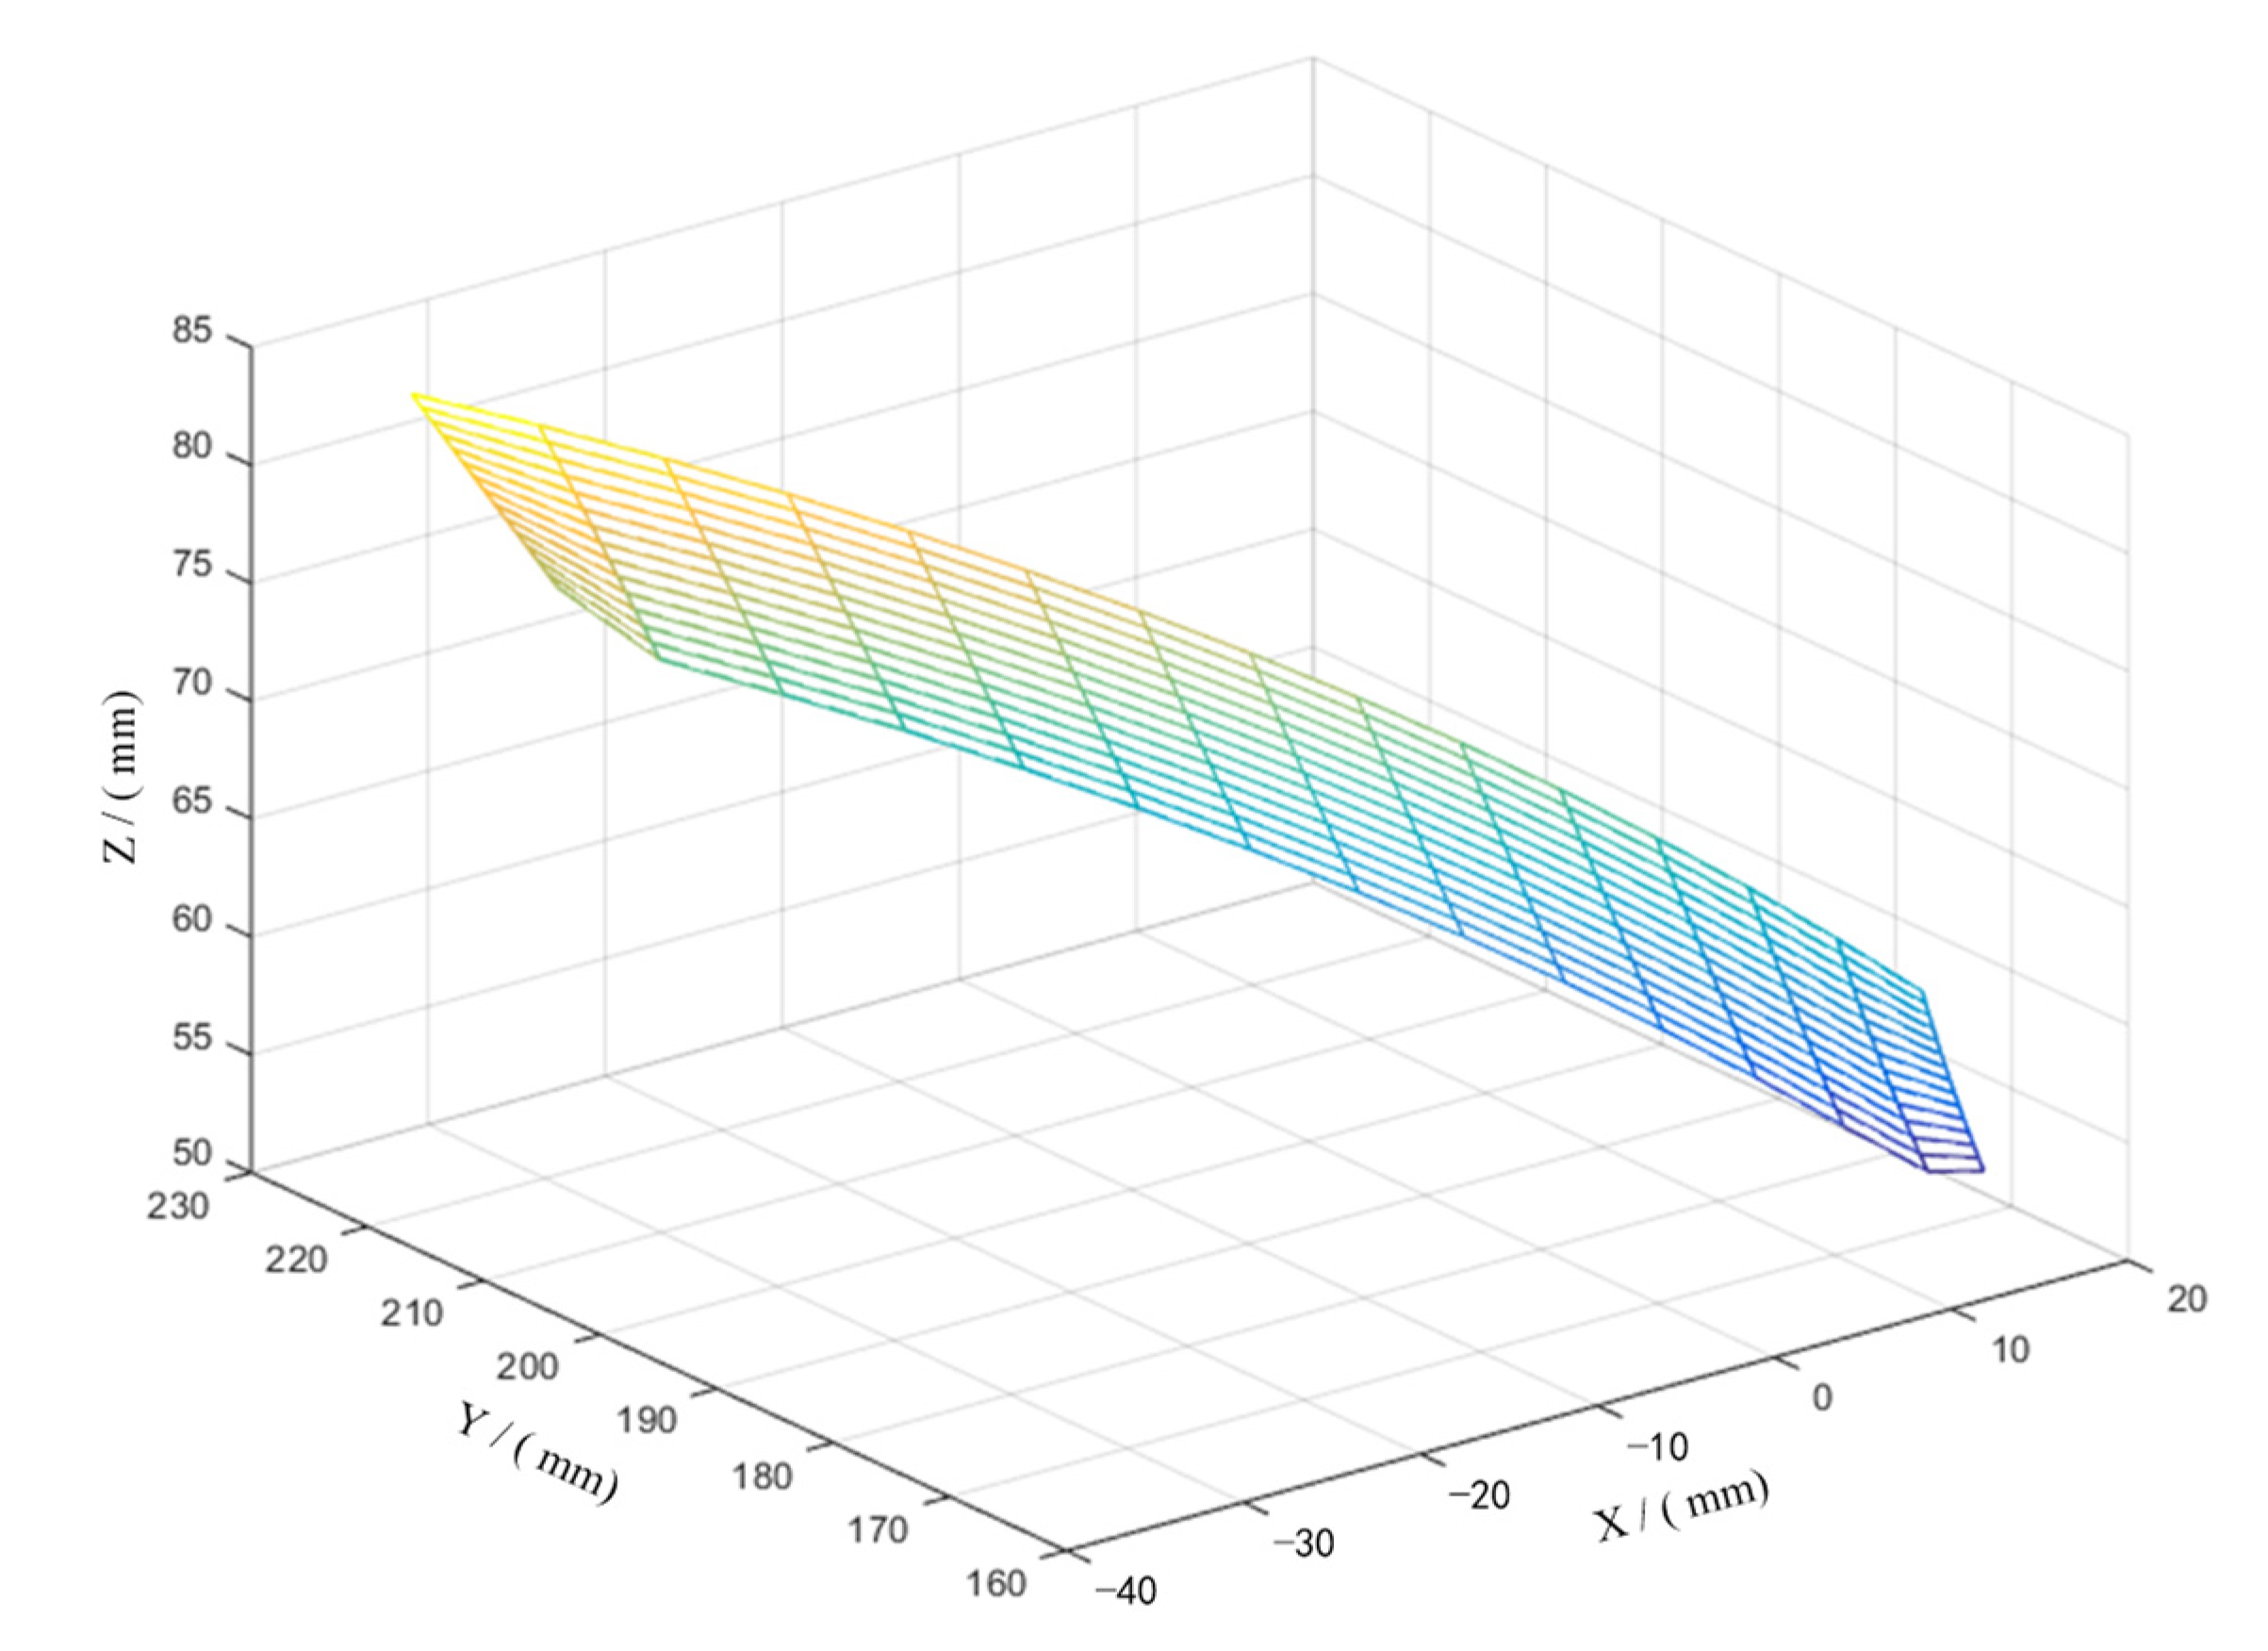
Table 9, the mean value difference surface fitting of the tooth surface errors in both the original sample and the bootstrap sample is completed by using the cubic NURBS surface fitting method in
Section 4. The gear concave surfaces and pinion convex surfaces after the NURBS surface fit are shown in
Figure 8 and
Figure 9, respectively.
From
Figure 8 and
Figure 9, it is can be seen that the spatial position relationship between the actual mean value difference surface and the bootstrap mean value difference surface is almost coincident, whether the gear concave surface or the pinion convex surface. The spacing of any measurement sequence point on the tooth surfaces is very small, which almost is close to 0. Meanwhile, after the NURBS surface fitting of the actual mean value difference surface and the bootstrap mean value difference surface, the square sums of the actual tooth surface errors and the bootstrap tooth surface errors in the gear concave surfaces are 0.5877 mm
2 and 0.5852 mm
2, respectively, and the relative error of the tooth surface errors is only 0.42%. Correspondingly, the sum of squares of the actual tooth surface errors and the bootstrap tooth surface errors in the pinion convex tooth surfaces are 1.0383 mm
2 and 1.0760 mm
2, respectively, and the relative error of tooth surface errors is also only 0.45%, which both fully meets the actual calculation requirements. Meanwhile, it can be concluded that the bootstrap statistics method can accurately reflect the change laws of the tooth surface errors, which also verifies the effectiveness of the proposed bootstrap-based statistics scheme in predicting the change laws of the tooth surface errors after heat treatment.
6. Discussion
In this paper, the bootstrap statistics methodology is applied to the field of tooth surface quality evaluation of the hypoid gears after heat treatment, to make up for the shortage that the traditional statistics methods are difficult to estimate and evaluate the change trends and laws of the hypoid gear tooth surfaces after heat treatment. For the same batch of hypoid gears with the same gear material, numerical control gear milling method, and heat treatment specification, through constructing the bootstrap-based statistics scheme of tooth surface errors after heat treatment, the change laws statistics and effective evaluation of the tooth surface errors for the whole batch hypoid gears after heat treatment is achieved, which lays a foundation for the further research on the pre-control correction of the hypoid gear machining parameters, improving the stability and qualification rate of the batch hypoid gear surface accuracy, and ensuring the efficient and stable production of the hypoid gears.
In this paper, the bootstrap-based statistics scheme of tooth surface errors after heat treatment only involves the same gear material. In the actual promotion and application of this proposed scheme, it is necessary to carry out more bootstrap statistics application experiments and data verification of the hypoid gear tooth surface errors with the different kinds of gear materials. Only by establishing a complete bootstrap statistics database for the hypoid gear tooth surface errors with the different kinds of gear materials, can the bootstrap method be more effectively used to calculate the tooth surface errors of hypoid gears after heat treatment. By this means, the mass production demands of the hypoid gears with different materials in the automobiles and other equipment manufacturing industries can be met, as well as that of high efficiency, high accuracy, and low costs.
In addition, as we all know, as the and change, the relative errors of bootstrap sampling also change. In particular, with the increase in the , the bootstrap sampling error becomes smaller and smaller. However, the excessive sample size will increase the workload of tooth surface measuring, which results in a waste of manpower, material resources, financial resources, and time, as well as losing the small sample statistics advantages of the bootstrap. Conversely, if the sample size is too small, the bootstrap sample will lack a sufficient representation of the original sample, which makes it difficult to ensure the accuracy and reliability of the bootstrap statistical results.
Next, researchers will continue to promote the implementation and application of this bootstrap-based statistics scheme of tooth surface errors after heat treatment. On the one hand, the researchers will verify the practicability of the bootstrap statistics method with as many kinds of tooth surface error batch statistics as possible, so as to enhance the persuasiveness of the theory. On the other hand, on the basis of ensuring the accuracy and reliability of the estimation, by changing the N and B as much as possible, and analyzing the corresponding batch statistics results of tooth surface errors, the bootstrap sample size will be further optimized to improve the statistics efficiency of the batch tooth surface errors and reduce the production costs of hypoid gears. Furthermore, efforts are also being made to study the pre-control correction technologies of the tooth surface errors of the hypoid gears after heat treatment to solve their tooth surface deformation problems.
7. Conclusions
In this paper, the same batch of hypoid gears with the same gear material, numerical control gear milling method, and heat treatment specification is taken as the research object, the bootstrap-based statistics scheme of tooth surface errors after heat treatment is proposed, and the bootstrap statistics model of tooth surface errors of batch hypoid gears is established. By analyzing the bootstrap statistics results, the feasibility and correctness of the proposed bootstrap-based statistics scheme of tooth surface errors after heat treatment is verified. In this paper, the main conclusions are as follows:
In this paper, the bootstrap statistics methodology is first applied to statistics of the tooth surface errors change laws for the same batch hypoid gears with the same gear material, numerical control gear milling method, and heat treatment specifications, and the machining quality evaluation of the whole batch tooth surfaces after heat treatment is realized, which verifies the effectiveness of the proposed bootstrap-based statistics scheme in predicting the tooth surface errors change laws after heat treatment.
With the help of the bootstrap statistics method proposed in this paper, it is not necessary to accurately measure the tooth surface errors of the whole batch of hypoid gears one by one to master the distribution characteristics and laws of the whole original sample. Only by randomly selecting 10 tooth surface samples and repeatedly sampling 2000 times, the original sample probabilistic characteristic values (e.g., sample mean value, and sample variance) of the whole batch tooth surface errors can be accurately estimated, and the heat treatment deformation statistics laws of the tooth surfaces can be also counted.
After the NURBS surface fitting, in whether the gear concave surface or the pinion convex surface, the spatial position relationship between the actual mean value difference surface and the bootstrap mean value difference surface is almost coincident, and the spacing of any measurement sequence point on the tooth surfaces is very small, which almost is close to 0. In the gear concave surfaces, the relative error of the tooth surface errors between the actual and bootstrap is only 0.42%. Correspondingly, in the pinion convex tooth surfaces, the relative error of the tooth surface errors of that is also only 0.45%.
Compared to the traditional statistics method which relies on the large sample data to statistics the deformation laws of tooth surface errors, the bootstrap statistics method proposed in this paper can effectively reduce the measurement numbers and costs of the whole batch hypoid gear tooth surfaces, as well as improve the statistics efficiency of tooth surface errors and the production efficiency of the whole batch hypoid gears. The research results of this paper provide the theoretical basis and helpful reference for further guiding the tooth surface quality control of the same batch hypoid gears after heat treatment (e.g., pre-control and correction of machining parameters, improvement of tooth surface accuracy, and assurance of gear products qualification rate).
Author Contributions
Conceptualization, J.L.; investigation, methodology, W.S. and J.L.; software, W.S. and Y.Z.; validation, H.Z. (Hengbo Zhao), H.Z. (Huijie Zhang), T.L. and W.S.; writing—original draft preparation, W.S.; writing—review and editing, J.S. and J.L. All authors have read and agreed to the published version of the manuscript.
Funding
This research was funded by the National Key R&D Program of China, grant number 2020YFB2006800; and the National Natural Science Foundation of China, grant numbers 51405135, 51775171, and 52005157.
Data Availability Statement
Not applicable.
Acknowledgments
The authors would like to thank all the authors of the references that gave us inspiration and help. The authors are grateful to the editors and anonymous reviewers for their valuable comments that improved the quality of this paper.
Conflicts of Interest
The authors declare no conflict of interest.
References
- Wasif, M.; Chen, Z.C.; Hasan, S.M. Determination of cutter-head geometry for the face-milling of hypoid gears. Int. J. Adv. Manuf. Technol. 2016, 86, 3081–3090. [Google Scholar] [CrossRef]
- Liang, C.C.; Song, C.S.; Zhu, C.C.; Liu, S.Y.; Cadini, F.; Bonaiti, L.; Gorla, C. Effects of machine-tool parameters on geometry and contact pattern for face hobbed hypoid gears. Meccanica 2022, 57, 1429–1442. [Google Scholar] [CrossRef]
- Jiang, C.; Deng, J.; Deng, X.Z. Optimal calculation and experimental study on cutting force of hypoid gear processed by generating method. Int. J. Adv. Manuf. Technol. 2021, 113, 1615–1635. [Google Scholar] [CrossRef]
- Wang, J.; Wang, X.C.; Jiang, H.; Feng, W.J. Measurement and Compensation of Deviations of Real Tooth Surface of Spiral Bevel Gear. Chin. J. Aeronaut. 2003, 16, 182–186. [Google Scholar] [CrossRef] [Green Version]
- Wang, X.C.; Wang, J.; Jiang, H. Tooth Surface Measurement and Machine-Settings Correction of Spiral Bevel Gear. Chin. J. Mech. Eng. 2003, 39, 125–128. [Google Scholar] [CrossRef]
- Takeda, R.; Fang, S.P.; Liu, Y.S.; Komori, M. Precision compensation method for tooth flank measurement error of hypoid gear. Measurement 2016, 89, 305–311. [Google Scholar] [CrossRef]
- Shao, W.; Ding, H.; Tang, J.Y. Data-driven operation and compensation approaches to tooth flank form error measurement for spiral bevel and hypoid gears. Measurement 2018, 122, 347–357. [Google Scholar] [CrossRef]
- Fan, Q. Tooth Surface Error Correction for Face-Hobbed Hypoid Gears. J. Mech. Design. 2010, 132, 011004. [Google Scholar] [CrossRef]
- Li, T.X.; Deng, X.Z.; Wei, B.Y. Tooth surface deviation measurement of hypoid gears based on one-dimensional probe. China Mech. Eng. 2007, 18, 958–962. [Google Scholar]
- Li, T.X.; Li, J.B.; Deng, X.Z.; Yang, J.J.; Li, G.G.; Ma, W.S. A new digitized reverse correction method for hypoid gears based on a one-dimensional probe. Meas. Sci. Technol. 2017, 28, 125004. [Google Scholar] [CrossRef]
- Shih, Y.P.; Sun, Z.H.; Lai, K. A flank correction face-milling method for bevel gears using a five-axis CNC machine. Int. J. Adv. Manuf. Technol. 2017, 91, 3635–3652. [Google Scholar] [CrossRef]
- Du, J.F.; Fang, Z.D. An active tooth surface design methodology for face-hobbed hypoid gears based on measuring coordinates. Mech. Mach. Theory 2016, 99, 140–154. [Google Scholar] [CrossRef] [Green Version]
- Nie, S.W.; Deng, J.; Deng, X.Z.; Yang, J.J.; Li, J.B. Tooth Surface Error Equivalent Correction Method of Spiral Bevel Gears Based on Ease off Topology. China Mech. Eng. 2017, 28, 2434–2440. [Google Scholar] [CrossRef]
- Nie, S.W.; Jiang, C.; Deng, X.Z.; Su, J.X.; Yang, J.J.; Wang, J.H. Flank Modification Method of Hypoid Gears with Ease-off Topology Correction. China Mech. Eng. 2019, 30, 2709–2715. [Google Scholar] [CrossRef]
- Yang, Y.; Mao, S.M.; Zhao, P.J.; Guo, W.C. Correction of Tooth Surface Deviations for Aero Spiral Bevel and Hypoid Gears. In Proceedings of the 2014 IEEE/ASME International Conference on Advanced Intelligent Mechatronics (AIM), Besacon, France, 8–11 July 2014; pp. 830–834. [Google Scholar]
- Wu, S.X.; Yan, H.Z.; Wang, Z.Y.; Bi, R.G.; Chen, Z.; Zhu, P.F. Tooth surface error correction of hypoid gears machined by duplex helical method. J. Cent. South Univ. 2021, 28, 1402–1411. [Google Scholar] [CrossRef]
- Ding, H.; Li, H.P.; Huang, R.; Tang, J.Y. Adaptive data-driven prediction and optimization of tooth flank heat treatment deformation for aerospace spiral bevel gears by considering carburizing-meshing coupling effect. Int. J. Heat Mass Tran. 2021, 174, 121301. [Google Scholar] [CrossRef]
- Zhang, Y.T.; Wang, G.; Shi, W.K.; Yang, L.; Li, Z.C. Optimization of Process Parameters for the Axial Distortion and Distortion Range During Die Quenching of a Spiral Bevel Gear. J. Mater. Eng. Perform. 2018, 27, 3803–3811. [Google Scholar] [CrossRef]
- Efron, B. Bootstrap methods: Another look at the jackknife. Ann. Statist. 1979, 7, 1–26. [Google Scholar] [CrossRef]
- Hasni, M.; Aguir, M.S.; Babai, M.Z.; Jemai, Z. Spare parts demand forecasting: A review on bootstrapping methods. Int. J. Prod. Res. 2019, 57, 4791–4804. [Google Scholar] [CrossRef] [Green Version]
- Celano, G. A bootstrap method for the measurement error estimation in Gauge R&R Studies. Qual. Reliab. Eng. Int. 2022, 38, 3404–3421. [Google Scholar] [CrossRef]
- Wang, H.L.; Deng, X.Z.; Li, J.B.; Yang, J.J. Dynamic Assessment of Vibration of Tooth Modification Gearbox Using Grey Bootstrap Method. Shock Vib. 2015, 2015, 204609. [Google Scholar] [CrossRef] [Green Version]
- Li, J.; Peng, J.; Chen, G.; Xiong, O.; Luo, J.; Du, X. A Generative Model Based on Bootstrapping and Artificial Neural Nets for Transmission Gears Safety. In Proceedings of the 2018 IEEE 17th International Conference on Cognitive Informatics and Cognitive Computing (ICCI*CC 2018), Berkeley, CA, USA, 16–18 July 2018; pp. 454–459. [Google Scholar]
- Chen, M.X.; Pang, X.Y.; Lu, K.B. Fault Diagnosis of Planetary Gearbox Based on Random Forest and Singular Value Difference Spectrum. Smart. Innov. Syst. Technol. 2020, 166, 1529–1540. [Google Scholar] [CrossRef]
- Efron, B.; Tibshirani, R.J. An Introduction to the Bootstrap; Chapman and Hall: New York, NY, USA, 1993. [Google Scholar]
- Sheng, Z.; Xie, S.Q.; Pan, C.Y. Probability Theory and Mathematical Statistics, 5th ed.; Higher Education Press: Beijing, China, 2020. [Google Scholar]
- Ning, X.L.; Wu, Y.X.; Zhao, X.; Zhao, J.M.; Zhang, K.; Hao, T.F.; Lyu, M.B.; Hu, Y.F.; Chen, Y. Research on small sample probability relational degree model. J. Northwestern Polytech. Univ. 2022, 40, 1164–1171. [Google Scholar] [CrossRef]
- Baek, D.K.; Yang, S.H.; Ko, T.J. Precision NURBS interpolator based on recursive characteristics of NURBS. Int. J. Adv. Manuf. 2013, 65, 403–410. [Google Scholar] [CrossRef]
- Pal, P. A reconstruction method using geometric subdivision and NURBS interpolation. Int. J. Adv. Manuf. 2008, 38, 296–308. [Google Scholar] [CrossRef]
- Ding, H.; Tang, J.Y.; Zhong, J.; Wan, G.X.; Zhou, Z.Y. Simulation and optimization of computer numerical control-milling model for machining a spiral bevel gear with new tooth flank. Proc. Inst. Mech. Eng. Part B J. Eng. 2016, 230, 1897–1909. [Google Scholar] [CrossRef]
Figure 1.
Bootstrap-based statistics scheme of tooth surface errors after heat treatment.
Figure 1.
Bootstrap-based statistics scheme of tooth surface errors after heat treatment.
Figure 2.
Relative errors of variance between the bootstrap sample and the original sample.
Figure 2.
Relative errors of variance between the bootstrap sample and the original sample.
Figure 3.
Measurement grid planning of gear measuring center.
Figure 3.
Measurement grid planning of gear measuring center.
Figure 4.
Tooth surface errors measuring of gear after heat treatment.
Figure 4.
Tooth surface errors measuring of gear after heat treatment.
Figure 5.
Tooth surface errors measuring of pinion after heat treatment.
Figure 5.
Tooth surface errors measuring of pinion after heat treatment.
Figure 6.
Bootstrap sample mean value and variance histograms of the first measurement sequence points in gear concave surfaces. (a) Mean value histogram; (b) variance histogram.
Figure 6.
Bootstrap sample mean value and variance histograms of the first measurement sequence points in gear concave surfaces. (a) Mean value histogram; (b) variance histogram.
Figure 7.
Bootstrap sample mean value and variance histograms of the first measurement sequence points in pinion convex surfaces. (a) Mean value histogram; (b) variance histogram.
Figure 7.
Bootstrap sample mean value and variance histograms of the first measurement sequence points in pinion convex surfaces. (a) Mean value histogram; (b) variance histogram.
Figure 8.
Gear concave surface after NURBS surface fitted.
Figure 8.
Gear concave surface after NURBS surface fitted.
Figure 9.
Pinion convex surface after NURBS surface fitted.
Figure 9.
Pinion convex surface after NURBS surface fitted.
Table 1.
Pinion tooth surface errors original samples of the same measurement sequence points.
Table 1.
Pinion tooth surface errors original samples of the same measurement sequence points.
| Measurement Sequence Points | Number of Pinion Tooth Surfaces Selected and Measured | Unit |
|---|
| 1 | 2 | 3 | | 18 | 19 | 20 |
|---|
| 1 | 0.0057 | 0.0130 | 0.0023 | … | 0.0035 | 0.0205 | 0.0105 | mm |
| 2 | 0.0067 | 0.0136 | 0.0044 | … | 0.0048 | 0.0193 | 0.0111 | mm |
| 3 | 0.0058 | 0.0146 | 0.0067 | … | 0.0062 | 0.0174 | 0.0116 | mm |
| 4 | 0.0049 | 0.0159 | 0.0028 | … | 0.0069 | 0.0180 | 0.0118 | mm |
| … | … | … | … | … | … | … | … | … |
| 223 | 0.0211 | 0.0159 | 0.0236 | … | 0.0085 | 0.0117 | 0.0328 | mm |
| 224 | 0.0192 | 0.0141 | 0.0218 | … | 0.0066 | 0.0097 | 0.0316 | mm |
| 225 | 0.0161 | 0.0104 | 0.0190 | … | 0.0020 | 0.0059 | 0.0281 | mm |
Table 2.
Probability eigenvalues of the first measurement sequence point on the pinion concave surface with different .
Table 2.
Probability eigenvalues of the first measurement sequence point on the pinion concave surface with different .
| N | Original Sample Mean (mm) | Bootstrap Sample Mean (mm) | Mean Relative Error | Original Sample Variance (mm2) | Bootstrap Sample Variance (mm2) | Variance Relative Error |
|---|
| 5 | 0.0522 | 0.0521 | 0.23% | 0.0640 | 0.0573 | 10.46% |
| 10 | 0.0381 | 0.0382 | 0.17% | 0.0906 | 0.0860 | 5.11% |
| 15 | 0.0471 | 0.0472 | 0.13% | 0.0926 | 0.0895 | 3.38% |
| 20 | 0.0636 | 0.0635 | 0.02% | 0.0880 | 0.0857 | 2.55% |
Table 3.
Tooth surface errors of the measurement sequence points in gear concave surfaces.
Table 3.
Tooth surface errors of the measurement sequence points in gear concave surfaces.
| Measurement Sequence Points | Serial Number of Tooth Surface Measured | Unit |
|---|
| 1 | 2 | 3 | | 18 | 19 | 20 |
|---|
| 1 | −0.0843 | −0.0361 | −0.0084 | … | −0.0482 | 0.0056 | −0.0522 | mm |
| 2 | −0.0867 | −0.1390 | −0.0108 | … | −0.0527 | 0.0047 | −0.0550 | mm |
| 3 | −0.091 | −0.383 | −0.0115 | … | −0.0549 | 0.0012 | −0.0586 | mm |
| … | … | … | … | … | … | … | … | … |
| 223 | 0.0993 | 0.0373 | 0.0062 | … | 0.0640 | 0.0030 | 0.0482 | mm |
| 224 | 0.0996 | 0.0361 | 0.0055 | … | 0.0636 | 0.0032 | 0.0480 | mm |
| 225 | 0.0968 | 0.0354 | 0.0060 | | 0.0606 | 0.0005 | 0.0451 | mm |
Table 4.
Tooth surface errors of the measurement sequence points in pinion convex surfaces.
Table 4.
Tooth surface errors of the measurement sequence points in pinion convex surfaces.
| Measurement Sequence Points | Serial Number of Tooth Surface Measured | Unit |
|---|
| 1 | 2 | 3 | | 18 | 19 | 20 |
|---|
| 1 | 0.0178 | 0.0309 | 0.0212 | … | 0.0254 | 0.0295 | 0.0192 | mm |
| 2 | 0.0196 | 0.0320 | 0.0215 | … | 0.0265 | 0.0305 | 0.0187 | mm |
| 3 | 0.0181 | 0.0321 | 0.0214 | … | 0.0267 | 0.0307 | 0.0200 | mm |
| … | … | … | … | … | … | … | … | … |
| 223 | −0.0088 | −0.0133 | −0.0119 | … | −0.0036 | −0.0155 | −0.0186 | mm |
| 224 | −0.0089 | −0.0149 | −0.0134 | … | −0.0033 | −0.0171 | −0.0183 | mm |
| 225 | −00115 | −0.0182 | −0.0169 | | −0.0079 | −0.0193 | −0.0205 | mm |
Table 5.
First bootstrap sampling data of all measurement sequence points in gear concave surfaces.
Table 5.
First bootstrap sampling data of all measurement sequence points in gear concave surfaces.
| N | Measurement Sequence Points | Unit |
|---|
| 1 | 2 | 3 | … | 223 | 224 | 225 |
|---|
| 10 | −0.0359 | −0.0795 | −0.0848 | … | 0.0373 | 0.0696 | 0.0060 | mm |
| −0.0623 | −0.0646 | −0.0910 | … | 0.0714 | 0.0361 | 0.0488 | mm |
| −0.0843 | −0.0795 | −0.0664 | … | 0.0970 | 0.0996 | 0.0642 | mm |
| −0.0746 | −0.0867 | −0.0910 | … | 0.0670 | 0.0734 | 0.0721 | mm |
| −0.0422 | −0.0390 | −0.0115 | … | 0.0420 | 0.0662 | 0.0358 | mm |
| −0.0361 | −0.0795 | −0.0409 | … | 0.0996 | 0.0662 | 0.0721 | mm |
| −0.0623 | −0.0644 | −0.0383 | … | 0.0714 | 0.0393 | 0.0642 | mm |
| −0.0843 | −0.0108 | −0.0910 | … | 0.0670 | 0.0662 | 0.0488 | mm |
| −0.0597 | −0.0588 | −0.0685 | … | 0.0670 | 0.0055 | 0.0594 | mm |
| −0.0422 | −0.0409 | −0.0664 | … | 0.0062 | 0.0734 | 0.0712 | mm |
Table 6.
First bootstrap sampling data of all measurement sequence points in pinion convex surfaces.
Table 6.
First bootstrap sampling data of all measurement sequence points in pinion convex surfaces.
| N | Measurement Sequence Points | Unit |
|---|
| 1 | 2 | 3 | … | 223 | 224 | 225 |
|---|
| 10 | 0.0212 | 0.0274 | 0.0209 | … | 0.0064 | 0.0101 | −0.0182 | mm |
| 0.0178 | 0.0185 | 0.0292 | … | −0.0063 | −0.0074 | 0.0013 | mm |
| 0.0346 | 0.0148 | 0.0321 | … | −0.0171 | −0.0067 | −0.0121 | mm |
| 0.0281 | 0.0148 | 0.0214 | … | 0.0143 | −0.0074 | 0.0056 | mm |
| 0.0158 | 0.0274 | 0.0153 | … | 0.0064 | −0.0089 | −0.0216 | mm |
| 0.0135 | 0.0185 | 0.0181 | … | −0.0133 | 0.0101 | −0.0115 | mm |
| 0.0135 | 0.0274 | 0.0185 | … | −0.0063 | 0.0049 | −0.0216 | mm |
| 0.0212 | 0.0148 | 0.0174 | … | 0.0143 | −0.0089 | 0.0005 | mm |
| 0.0203 | 0.0274 | 0.0153 | … | −0.0048 | 0.0101 | −0.0121 | mm |
| 0.0135 | 0.0274 | 0.0181 | … | 0.0143 | −0.0149 | 0.0056 | mm |
Table 7.
Bootstrap sample mean value and variance confidence intervals of the first measurement sequence points in gear concave surfaces.
Table 7.
Bootstrap sample mean value and variance confidence intervals of the first measurement sequence points in gear concave surfaces.
| N | Original Sample Mean (mm) | Original Sample Variance (mm2) | Bootstrap Sample Mean (mm) | Bootstrap Sample Variance (mm2) | Mean Confidence Interval | Variance Confidence Interval |
|---|
| 10 | −0.0161 | 0.0377 | −0.0160 | 0.0358 | (−0.0161,−0.0159) | (0.0357,0.0359) |
Table 8.
Bootstrap sample mean value and variance confidence intervals of the first measurement sequence points in pinion convex surfaces.
Table 8.
Bootstrap sample mean value and variance confidence intervals of the first measurement sequence points in pinion convex surfaces.
| N | Original Sample Mean (mm) | Original Sample Variance (mm2) | Bootstrap Sample Mean (mm) | Bootstrap Sample Variance (mm2) | Mean Confidence Interval | Variance Confidence Interval |
|---|
| 10 | 0.0312 | 0.0116 | 0.0312 | 0.0111 | (0.0311,0.0313) | (0.0110,0.0111) |
Table 9.
Bootstrap sample mean values of all measurement sequence points in gear concave surfaces and pinion convex surfaces.
Table 9.
Bootstrap sample mean values of all measurement sequence points in gear concave surfaces and pinion convex surfaces.
| Bootstrap Sample Mean Values (mm) | N | Measurement Sequence Points |
|---|
| 1 | 2 | 3 | … | 223 | 224 | 225 |
|---|
| Gear concave surface | 10 | −0.0526 | −0.0557 | −0.0583 | … | 0.0619 | 0.0601 | 0.0585 |
| Pinion convex surface | 10 | 0.0214 | 0.0230 | 0.0226 | … | 0.0036 | 0.0035 | 0.0035 |
| Disclaimer/Publisher’s Note: The statements, opinions and data contained in all publications are solely those of the individual author(s) and contributor(s) and not of MDPI and/or the editor(s). MDPI and/or the editor(s) disclaim responsibility for any injury to people or property resulting from any ideas, methods, instructions or products referred to in the content. |
© 2023 by the authors. Licensee MDPI, Basel, Switzerland. This article is an open access article distributed under the terms and conditions of the Creative Commons Attribution (CC BY) license (https://creativecommons.org/licenses/by/4.0/).


 ,
, 


