Article

Analysis of the Influence of Micro-Pore Structure on Oil Occurrence Using Nano-CT Scanning and Nuclear Magnetic Resonance Technology: An Example from Chang 8 Tight Sandstone Reservoir, Jiyuan, Ordos Basin

1
State Key Laboratory of Continental Dynamics, Northwest University, Xi’an 710069, China
2
Department of Geology, Northwest University, Xi’an 710069, China
3
School of Petroleum Engineering, Xi’an Shiyou University, Xi’an 710065, China
4
Engineering Research Center of Development and Management for Low to Ultra-Low Permeability Oil & Gas Reservoirs in West China, Ministry of Education, Xi’an 710065, China
5
Xi’an Key Laboratory of Tight Oil (Shale Oil) Development, Xi’an 710065, China
6
Oil and Gas Technology Institute of Changqing Oilfield Company, PetroChina, Xi’an 710018, China
7
National Engineering Laboratory for Exploration and Development of Low-Permeability Oil & Gas Fields, Xi’an 710018, China
*
Authors to whom correspondence should be addressed.
Processes 2023, 11(4), 1127; https://doi.org/10.3390/pr11041127
Submission received: 15 March 2023 / Revised: 1 April 2023 / Accepted: 4 April 2023 / Published: 6 April 2023

Abstract

:
The micro-pore structure of a tight sandstone reservoir remarkably impacts the occurrence characteristics of the tight oil. The micro-pore structure of the Jiyuan Chang 8 tight sandstone reservoir in the Ordos Basin was examined in this research using a core physical property test, an environmental scanning electron microscope, thin section identification, and high-pressure mercury intrusion. Using nano-CT scanning and nuclear magnetic resonance technologies, representative core samples were chosen for studies evaluating the tight oil occurrence statically and dynamically. The micro-pore structure effect of a tight sandstone reservoir on the occurrence of tight oil was investigated, and the occurrence of tight oil in the reservoir forming process was discussed. It was significant to the study of tight oil in the reservoir forming process in Ordos Basin. Findings indicated that the Chang 8 reservoir in Jiyuan, Ordos Basin has poor physical properties and exhibits a high degree of heterogeneity. In addition, the oil charging simulation experiment (oil charging) can be separated into the following three stages: fast growth, gradual growth, and stability. In the process of crude oil charging, oil always preferentially entered into medium pores and large pores. These pores were the primary areas of tight oil distribution. Furthermore, the occurrence of tight oil was affected by pore type, pore structure parameters, throat parameters, and combination mode of pore and throat. First, substantially large and medium pores lead to effective pore connectivity and generate a considerable amount of tight oil. The occurrence morphology includes oil film, cluster, porous, and isolated. Second, the greater the degree of intergranular pore growth and soluble feldspar pore development, the thicker the throat, the more developed the effective throat, and the greater the quantity of tight oil. Finally, oil saturation was negatively correlated with median pressure and displacement pressure and positively correlated with sorting factors, median radius, maximum pore throat radius, and efficiency of inverted mercury.

1. Introduction

Tight oil and gas reservoirs have gained increasing attention with the advancement of conventional reservoirs. In particular, tight oil has emerged as the principal focus of global unconventional oil and gas exploration and production initiatives [1,2,3,4,5,6,7,8,9,10]. However, tight sand reservoirs differ from conventional reservoirs because of their complex characteristics. The main performance of tight oil is characterized as follows. First, the reservoir had a large accumulation depth, wide distribution, and complex sedimentation. Second, the pore system was mainly micron-nanometer and the throat was small and complex (mainly nanometer scale). Finally, the reservoir exhibited poor porosity and permeability as well as considerable heterogeneity [11,12]. All these characteristics increase the development difficulty and cost of tight sandstone reservoirs. It is not conducive to large-scale exploration and development of unconventional oil and gas reservoirs in China. Thus, research on the influencing factors of microscopic pore structures on the occurrence of tight oil in tight sandstone reservoirs is of major practical importance for the development of tight oil reservoirs [13,14,15,16,17,18,19,20,21]. Scholars have used a variety of research approaches in the past decade, and several studies have been conducted on the occurrence condition of tight oil. Previous studies mainly focused on static and dynamic aspects. On the one hand, casting thin sections, scanning electron microscopy (SEM), CT scanning, and X-ray diffraction were used to describe the static occurrence. For instance, Bai et al. [22] used CT to identify two types of occurrence forms and three types of occurrence spaces of tight oil. Wang et al. [23] classified the microscopic occurrence states of Yan 7 tight oil in the Ordos Basin into six types (emulsion, tufted, throat, granular, thin film, and isolated) based on the static study. Yan et al. [24] determined that the tight oil in Lucaogou Formation, Xinjiang demonstrated two types of occurrence in the reservoir, movable and bound oils, by casting thin sections and SEM. Peng et al. [25] discovered that the movable tight oil in the Funing shale in Northern Jiangsu mainly occurs in fractures using multi-temperature pyrolysis and nuclear magnetic resonance (NMR) techniques. Wen et al. [26] determined that tight oil occurs in pores of more than a few hundred nanometers. Sun et al. [27] indicated that tight oil mainly occurs in pores of less than 200 nm and also exists in micron pores. Li et al. [28] discovered that the free tight oil of a tight sandstone reservoir has a minimum pore radius of 0.1 µm, whereas the pores containing adsorbed tight oil range between 0.02 and 0.3 µm; the former content (50.14%) is larger than the latter (49.86%). Gong et al. [29] used SEM and X-ray energy spectrometry to investigate the microscopic occurrence features of tight oil in the Songliao Basin. He determined that tight oil mainly occurs in intergranular pores, intraocular pores, and microfractures. Two kinds of occurrence states are available: oil film and oil bead. Liu et al. [30] divided the oil film in the pore into fixed and moving oil films. Oil film thickness is negatively associated with temperature and positively correlated with pore size and fluid molar mass. Jia et al. [31] proposed a method to characterize the storage space, occurrence state, and influencing factors of tight oil by SEM and NMR. The findings indicated that the reservoir space of tight reservoirs comprises nanoscale fractures and pores, and microfractures connect the dispersed oil spots and improve the fluidity of crude oil. On the other hand, a series of dynamic laboratory experiments, such as gas–water high-speed centrifugation, low-temperature adsorption, core flooding, and NMR, have been conducted to describe the occurrence space and law of crude oil quantitatively. For example, Li et al. [32] quantitatively analyzed the occurrence space of tight oil in Chang 7 of Ordos Basin using low-temperature adsorption, centrifugation, and NMR experiments. They determined that the oil phases in the studied region predominantly exist in nano-sized pores with a pore radius between 97 and 535 nm. Wang et al. [33] established the microscopic visualization model of sandstone oil displacement. The physical process of oil charging in tight sandstone was simulated and analyzed, and the microscopic dynamic characteristics of oil charging were identified. Li et al. [34] discovered that oil aggregation is controlled by pore structure, permeability, and porosity in the oil-filled physical simulation experiment. Liu et al. [35] established net force during tight oil accumulation and qualitatively defined the link between tight reservoir oil content and net force during oil charging through physical tests and computer simulations. The oil charging time comprised the following three phases: breakthrough, fast, and complete saturation phase. Feng et al. [36] considered the low-velocity non-Darcy flow prevalent in tight sandstone reservoirs. Therefore, the Roc threshold of oil-filled pore throat radius in a tight reservoir was determined by combining various methods, such as high-pressure mercury intrusion, NMR centrifugation, and oil charging simulation tests. Zheng et al. [37] determined threshold and crucial pressure gradients in the charging process of tight reservoir oil. Porosity, permeability, crude oil viscosity, and displacement pressure gradient all had an impact on the oil saturation level.
Overall, the static occurrence characteristics of tight oil have been comprehensively studied, and the occurrence space (micro and nano pores and fractures) and state (emulsion, tuft, throat, granular, thin film, and isolated) of tight oil have been identified. However, the research on dynamic occurrence mainly focused on the change law of tight oil during the charging process. Moreover, the analysis of influencing factors of reservoir pore structure on the occurrence of tight oil from the aspect of micro-pore structure was not comprehensive [38,39,40]. In this study, the current research focused on the Chang 8 tight sandstone reservoir in the Jiyuan section of the Ordos Basin. Representative cores were selected for static and dynamic assessments of tight oil occurrence. The effect of the micro-pore structure of a tight sandstone reservoir on the occurrence of tight oil was comprehensively discussed, and the mechanism of tight oil in the reservoir creation process was identified. This discussion is of theoretical importance for studying the tight oil accumulation process in Ordos Basin.

2. Experimental Section

2.1. Materials

In the investigation, ten tight sandstone core samples were extracted from the Chang 8 reservoir at a depth of 2198.34–2223.32 m in Jiyuan, Ordos Basin. These cores were washed, permeability was measured by gas, and porosity was measured by weighing. Table 1 provides the relevant physical parameters. The experimental samples had varying porosities of 4.8% to 10.2%, with an average of 7.59%. The permeability ranged between 0.03 × 10⁻³ µm2 and 0.52 × 10⁻³ µm2, with a mean value of 0.22 × 10⁻³ µm2. The variation of crude oil in underground reservoir formation was simulated, and the dynamic occurrence features of tight oil throughout the reservoir formation process were investigated.
Crude oil charging was physically tested using simulation stratum water that had a salinity of 25,000 mg/L, and manganese water (Mn2+, 25,000 mg/L) was configured in accordance with the water quality test data. A high concentration of Mn+ eliminates the water signal in the T2 spectrum; therefore, all the measured signals are oil signals. The high viscosity of crude oil makes it unsuitable for the displacement experiment. Thus, the experiment could not be conducted. Therefore, the volume ratio of ground-degassed crude oil to refined kerosene (1:3) was used to prepare the experimental simulation oil. The simulated oil viscosity was 3.5 mPa·s (18.5 MPa, 60 °C).

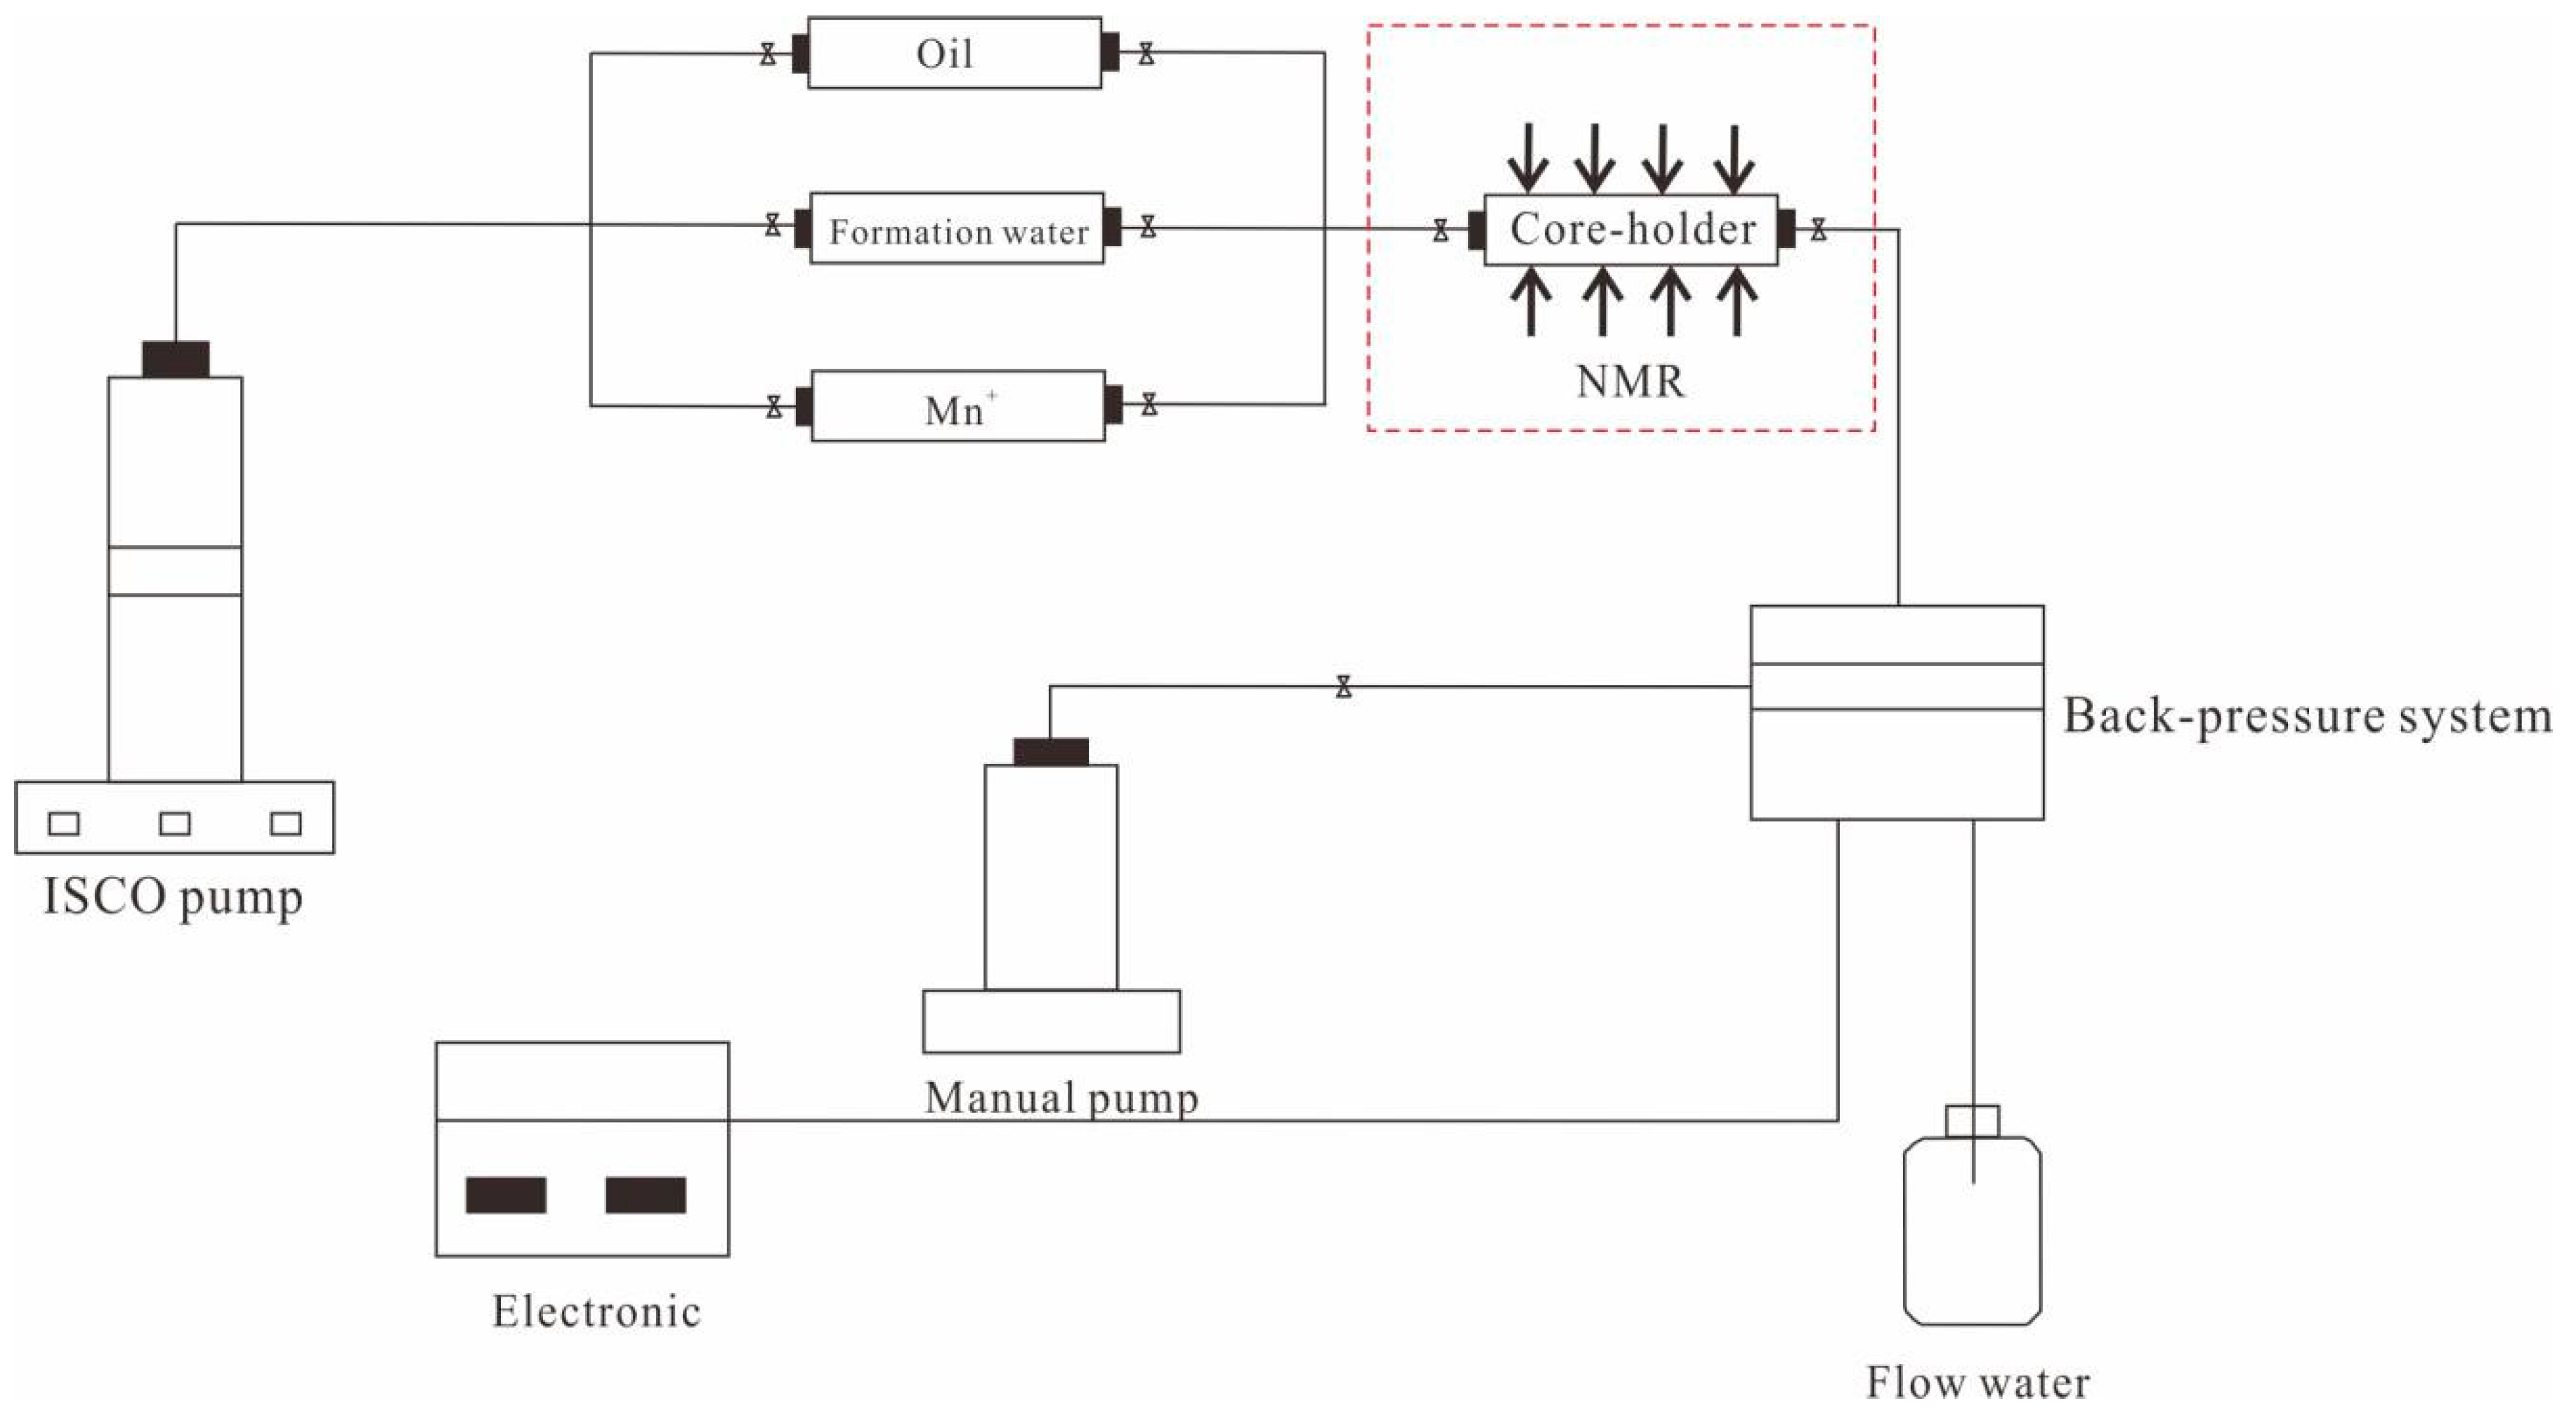
2.2. Experimental Setup

This section briefly introduces the experimental instruments and materials used in this study. The displacement experiment equipment is the LDY-150 high-temperature and high-pressure dynamic displacement system (Figure 1). The displacement pump is Microke 3PB-1045II, the displacement pressure is 0–58 MPa, and the flow rate control range is 0.01–15 mL/min. Hand pump and intermediate containers are produced by Huaxing Petroleum Company. In addition, the core holder comprises PEEK nonmagnetic material and can withstand up to 35 MPa pressure and up to 85 °C temperature. Fluorine oil without a hydrogen core is utilized in the experiment to replicate formation pressure by applying confining pressure to the holder. Moreover, the pressure control range for the backpressure control mechanism of the manual pump is 0–50 MPa. The abovementioned equipment was manufactured by Jiangsu Huaxing Petroleum Instrument Co.,Ltd. The core observation equipment is the Oxford Geospec2/53 nuclear magnetic resonance test system, which was manufactured by Shanghai Nuomai Company; the temperature is 32 °C, the permanent magnet is 2 MHz, the magnetic field strength is 0.5 T, the frequency range for RF pulses is 1–20 MHz, and the frequency control precision is 0.01 MHz.
Nano-CT scanning is one of the most advanced techniques used in tight oil and gas reservoir research. This technique has a high resolution (up to 100 nm maximum resolution) and lossless rock scanning imaging. Importantly, nano-CT scanning breaks through the limitation that two-dimensional images cannot reflect the three-dimensional characteristics of microscopic pore systems. The nano-CT scanning can analyze the development characteristics of micro and nano pores, pore size and connectivity, and the occurrence state of crude oil in the core [41,42,43]. In this experiment, the entire field of view of core samples was scanned using the GE nanotom M nano-scale core CT scanning device. The tight oil occurrence shape and micro-pore structure are also detected.

2.3. Experimental Procedures

The detailed operation steps of the physical simulation experiment of crude oil charging are presented as follows. (1) The standard vacuum-saturated formation water technique in conjunction with the high-pressure displacement equipment is utilized to imitate stratum water by saturating samples. NMR T2 spectrum is then tested. (2) A high-temperature and high-pressure displacement system is used to displace saturated manganese water (Mn2+, 25,000 mg/L) to eliminate the water signal in the core. The NMR T2 spectrum is examined when the outflow volume is around 5 pore volume (PV), and again when the displacement proceeds to 10 pore volume (PV). If there is no significant difference between the two T2 spectra, the core pores can be considered to be completely saturated with manganese water. (3) High-temperature and high-pressure displacement system is used to saturate simulation crude oil at 0.01 mL/min. Due to the heterogeneity of core (different porosity and permeability), the displacement time of each core in the experiment is different, and there is no uniformly determined value. The displacement is stopped when the liquid output volume reaches 1, 2, 3, 4, and 5 pore volume (PV) until the outlet liquid is pure oil without any water and the NMR T2 spectrum does not change significantly. The NMR T2 spectra are then measured at different drainage volumes. (4) The NMR T2 spectrum is measured at different charging volume multiples, and the T2 spectrum of saturated formation water measured in step 1 is plotted on the same map to obtain the change in oil content.

3. Results and Discussion

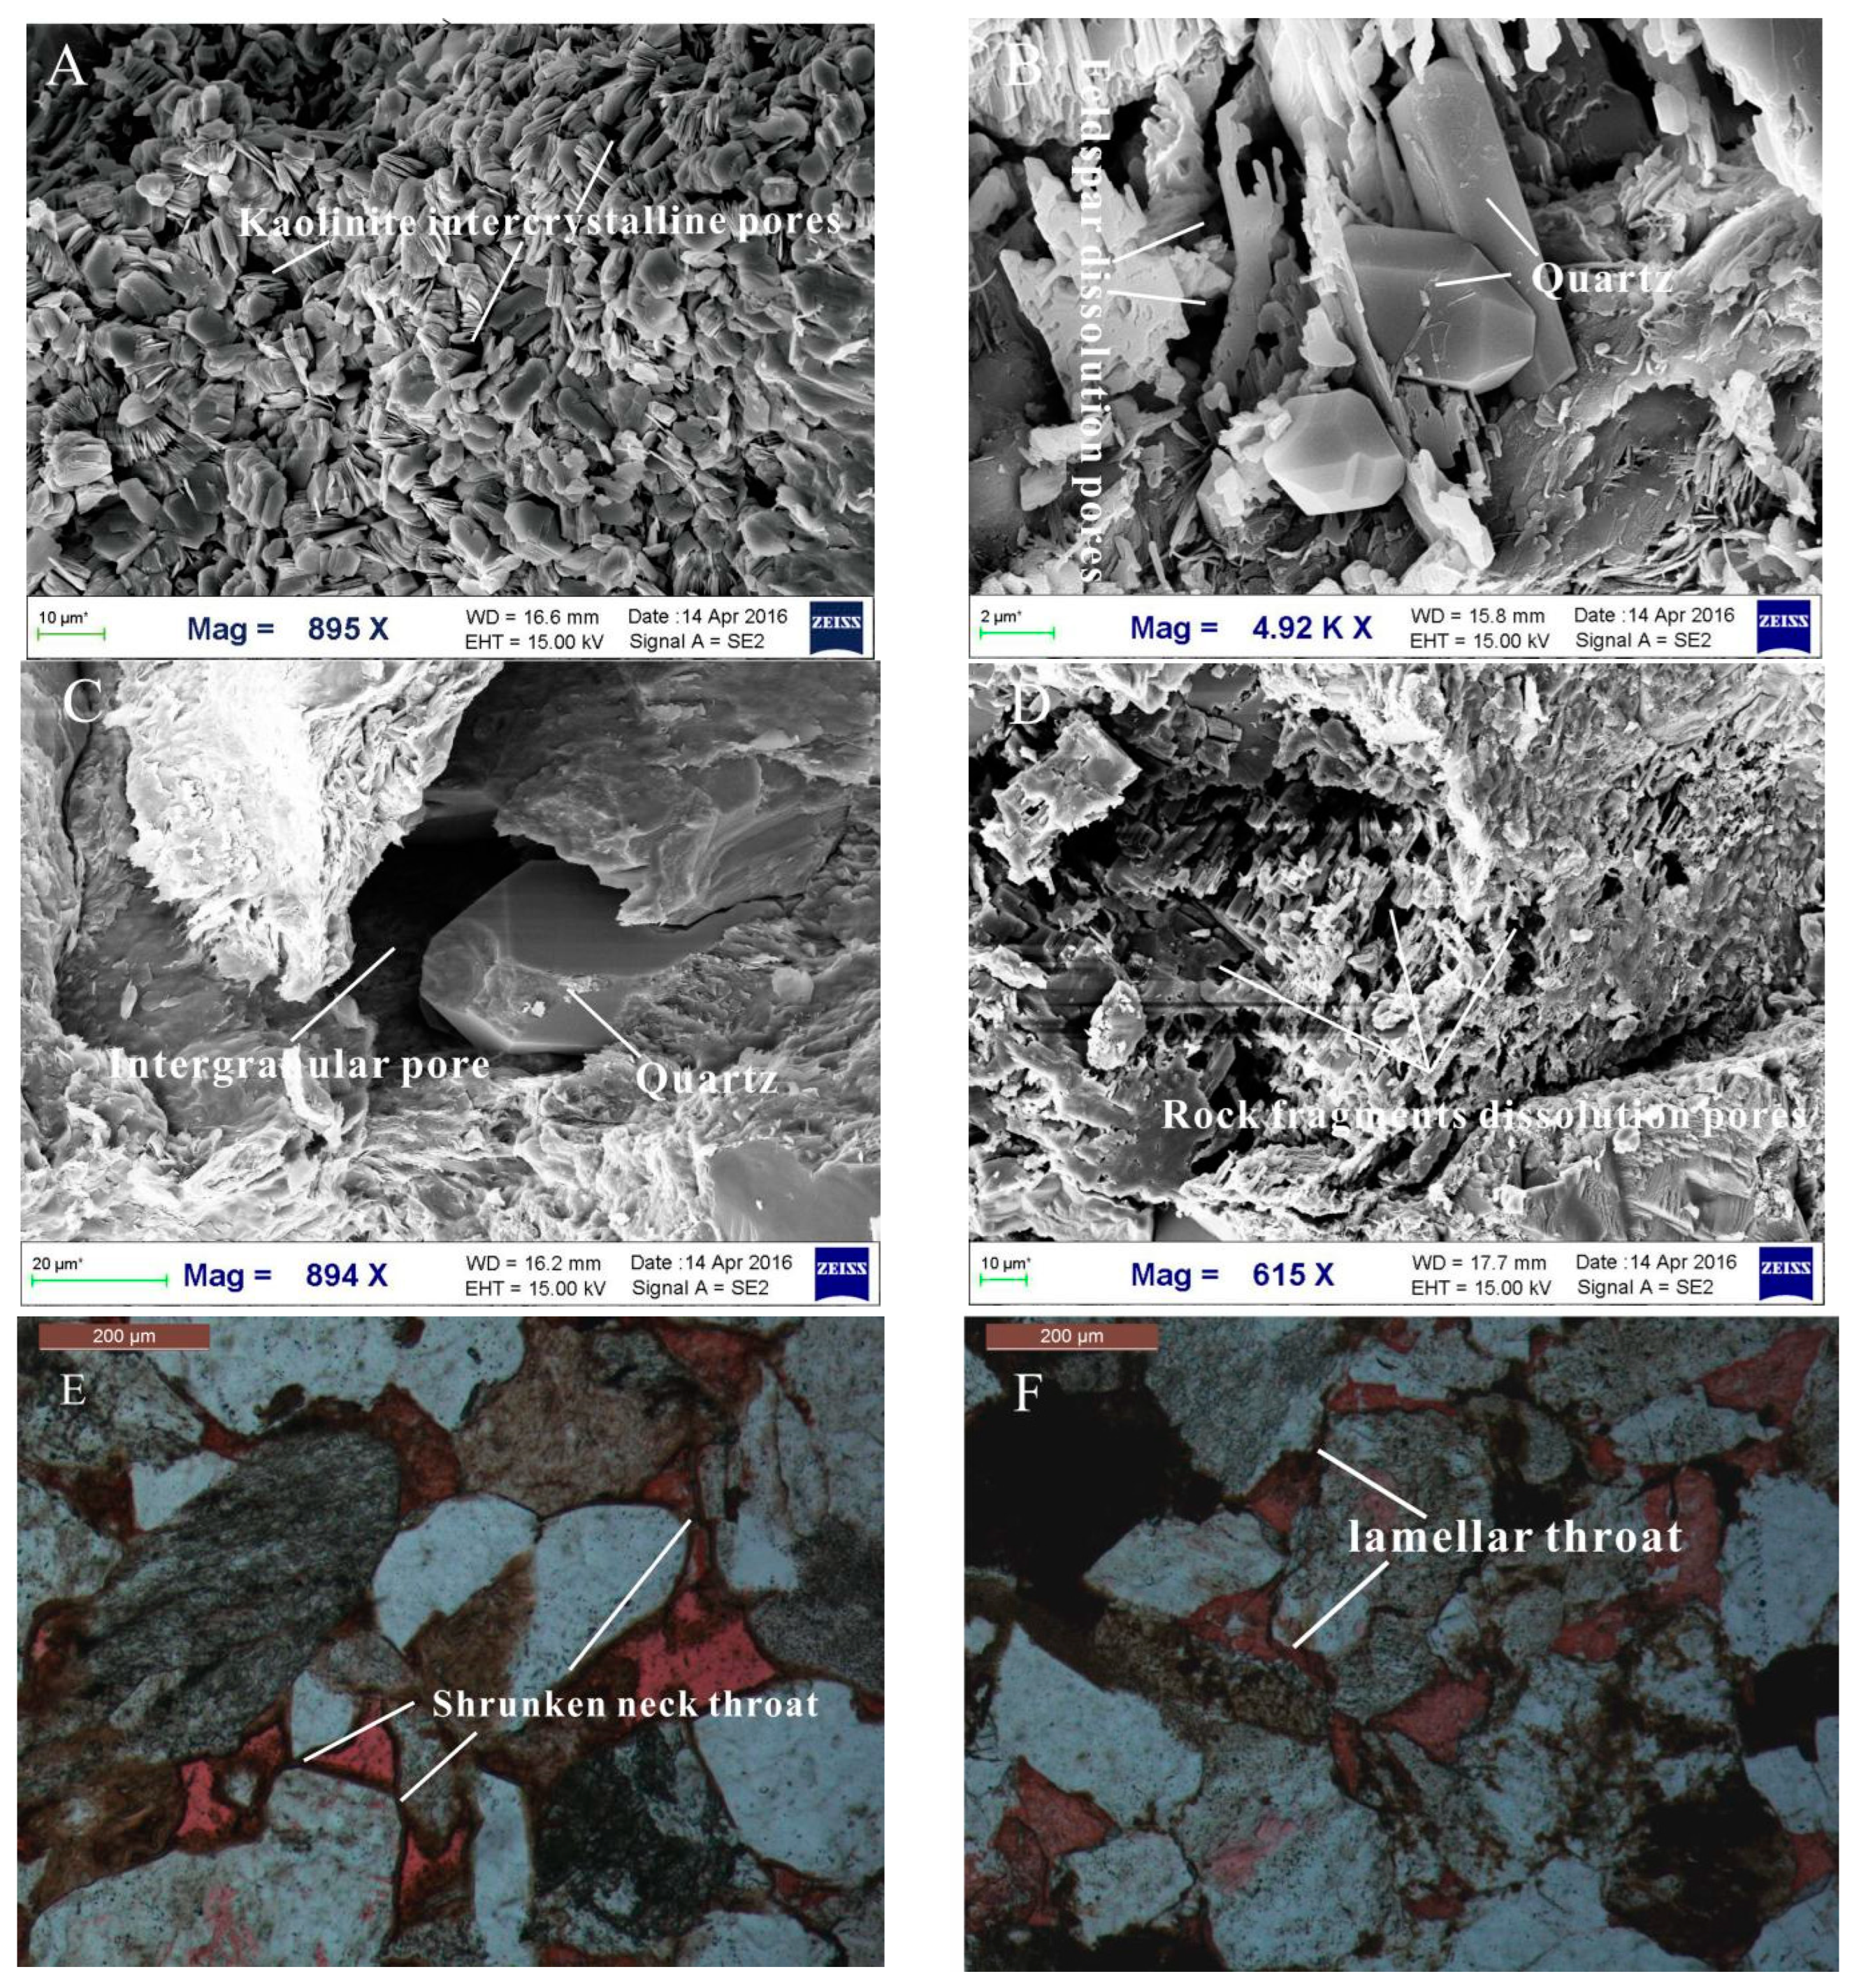
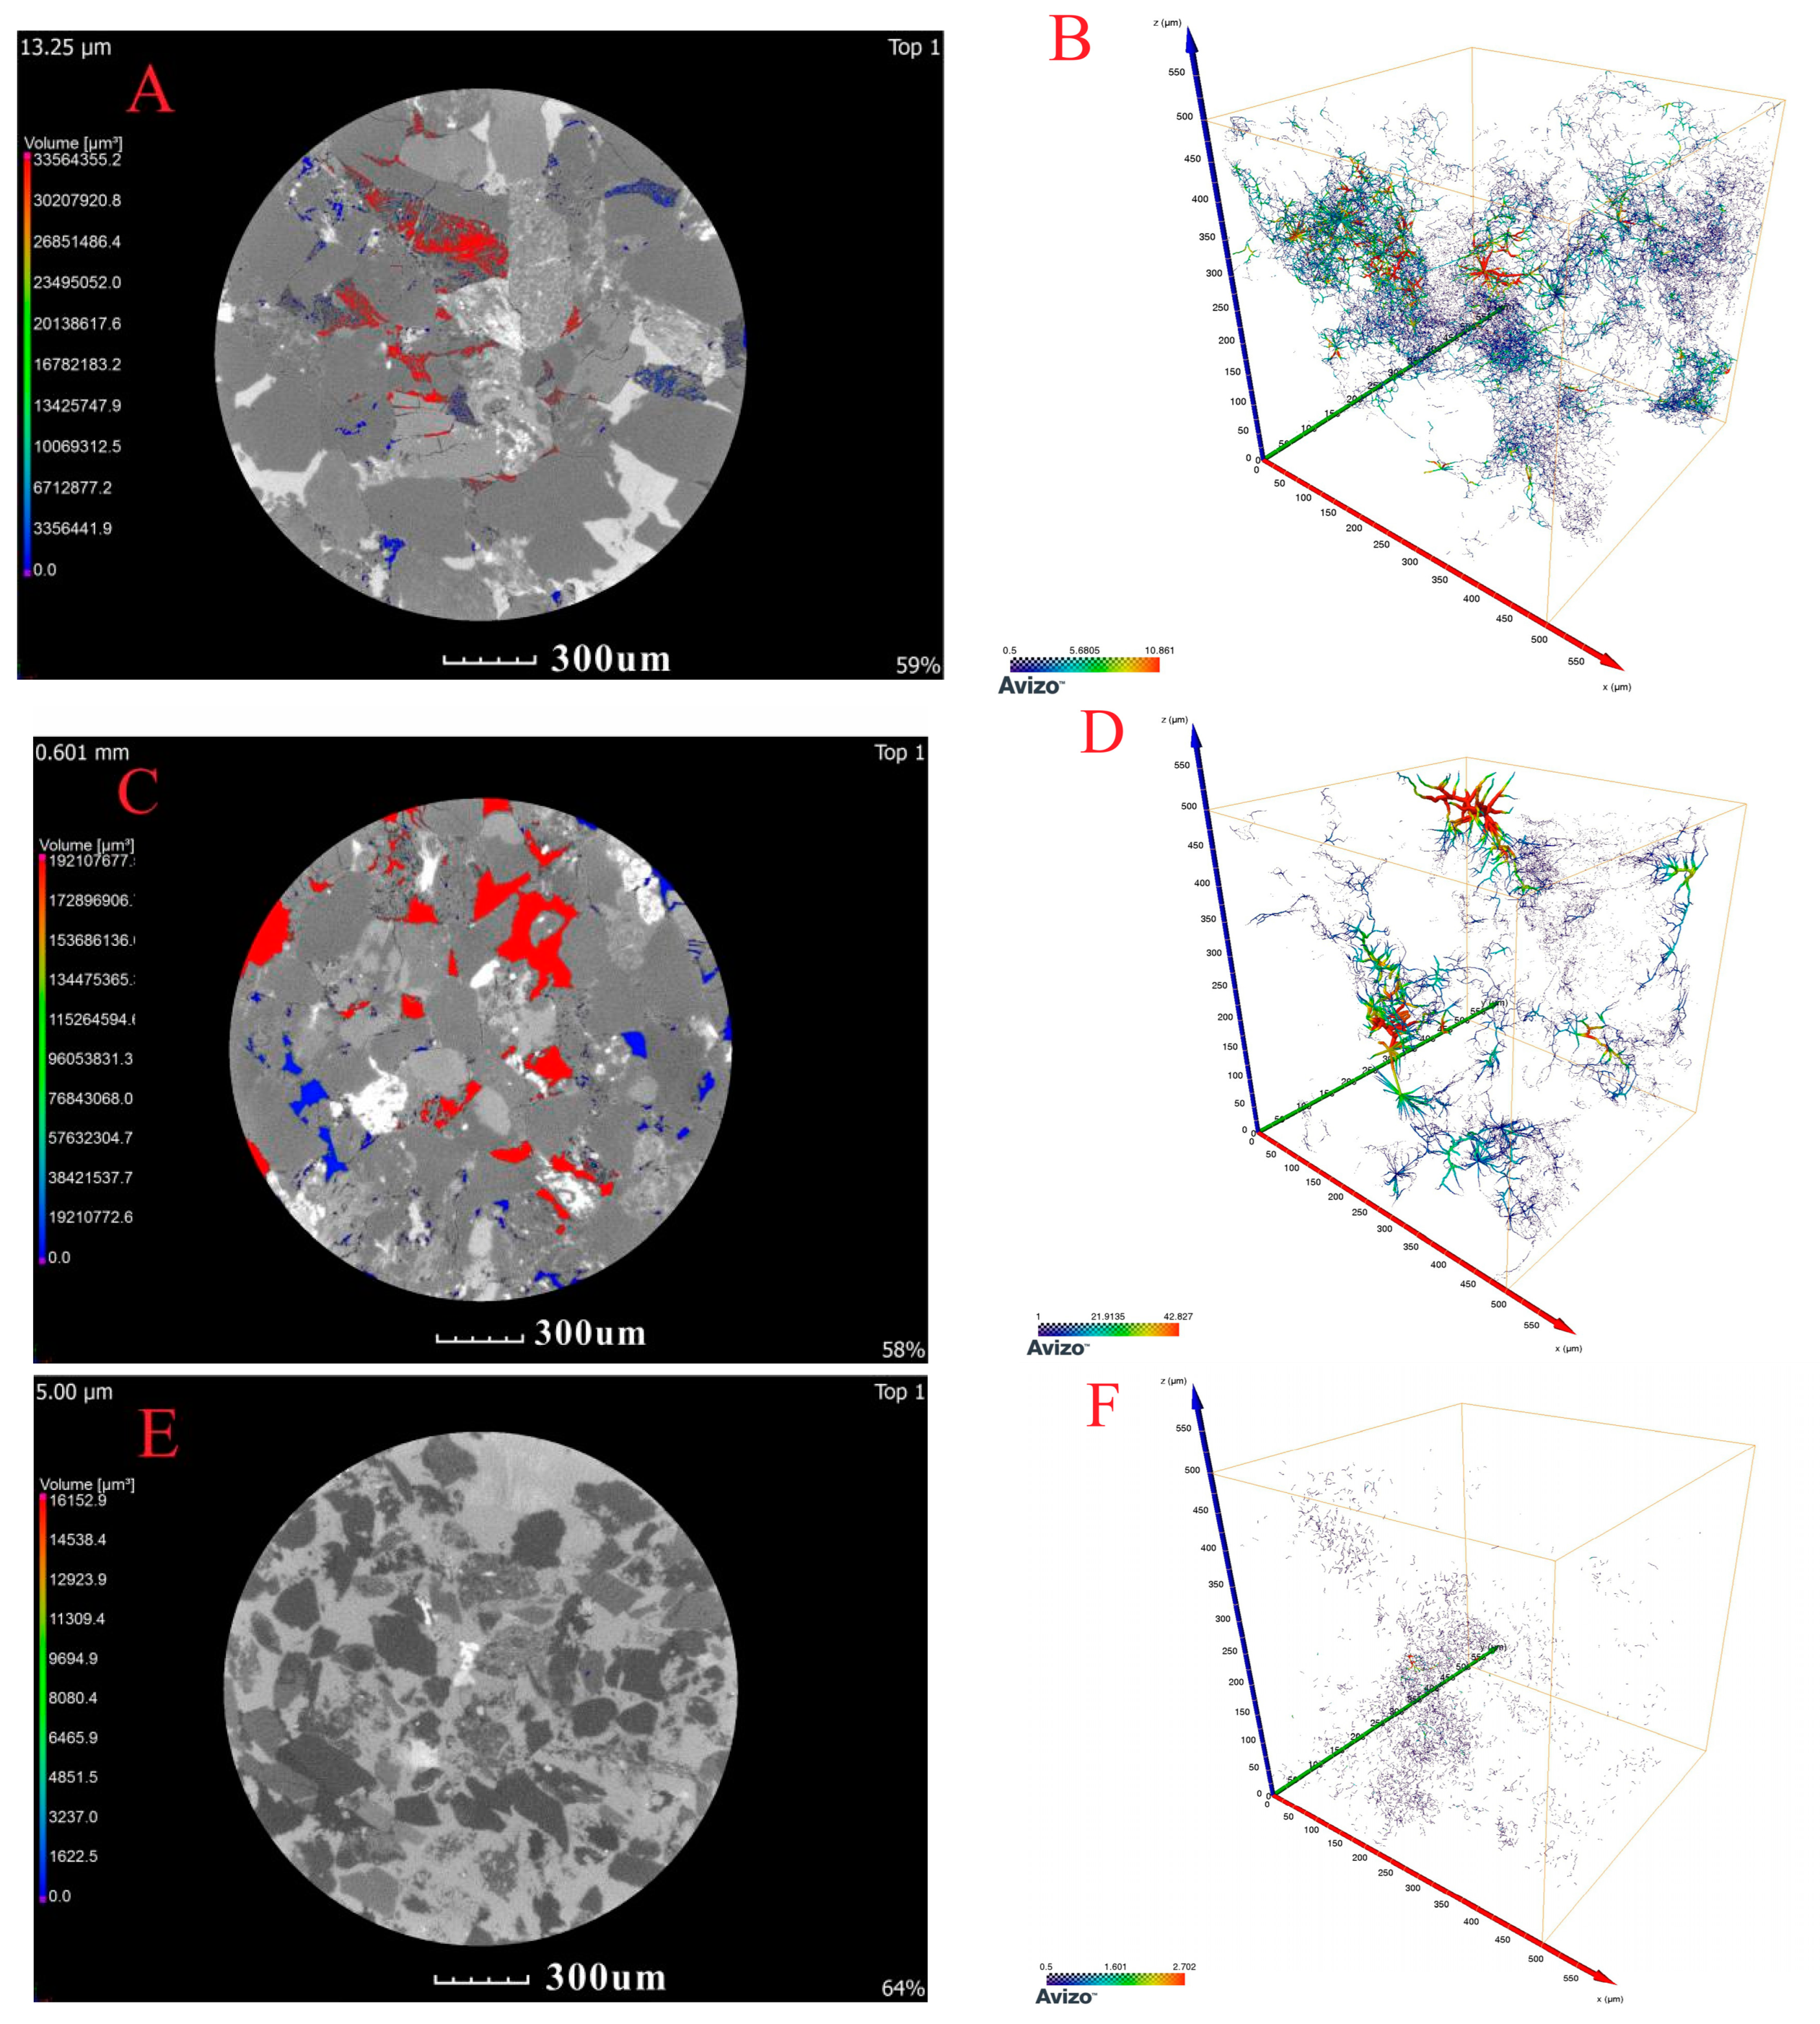
3.1. Characteristics and Classification of Reservoir Pore Structure

Chang 8 reservoir types are grouped into three categories based on the physical property characteristics and high-pressure mercury intrusion data of 10 samples from the research region. Table 2 lists Types I, II, and III.
Type I reservoir has good physical properties. The permeability and porosity on average across the reservoir are 0.44 × 10⁻³ μm2 and 9.0%, respectively. The capillary pressure curve shows a long platform shape and is inclined to the lower left. The average exhaust and median pressure are low at 0.86 and 6.89 MPa, respectively. The average high sorting factor is 2.19, indicating a significantly concentrated distribution of laryngeal size. The pore types include residual intergranular and soluble feldspar pores. The most common form of throat is lamellar, followed by large and medium throats (Figure 2B,F). Sample Nos. 6, 7, 8, and 9 belong to this type of reservoir, and sample No. 8 is then subjected to CT scanning. We determined that sample No. 8 contains a large number of large pores and medium pores, and the pores are distributed in planar sheet. There are a few small pores scattered around the large pores. The overall pore connectivity of the samples is good. Numerous large throats are observed, which show regular network distribution (Figure 3C,D). The large pore volume of the sample ranges from 347,349.5 μm3 to 385,943.9 μm3, the medium pore volume lies within the range of 124,574–175,943.9 μm3, and the small pore volume varies from 38,595.1 μm3 to 77,189.4μm3. The overall porosity of the samples is 10.2%, and the pore volume is 251,193,463.8 μm3. The average pore radius is 4.75 μm, with a range between 1.45 and 320.62 μm. Additionally, the average throat radius of the sample is 2.11 μm, the average throat length is 12.23 μm, the total throat length is 96,425.37 μm, and the throat volume is 12,600,165 μm3.
Type II reservoirs have general physical properties. The permeability and porosity on an average across the reservoir are 0.08 × 10⁻³ μm2 and 7.63%, respectively. The capillary pressure curve is gentle, with a visible horizontal plateau. The average displacement and median pressures of the reservoir are slightly larger than those of Type I, which are 1.22 and 10.95 MPa, respectively. The average sorting factor is 1.95, and the sorting performance is general. Figure 2C,E reveal that reservoir pores are dominated by residual intergranular holes, feldspar-dissolved pores, a small number of micro pores, and a narrow neck throat. Thus, sample Nos. 1, 4, and 5 belong to this type of reservoir. Nano-CT scanning was then performed on sample No. 1 to observe its pore throat distribution. Figure 3A,B show that the sample contains substantially small pores, a certain amount of large pores distributed in planar sheet and bands, and some medium pores. The overall pore connectivity is good, and many small throats show a network distribution. The large, medium, and small pore volumes of the sample are 3,354,635.2, 109,216.7–136,520.5, and 27,304.5–54,608.2 μm3, respectively. The overall porosity of the samples is 7.8%, and the pore volume is 9,711,527.8 μm3. The average pore radius is 4.01 μm, with a range between 1.02 and 225.13 μm. Moreover, the average throat radius of this sample is 0.9 μm, the average throat length is 9.78 μm, the total throat length is 269,522.83 μm, and the throat volume is 2,205,541.60 μm3.
Type III reservoirs have poor physical properties. The permeability and porosity on an average across the reservoir are 0.043 × 10⁻³ μm2 and 5.17%, respectively, which are substantially lower than Type I. The capillary pressure curve is steep, with a slightly evident horizontal plateau. The average drainage and median pressures of the samples are larger than those of the Type II capillary pressure curve, which are 2.68 and 39.05 MPa, respectively. The average sorting factor is 1.67, which is inferior to that of types I and II. Specifically, Figure 2A shows that the pore types of reservoirs are mostly intercrystalline and micro pores with several tiny throats. The percolation and storage capacity of reservoir fluid is poor, and the heterogeneity of reservoir fluid is strong Thus, sample Nos. 2, 3, and 10 belong to this type of reservoir. Nano-CT scanning was then performed on sample No. 10 to observe its pore throat distribution. Figure 3E,F show that the pores of the samples are small and poorly developed, with almost no large or medium pores, poor pore–throat connectivity, and mostly scattered and isolated distribution. The test findings indicate that the volume of small pores is 1141.4 μm3 and the overall porosity of the sample is 5.2%, which is the lowest among the three samples. Pores account for a total volume of 2,356,470.8 μm3. The range of pore radius is between 1.22 and 54.27 μm, with an average of 2.60 μm. The throat is small and punctate with poor development and connectivity. The average radius of the throat is 0.52 μm, the average length of the throat is 9.13 μm, the total length of the throat is 28,842.27 μm, and the total volume is 25,774.79 μm3.

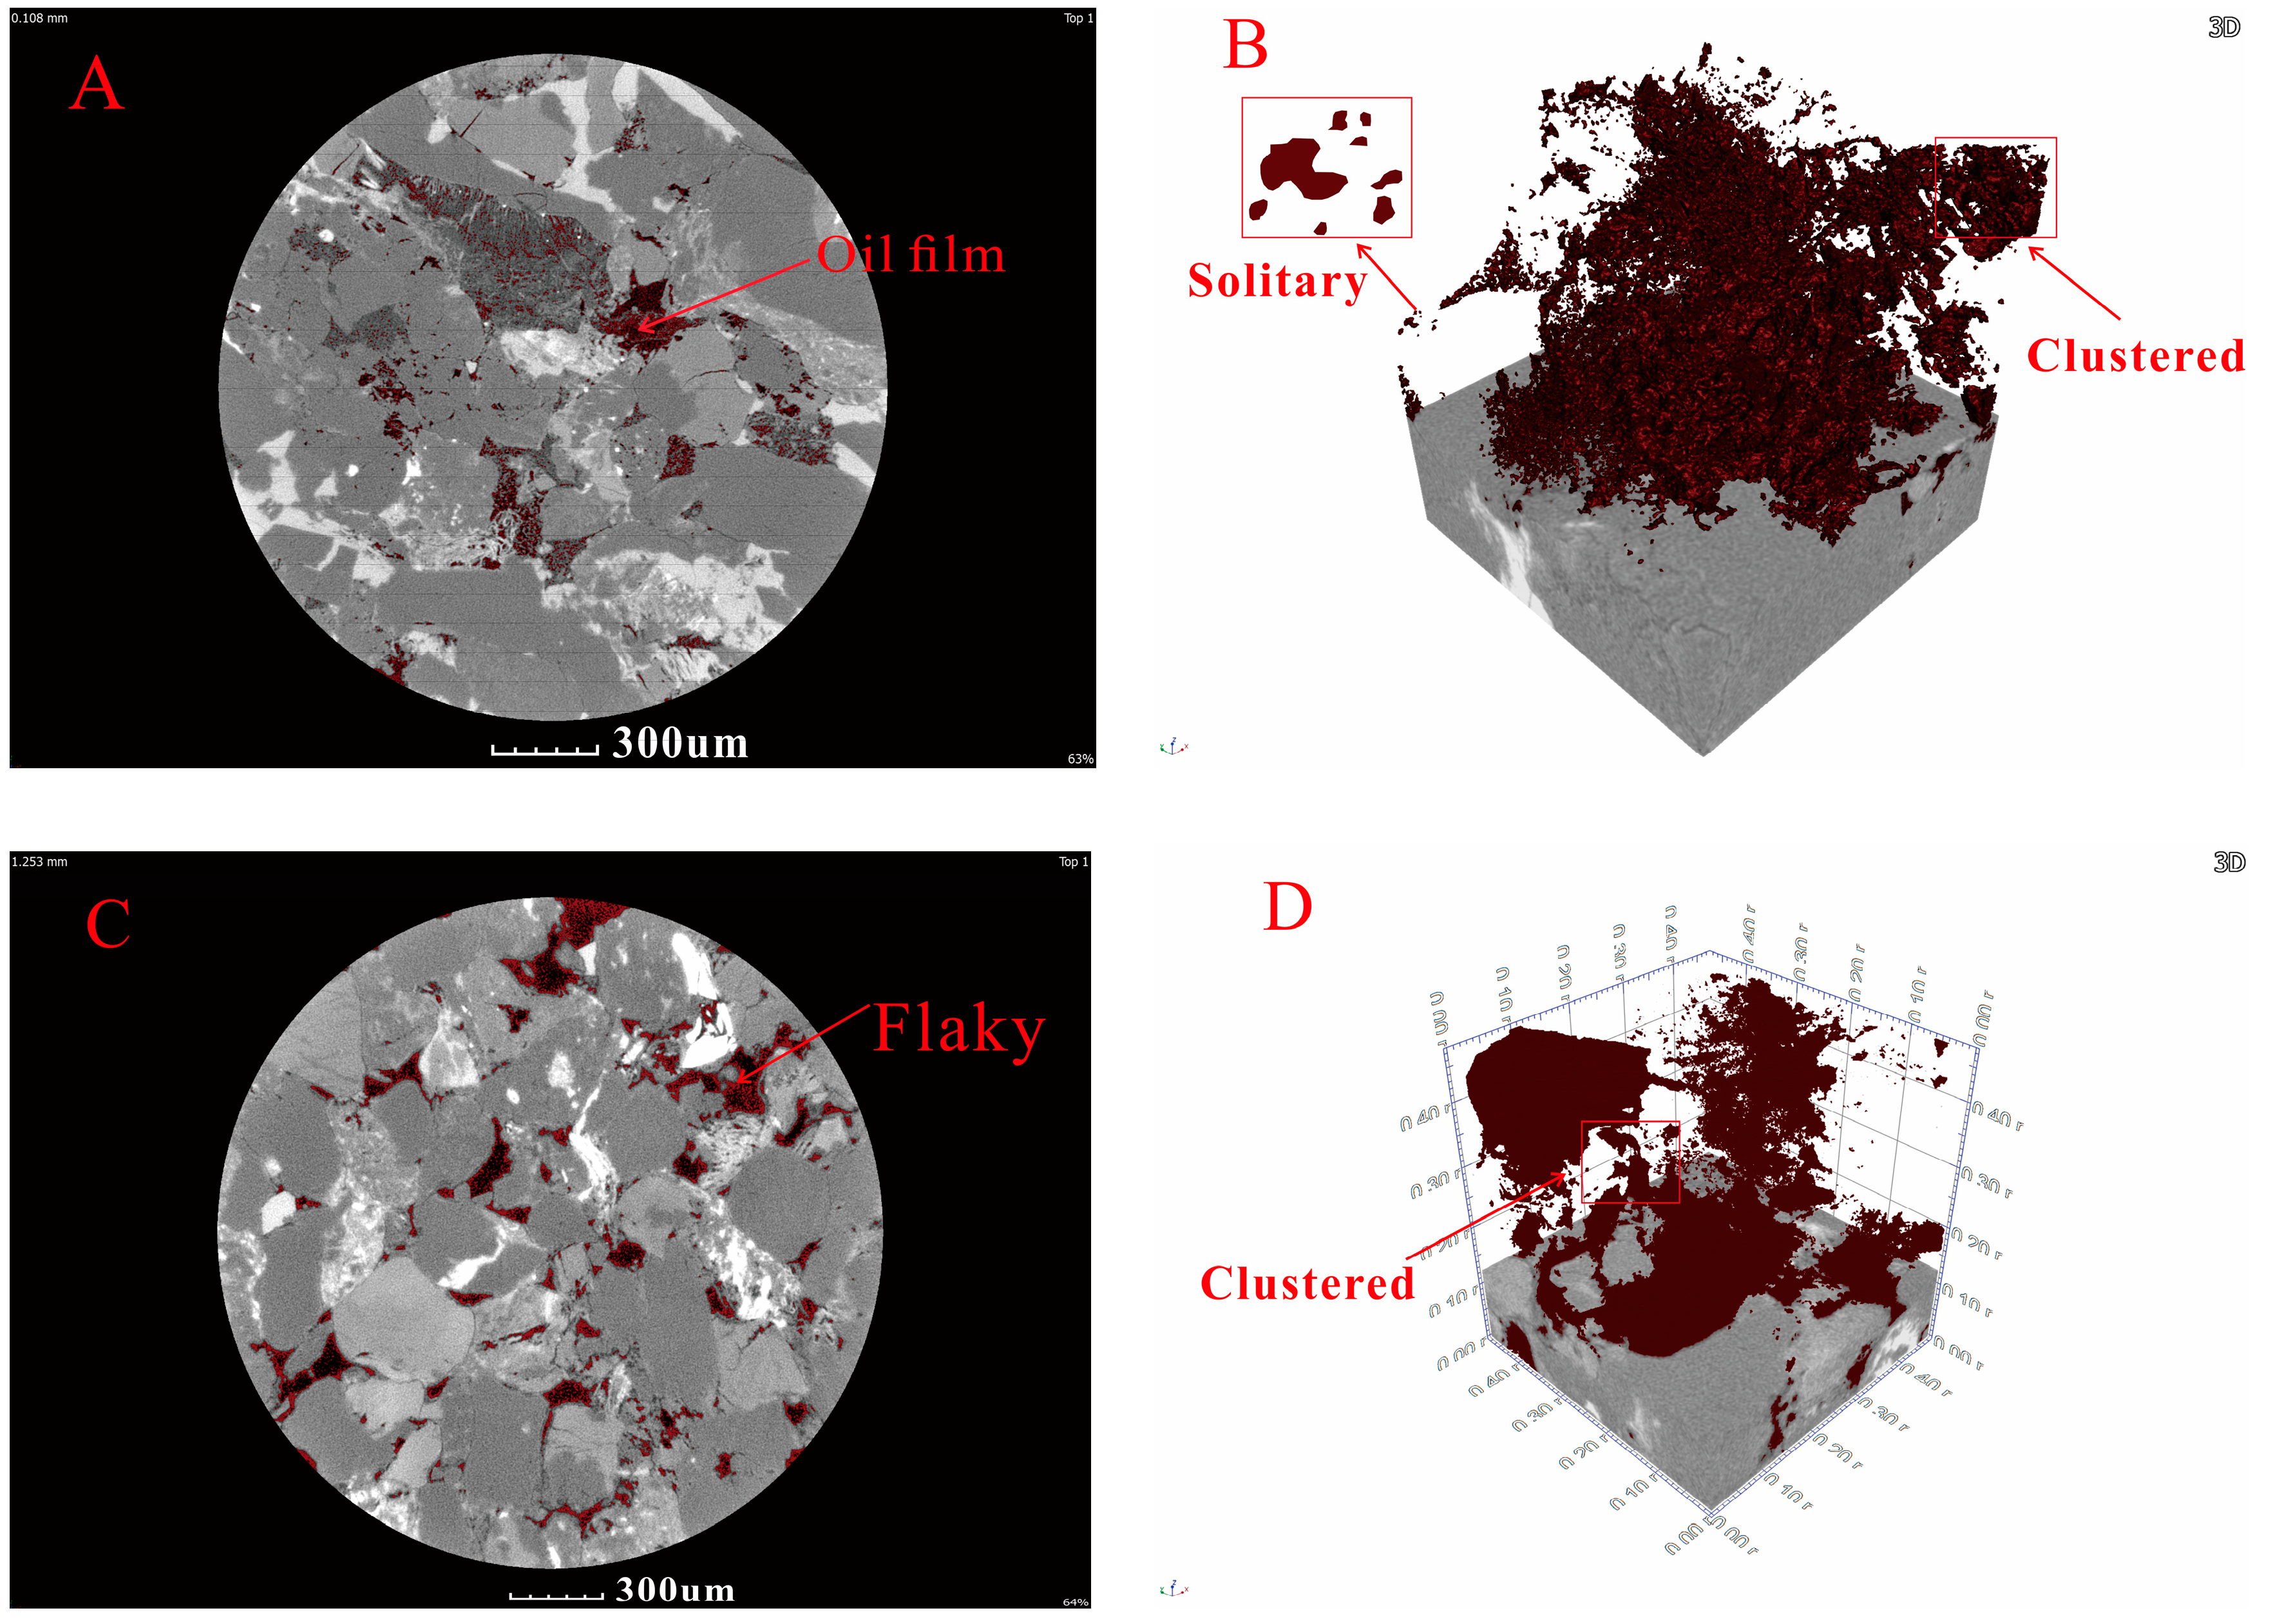
3.2. Static Occurrence Characteristics of Tight Oil

The two-dimensional scanning section of residual oil reveals that the Type II reservoir represents the development of some micro pores and a certain amount of dissolution pores in sample No. 1. The residual oil is mostly found in medium- and large-sized pores, but the tight oil in pores of tiny sizes is scarce. Oil film is the predominant form, and the main occurrence form is oil film. Figure 4A,B show that the tight oil is dispersed throughout the core samples. The oil distribution is dispersed when close to the core surface, and the oil distribution is compact when close to the core. This phenomenon is due to the location of most medium and large pores inside the center part of the core and the surface is mainly distributed with small dispersed pores. The pore connectivity in the central part is also good, and the occurrence form is clustered and solitary. The Type I reservoir represents sample No. 8 with additional intergranular, medium, and large pores distributed in planar sheet and a few micro-pores. Figure 4C,D show that oil mainly occurs in medium and large pores and is uniformly distributed in the core, and the occurrence form is mainly flake and cluster. The residual oil volume of sample No. 8 is 137,196,645.1 μm3, which is approximately 2.8 times that of sample No. 1, and the porosity is larger than that of sample No. 1 (7.8%) with good pore connectivity. Type III reservoirs were not scanned because they were too tight, had poor pore–throat structure, and had substantially low residual oil content (<0.5%).

3.3. Dynamic Occurrence Characteristics of Tight Oil

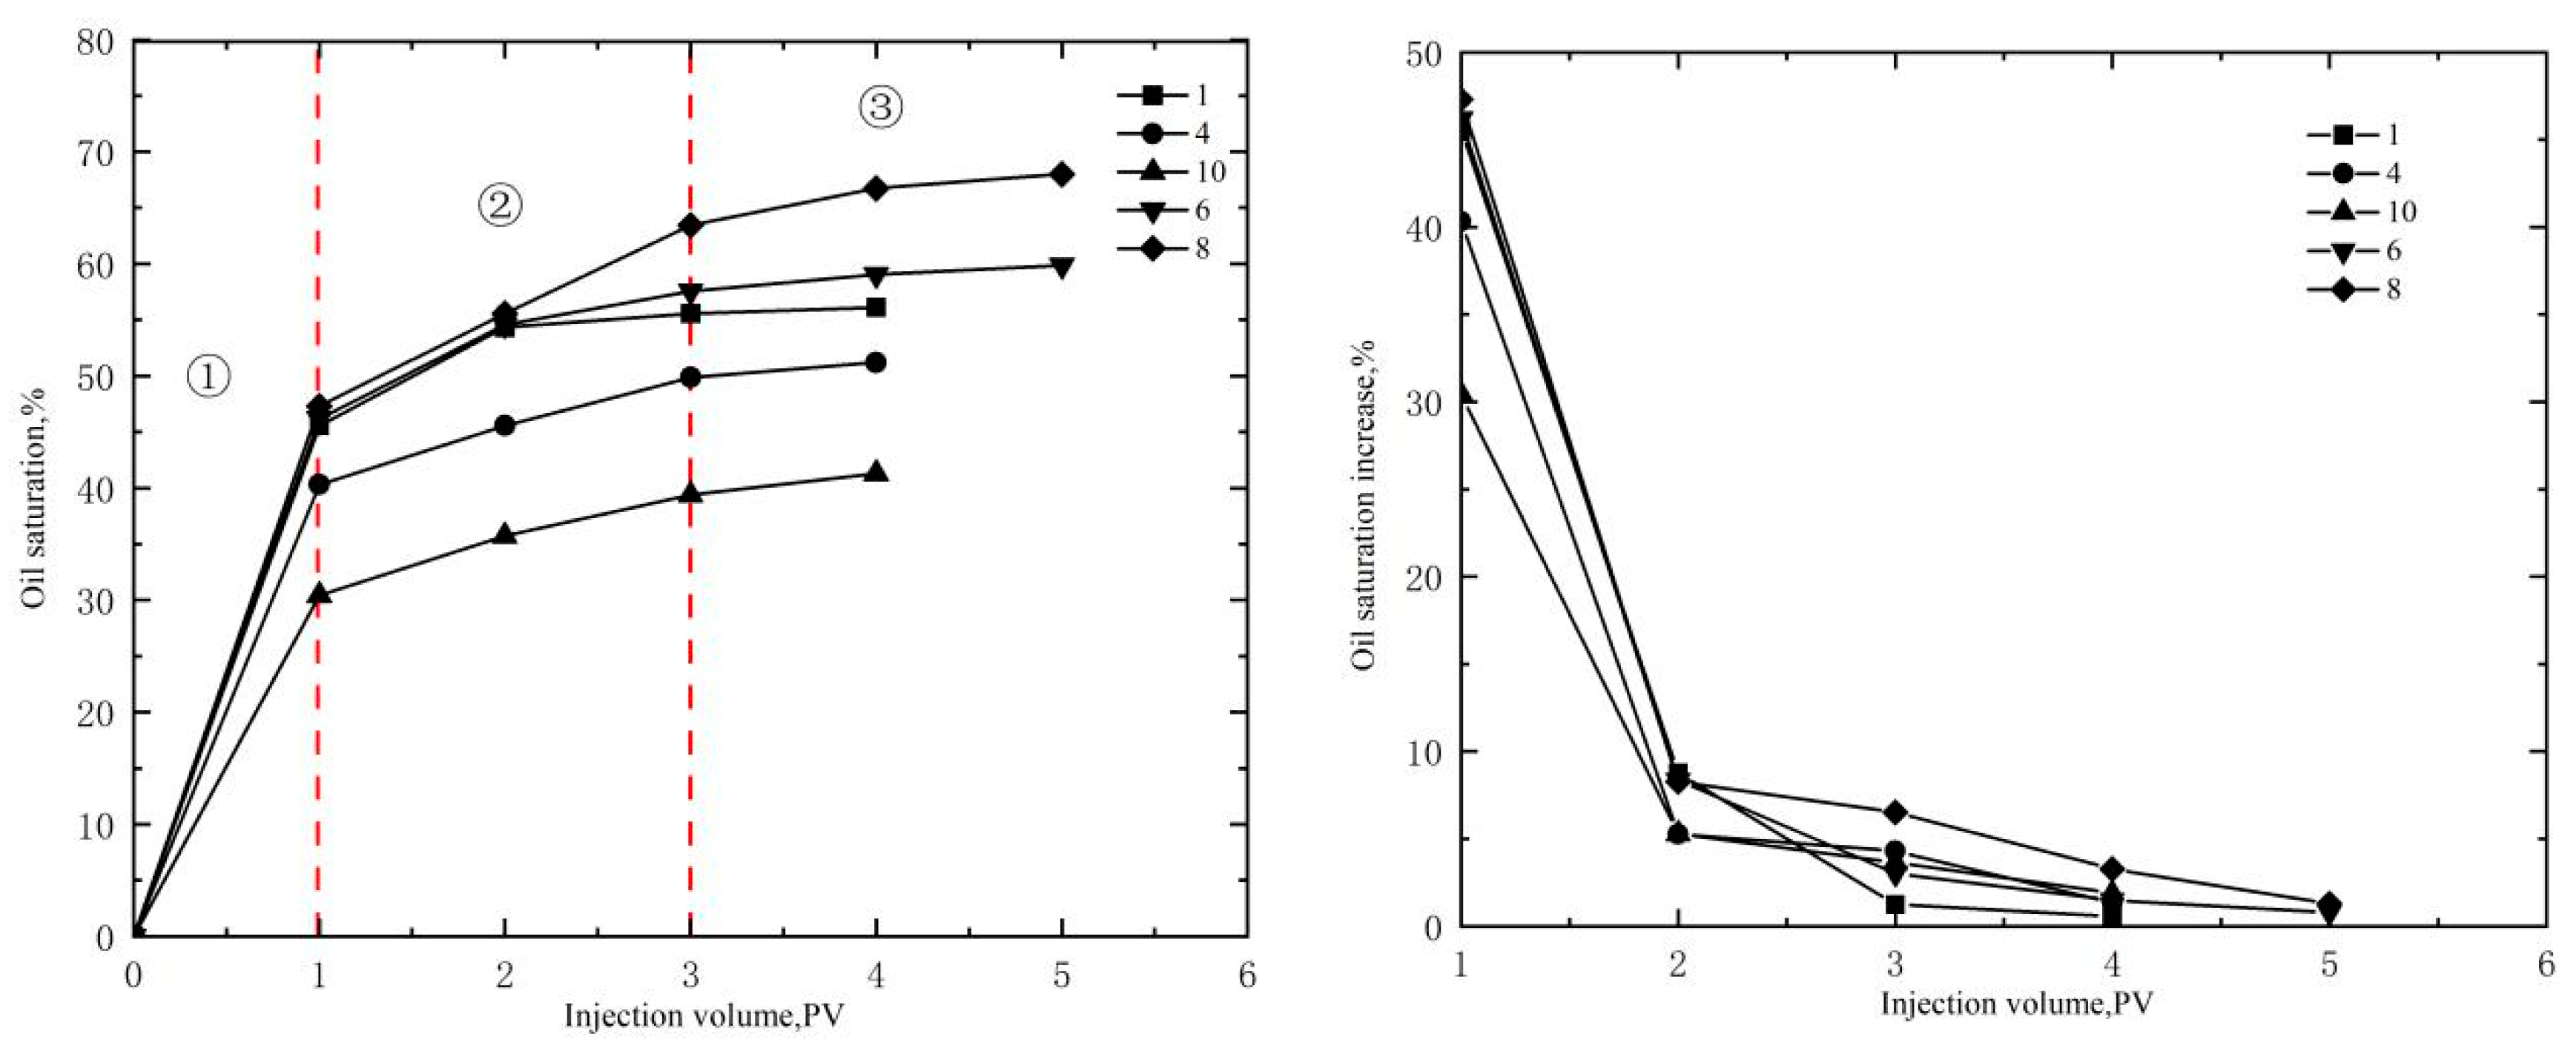
3.3.1. Oil Saturation Changes

Oil saturation can successfully assess the oil content of the reservoir and evaluate its performance [44]. The NMR technique indicates that the oil saturation after oil charging is the ratio of the covered area under the T2 spectrum after each displacement to that under the T2 spectrum of saturated water formation (Equation (1)). The change in oil saturation under different displacement states is calculated in accordance with the T2 spectrum distribution of NMR by using the curve integral method.
S 0 = T 2 , min T 2 , max A i , t T 2 , min T 2 , max A i , o
where S0: oil saturation, %; T2,max: maximum relaxation time for each pore on the T2 spectral curve, ms; T2,min: minimum relaxation time for each pore on the T2 spectral curve, ms; Ai,t: amplitude of T2 spectrum curve at different displacement volume multiples; Ai,0: amplitude of T2 spectrum curve in saturated water formation.
Figure 5 shows that the oil saturation rises steadily as the volume multiple of injected oil increases. The rising amplitude of the saturation decreases when the amount of oil charging is increased. The crude oil charging process can be separated into three stages according to the change in amplitude. ① Fast growth period: the oil saturation increases significantly when the volume ratio of injected oil is 1 PV, with an average increase of 41.69%. This phenomenon is attributed to the water-saturated reservoir at the beginning of the recharge. As the volume of injected oil increases, the displacement pressure rises and the oil slowly overcomes capillary resistance and enters the reservoir. The capillary resistance of large and medium pores is relatively low; thus, oil is preferentially injected into these pores. ② Gradual growth period: when the injected oil amount reaches 2 PV, the increase in oil saturation is 7.60% on average. When 3 PV is injected, the average increase is 4.12%. The displacement pressure rises as the amount of injected oil increases. The capillary force that can overcome crude oil gradually increases and enters the pores with a small radius, and the oil trickled into the small pores. ③ Stability period: The increase in oil saturation decreases significantly when the volume ratio of injected oil reaches 3 PV. The crude oil occupies most of the pores in the reservoir rock when the displacement pressure reaches a specific level. Even if the pressure increases further, the oil saturation does not increase significantly, reaching the maximum oil saturation. After flooding, the minimum oil saturation is 41.28%, the maximum is 68.01%, and the average is 55.29%. Three different reservoir-representative rock sample types for oil saturation are compared. The average oil saturation of the Type I reservoir is the highest (63.93%) and that of types II and III is low (53.16%) and the lowest (41.28%), respectively.

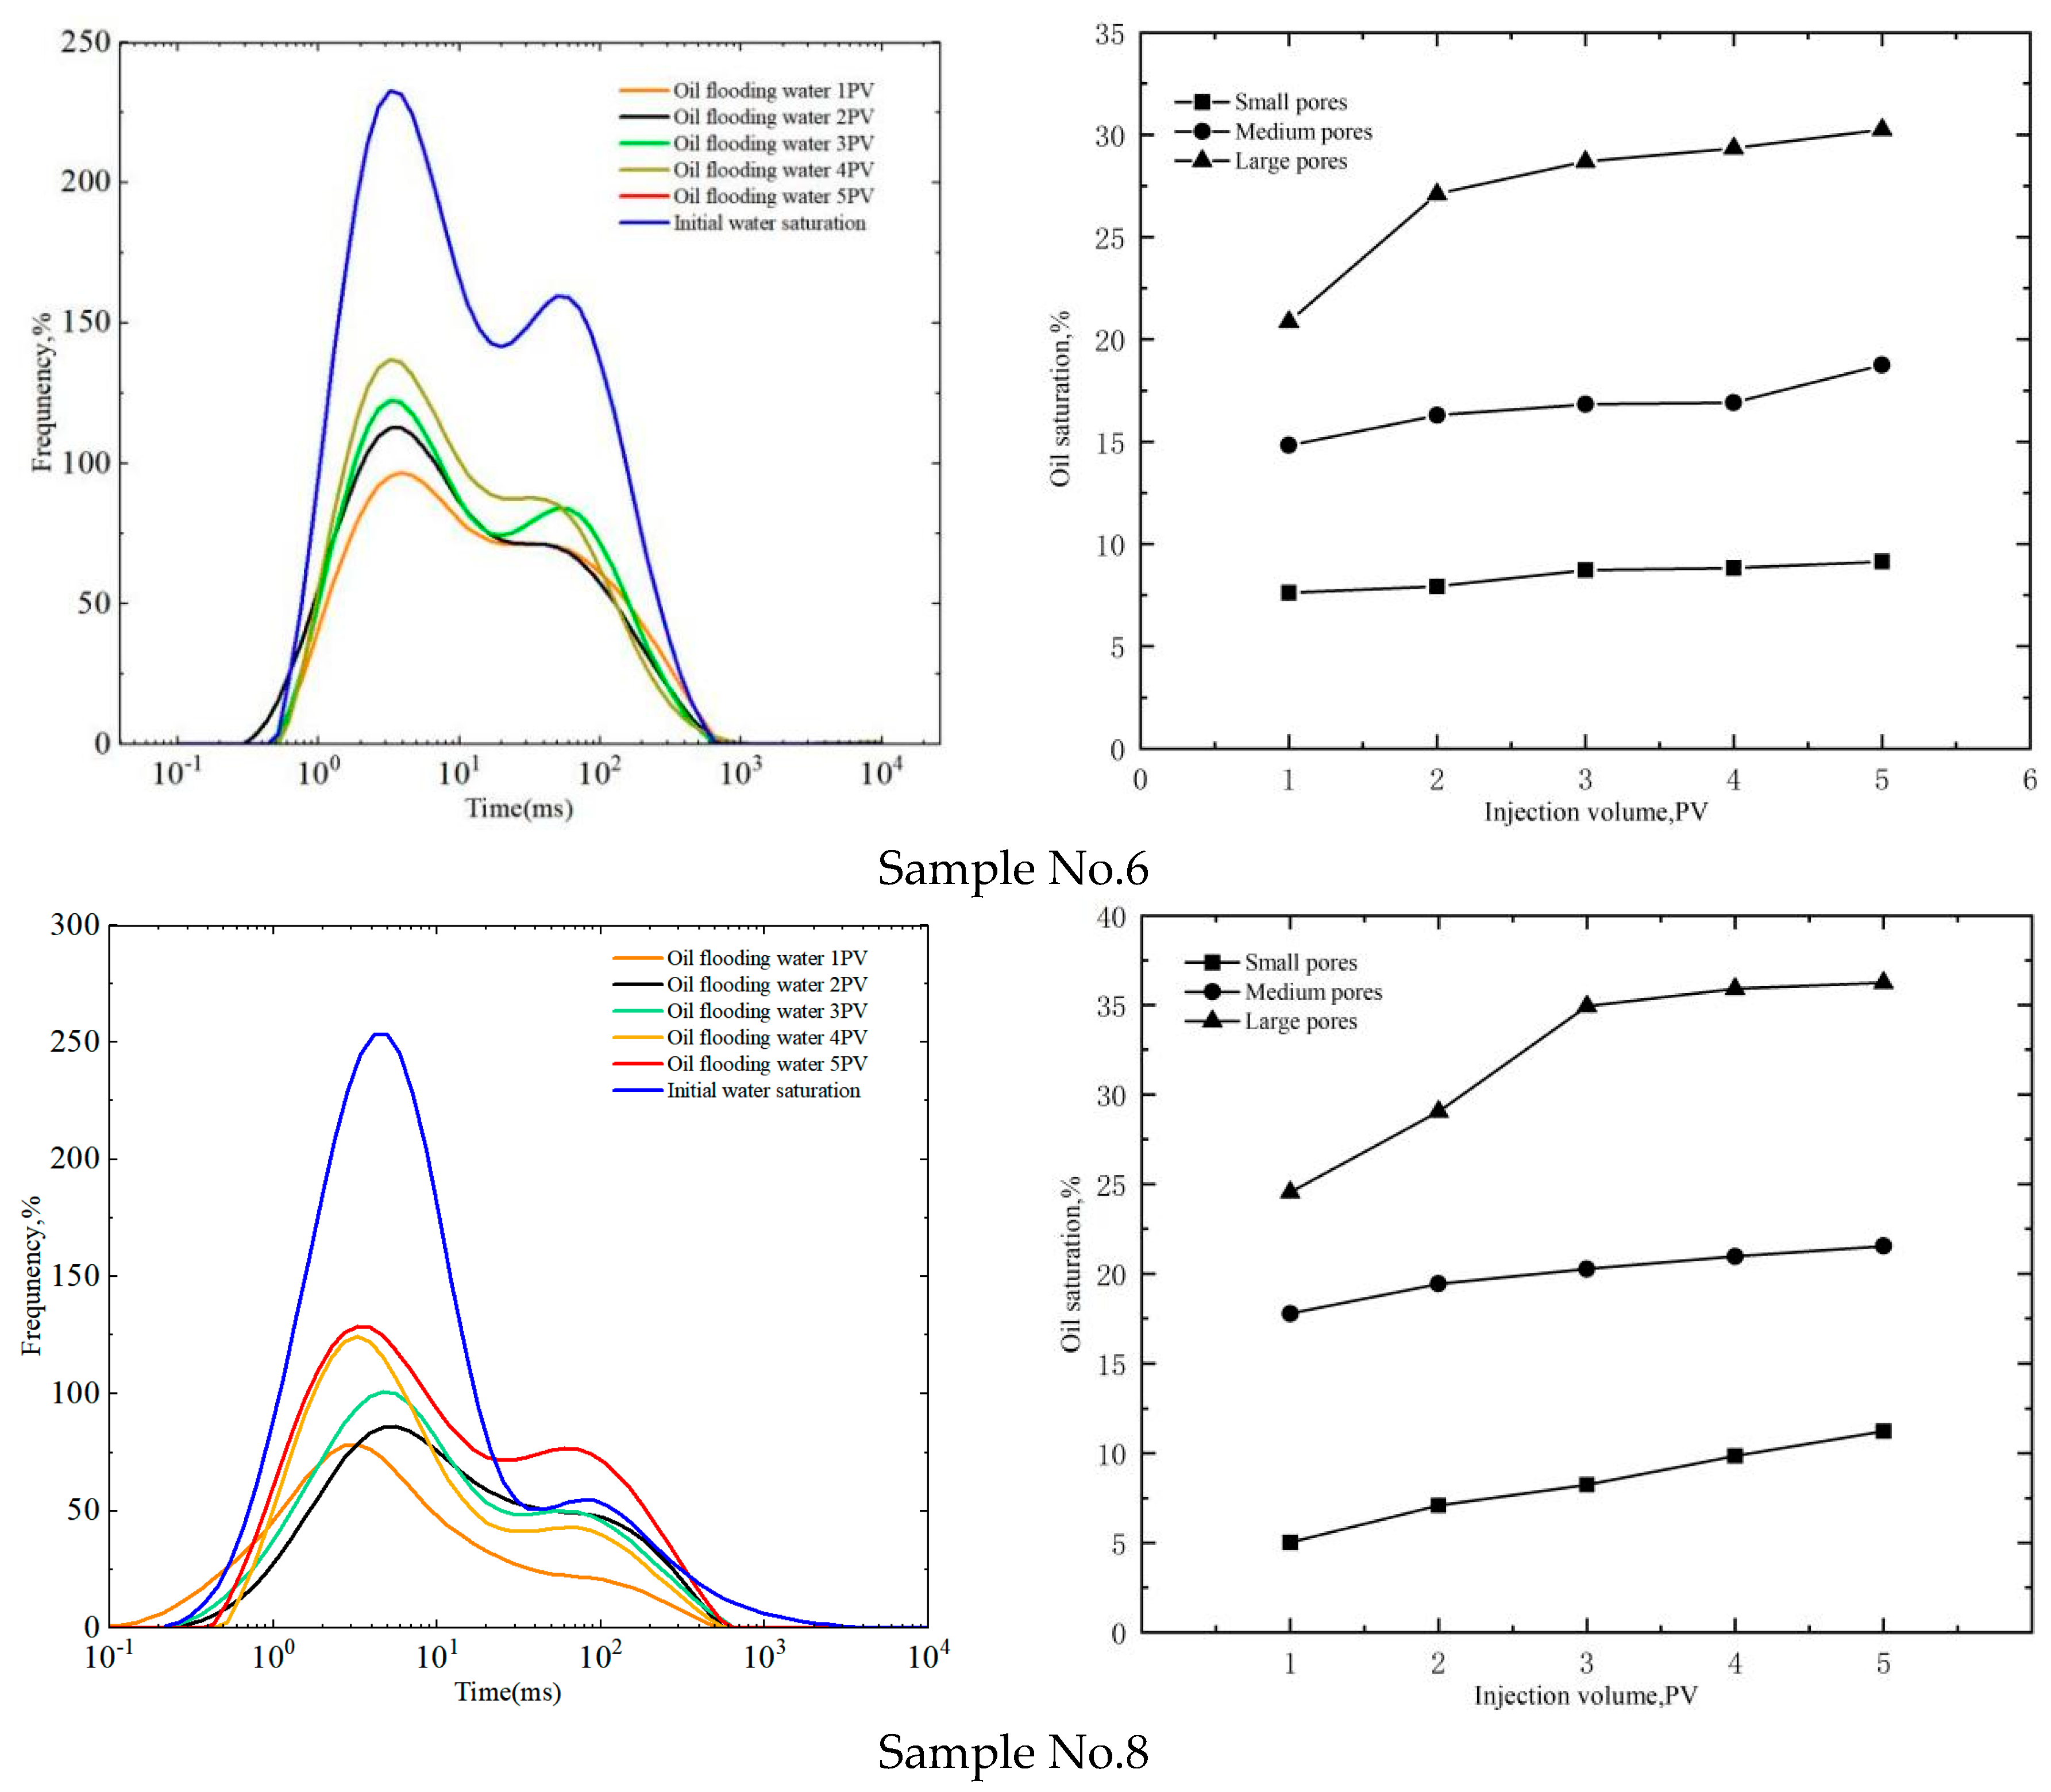
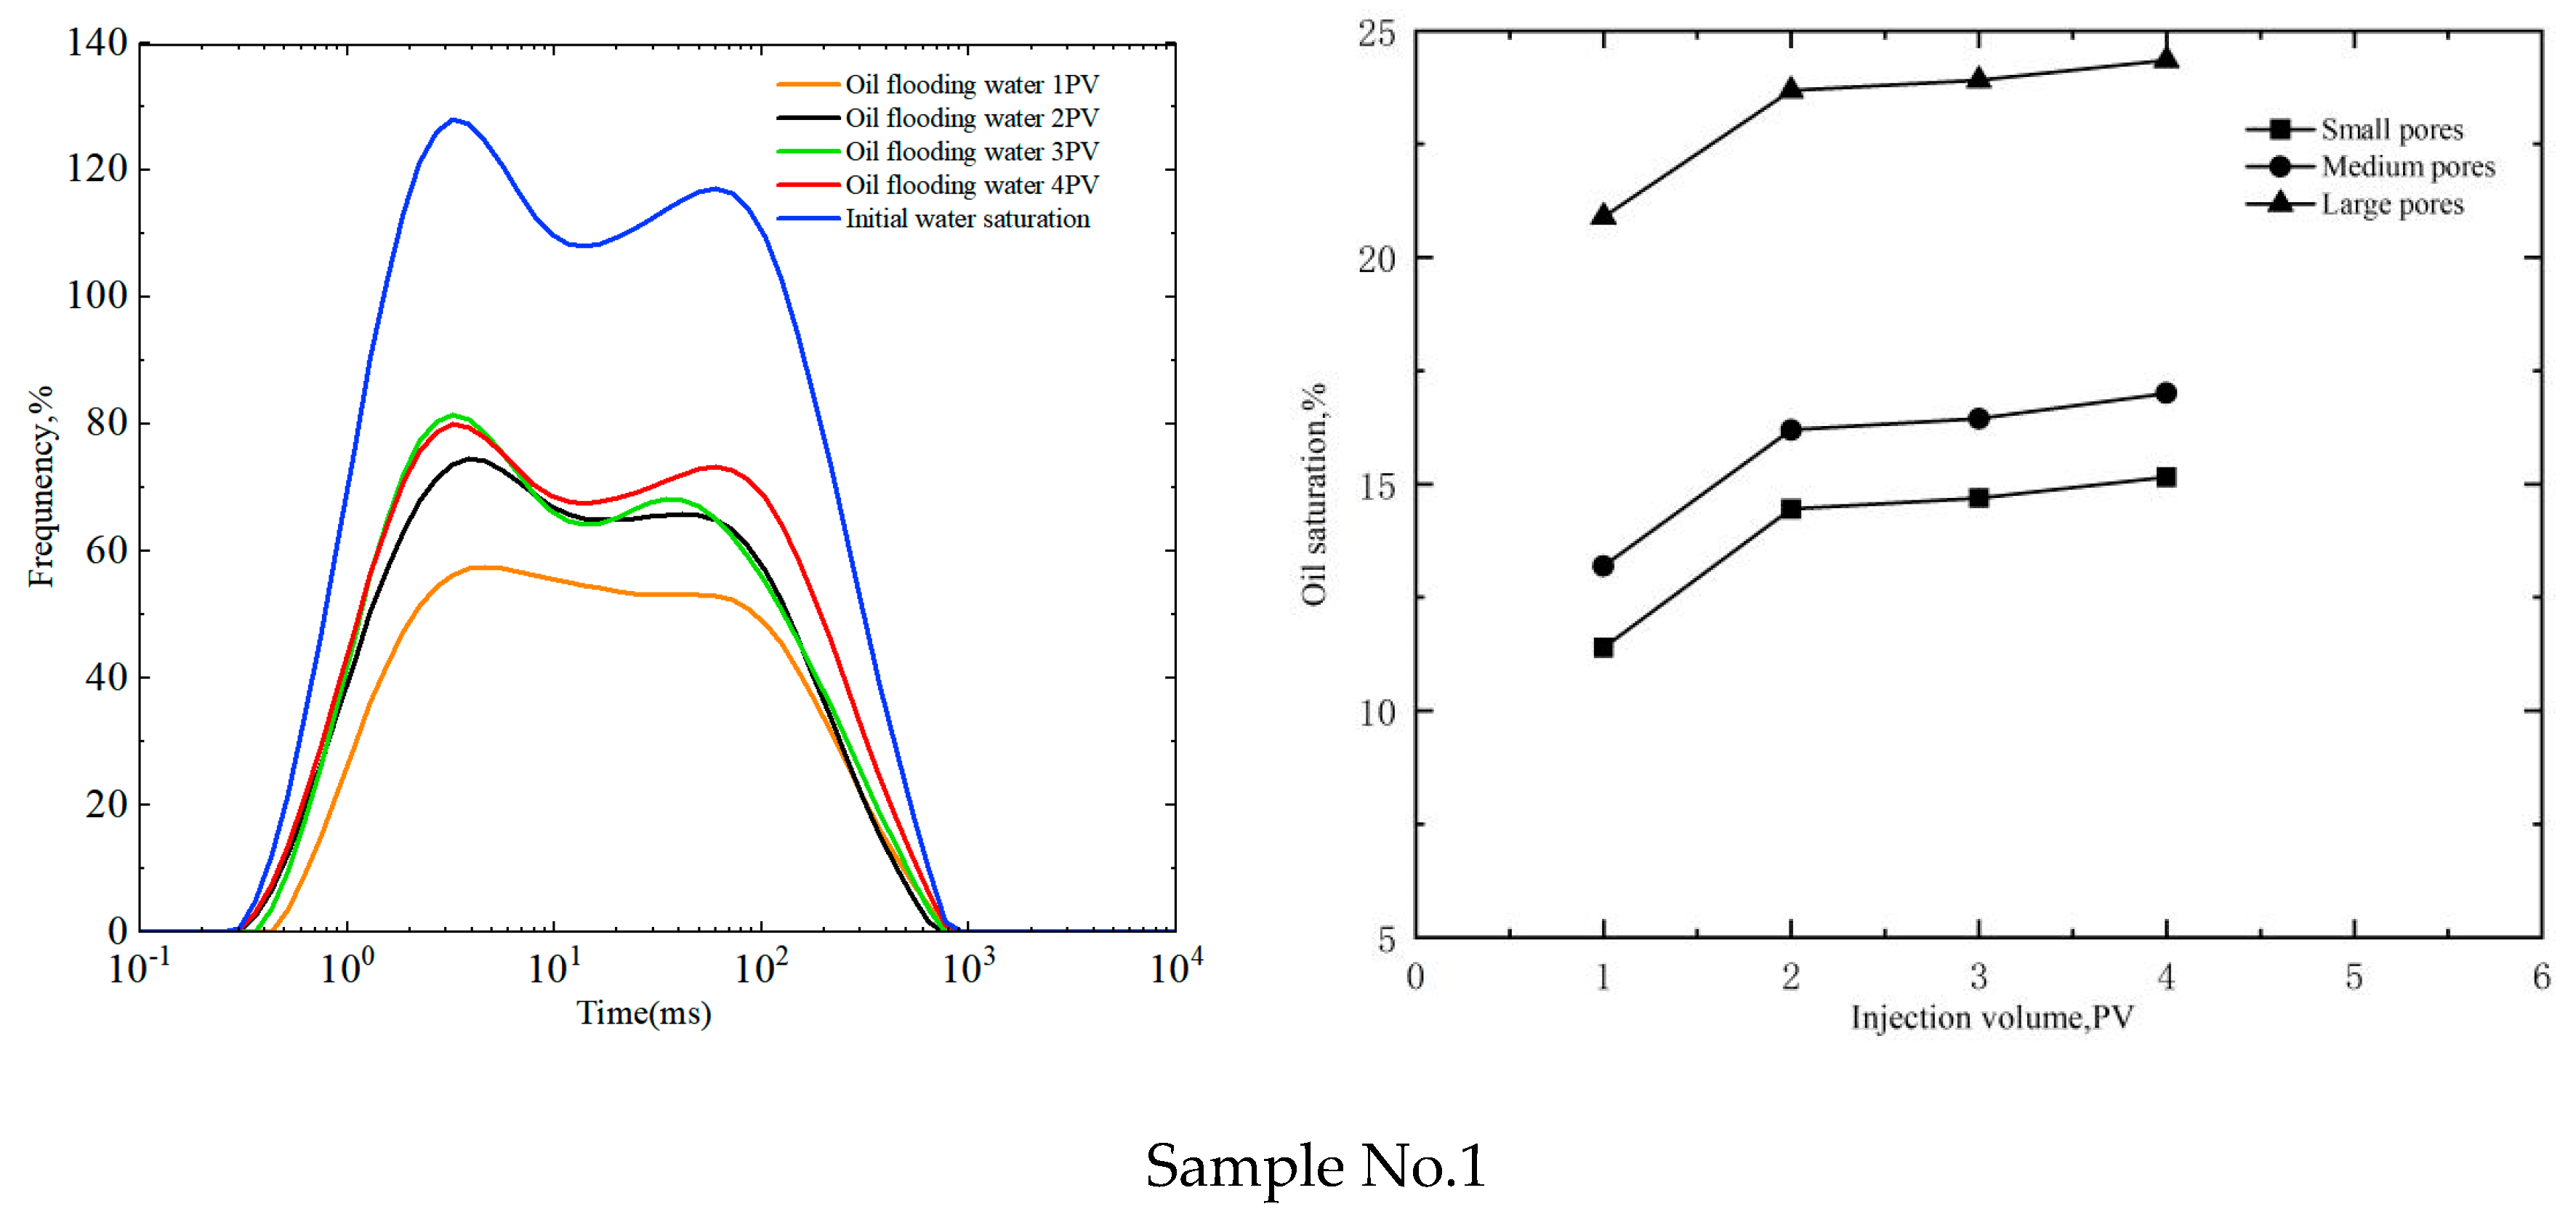
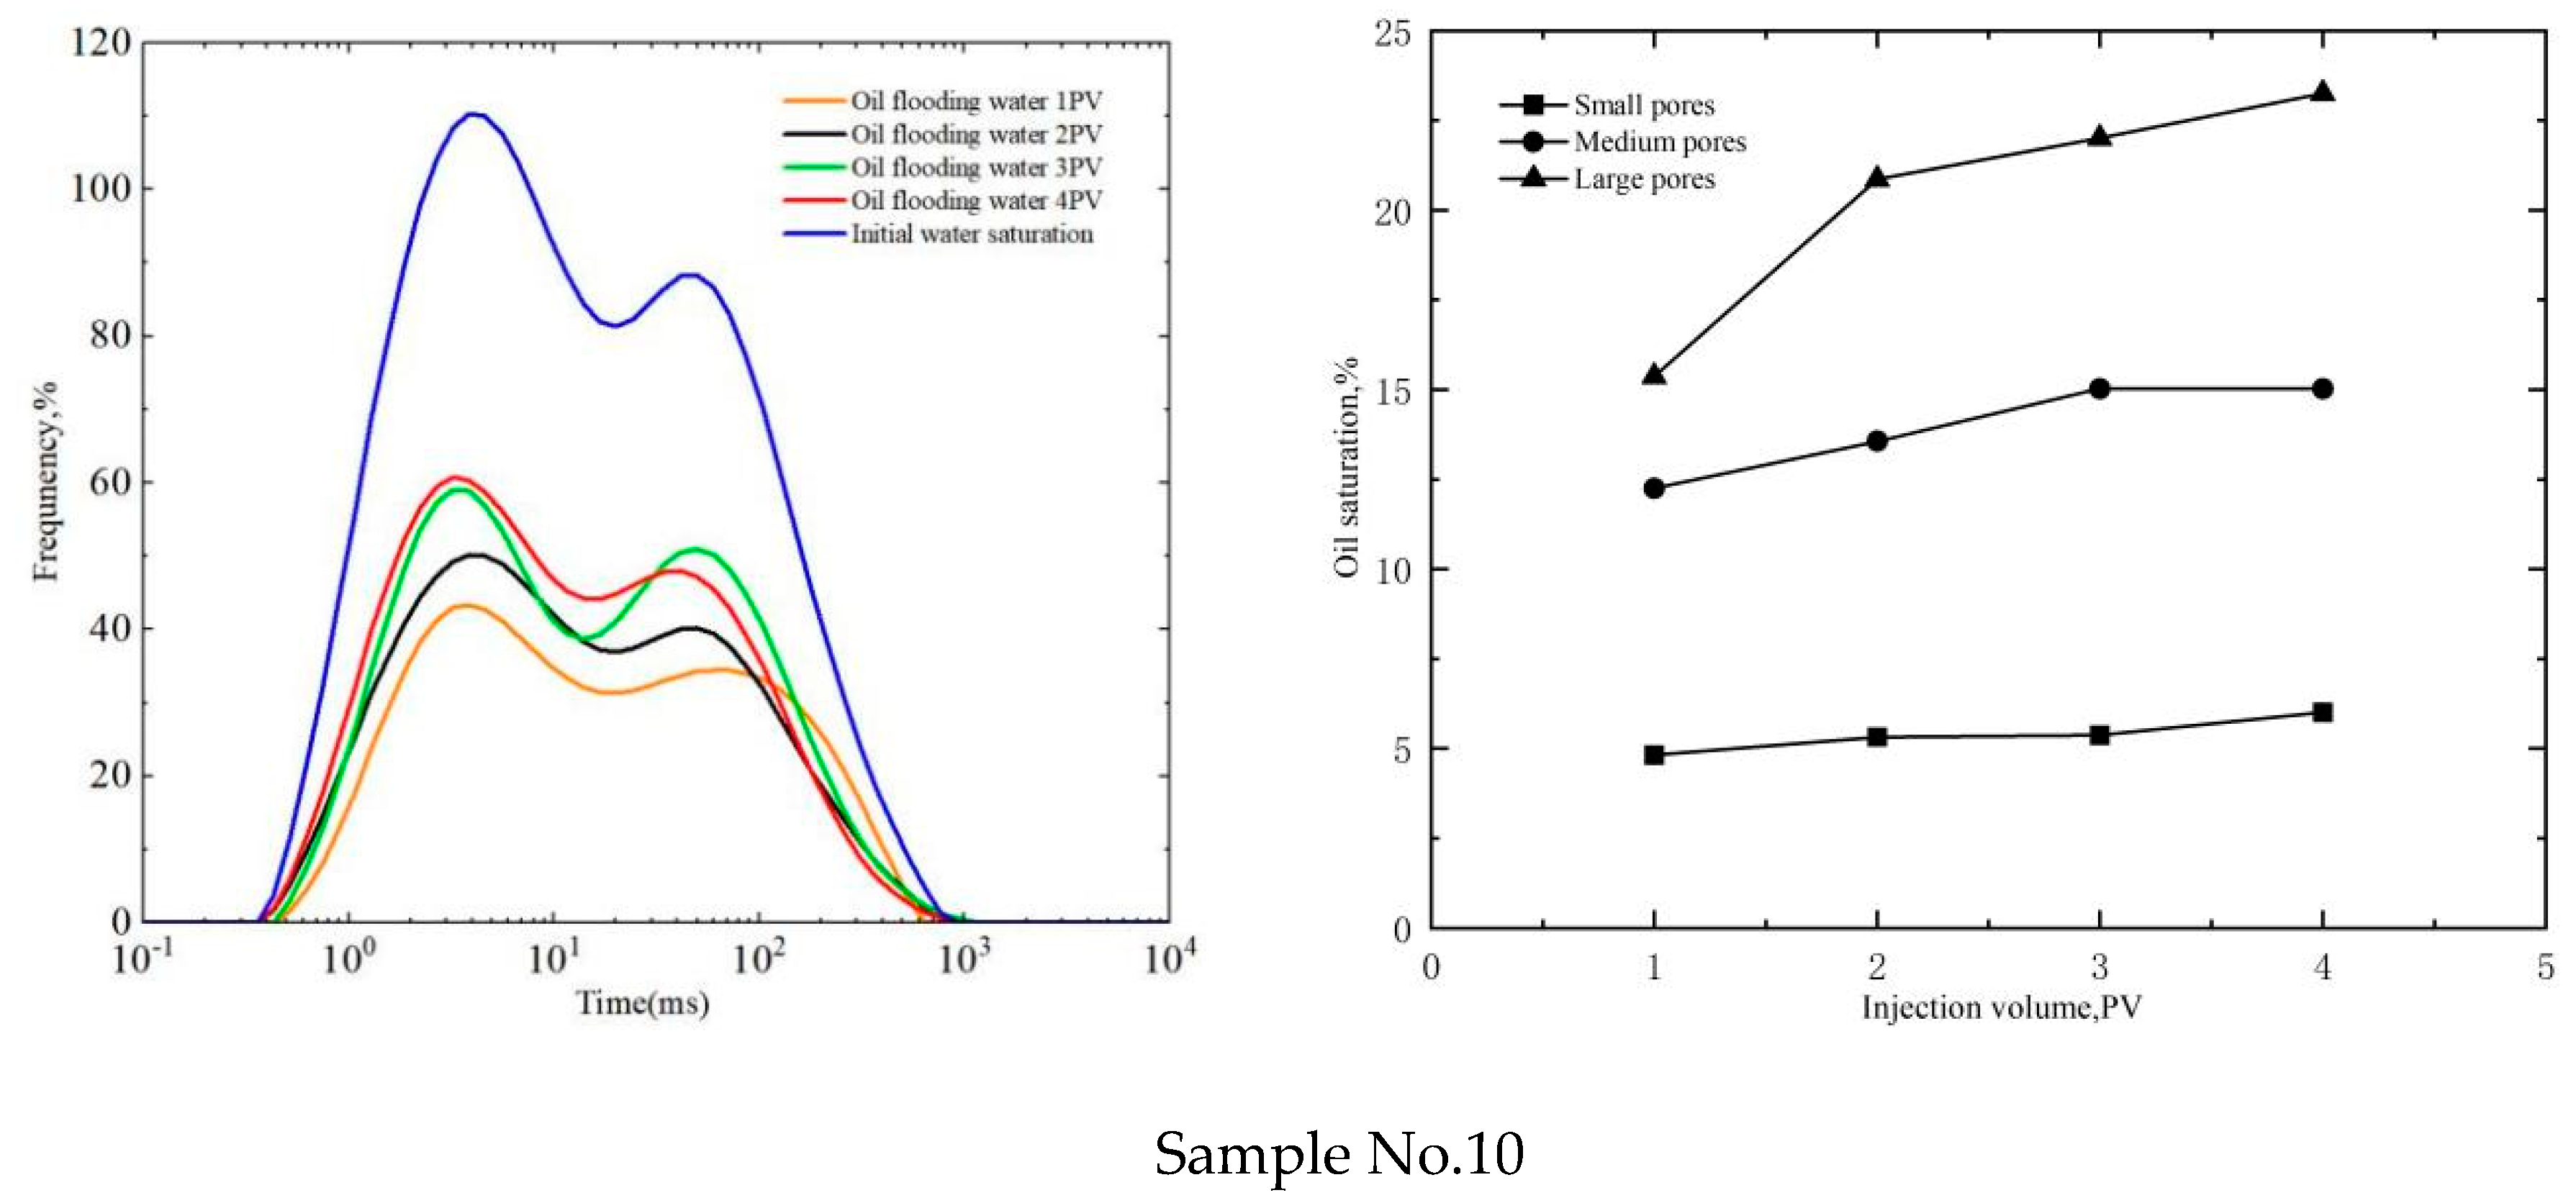
3.3.2. Dynamic Occurrence Distribution of Tight Oil

The NMR T2 value correlates positively with the pore radius. A large T2 value indicates a wide pore radius [45]. Therefore, the range of big, medium, and small pores can be defined on the basis of the relaxation time. The T2 spectrum of the sample is mainly bimodal, which is reflected by high left and low right peak values. The left peak represents small pores, ranging from 0.1 ms to 16 ms. Meanwhile, the right peak represents medium and large pores, ranging from 12 ms to 950 ms.
Then, the curve integral method is used to calculate the corresponding oil saturation of small pores, medium pores and large pores under different displacement states (Equation (2))
S o i = T 2 , t 2 T 2 , t 1 B i , t T 2 , min T 2 , max B i , o
where: Soi oil saturation, %; T2,t1: t1 relaxation time for each pore on the T2 spectral, ms; T2,t2: t2 relaxation time for each pore on the T2 spectral, ms; T2,max: maximum relaxation time for each pore on the T2 spectral curve, ms; T2,min: minimum relaxation time for each pore on the T2 spectral curve, ms; Bi,t: amplitude of T2 spectrum curve at different displacement volume multiples; Bi,0: amplitude of T2 spectrum curve in saturated water formation.
The pores can be categorized into three types based on the T2 spectrum distribution of Type I reservoir for sample Nos. 6 and 8 during the charging process: small pores (0.1 ms < T2 ≤ 16 ms), medium pores (16 ms < T2 ≤ 110 ms), and large pores (>110 ms). Figure 6 shows that the wave peaks corresponding to small and large pores gradually increase as charging quantity rises. This condition indicates that an increasing amount of oil steadily entered the large and small pores until the core reached the saturated oil state with increasing charging volume. The rise in oil content in pores of various diameters is variable when the charging volume is 1 PV. Large and medium pores have higher oil saturation than small pores. This finding proves that oil preferentially enters large and medium pores and then enters micro pores. With the charging progress, the oil content in small pores rises slowly. The content of oil in large and medium pores increases faster than that in small pores. Compared with the two samples, the oil content in the small pore of sample No. 8 increased faster than that of sample No. 6. After flooding, the oil saturation of sample No. 8 (68.01%) was larger than the sample no. 6 (59.84%). This finding can be attributed to the good pore permeability of sample No. 8, the large overall pore volume, the good overall pore connectivity, and the large throat. These conditions facilitate the easy storage of oil and contribute to its abundance.
The pore size range of Type II reservoir representative sample No. 1 is divided into small pores (0.1 ms < T2 ≤ 12 ms), medium pores (12 ms < T2 ≤ 105 ms), and large pores (T2 > 110 ms). Figure 7 shows that the wave crest corresponding to each pore in Type II reservoir increases as oil input rises. The rise in wave crest associated with small pores in Type II reservoir is larger than that associated with large pores when compared to Type I reservoir. The change in oil content in different pore radii under different charging volumes was quantitatively analyzed. Type II reservoirs develop small pores with a large volume proportion, causing more crude oil to enter the small pores. Thus, the oil saturation of the small pores significantly increases. The low content of medium and large pores results in lower oil saturation in large and medium pores than in Type I reservoirs. The sample had a lower ultimate oil saturation (53.16%) than the Type I reservoir (63.94%).
Type III reservoir represents the pore size range of sample No. 10, which is divided into small pores (0.1 ms < T2 ≤ 10 ms), medium pores (10 ms < T2 ≤ 100 ms), and large pores (T2 > 100 ms). As illustrated in Figure 8, an increase in wave peak related to small pores in reservoir Type III is less than that corresponding to large pores. That is, the connectivity between these pores and the pore permeability are both poor despite the substantial small pore content of Type III. These conditions are unfavorable to the flow and presence of oil in the pores. Reservoirs of Type III contain fewer medium and large pores compared with those of types I and II. Low porosity and permeability are the primary reasons of insufficient oil saturation in pores of medium and large sizes.

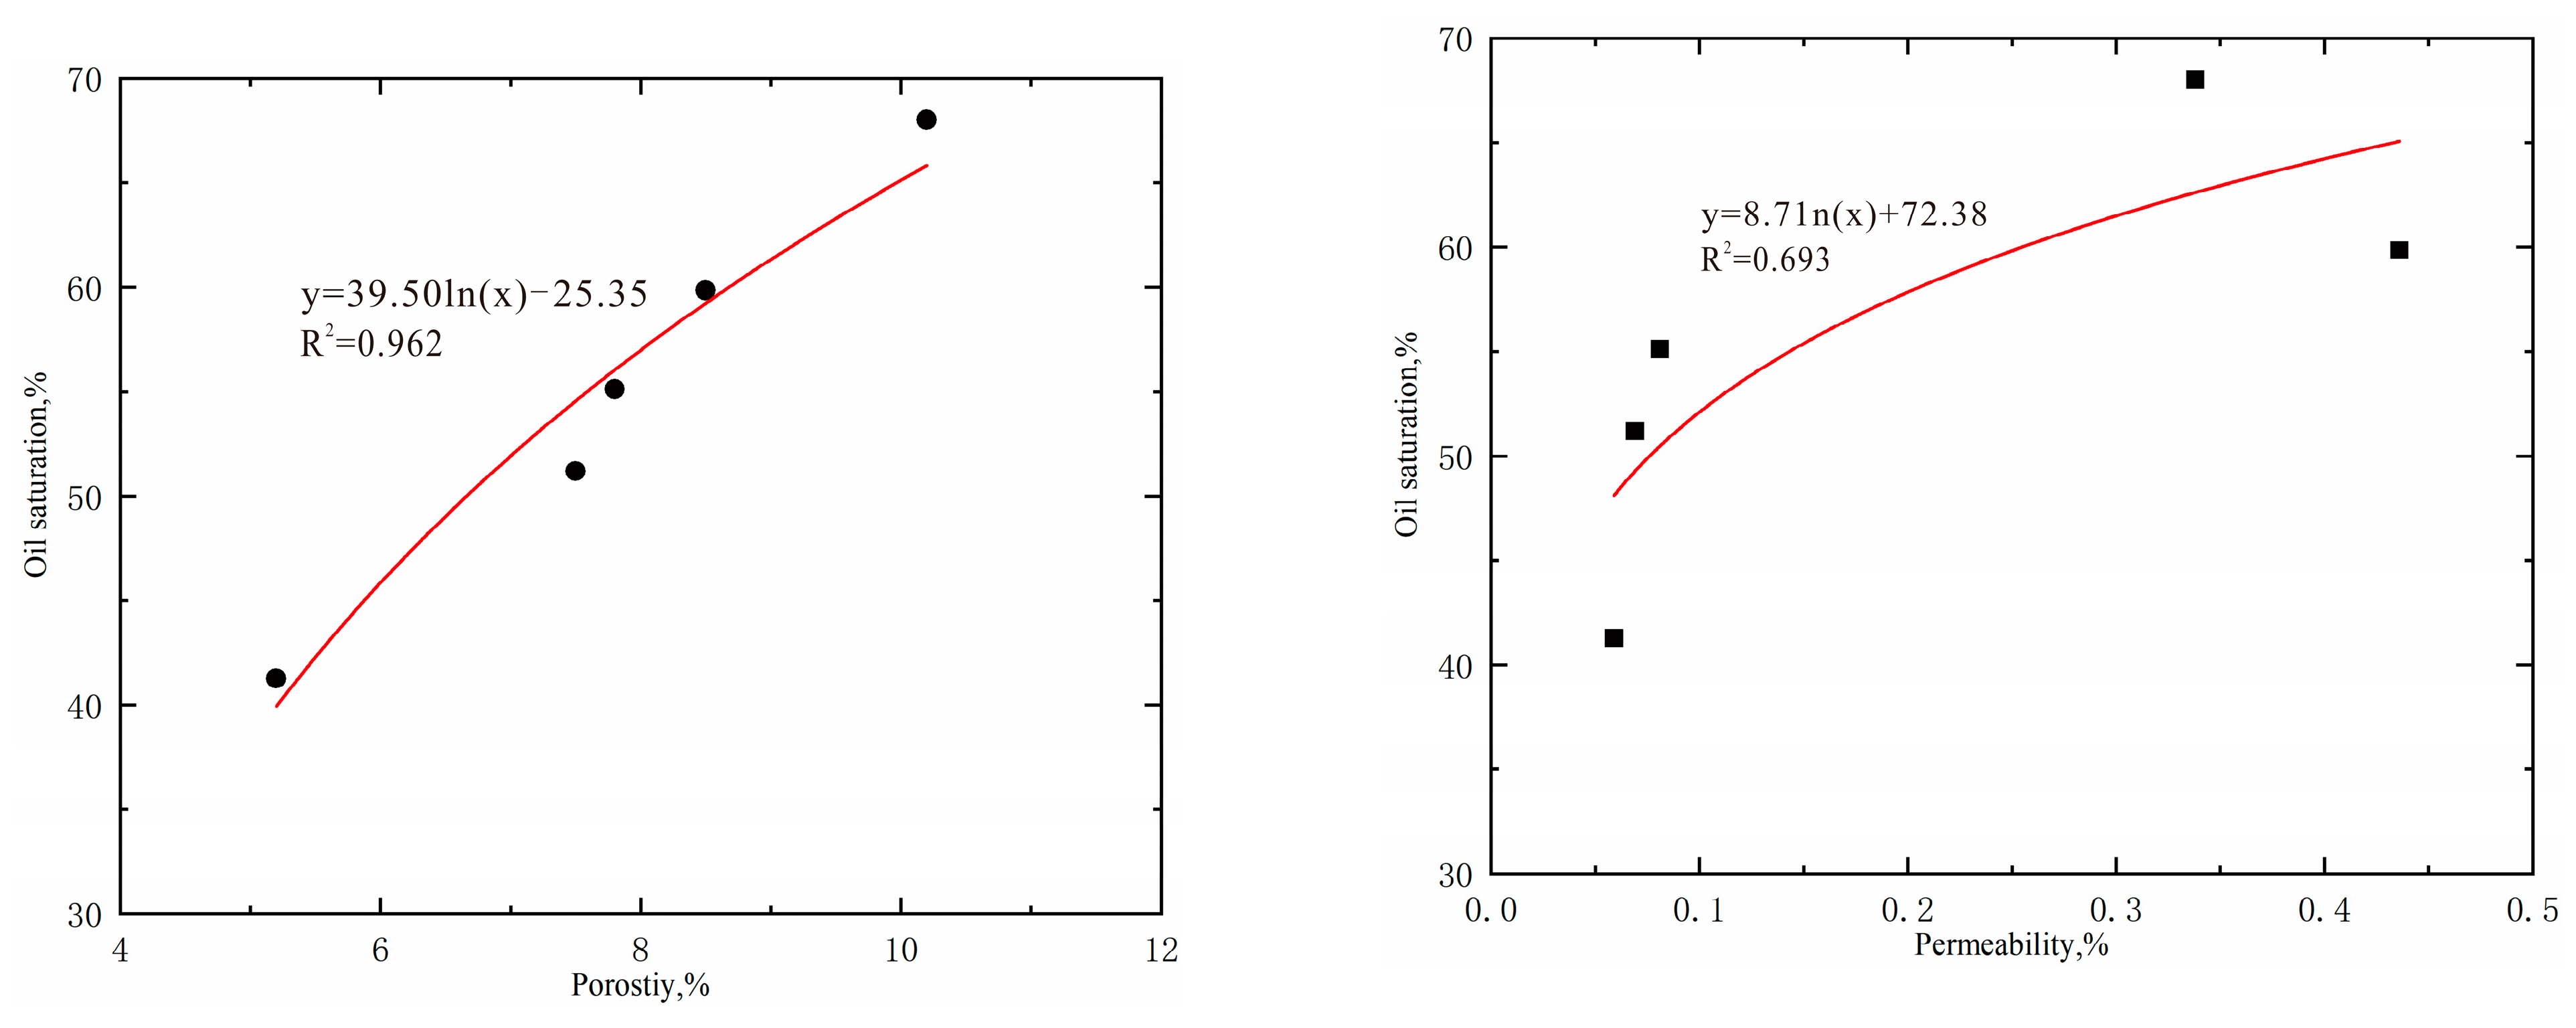
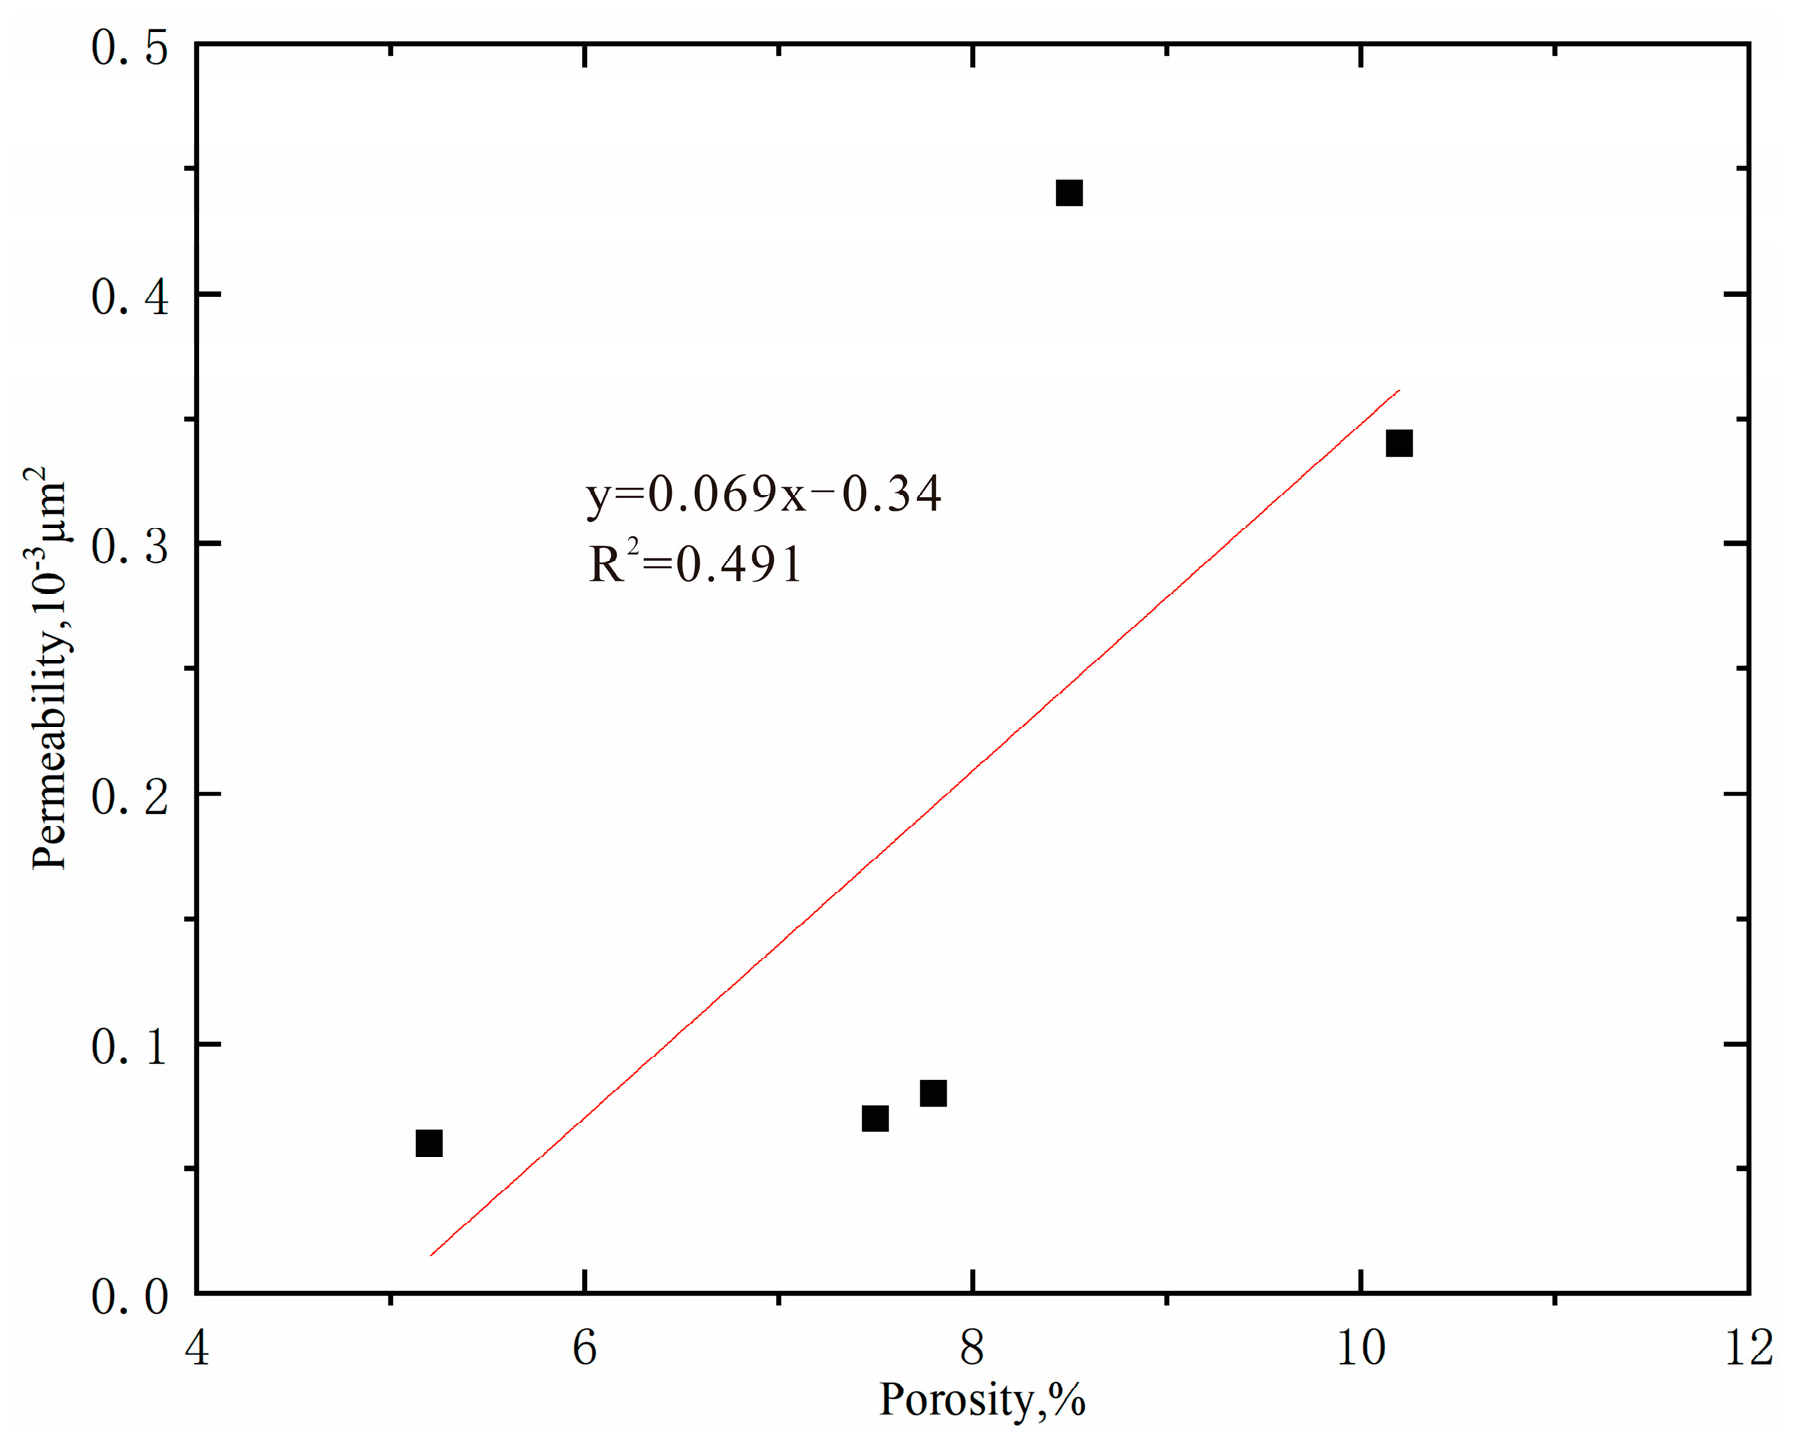
3.4. Influence of Reservoir Physical Properties

After the charging experiment, the correlation analysis between oil saturation and porosity and permeability of five core samples was carried out. Oil saturation is positively correlated with porosity and permeability. It has a stronger positive correlation with porosity (Figure 9). However, the correlation between the porosity and permeability of the samples is not strong (R2 = 0.491) (Figure 10). The permeability mainly affects the flow ability of fluid between rock pores. The higher the permeability, the stronger the flow ability of fluid in the reservoir. Porosity represents the number of pores in the sandstone reservoir. The larger the porosity, the more void content in the reservoir, and the more fluid can be stored. Due to the low permeability of tight sandstone reservoirs, the average permeability of samples in this study was only 0.22 × 10⁻³ µm2. Therefore, porosity plays a greater role in the occurrence of tight oil in tight sandstone reservoirs.

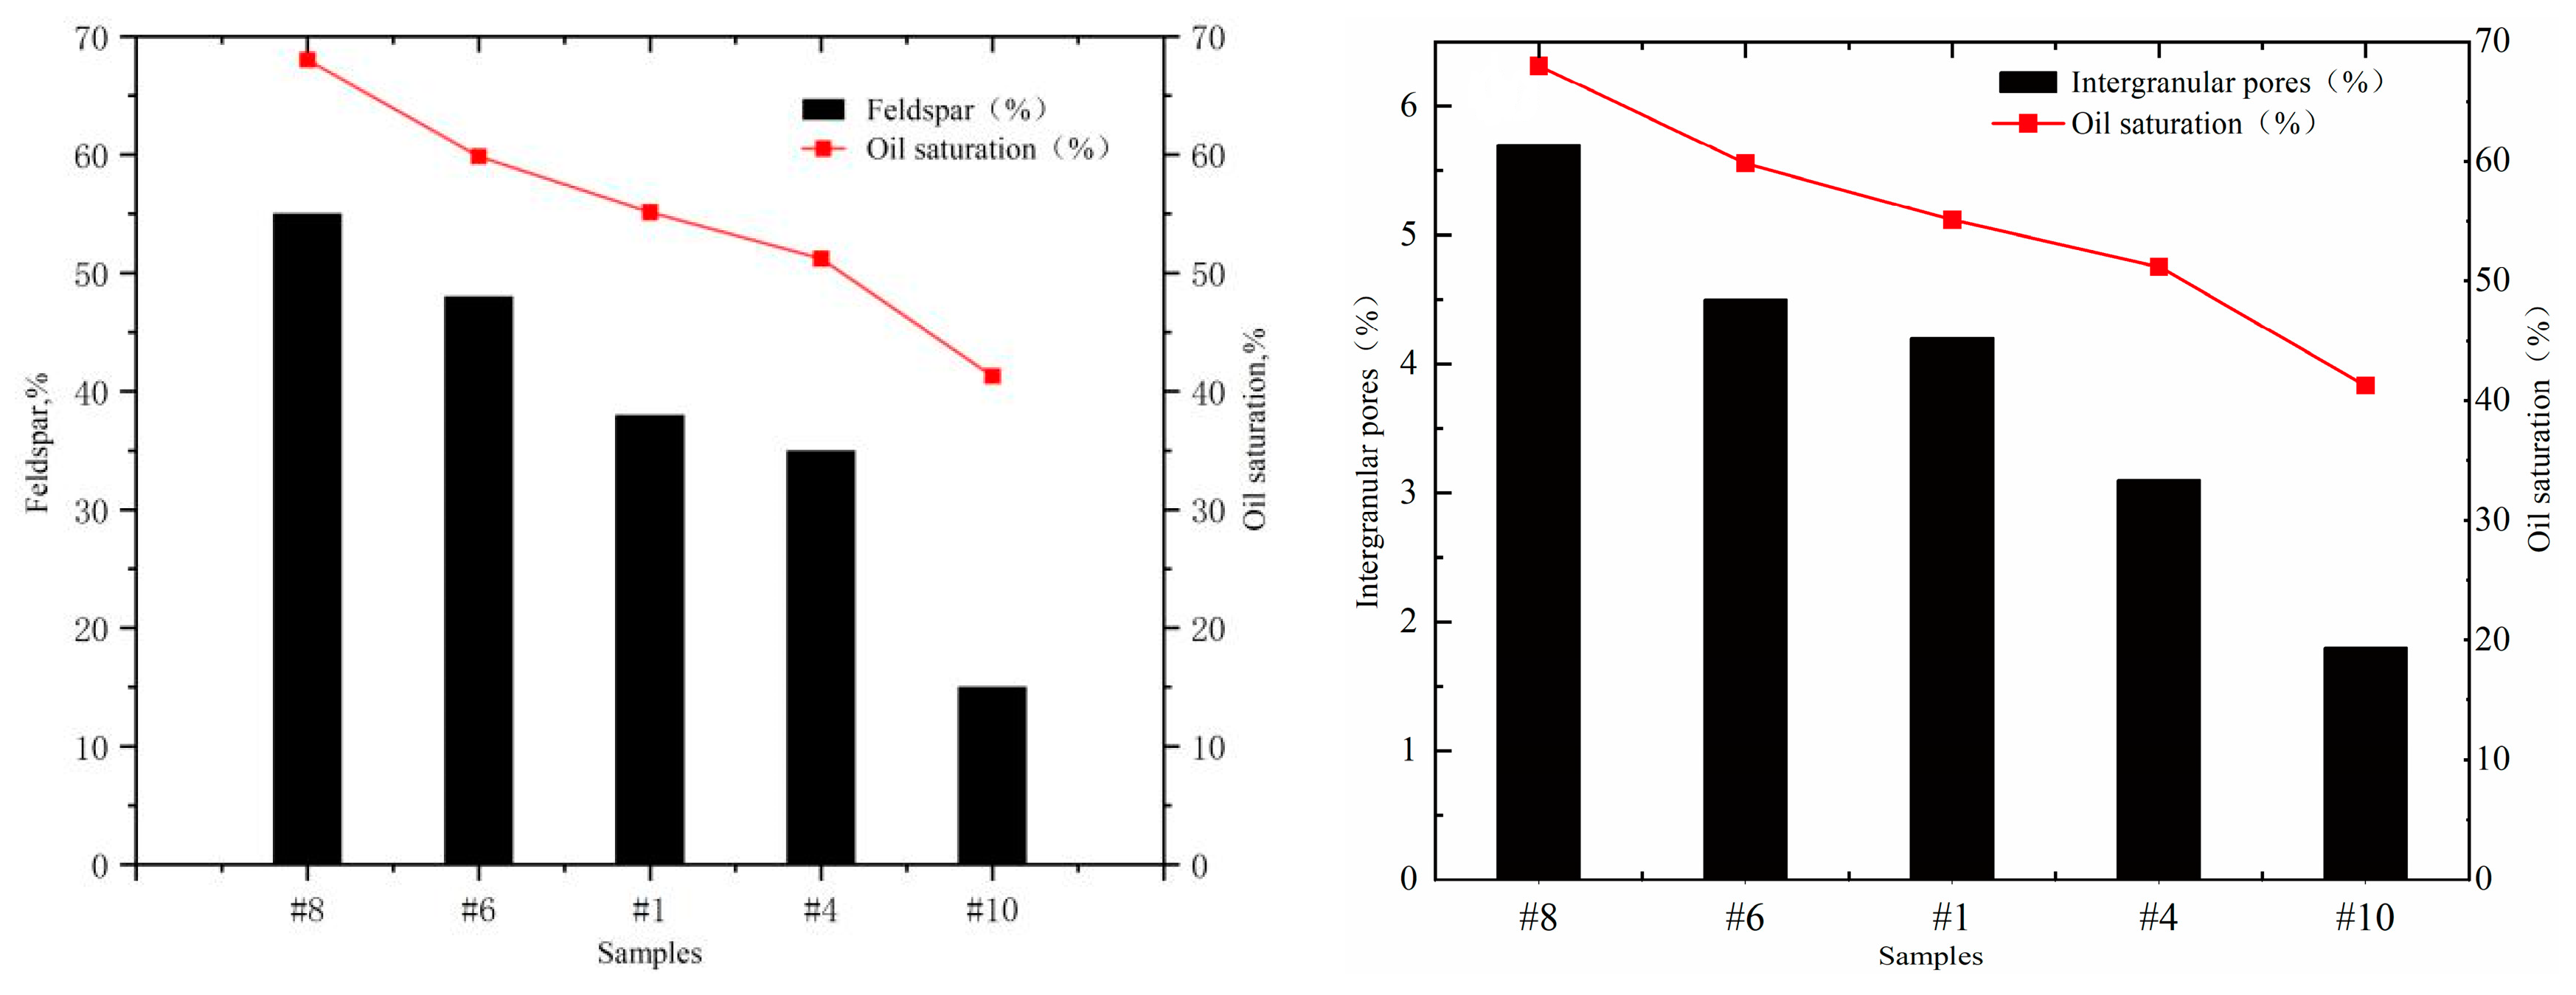
3.5. Influence of Pore Structure

3.5.1. Pore Throat Type

Figure 11 depicts type I and II reservoir representative samples No. 8, 6, 1 and 4 with high intergranular pore content and developed secondary pores, which have a high oil saturation. The absolute content of intergranular pores and feldspar in core 10 of Type III reservoir is only 1.80% and 15.2%, respectively, demonstrating the lowest oil saturation. This phenomenon occurs due to intergranular pores (large reservoir space), which are the optimal pore type for tight sandstone reservoirs. Generally, if the pore connectivity is good and the secondary pores are well developed, then tight oil formation is improved and the amount of tight oil is large. The development of secondary pores can provide more seepage channels and improve the seepage capacity of the reservoir. Feldspar is the most abundant soluble mineral in sandstone reservoirs. Intergranular dissolution, intragranular dissolution, and dissolution expansion pores are generated as a result of the dissolving of feldspar particles, providing space for the occurrence of tight oil. Therefore, the high content of feldspar pores increases the oil saturation.
As shown by the thin cast section and nano-CT scanning (Figure 2 and Figure 3), the highest overall porosity of sample No. 8 is 10.2%, indicating a large pore volume. The total length of the throat is lower than that of sample No. 1. However, the average length and radius of the throat are larger than that of sample No. 1 and the pore connectivity is good. The overall porosity of sample No. 1 is low at only 7.8%, and the pore volume, average throat length, and average radius are small. The pore type of sample No. 8 is mainly intergranular pores, including some feldspar-dissolved pores. Medium pore and macro pore contents are flake throat, including the large throat. The overall pore connectivity is better than that of sample No. 1; therefore, sample No. 8 has the largest tight oil accumulation (68.01%). The lowest porosity of sample No. 10 is 5.2%. The pore type is mainly kaolinite intercrystalline pores, and the pore throat is undeveloped. The relative content of small pores is high, there are almost no large pores, pore–throat connectivity is poor, and there are many small throats. The average radius and length of throat are the smallest at 0.52 and 9.13 μm, respectively, and the oil saturation is the lowest (41.28%).
The occurrence of tight oil is generally closely related to the physical features, pore types, pore throat sizes, and connectivity of the reservoir. The Type I reservoir mostly comprises intergranular and feldspar dissolution pores due to its excellent physical qualities. In addition, the pore development degree is high, the content of large and medium pores is high, and the pore–throat connectivity is superior. Therefore, the tight oil accumulation is large and the occurrence pattern is mainly cluster (Figure 4C,D). The reservoirs of Type II have typical physical characteristics, and the pores are mostly intergranular residual pores. In addition, the reservoirs contain a few primary intergranular and developing pores. Medium and macro pore contents are general; a few small pores exist and the connectivity is universal. Therefore, tight oil accumulation is smaller than that of the Type I reservoirs, and the occurrence pattern is mainly thin film and isolated (Figure 4A,B). The Type III reservoir has the poorest physical features, with micro and intercrystalline pores dominating the pore types. This reservoir has an abundance of small pores with weak pore–throat connection. Consequently, tight oil deposits are minimal.

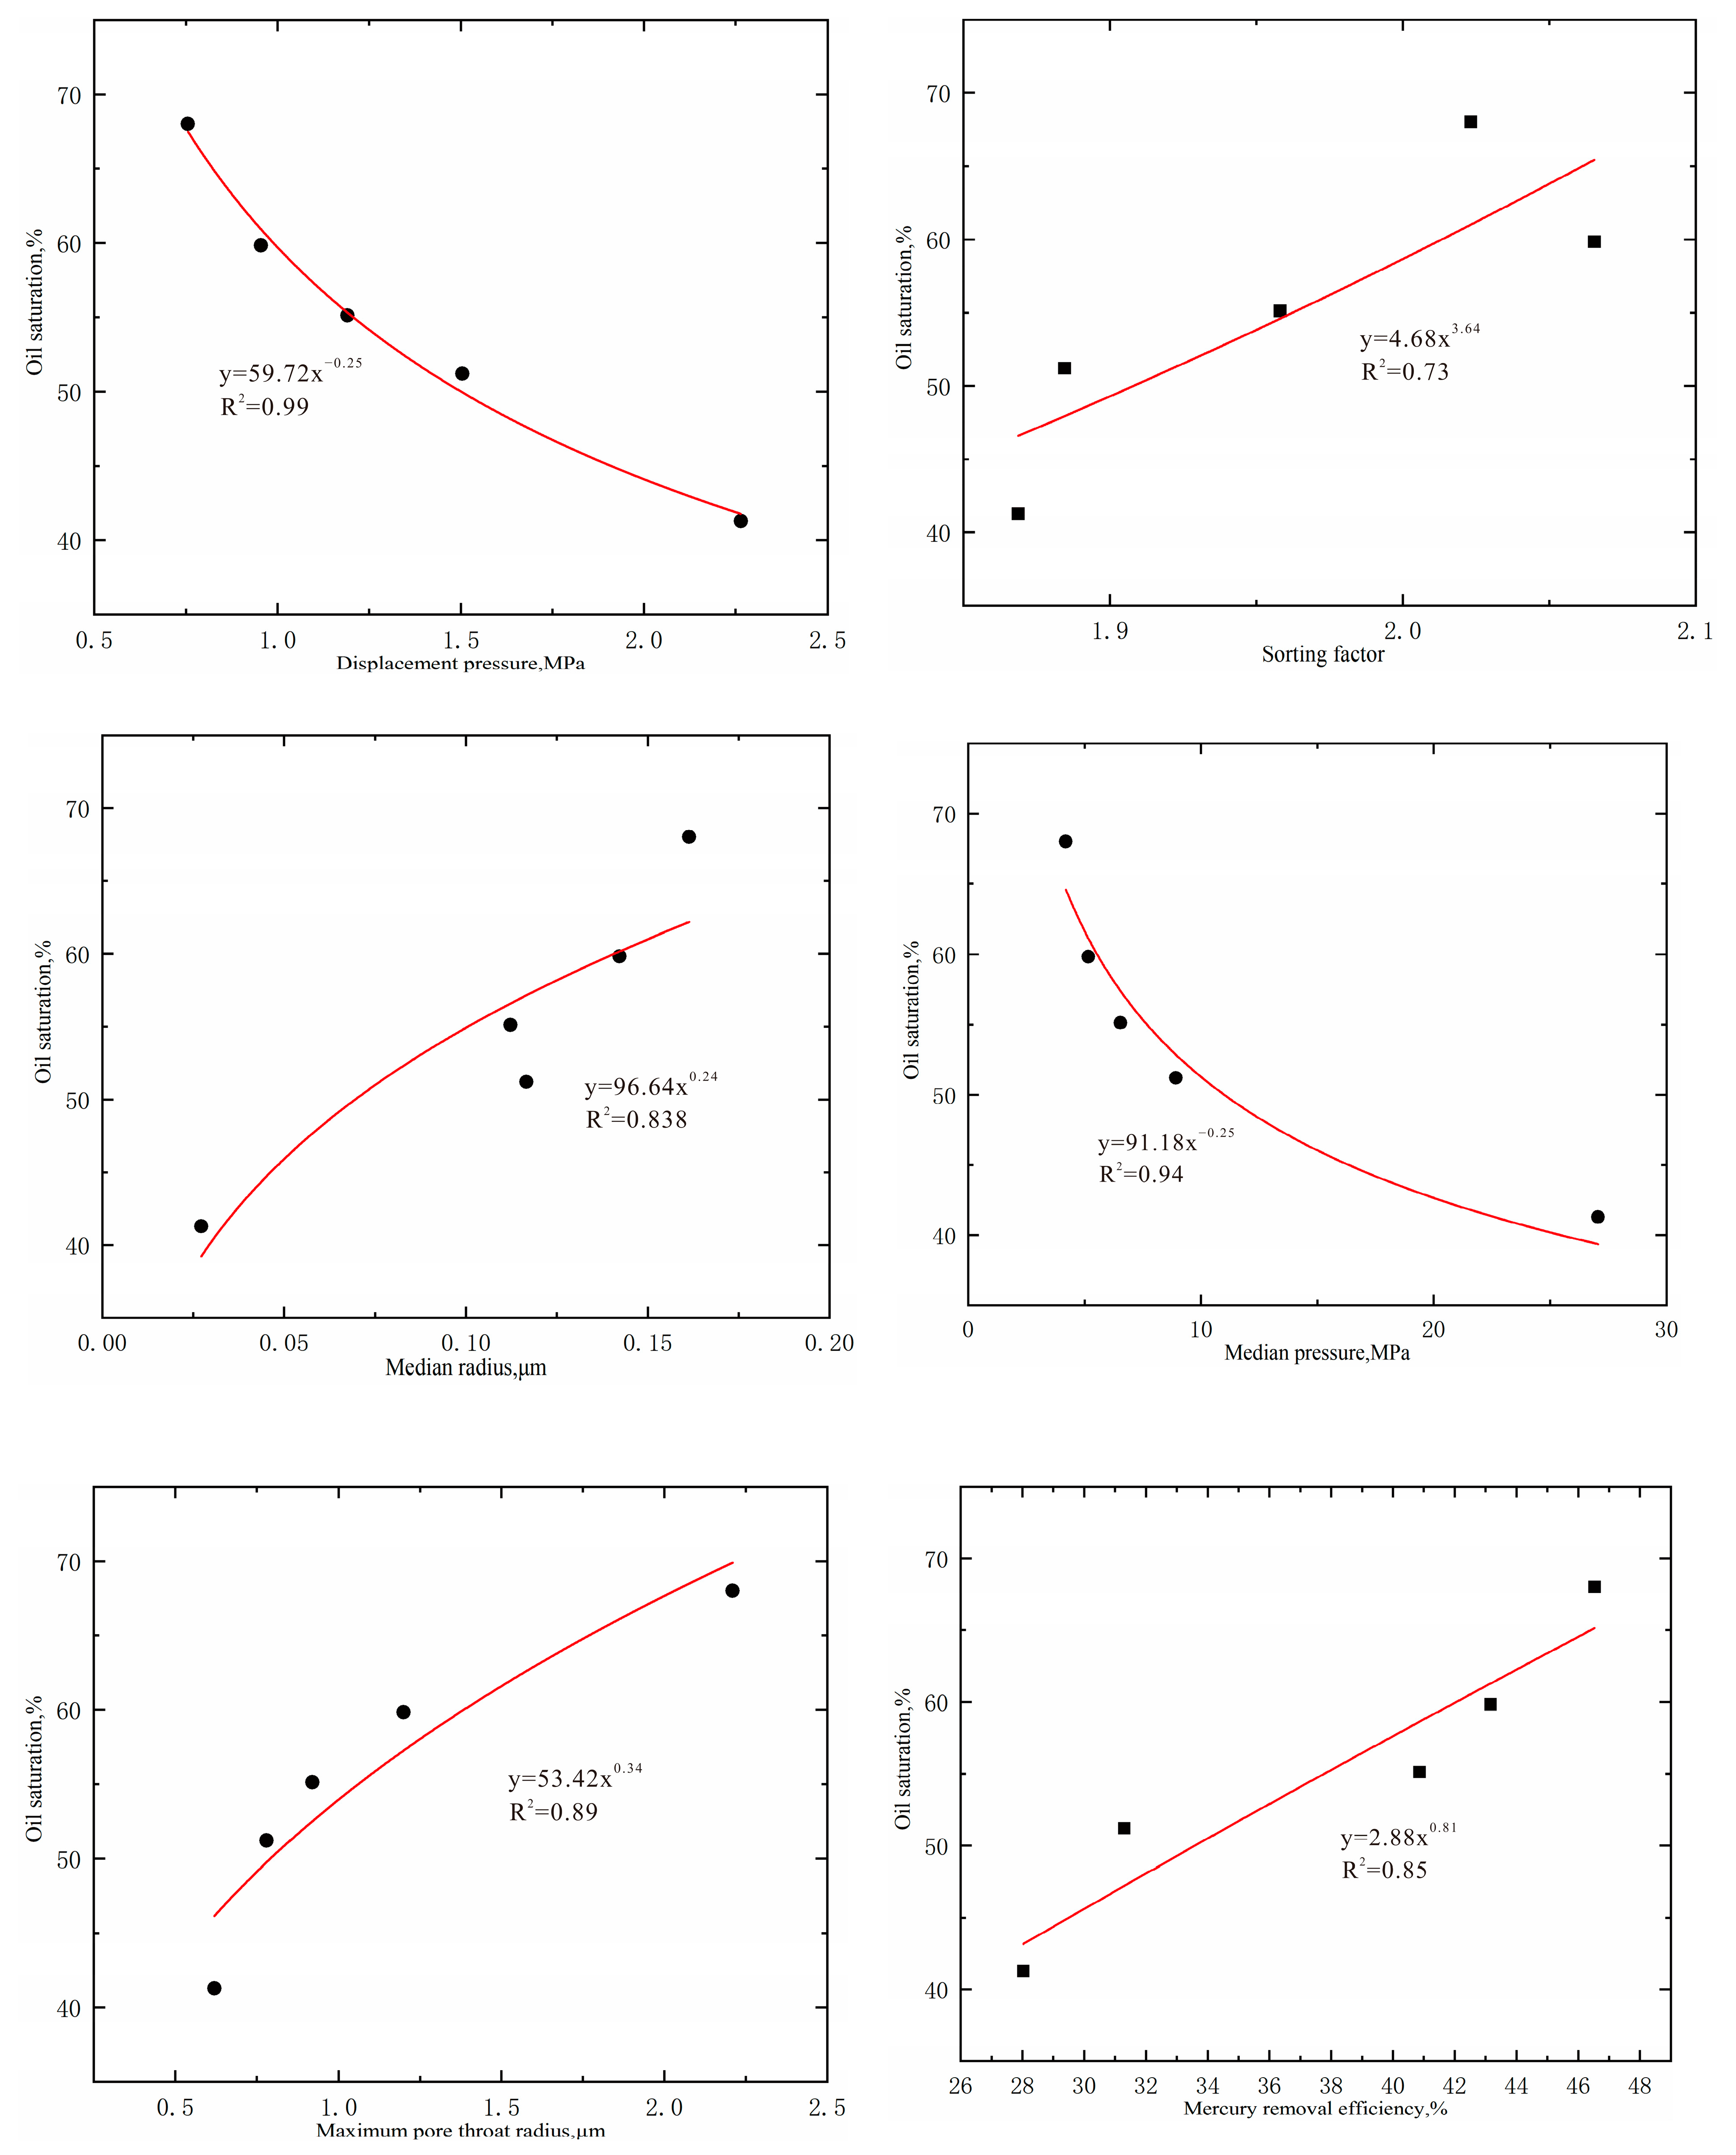
3.5.2. Pore Throat Parameters

As illustrated in Figure 12, oil saturation has a considerable inverse relationship with the median and displacement pressures. The reason is that a small median pressure indicates that the proportion of the large throat in the pore increases as the median radius of the pore throat rises (r50). Therefore, the production capacity is large when the oil percolation capability of the rock is improved. The displacement pressure is the capillary pressure associated with the largest connected pore. Therefore, the reservoir is effective, the displacement pressure is low, and the maximum pore throat radius is large. Therefore, maximum pore throat radius correlates positively with oil saturation. The sorting factor shows the regularity of the distribution of pore throat sizes. A high sorting factor leads to a wide distribution range of pore throats and number of pore throats and a high fluid seepage capacity. The mercury withdrawal efficiency reflects the recovery efficiency of the non-wetted phase. A high efficiency denotes a high non-wetted phase recovery and oil content of the reservoir. Therefore, oil saturation is positively correlated with sorting factor and mercury withdrawal efficiency. Overall, tight oil is associated with the interconnection and classification of pore throats inside the core. Increased connectedness between pores and throats leads to uniform sorting, increased oil saturation, and high tight oil accumulation.

4. Conclusions

Based on reservoir physical parameters and micropore throat structure, Chang 8 tight sandstone reservoir, Jiyuan, can be divided into three categories. Type I reservoir has good physical properties and develops a large number of large pores and medium pores. The pore types include residual intergranular and soluble feldspar pores. The most common form of the throat waiss lamellar, followed by large and medium throats. Type II reservoirs have general physical properties. The small pores in the reservoir are relatively developed, containing medium pores and large pores. Reservoir pores are dominated by residual intergranular holes, feldspar-dissolved pores, a small number of micropores, and a narrow neck throat. Type III reservoirs have poor physical properties. A large number of micro-pores are developed, while medium-pores and large-pores are not developed. The percolation and storage capacity of reservoir fluid are poor, and the heterogeneity of reservoir fluid is strong. The process of tight oil charging can be divided into the following three steps: fast growth, gradual growth, and stability. For the Type I reservoir, oil preferentially enters large and medium pores and then enters micropores. With the charging progress, the oil content in small pores rises slowly. The content of oil in large and medium pores increases faster than that in small pores. Type II reservoirs develop small pores with a large volume proportion, causing more crude oil to enter the small pores. Thus, the oil saturation of the small pores significantly increases. The connectivity and permeability between pores of Type III reservoirs are poor, which is not conducive to the flow and occurrence of crude oil in pores, and the overall oil saturation is low. At the end of charging, the average oil saturation of the Type I reservoir is the highest (63.93%), the Type II reservoir is lower than Type I (53.16%), and the Type III reservoir is the lowest (41.28%). The oil content in medium and large pores is substantially higher than that in small pores. This finding indicates that medium and large porosities are the main distribution areas of tight oil in tight sandstone reservoirs. The occurrence morphology includes oil film, cluster, porous, and isolated.
The occurrence of tight oil is affected by pore type, pore structure parameters, throat parameters, and pore–throat combination. In tight sandstone reservoirs, the more large and medium pores, the better the pore connectivity and the better the occurrence of tight oil. The greater the degree of intergranular pore growth and soluble feldspar pore development, the thicker the throat, the more developed the effective throat, and the greater the quantity of tight oil. Finally, oil saturation was shown to be inversely linked to median and displacement pressures. On the contrary, oil saturation was positively connected with maximum pore throat radius, mercury withdrawal efficiency, median radius, and separation factor.
With the deterioration of reservoir pore structure, tight oil reserves are decreasing. For Type I and Type II reservoirs with good pore structure, medium pores, and large pores, tight oil reserves are large and their shape is good. Therefore, the key to enhancing oil recovery in tight sandstone reservoirs is to prioritize the use of oil from medium and large pores in Type I and Type II reservoirs.

Author Contributions

X.S.: Investigation, Formal analysis, Conceptualization, Data Curation, Writing—Original Draft; H.G.: Writing—Review and Editing, Supervision, Funding acquisition, Methodology; C.F.: Writing—Review and Editing, Supervision, Funding acquisition, Methodology; P.Y. Investigation, Resources, Data Curation; C.W.: Supervision, Writing—Review and Editing, Project administration; T.L.: Supervision, Writing—Review and Editing, Project administration. All authors have read and agreed to the published version of the manuscript.

Funding

This research was sponsored by the National Natural Science Foundation of China (No. 52174030, No. 52004222), PetroChina Innovation Foundation (No. 2020D-5007-0205), Scientific Research Program Funded by Shaanxi Provincial Education Department (Program 22JY054), Key Research and Development Program of Shaanxi Province (Grant No. 2022GY-137), Key Scientific Research Project of Education Department of Shaanxi Province (Grant No. 21JP095), and the Youth Innovation Team of Shaanxi Universities.

Institutional Review Board Statement

Not applicable.

Informed Consent Statement

Not applicable.

Data Availability Statement

Not applicable.

Conflicts of Interest

The authors declare no conflict of interest.

References

  1. Zhou, N.; Lu, S.; Wang, M.; Huang, W.; Xiao, D.; Jiao, C.; Wang, J.; Tian, W.; Zhou, L.; Chen, F.; et al. Limits and grading evaluation criteria of tight oil reservoirs in typical continental basins of China. Pet. Explor. Dev. 2021, 48, 1089–1100. [Google Scholar] [CrossRef]
  2. Zhao, W.; Hu, S.; Hou, L.; Yang, T.; Li, X.; Guo, B.; Yang, Z. Types and resource potential of continental shale oil in China and its boundary with tight oil. Pet. Explor. Dev. Online 2020, 47, 1–11. [Google Scholar] [CrossRef]
  3. Sun, L.; Zou, C.; Jia, A.; Wei, Y.; Zhu, R.; Wu, S.; Guo, Z. Development characteristics and orientation of tight oil and gas in China. Pet. Explor. Dev. Online 2019, 46, 1073–1087. [Google Scholar] [CrossRef]
  4. Xiang, F.; Zhi, Y.; Weipeng, Y.; Xuguang, G.; Yanxiong, W.; Juntian, L. Classification evaluation criteria and exploration potential of tight oil resources in key basins of China. J. Nat. Gas Geosci. 2019, 4, 309–319. [Google Scholar]
  5. Wang, S.; Yu, Y.; Guo, Q.; Wang, S.; Wu, X. New advances in the assessment of tight oil resource in China. Pet. Res. 2017, 2, 1–12. [Google Scholar] [CrossRef]
  6. Shen, A.; Liu, Y.; Wang, X.; Cai, B.; He, C.; Liang, S. The geological characteristics and exploration of continental tight oil: An investigation in China. J. Pet. Explor. Prod. Technol. 2018, 9, 1651–1658. [Google Scholar] [CrossRef] [Green Version]
  7. Hughes, J.D. Energy: A reality check on the shale revolution. Nature 2013, 494, 307–308. [Google Scholar] [CrossRef]
  8. Dong, Z.; Holditch, S.; McVay, D.; Ayers, W. Global Unconventional Gas Resource Assessment. SPE Econ. Manag. 2012, 4, 222–234. [Google Scholar] [CrossRef]
  9. Zhang, G.; Feng, C.; Yao, X. Petroleum Geology in Deepwater Settings in a Passive Continental Margin of a Marginal Sea: A Case Study from the South China Sea. Acta Geol. Sin. (Engl. Ed.) 2021, 95, 1–20. [Google Scholar] [CrossRef]
  10. Wang, C.; Liu, Y.; Du, Y.; Gao, Y.; Sun, Y. Heavy-Oil Recovery by Combined Geothermal Energy and Cosolvent/Water Flooding. Energy 2021, 228, 120681. [Google Scholar] [CrossRef]
  11. Wang, J.; Wu, S.; Li, Q.; Guo, Q. An investigation into pore structure fractal characteristics in tight oil reservoirs: A case study of the Triassic tight sandstone with ultra-low permeability in the Ordos Basin, China. Arab. J. Geosci. 2020, 13, 961. [Google Scholar] [CrossRef]
  12. Gao, H.; Cao, J.; Wang, C.; He, M.; Dou, L.; Huang, X.; Li, T. Comprehensive characterization of pore and throat system for tight sandstone reservoirs and associated permeability determination method using SEM, ratecontrolled mercury and high pressure mercury. J. Pet. Sci. Eng. 2018, 174, 514–524. [Google Scholar] [CrossRef]
  13. Li, H.; Liu, X.; Yang, Z.; Guo, H.; Zeng, Q.; Meng, L.; Qin, F. Quantitative analysis method of oil occurrences in tight reservoir. Energy Rep. 2020, 6, 1067–1072. [Google Scholar] [CrossRef]
  14. Tang, Y.; Lei, J.; Dong, H.; Tan, S.; Ma, D.; Zhang, N.; Wang, M. Study on Pore Structure and the Microscopic Mechanism of the Difference in Petrophysical Properties of Tight Sandstone: A Case Study of the Chang 3 Member of Weibei Oilfield, Ordos Basin. Front. Earth Sci. 2022, 10, 457. [Google Scholar] [CrossRef]
  15. Zhao, X.; Yang, Z.; Zhou, S.; Luo, Y.; Liu, X.; Zhang, Y.; Lin, W.; Xiao, Q.; Niu, Z. Research on Characterization and Heterogeneity of Microscopic Pore Throat Structures in Tight Oil Reservoirs. ACS Omega 2021, 6, 24672–24682. [Google Scholar] [CrossRef]
  16. Liu, T.; Xiong, S.; Yu, J.; He, Y.; Song, P.; Chu, S.; Lin, W.; Hou, H. Study on the micro pore structures of the four different kinds of lithological reservoirs in the basin of Western China. J. Pet. Explor. Prod. 2021, 11, 1139–1153. [Google Scholar]
  17. Yin, S.; Dong, L.; Yang, X.; Wang, R. Experimental investigation of the petrophysical properties, minerals, elements and pore structures in tight sandstones. J. Nat. Gas Sci. Eng. 2020, 76, 103189. [Google Scholar] [CrossRef]
  18. Wang, J.; Cao, Y.; Liu, K.; Gao, Y.; Qin, Z. Fractal characteristics of the pore structures of fine-grained, mixed sedimentary rocks from the Jimsar Sag, Junggar Basin: Implications for lacustrine tight oil accumulations. J. Pet. Sci. Eng. 2019, 182, 106363. [Google Scholar] [CrossRef]
  19. Dou, L.; Xiao, Y.; Gao, H.; Wang, R.; Liu, C.; Sun, H. The study of enhanced displacement efficiency in tight sandstone from the combination of spontaneous and dynamic imbibition. J. Pet. Sci. Eng. 2021, 199, 108327. [Google Scholar] [CrossRef]
  20. Gao, H.; Li, T.; Yang, L. Quantitative determination of pore and throat parameters in tight oil reservoir using constant rate mercury intrusion technique. J. Pet. Explor. Prod. Technol. 2016, 6, 309–318. [Google Scholar] [CrossRef] [Green Version]
  21. Feng, C.; Yao, X.; Yang, H. Source-sink System and Sedimentary Model of Progradational Fan Delta Controlled by Restricted Ancient Gully: An Example in the Enping Formation in the Southern Baiyun Sag, Pearl River Mouth Basin, Northern South China Sea. Acta Geol. Sin. (Engl. Ed.) 2021, 95, 232–247. [Google Scholar] [CrossRef]
  22. Bai, B.; Zhu, R.; Wu, S.; Yang, W.; Jeff, G.; Allen, G.; Zhang, X.; Su, L. Using multi-scale CT imaging to characterize the micro-pore structure of tight sandstone. Pet. Explor. Dev. 2013, 40, 329–333. [Google Scholar] [CrossRef]
  23. Wang, M.; Zhang, S.; Zhang, F.; Liu, Y.; Guan, H.; Li, J.; Shao, L.; Yang, S.; She, Y. Quantitative study on the microscopic occurrence of tight oil in the Chang 7 member of Yanchang Formation in Ordos Basin. Pet. Explor. Dev. 2015, 42, 757–762. [Google Scholar] [CrossRef]
  24. Yan, L.; Ran, Q.; Gao, Y.; Chen, F.; Wang, S. Occurrence form and applicability evaluation of tight oil in Lucaogou Formation, Xinjiang. Reserv. Eval. Dev. 2017, 7, 20–25+33. [Google Scholar]
  25. Peng, J.; Qiu, Q.; Wang, D.; Li, Z.; Zhu, J.; Liang, S.; Wu, Y. Occurrence and availability of tight oil in the Funing Formation of Paleogene in Subei Basin. Pet. Geol. Exp. 2020, 42, 53–59. [Google Scholar]
  26. Wen, H.; Li, T.; Wang, M. Characteristics of Nanoscale Pore of Tight Sand Reservoir and Its Relation to Hydrocarbon Occurrence. J. Nanosci. Nanotechnol. 2017, 17, 6997–7002. [Google Scholar] [CrossRef]
  27. Sun, Z.; Wang, F.; Han, Y.; Hou, Y.; He, S.; Luo, J.; Zheng, Y.; Wu, S. Multi-scale characterization of the occurrence space of inter-salt movable shale oil in the Paleogene Qianjiang Formation of Qianjiang Sag, Jianghan Basin. Pet. Geol. Exp. 2020, 42, 586–595. [Google Scholar]
  28. Li, C.; Chen, G.; Li, X.; Zhou, Q.; Sun, Z. The occurrence of tight oil in the Chang 8 lacustrine sandstone of the Huaqing area, Ordos Basin, China: Insights into the content of adsorbed oil and its controlling factors. J. Nat. Gas Geosci. 2022, 7, 27–37. [Google Scholar] [CrossRef]
  29. Gong, Y.; Liu, K. Pore throat size distribution and oiliness of tight sands-A case study of the Southern Songliao Basin, China. J. Pet. Sci. Eng. 2020, 184, 106508. [Google Scholar] [CrossRef]
  30. Liu, Y.; Dong, X.; Chen, Z.; Hou, Y.; Luo, Q.; Chen, Y. A novel experimental investigation on the occurrence state of fluids in microscale pores of tight reservoirs. J. Pet. Sci. Eng. 2021, 196, 107656. [Google Scholar] [CrossRef]
  31. Jia, N.; Wang, Z.; Jiang, Q.; Yang, L.; He, L.; Liu, X.; Jin, X.; Li, T.; Cheng, L. Study on Influencing Factors of Microscopic Occurrence of Tight Oil in Nanoscale Pore Throat. J. Nanosci. Nanotechnol. 2020, 20, 2223–2230. [Google Scholar]
  32. Li, H.; Guo, H.; Yang, Z.; Wang, X. Tight oil occurrence space of Triassic Chang 7 Member in Northern Shaanxi Area, Ordos Basin, NW China. Pet. Explor. Dev. 2015, 42, 434–438. [Google Scholar] [CrossRef]
  33. Wang, W.; Li, Y.; Chen, X. Microscope dynamic characterization of oil charging in tight sandstone using a physical simulation experiment. J. Pet. Sci. Eng. 2021, 200, 108379. [Google Scholar] [CrossRef]
  34. Li, C.; Liu, G.; Cao, Z.; Sun, M.; You, Y.; Liu, N. Oil charging pore throat threshold and accumulation effectiveness of tight sandstone reservoir using the physical simulation experiments combined with NMR. J. Pet. Sci. Eng. 2022, 208, 109338. [Google Scholar] [CrossRef]
  35. Liu, Y.; Ye, J.; Zong, J.; Wang, D.; Cao, Q.; Yang, B.; Li, W.; Zhao, J. Analysis of forces during tight oil charging and implications for the oiliness of the tight reservoir: A case study of the third member of the Palaeogene Shahejie Formation, Qibei slope, Qikou sag. Mar. Pet. Geol. 2022, 144, 105819. [Google Scholar] [CrossRef]
  36. Feng, X.; Zeng, J.; Tao, S.; Yang, J.; Feng, S.; Pang, Z. Oil-Charging Pore-Throat Radius Threshold of Tight Reservoirs: A Comparison on Multi-Method Calculation Results. J. Nanosci. Nanotechnol. 2017, 17, 6067–6076. [Google Scholar] [CrossRef]
  37. Zheng, M.; Li, J.; Wu, X.; Li, P.; Wang, W.; Wang, S.; Xie, H. Physical modeling of oil charging in tight reservoirs: A case study of Permian Lucaogou Formation in Jimsar Sag, Junggar Basin, NW China. Pet. Explor. Dev. 2016, 43, 241–250. [Google Scholar] [CrossRef]
  38. Xi, K.; Cao, Y.; Haile, B.G.; Zhu, R.; Jahren, J.; Bjorlykke, K.; Zhang, X.; Hellevang, H. How does the pore-throat size control the reservoir quality and oiliness of tight sandstones? The case of the Lower Cretaceous Quantou Formation in the southern Songliao Basin, China. Mar. Pet. Geol. 2016, 76, 1–15. [Google Scholar] [CrossRef]
  39. Zeng, J.; Feng, X.; Zhang, Y.; Qiao, J.; Yang, Z. Influence of Tight Sandstone Micro-Nano Pore-Throat Structures on Petroleum Accumulation: Evidence from Experimental Simulation Combining X-ray Tomography. J. Nanosci. Nanotechnol. 2017, 17, 6459–6469. [Google Scholar] [CrossRef]
  40. Nelson, P.H. Pore-throat sizes in sandstones, tight sandstones, and shales. AAPG Bull. 2009, 93, 329–340. [Google Scholar] [CrossRef]
  41. Akbarabadi, M.; Saraji, S.; Piri, M.; Georgi, D.; Delshad, M. Nano-scale experimental investigation of in-situ wettability and spontaneous imbibition in ultra-tight reservoir rocks. Adv. Water Resour. 2017, 107, 160–179. [Google Scholar] [CrossRef]
  42. Liu, Z.; Li, W.; Li, J.; Wang, W.; Fu, G. Characteristics of Tight Oil Reservoir Based on Nano-CT. Adv. Mater. Sci. Eng. 2022, 2022, 7863047. [Google Scholar] [CrossRef]
  43. Jussiani, E.I.; Dos Reis, P.J.; Appoloni, C.R. Determining chemical composition of materials through micro-CT images. Micron 2016, 89, 9–15. [Google Scholar] [CrossRef]
  44. Zhang, Y.; Zeng, J.; Dai, Z.; Viswanathan, H.; Xiao, T.; Ma, Y.; Feng, X. Experimental investigation on oil migration and accumulation in tight sandstones. J. Pet. Sci. Eng. 2018, 160, 267–275. [Google Scholar] [CrossRef]
  45. Wang, C.; Gao, H.; Gao, Y.; Fan, H. Influence of Pressure on Spontaneous Imbibition in Tight Sandstone Reservoirs. Energy Fuels 2020, 34, 9275–9282. [Google Scholar] [CrossRef]
Figure 1. Crude oil charging physical simulation experimental device.
Processes 11 01127 g001
Figure 2. (A) Kaolinite intercrystalline pores (Sample No. 10); (B) Feldspar dissolved pore, locally developed quartz (Sample No. 8); (C) Intergranular pore, locally developed quartz (Sample No. 4); (D) Rock fragment dissolution pores (Sample No. 6); (E) Shrunken neck throat (Sample No. 1); (F) lamellar throat (Sample No. 7). Typical pore and throat types of Chang 8 reservoir.
Processes 11 01127 g002
Figure 3. (A) Top view of pore distribution (Sample No. 1); (B) Three-dimensional structure model of throats (Sample No. 1); (C) Top view of pore distribution (Sample No. 8); (D) Three-dimensional structure model of throats (Sample No. 8); (E) Top view of pore distribution (Sample No. 10); (F) Three-dimensional structure model of throats (Sample No. 10); Sample Nano-CT scanning image.
Processes 11 01127 g003
Figure 4. (A) Residual oil in 2D sections (Sample No. 1); (B) 3D of residual oil distribution (Sample No. 1); (C) Residual oil in 2D sections (Sample No. 8); (D) 3D of residual oil distribution (Sample No.8). Nano-CT scanning results of samples.
Processes 11 01127 g004
Figure 5. Relation between charging volume and oil saturation, increment in oil saturation.
Processes 11 01127 g005
Figure 6. T2 spectrum distribution of representative cores (Nos. 6 and 8) of Type I in the charging process and changes in oil saturation in different pores.
Processes 11 01127 g006
Figure 7. T2 spectrum distribution of representative cores (No. 1) of Type II in the charging process and changes in oil saturation in different pores.
Processes 11 01127 g007
Figure 8. T2 spectrum distribution of representative cores of Type III in the charging process and changes in oil saturation in different pores.
Processes 11 01127 g008
Figure 9. Relation between oil saturation and reservoir porosity, permeability.
Processes 11 01127 g009
Figure 10. Relation between porosity and permeability.
Processes 11 01127 g010
Figure 11. Relation between oil saturation and feldspar content, intergranular pore content.
Processes 11 01127 g011
Figure 12. Relationship between oil saturation and displacement pressure, sorting factor, median radius, median pressure, maximum pore throat radius, and mercury removal efficiency.
Processes 11 01127 g012
Table 1. Information of Experimental Samples.
Core NumberDiameter (cm)Length (cm)Porosity (%)Permeability (10−3 µm2)Lithology
12.495.107.800.08Medium–fine-grained feldspar sandstone
22.505.005.500.03Fine-grained feldspar sandstone, rich in mica
32.505.104.800.04Fine-grained feldspar sandstone, rich in mica
42.505.107.500.07Medium–fine-grained feldspar sandstone
52.495.207.600.09Medium–fine-grained feldspar sandstone
62.485.008.500.44Medium–fine lithic feldspar sandstone
72.475.008.200.52Fine–medium lithic feldspar sandstone
82.495.0010.200.34Calcareous medium-grained lithic feldspar sandstone
92.505.209.100.48Medium–fine lithic feldspar sandstone
102.505.005.200.06Ultrafine–fine-grained feldspar sandstone
Table 2. Classification of Representative Samples of Chang 8 Reservoir in the Study Area.
GroupSample NumberPorosity (%)Permeability (10−3 µm2)Displacement PressureMaximum Pore Throat Radius, µmMedian RadiusMedian PressureCoefficient of VariationSorting FactorSkewnessMaximum Mercury Saturation (%)Mercury Withdrawal Efficiency (%)
I68.50.44 0.95 1.200.14 5.17 18.25 2.07 0.48 87.15 43.16
78.20.52 0.95 0.950.09 8.35 16.36 2.25 0.47 92.49 41.72
810.20.34 0.76 2.210.16 4.20 14.61 2.02 0.49 86.89 46.53
99.10.48 0.78 0.900.15 4.91 18.81 2.41 0.48 89.98 37.57
II17.80.08 1.19 0.950.11 6.54 16.12 1.96 0.42 89.81 40.86
47.50.07 1.50 0.780.12 8.92 13.05 1.88 0.54 87.13 31.30
57.60.09 0.96 0.750.14 5.20 14.61 2.02 0.43 86.89 29.58
III25.50.03 2.91 0.580.02 43.90 12.12 1.47 0.29 66.70 35.74
34.80.04 2.88 0.620.02 34.18 9.87 1.66 0.33 84.41 27.10
105.20.06 2.26 0.620.03 27.06 14.42 1.87 0.21 85.75 28.03
Disclaimer/Publisher’s Note: The statements, opinions and data contained in all publications are solely those of the individual author(s) and contributor(s) and not of MDPI and/or the editor(s). MDPI and/or the editor(s) disclaim responsibility for any injury to people or property resulting from any ideas, methods, instructions or products referred to in the content.

