Article

Effect of Changing Belt Tension on Machining Surface of CNC Lathe Spindle

1
Department of Mechanical System, Korea Polytechnic Colleges, Muan 58542, Republic of Korea
2
Department of Marine Police and Fisheries Product System, Gyeongsang National University, Tongyeong 53064, Republic of Korea
*
Author to whom correspondence should be addressed.
Processes 2023, 11(4), 1079; https://doi.org/10.3390/pr11041079
Submission received: 11 March 2023 / Revised: 25 March 2023 / Accepted: 30 March 2023 / Published: 3 April 2023
(This article belongs to the Topic Modern Technologies and Manufacturing Systems, 2nd Volume)

Abstract

:
Computer numerical control (CNC) lathes are optimized for machining workpieces into rotating shafts or cylindrical shapes of structures. However, because rotating mechanical parts are used on CNC lathes, vibration from spindles, servomotors, hydraulic pumps, and feed screws occurs. Therefore, periodic preventive maintenance is required to minimize vibrations. Additionally, alignment, balance, and adjustment operations are necessary for parts that perform linear or rotational movements. Thus, this study adjusts the tension of the V-belt that drives the spindle of the CNC lathe, analyzes the primary components and the vibrations occurring at the spindle and servomotor, and measures the surface roughness to identify the cutting quality according to the impact of the belt tension. The experimental results show that the peak value of the vibrating component increases as the cutting speed increases. We demonstrate that the optimal vibration characteristics and excellent surface roughness values are achieved at a relatively looser belt tension than the standard value. In particular, at a feed speed of 0.05 mm/rev, a cutting speed of 250 m/min, and a depth of cut of 0.8, the surface roughness in loose tension was reduced by up to 143.9% compared to tight tension. Additionally, the optimum processing quality is achieved at a cutting depth of 0.6 and 0.8 mm, corresponding to a turning insert nose R-value of 0.4 mm, and at cutting speeds ranging from 200 to 250 m/min.

Graphical Abstract

1. Introduction

In modern industry, machine cutting is a typical method for manufacturing automobiles, airplanes, ships, and medical and industrial machine components into the required precise shapes and measures. Generally, creating the demanded shapes and measures using a machine tool and rotating or stationary tools to remove chips from a workpiece is referred to as cutting. In particular, the computer numerical control (CNC) machine tool started as a numerical control (NC) milling first developed at the Massachusetts Institute of Technology in 1952. This technology subsequently spread along with the progress in CNC lathe technology and machining centers during the third industrial revolution. In this process, the manufacturing industry grew rapidly owing to mass production, a decrease in production costs, and an improvement in the quality of products. Currently, we are in an era of infinite competition in every industry. Particularly, the steel and material industries are continuously developing new materials or steel grades with varying chemical compositions or physical properties based on consumer demand. Consequently, studies have been conducted in cutting sites, where various materials are used for manufacturing, to determine the optimal cutting conditions through experimental methods. This enables for the measurement of a cutting force, tool abrasion, and surface roughness to identify the cutting properties of new steel grades or new materials [1].
In particular, carbon fiber or graphite/polymer composites, difficult-to-cut materials with high-tool wear, among the new materials, are widely used in the automobile and aerospace industries. Therefore, research is being conducted to improve the production quality by measuring the cutting force, etc., to minimize tool wear; it is in progress [2,3]. In addition, research is being conducted to improve machining quality and efficiency by comparing the existing machining method’s cutting force coefficient with the new cutting method’s cutting function of CAM software [4]. In general, in studies related to machine cutting, the typical experimental method for identifying the cutting property employs a cutting force measurement using a tool dynamometer, which measures the force or torque [5]. It is used in most studies because the characteristics of the cutting resistance generated during the processing of a workpiece can be determined by measuring the tangential, radial, and feed forces, which are the cutting forces generated between the tool and workpiece [6,7]. Additionally, cutting resistance increases the heat generated on the cutting edge of the tool, resulting in reduced hardness and accelerated abrasion. Therefore, the abrasion and damage to a tool can be predicted [8]. In addition, the quality can be improved by measuring the cutting force according to the size and shape of the tool and the feed rate [9,10].
Therefore, to solve tool wear acceleration, new production-based studies are being conducted to monitor tool wear based on the signal waveform of the existing cutting force [11].
These are factors that significantly affect the cost and rate of production. Therefore, tool abrasion should be minimized and cutting quality improved by selecting the tool shape and material quality suitable to the processing [12,13].
In general, the issue of quality degradation occurring directly or indirectly after cutting can be assessed by measuring the cut surface [14]. The tool’s shape, wear, and cutting conditions directly affect the cutting processing quality. In addition, the cutting oil, spraying method, and forced vibration during processing indirectly affect the quality [15,16]. The surface roughness is affected by the cutting conditions, state of tool abrasion, and abnormalities in the machine. Therefore, it is an important assessment method. A typical method of improving the quality of the cut surface with the cutting conditions is increasing the cutting speed and reducing the feed rate [17]. This is because reducing the cutting speed reduces the impact of the build-up edge. Moreover, the uncut parts increase owing to the feed rate of the tool moving only to the designated amount per rotation of the workpiece. Additionally, surface roughness increases when the feed rate is extremely low. Therefore, diverse studies on assessing the surface roughness have been conducted because the cutting conditions produce different results depending on the material to be cut and the tools used [18,19]. However, in the form of continuous chips, a built-up edge may occur, which is a cause of roughening the machined surface, so it must be prevented by increasing the cutting speed and rake angle.
Therefore, the formation of chips has a great relationship with the quality of the machined surface. Recently, the cutting properties have extensively been investigated using a finite element method analysis, from which the parts where stress is concentrated, temperature distribution, and abrasion characteristics can be diversely analyzed from the chip formation process [20,21].
This study measured the vibration occurring owing to the impact of the tension of the micro V-belt and prevented or improved the quality degradation issues resulting on the cut surface. Most vibration studies related to cutting equipment have analyzed the vibrating components of the equipment or the involved chatter vibration generated by the impact of the tools [22,23,24]. However, thus far, studies on quality improvement using machine diagnosis have not been reported. In general, the primary solutions to the vibration generated during machining are to keep the overhang of the tool holder short, select a turning insert with a small nose R to reduce the Thrust force, or carefully select the cutting conditions.
Considering on-site production, the quality degradation that can originate from indirect factors is significant. Therefore, studies relevant to the topic of our study should be encouraged.
Most production sites do not comply with the accurate standard of replacing the CNC lathe belt. Given the relatively simple process, replacement relies on experience. Additionally, machine diagnostics using vibration equipment is not a common practice, so most return immediately to production only after replacing the belt. Therefore, this study measured the change in vibration by adjusting the micro V-belt tension by 20% intervals from the standard value to transfer the power of the servomotor for the CNC lathe to the spindle and analyzed the results. Additionally, the representative cutting conditions were designated under the changed belt tension to cut a total of 54 sample workpieces and examine the impact on the surface roughness quality.

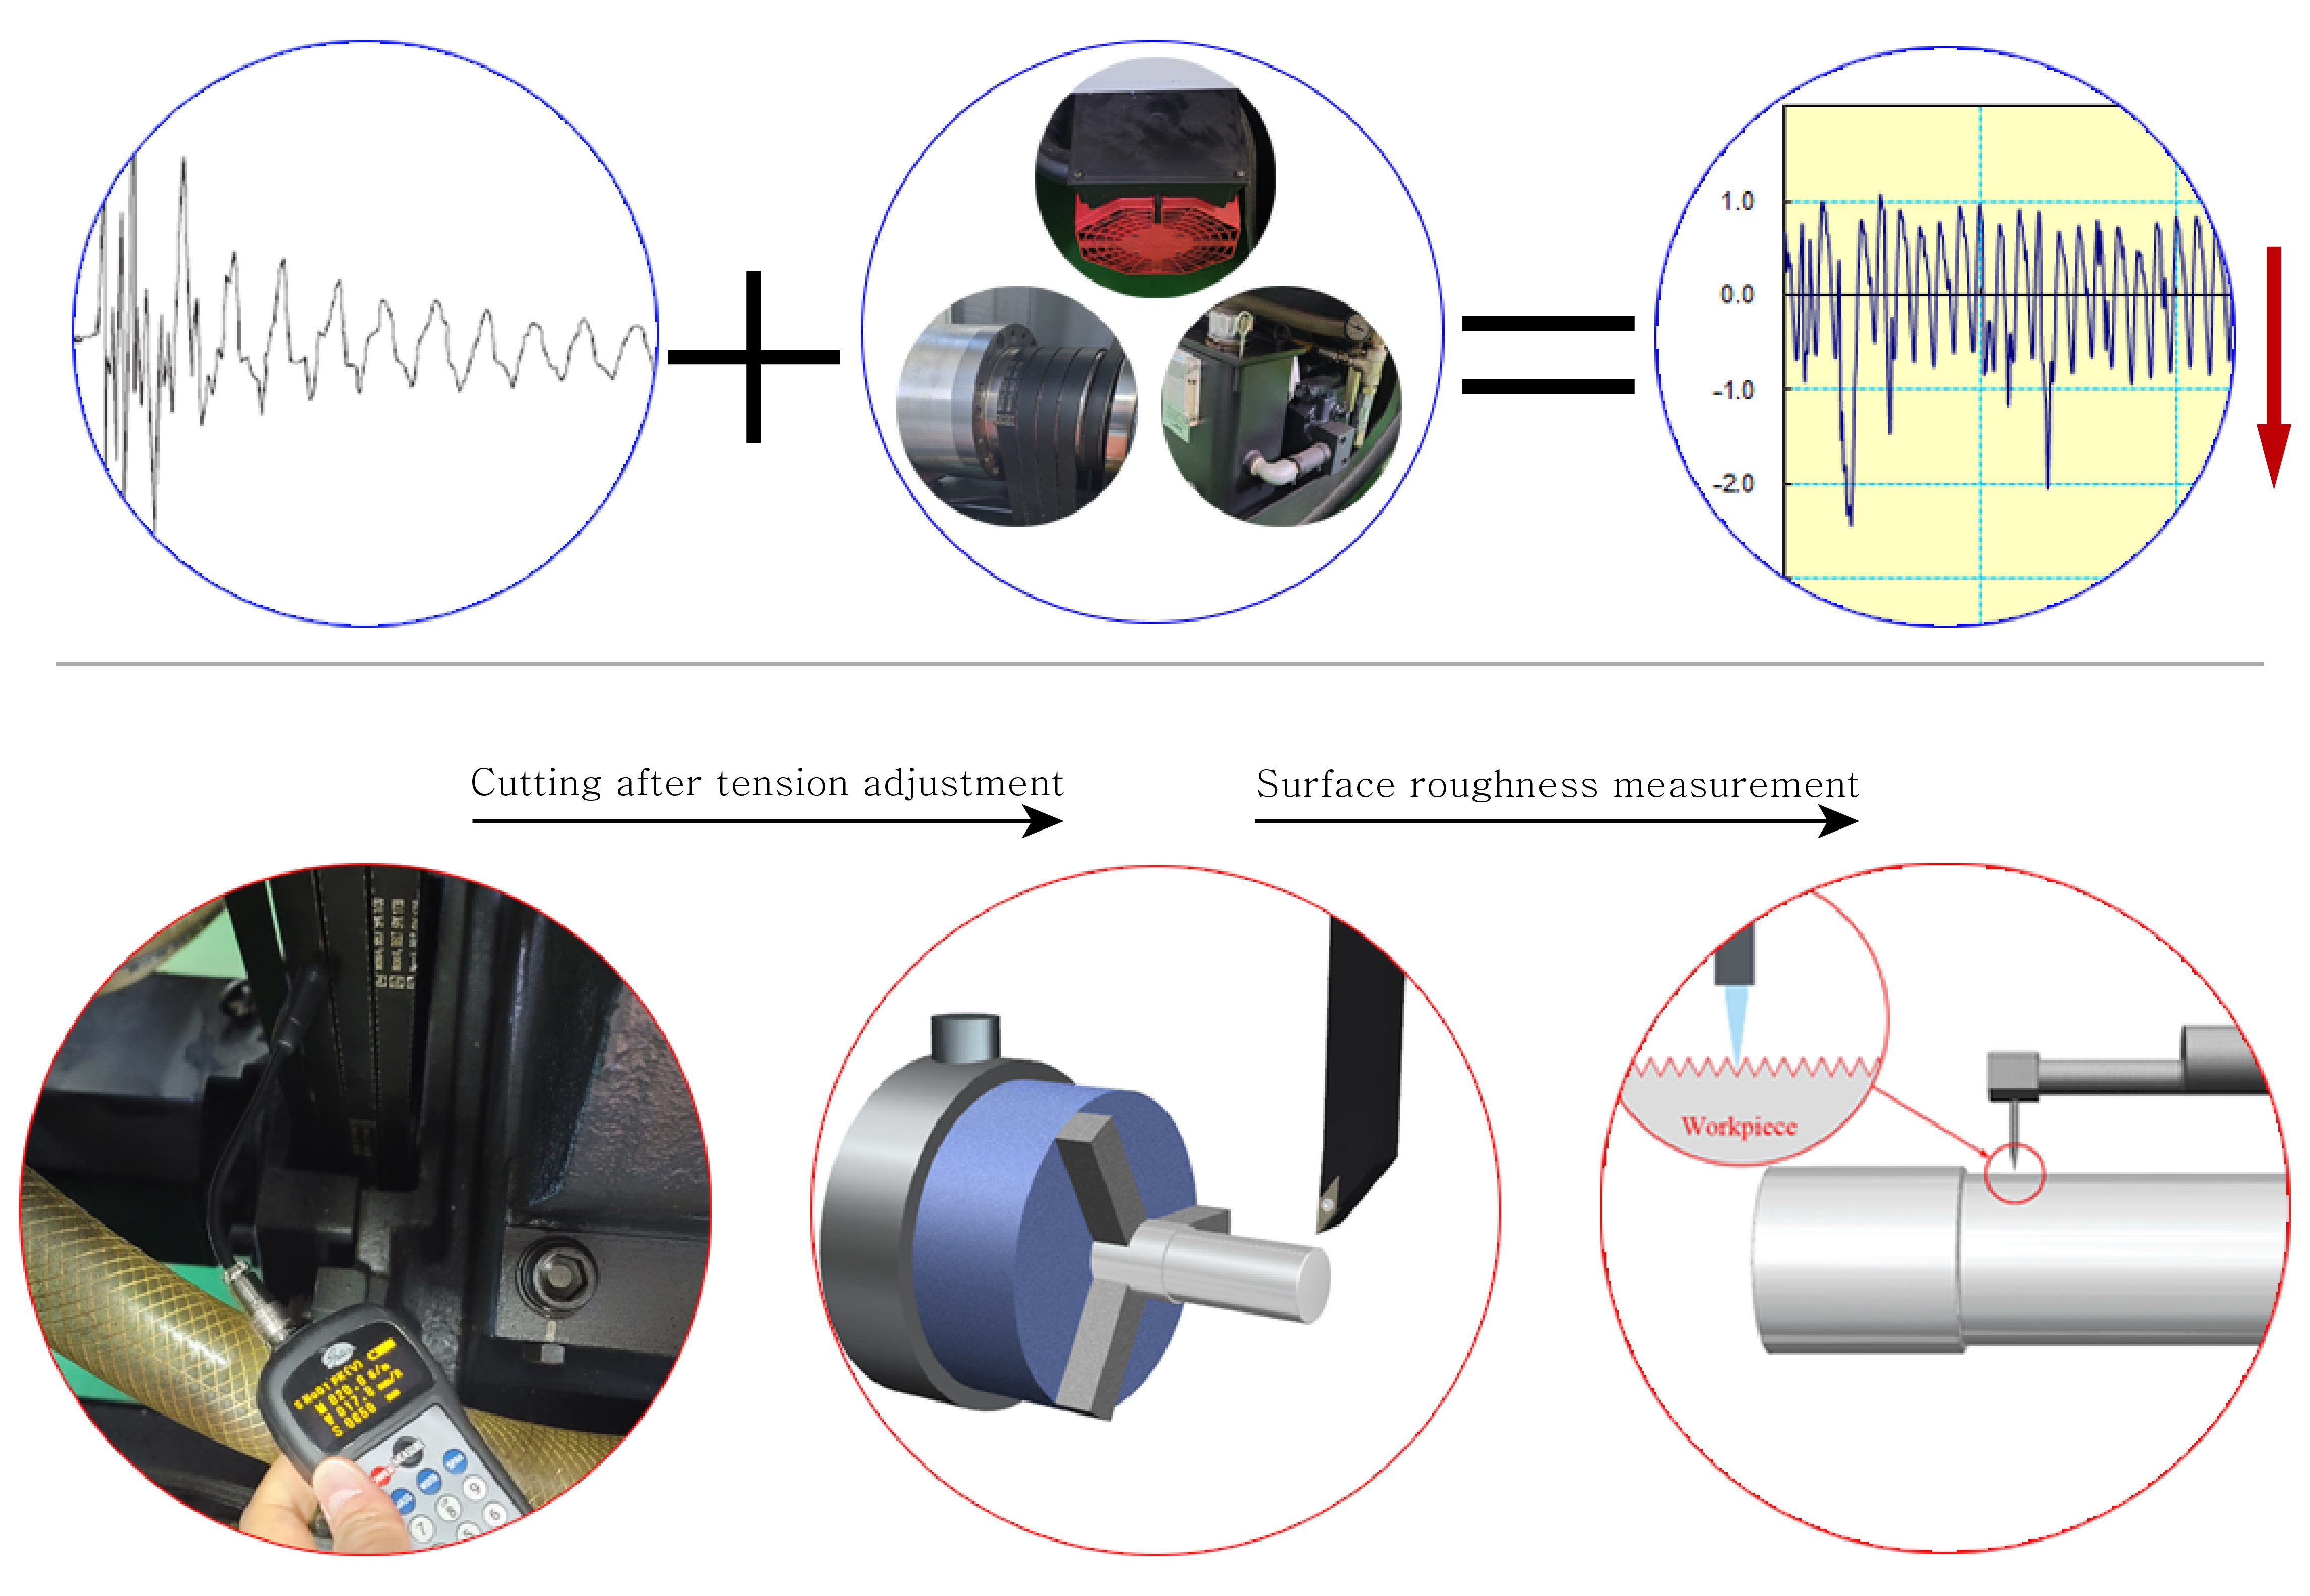
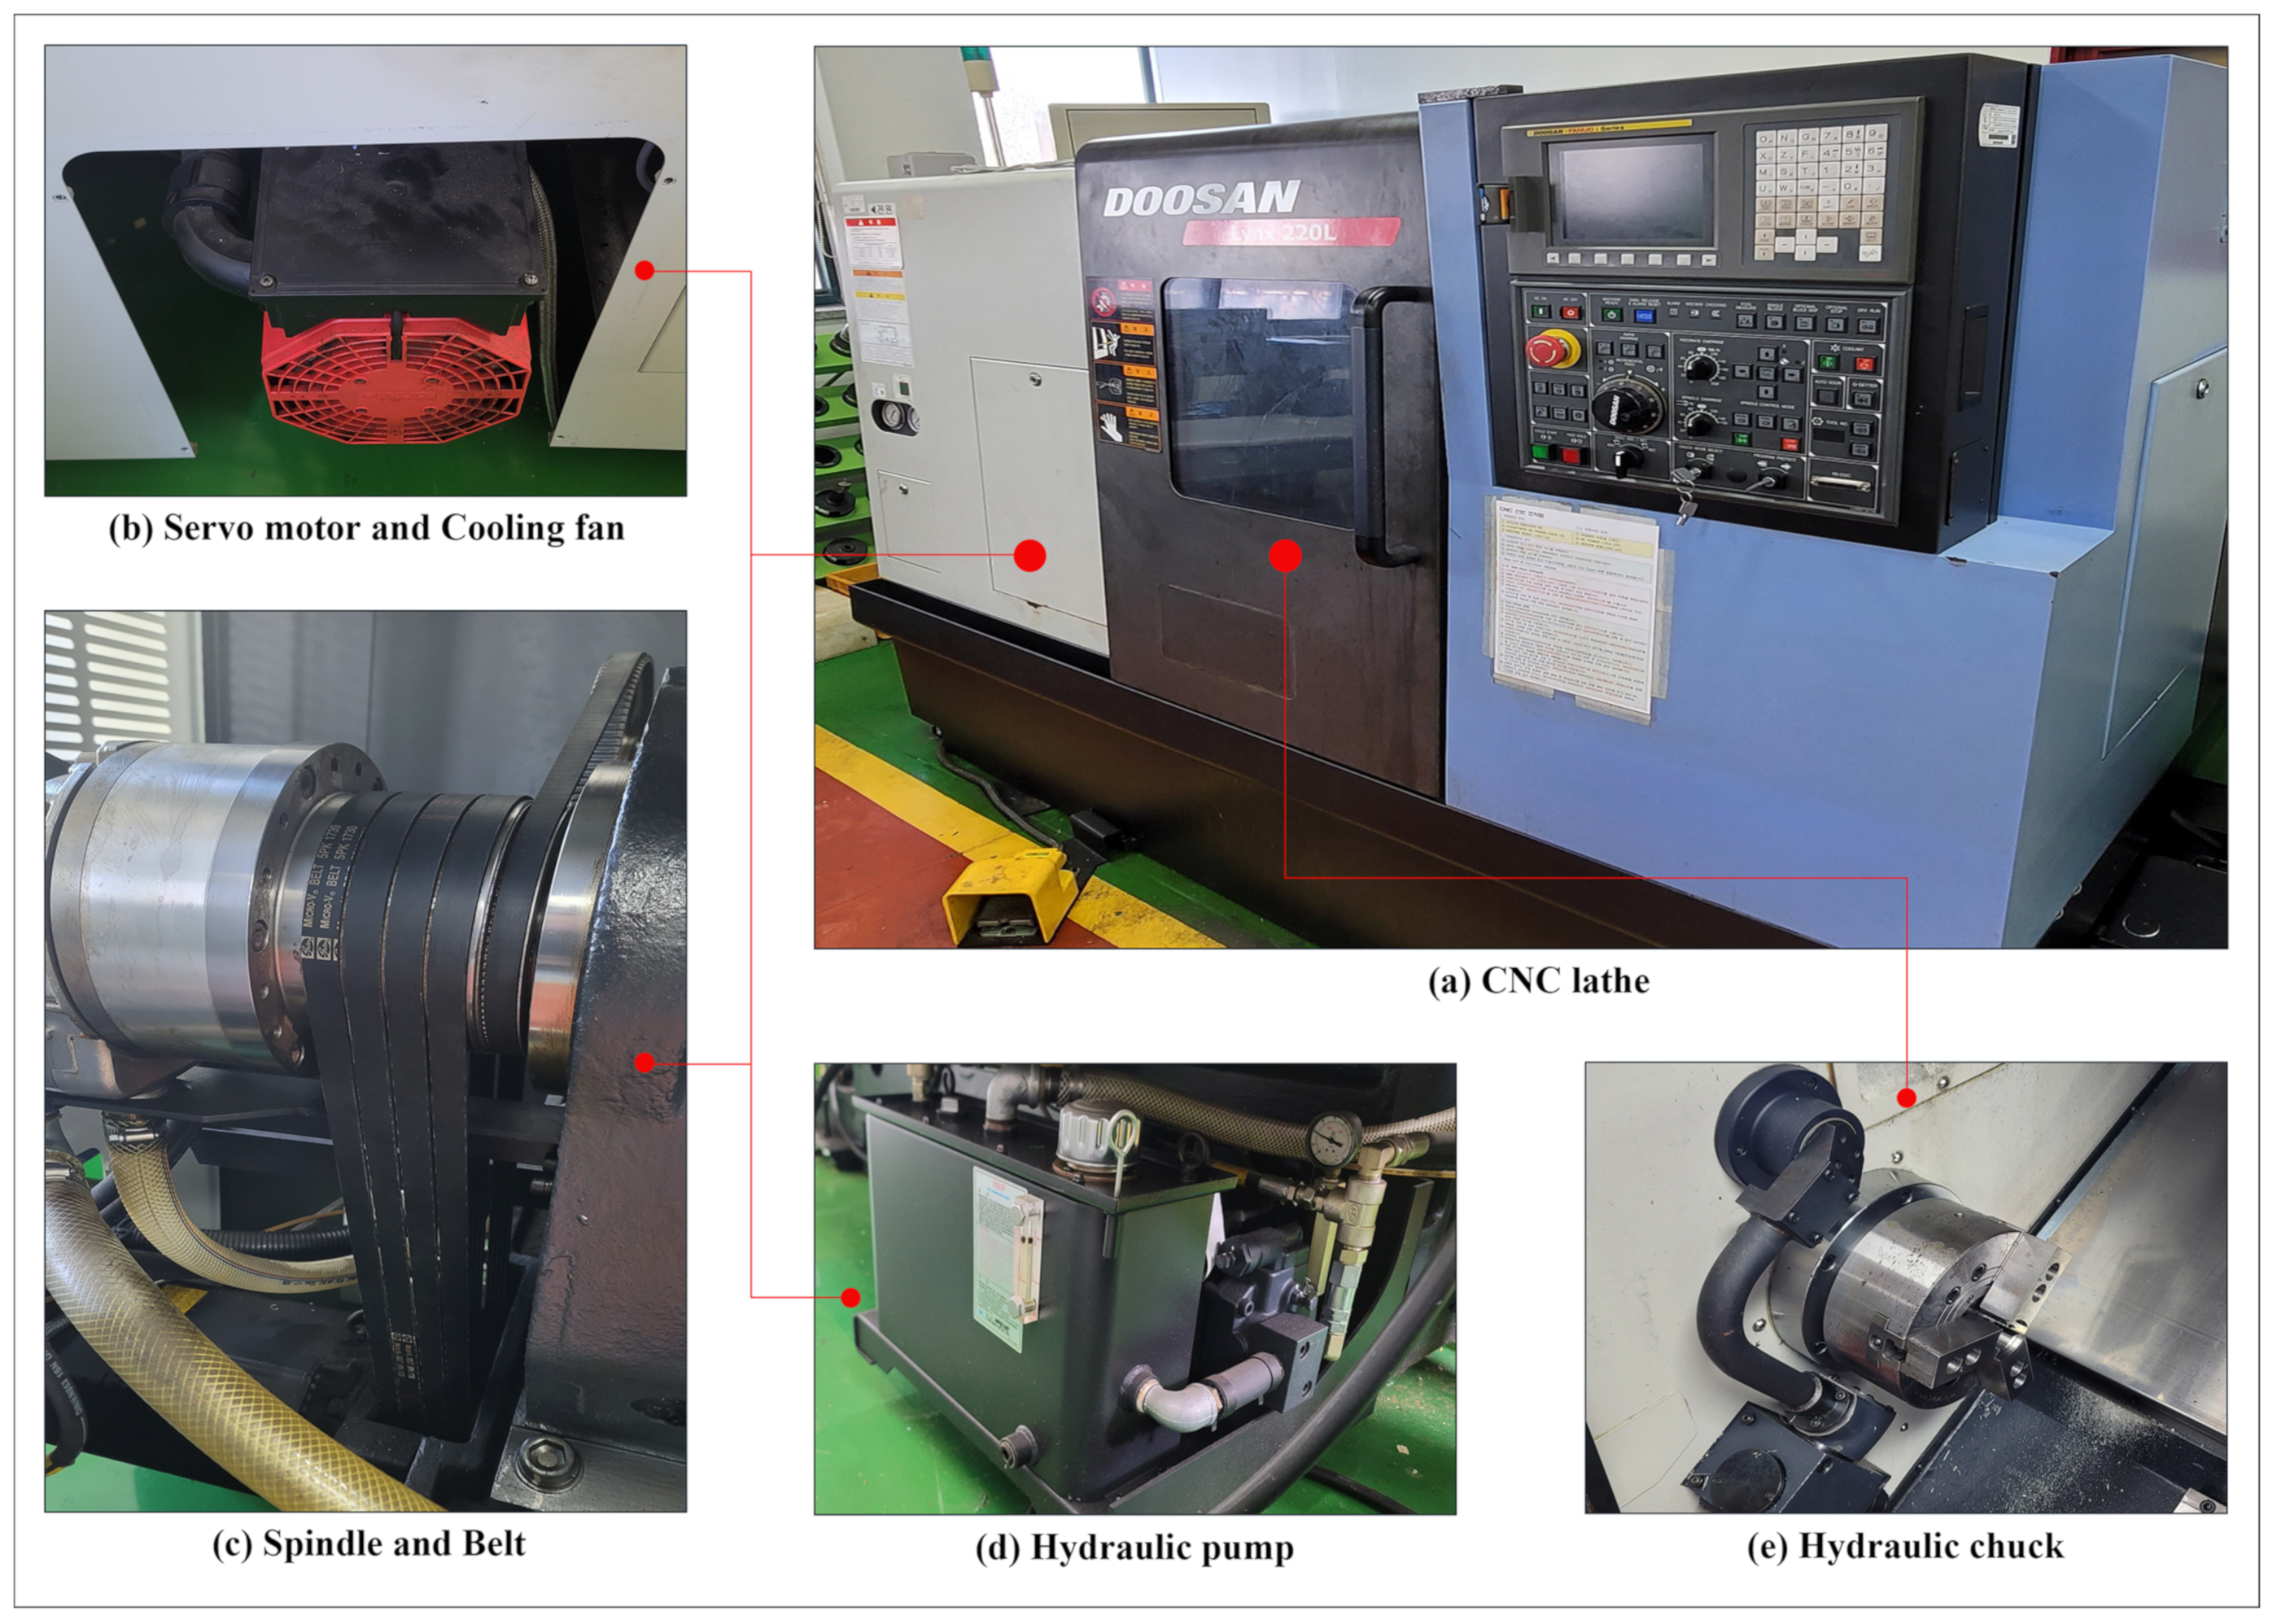
2. Experiment and Methods

This study assesses the impact of the vibration, that occurs during cutting on the surface roughness according to the change in the tension of the belt on the CNC lathe. As shown in Figure 1, the experimental procedure of this study is conducted in four steps: (a) adjusting the belt tension using the sonic tension meter, (b) measuring the vibration on the spindle inside the cutting room, (c) of cutting according to the cutting conditions, and (d) measuring the surface roughness after cutting.
The specifications of the CNC lathe used in this study are shown in Table 1. Figure 2a shows the equipment used in the experiment. The CNC lathe is a DOOSAN Lynx 220L model, and the tool fixed to the turret is transported in the X-axis and Z-axis and cuts the rotating workpiece. The chuck and tailstock that fix the workpiece are operated by hydraulic pressure, and the spindle rotates by being connected with a servomotor by a micro belt.

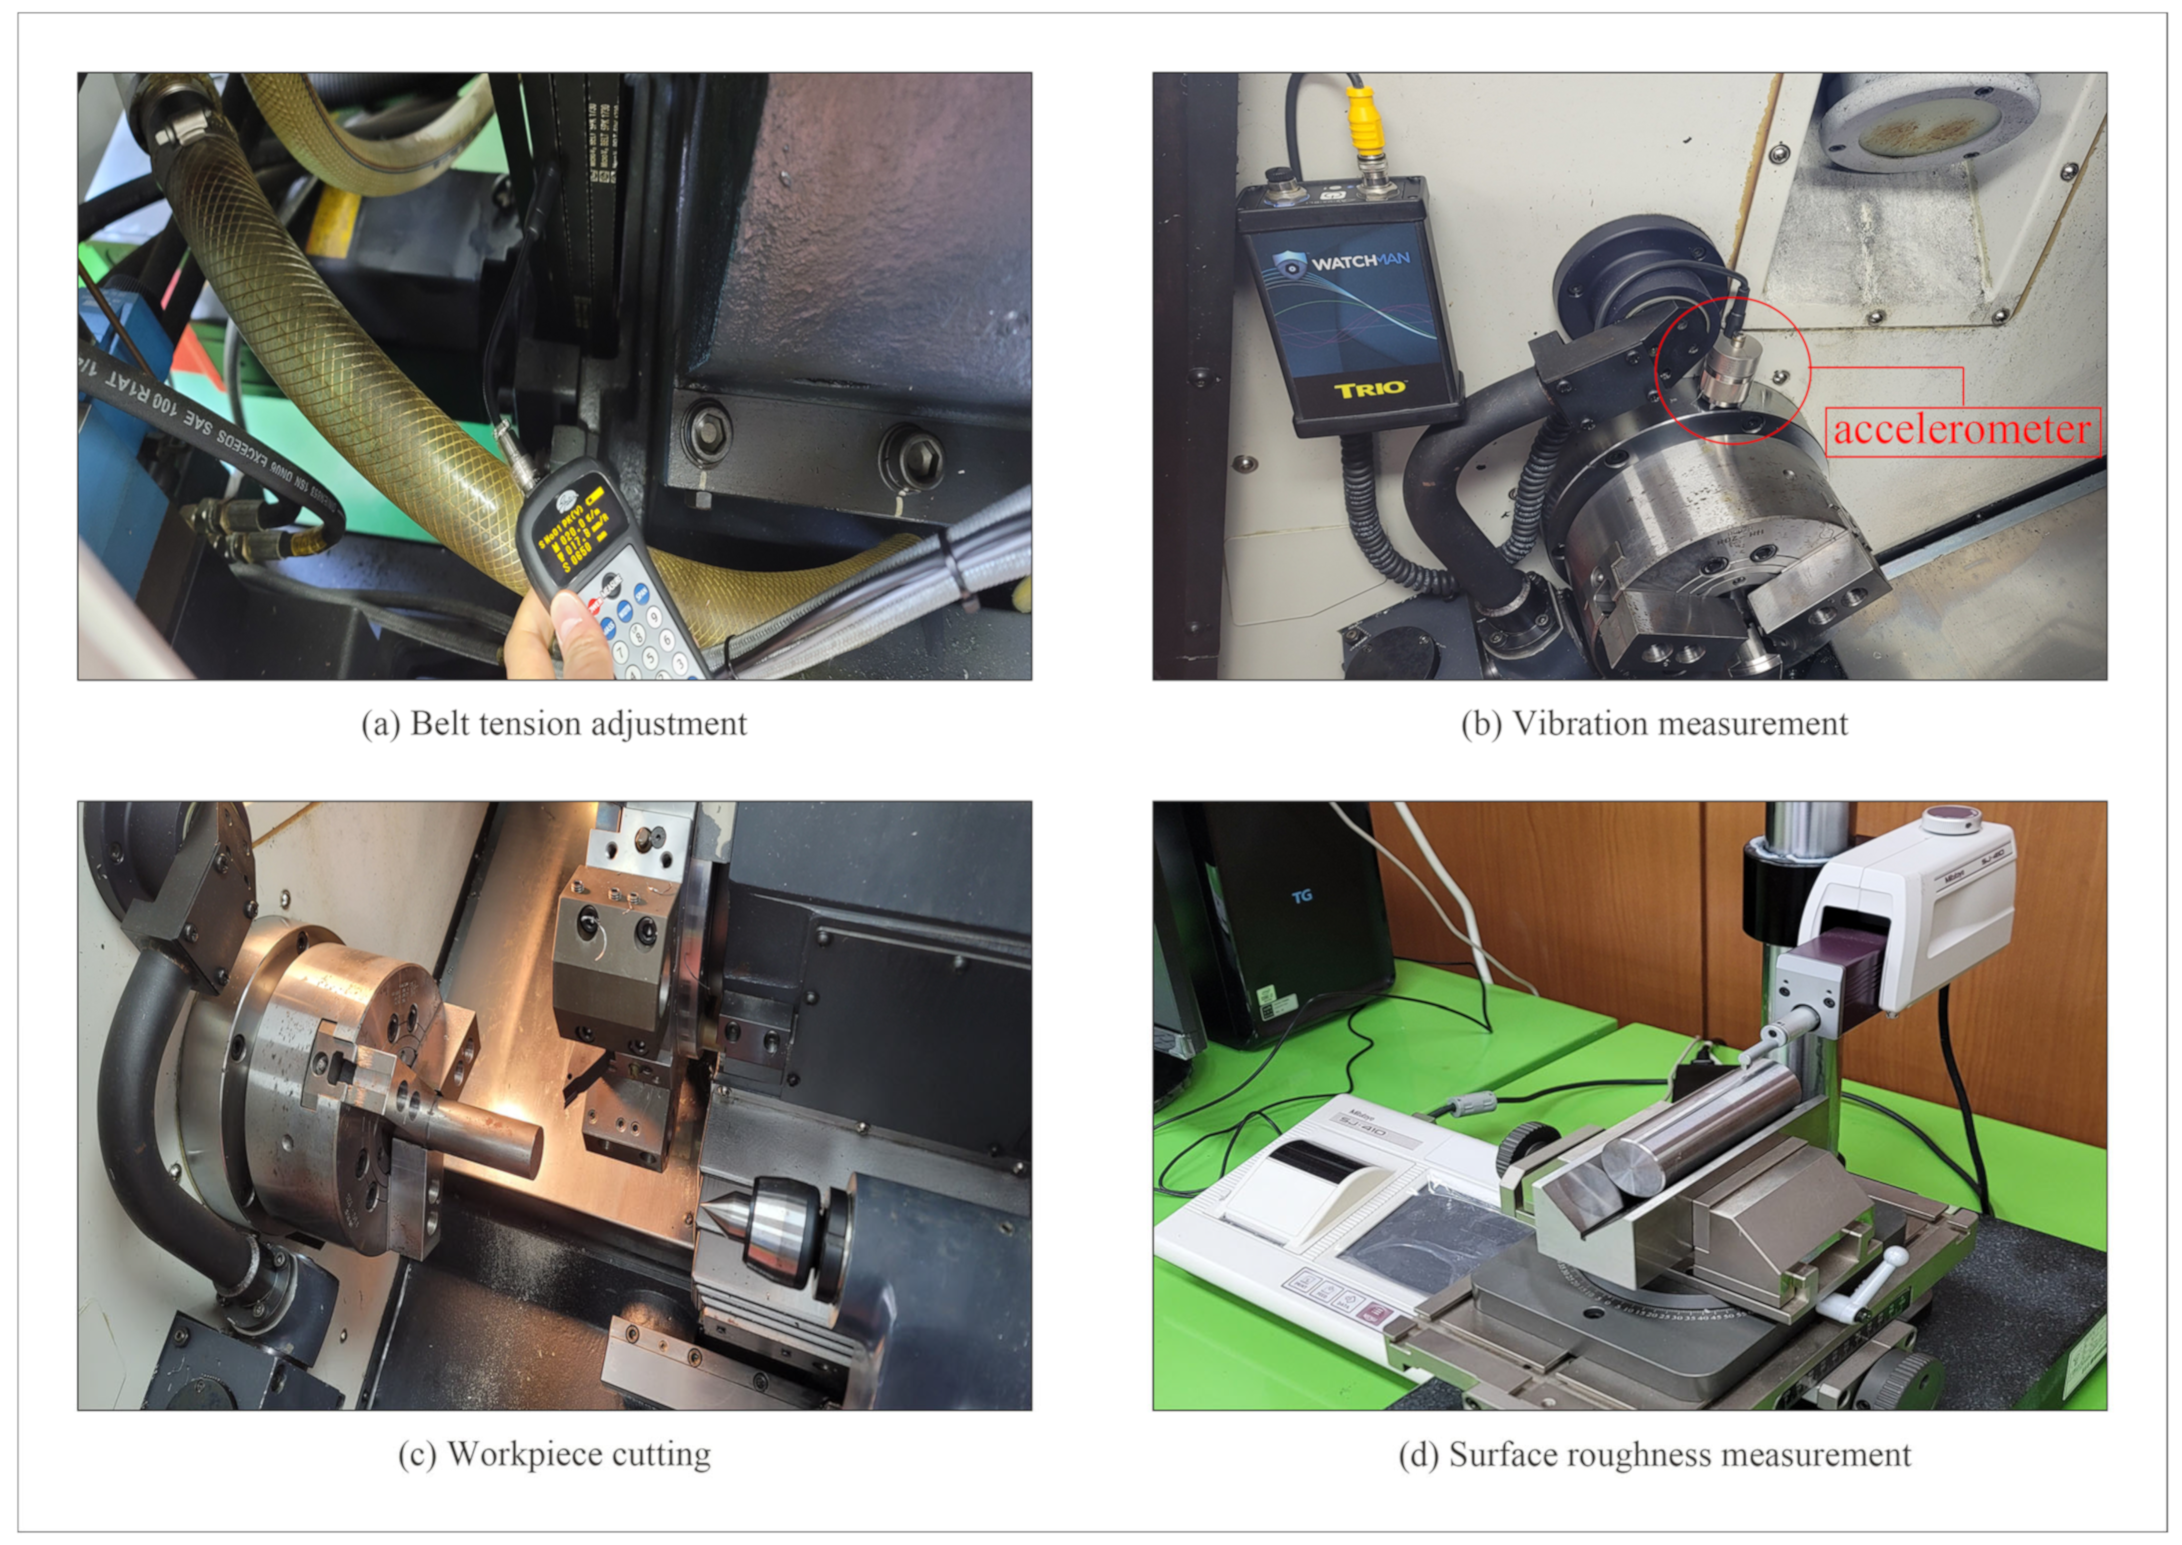
2.1. Belt Tension Measurement

The CNC lathe spindle uses the V-belt to receive the rotating power of the servomotor to rotate. Therefore, the belt tension between the servomotor and spindle is significant as it affects the vibrating component during processing.
The standard of the micro V-belt used in the CNC lathe is shown in Table 2. Figure 2c shows four micro V-belts connected in parallel. A sonic tension meter was used to measure the tension in the belt. As shown in Figure 1a, the sonic tension meter is placed near the V-belt. The method measures the natural frequency generated when hitting with a tool, such as a hammer.
The specifications of the sonic tension meter are shown in Table 3. After adjusting the tension, five consecutive measurements were performed. The results are shown in Table 4. The belt tension value depends on the recommended value (505 N) by the manufacturer. Notably, a relatively loose state (405 N) and a relatively tight state (605 N) were set with approximately 20% intervals. If the belt tension is too loose, noise and vibration are generated due to a slip between the belt and the pulley, and if the belt tension is too tight, belt wear is accelerated, and tensile fracture occurs. Therefore, based on the tension value recommended by the belt manufacturer, a tension value corresponding to about 20% was determined.

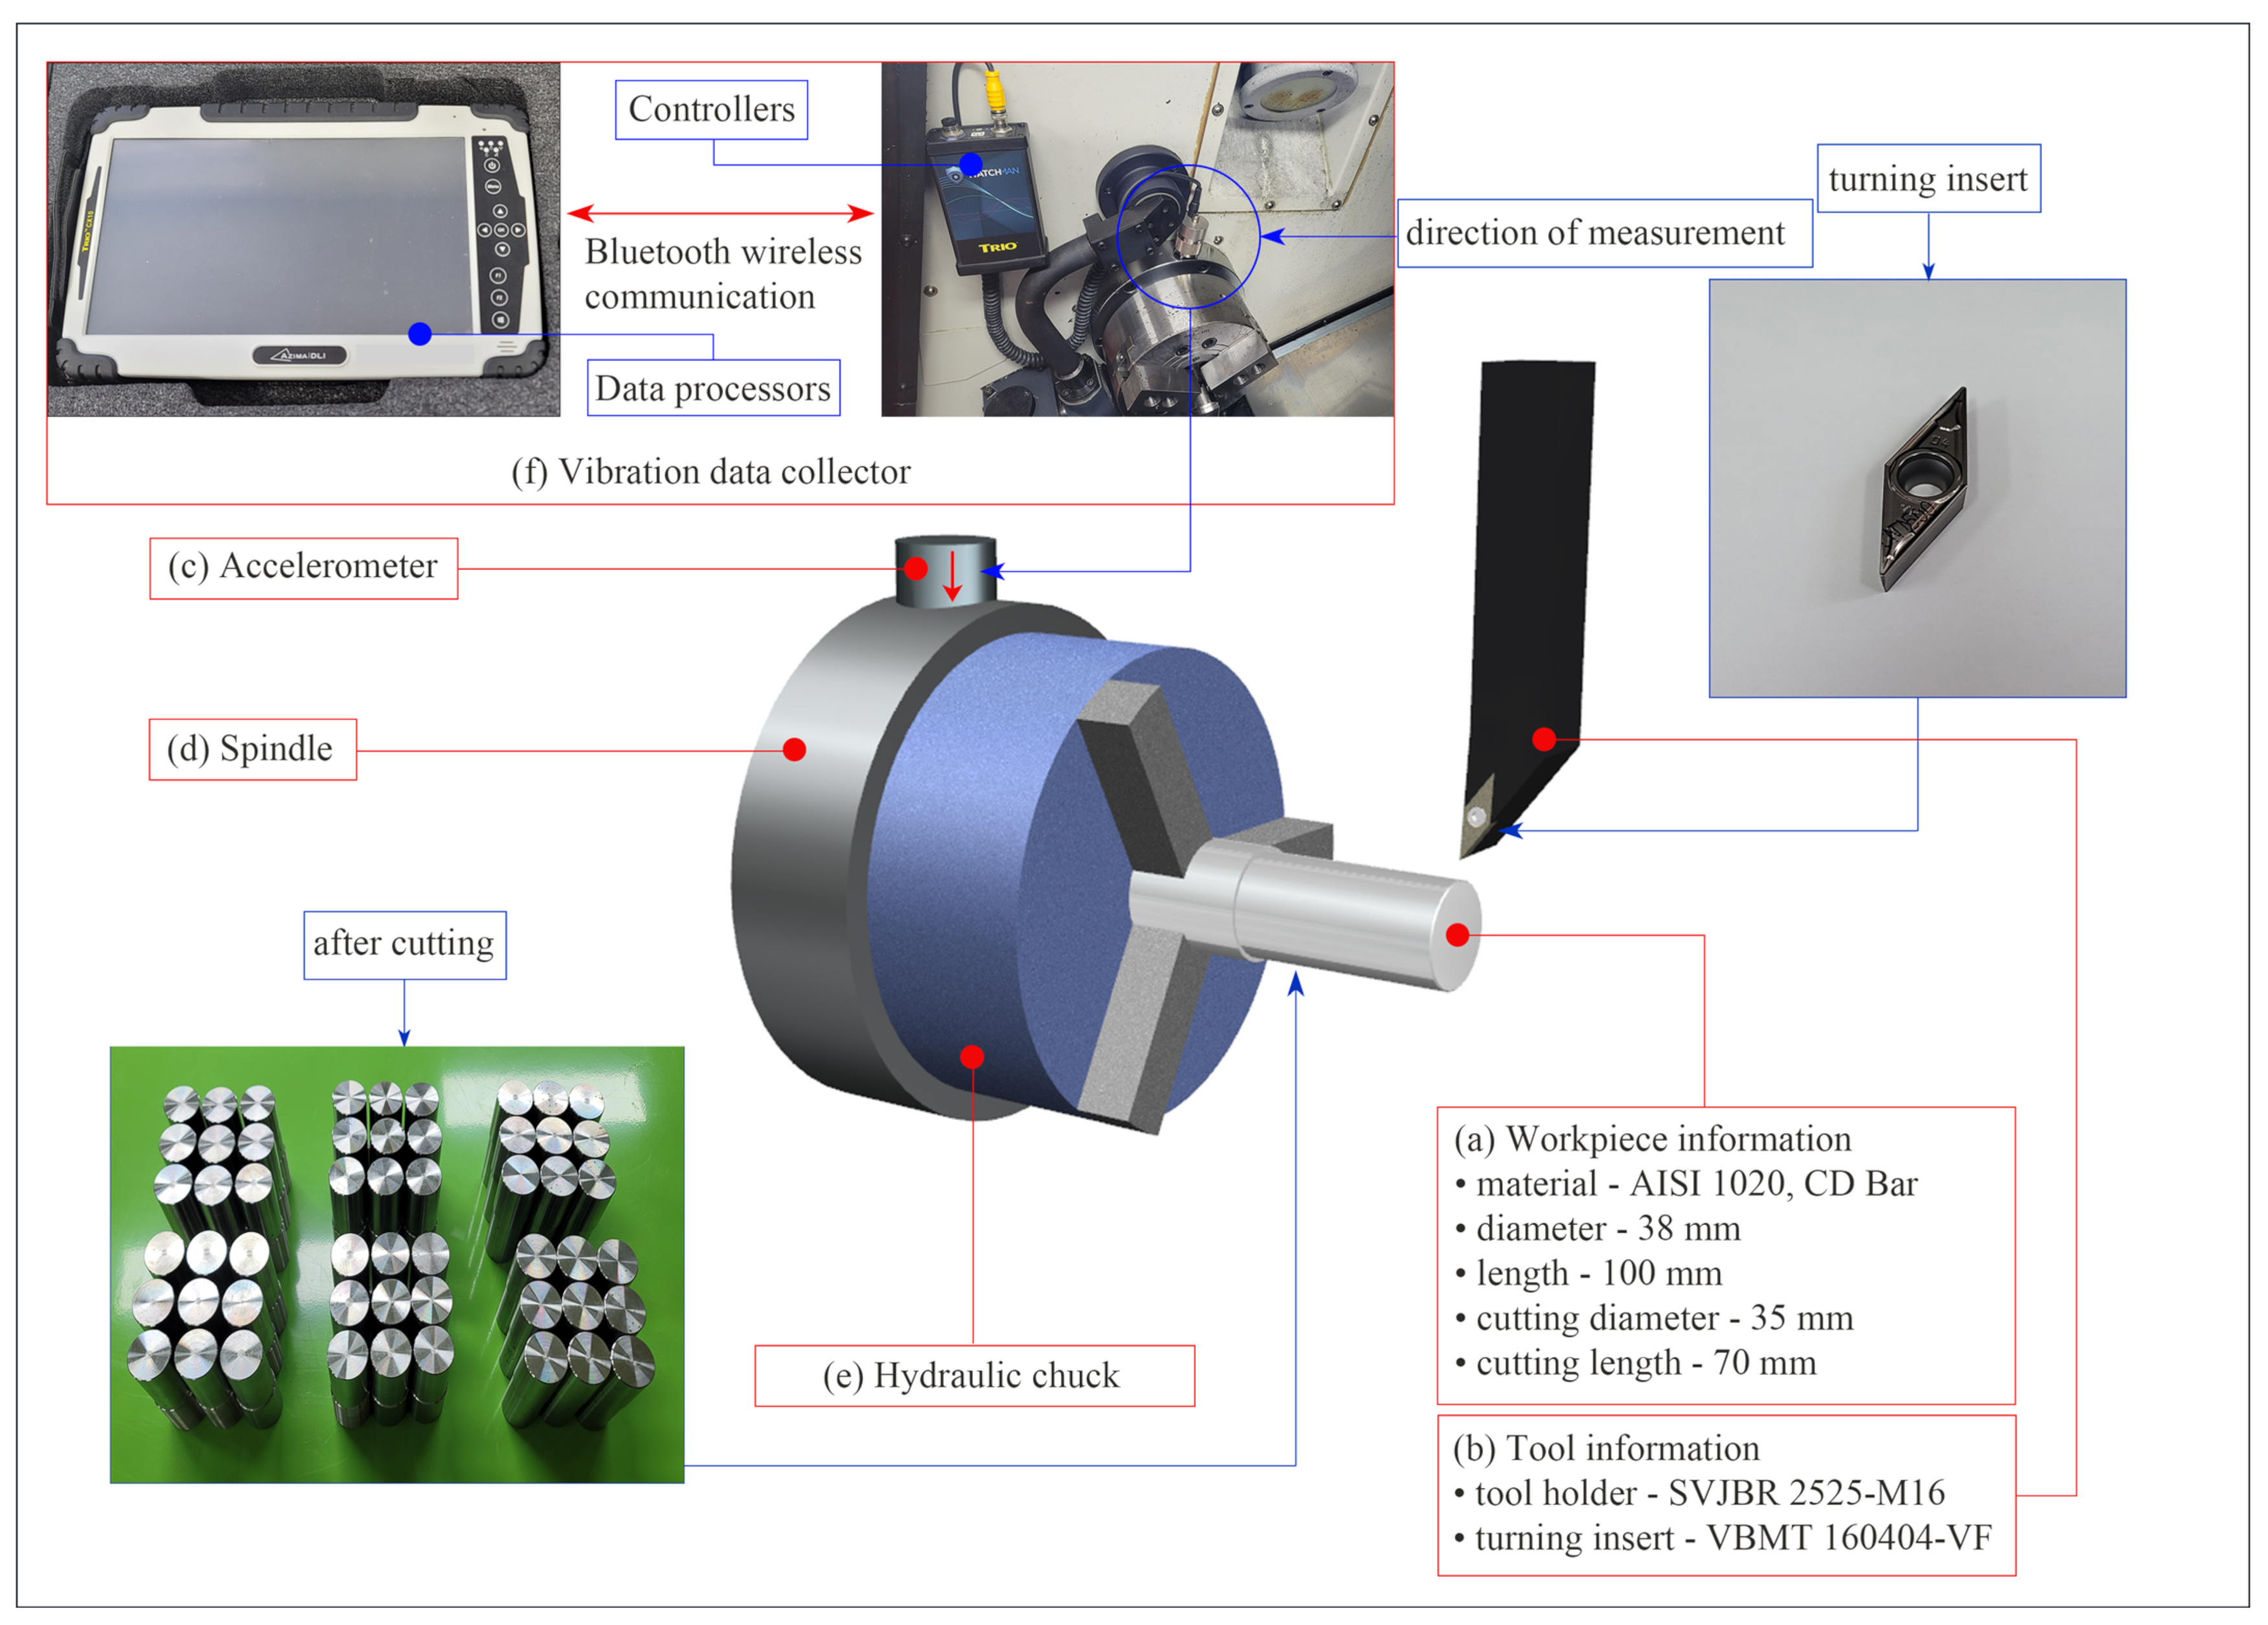
2.2. Vibration Measurement

For the measurement of the CNC lathe spindle, an accelerometer is attached as shown in Figure 1b. The direction of measurement is on the z-axis (vertical) as shown in Figure 3c. The vibration data collector is shown in Figure 3f. The accelerometer was attached to the spindle using a magnet, and the vibration was measured wirelessly using the AZIMA DLI CX10 model equipped with Bluetooth, a wireless communication function. While measuring the vibration, the frequencies in the range of 0–200 Hz were measured. Each frequency component, including the total vibration amount was analyzed. The major vibration points that can occur on the CNC lathe are shown in Figure 1, where (a) shows the CNC lathe used in the experiment, (b) the servomotor that rotates the spindle and cooling fan, (c) the spindle and micro V-belt, (d) the hydraulic pump that operates the hydraulic chuck and tailstock, and (e) the hydraulic chuck that fixes the workpiece. Here, the frequency components of the servomotor, spindle, belt, and hydraulic chuck changed depending on the cutting speed, and the hydraulic pump and cooling fan exhibited fixed frequency components. Additionally, the rotation ratio of the spindle and servomotor was 1:1.73, and the frequency component at the servomotor was higher. The specifications of the vibration data collector used in this experiment are shown in Table 5.

2.3. Workpiece Cutting

To process the workpiece, we complied with the cutting conditions to cut 54 workpieces as presented in Table 6 to complete the process; the insert was replaced during the first processing of the workpiece. The SVJBR 2525 M16 and VBMT 160404 VF were used as the tool holder and the turning insert used during cutting, respectively, as shown in Figure 3b. For the cutting material, a cold drawn (CD) bar, such as the AISI 1020 with approximately a 0.2% carbon content was used. The CD bar was realized through cold drawing. It is used in small mechanical parts that are not thermally treated rotating shafts and bolts included in automobiles and heavy machinery. Therefore, it is typically used in components that require sound weldability depending on the use. The chemical composition of the materials used is shown in Table 7, and the mechanical properties are shown in Table 8. Regarding the size of the material, the external diameter was 38 mm and the length was 110 mm as shown in Figure 3a. The size after rough cutting was programmed to be obtained at an external diameter of 35 mm and a cutting segment length of 70 mm.

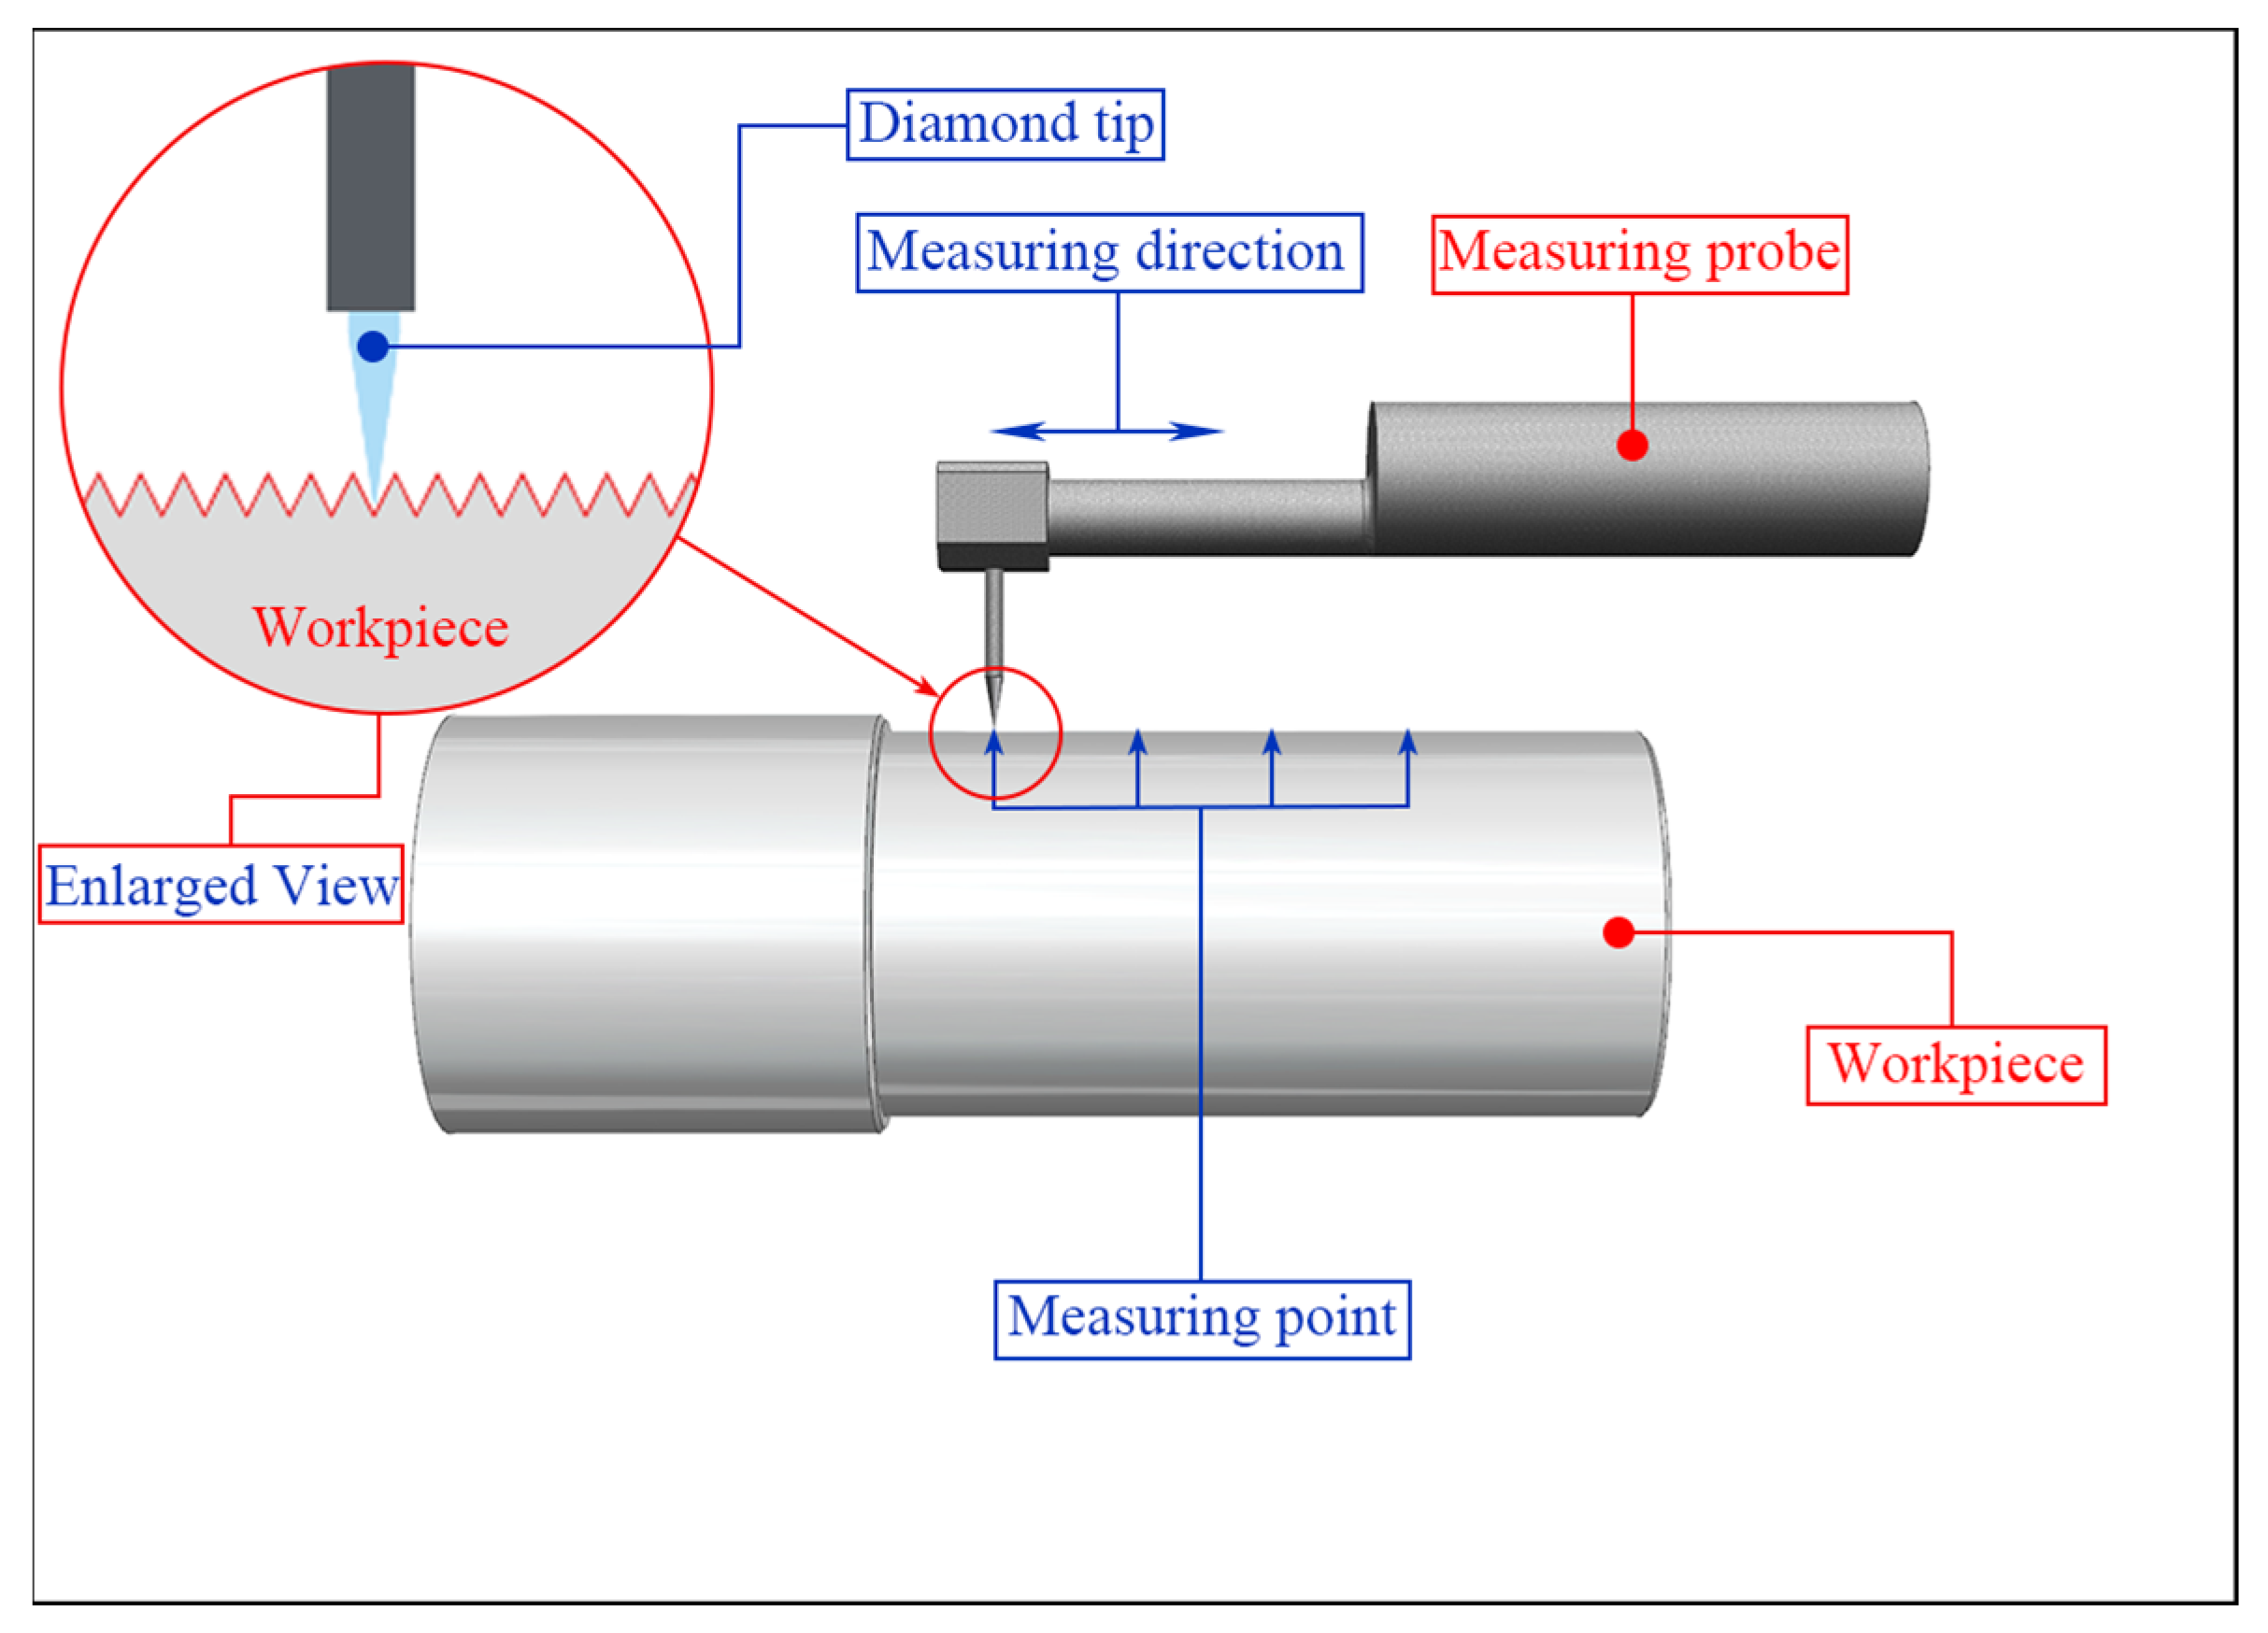
2.4. Surface Roughness Measurement

Measuring the surface roughness involved the measurement of the extent of the fineness of the unevenness that either occurs regularly or irregularly on the workpiece surface. This is referred to as the surface roughness. In general, the surface structure consists of waviness, lay, and flaw. The surface roughness differs according to the variables, such as the tool used during processing, cutting conditions, and vibration. Therefore, to satisfy the quality demanded by a consumer, the optimal cutting conditions and sound tools as well as periodic preventive maintenance and calibration must be considered for the processing to be precise.
In this study, four surface roughness measurements were performed for one workpiece as shown in Figure 4, at 15 mm intervals. The specifications of the surface roughness equipment used in the experiment are shown in Table 9. Figure 1d shows the measurement equipment.

3. Results and Discussion

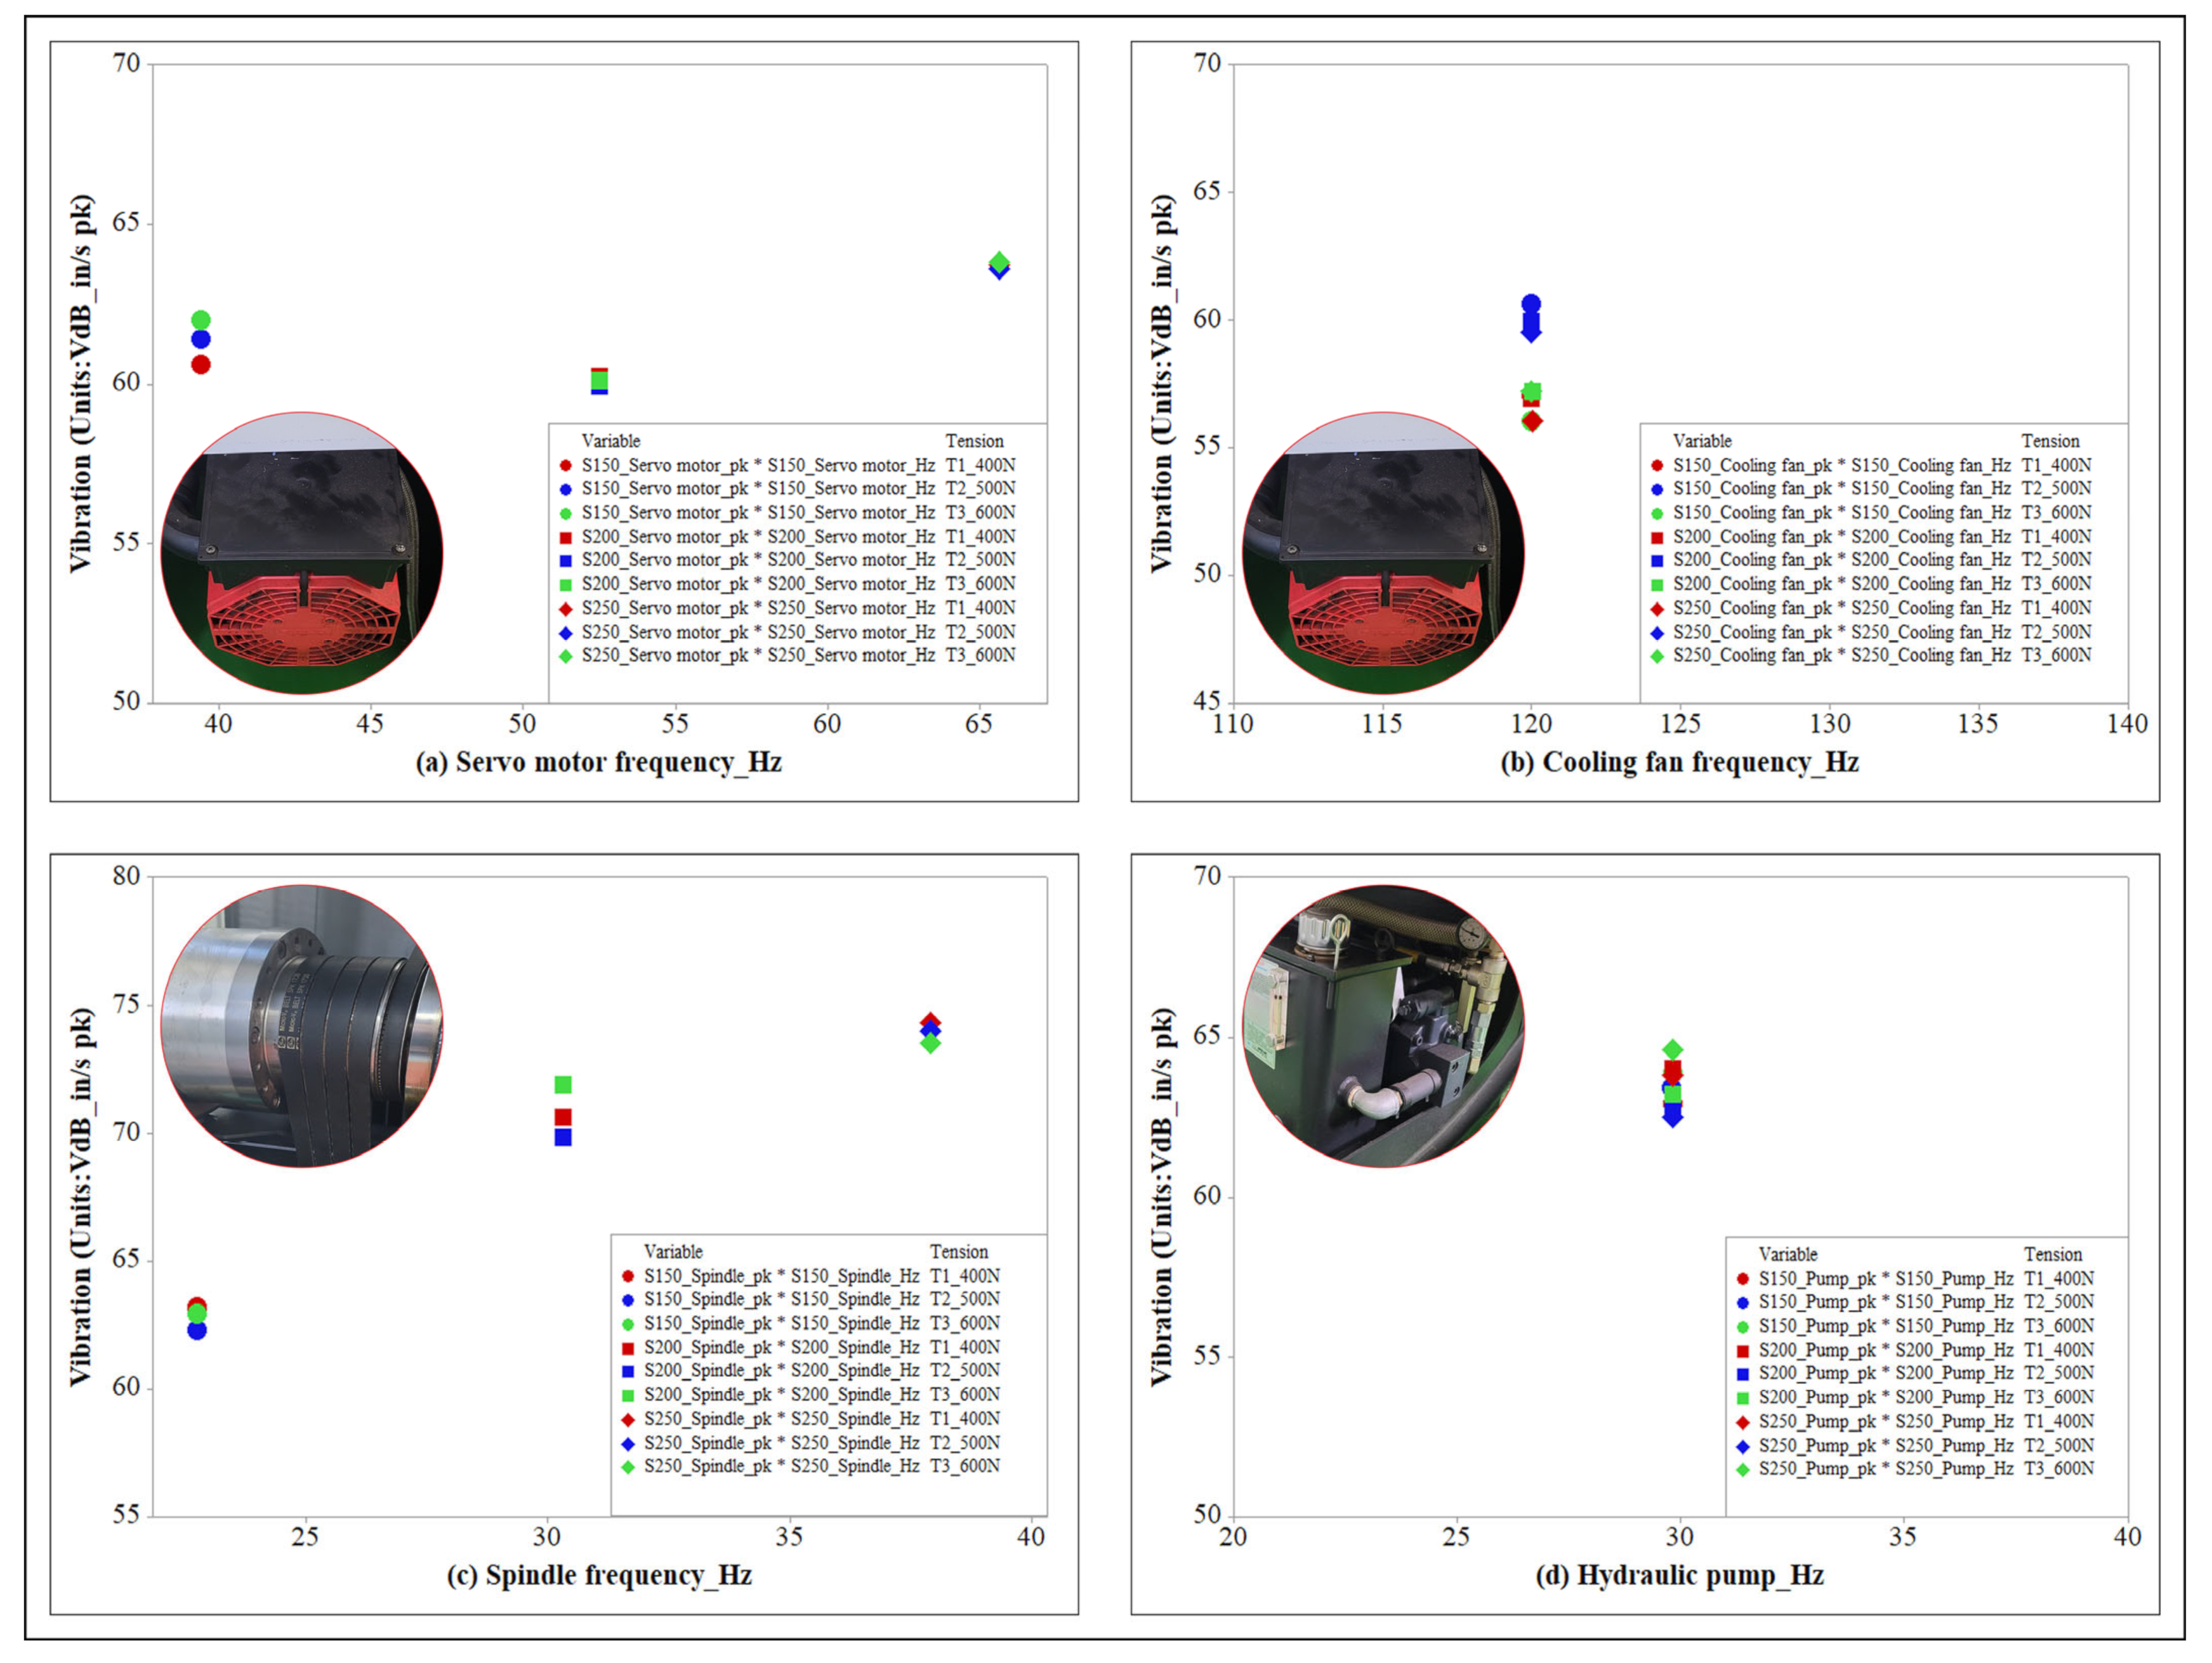
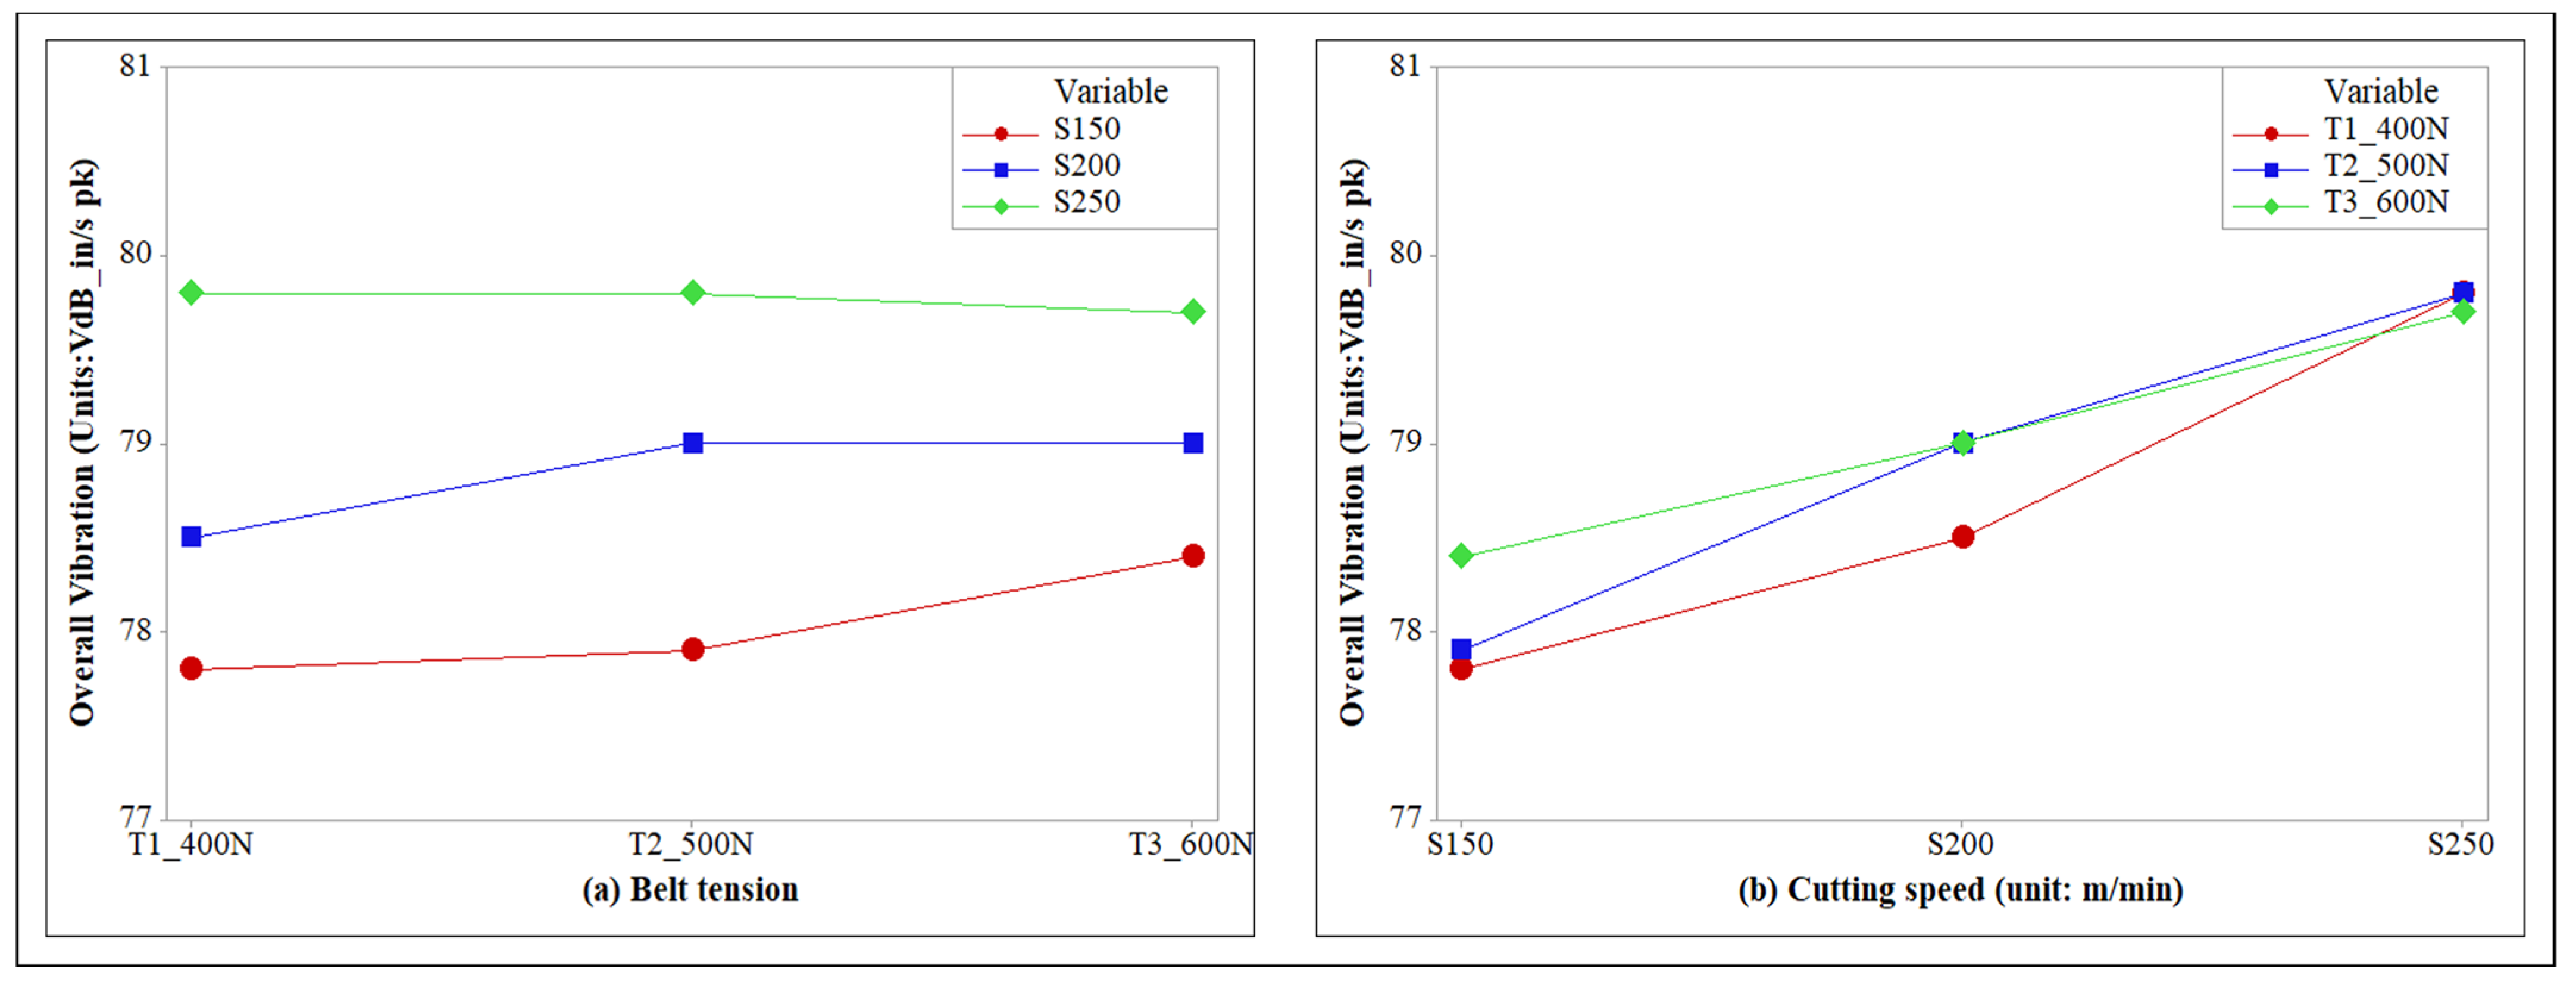
3.1. Analysis of Measured Vibration

The vibration measurement was performed in the vertical direction from the upper part of the spindle located inside the cutting room as shown in Figure 1b. The vibration unit in VdB, which is the vibration velocity level, and the equation relevant to the logarithmic scaling of the vibration are shown in Equation (1) [25].
L v = 20 × l o g 10 v v r e f
where L v is the velocity level in decibels, v is the RMS velocity amplitude, and v r e f is the reference velocity amplitude.
The vibration measurement was conducted as the workpiece was fixed and rotated at the RPM that corresponded to each cutting condition. Notably, the results identified the four major factors of the vibration component that could affect the processing. The four factors that generated the major vibration components were: (a) the servomotor, (b) servomotor cooling fan, (c) spindle, and (d) hydraulic pump as shown in Figure 5. The results show a scatter plot using the frequency and frequency peak values as each vibration component and accurate vibration components can be intuitively identified.
As shown in Figure 5a, a change in the frequency component of the servomotor depending on the cutting speed occurs. In particular, when the cutting speed increased to 250 m/min, the rotation speed was 3939 RPM, and a vibration component was observed at 65.63 Hz. The average vibration peak value was 63.7 in/s, pk, which was the maximum value. When the cutting speed was 200 m/min, the rotating speed was 3149 RPM and a vibration component was observed at 52.48 Hz. The average frequency peak value was 60.0 in/s, pk, which indicated the minimum value and was 5.8% lower than the maximum value.
As shown in Figure 5b, the servomotor cooling fan exhibited a consistent vibration component regardless of the change in cutting speed. The cooling fan that rotated at a fixed speed for the cooling of the servomotor generated a vibration component of 120 Hz at 7200 RPM. The average frequency peak value was 57 in/s, pk.
As shown in Figure 5c, the spindle vibration component changes depending on the change in the cutting speed, which is identical to that of the servomotor. In particular, when the cutting speed increased to 250 m/min, the rotating speed was 2274 RPM and a vibration component was observed at 37.9 Hz. The average frequency peak value was 73.93 in/s, pk, which was the maximum value. When the cutting speed was 150 m/min, the rotating speed was 1364 RPM and a vibration component was observed at 22.7 Hz. The average frequency peak value was 62.80 in/s, pk, which indicated the minimum value and was 15.0% lower than the maximum value.
As shown in Figure 5d, the vibration of the hydraulic pump exhibits a consistent vibration component identical to the servomotor cooling fan. The hydraulic pump used to hydraulically operate the tailstock and the hydraulic chuck that fixes the workpiece exhibited a vibration component at 29.7 Hz when rotating at 1780 RPM. The average frequency peak value was 63.3 in/s, pk.
Thus, comprehensively comparing the components of the measured results showed that under a cutting speed of 150 m/min, the vibration occurring from the hydraulic pump operation would most significantly impact the cutting. However, as the cutting speed increased, the vibration occurring at the spindle was identified to have the most impact at a cutting speed of 250 m/min.
In addition, the vibration intensity depending on the change in tension was analyzed with the total vibration amount as the overall scale of vibration. As shown in Figure 6, (a) the belt tension and (b) the cutting speed were used for a time-series presentation.
As shown in Figure 6a, the total vibration amount depending on each cutting speed change can be identified. The results show that the total vibration increases as the cutting speed increases and the total vibration increases depending on the change in belt tension.
As shown in Figure 6b, the total vibration amount depending on the change in tension can be calculated from each cutting speed. At a cutting speed of 150 m/min, a maximum value of 78.4 in/s, pk was observed at Tension 3 (605 N), and a minimum value of 77.8 in/s, pk was observed at Tension 1 (405 N). At a cutting speed of 200 m/min, a maximum value of 79.0 in/s, pk was identically reached at Tensions 2 (505 N) and 3 (605 N). Moreover, a minimum value of 78.5 in/s, pk was observed at Tension 1 (405 N). At a cutting speed of 250 m/min, Tensions 1 (405 N) and 2 (505 N) exhibited identical maximum values at 79.8 in/s, pk, and a minimum value of 79.7 in/s, pk was observed at tension 3 (605 N) at a small difference.
Therefore, comparing the total vibration amount showed that efficient results were achieved at a cutting speed of 250 m/min and at Tension 3 (605 N) by a significantly small difference. However, outstanding results were shown at Tension 1 (405 N), undercutting speeds of 150 and 200 m/min.

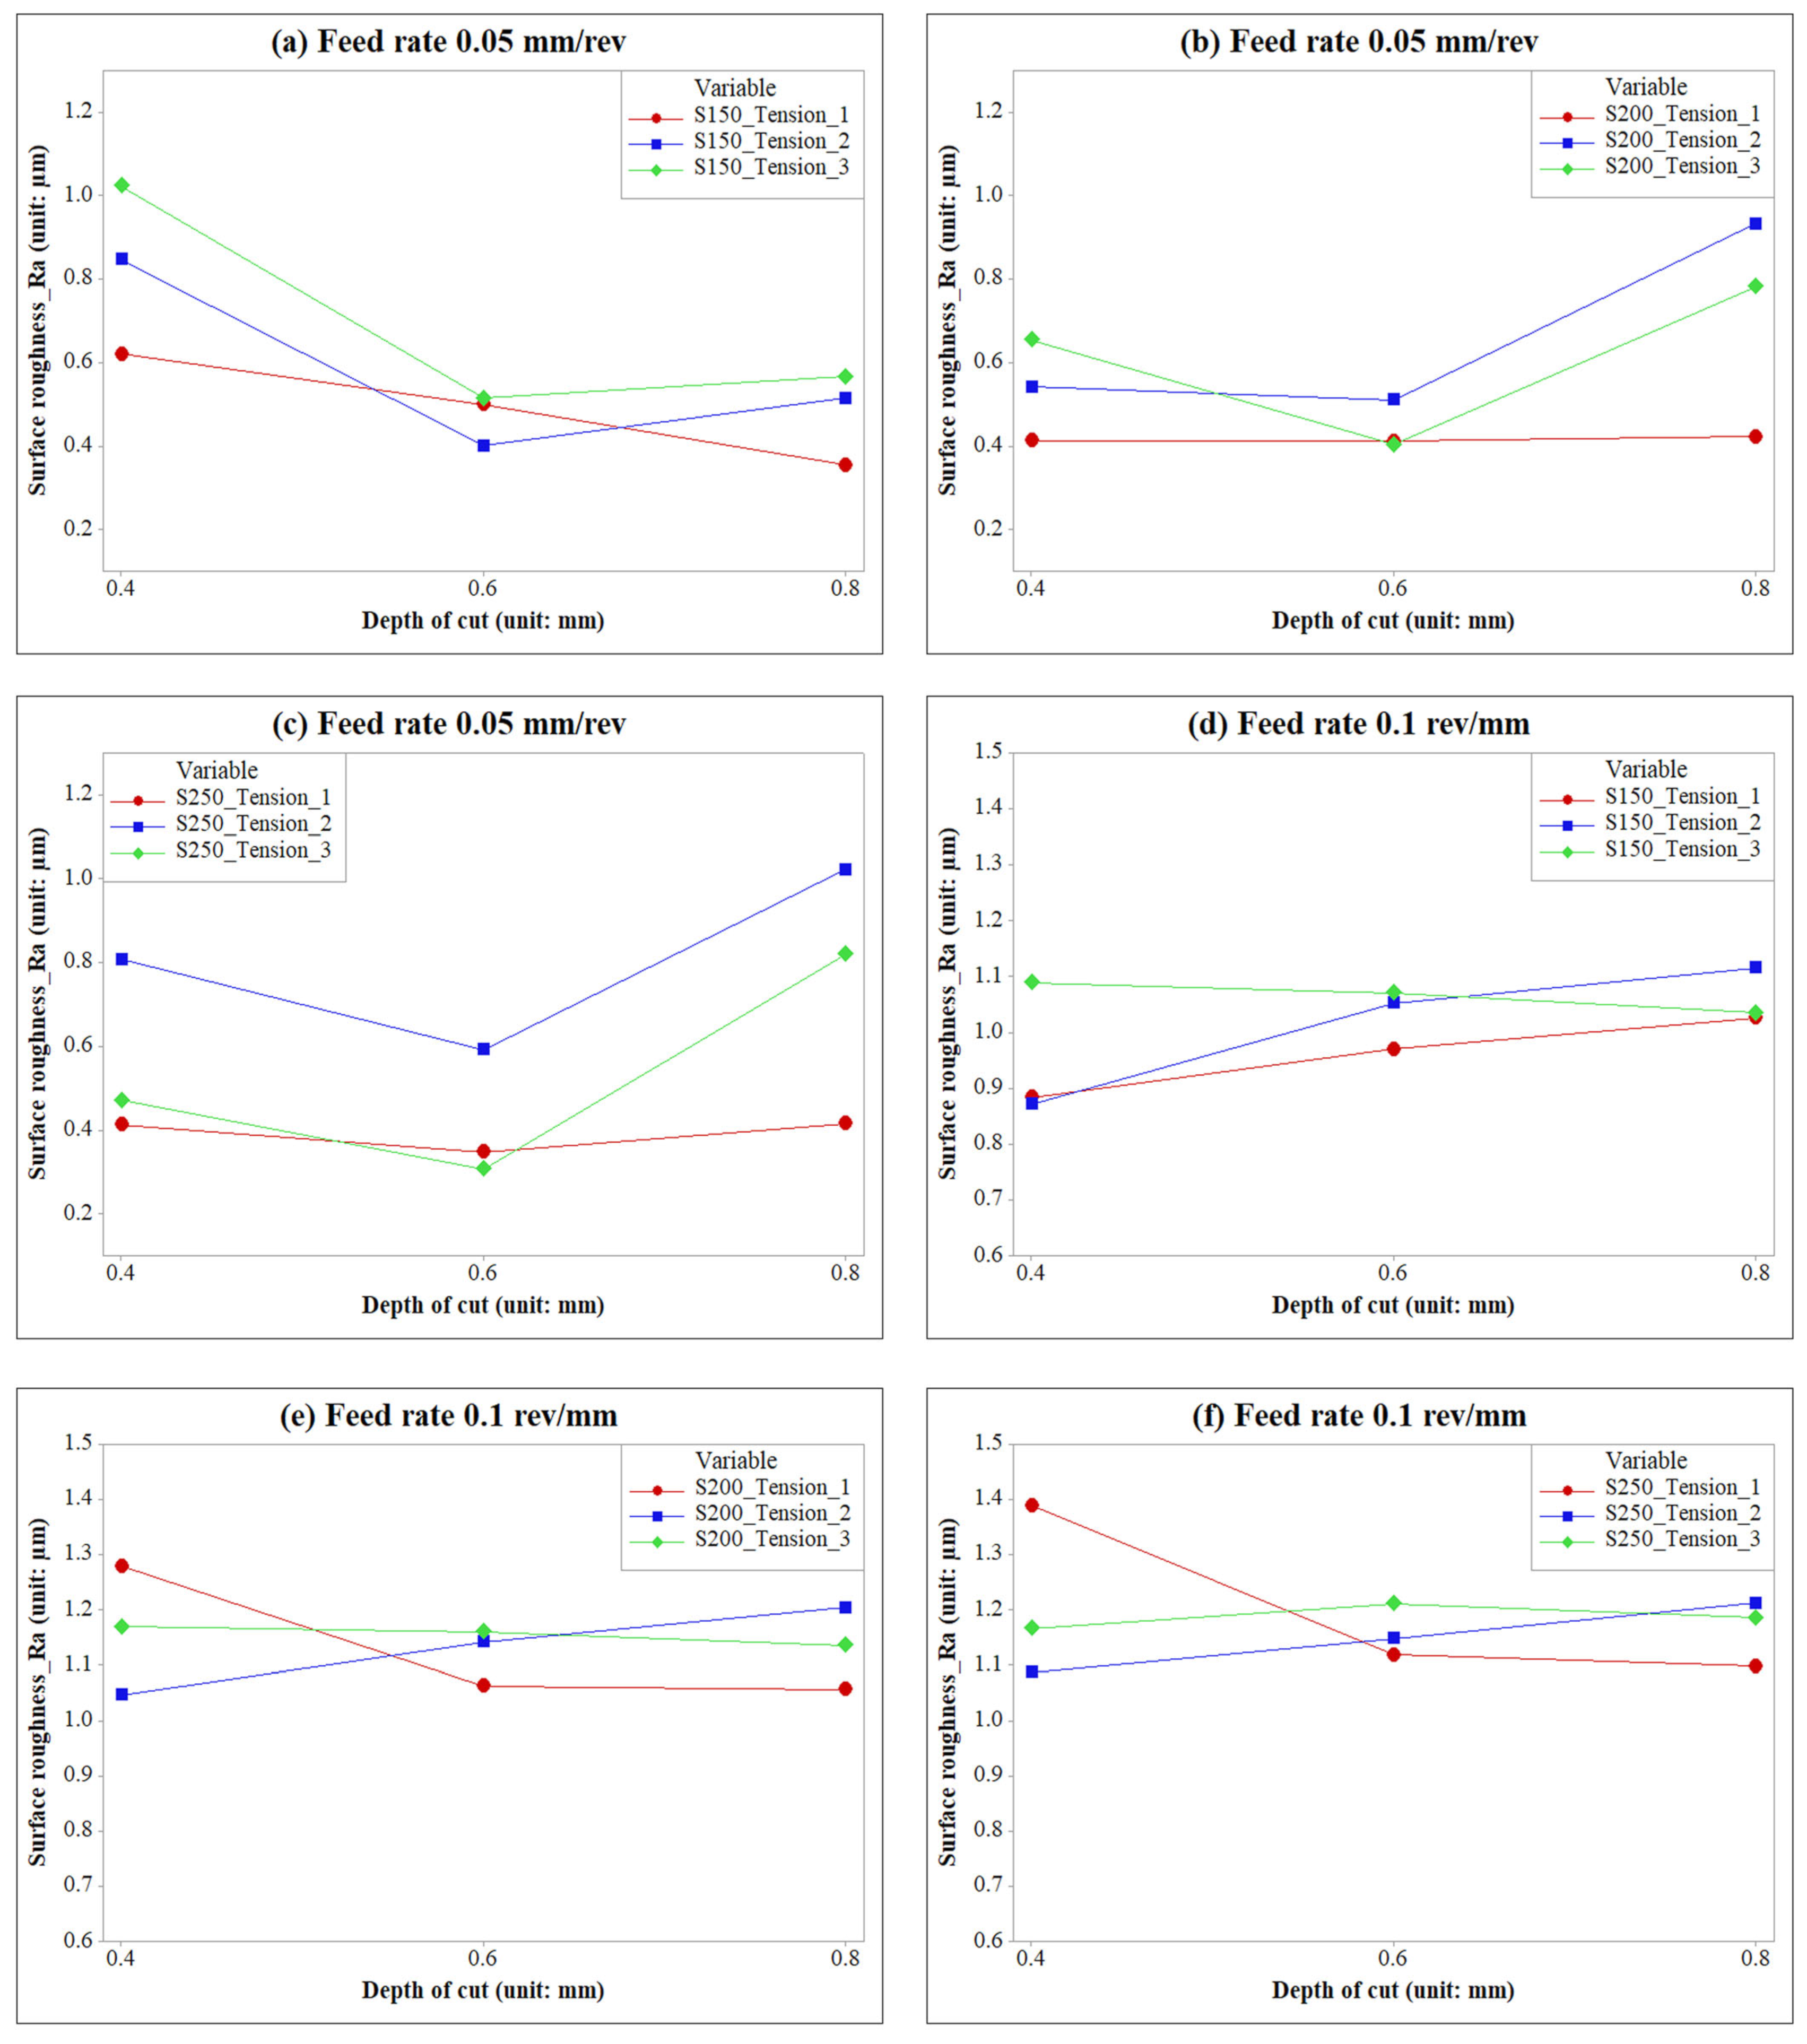
3.2. Analysis of Measured Surface Roughness

For the measurement analysis of surface roughness, 54 workpieces were processed according to the cutting conditions, and the surface roughness was assessed four times as shown in Figure 4. The surface roughness results according to the change in belt tension under each cutting condition are shown in Figure 7. The average surface roughness (Ra) was used as a typical method of representing the surface roughness, and the relevant equation is shown in Equation (2).
R a = 1 L 0 L f ( x ) d x
The experimental results are classified according to the feed rate of 0.05 mm/rev as shown in Figure 7a–c, and the criteria are a feed rate of 0.1 mm/rev for Figure 7d,f.
Figure 7a shows surface roughness versus cutting depth under a cutting speed of 150 m/min. In the results of Tension 1, a minimum value of 0.35 μ m was observed at a cutting depth of 0.8 mm and 0.6 μ m at 0.4 mm cutting depth. In the results of Tension 2, a minimum value of 0.40 μ m was observed at a cutting depth of 0.6 mm. Under Tension 3, 1.02 μ m was observed at a cutting depth of 0.4 mm, which was a 70.0% increase from the minimum value, 0.51 μ m was observed at a 0.6 mm cutting depth, which was a 27.5% increase from the minimum value, and 0.57 μ m was observed at a 0.8 mm cutting depth, which was a 62.8% increase from the minimum value. Therefore, under the condition of (a) and the belt tension of Tension 1, efficient results were achieved when the cutting depths were 0.4 and 0.8 mm. When the belt tension was Tension 2, a sound result was achieved when the cutting depth was 0.6 mm.
Figure 7b shows the surface roughness versus the cutting depth under a cutting speed of 200 m/min. Under Tension 1, the minimum values were consistent at 0.41 μ m at a cutting depth of 0.4 mm, 0.41 μ m at a cutting depth of 0.6 mm, and 0.42 μ m at a cutting depth of 0.8 mm. Under Tension 2, 0.51 μ m was observed at a cutting depth of 0.6 mm, which was a 24.4% increase from the minimum value, and 0.93 μ m was observed at a cutting depth of 0.8 mm, which was a 121.4% increase from the minimum value. Under Tension 3, 0.65 μ m was attained at a cutting depth of 0.4 mm, which was a 58.5% increase from the minimum value. Thus, the surface roughness results were overall excellent when the belt tension corresponded to Tension 1.
Figure 7c presents the surface roughness according to the cutting depth under a cutting speed of 250 m/min. Under Tension 1, 0.41 μ m was observed at a 0.4 mm cutting depth, and an identical minimum value of 0.41 μ m was observed at a 0.8 mm cutting depth. Under Tension 3, a minimum value of 0.31 μ m was observed at 0.6 mm. Under Tension 2, 0.81 μ m was observed at a 0.4 mm cutting depth, which was a 97.5% increase from the minimum value, 0.59 μ m was observed at a 0.6 mm cutting depth, which was a 90.3% increase from the minimum value, and 1.0 μ m was observed at a 0.8 mm cutting depth, which was a 143.9% increase from the minimum value. Thus, under the conditions of Figure 7c, excellent results were achieved when the belt tension corresponded to Tension 1 at cutting depths of 0.4 mm and 0.8 mm. When the belt tension was Tension 3, an efficient result was achieved when the cutting depth was 0.6 mm.
Figure 7d shows the surface roughness versus the cutting depth under a cutting speed of 150 m/min. Under Tension 1, 0.97 μ m was observed at a cutting depth of 0.6 mm, and a minimum of 1.02 μ m was observed at a cutting depth of 0.4 mm. Under Tension 2, a minimum value of 0.87 μ m was observed at a cutting depth of 0.4 mm, and 1.11 μ m was observed at a cutting depth of 0.8 mm, which was an 8.8% increase from the minimum value. Under Tension 3, 1.1 μ m was observed at a 0.4 mm cutting depth, which was a 26.4% increase from the minimum value, and 1.07 μ m was observed at a 0.6 mm cutting depth, which was a 10.3% increase from the minimum value. Thus, under the conditions in Figure 7c, excellent results were achieved when the cutting depths were 0.6 and 0.8 mm and the belt tension was Tension 1. When the belt tension was Tension 2, an excellent result was achieved when the cutting depth was 0.4 mm.
Figure 7e shows the surface roughness versus the cutting depth under a cutting speed of 200 m/min. Under Tension 1, a maximum value of 1.27 μ m was observed at a 0.4 mm cutting depth, and minimum values of 1.06 and 1.05 μ m were observed at 0.6 and 0.8 mm cutting depths, respectively. Under Tension 2, a minimum value of 1.05 μ m was observed at a 0.4 mm cutting depth, which was an 17.3% decrease from the maximum value, and 1.2 μ m was observed at a 0.8 mm cutting depth, which was a 14.28% increase from the minimum value. Under Tension 3, 1.16 μ m was observed at a 0.6 mm cutting depth, which was a 9.4% increase from the minimum value. Thus, under the conditions of Figure 7e, excellent results were achieved when the cutting depths were 0.6 and 0.8 mm and the belt tension was Tension 1. Moreover, an excellent result was achieved when the cutting depth was 0.4 mm under Tension 2.
Figure 7f shows surface roughness versus cutting depth under a cutting speed of 250 m/min. In the results of Tension 1, a maximum value of 1.38 μ m was observed at a 0.4 mm cutting depth, 1.11 μ m at a 0.6 mm cutting depth, and a minimum value of 1.10 μ m was observed at a 0.8 mm cutting depth. Under Tension 2, a minimum value of 1.08 μ m was observed at a 0.4 mm cutting depth, which was a 21.7% decrease from the maximum value, and 1.19 μ m was observed at a 0.8 mm cutting depth, which was a 7.2% increase from the minimum value. Under Tension 3, 1.21 μ m was observed at 0.6 mm, which was an 9.0% increase from the minimum value. Thus, in Figure 7f, excellent results were achieved when the cutting depths were 0.6 and 0.8 mm under Tension 1, and a sound result was achieved when the cutting depth was 0.4 mm under Tension 2.
By measuring the surface roughness, the impact of the cutting conditions and the tension change the surface roughness could be identified. Consequently, the results from Tension 1 showed an overall best surface roughness. In particular, when the feed rate was 0.05 mm/rev, excellent results were achieved when the cutting speeds were 150 and 250 m/min. Additionally, when the feed rate was 0.1 mm/rev, excellent results were achieved when the cutting speeds were 150 and 250 m/min. Further, the lowest total vibration amount was observed in the total vibration in Figure 6 under Tension 1 and cutting speeds of 150 and 250 m/min. Therefore, comprehensively considering the surface roughness results and the total vibration amount showed significantly excellent results under Tension owing to the sound vibration properties. The optimal cutting condition of the cutting speeds of 200 or 250 m/min and a cutting depth (diameter) that corresponded to a 0.4 mm turning to insert the nose radius (R) showed the best results.

4. Conclusions

This study measured the surface roughness of workpieces after cutting and the vibration of the rotating spindle according to each cutting condition and by adjusting the tension of the belt that operated the spindle to analyze the impact of the vibration characteristics with the change in the belt tension of the CNC lathe on the cutting process. Thus, the results are summarized as follows.
The vibration that was generated as the spindle rotated according to the cutting conditions and the operation of the CNC lathe typically corresponded to the spindle, servomotor, hydraulic pump, and cooling fan. In particular, as the RPM increased, the spindle and servomotor frequency and peak values increased accordingly. The total vibration measurement tended to increase along with the increase in cutting speed. Moreover, significantly outstanding vibration properties were achieved under the condition of Tension 1.
For the result of the surface roughness, the lowest surface roughness of 0.31 µm was shown in Tension 3 under the depth of cut 0.6 mm as the cutting speed increased from 150 to 200 and 250 m/min based on the feed rate of 0.05 mm/rev. Tension 1 showed 0.35 µm, 13.2 % higher than Tension 3 at a 250 m/min cutting speed. This result is excellent, and the lowest surface roughness was shown in the state of Tension 1 at a depth of cut of 0.4 and 0.8 mm. In addition, at a cutting speed of 200 or 250 m/min, stable results were obtained while maintaining a constant level of surface roughness.
The lowest surface roughness was 0.87 µm in the Tension 2 condition under the cutting speed of 150 m/min based on a feed rate of 0.1 mm/rev and a depth of cut of 0.4 mm. However, Tension 1 showed 0.88 µm, which is 1.43% higher than Tension 2 at a cutting speed of 150 mm/min, and this result is also excellent. Additionally, the lowest surface roughness was obtained under Tension 1 at cutting speeds of 200 and 250 mm/min and depth of cut of 0.6 and 0.8 mm. However, at a depth of cut of 0.4 mm, the surface roughness increased by 22.2% at a cutting speed of 200 m/min and by 27.7% at a cutting speed of 250 m/min, compared to T2, which had the lowest surface roughness result.
Consequently, overall excellent surface roughness was achieved under Tension 1 in the surface roughness results.
Thus, we concluded that the optimal vibration characteristics and excellent surface roughness were achieved under a relatively loose belt tension. Additionally, the optimal cutting condition could be identified through the results of surface roughness measurements. The most outstanding surface roughness results were achieved when the cutting speeds were 200 and 250 m/min and the cutting depth was 0.6 and 0.8 mm, which corresponded to 0.4 mm turning insert nose R.

Author Contributions

Conceptualization, I.-S.K.; methodology, T.-H.L.; validation, I.-S.K. and T.-H.L.; formal analysis, I.-S.K.; investigation, I.-S.K.; resources, T.-H.L.; writing—original draft preparation, I.-S.K.; writing—review and editing, I.-S.K. and T.-H.L.; visualization, I.-S.K.; supervision, T.-H.L.; project administration, I.-S.K.; funding acquisition, T.-H.L. All authors have read and agreed to the published version of the manuscript.

Funding

This research received no external funding.

Institutional Review Board Statement

Not applicable.

Informed Consent Statement

Not applicable.

Data Availability Statement

Not applicable.

Conflicts of Interest

The authors declare no conflict of interest.

References

  1. You, S.H.; Lee, J.H.; Oh, S.H. A Study on Cutting Characteristics in Turning Operations of Titanium Alloy used in Automobile. Int. J. Precis. Eng. Manuf. 2019, 20, 209–216. [Google Scholar] [CrossRef] [Green Version]
  2. Lee, J.H.; Ge, J.C.; Song, J.H. Study on Burr Formation and Tool Wear in Drilling CFRP and Its Hybrid Composites. Appl. Sci. 2021, 11, 384. [Google Scholar] [CrossRef]
  3. Wang, W.; Yang, D.; Wang, R.; Wei, F.; Liu, M. The Optimization of Machining Parameters on Cutting Force during Orthogonal Cutting of Graphite/Polymer Composites. Processes 2022, 10, 2096. [Google Scholar] [CrossRef]
  4. Zhou, K.; Zhang, C.; Du, S. Cutting Force Prediction for Trochoid Milling of 300M Ultra-High Strength Steel. Processes 2022, 10, 2617. [Google Scholar] [CrossRef]
  5. Wojciechowski, S.; Matuszak, M.; Powałka, B.; Madajewski, M.; Maruda, R.W.; Królczyk, G.M. Prediction of cutting forces during micro end milling considering chip thickness accumulation. Int. J. Mach. Tools Manuf. 2019, 147, 103466. [Google Scholar] [CrossRef]
  6. Kurt, A.; Bakir, S. Theoretical analysis and mathematical modeling of deformation and stresses of the grooving tool. Neural Comput. Appl. 2020, 32, 10481–10500. [Google Scholar] [CrossRef]
  7. Ren, Z.; Jiang, H.; Zou, Z.; Yuan, S. Simulation Prediction and Experiment of Brittle Damage of Cemented Carbide Microgroove Turning Tools Based on Peridynamics. Processes 2023, 11, 520. [Google Scholar] [CrossRef]
  8. Yin, G.; Shen, J.; Wu, Z.; Wu, X.; Jiang, F. Experimental Investigation on the Machinability of PCBN Chamfered Tool in Dry Turning of Gray Cast Iron. Processes 2022, 10, 1547. [Google Scholar] [CrossRef]
  9. Del Sol, I.; Rivero, A.; Gamez, A.J. Effects of Machining Parameters on the Quality in Machining of Aluminium Alloys Thin Plates. Metals 2019, 9, 927. [Google Scholar] [CrossRef] [Green Version]
  10. Tsai, M.Y.; Chang, S.Y.; Hung, J.P.; Wang, C.C. Investigation of milling cutting forces and cutting coefficient for aluminum 6060-T6. Comput. Electr. Eng. 2016, 51, 320–330. [Google Scholar] [CrossRef]
  11. Bombiński, S.; Kossakowska, J.; Jemielniak, K. Detection of accelerated tool wear in turning. Mech. Syst. Signal Process. 2022, 162, 108021. [Google Scholar] [CrossRef]
  12. Anwar, S.; Khan, N.A.; Khan, S.A.; Raza, S.F. One-Step High-Speed Finish Drilling of Inconel 718 Superalloy via Novel Inserts. Processes 2023, 11, 752. [Google Scholar] [CrossRef]
  13. Wang, R.; Yang, D.; Wang, W.; Wei, F.; Lu, Y.; Li, Y. Tool Wear in Nickel-Based Superalloy Machining: An Overview. Processes 2022, 10, 2380. [Google Scholar] [CrossRef]
  14. Bouzid, L.; Yallese, M.A.; Chaoui, K.; Mabrouki, T.; Boulanouar, L. Mathematical modeling for turning on AISI 420 stainless steel using surface response methodology. Proc. Inst. Mech. Eng. Part B J. Eng. Manuf. 2015, 229, 45–61. [Google Scholar] [CrossRef]
  15. Dubey, V.; Sharma, A.K.; Vats, P.; Pimenov, D.Y.; Giasin, K.; Chuchala, D. Study of a Multicriterion Decision-Making Approach to the MQL Turning of AISI 304 Steel Using Hybrid Nanocutting Fluid. Materials 2021, 14, 7207. [Google Scholar] [CrossRef] [PubMed]
  16. Binali, R.; Demirpolat, H.; Kuntoğlu, M.; Sağlam, H. Machinability Investigations Based on Tool Wear, Surface Roughness, Cutting Temperature, Chip Morphology and Material Removal Rate during Dry and MQL-Assisted Milling of Nimax Mold Steel. Lubricants 2023, 11, 101. [Google Scholar] [CrossRef]
  17. Ni, C.; Zhu, L.; Zheng, Z.; Zhang, J.; Yang, Y.; Hong, R.; Bai, Y.; Lu, W.F.; Wang, H. Effects of machining surface and laser beam scanning strategy on machinability of selective laser melted Ti6Al4V alloy in milling. Mater. Des. 2020, 194, 108880. [Google Scholar] [CrossRef]
  18. Lee, S.-K. The Effect of Surface Roughness on Cutting Tool Shape in CNC Lathe C-Axis Turn-mill Machining. Korean Soc. Manuf. Process. Eng. 2017, 16, 62–68. [Google Scholar] [CrossRef]
  19. Aouici, H.; Elbah, M.; Benkhelladi, A.; Fnides, B.; Boulanouar, L.; Yallese, M.A. Comparison on various machinability aspects between mixed and reinforced ceramics when machining hardened steels. Mech. Ind. 2019, 20, 109. [Google Scholar] [CrossRef] [Green Version]
  20. Mac, T.-B.; Luyen, T.-T.; Nguyen, D.-T. A Study for Improved Prediction of the Cutting Force and Chip Shrinkage Coefficient during the SKD11 Alloy Steel Milling. Machines 2022, 10, 229. [Google Scholar] [CrossRef]
  21. Tagiuri, Z.A.M.; Dao, T.-M.; Samuel, A.M.; Songmene, V. Numerical Prediction of the Performance of Chamfered and Sharp Cutting Tools during Orthogonal Cutting of AISI 1045 Steel. Processes 2022, 10, 2171. [Google Scholar] [CrossRef]
  22. Agic, A.; Eynian, M.; Ståhl, J.-E.; Beno, T. Experimental analysis of cutting edge effects on vibrations in end milling. CIRP J. Manuf. Sci. Technol. 2019, 24, 66–74. [Google Scholar] [CrossRef]
  23. Hu, Y.; Li, S.; Deng, X.; Vadim, S. Correlation analysis of noise sound pressure and vibration in aluminum alloy milling. J. Vib. Control. 2022, 28, 276–289. [Google Scholar] [CrossRef]
  24. Altintas, Y.; Weck, M. Chatter Stability of Metal Cutting and Grinding. CIRP Ann. 2004, 53, 619–642. [Google Scholar] [CrossRef]
  25. Kang, I.-S.; Yang, S.-M. The Effect of the Back-Pressure Changes in an Exhaust System on Vibration When Attaching a Variable Device during Idling. Sensors 2022, 22, 3985. [Google Scholar] [CrossRef]
Figure 1. Schematic of the experimental procedure. (a) Tension adjustment of the belt that transmits power to the servomotor and spindle of the CNC lathe; (b) vibration measurement of the spindle inside the cutting room; (c) workpiece cutting according to conditions; (d) measurement of surface roughness after cutting.
Processes 11 01079 g001
Figure 2. Major components of vibration in CNC lathes. (a) CNC lathe used in the experiment; (b) servomotor used to drive the spindle; (c) belt and main spindle connected to the servomotor to transmit power; (d) hydraulic pump used to operate the hydraulic chuck and tailstock; and (e) hydraulic chuck to hold the workpiece.
Processes 11 01079 g002
Figure 3. Schematic of tools and workpieces used in cutting. (a) Information on workpieces used for cutting; (b) information on tools used for cutting; (c) accelerometer used for vibration measurement and direction of measurement; (d) spindle at vibration measuring position; (e) hydraulic chuck to hold the workpiece; and (f) Vibration data collector used for vibration measurement.
Processes 11 01079 g003
Figure 4. Schematic of surface roughness measurement at four points on a workpiece after cutting.
Processes 11 01079 g004
Figure 5. Results of frequency analysis of measured vibrations. (a) Frequency analysis of servomotor; (b) frequency analysis of cooling fans; (c) frequency analysis of spindle; and (d) frequency analysis of hydraulic pump.
Processes 11 01079 g005
Figure 6. Analysis result of overall vibration. (a) Overall vibration according to belt tension; (b) overall vibration according to cutting speed.
Processes 11 01079 g006
Figure 7. Results of measured surface roughness. (a) Cutting at a feed speed of 0.05 mm/rev and a cutting speed of 150 m/min; (b) cutting at a feed speed of 0.05 mm/rev and a cutting speed of 200 m/min; (c) cutting at a feed speed of 0.05 mm/rev and a cutting speed of 250 m/min; (d) cutting at a feed speed of 0.1 mm/rev and a cutting speed of 150 m/min; (e) cutting at a feed speed of 0.1 mm/rev and a cutting speed of 200 m/min; and (f) cutting at a feed speed of 0.1 mm/rev and a cutting speed of 250 m/min.
Processes 11 01079 g007
Table 1. Specifications of the CNC lathe used in the experiment.
DescriptionSpecification
Max. Turning Diameter320 mm
Max. Turning Length305 mm
Standard chuck size8 inch
Max. Spindle speed4000 rpm
Max. Spindle power11 kW
Table 2. Specifications of belts used in CNC lathes.
DescriptionSpecification
Belt pitch3.56 mm
Belt pitch length1730 mm
Belt width17.8 mm
Table 3. Specifications of the sonic tension meter used in the experiment.
DescriptionSpecification
Measurable frequency band10–5000 Hz
Total length170 mm
Sensor outer diameter12.5 mm
Table 4. Results of belt tension measured using a sonic tension meter.
Tension1st2nd3rd4th5thMean
Tension 1
(loose)
407 N
26.0 Hz
408 N
26.1 Hz
409 N
26.1 Hz
410 N
26.1 Hz
408 N
26 Hz
408.4 N
26.1 Hz
Tension 2
(standard)
509 N
29.1 Hz
510 N
29.1 Hz
508 N
29.1 Hz
510 N
29.1 Hz
511 N
29.2 Hz
509.6 N
29.1 Hz
Tension 3
(tight)
605 N
31.7 Hz
608 N
31.8 Hz
609 N
31.8 Hz
606 N
31.8 Hz
609 N
31.8 Hz
607.4 N
31.78 Hz
Table 5. Specifications of the vibration data collector used in the experiment.
DescriptionSpecification
Measurementsacceleration
velocity (by integration)
displacement
Bandwidth0.5–40 kHz
Dynamic range104 dB
Sampling rate102.4 kHz
Table 6. Cutting conditions used in the experiment.
DescriptionSpecification
Cutting speed150, 200, and 250 m/min
Depth of cut0.4, 0.6, and 0.8 mm
Feed rate0.05 and 0.1 mm/rev
Table 7. Chemical composition of AISI 1020 steel by Wt.
ElementContent (wt %)
C0.18~0.23
Mn0.30~0.60
P0.040 (Max)
S0.050 (Max)
Si-
Table 8. Mechanical properties of AISI 1020 steel.
PropertiesMetric
Tensile strength629.541 MPa
Yield strength603.588 MPa
Hardness (HRC)13.5
Poisson’s ratio0.29
Elongation36.5%
Table 9. Specifications of the surface roughness measuring instrument used in the experiment.
DescriptionSpecification
Measuring speed0.05, 0.1, 0.5, 1 mm/s
Detector measuring force0.75 mN
Measuring methodSkidless/skidded
Measuring range800; 80; 8 µm
Traverse50 mm
Disclaimer/Publisher’s Note: The statements, opinions and data contained in all publications are solely those of the individual author(s) and contributor(s) and not of MDPI and/or the editor(s). MDPI and/or the editor(s) disclaim responsibility for any injury to people or property resulting from any ideas, methods, instructions or products referred to in the content.

