

Impact of Some Enzymatic Treatments on Acrylamide Content in Biscuits
by
 ,
,
Amr A. El-Sayed
1,*,
Magdy M. Abdelhady
2, 
Saleh A. Jaafari
3,
Tariq M. Alanazi
4 and
Alaa S. Mohammed
1 1
Food Science Department, Faculty of Agriculture, Zagazig University, Zagazig 44511, Egypt
2
Horticulture Crop Processing Research Department, Food Technology Research Institute, Agriculture Research Center, Giza 12619, Egypt
3
Edabi General Hospital, Jazan 5741, Saudi Arabia
4
Security Forces Hospital, Riyadh 11481, Saudi Arabia
*
Author to whom correspondence should be addressed.
Processes 2023, 11(4), 1041; https://doi.org/10.3390/pr11041041
Submission received: 22 February 2023
/
Revised: 15 March 2023
/
Accepted: 27 March 2023
/
Published: 29 March 2023
(This article belongs to the Special Issue Food Processing and Food Analysis: Principles, Techniques, and Applications)
Abstract
:Since its discovery in many heat-treatment foods in 2002, many efforts have been made to reduce acrylamide levels in foods. Methods to reduce acrylamide levels by reducing Maillard reaction products have been considered. However, baking cookies produces acrylamide, a carcinogenic compound. This study aimed to use a new quantitative index and formula for L-asparaginase, glucose oxidase, their 1:1 blending enzymes, baker’s yeast, and green tea powder (0.5 g/kg wheat flour) at a new proposed temperature of 37 °C for 30 min to reduce acrylamide production in biscuits and bakery products using new indicators such as asparagine reduction (%), the asparagine/acrylamide ratio, acrylamide reduction (%), and the asparagine/reducing sugar ratio. The highest acrylamide concentrations were reduced from 865 mg/kg in the blank sample (BT0) to 260 and 215 mg/kg in the mixed enzyme powder (1:1) (BT3)- and BT4-treated samples, respectively. The biscuit samples treated with 0.5 g/kg L-asparaginase reduced the acrylamide levels by approximately 67.63%, while the BT3 samples showed acrylamide levels of 69.94% and asparagine levels of 68.75% and 47%, respectively, compared with percentage in the untreated sample (blank), 95%. This percentage was 54.16% for the BT4 samples. The results showed that acrylamide was formed during baking, and all treatment samples inhibited its formation, making it possible to produce foods with low levels of acrylamide in starchy foods in the food industry at 37 °C for 30 min and preserving the quality and nutritional value of the final product. It can be used as a specialty food or functional food and protects school-agechildren, as well as youth on campus, from approximately 70–80% of their daily intake of acrylamide.

1. Introduction
Baked products, including cookies, are becoming increasingly popular around the world due to their nutritious qualities and suitability for use in nutritional programs and emergencies such as hurricanes, thunderstorms, and earthquakes. However, baked products are responsible for 20% of acrylamide consumption in Europe [1]. The Brazilian Consumers Association tested the acrylamide levels of 51 products across eight food categories in 2013 and found that French bread, and sweet and savory biscuits had the highest levels of acrylamide [2]. For example, confectionery had acrylamide levels ranging from 1100 mg/kg to 100 mg/kg. Biscuits are a popular snack for people of all ages, especially in lower-income countries where protein lack and malnutrition are rampant [3]. The British originally invented the biscuit [4]. It has a shelf life of six months or more; has diversified taste and texture; and is popular among all ages for its convenience, taste, and low cost [5]. However, these products, along with coffee and potato products, contribute to the dietary intake of acrylamide (AA), a hazardous chemical designated as “possibly carcinogenic to humans” by the International Agency for Research on Cancer (group 2A). Acrylamide (AA) is colorless and odorless and has a molecular weight of 71.08 kDa. In numerous heat-treated high-carbohydrate meals, AA has been found in much higher concentrations than other known food carcinogens [6].
The formation of AA in food is due to the immediate presence of reducing sugars and asparagine in conjunction with the processing environment (temperatures above 120 °C and low humidity), which triggers the Maillard reaction [7]. International regulations on the maximum tolerable levels of AA in foods have become increasingly preemptive over the years [8]. Also, efforts are being made to put mitigating measures in place at the level of the food industry business.
Asparagine in flours is the main AA precursor, so several studies have been conducted to examine the impact of different flour sources and blends on AA formation in baked goods [9]. In general, it has been shown that grain or nongrain varieties with higher levels of free asparagine produce biscuits with higher levels of AA [10]. In contrast, Žilić et al. [11] observed that the concentrations of asparagine in various tested flours (e.g., wheat, oat, rye, barley, triticale, and corn) showed no significant relationship with the AA concentrations measured in biscuits prepared with different formulations. When Capuano et al. [12] prepared crusty bread with wheat and rye and toasted different types of whole grain flour under different time and temperature conditions, they found no correlation between the asparagine concentration in the starting ingredient and the AA in the final product. These findings suggest that other flour compounds and properties may affect the extent of the Maillard reaction and, hence, the formation of AA.
School feeding programs can make a significant difference in children’s nutrient and meal intake. School children spend at least 6 h a day in school and consume up to 47% of their calories there [13]. Nutrition is an essential part of children’s health. The FAO recognizes the role that schools can and do play in the implementation of the International Covenant on Economic, Social and Cultural Rights (ICESCR) [13]. Signatories to the Right to Food owe a duty to people to respect, protect, and fulfill their right to regular and dignified access to nutritious and culturally appropriate food [14]. Rising income poverty, food insecurity, and school closures in many countries have drawn public and political attention to the role of school meals as health and welfare measures and, in this context, as a human right.
Although recent research has clarified the process of AA formation via the asparagine and carbohydrate pathways, more research is needed on the respective elements that influence AA formation in a given dietary matrix. Free asparagine and reducing sugars are the same AA precursors found in potatoes, coffee, and grains. However, the relative importance of these two variables varies widely between the three species. Sugar reduction thrives in cereal grains, so the most important or rate-limiting factor affecting AA formation in baked goods is free asparagine concentration [15]. The average concentration of free asparagine in rarely used cereals has been reported to be 426 ± 144 and 1179 ± 359 mg/kg [16]. According to the published studies, it is difficult to determine whether the differences in AA concentration found in the final biscuits are due solely to variations in the initial amount of asparagine in the flours or to the effects of the fiber and protein content of the flour.
Several strategies have been proposed to prevent acrylamide formation in food, mainly by removing reducing sugars and amino acid precursors or by influencing the Maillard reaction in terms of heating time and temperature [12]. Several pretreatments, such as sodium, acid pyrophosphate [17], organic acids [18], divalent cations [19], and lactic acids, have been used to reduce the formation of acrylamide in foods [20]. However, these compounds had a negative impact on the taste, aroma, nutritional value, and appearance of the final product [21].
Because of their high selectivity, catalytic activity, moderate reaction conditions, and low environmental impact, enzymes are used as biocatalysts in a variety of fields. L-asparaginase (EC 3.5.1.1) catalyzes the hydrolysis of L-asparagine to ammonia and aspartic acid, thereby removing acrylamide precursors [22]. The use of L-asparaginase to reduce the initial levels of L-asparagine is one of the most recent innovations in reducing acrylamide formation [23,24,25]. Asparagine’s L-effectiveness in reducing acrylamide levels in foods without sacrificing taste, texture, or aroma has been widely reported [26]. Commercial L-asparaginase has been shown to reduce acrylamide in potato strips used in French fries [26], with approximately 60% acrylamide in potato strips, blanched for 10 min at 75 °C. In addition, L-asparaginase has a negligible effect on the nutritional and sensory profiles of heated products [27]. The main function of asparaginase is to convert asparagine into aspartic acid while preserving all the sensory properties of the end product [28]. Glucose oxidase, on the other hand, converts glucose into gluconic acid (GA).
Glucose oxidase (GOx, EC 1.1.3.4) is a structural analogue containing a tightly but noncovalently bound cofactor, flavin adenine dinucleotide (FAD), that acts as a redox carrier during the catalytic process [29]. Due to its unique catalytic mechanism, Gox is widely used in GA production, glucose biosensors for diabetes monitoring, biofuel cells, food and beverage additives, low-alcohol wine production, the textile industry, and the antitumor drug and feed industries [30]. In an aerobic environment, Gox can specifically oxidize -D-glucose to produce D-gluconate lactone and hydrogen peroxide, and D-gluconate lactone is then hydrolyzed, non-enzymatically, to GA. The byproduct of the catalytic reaction, hydrogen peroxide, negatively affects the stability and activity of GOx and prevents the industrial production of GA [31].
GOx has been cited for commercial use as an important alternative to chemical antioxidants in the food industry. Each molecule of this flavoprotein contains two active sites. It catalyzes -D-glucose oxidation to gluconic acid and hydrogen peroxide (H2O2) [32]. GOx has a wide range of applications, particularly where there is a need to remove glucose or O2 to extend food shelf life or to produce H2O2 or gluconic acid. It is used in the food industry to prevent fat from going rancid and to prevent oxygen deprivation from fruit juices and beverages. It has been reported that GOx can be used as an alternative to bleaching or processing milk to produce H2O2 [33]. GOx has also been used to make low-alcohol wine [34]. Studies have also reported that using Gox acts mostly as oxygen scavenger, and cause controlled browning, and that can increase the shelf life of foods [35]. In addition, GOx has been shown to have potent antimicrobial properties against a wide range of fungal strains and foodborne bacteria [36]. Despite the wide range of applications of GOx, the instability and nonrecyclability of an enzyme are major challenges for its industrial exploitation.
Yeast is a unicellular fungus that has been studied in great detail in physiology, genetics, and molecular biology and has been used as a model to understand other microorganisms. Yeast was discovered about a hundred years ago, and at least 1500 species of yeast have been identified [37]. They have been divided into two groups, namely conventional (Saccharomyces cerevisiae and closely related species) and non-conventional yeasts. Baker’s yeast (Saccharomyces cerevisiae) is the most commercially used microorganism and the first eukaryote with a broad database of its entire genome sequence [38]. This yeast is classified in the division Ascomycota, while others are classified under Basidiomycota and Deuteromycetes [37]. Saccharomyces cerevisiae is considered an ideal microbe for cell factories due to its short replication time, easy domestication, high sporulation efficiency, low pathogenesis, and small genome size [39]. Because of its tolerance to various stresses such as low pH, osmotic stress, high ethanol and nutrient loads, and its fermentative potential, S. cerevisiae can dominate the fermentation process [40]. All these factors have made it an efficient and effective research microorganism and have provided it with several scientific discoveries [39]. Some microbial treatments have been proposed to reduce AA in baked goods [41,42]. It has been shown that 2 h fermentation processes of dough in baked goods could reduce AA content by up to 90% [41,43] due to the consumption of a limiting precursor (ASP) by the yeast. The fermentation of free ASP and reducing sugars in youtiao, a traditional Chinese fried food, showed that adding 0.8% (w/w) yeast to the dough and fermenting for 1 h could reduce the amount of AA to 66.7% [44]. Other studies also introduced fermentation as one of the most important processes that reduces AA content, which in turn ensures quality and safety of the baked goods [45].
Tea is produced from the Camellia sinensis plant’s leaves. Because of its rich aroma and flavor, ease of preparation, and powerful health benefits, tea has gained worldwide acceptance over the past 2000 years. It is one of the most consumed beverages worldwide. The global tea market was valued at USD 9.1 billion in 2021, showing a compound annual growth rate (CAGR) of 6.13% from 2021 to 2027 [46]. The profound health benefits of tea are widely recognized by consumers, and tea has long been used in Asian traditional medicine to treat digestive problems such as diarrhea [47]. Over the past few decades, a significant number of studies have shown that regular tea consumption can improve human health, as it appears to counteract cardiovascular disease, obesity, cancer, inflammatory bowel disease, and type 2 diabetes [48]. These health benefits are generally attributed to the phenolic compounds in tea. Phenolics, such as flavonoids, possess potent antioxidant, anti-inflammatory, antimicrobial, antitumor, and antiaging properties [49]. Additionally, according to the United States Department of Agriculture (USDA) Flavonoids Database, tea is the dominant dietary source of flavonoids [50,51]. Tea consumption contributes to a daily per capita intake of 157 mg of flavonoids, which is 83% of the total daily dietary intake of flavonoids, which is estimated at 189 mg [51]. The literature data show that antioxidants are able to reduce AA in foods exposed to high temperatures by inhibiting the acrylamide formation of oxidized forms of antioxidants. The antioxidant compounds are mainly flavonoids, phenolic acids found in many foods and spices [52]. Green tea extract is rich in polyphenols known for their very high antioxidant capacity [53,54]. Some studies show very good properties of green tea extracts in reducing lipid oxidation [55] and developing AA in starchy products [53].
The purpose of this study was to investigate the effect of enzyme, baker’s yeast, and green tea powder addition levels on acrylamide content in biscuits and to select the best treatments as processing recommendations. Biscuits were formulated by adding 0.5 g of the enzymes or baker’s yeast and green tea per kg of wheat flour to the biscuit components. In this way, we were confident in evaluating the properties of the processed biscuits, such as their chemical composition, essential minerals, color characteristics, and sensory evaluation.
2. Materials and Methods
2.1. Biscuit Dough Ingredients
Twenty-five kilograms of wheat flour with a 72% extraction was obtained from El-Aseel Mills for Milling Grains, El Obour City (Cairo, Egypt). Sugar powder, milk powder, butter, sodium chloride, ammonium bicarbonate, sodium bicarbonate, and baking powder were purchased from the local market in Zagazig (Egypt). The wheat flour was divided into 1 kg/glass jar and stored in the refrigerator at 4 °C until processing.
2.2. Sources of Enzymatic Powders, Baker’s Yeast, and Green Tea
The enzymatic powders of L-asparaginase aminohydrolase, the common name of which is PreventASe® (EC 3.5.1.1), was purchased from DSM company (DSM Nutritional Products LLC., Cairo, Egypt), and glucose oxidase (EC.1.1.3.4) was purchased from Sigma-Aldrich Chemistry, GmbH (Germany). Lyophilized baker’s yeast, Saccharomyces cerevisiae powder, green tea (Camellia sinensis) powder, and baking soda were purchased at a hypermarket in Zagazig (Egypt).
2.3. Application of Component Powders for Treated Biscuit Samples
Lyophilized EC 3.5.1.1 powder at a concentration of 100–300 units/mg protein (biuret) was added to aliquots of the biscuit formulation (0.5 gm/kg wheat flour quantity) to produce an enzymatically treated sample (BT1), as presented in Table 1. Our study used an incubation temperature of 37 °C for 30 min as the process conditions. Lyophilized glucose oxidase (EC.1.1.3.4) from Aspergillus niger (2000–10,000 units/g) powder was added as described above to produce the enzymatically treated sample, named BT2, while the mixed sample of enzymatic powders (1:1) was marked as BT3. The same amount of 0.5 gm/kg wheat flour was used for the baker’s yeast and green tea powders to produce samples BT4 and BT5, respectively.
2.4. Technological Process and Preparation of Biscuit Samples
The biscuit dough samples were prepared according to the recipe described in AACC method 10-54.01 [56] with some modifications, as presented in Figure 1. The recipe contained the following ingredients: 40.0 g of wheat flour (72% extraction), 16.8 g of sucrose, 16.0 g of shortening (refined sunflower oil), 0.5 g of sodium chloride, 0.6 g of sodium bicarbonate, 0.6 g of high-fructose maize syrup, 0.4 g of nonfat dry milk, and 8.8 mL of water. All ingredients were mixed thoroughly as described in AACC method 10–54 [56] using a hand dough mixer.
2.5. The Biscuit Formation, Shaping, and Baking Process
The biscuit dough was shaped by a manual meat mincer machine (Figure 2), with some modified parts, to produce bars and to cut biscuits with a range of 7 cm in length and of 3 mm in height. The baking process was performed in a locally made convection oven at 180 °C for 10 min.
2.6. Proximate Chemical Analysis of Biscuits
The moisture content was determined following AACC method 44-15.02 [56]. The protein content was determined according to AACC method 46-12.01 [56], Boric Acid Modification, which is a modification of the Kjeldahl method, and the boric acid was used in the indicator solution, to produce Boric acid-methyl red-methylene blue receiver, according to AACC method 08-03.01 [56].
The crude fiber was determined according to AACC method 32-10.01 [56]. Crude fat was determined according to AACC method 30-10.01 [56] by acid hydrolysis of the sample with HCl (25 + 11) followed by extraction of the hydrolyzed lipid materials with mixed ethers. The energy content of the biscuits was calculated using the following equation (fractional method):
Energy (Kcal/g) = [(4 × Protein) + (9 × Fat) + (4 × Carbohydrates)]
2.7. Determination of Some Essential Minerals for Treated Biscuit Samples
The mineral element contents were determined according to AACC method 40-70.01 [56] with atomic absorption spectrophotometry. This method was used to determine the calcium, iron, magnesium, and zinc content in grains and cereal products using a Perkin Elmer 2380 atomic absorption spectrophotometer (AAS) at the central laboratory of the Faculty of Agriculture, Zagazig University, Egypt. The potassium content was determined according to AACC method 40-71.01 [56] with atomic absorption spectrophotometry. A representative sample was dry-ashed to a known volume. The residue was dispersed in acid and diluted to a predetermined volume. This solution, or a dilution thereof, was analyzed for the potassium content with atomic absorption spectrophotometry. Cesium chloride was added to all solutions (standards, samples, and blank) as an ionization suppressant.
The phosphorus content was determined according to AACC method 40-57.01 [56]. In brief, the sample was placed in an 800 mL Kjeldahl flask; 20–30 mL of H2SO4 (specific gravity 1.84) and 2–4 g of NaNO3 or KNO3 were added; and the sample was digested on a Kjeldahl rack until complete carbonization. After cooling, 5 mL of concentrated HNO3 was added, and digestion was performed again. The addition of HNO3 was continued until the solution became colorless. After cooling, 150 mL of water was added, brought to a boil, and boiled for 5 min. The sample was placed in an evaporating dish, and 10–20 mL of a saturated alcohol solution of magnesium acetate was added. The alcohol was allowed to evaporate to dryness or ignition and allowed to burn off. Carefully, the mass was charred over a Bunsen burner and, then, ignited to whiteness in a muffle furnace. When cooled, the ash was dissolved with HCl or HNO3.
2.8. Determination of Chemical Characteristics of Treated Biscuits
Asparagine was determined using a colorimetric assay that was said to be specific for L-asparagine, according to [57]. The reduction in asparagine (percentage) in biscuit samples was determined to show the percentage of asparagine content that could be converted into AA in the samples. Spectrophotometry was used to determine the reducing sugar content (Jenway-UV–VIS Spectrophotometer) according to the method described by [58]. The acrylamide content was determined using a Reversed phase (RP) C18-type column (Hypersil ODS C18), which has a dimension of 4.6 mm × 15 cm in size. Chromatographic analyses were carried out using a Young Lin HPLC, series YL-9100, equipped with a quaternary pump, an autosampler (YL9150), a degasser, and a YL-9160 spectrophotometric detector (Photo Diode Array detector—PDA), which was set at 202 nm. The flow rate was fixed at 0.5 mL/min, and the solvent system consisted of acetonitrile/H2O (70:30, v/v). The mode of the HPLC instrument was isocratic, and the injection volume was 20 μL [59]. The extraction of acrylamide from the biscuit samples was carried out according to the methods of Wang et al. [60] using Waters Sep-Pak cartridges (Milford, MA, USA). The samples were purified by solid-phase extraction, and the solution was centrifuged at 14,500× g for 20 min at 0 °C to remove any lipids. The percentage of recovered acrylamide was more than 81.0%, and the precision percentage ranged from, 2.5 to 9.85% (n = 3).
Management of the acrylamide calibration curve:
The acrylamide standard was determined, with a peak observed at 3.5. A good coefficient of correlation of 0.9977 was estimated (Figure 3). The limit of detection (LOD) for acrylamide content (signal to noise 3) was 10.5 μg/kg, while the limit of quantification (LOQ) (signal to noise 10) was 33.3 μg/kg. Laboratory experiments showed that its recovery was at the level of 85% ± 5%.
To report the percentage of acrylamide content in the samples, the reduction in acrylamide (%) was determined in all biscuit samples. This percentage of acrylamide reduction may be used to recognize the most effective treatment for lowering acrylamide levels, among all the conditions and samples.
2.9. Determination of Color Properties for Treated Biscuit Samples
According to Rao et al. [61], a Hunter Lab color analyzer was used to test the color properties of biscuit samples (Hunter Lab color Flex EZ, USA). The L* value (lightness index scale) ranges from 0 (black) to 100 (white), whereas the a* value indicates redness (+a) or greenness (a) and the b* value indicates yellowness (+b) or blueness (b). After filling a Petri dish to the brim with the samples, the Petri dish was placed directly on the colorimeter sensor. The C value indicates color intensity, and the hue angle (hab) value refers to the degree of redness (when hab = 0°) and yellowness (when hab = 90°).
The total color change in the L*, a*, and b* colorimetric spaces, ΔE*, was then calculated from the following equation:
where L*, a*, and b* are the actual color values and L 0, a 0, and b 0 are the color values for the BT0 sample.
ΔE = (((L* − L*0)2 + (a − a0) 2+ (b − b 0) 2) ½)
2.10. Sensory Evaluation of Treated Biscuit Samples
The processed biscuits made from five different treatments and the control code were simultaneously presented with some modifications [62] to a panel of 30 panelists who were selected from the campus (students and staff at Zagazig University, Egypt) without consideration for age or sex restrictions. On a 9-point hedonic scale for degree of liking, the panelists were asked to indicate their preference (color, taste, mouth feel, aroma, and texture). At each session, two samples of every treatment were served to the panelists at random in porcelain dishes at room temperature.
2.11. Determination of Some Physical Properties and Baking Quality of Processed Biscuit Samples
According to the AACC’s standard methods [56], the diameter (D) of the plagioclase was measured (HL 474938, STECO, Germany). Biscuit quality (in six cookies) was determined based on the width (W), thickness (T), and W/T ratio (biscuit spread factor), with adjustments for constant atmospheric pressure and conditions. The recipe called for 225 g of wheat flour, a mixing bowl and paddle, and a set amount of water added to the dough. Dextrose was used to help with the development of a brown color. This method can be used to evaluate other flour types; flour treatments; and factors that affect biscuit geometry, such as the ingredients. The biscuit length (L) was measured from edge to edge with a Vernier caliper (Mitutoya Vernier caliper, Metric) to obtain the average length in centimeters.
The biscuit width value (W) was determined by placing six biscuits edge to edge to obtain the average width in centimeters. The thickness of a biscuit (T) was measured by stacking six well-formed biscuits on top of each other, followed by triplicate readings taken by shuffling the biscuit samples [63]. The diameter and thickness were measured in triplicate.
The volume of the biscuits was calculated using the following formula based on length (L), width (W), and thickness (T):
Volume (cm 3) = L × W × T
- L = average length of biscuits (cm);
- W = average width of biscuits (cm);
- T = average thickness of biscuits (cm).
The spread ratio was calculated by dividing the average width of the biscuits by the average thickness of the biscuits based on the method of Akubor et al. [64], using the following formula:
SF = W/T
- W—Width of biscuits (cm);
- T—Thickness of biscuits (cm).
The weight of the baked biscuits was calculated as the average of the values of four individual biscuits using a digital weighing balance. Vernier calipers were used to measure the diameter and thickness of the biscuit samples (Mitutoya Vernier caliper, metric).
After calculating the volume, the density was calculated by dividing the weight by the volume [65].
Density (g/cm3) = Weight (g)/Volume (cm3).
The bake loss percentage (weight loss %) of the biscuit samples was calculated by weighing six biscuits before and after baking. The weight difference was calculated as a percentage of bake loss [66]. The percent weight loss of the biscuit samples was calculated as follows:
where A = weight of six dough biscuits; B = weight of six baked biscuits.
Baking loss % = (A-B)/A × 100
2.12. Statistical Analysis of Treated Biscuit Samples
All experiments with the treated biscuits are expressed as the mean ± standard deviation of at least three replicates. A one-way analysis of variance (ANOVA) was used to compare the means of the different groups, while an LSD test was used for multiple comparisons of all treatments. Statistix 10.0 (Statistix, Tallahassee, FL, USA) was used to perform a statistical analysis of the data. p < 0.05 was considered statistically significant.
3. Results
3.1. Chemical Composition of Biscuit Samples
The values of the limiting factors affecting acrylamide formation in the biscuit treatments were determined, as presented in table below. After 15 min of baking in the oven and cooling at 30–35 °C (room temperature), the contents of protein, ash, fat, crude fiber, and carbohydrates did not noticeably increase with all of the enzymatic treatments compared with the blank biscuit sample (BT0), as presented in Table 2. The protein content of baker’s-yeast-treated biscuits increased to 8.36 ± 0.31%, followed by BT3-treated biscuits and BT2-treated biscuits at 8.63 ± 0.23 and 8.56 ± 0.12, respectively. This increase may be attributed to the protein content of baker’s yeast in the treated biscuits and enzymatic powder components [67]. Concerning the ash content, the biscuits treated with green tea and baker’s yeast had higher ash contents, 1.533 ± 0.306% and 1.566 ± 0.306%, respectively, compared with 0.846 ± 0.035% for the untreated biscuits. This increase may be due to the addition of green tea and baker’s yeast, which promoted the mineral content of the treated biscuits. The fat content was increased in sample BT5, reaching 18.43 ± 0.15%, while it was approximately 18.20 ± 0.70% and 18.10 ± 0.72% in BT2 and BT3, respectively. The fiber content decreased in sample BT4, reaching 1.34 ± 0.24%, while it was approximately 1.63 ± 0.21% and 2.40 ± 0.10% in BT5 and BT2, respectively.
Biscuits have a low moisture content (1–5%) that differs from other baked cereal products, such as bread (35–45%) and cake (15–30%). The low moisture content ensures that the biscuits are generally free from microbiological spoilage and have a long shelf life as long as they are protected against moisture from damp surroundings or the atmosphere. Arimi et al. [68] demonstrated that the primary reason for biscuits’ long shelf life is their low water activity, which can reach 0.5 in confectioners’ biscuits or sweet children’s biscuits. This critical water activity level, above which the biscuits soften, has been reported to be between 0.51 and 0.59 for cracker bread biscuits. The percentage of moisture found in biscuits treated with yeast and green tea (3.38 ± 0.51% and 3.12 ± 0.20%, respectively) was obviously lower than that in untreated biscuits (5.27 ± 0.60%). These findings indicate that adding enzymes to the biscuit components had no discernible effect on its composition or nutritional value.
The carbohydrate contents were 67.17 ± 0.47% in biscuits treated with yeast, 69.65 ± 0.28% in green-tea-treated biscuits, and 66.94 ± 0.40% in untreated biscuits (BT0), as shown in Table 2. This decrease was attributed to the natural yeast activities on sugar during the fermentation period, which may have turned it into alcohol and CO2, and the antioxidant properties of green tea. Our results are in agreement with those in the study conducted in [69]. In that study, they mixed asparaginase enzyme (500 U/kg flour) into cookie dough and baked it at 205 °C for 11 and 15 min without resting. At both baking temperatures, they discovered that, when the dough rested, the acrylamide reduction was greater than when the cookies were baked without resting the dough. As a result, the addition and application of asparaginase and glucose oxidase enzymes had no effect on the chemical composition of the final product and could be used as supplemented components to reduce Maillard reaction products and acrylamide contents, demonstrating their activity. It is possible to reduce acrylamide in biscuits by using appropriate amount of asparaginase and glucose oxidase and by combining them at a 1:1 ratio with 0.5 gm/kilogram wheat flour. The energy in the BT4 sample was increased compared with that in the BT5 sample, 465.6 ± 0.65 (k. calories/g) and 466.9 ± 2.61, respectively, and those in the BT0 and BT3 biscuits were 456.5 ± 1.53, and 428.9 ± 6.75, respectively. Energy comes from the amounts of fat, carbohydrates, and protein in the biscuits. Therefore, these decreases may depend on the lack of these components in some samples due to the activities of the enzymes, yeast, and green tea. The most increasing of pH value was found in the BT0 sample, which reached to 6.86 ± 0.25, followed by BT1 (6.50 ± 0.26), while the pH values in the other treatments were lower. The amount of acids produced in the biscuits treated with yeast and green tea may also demonstrate that these treatments are efficient ways to reduce acrylamide. These results are in agreement with those of Zhang et al. [70], who also proved the potential effect of adjusting pH as a method to reduce acrylamide formation in food. The total titratable acidity (TTA) content increased noticeably in BT0 (0.39 ± 0.31), while the others of the enzymatic treatments, BT1, BT2, and BT3 were 0.36 ± 0.35, 0.29 ± 0.28, and 0.31 ± 0.35, respectively. The amount of acids formed in yeast- and green-tea-treated biscuits could also be used to mitigate acrylamide. Therefore, the total titratable acidity (TTA%) is considered an important indicator for acrylamide mitigation. Our results proved that BT5 and BT4 had the lowest values, 0.246 ± 0.012 and 0.276 ± 0.012, respectively. These amounts of TTA affected the acrylamide content, color, and appearance, as shown in Figure 4a–c.
3.2. Color Characteristics for Processed Biscuits
Color attributes are considered the main characteristics that are useful for reflecting consumer acceptance. Consumer preferences are taken into consideration by researchers while attempting to build a functional meal that has been transformed from traditional food as a motivational step to finish or stop the trend. The differences in color indices between treated biscuit samples are depicted in Figure 5. The L* values, as presented, were found in samples BT1 and BT3 to be 90.80 ± 0.10 and 90.30 ± 0.01, respectively. As expected, the L* values of BT1, BT2, and BT3 of the biscuit samples increased noticeably with the enzymatic treatments. The data showed that green-tea-treated biscuits had the highest L* values (lightness), followed by untreated biscuits (BT0). Baker’s yeast powder is naturally brown, and it caused the biscuit to become brown and red after baking. Although baker’s yeast is used in bread production, it could also be used as an acrylamide-mitigation agent in baked products. According to some studies, there is a strong correlation between the color intensity of the crust and the formation of acrylamide, especially when bread is baked at temperatures above 200 °C [1]. A similar trend was observed by adding de-oiled peanut meal flour to biscuits [71]. According to Lagrain et al. [72], green tea’s antioxidant properties inhibited the oxidation of free thiol groups on gluten and, thus, the formation of disulfide bonds, weakening the gluten network.
The a* values in the blank (BT0), BT3, and BT4 samples were found to be 6.48 ± 0.01, 4.38 ± 0.01, and 14.16 ± 0.12, respectively. The greatest decrease found in BT2 might have been due to the activity of the added glucose oxidase enzyme. Many changes occur during biscuit processing, including the partial gelatinization of starch, the denaturation of proteins, drying and the evaporation of water, browning, and changes in size or structure. On the other hand, the other color indices, such as the a* and b* values, the color intensity, and the total color difference, were obviously higher in the yeast-treated and BT0 biscuits than in the green-tea-treated biscuits. The b* values found in the samples treated with BT0, BT2, and BT4 were 53.76 ± 0.15, 45.23 ± 0.06, and 65.56 ± 0.12, respectively. The lowest values were found in the other samples. In addition, the color intensity (C) values were found to be 54.50 ± 0.20, 45.40 ± 0.26, and 66.33 ± 1.15 in the samples treated with BT0, BT2, and BT4, respectively. The lowest values were found in the other samples. This increase may be affected by the added amounts of enzymes, which react with asparagine and glucose, the precursors of the Maillard reaction, and may mitigate browning. The total color difference (∆E) values found in samples BT2 and BT0 were 88.56 ± 0.12 and 86.50 ± 0.26, respectively. The lowest values were found in the other samples (Figure 5).
3.3. Chemical Indicators for Biscuit Samples
It is now well understood that free amino acids, particularly asparagine, and reducing sugars are important precursors for acrylamide in foods and that raw materials and processing conditions such as time, temperature, pH, water activity, additives, and matrix influence its formation and degradation [73]. The correlation between reducing sugar, asparagine, and acrylamide content in different treatments of baker’s yeast and green tea in biscuits is shown in Table 3. The results show that both baker’s yeast and green tea effectively reduced the contents of reducing sugars and asparagine, resulting in lower acrylamide levels in treated biscuits than in BT0 biscuits. Furthermore, when compared with green tea biscuit samples, the baker’s yeast treatment had a greater reduction.
The reducing sugar contents (mg/100 gm.) were increased in samples BT0 and BT1, 5633.3 ± 305.5 and 5500.0 ± 264.6 mg/100 gm, respectively. The reducing sugar content was the lowest in the other sample. According to [74], to minimize browning in the Millard reaction, low levels of reducing sugars are needed. The Swedish National Food Administration (SNFA) reported the presence of acrylamide in food with a high carbohydrate content that had been exposed to high temperatures [6,75]. Previous research discovered no reducing sugars (glucose and fructose) in dough or biscuits, which could be attributed to their involvement in the Maillard reaction or other thermal reactions (e.g., caramelization and pyrolytic reactions). The concentration of sucrose did not vary much while baking, indicating that any breakdown of this sugar during baking had already taken place [76,77]. Low reducing sugar concentrations are vital, according to Motter [74], when limiting color formation during frying. The data obtained for the content of reducing sugars in all our tested biscuit samples differed from those reported in the literature. These differences may be due to the different types of raw materials used when preparing the biscuits having different characteristics.
The reduction in asparagine (%) was noticeably highest in the BT1 and BT4 samples, at 68.31 ± 0.25 and 53.45 ± 0.75, respectively. This means that asparaginase converted the missed asparagine into aspartic acid. The asparagine contents were also lowered from 478.6 ± 1.5 mg/kg at BT0 to 222.3 ± 3.2 mg/kg in the yeast-treated biscuits. These results are in agreement with those of Barber et al. [78], who reported that asparagine and other free amino acids are important nitrogen sources for yeast growth. Several researchers have concluded that asparagine is the limiting precursor in baked goods because its concentration is lower than that of reducing sugars, 60.11 ± 1.09 mg/kg versus 89.62 ± 3.11 mg/kg, respectively [79,80,81]. According to Mustafa et al. [82], the fermentation time, which ranged from 13 to 164 min, had a lowering effect on acrylamide precursors in the dough. These fermentation effects were more pronounced in the experiment with low asparagine levels, which matched the ingredient levels. At all levels of asparagine, a strong correlation was found between the contents of asparagine in fermented dough and acrylamide in breads.
The acrylamide levels decreased from 868.0 ± 7.9 μg/kg in BT0 to 214.3 ± 2.1 and 230.6 ± 2.1 μg/kg in the baker’s-yeast- and green-tea-treated biscuits, respectively. These findings indicate that all treatments reduced the acrylamide content. Some studies have reported that baked products represent approximately 25% of total acrylamide exposure in the diet [83], and that goal should encourage researchers to mitigate the acrylamide content in baked products. The reduction in acrylamide (%) reached 75.22 ± 0.24 and 73.33 ± 0.24 when using the baker’s yeast and green tea treatments, respectively. This research could be considered a significant contribution to the reduction in acrylamide by natural antioxidants, such as those found in green tea. These results are in agreement with those reported by Zhang and Ying [84], who indicated that both the antioxidants in bamboo leaves and the green tea extract could significantly reduce the acrylamide content in fried bread sticks while retaining the original flavor and crispness. The addition of plant extracts in the various products is one way to reduce AA. Markova et al. [85] reported a 23% reduction in AA content after adding some spices to buckwheat gingerbread. Similarly, a 76 percent reduction in AA levels was achieved when an antioxidant solution made from bamboo leaves was added prior to processing French fries and potato chips [86]. In a similar study, adding green tea extract to fried breadsticks resulted in an 83 percent reduction in AA content [86].
The asparagine/acrylamide ratio (AAR) is regarded as a crucial indicator for reducing the amount of asparagine and reducing sugars, which can result in Maillard reaction products. It was found to be 1.835 ± 0.026 in the BT5 sample and 1.506 ± 0.018 in the BT2 sample. This means that the greater the amount of asparagine, the lower the amount of acrylamide and Maillard reaction products. The asparagine/reducing sugar ratio is also considered an important indicator of the relationship between asparagine content and reducing sugar content, which may be converted into Maillard reaction products. It was 0.139 a ± 0.014 in the BT2 sample, while it was 0.088 ± 0.001, 0.085 ± 0.004, and 0.082 ± 0.001 in the BT5, BT0, and BT4 samples, respectively. This means that the greater the amount of asparagine and reducing sugars, the greater the amount of Maillard reaction products (such as acrylamide). Fredriksson et al. [41] reported that acrylamide formation in bread is caused by the high L-asparagine content of wheat flour. These findings indicate that the Maillard reaction rates were faster in the BT0 samples than in the other treated samples. The asparagine-to-acrylamide ratio is important for determining the effect of the amount of asparagine in the samples on the amount of acrylamide generated via the Maillard reaction route. This index only applies to the Maillard reaction and not to other pathways that may be terminated by acrylamide synthesis (fatty acid, glycerol, acrolein, pyruvic acid, and acrylic acid routes).
The asparagine contents (mg/kg) were the most reduced in samples BT1, BT4, and then BT3, with values of 151.3 ± 1.5, 222.3 ± 3.2, and 241.3 ± 1.5, respectively. The asparagine contents were almost the same as those in the other samples. These results may be due to the high activity of the asparaginase enzyme in the media in samples BT1 and BT3. Hamlet et al. [87] reported that the concentration of L-asparagine in wheat flour ranges between 74 and 664 mg kg−1, while it ranges between 319 and 791 mg kg−1 in rye flour. This demonstrates that the L-asparagine content varies between flour types. The concentration of free L-asparagine in flour and dough was found to correlate with the formation of acrylamide in several baked products, according to Springer et al. [88]. As a result, choosing flour with a low L-asparagine content would be advantageous in producing bread with a low acrylamide content [89]. These results are higher than those reported by the European Food Safety Authority (EFSA) [90], which has set indicative acrylamide levels in the most relevant food categories. The reduction in acrylamide (%) was the greatest in samples BT4 and BT5, followed by that in sample BT2, at 75.22 ± 0.24, 73.33 ± 0.24, and 63.93 ± 0.40, respectively. Our results, in general, agree with some studies that have been carried out on the application of fungal L-asparaginase to reduce acrylamide in starch products. Hendriksen et al. [91] applied Aspergillus oryzae using L-asparaginase in sweet and savory biscuits, and the authors were able to reduce the acrylamide levels by 34–92%. Commercial L-asparaginase has been able to reduce the contents of acrylamide in biscuits by up to 70%. These researchers did not notice any changes in color or flavor [92].
Zou et al. [93] found that, because cysteine and glycine can compete with asparagine for the carbonyl group reaction, the addition of amino acids to biscuit recipes can prevent the formation of acrylamide in the product by up to 97%. This reduction in asparagine (%) refers to the amount of asparagine, which converts into an acrylamide compound. The greatest reduction was in the BT1 sample (68.31 ± 0.25), followed by the BT4 sample (53.45 ± 0.75), while, the other treatments produced roughly comparable results, and some recent studies studied these phenomena, such as Anese et al. [94], who studied the effect of biscuit composition on the ability of L-asparaginase (Novozymes ®) to reduce acrylamide formation. The authors concluded that differences in L-asparaginase efficiency could be attributed to the different compositions of the tested foods. Despite its ability to remove acrylamide, L-asparaginase performed better in biscuits with a high-water content; however, as the fat content of the biscuits increased, the reduction in acrylamide decreased.
3.4. Sensory Evaluation of Processed Biscuits
The sensory evaluation of biscuits changed slightly according to the panelists ‘results, as shown in Figure 6. The sensory evaluation of color was the most reduced value in the sample (BT4 = 5.1). The taste and mouth feel values were the lowest in the same sample, 5.8 and 6.0, respectively. However, the aroma and texture were 6.1 and 6.5, respectively. These findings could be attributed to a lack of a color grade, as well as any enzymatic activity in the treated sample media, especially in the baker’s yeast treatment. The Maillard reaction is responsible for the creation of these products’ specific sensory attributes, and acrylamide is also formed during the reaction [95]. The color of baked products is one of the most important factors influencing consumer acceptance and food quality [96]. The majority of the methods used to reduce this toxic compound have a negative impact on the final product’s taste and appearance [97]. The use of fungal L-asparaginase is a relatively new, promising, and effective method for lowering acrylamide levels in food. This enzyme contributes to mitigation strategies in two ways: it interferes with the Maillard reaction, and it removes precursors by converting L-asparagine into L-aspartic acid (nontoxic) without changing the nutritional value, appearance, or flavor of the final product [91,97].
3.5. Essential Mineral Contents for Biscuit Samples
As shown in Table 4, the contents of some essential minerals changed in the samples, especially in those treated with green tea extract and baker’s yeast. Generally, in the other samples, there were no significant changes in the contents of the mentioned essential minerals in the treated biscuit samples compared with the BT0 sample.
The zinc value (Zn) was reached in the sample treated with green tea extract (BT5) and baker’s yeast (BT4), 10.50 ± 0.17 p.p.m and 10.46 ± 0.38 p.p.m, respectively (on a dry basis). This increase may be due to the added amount of green tea and baker’s yeast, which contain some minerals and other components. Additionally, iron or Ferrum (Fe) was found in the sample treated with green tea (BT5) and baker’s yeast (BT4), 44.53 ± 0.06 p.p.m and 44.36 ± 0.21 p.p.m, respectively (on a dry basis). This increase may depend on the added amount of green tea and baker’s yeast, which contain some minerals and other components. Magnesium (Mg) increased in the samples treated with green tea (BT5) and baker’s yeast (BT4) to 235.6 ± 4.2 p.p.m and 234.0 ± 3.6 p.p.m, respectively (on a dry basis). This increase may be due to the added amounts, which may contain some minerals and other components. Calcium (Ca) increased in the samples treated with green tea (BT5) and baker’s yeast (BT4), 875.6 ± 3.1 p.p.m and 873.6 ± 3.8 p.p.m, respectively. Potassium (K) increased in the samples treated with green tea (BT5) and baker’s yeast (BT4), 2343.3 ± 2.5 p.p.m and 2341.7 ± 2.1 p.p.m, respectively. Phosphorus (P) increased in the samples treated with green tea (BT5) and baker’s yeast (BT4), 412.6 ± 3.8 p.p.m and 412.3 ± 0.6 p.p.m, respectively. This increase in mineral content may be due to the added amount of ingredients such as enzyme powders, green tea, and baker’s yeast, which contain some minerals and other components. According to the abovementioned results, the nutritional values of the biscuit samples treated with enzymes were almost unaffected by these additions (BT1, BT2, and BT3). However, the other samples (BT4 and BT5) had increased essential mineral contents, which indicated an increase in the nutritional values of these biscuit samples.
3.6. Physical Characteristics of Processed Biscuits
There are some changes in the baking properties of biscuit samples, as shown in Table 5. The length values (cm) were noticeably higher in the samples treated with baker’s yeast (BT4, BT3, and BT1), as presented in Figure 7b, than in the other samples (10.33 ± 0.15 cm, 9.56 ± 0.25 cm, and 9.5 ± 0.02 cm, respectively). This greatest increase in baker’s-yeast-treated biscuits may be due to the yeast activity in the media, fermentation process, and production of gas (such as CO2), as shown in Figure 7a. The biscuits treated with baker’s yeast swelled more than the other biscuits. However, the other treated samples were approximately the same size in length. The width values (cm) increased in the samples treated with baker’s yeast (BT4), green tea powder (BT5), and glucose oxidase (BT2) compared with the other samples, 2.60 ± 0.10 cm, 2.13 ± 0.15 cm, and 1.83 ± 0.12 cm, respectively. This greatest increase in baker’s-yeast-treated biscuits may be due to the yeast activity in the media, fermentation process, and production of gas (such as CO2). The biscuits treated with baker’s yeast swelled more than the other biscuits. In the other treated samples, the width values were approximately the same. The thickness (T), values (cm) increased in the samples treated with baker’s yeast (BT4) and green tea powder (BT5), which reached to 1.46 ± 0.15 cm, and 1.16 ± 0.15 cm, respectively, and followed by the other samples.
The volume values (cm3) increased in the samples treated with baker’s yeast (BT4, BT5, BT1, and BT3), 39.42 ± 4.66 cm3, 23.65 b ± 3.79 cm3, and 13.92 ± 1.63 cm3, respectively.
The spread ratio values (SF) increased in the samples treated with a blank biscuit (BT0), the glucose-oxidase-treated samples (BT2), and the mixed-enzyme-1:1-treated sample (BT3), to 2.32 ± 0.23, 2.21 ± 0.28, and 2.08 ± 0.14, respectively. The weight values in the treated biscuit samples did not differ significantly during the treatments. The weight values (gm.) were 8.80 ± 0.10 g in the sample treated with green tea powder (BT5), as presented in Figure 7c, and 8.63 ± 0.21 g in the blank biscuit (BT0).
The density value (g/cm3) was increased in the samples treated with a blank biscuit, (BT1, BT2, and BT3), 0.747 ± 0.048, 0.619 ± 0.074, 0.603 ± 0.004, and 0.574 ± 0.0530, respectively. The greatest decrease was at BT4 = 0.210 ± 0.023. According to the density equation used in the calculation of the values, it has a positive relationship with weight values and a negative relationship with volume. Therefore, this explains the lowest value in the baker’s-yeast-treated sample. This may be due to the yeast activity byproducts in the media, fermentation process, and production of gas (such as CO2). The baking loss (%) was 33.07 ± 0.76, 30.98 ± 0.63, and 29.69 ± 1.56 in samples BT5, BT3, and BT1, respectively. The lowest value was in the BT4 sample, which was 18.99 ± 0.92, as shown in Table 4. These values of baking loss are considered an important indicator for the quantity of the final product. As shown in the baker’s yeast treatment, it is the lowest value, which may lead to a greater quantity of the final product.
Gökmen et al. [98] reported that evaporative cooling, which prevented an excessive increase in biscuit temperatures, probably limited the hydrolysis of sucrose into glucose and fructose and reduced the water content. In the last baking steps, water loss leveled off, indicating that the biscuits were dry.
4. Conclusions
Biscuits are a popular food for many individuals all over the world. It is consumed in many countries around the world, particularly Egypt, as part of army and school food programmes and during times of crisis. Despite their unique properties, when biscuits are exposed to high temperatures during the baking process, toxic and carcinogenic compounds such as acrylamide are formed during the Maillard reaction. In this study, we tried to lower the amount of acrylamide while maintaining the quality of the biscuits by using various ingredients in novel ratios and combinations at a new recommended temperature of 37 °C for 30 min.This study used a 1:1 mixtures of L-asparaginase and glucose oxidase for assessment their behavior in the same media of biscuit doughs and at 37 °C, compared with baker’s yeast and green tea powders, to produce acrylamide-low-level biscuits, as functional food. L-asparaginase is an enzyme that catalyzes the hydrolytic cleavage of the amino acid L-asparagine, a precursor for acrylamide, into L-aspartic acid and ammonia, lowering acrylamide synthesis in starchy foods (such as biscuits). Glucose oxidase converts glucose to gluconic acid during the oxidation process, while baker’s yeast uses glucose and some minerals as nutrients and produces alcohol and CO2, while green tea contains some antioxidant compounds. Our results confirmed that the enzymatic powders with 0.5 gm/kg of added wheat flour can be used as acrylamide reduction substances, which lead to the production of low-acrylamide-level biscuits. Investigations were also conducted into the potential role of certain enzymes, baker’s yeast, and green tea powder in lowering acrylamide synthesis in biscuits. Baker’s yeast is an enzyme complex that synthesizes the hydrolytic cleavage of L-asparagine, the amino acid considered the precursor for acrylamide, to L-aspartic acid and ammonia, reducing the formation of acrylamide in starchy foods. These biscuit products may be used as special foods or functional foods and protected the body from approximately 70–80% of daily acrylamide intake, especially in adolescents and children on campuses and schools, during the study period.
This study could be regarded as an important contribution to the reduction in acrylamide formation in biscuits by the addition of natural and safety resources that can be used as acrylamide reduction substances at 37 °C for 30 min while preserving the quality and nutritional value of the final product, leading to the production of low-acrylamide-level foods, especially starchy components.
5. Future Research Needs
There is a need for more information on the toxicity of acrylamide in the human diet, particularly the effects of high-level acrylamide meals on the probability of cancer and its kind in the human body. There is little understanding of acrylamide’s role in this type of cancer. Furthermore, more research on acrylamide reduction using natural substances and compounds at room temperature for a short period of time should be conducted in order to be applied to processing methods.
Author Contributions
A.A.E.-S. performed the lab experiments, analyzed and interpreted the data of the work, and prepared the original manuscript; M.M.A. supervised and reviewed the manuscript; S.A.J. prepared the original manuscript; T.M.A. analyzed and interpreted the data; A.S.M. reviewed the writing. All authors have read and agreed to the published version of the manuscript.
Funding
This research received no external funding.
Institutional Review Board Statement
Not applicable.
Informed Consent Statement
Not applicable.
Data Availability Statement
The current manuscript includes all of the data produced and examined for the study, and the associated authors have no objections regarding the data’s and materials’ accessibility.
Conflicts of Interest
The authors declare no conflict of interest.
References
- Keramat, J.; LeBail, A.; Prost, C.; Jafari, M. Acrylamide in Baking Products: A Review Article. Food Bioprocess Technol. 2011, 4, 530–543. [Google Scholar] [CrossRef]
- Petisca, C.; Henriques, A.; Pérez-Palacios, T.; Pinho, O.; Ferreira, I.M.P.L.V.O. Assessment of hydroxymethylfurfural and furfural in commercial bakery products. J. Food Compos. Anal. 2014, 33, 20–25. [Google Scholar] [CrossRef]
- Vass, A.A.; Smith, R.R.; Thompson, C.V.; Burnett, M.N.; Wolf, D.A.; Synstelien, J.A.; Dulgerian, N.; Eckenrode, B.A. Decompositional Odor Analysis Database. J. Forensic Sci. 2004, 49, 1–10. [Google Scholar] [CrossRef]
- Manley, D. Chocolate and Cocoa as Biscuit Ingredients. In Manley’s Technology of Biscuits, Crackers and Cookies, 4th ed.; Woodhead Publishing: Sawston, UK, 2011; pp. 235–246. [Google Scholar] [CrossRef]
- Manley, D. Biscuit, Cookie and Cracker Manufacturing Manuals. In Biscuit Cookie Cracker Manufacturing Manual Vol. 6 Biscuit Packaging and Storage; Woodhead Publishing Limited: Sawston, UK, 1998. [Google Scholar] [CrossRef]
- Tareke, E.; Rydberg, P.; Karlsson, P.; Eriksson, S.; Törnqvist, M. Analysis of acrylamide, a carcinogen formed in heated foodstuffs. J. Agric. Food Chem. 2002, 50, 4998–5006. [Google Scholar] [CrossRef]
- Mesias, M.; Morales, F.J. Acrylamide in bakery products. Acrylamide Food Anal. Content Potential Health Eff. 2015, 131–157. [Google Scholar]
- European Food Safety Authority. Results On Acrylamide Levels in Food from Monitoring Year 2008. EFSA J. 2010, 8, 1599. [Google Scholar] [CrossRef] [Green Version]
- Miśkiewicz, K.; Nebesny, E.; Oracz, J. Formation of acrylamide during baking of shortcrust cookies derived from various flours. Czech J. Food Sci. 2012, 30, 53–56. [Google Scholar] [CrossRef] [Green Version]
- Sazesh, B.; Goli, M. Quinoa as a wheat substitute to improve the textural properties and minimize the carcinogenic acrylamide content of the biscuit. J. Food Process. Preserv. 2020, 44, e14563. [Google Scholar] [CrossRef]
- Žilić, S.; Aktağ, I.G.; Dodig, D.; Filipović, M.; Gökmen, V. Acrylamide formation in biscuits made of different wholegrain flours depending on their free asparagine content and baking conditions. Food Res. Int. 2020, 132, 109109. [Google Scholar] [CrossRef]
- Capuano, E.; Ferrigno, A.; Acampa, I.; Serpen, A.; Açar, Ö.Ç.; Gökmen, V.; Fogliano, V. Effect of flour type on Maillard reaction and acrylamide formation during toasting of bread crisp model systems and mitigation strategies. Food Res. Int. 2009, 42, 1295–1302. [Google Scholar] [CrossRef]
- Condon, E.M.; Crepinsek, M.K.; Fox, M.K. School Meals: Types of Foods Offered to and Consumed by Children at Lunch and Breakfast. J. Am. Diet. Assoc. 2009, 109, S67–S78. [Google Scholar] [CrossRef]
- Augusto, F.R.; Hilário, A.P. The Rise of Food Charity in Europe; Lambie-Mumford, H., Silvasti, T., Eds.; Springer: Berlin/Heidelberg, Germany, 2021. [Google Scholar]
- Baskar, G.; Aiswarya, R. Overview on mitigation of acrylamide in starchy fried and baked foods. J. Sci. Food Agric. 2018, 98, 4385–4394. [Google Scholar] [CrossRef]
- Arisseto, A.P.; Toledo, M.C.; Govaert, Y.; Van Loco, J.; Fraselle, S.; Weverbergh, E.; Degroodt, J.M. Determination of acrylamide levels in selected foods in Brazil. Food Addit. Contam. 2007, 24, 236–241. [Google Scholar] [CrossRef]
- Lindsay, R.C.; Jang, S. Chemical Intervention Strategies for Substantial Suppression of Acrylamide Formation in Fried Potato Products. Adv. Exp. Med. Biol. 2005, 561, 393–404. [Google Scholar] [CrossRef]
- Jung, M.; Choi, D.; Ju, J. A Novel Technique for Limitation of Acrylamide Formation in Fried and Baked Corn Chips and in French Fries. J. Food Sci. 2003, 68, 1287–1290. [Google Scholar] [CrossRef]
- Vinci, R.M.; Mestdagh, F.; De Meulenaer, B. Acrylamide formation in fried potato products—Present and future, a critical review on mitigation strategies. Food Chem. 2012, 133, 1138–1154. [Google Scholar] [CrossRef]
- Baardseth, P.; Blom, H.; Sundt, T.W.; Slinde, E. Reduction of Acrylamide Formation. U.S. Patent 20060147606, 6 July 2006. [Google Scholar]
- Batool, T.; Makky, E.A.; Jalal, M.; Yusoff, M.M. A Comprehensive Review on l-Asparaginase and Its Applications. Appl. Biochem. Biotechnol. 2016, 178, 900–923. [Google Scholar] [CrossRef] [Green Version]
- Capuano, E.; Fogliano, V. Acrylamide and 5-hydroxymethylfurfural (HMF): A review on metabolism, toxicity, occurrence in food and mitigation strategies. LWT-Food Sci. Technol. 2011, 44, 793–810. [Google Scholar] [CrossRef]
- Lingnert, H.; Grivas, S.; Jägerstad, M.; Skog, K.; Törnqvist, M.; Åman, P. Acrylamide in food: Mechanisms of formation and influencing factors during heating of foods. Scand. J. Nutr. 2002, 46, 159–172. [Google Scholar] [CrossRef]
- Svensson, K.; Abramsson, L.; Becker, W.; Glynn, A.; Hellenäs, K.-E.; Lind, Y.; Rosén, J. Dietary intake of acrylamide in Sweden. Food Chem. Toxicol. 2003, 41, 1581–1586. [Google Scholar] [CrossRef]
- Zyzak, D.V.; Sanders, R.A.; Stojanovic, M.; Tallmadge, D.H.; Eberhart, B.L.; Ewald, D.K.; Gruber, D.C.; Morsch, T.R.; Strothers, M.A.; Rizzi, G.P.; et al. Acrylamide Formation Mechanism in Heated Foods. J. Agric. Food Chem. 2003, 51, 4782–4787. [Google Scholar] [CrossRef] [PubMed]
- Pedreschi, F.; Mariotti, S.; Granby, K.; Risum, J. Acrylamide reduction in potato chips by using commercial asparaginase in combination with conventional blanching. LWT Food Sci. Technol. 2011, 44, 1473–1476. [Google Scholar] [CrossRef]
- Aiswarya, R.; Baskar, G. Enzymatic mitigation of acrylamide in fried potato chips using asparaginase from Aspergillus terreus. Int. J. Food Sci. Technol. 2018, 53, 491–498. [Google Scholar] [CrossRef]
- Pedreschi, F.; Mariotti, M.S.; Granby, K. Current issues in dietary acrylamide: Formation, mitigation and risk assessment. J. Sci. Food Agric. 2014, 94, 9–20. [Google Scholar] [CrossRef]
- Wang, S.; Yu, J.; Xin, Q.; Wang, S.; Copeland, L. Effects of starch damage and yeast fermentation on acrylamide formation in bread. Food Control 2017, 73, 230–236. [Google Scholar] [CrossRef]
- Choi, I.; Zhong, Q. Gluconic acid as a chelator to improve clarity of skim milk powder dispersions at pH 3.0. Food Chem. 2021, 344, 128639. [Google Scholar] [CrossRef]
- Kornecki, J.F.; Carballares, D.; Tardioli, P.W.; Rodrigues, R.C.; Berenguer-Murcia, Á.; Alcántara, A.R.; Fernandez-Lafuente, R. Enzyme production of D-gluconic acid and glucose oxidase: Successful tales of cascade reactions. Catal. Sci. Technol. 2020, 10, 5740–5771. [Google Scholar] [CrossRef]
- Jiang, D.F.; Chen, J.; Li, F.; Li, W.; Yu, L.; Zheng, F.; Wang, X. Deoxynivalenol and its acetyl derivatives in bread and biscuits in Shandong province of China. Food Addit. Contam. Part B Surveill. 2018, 11, 43–48. [Google Scholar] [CrossRef]
- Szweda, R.T.; Schmidt, K.; Zorn, H. Bleaching of colored whey and milk by a multiple-enzyme system. Eur. Food Res. Technol. 2013, 237, 377–384. [Google Scholar] [CrossRef]
- Valencia, P.; Espinoza, K.; Ramirez, C.; Franco, W.; Urtubia, A. Technical Feasibility of Glucose Oxidase as a Prefermentation Treatment for Lowering the Alcoholic Degree of Red Wine. Am. J. Enol. Vitic. 2017, 68, 386–389. [Google Scholar] [CrossRef]
- Gong, Q.; Sun, L.-P.; Wu, Z.; Huo, L.-H.; Zhao, H. Enhanced non-enzymatic glucose sensing of Cu–BTC-derived porous copper@carbon agglomerate. J. Mater. Sci. 2018, 53, 7305–7315. [Google Scholar] [CrossRef]
- Visvanathan, R.; Jayathilake, C.; Liyanage, R.; Sivakanesan, R. Applicability and reliability of the glucose oxidase method in assessing α-amylase activity. Food Chem. 2019, 275, 265–272. [Google Scholar] [CrossRef]
- Walker, G.M. Yeasts. In Desk Encyclopedia of Microbiology; Academic Press: Cambridge, MA, USA; Elsevier: Amsterdam, The Netherlands, 2009; pp. 1174–1187. [Google Scholar]
- Goffeau, A.; Barrell, B.G.; Bussey, H.; Davis, R.W.; Dujon, B.; Feldmann, H.; Galibert, F.; Hoheisel, J.D.; Jacq, C.; Johnston, M.; et al. Life with 6000 genes. Science 1996, 274, 546–567. [Google Scholar] [CrossRef] [Green Version]
- Gallone, B.; Steensels, J.; Prahl, T.; Soriaga, L.; Saels, V.; Herrera-Malaver, B.; Merlevede, A.; Roncoroni, M.; Voordeckers, K.; Miraglia, L.; et al. Domestication and Divergence of Saccharomyces cerevisiae Beer Yeasts. Cell 2016, 166, 1397–1410.e16. [Google Scholar] [CrossRef] [Green Version]
- Warringer, J.; Zörgö, E.; Cubillos, F.A.; Zia, A.; Gjuvsland, A.; Simpson, J.T.; Forsmark, A.; Durbin, R.; Omholt, S.W.; Louis, E.J.; et al. Trait Variation in Yeast Is Defined by Population History. PLoS Genet. 2011, 7, e1002111. [Google Scholar] [CrossRef] [Green Version]
- Fredriksson, H.; Tallving, J.; Rosén, J.; Åman, P. Fermentation Reduces Free Asparagine in Dough and Acrylamide Content in Bread. Cereal Chem. 2004, 81, 650–653. [Google Scholar] [CrossRef]
- Huang, Y.; Lu, J.; Li, M.; Li, C.; Wang, Y.; Shen, M.; Chen, Y.; Nie, S.; Zeng, M.; Chen, J.; et al. Effect of acidity regulators on acrylamide and 5-hydroxymethylfurfural formation in French fries: The dual role of pH and acid radical ion. Food Chem. 2022, 371, 131154. [Google Scholar] [CrossRef]
- Fink, M.; Andersson, R.; Rosén, J.; Åman, P. Effect of added asparagine and glycine on acrylamide content in yeast-leavened bread. Cereal Chem. 2006, 83, 218–222. [Google Scholar] [CrossRef]
- Huang, W.; Yu, S.; Zou, Q.; Tilley, M. Effects of frying conditions and yeast fermentation on the acrylamide content in you-tiao, a traditional Chinese, fried, twisted dough-roll. Food Res. Int. 2008, 41, 918–923. [Google Scholar] [CrossRef]
- Matthäus, B.; Haase, N.U. Acrylamide—Still a matter of concern for fried potato food? Eur. J. Lipid Sci. Technol. 2014, 116, 675–687. [Google Scholar] [CrossRef]
- Isanbulatova, E.S. Russiaâ€TM S Export Potential in The Global Tea Market. Bus. Strateg. 2022, 10, 57–59. [Google Scholar] [CrossRef]
- Yang, Y.; Guan, J.; Yin, J.; Shao, B.; Li, H. Urinary levels of bisphenol analogues in residents living near a manufacturing plant in south China. Chemosphere 2014, 112, 481–486. [Google Scholar] [CrossRef] [PubMed]
- Burillo, J.; Marqués, P.; Jiménez, B.; González-Blanco, C.; Benito, M.; Guillén, C. Insulin resistance and diabetes mellitus in Alzheimer’s disease. Cells 2021, 10, 1236. [Google Scholar] [CrossRef] [PubMed]
- Shang, Y.; Xu, X.; Gao, B.; Wang, S.; Duan, X. Single-atom catalysis in advanced oxidation processes for environmental remediation. Chem. Soc. Rev. 2021, 50, 5281–5322. [Google Scholar] [CrossRef]
- Sebastian, R.S.; Kuczmarski, M.F.; Enns, C.W.; Goldman, J.D.; Murayi, T.; Moshfegh, A.J.; Zonderman, A.B.; Evans, M.K. Application of the Database of Flavonoid Values for USDA Food Codes 2007–2010 in assessing intake differences between the Healthy Aging in Neighborhoods of Diversity across the Life Span (HANDLS) study and What We Eat in America (WWEIA), NHANES. J. Food Compos. Anal. 2021, 104, 104124. [Google Scholar] [CrossRef]
- Song, W.O.; Chun, O.K. Tea Is the Major Source of Flavan-3-ol and Flavonol in the U.S. Diet. J. Nutr. 2008, 138, 1543S–1547S. [Google Scholar] [CrossRef] [Green Version]
- Mildner-Szkudlarz, S.; Różańska, M.; Piechowska, P.; Waśkiewicz, A.; Zawirska-Wojtasiak, R. Effects of polyphenols on volatile profile and acrylamide formation in a model wheat bread system. Food Chem. 2019, 297, 125008. [Google Scholar] [CrossRef]
- Torres, A.M.; Palacios, S.A.; Yerkovich, N.; Palazzini, J.M.; Battilani, P.; Leslie, J.F.; Logrieco, A.F.; Chulze, S.N. Fusarium head blight and mycotoxins in wheat: Prevention and control strategies across the food chain. World Mycotoxin J. 2019, 12, 333–355. [Google Scholar] [CrossRef]
- Fu, Z.; Yoo, M.J.; Zhou, W.; Zhang, L.; Chen, Y.; Lu, J. Effect of (−)-epigallocatechin gallate (EGCG) extracted from green tea in reducing the formation of acrylamide during the bread baking process. Food Chem. 2018, 242, 162–168. [Google Scholar] [CrossRef]
- Zbikowska, A.; Kowalska, M.; Pieniowska, J. Assessment of shortcrust biscuits with reduced fat content of microcrystalline cellulose and psyllium as fat replacements. J. Food Process. Preserv. 2018, 42, e13675. [Google Scholar] [CrossRef]
- AACC International. International. Approved Methods of Analysis, 11th ed.; AACC International: St. Paul, MN, USA, 2000. [Google Scholar]
- Sheng, Y.Y.; Irons, G.A. Measurement and modeling of turbulence in the gas/liquid two-phase zone during gas injection. Metall. Trans. B 1993, 24, 695–705. [Google Scholar] [CrossRef]
- Miller, G.L. Use of Dinitrosalicylic Acid Reagent for Determination of Reducing Sugar. Anal. Chem. 1959, 31, 426–428. [Google Scholar] [CrossRef]
- Khoshnam, F.; Zargar, B.; Pourreza, N.; Parham, H. Acetone extraction and HPLC determination of acrylamide in potato chips. J. Iran. Chem. Soc. 2010, 7, 853–858. [Google Scholar] [CrossRef]
- Wang, H.; Lee, A.W.; Shuang, S.; Choi, M.M. SPE/HPLC/UV studies on acrylamide in deep-fried flour-based indigenous Chinese foods. Microchem. J. 2008, 89, 90–97. [Google Scholar] [CrossRef]
- Rao, R.V.; Savsani, V.J.; Vakharia, D.P. Teaching–learning-based optimization: A novel method for constrained mechanical design optimization problems. Comput. Aided Des. 2011, 43, 303–315. [Google Scholar] [CrossRef]
- Hooda, S.; Jood, S. Effect of fenugreek flour blending on physical, organoleptic and chemical characteristics of wheat bread. Nutr. Food Sci. 2005, 35, 229–242. [Google Scholar] [CrossRef]
- Gomez, D.E.; Alonso, D.F.; Yoshiji, H.; Thorgeirsson, U.P. Tissue inhibitors of metalloproteinases: Structure, regulation and biological functions. Eur. J. Cell Biol. 1997, 74, 111–122. [Google Scholar]
- Akubor, P.I.; Ukwuru, M.U. Functional properties and biscuit making potential of soybean and cassava flour blends. Plant Foods Hum. Nutr. 2003, 58, 1–12. [Google Scholar] [CrossRef]
- Das, A.B.; Srivastav, P.P. Acrylamide in snack foods. Toxicol. Mech. Methods 2012, 22, 163–169. [Google Scholar] [CrossRef]
- Agrahar-Murugkar, D.; Gulati, P.; Kotwaliwale, N.; Gupta, C. Evaluation of nutritional, textural and particle size characteristics of dough and biscuits made from composite flours containing sprouted and malted ingredients. J. Food Sci. Technol. 2015, 52, 5129–5137. [Google Scholar] [CrossRef] [Green Version]
- Cauvain, S. Principles of dough formation. In Technology of Breadmaking; Springer: Berlin/Heidelberg, Germany, 2015; pp. 303–337. [Google Scholar]
- Arimi, J.; Duggan, E.; O’Sullivan, M.; Lyng, J.; O’Riordan, E. Effect of water activity on the crispiness of a biscuit (Crackerbread): Mechanical and acoustic evaluation. Food Res. Int. 2010, 43, 1650–1655. [Google Scholar] [CrossRef]
- Ciesarová, Z.; Kukurová, K.; Bednáriková, A.; Morales, F.J. Effect of heat treatment and dough formulation on the formation of Maillard reaction products in fine bakery products—Benefits and weak points. J. Food Nutr. Res. 2009, 48, 20–30. [Google Scholar]
- Zhang, Y.; Ren, Y.; Zhang, Y. New Research Developments on Acrylamide: Analytical Chemistry, Formation Mechanism, and Mitigation Recipes. Chem. Rev. 2009, 109, 4375–4397. [Google Scholar] [CrossRef] [PubMed]
- Yadav, D.N.; Thakur, N.; Sunooj, K.V.; Singh, K.K. Effect of de-oiled peanut meal flour (DPMF) on the textural, organoleptic and physico chemical properties of bread. Int. Food Res. J. 2013, 20, 1307–1312. [Google Scholar]
- Lagrain, B.; Thewissen, B.G.; Brijs, K.; Delcour, J.A. Impact of Redox Agents on the Extractability of Gluten Proteins during Bread Making. J. Agric. Food Chem. 2007, 55, 5320–5325. [Google Scholar] [CrossRef]
- Rydberg, P.; Eriksson, S.; Tareke, E.; Karlsson, P.; Ehrenberg, L.; Törnqvist, M. Factors that influence the acrylamide content of heated foods. Adv. Exp. Med. Biol. 2005, 561, 317–328. [Google Scholar] [CrossRef]
- Mottur, G. A scientific look at potato chips: The original savory snack. Cereal Foods World 1989, 34, 620–626. Available online: https://agris.fao.org/agris-search/search.do?recordID=US9009187 (accessed on 12 January 2022).
- Mottram, D.S.; Wedzicha, B.L.; Dodson, A.T. Food chemistry: Acrylamide is formed in the Maillard reaction. Nature 2002, 419, 448–449. [Google Scholar] [CrossRef]
- Nguyen, H.T.; Van der Fels-Klerx, H.J.; Peters, R.J.B.; Van Boekel, M.A.J.S. Acrylamide and 5-hydroxymethylfurfural formation during baking of biscuits: Part I: Effects of sugar type. Food Chem. 2016, 192, 575–585. [Google Scholar] [CrossRef]
- Schouten, M.A.; Fryganas, C.; Tappi, S.; Romani, S.; Fogliano, V. The use of kidney bean flour with intact cell walls reduces the formation of acrylamide in biscuits. Food Control 2022, 140, 109054. [Google Scholar] [CrossRef]
- Barber, S.; Torner, M.J.; Martínez-Anaya, M.A.; de Barber, C.B. Microflora of the sour dough of wheat flour bread IX Biochemical characteristics and baking performance of wheat doughs elaborated with mixtures of pure microorganisms. Z. Lebensm. Unters. Forsch. 1989, 189, 6–11. [Google Scholar]
- Curtis, T.; Halford, N.G. Food security: The challenge of increasing wheat yield and the importance of not compromising food safety. Ann. Appl. Biol. 2014, 164, 354–372. [Google Scholar] [CrossRef] [Green Version]
- Nguyen, H.T.; van der Fels-Klerx, H.J.; van Boekel, M.A.J.S. Acrylamide and 5-hydroxymethylfurfural formation during biscuit baking. Part II: Effect of the ratio of reducing sugars and asparagine. Food Chem. 2017, 230, 14–23. [Google Scholar] [CrossRef] [PubMed]
- Weisshaar, R. Acrylamide in bakery products—Results from model experiments. Dtsch. Leb. 2004, 100, 92. [Google Scholar]
- Mustafa, A.; Fink, M.; Kamal-Eldin, A.; Rosén, J.; Andersson, R.; Åman, P. Interaction effects of fermentation time and added asparagine and glycine on acrylamide content in yeast-leavened bread. Food Chem. 2009, 112, 767–774. [Google Scholar] [CrossRef]
- Claus, A.; Carle, R.; Schieber, A. Acrylamide in cereal products: A review. J. Cereal Sci. 2008, 47, 118–133. [Google Scholar] [CrossRef]
- Zhang, Y.; Ying, T.; Zhang, Y. Reduction of Acrylamide and Its Kinetics by Addition of Antioxidant of Bamboo Leaves (AOB) and Extract of Green Tea (EGT) in Asparagine–Glucose Microwave Heating System. J. Food Sci. 2008, 73, C60–C66. [Google Scholar] [CrossRef]
- Marková, L.; Ciesarová, Z.; Kukurová, K.; Zieliński, H.; Przygodzka, M.; Bednáriková, A.; Šimko, P. Influence of various spices on acrylamide content in buckwheat ginger cakes. Chem. Pap. 2012, 66, 949–954. [Google Scholar] [CrossRef]
- Zhang, Y.; Zhang, Y. Formation and reduction of acrylamide in Maillard reaction: A review based on the current state of knowledge. Crit. Rev. Food Sci. Nutr. 2007, 47, 521–542. [Google Scholar] [CrossRef]
- Hamlet, C.G.; Sadd, P.A.; Liang, L. Correlations between the Amounts of Free Asparagine and Saccharides Present in Commercial Cereal Flours in the United Kingdom and the Generation of Acrylamide during Cooking. ACS Publ. 2008, 56, 6145–6153. Available online: https://pubs.acs.org/doi/pdf/10.1021/jf703743g (accessed on 31 August 2022). [CrossRef]
- Springer, M.; Fischer, T.; Lehrack, A.; Freund, W. Development of acrylamide in baked products. Getreide Mehl Brot 2003, 57, 274–278. [Google Scholar]
- Kumar, N.S.M.; Shimray, C.A.; Indrani, D.; Manonmani, H.K. Reduction of Acrylamide Formation in Sweet Bread with l-Asparaginase Treatment. Food Bioprocess Technol. 2014, 7, 741–748. [Google Scholar] [CrossRef]
- European Food Safety Authority. Results on acrylamide levels in food from monitoring years 2007–2009 and Exposure assessment. EFSA J. 2011, 9, 2133. [Google Scholar] [CrossRef] [Green Version]
- Hendriksen, H.V.; Kornbrust, B.A.; Ostergaard, P.R.; Stringer, M.A. Evaluating the potential for enzymatic acrylamide mitigation in a range of food products using an asparaginase from Aspergillus oryzae. J. Agric. Food Chem. 2009, 57, 4168–4176. [Google Scholar] [CrossRef]
- Vass, M.; Amrein, T.M.; Schönbächler, B.; Escher, F.; Amadò, R. Ways to reduce the acrylamide formation in cracker products. Czech J. Food Sci. 2018, 22, S19–S21. [Google Scholar] [CrossRef]
- Zou, P.; Oh, S.S.Y.; Kiang, K.H.; Low, M.Y.; Bloodworth, B.C. Detection of sibutramine, its two metabolites and one analogue in a herbal product for weight loss by liquid chromatography triple quadrupole mass spectrometry and time-of-flight mass spectrometry. Rapid Commun. Mass Spectrom. 2007, 21, 614–618. [Google Scholar] [CrossRef]
- Anese, M.; Suman, M.; Nicoli, M.C. Acrylamide removal from heated foods. Food Chem. 2010, 119, 791–794. [Google Scholar] [CrossRef]
- Thomas, A.; Thomas, A. Acrylamide—A potent carcinogen in food. Int. J. Sci. Res. 2014, 3, 2319–7064. [Google Scholar]
- Bartkiene, E.; Jakobsone, I.; Pugajeva, I.; Bartkevics, V.; Zadeike, D.; Juodeikiene, G. Reducing of acrylamide formation in wheat biscuits supplemented with flaxseed and lupine. Lwt Food Sci. Technol. 2016, 65, 275–282. [Google Scholar] [CrossRef]
- Batool, Z.; Sadir, S.; Liaquat, L.; Tabassum, S.; Madiha, S.; Rafiq, S.; Tariq, S.; Batool, T.S.; Saleem, S.; Naqvi, F.; et al. Repeated administration of almonds increases brain acetylcholine levels and enhances memory function in healthy rats while attenuates memory deficits in animal model of amnesia. Brain Res. Bull. 2016, 120, 63–74. [Google Scholar] [CrossRef]
- Gökmen, V.; Şenyuva, H.Z. Acrylamide formation is prevented by divalent cations during the Maillard reaction. Food Chem. 2007, 103, 196–203. [Google Scholar] [CrossRef]
Figure 1.
Flowchart of processed biscuits.

Figure 2.
Manual meat mincer machine, modified for biscuit formation.

Figure 3.
The acrylamide calibration standard curve.

Figure 4.
Processed biscuit samples. (a) Raw biscuit samples treated with l-asparaginase after formation process, (b) Baked biscuit samples treated with glucose oxidase enzyme, (c) Baked biscuit samples treated with mixed enzymes (1:1).
Figure 4.
Processed biscuit samples. (a) Raw biscuit samples treated with l-asparaginase after formation process, (b) Baked biscuit samples treated with glucose oxidase enzyme, (c) Baked biscuit samples treated with mixed enzymes (1:1).

Figure 5.
Color attributes of biscuits.

Figure 6.
Sensory evaluation of processed biscuits.

Figure 7.
Processed biscuit samples. (a) Baked biscuits treated with baker’s yeast powder, (b) Baked biscuits treated with asparaginase enzyme, (c) Baked biscuits treated with green tea powder.
Figure 7.
Processed biscuit samples. (a) Baked biscuits treated with baker’s yeast powder, (b) Baked biscuits treated with asparaginase enzyme, (c) Baked biscuits treated with green tea powder.


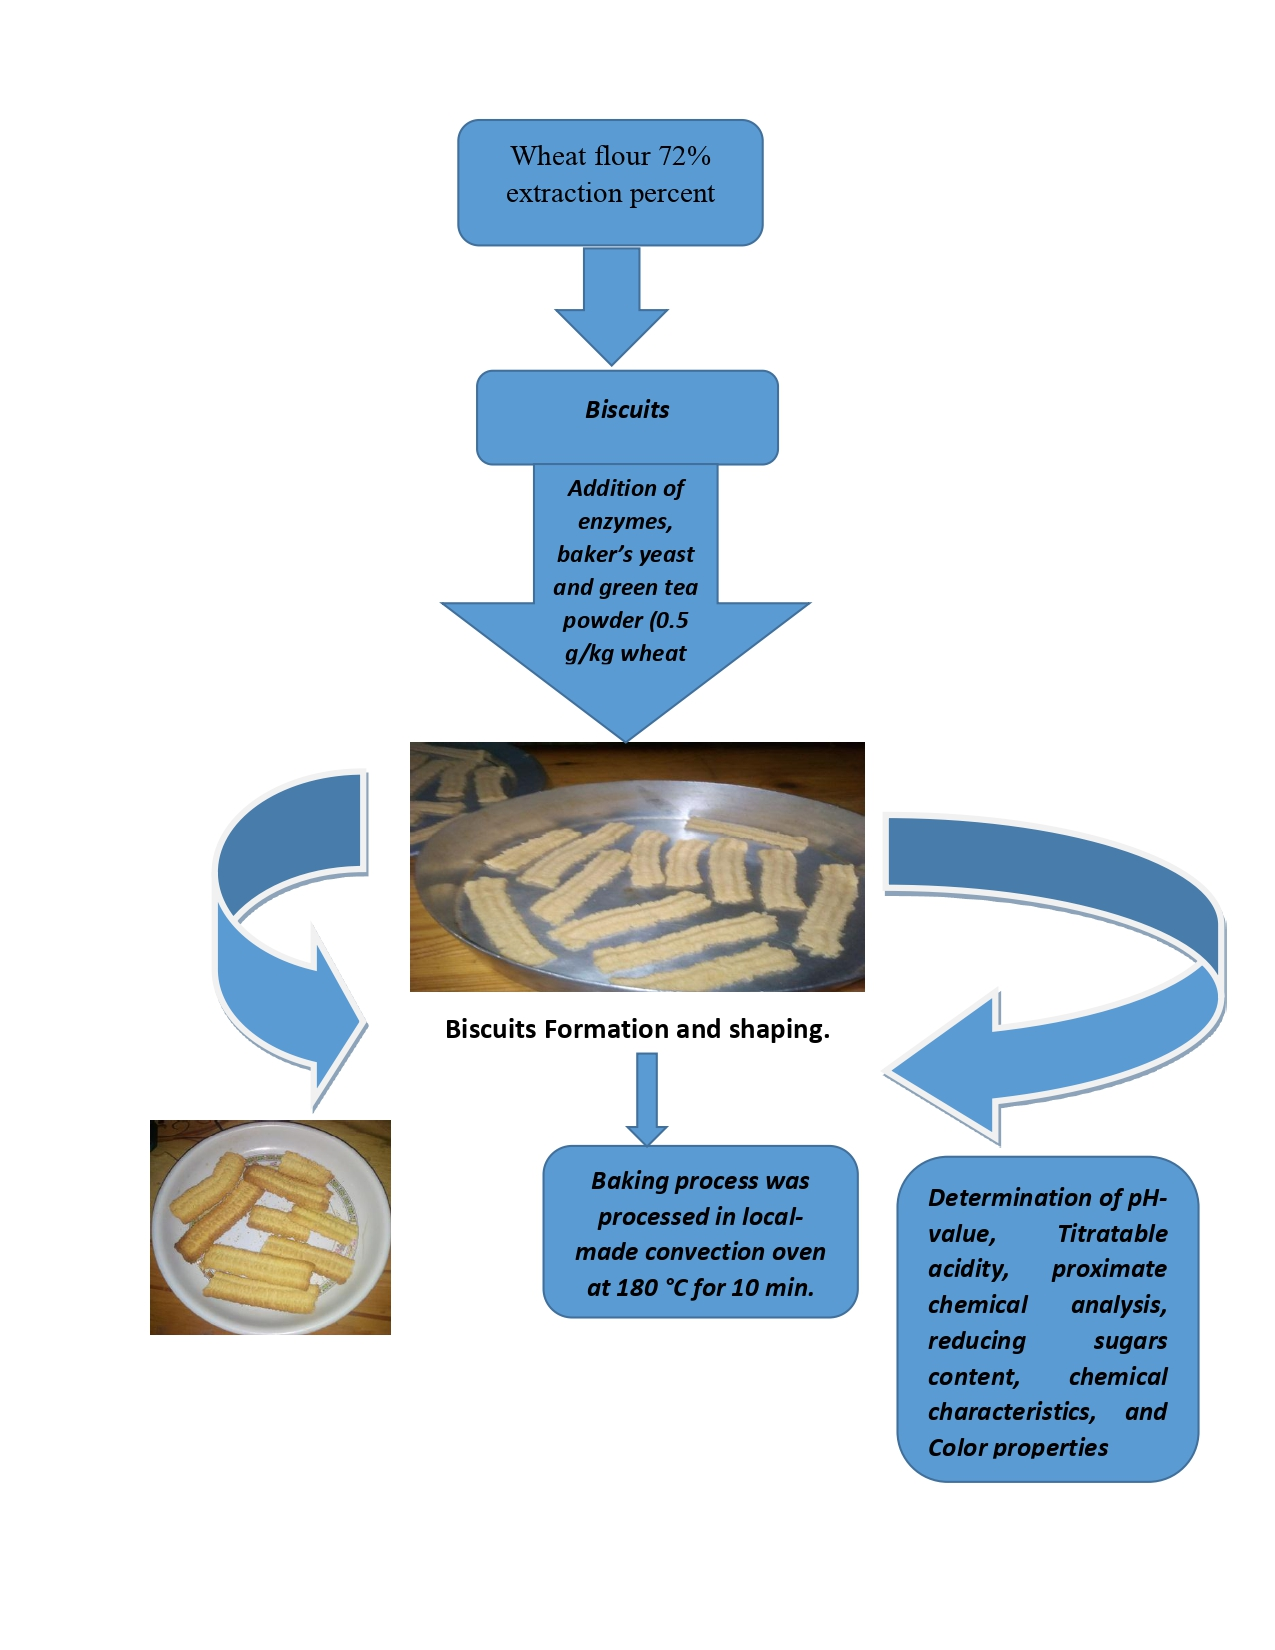
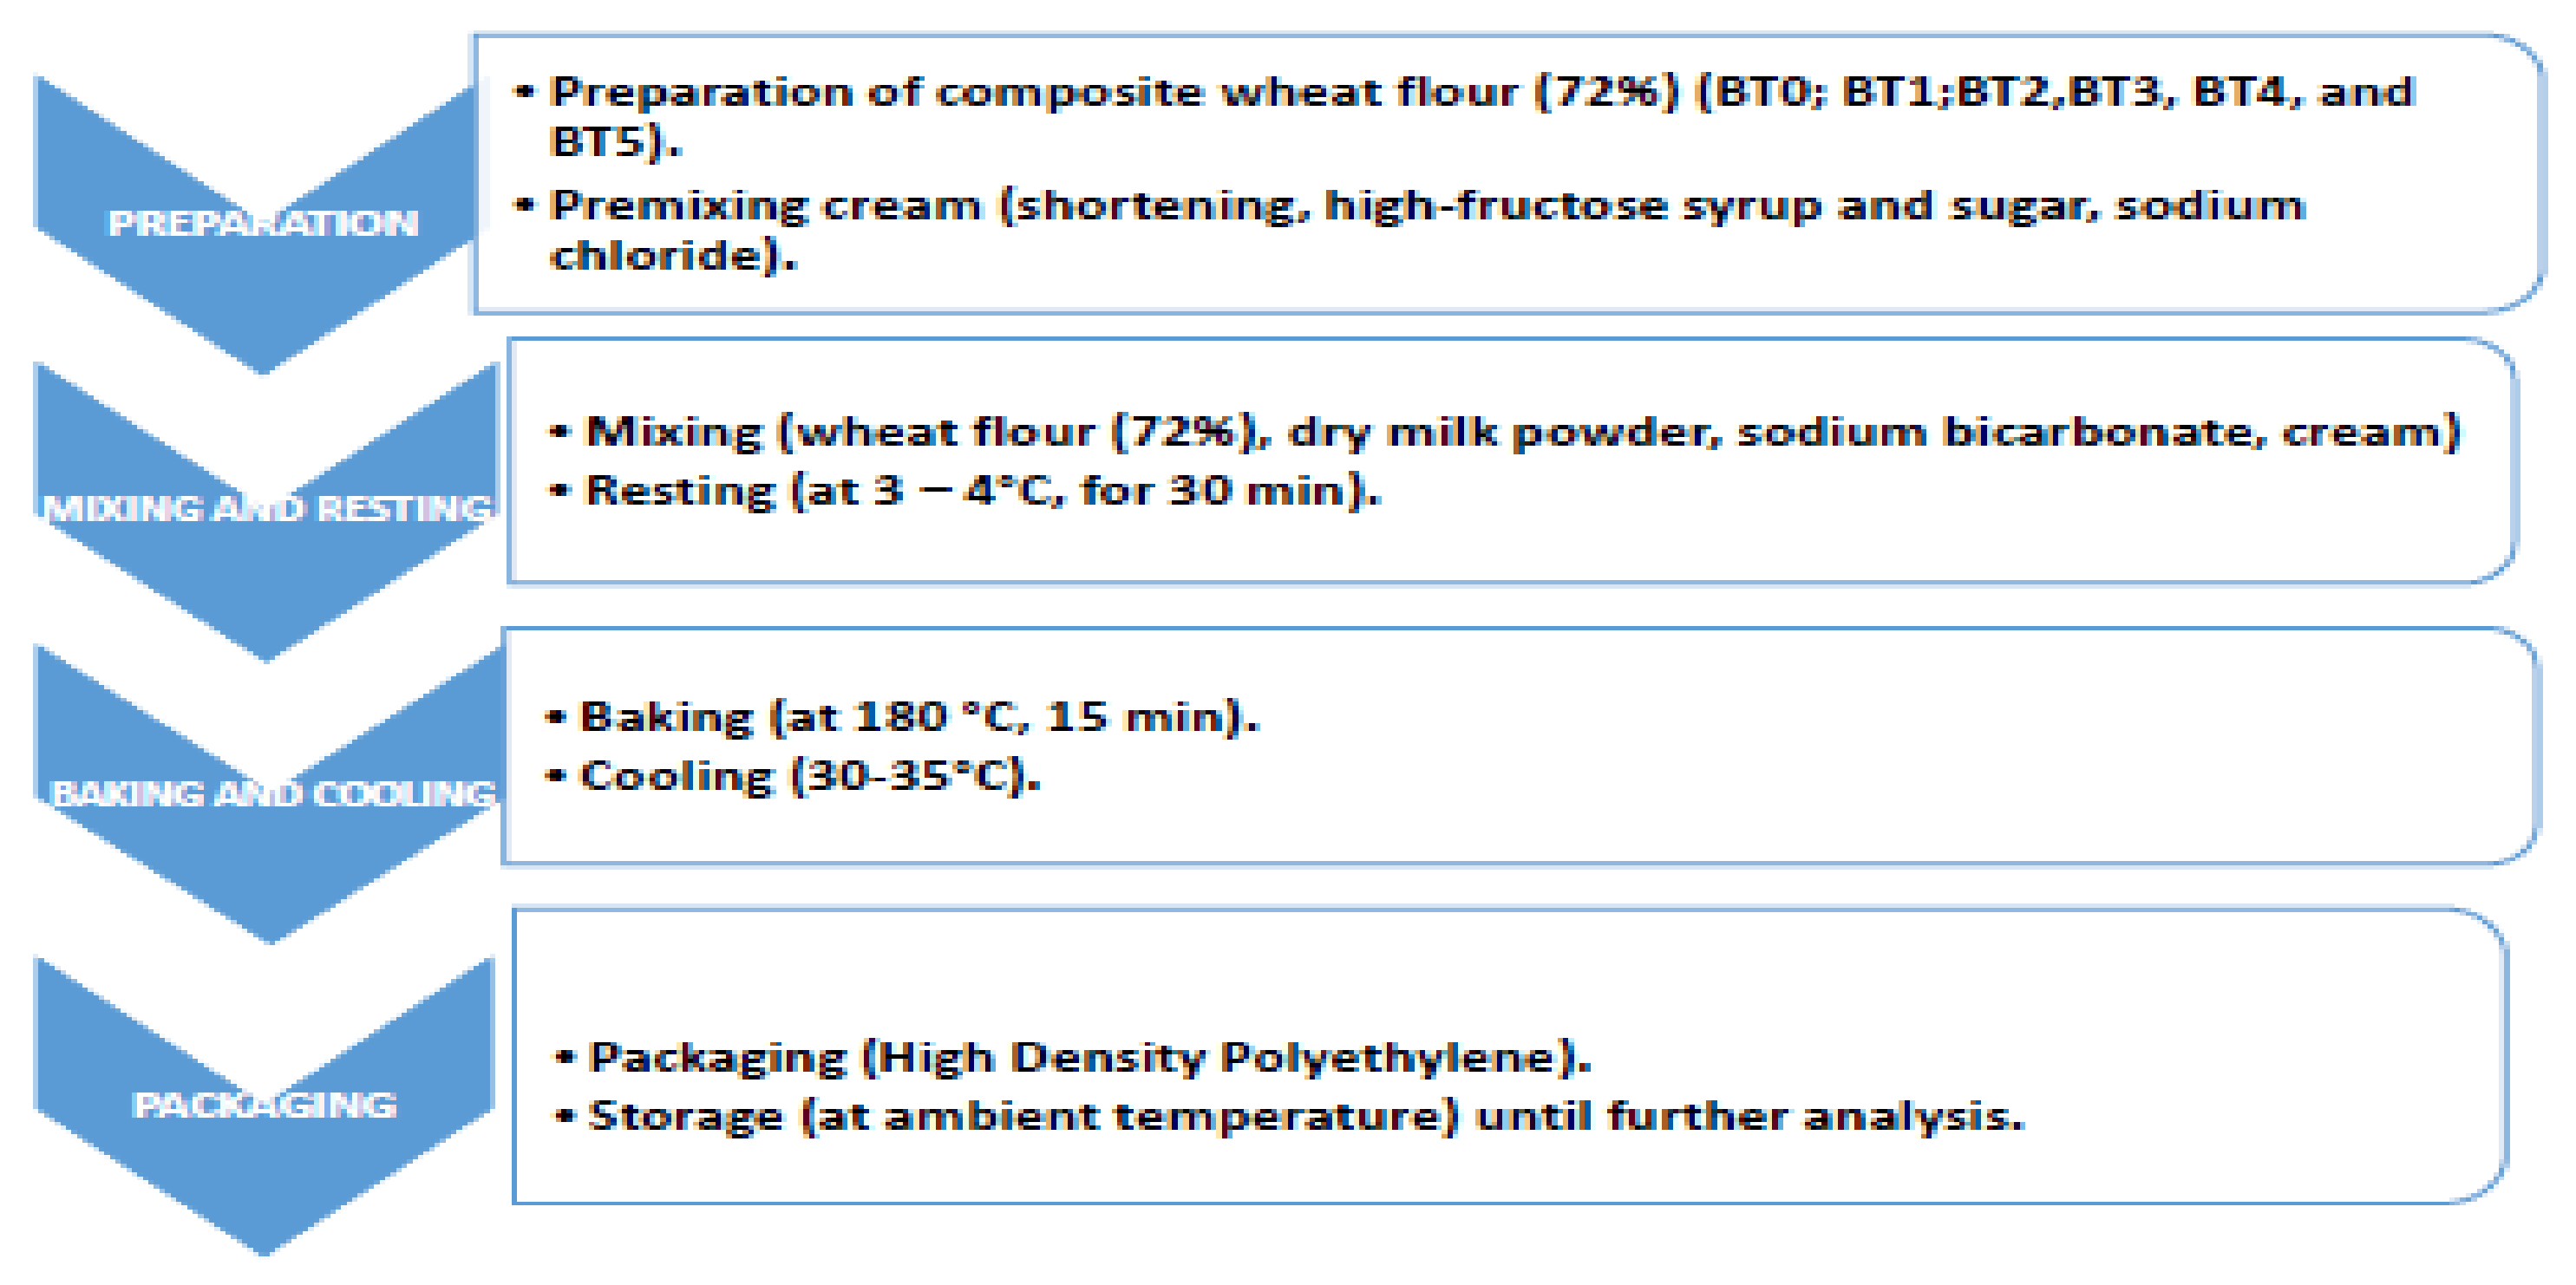
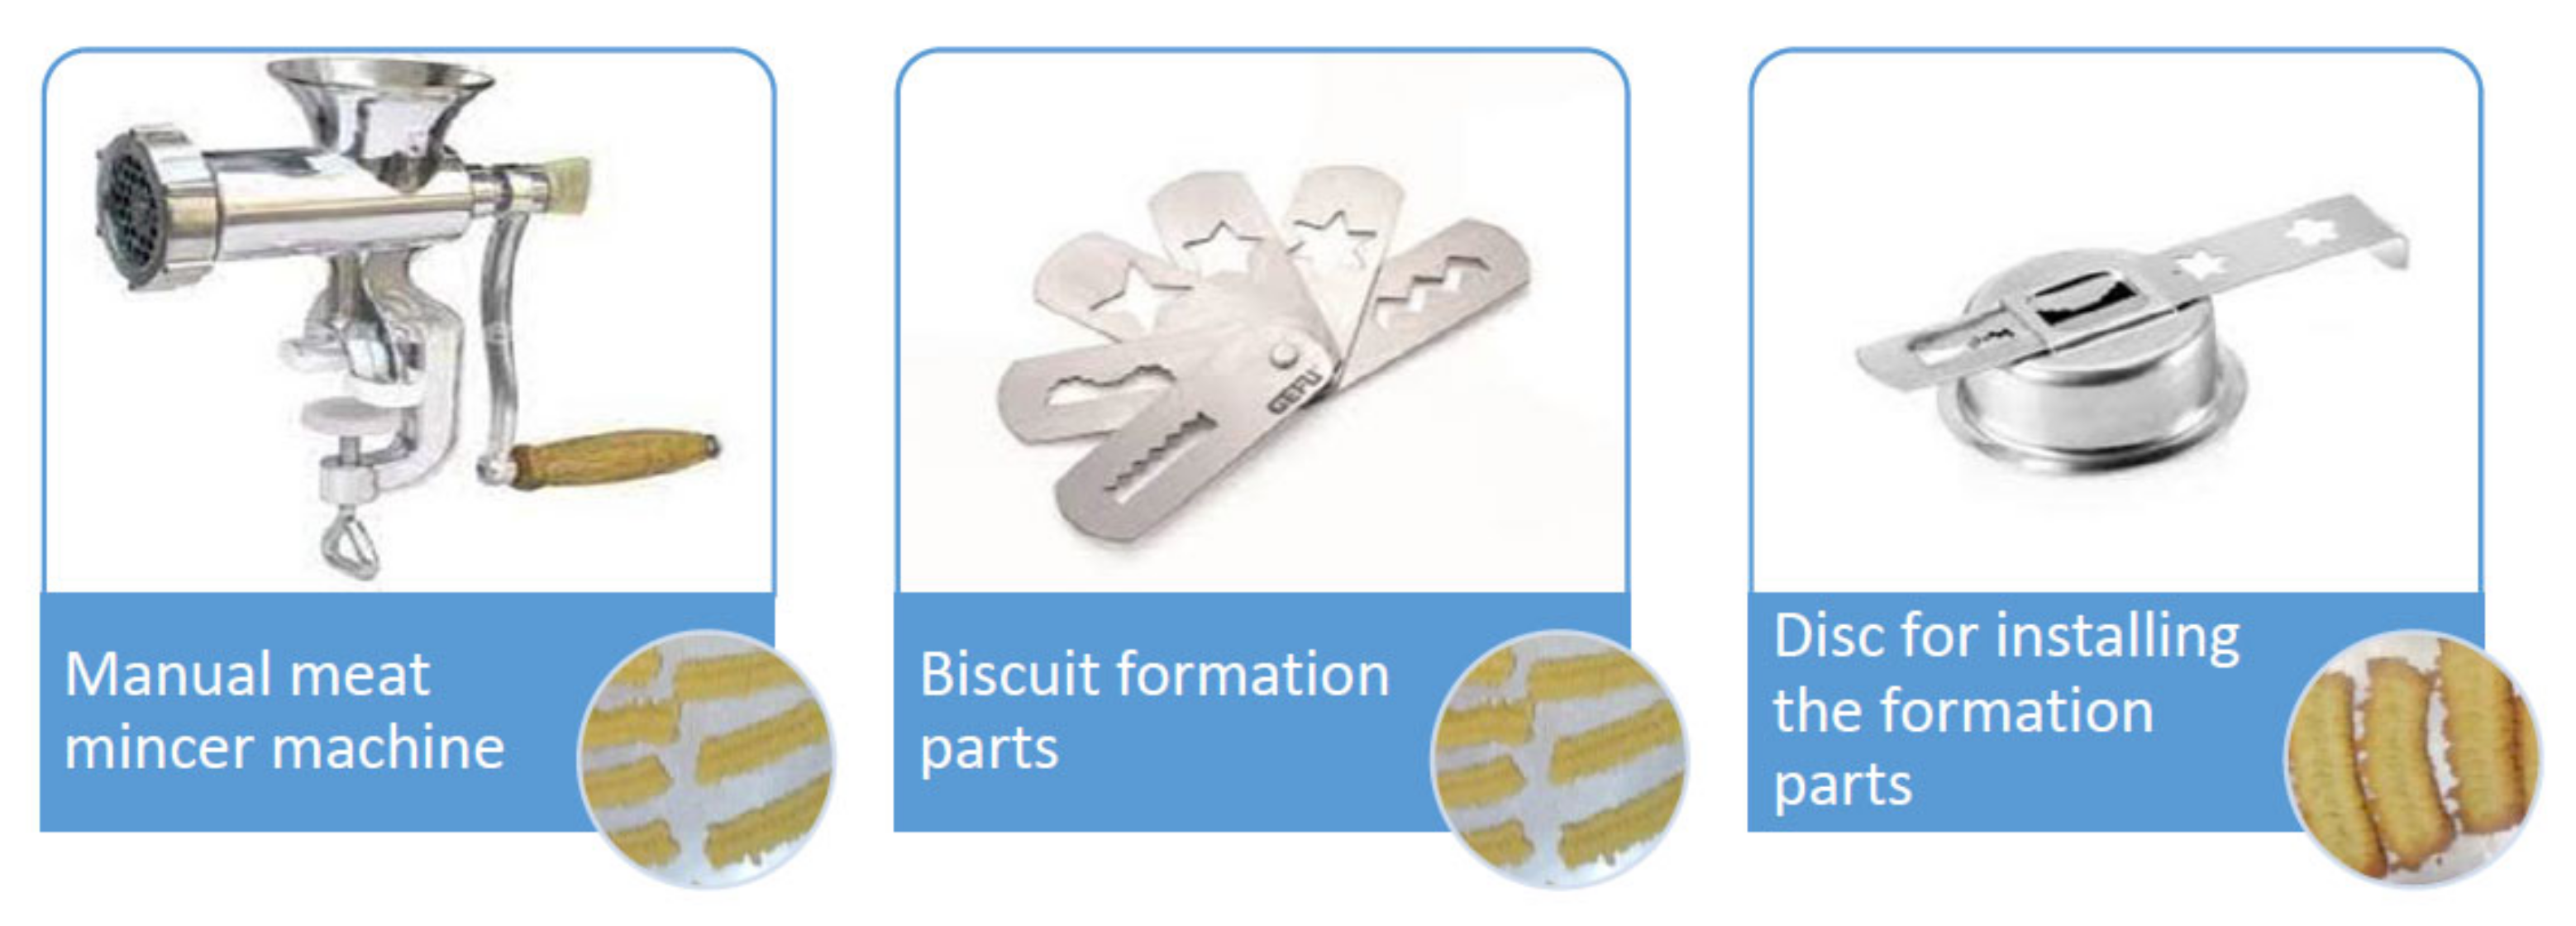
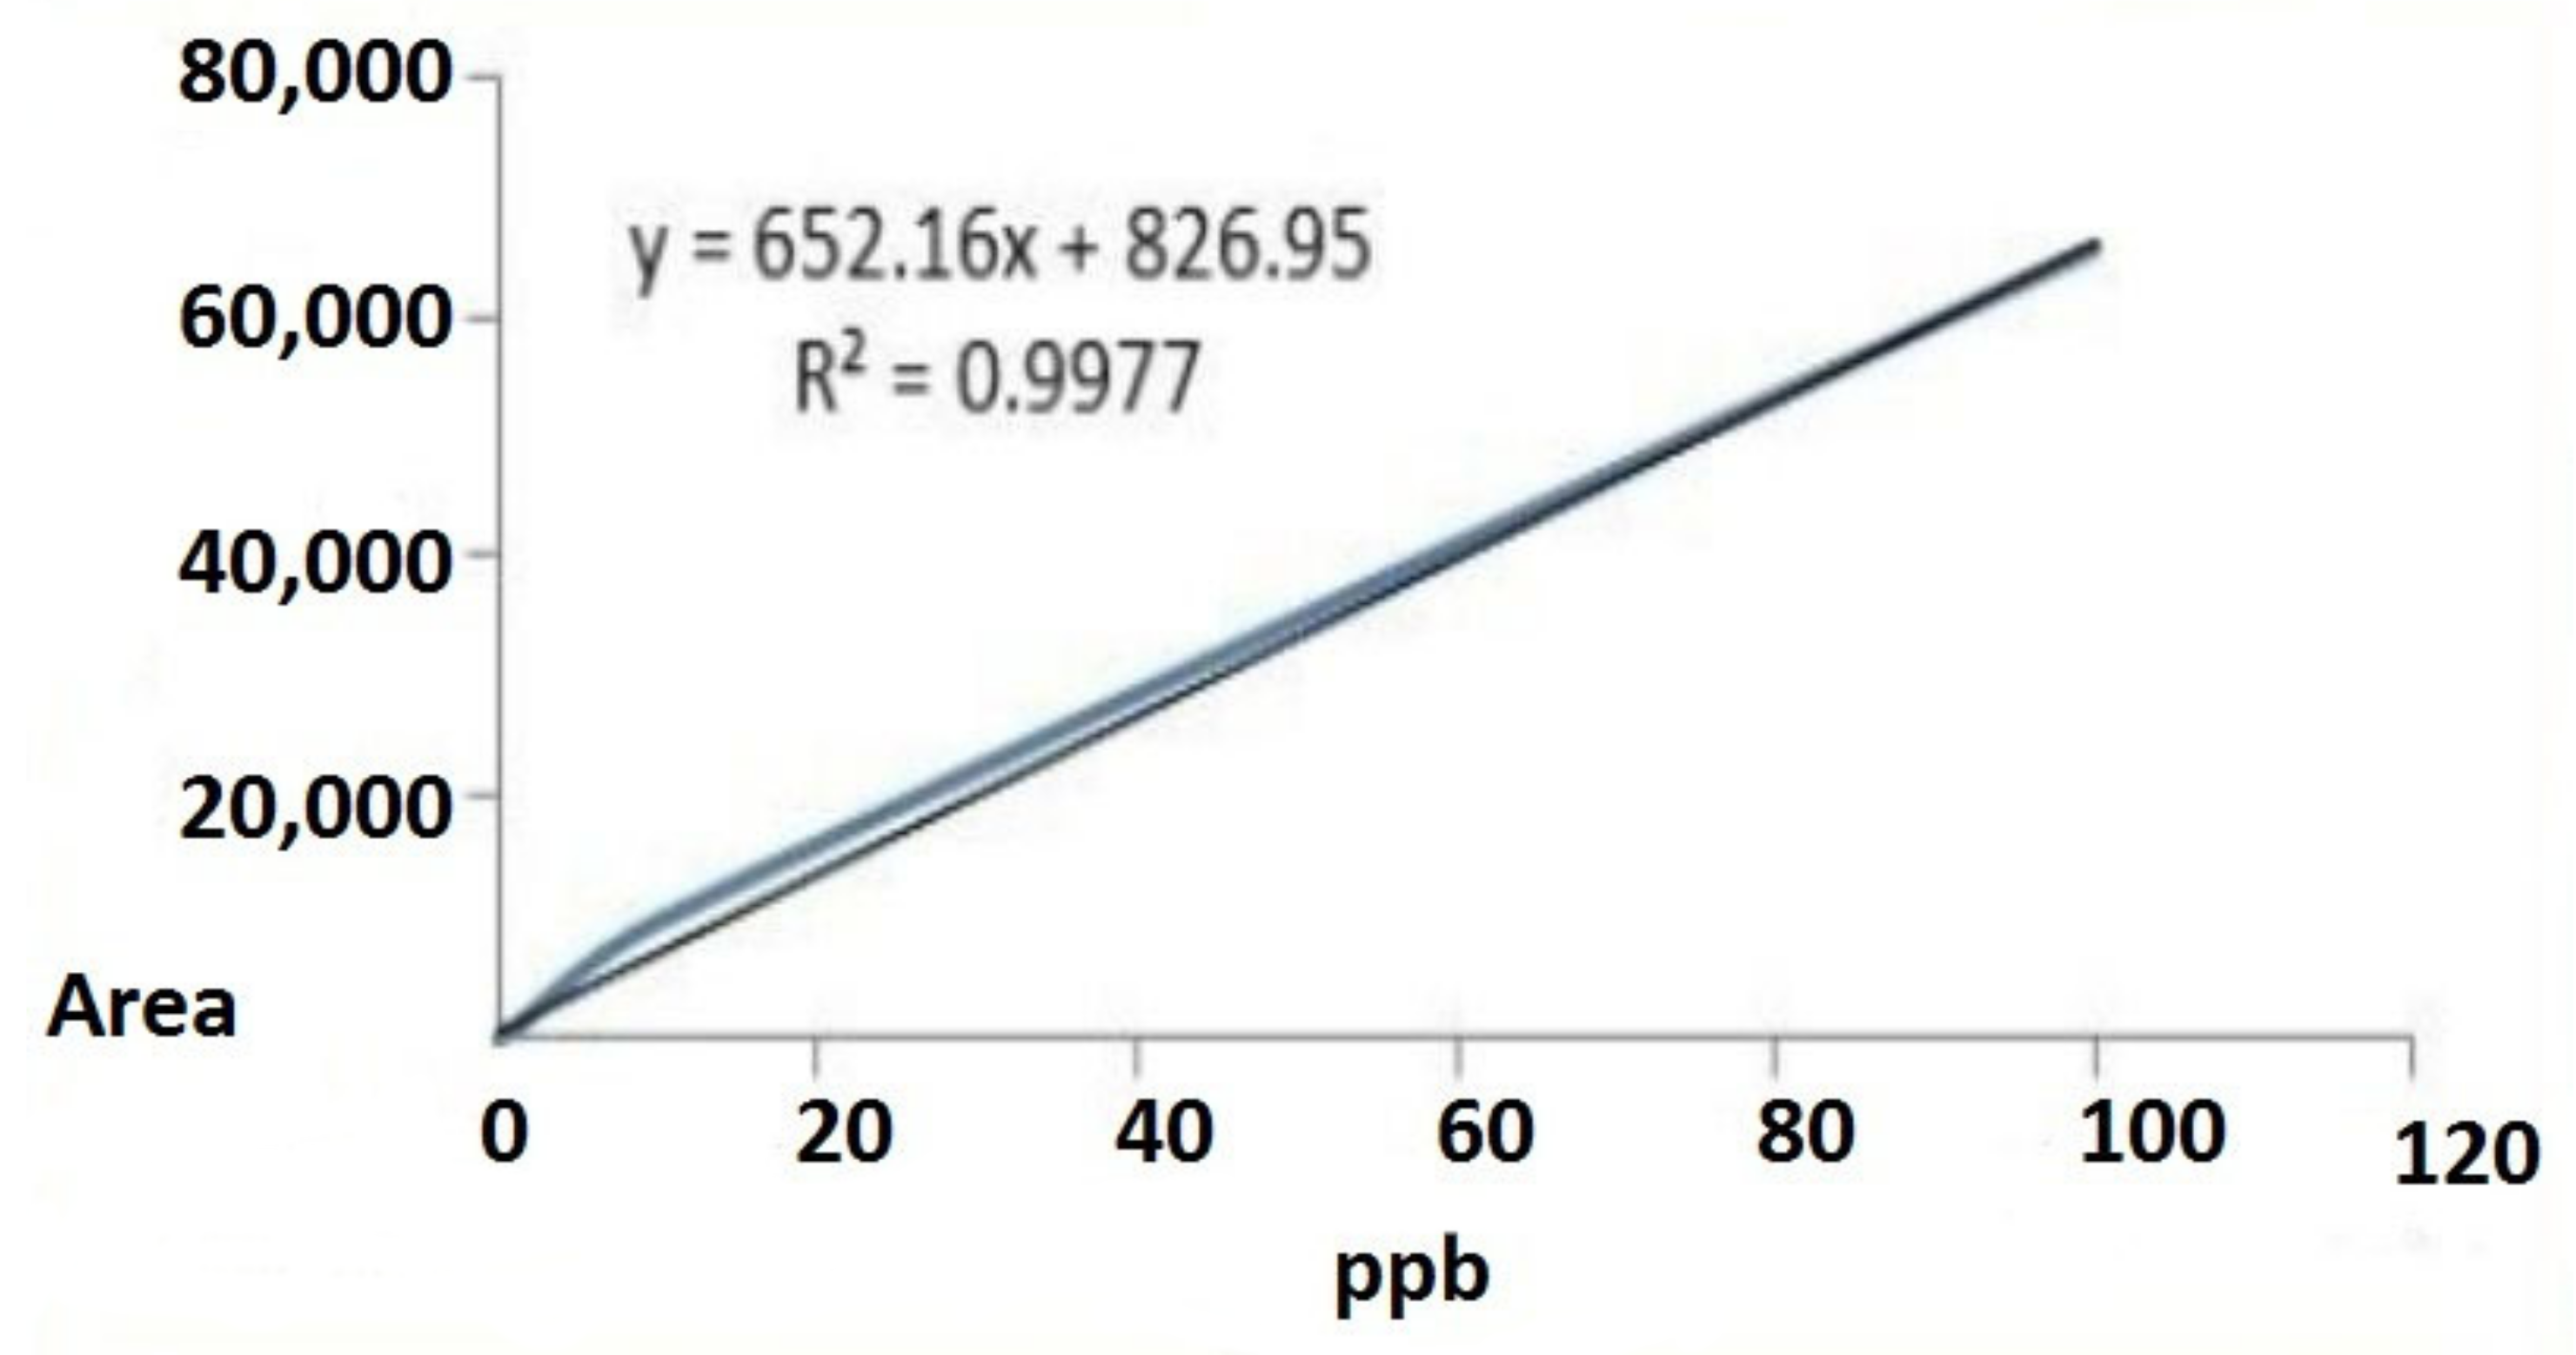
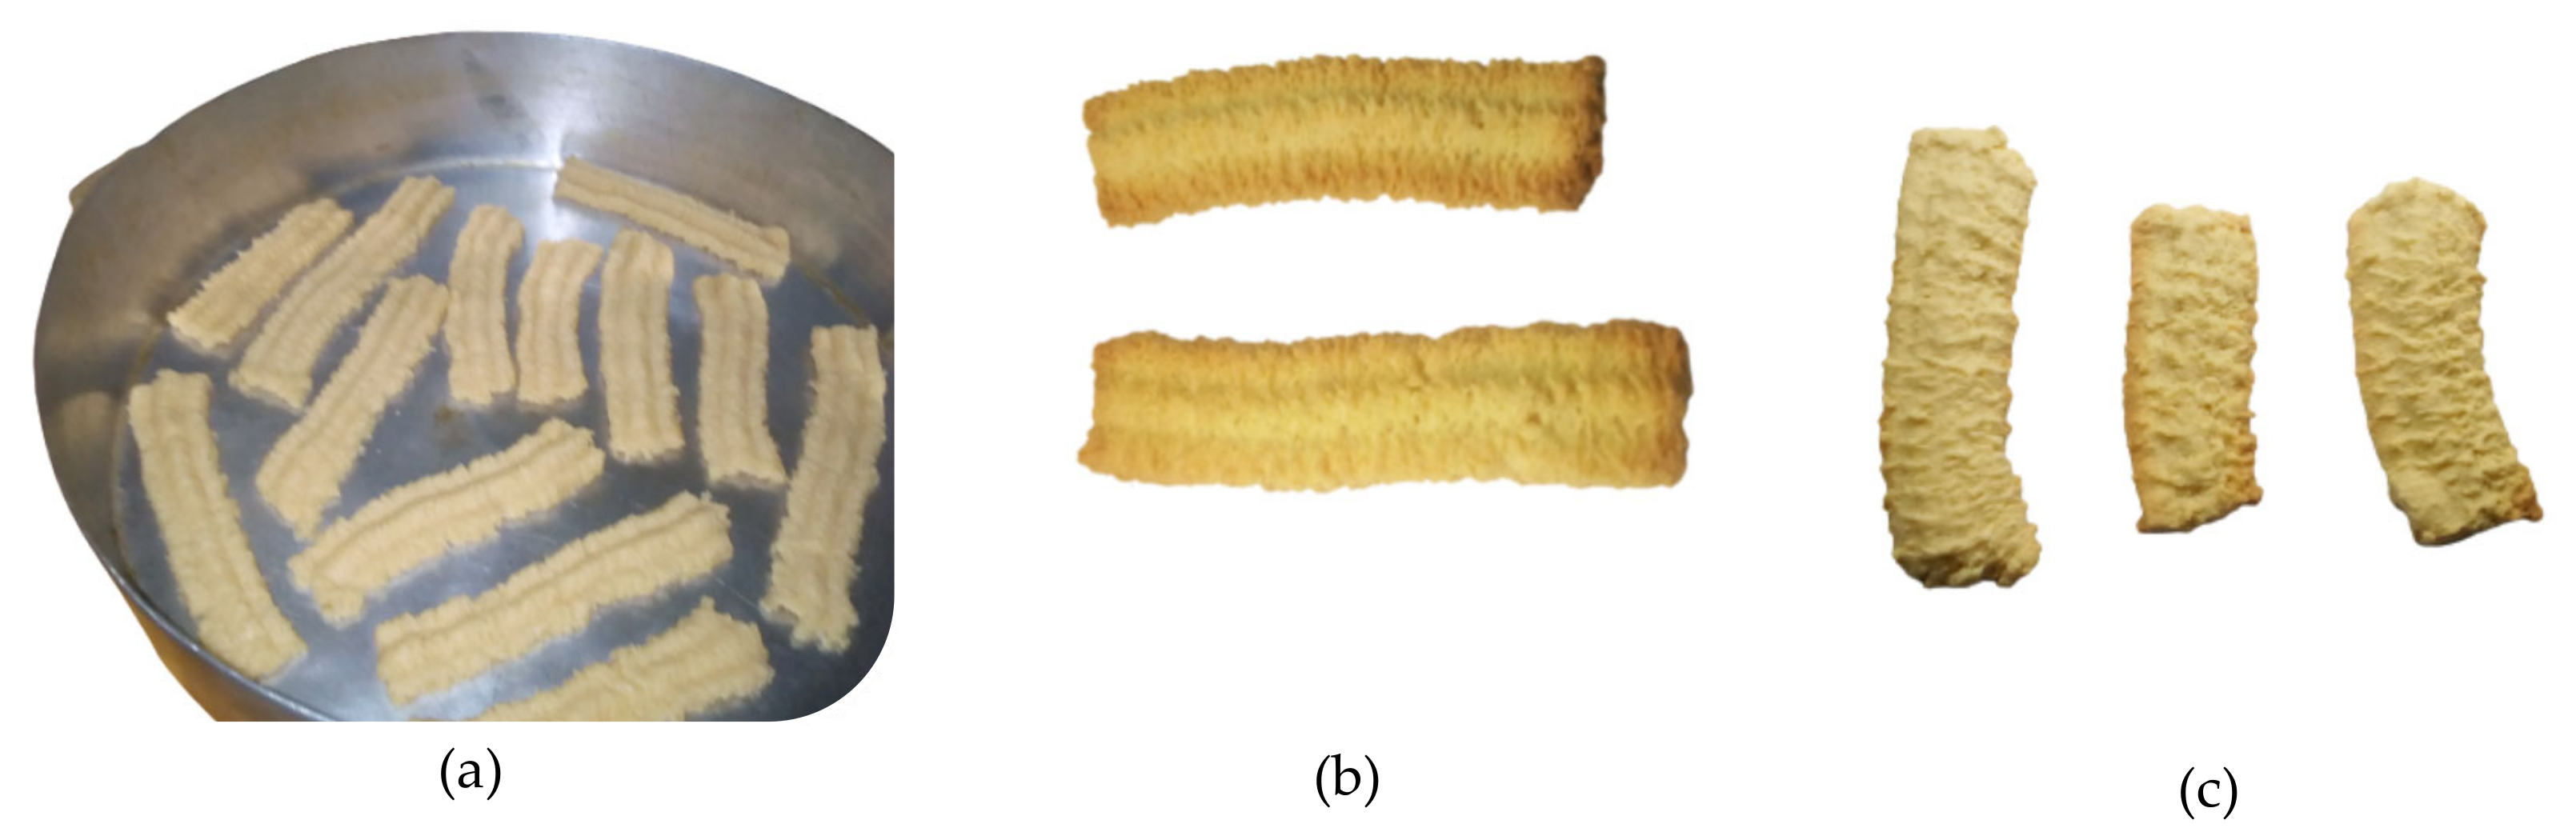
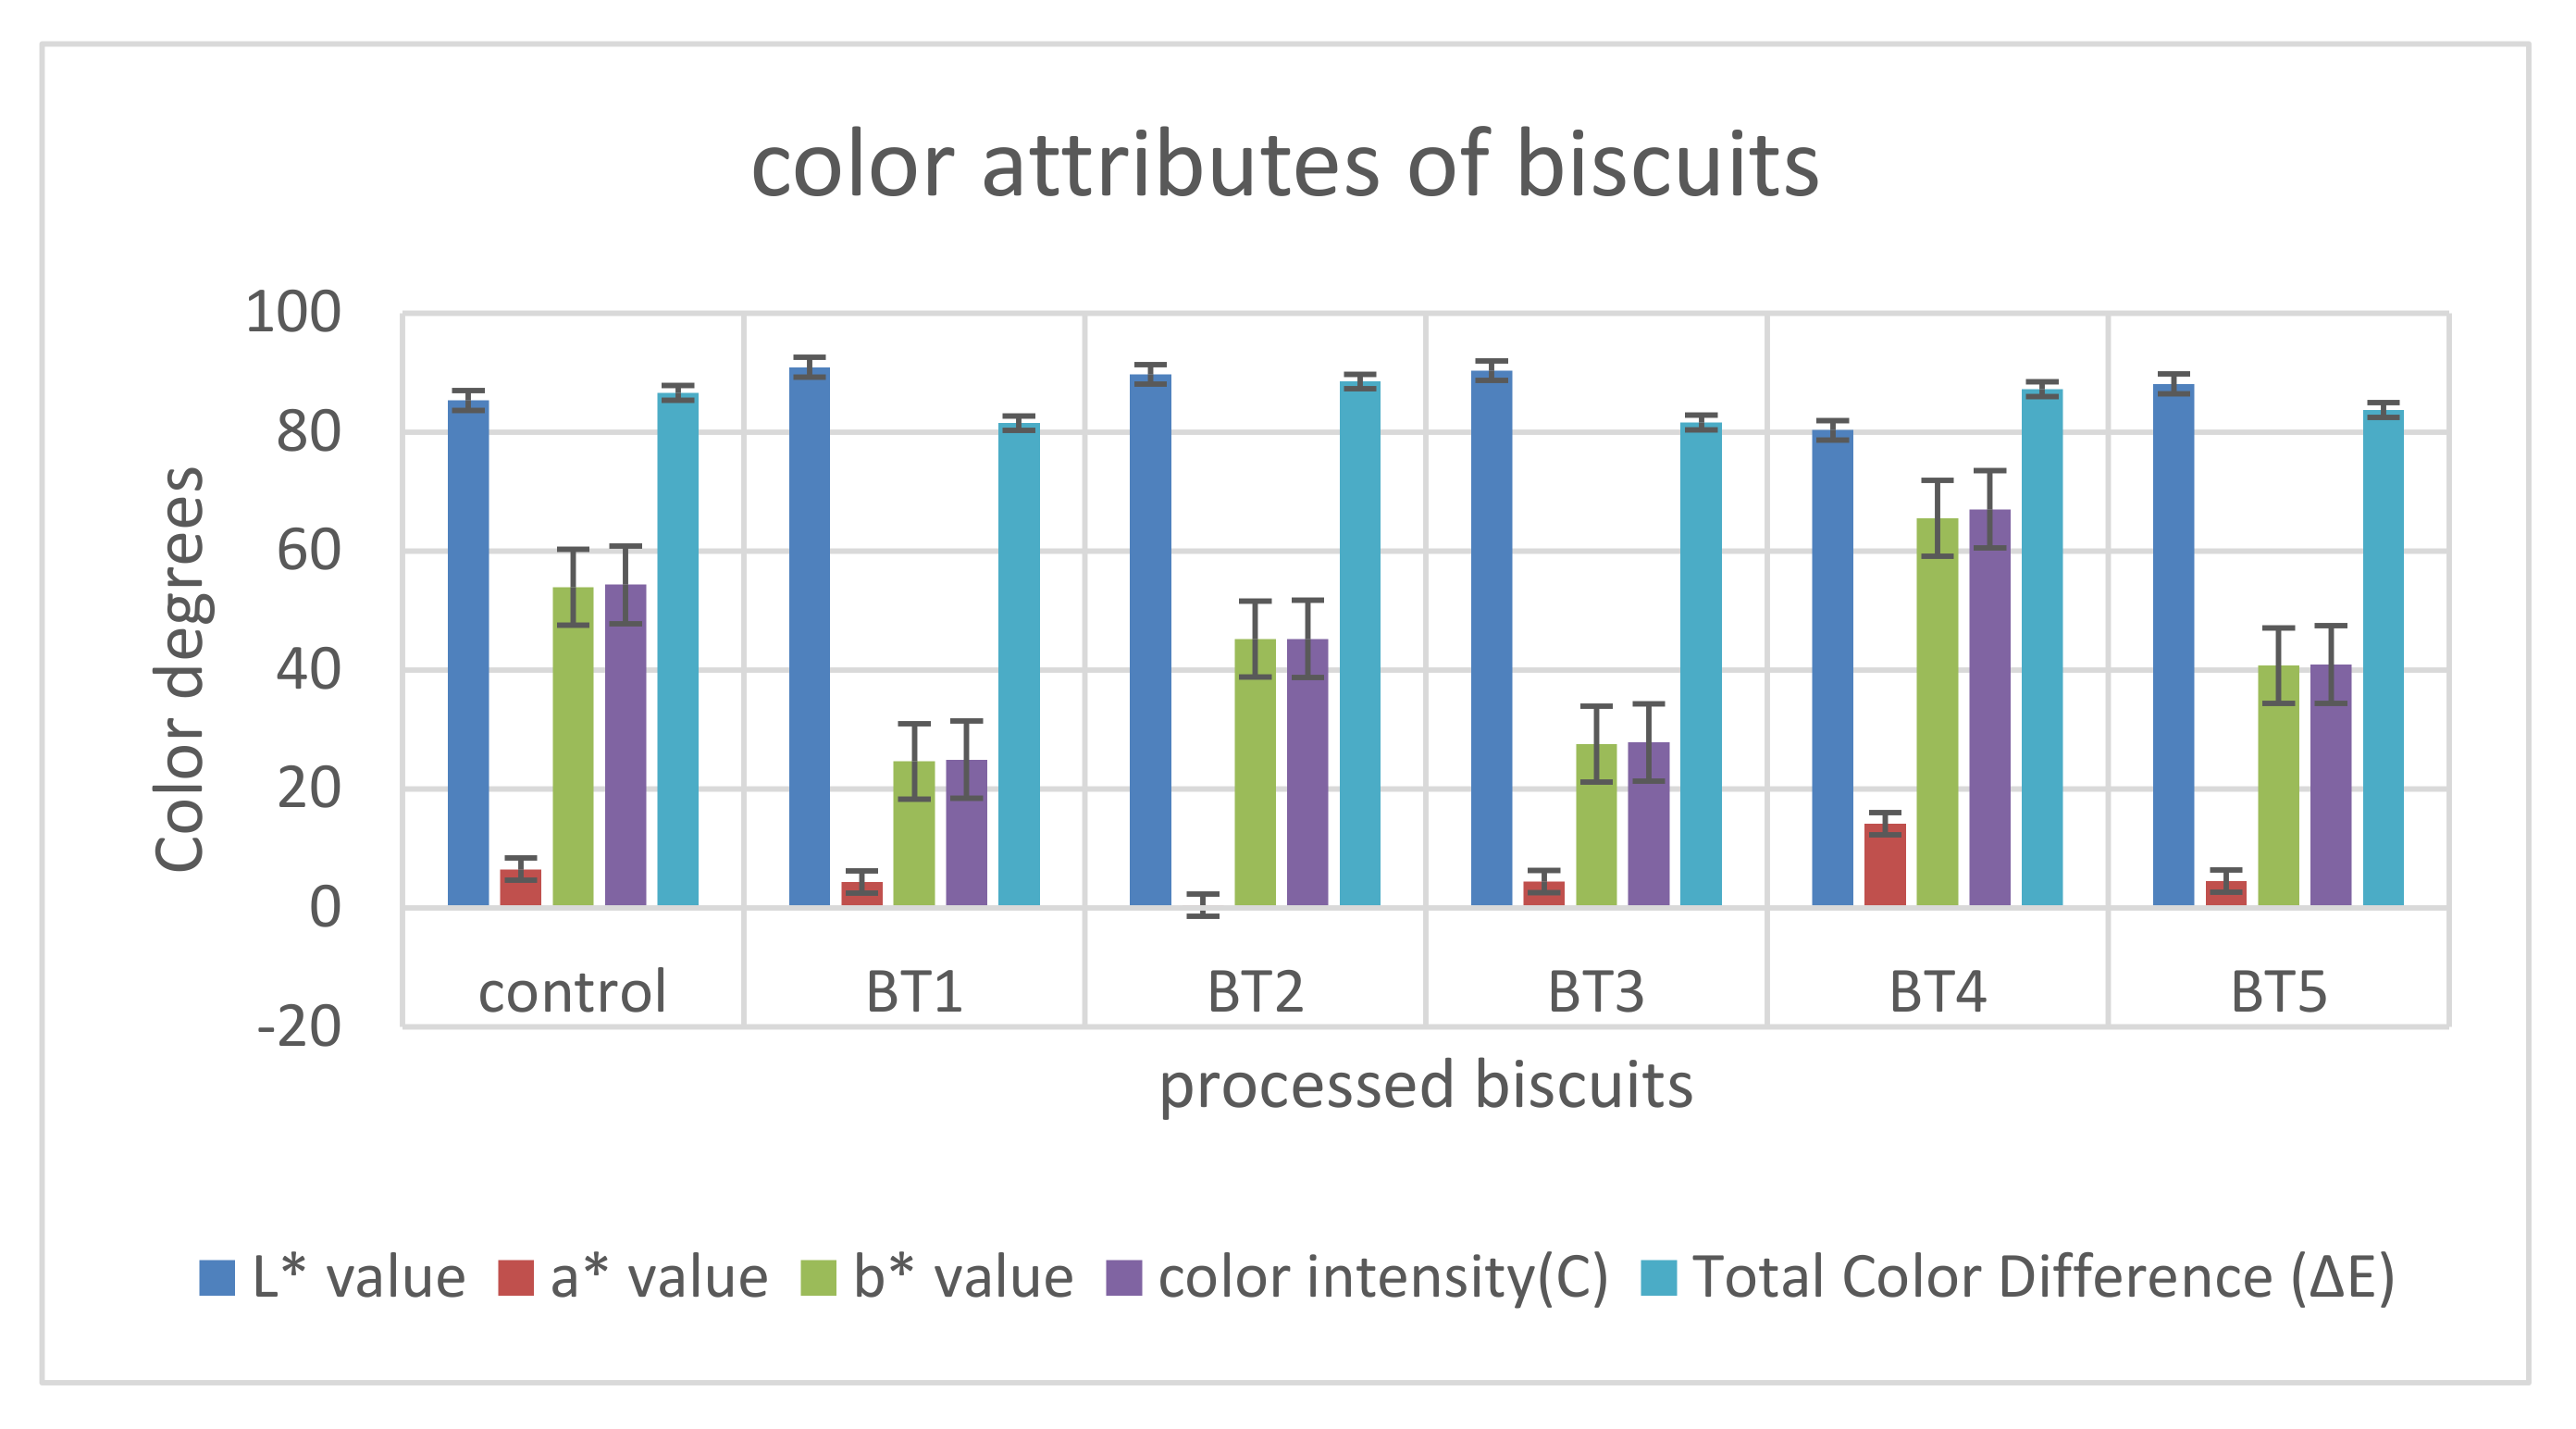
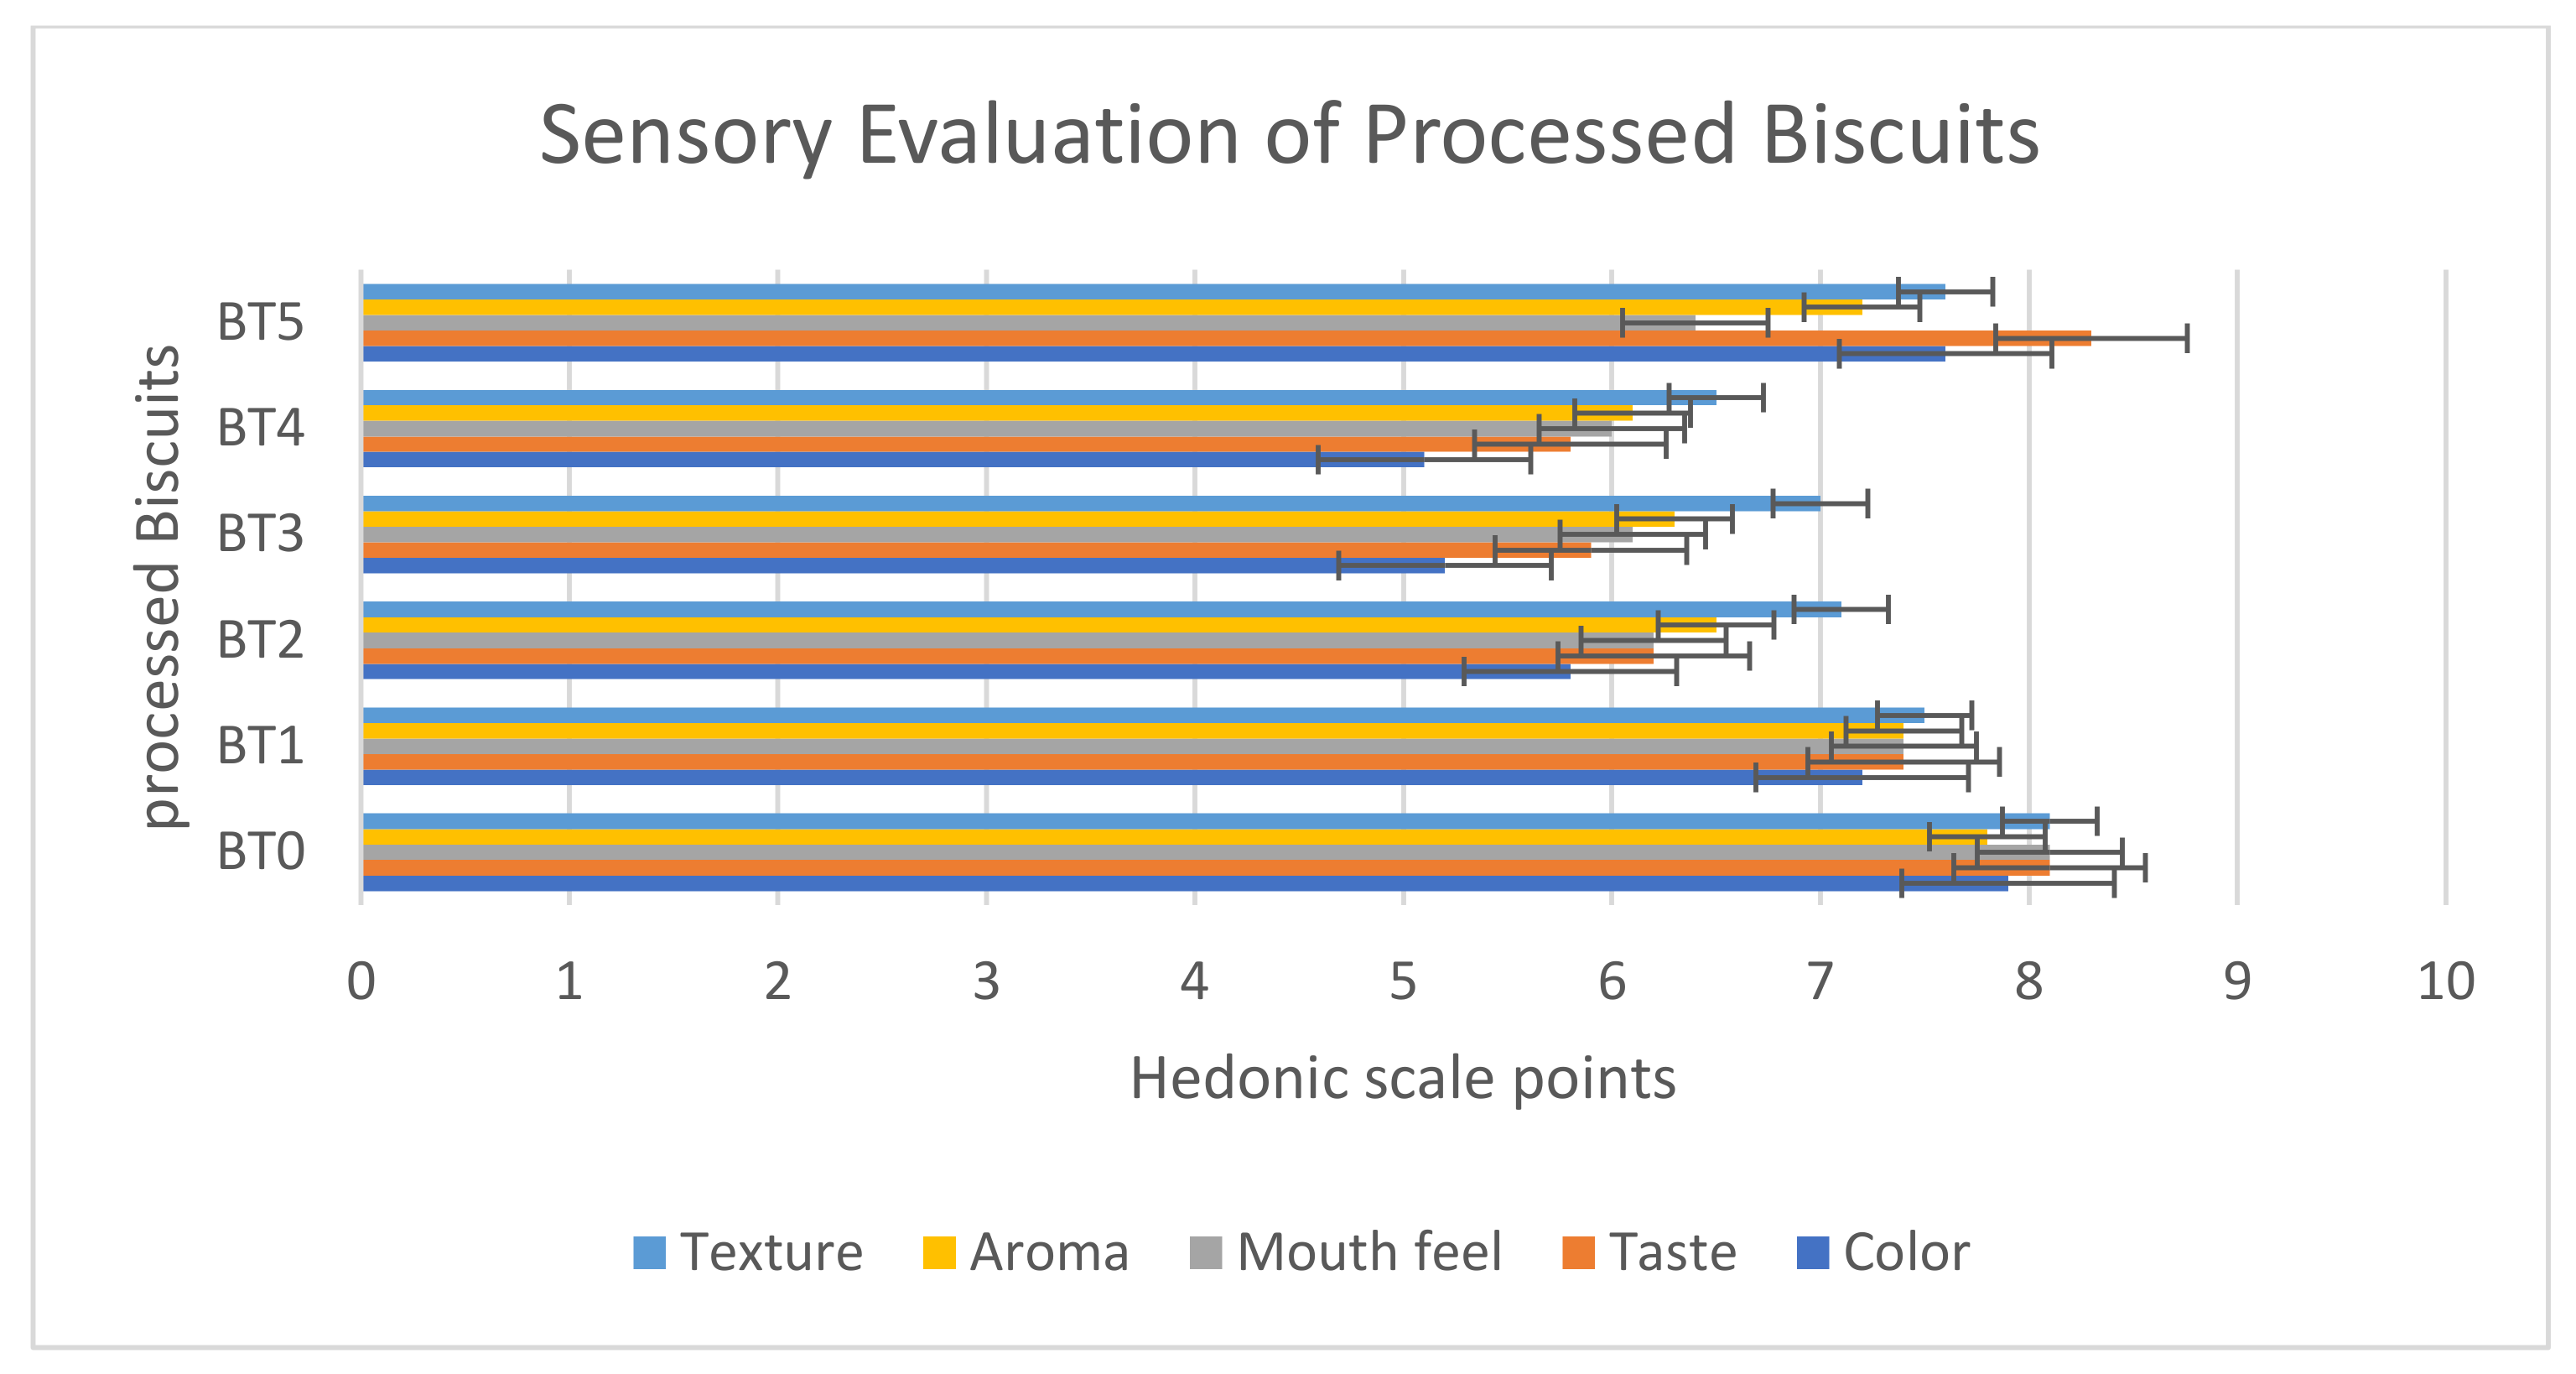
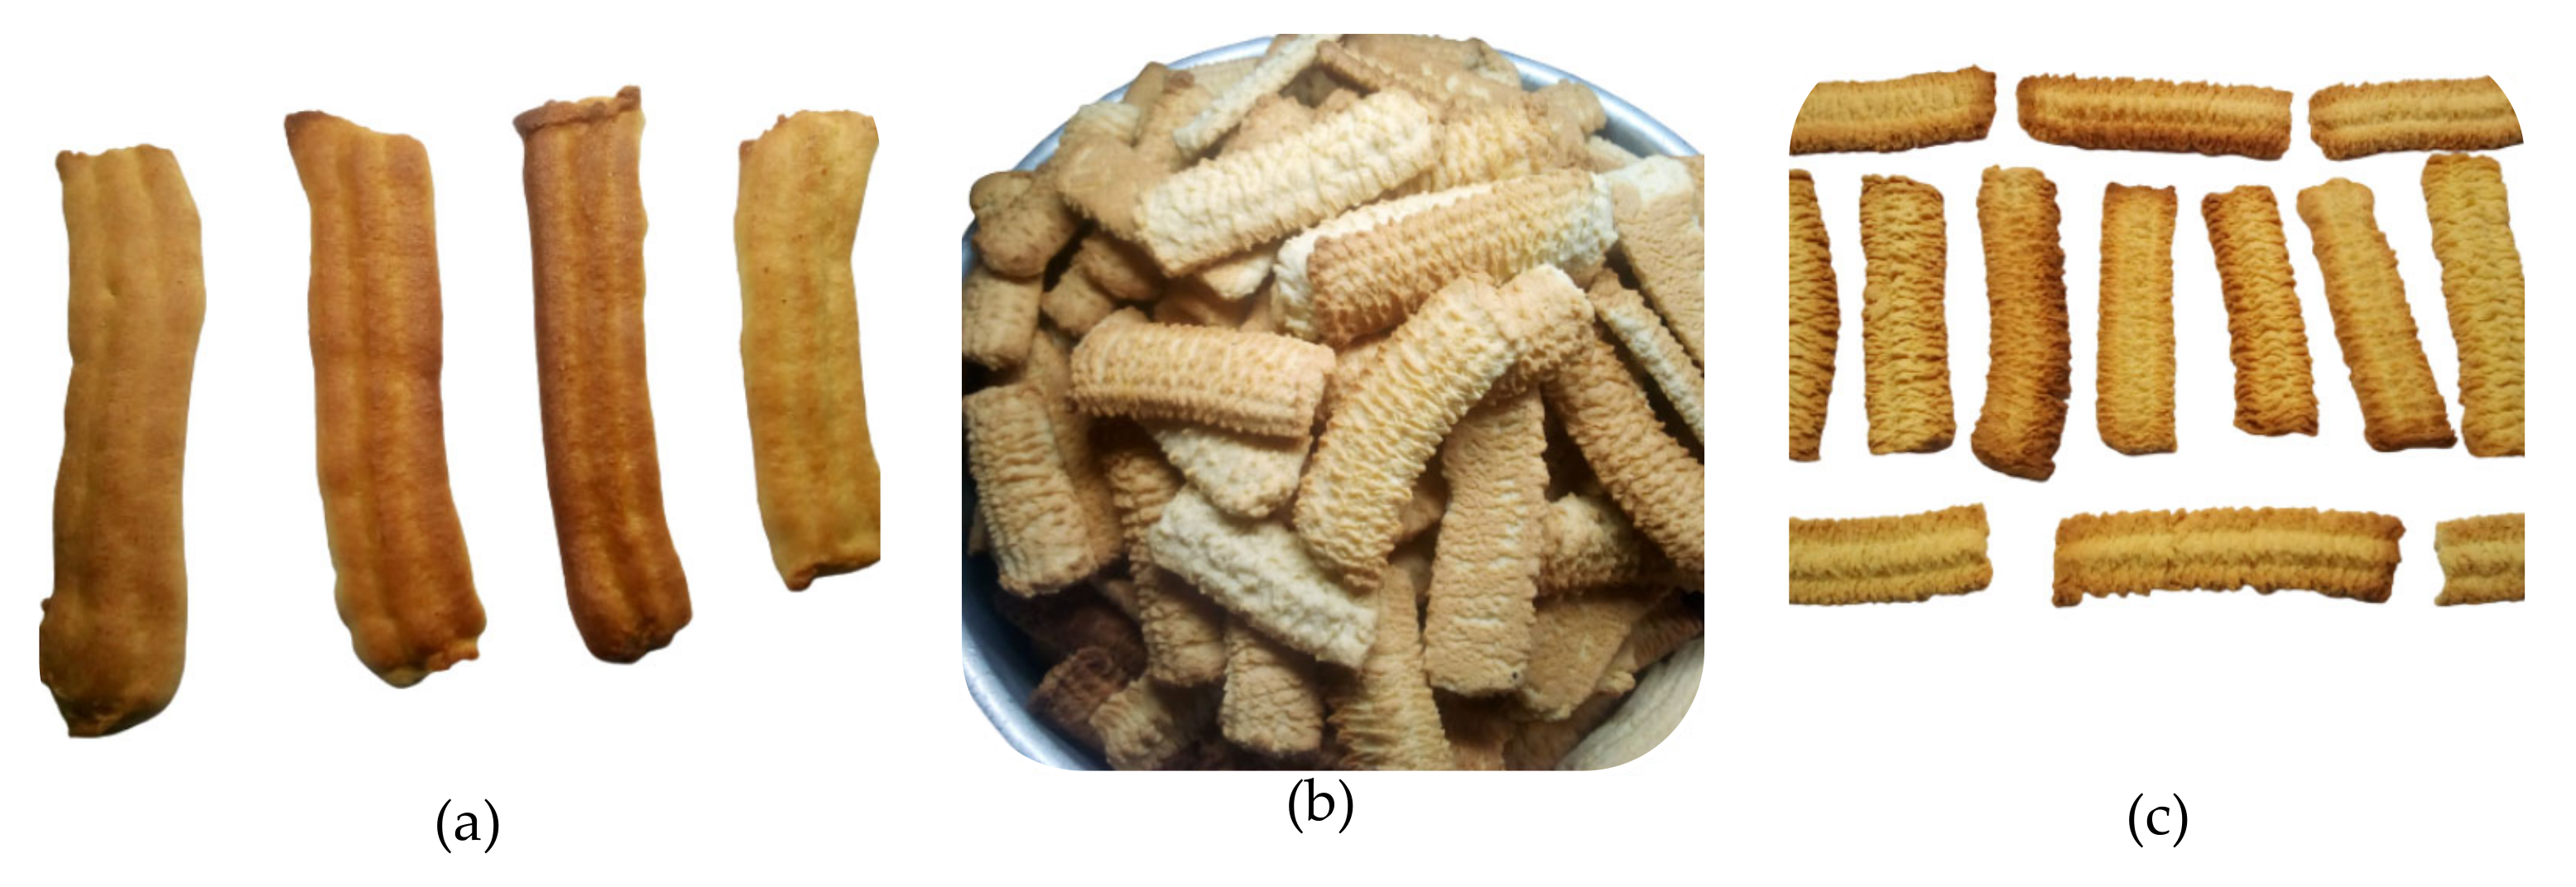
Table 1.
Treatment descriptions and the percentage of different treatments for biscuit manufacturing.
Table 1.
Treatment descriptions and the percentage of different treatments for biscuit manufacturing.
| Parameter | BT0 | BT1 | BT2 | BT3 | BT4 | BT5 |
|---|---|---|---|---|---|---|
| Asparaginase | -- | 0.5 gm/kg wheat flour | -- | -- | -- | -- |
| Glucose oxidase | -- | 0.5 gm/kg wheat flour | -- | -- | -- | |
| Mixed enzymes (1:1) | -- | -- | 0.5 gm/kg wheat flour | -- | -- | |
| Baker’s yeast | -- | -- | -- | 0.5 gm/kg wheat flour | -- | |
| Green tea | -- | -- | -- | -- | 0.5 gm/kg wheat flour |
Table 2.
Chemical composition of processed biscuits.
| Parameter | BT0 | BT1 | BT2 | BT3 | BT4 | BT5 | F. Test |
|---|---|---|---|---|---|---|---|
| Protein (%) | 8.30 ab ± 0.44 | 8.60 a ± 0.26 | 8.56 a ± 0.12 | 8.63 a ± 0.23 | 8.36 ab ± 0.31 | 8.00 b ± 0.32 | * |
| Ash (%) | 0.846 b ± 0.035 | 0.850 b ± 0.030 | 0.826 b ± 0.021 | 0.853 b ± 0.015 | 1.566 a ± 0.306 | 1.533 a ± 0.306 | NS |
| Fat (%) | 18.30 a ± 0.44 | 17.96 a ± 0.50 | 18.20 a ± 0.70 | 18.10 a ± 0.72 | 18.16 a ± 0.32 | 18.43 a ± 0.15 | * |
| Fibers (%) | 2.63 a ± 0.15 | 2.46 a ± 0.32 | 2.40 a ± 0.10 | 2.56 a ± 0.15 | 1.34 b ± 0.24 | 1.63 b ± 0.21 | * |
| Moisture (%) | 5.27 c ± 0.60 | 12.83 a ± 0.31 | 12.93 a ± 0.49 | 11.96 b ± 0.68 | 3.38 d ± 0.51 | 3.12 d ± 0.20 | * |
| Carbohydrates (%) | 64.65 b ± 1.28 | 57.28 c ± 0.29 | 57.07 c ± 1.06 | 57.88 c ± 0.66 | 67.17 a ± 0.47 | 66.94 a ± 0.40 | * |
| Energy (k. calories/g) | 456.5 b ± 1.53 | 425.2 c ± 3.84 | 426.3 c ± 1.96 | 428.9 c ± 6.75 | 465.6 a ± 0.65 | 466.9 a ± 2.61 | * |
| pH value | 6.86 a ± 0.25 | 6.50 a ± 0.26 | 5.53 b ± 0.44 | 5.40 b ± 0.25 | 4.66 c ± 0.21 | 4.53 c ± 0.15 | * |
| Total Titratable Acidity (TTA) % | 0.376 a ± 0.015 | 0.356 a ± 0.006 | 0.276 c ± 0.015 | 0.330 b ± 0.020 | 0.276 c ± 0.012 | 0.246 d ± 0.012 | * |
BT0 = control treatment biscuit, BT1 = L-asparaginase treatment biscuit, BT2 = glucose oxidase treatment biscuit, BT3 = mixed enzyme (1:1) treatment biscuit, BT4 = baker’s yeast powder, BT5 = green tea powder. * The results are presented as the mean value ± S.D. * Means followed by different small letters in the same column are significantly different (p ≤ 0.05). F. test: the ratio of the mean squared error between these groups.
Table 3.
Chemical parameters for processed biscuits.
| Parameter/Treatment | BT0 | BT1 | BT2 | BT3 | BT4 | BT5 | F. Test |
|---|---|---|---|---|---|---|---|
| Reducing sugar content (mg/100 g) | 5633.3 a ± 305.5 | 5500.0 a ± 264.6 | 3400.0 d ± 360.6 | 3900.0 c ± 0.0 | 2700.0 e ± 0.0 | 4800.0 b ± 0.0 | * |
| Asparagine content (mg/kg) | 478.6 a ± 1.5 | 151.3 f ± 1.5 | 470.0 b ± 2.0 | 241.3 d ± 1.5 | 222.3 e ± 3.2 | 423.3 c ± 3.5 | * |
| Asparagine/Reducing sugar ratio | 0.085 b ± 0.004 | 0.027 d ± 0.001 | 0.139 a ± 0.014 | 0.062 c ± 0.000 | 0.082 b ± 0.001 | 0.088 b ± 0.001 | * |
| Reduction in Asparagine (%) | 0.00 f ± 0.00 | 68.31 a ± 0.25 | 1.60 e ± 0.24 | 49.48 c ± 0.42 | 53.45 b ± 0.75 | 11.37 d ± 0.55 | * |
| Acrylamide (mg/kg) | 868.0 a ± 7.9 | 283.0 c ± 3.0 | 312.0 b ± 3.5 | 262.6 d ± 4.6 | 214.3 f ± 2.1 | 230.6 e ± 2.1 | * |
| Asparagine/Acrylamide ratio | 0.551 e ± 0.004 | 0.534 e ± 0.005 | 1.506 b ± 0.018 | 0.919 d ± 0.018 | 1.037 c ± 0.012 | 1.835 a ± 0.026 | * |
| Reduction in acrylamide (%) | 0.00 f ± 0.00 | 67.28 d ± 0.35 | 63.93 e ± 0.40 | 69.63 c ± 0.53 | 75.22 a ± 0.24 | 73.33 b ± 0.24 | * |
BT0 = control treatment biscuit, BT1 = L-asparaginase treatment biscuit, BT2 = glucose oxidase treatment biscuit, BT3 = mixed enzyme (1:1) treatment biscuit, BT4 = baker’s yeast powder, BT5 = green tea powder. * The results are presented as the mean value ± S.D. * Means followed by different small letters in the same column are significantly different (p ≤ 0.05). F. test: the ratio of the mean squared error between these groups.
Table 4.
Some essential mineral contents for biscuit samples.
| Parameter/Treatment | BT0 | BT1 | BT2 | BT3 | BT4 | BT5 | F. Test |
|---|---|---|---|---|---|---|---|
| Length (cm) | 9.30 c ± 0.10 | 9.50 bc ± 0.10 | 9.00 d ± 0.01 | 9.56 b ± 0.25 | 10.33 a ± 0.15 | 9.50 bc ± 0.20 | * |
| Width, W (cm) | 1.70 c ± 0.10 | 1.70 c ± 0.26 | 1.83 c ± 0.12 | 1.80 c ± 0.01 | 2.60 a ± 0.10 | 2.13 b ± 0.15 | * |
| Thickness, T (cm) | 0.73 c ± 0.06 | 0.86 c ± 0.06 | 0.83 c ± 0.06 | 0.86 c ± 0.06 | 1.46 a ± 0.15 | 1.16 b ± 0.15 | * |
| Volume (cm3) | 11.58 c ± 1.00 | 13.92 c ± 1.63 | 13.71 c ± 0.05 | 14.94 c ± 1.35 | 39.42 a ± 4.66 | 23.65 b ± 3.79 | * |
| Spread ratio (SF) | 2.32 a ± 0.23 | 1.97 abc ± 0.41 | 2.21 ab ± 0.28 | 2.08 abc ± 0.14 | 1.78 c ± 0.15 | 1.84 bc ± 0.23 | * |
| Weight (g) | 8.63 ab ± 0.21 | 8.53 b ± 0.06 | 8.26 c ± 0.06 | 8.53 b ± 0.06 | 8.23 c ± 0.15 | 8.80 a ± 0.10 | * |
| Density (g/v) | 0.747 a ± 0.048 | 0.619 b ± 0.074 | 0.603 b ± 0.004 | 0.574 b ± 0.053 | 0.210 d ± 0.023 | 0.377 c ± 0.054 | * |
| Baking loss (%) | 29.13c ± 0.86 | 29.69c ± 1.56 | 26.08d ± 2.17 | 30.98b ± 0.63 | 18.99e ± 0.92 | 33.07a ± 0.76 | * |
BT0 = control treatment biscuit, BT1 = L-asparaginase treatment biscuit, BT2 = glucose oxidase treatment biscuit, BT3 = mixed enzyme (1:1) treatment biscuit, BT4 = baker’s yeast powder, BT5 = green tea powder. * The results are presented as the mean value ± S.D. * Means followed by different small letters in the same column are significantly different (p ≤ 0.05). F. test: the ratio of the mean squared error between these groups.
Table 5.
Physical characteristics of processed biscuits.
| Parameter/Treatment | BT0 | BT1 | BT2 | BT3 | BT4 | BT5 | F. Test |
|---|---|---|---|---|---|---|---|
| Length (cm) | 9.30 c ± 0.10 | 9.50 bc ± 0.10 | 9.00 d ± 0.01 | 9.56 b ± 0.25 | 10.33 a ± 0.15 | 9.50 bc ± 0.20 | * |
| Width, W (cm) | 1.70 c ± 0.10 | 1.70 c ± 0.26 | 1.83 c ± 0.12 | 1.80 c ± 0.01 | 2.60 a ± 0.10 | 2.13 b ± 0.15 | * |
| Thickness, T (cm) | 0.73 c ± 0.06 | 0.86 c ± 0.06 | 0.83 c ± 0.06 | 0.86 c ± 0.06 | 1.46 a ± 0.15 | 1.16 b ± 0.15 | * |
| Volume (cm3) | 11.58 c ± 1.00 | 13.92 c ± 1.63 | 13.71 c ± 0.05 | 14.94 c ± 1.35 | 39.42 a ± 4.66 | 23.65 b ± 3.79 | * |
| Spread ratio (SF) | 2.32 a ± 0.23 | 1.97 abc ± 0.41 | 2.21 ab ± 0.28 | 2.08 abc ± 0.14 | 1.78 c ± 0.15 | 1.84 bc ± 0.23 | * |
| Weight (g) | 8.63 ab ± 0.21 | 8.53 b ± 0.06 | 8.26 c ± 0.06 | 8.53 b ± 0.06 | 8.23 c ± 0.15 | 8.80 a ± 0.10 | * |
| Density (g/v) | 0.747 a ± 0.048 | 0.619 b ± 0.074 | 0.603 b ± 0.004 | 0.574 b ± 0.053 | 0.210 d ± 0.023 | 0.377 c ± 0.054 | * |
| Baking loss (%) | 29.13 c ± 0.86 | 29.69 c ± 1.56 | 26.08 d ± 2.17 | 30.98 b ± 0.63 | 18.99 e ± 0.92 | 33.07 a ± 0.76 | * |
BT0 = control treatment biscuit, BT1 = L-asparaginase treatment biscuit, BT2 = glucose oxidase treatment biscuit, BT3 = mixed enzyme (1:1) treatment biscuit, BT4 = baker’s yeast powder, BT5 = green tea powder. * The results are presented as the mean value ± S.D. * Means followed by different small letters in the same column are significantly different (p ≤ 0.05). F. test: the ratio of the mean squared error between these groups.
Disclaimer/Publisher’s Note: The statements, opinions and data contained in all publications are solely those of the individual author(s) and contributor(s) and not of MDPI and/or the editor(s). MDPI and/or the editor(s) disclaim responsibility for any injury to people or property resulting from any ideas, methods, instructions or products referred to in the content. |
© 2023 by the authors. Licensee MDPI, Basel, Switzerland. This article is an open access article distributed under the terms and conditions of the Creative Commons Attribution (CC BY) license (https://creativecommons.org/licenses/by/4.0/).
Share and Cite
MDPI and ACS Style
El-Sayed, A.A.; Abdelhady, M.M.; Jaafari, S.A.; Alanazi, T.M.; Mohammed, A.S. Impact of Some Enzymatic Treatments on Acrylamide Content in Biscuits. Processes 2023, 11, 1041. https://doi.org/10.3390/pr11041041
AMA Style
El-Sayed AA, Abdelhady MM, Jaafari SA, Alanazi TM, Mohammed AS. Impact of Some Enzymatic Treatments on Acrylamide Content in Biscuits. Processes. 2023; 11(4):1041. https://doi.org/10.3390/pr11041041
Chicago/Turabian StyleEl-Sayed, Amr A., Magdy M. Abdelhady, Saleh A. Jaafari, Tariq M. Alanazi, and Alaa S. Mohammed. 2023. "Impact of Some Enzymatic Treatments on Acrylamide Content in Biscuits" Processes 11, no. 4: 1041. https://doi.org/10.3390/pr11041041
Note that from the first issue of 2016, this journal uses article numbers instead of page numbers. See further details here.