
Efficient Non-Destructive Detection of Interface Adhesion State by Interfacial Thermal Conductance: A Molecular Dynamics Study
Jiangsu Key Laboratory of Advanced Food Manufacturing Equipment and Technology, Jiangnan University, Wuxi 214122, China
*
Author to whom correspondence should be addressed.
Processes 2023, 11(4), 1032; https://doi.org/10.3390/pr11041032
Submission received: 2 March 2023
/
Revised: 22 March 2023
/
Accepted: 27 March 2023
/
Published: 29 March 2023
Abstract
:The state of interface adhesion, as measured by the void ratio, is a critical factor affecting the adhesion strength and heat dissipation efficiency of a system. However, non-destructive and rapid detection of the adhesion process remains a challenge. In this study, we used all-atom molecular dynamics simulations to investigate the interfacial thermal conductance of silicon and polymer at various adhesion void ratios, with the aim of achieving non-destructive and rapid detection of the adhesion process. Our results demonstrate a linear relationship between the interfacial thermal conductance and effective contact area at different temperatures, enabling the numerical value of interfacial thermal conductance to serve as an indicator of interfacial adhesion state. Furthermore, we also output the surface temperature of the adhesive interface. The non-uniformity of the surface temperature evolution can be used to identify the location of bubbles on the adhesive surface, which further reflects the bonding state of the interface. This project presents a novel approach and research framework for the non-destructive and rapid testing of the adhesion processes.
1. Introduction
Adhesives are components that bond two different materials or the same material together by means of an adhesive action [1,2,3]. Structural adhesives have provided the design engineer with a flexible tool for the creation of light engineering structures that would otherwise be very difficult, if not impossible, to fabricate. In the early stage, adhesives and sealants were collected from animals and plants with simple processing, and much of the animal glues were used as interior applications. With the development of new technologies, synthetic adhesives became the predominant ones because of their advantages of low cost, water resistance, and easy accessibility. Nowadays, with the continuous development of the economic and scientific field, the adhesive industry has become a very important new material for the development of high technology [4,5]. Due to their special and excellent properties, they are widely used in several industries and in life such as automotive, aeronautics, clothing, tooling, implants, power generation, and marine applications [6,7,8,9,10,11].
Due to the presence of vacuoles in polymers as adhesives, the adhesion strength and the adhesion effect at the interface with solids directly affect the stability of the overall structure and the safety of the system [12,13,14,15]. The traditional test method for vacuoles is the knocking method: the bonding surface is struck with a small hammer and the quality of the bond is judged by the sound made. If there is no local defect, the sound from the knocking is clear, and vice versa, the sound being low indicates that there are internal defects and bubbles [5,16]. There is a visual inspection method: inspectors use their eyes to observe whether the bonded parts of the joints have cracks or a lack of glue phenomenon [17]. Mechanical peeling, mechanical stretching, and other detection methods are destructive testing methods [13,18,19,20]. For example, Kadioglu et al. [5] investigated the behavior of a flexible adhesive under impact loading using the single lap joint configuration. This adhesive showed a high strain to failure with good strength. These features of the adhesive under impact loading improve the structural crashworthiness. The results showed that the lap joint strength increases considerably under impact loading compared with those under quasi-static loading, and that there is a relationship between the joint performance and the loading speeds. Szabelski et al. [12] conducted experimental tests at an ambient temperature and elevated temperature during, in which adhesive butt joints were loaded with a tensile force until failure. A long short-term memory forecast was used to determine the point corresponding to the mix ratio of the adhesive components at which the heat holding of the adhesive joint no longer has a positive and significant importance to the final tensile strength of the joint. Teng et al. [21] designed a new thermo-chemical luminescence (TCL) probe that not only provides a viable method for fabricating high sensitivity and high-resolution temperature sensors, but also provides a detailed understanding of the nature of TCL technology. Wang et al. [22] experimentally quantified the effect of interfacial roughness on thermal contact resistance (TCR) at the solid–solid interface at the nanoscale, provided a quantitative assessment of the TCR at the solid–solid interface at the nanoscale, and contributed to an in-depth understanding of the heat transport mechanism for advanced thermal management of nanodevices. However, most of the current testing techniques belonging to destructive testing have the following main problems: the destructive testing will destroy the specimen, and the specimen is also directly scrapped after the testing is completed; the tested specimens are limited, and the testing results often lack representativeness; the quality evaluation based on destructive testing can only be macroscopic, and it is difficult to find some potential quality hazards; and an all-good project should withstand microscopic evaluation; there are special cases, difficult operability, and other problems.
Determining the quality of adhesive coatings by calculating the interfacial thermal conductance is a non-destructive testing technique. When there are defects such as vacuoles in the adhesive between two objects, due to differences in density, specific heat, and interfacial thermal conductance, the overall structure and external thermal conductivity may be inconsistent, resulting in an uneven temperature on the bonding surface. The adhesive quality of the structure can be judged from the above situation. Non-destructive testing techniques that study bonding strength through interfacial thermal conductance can effectively monitor product quality and correctly evaluate the structural stability and system safety. This is of great significance for improving the safety and economy of products and extending their service life.
2. Model and Simulation Method
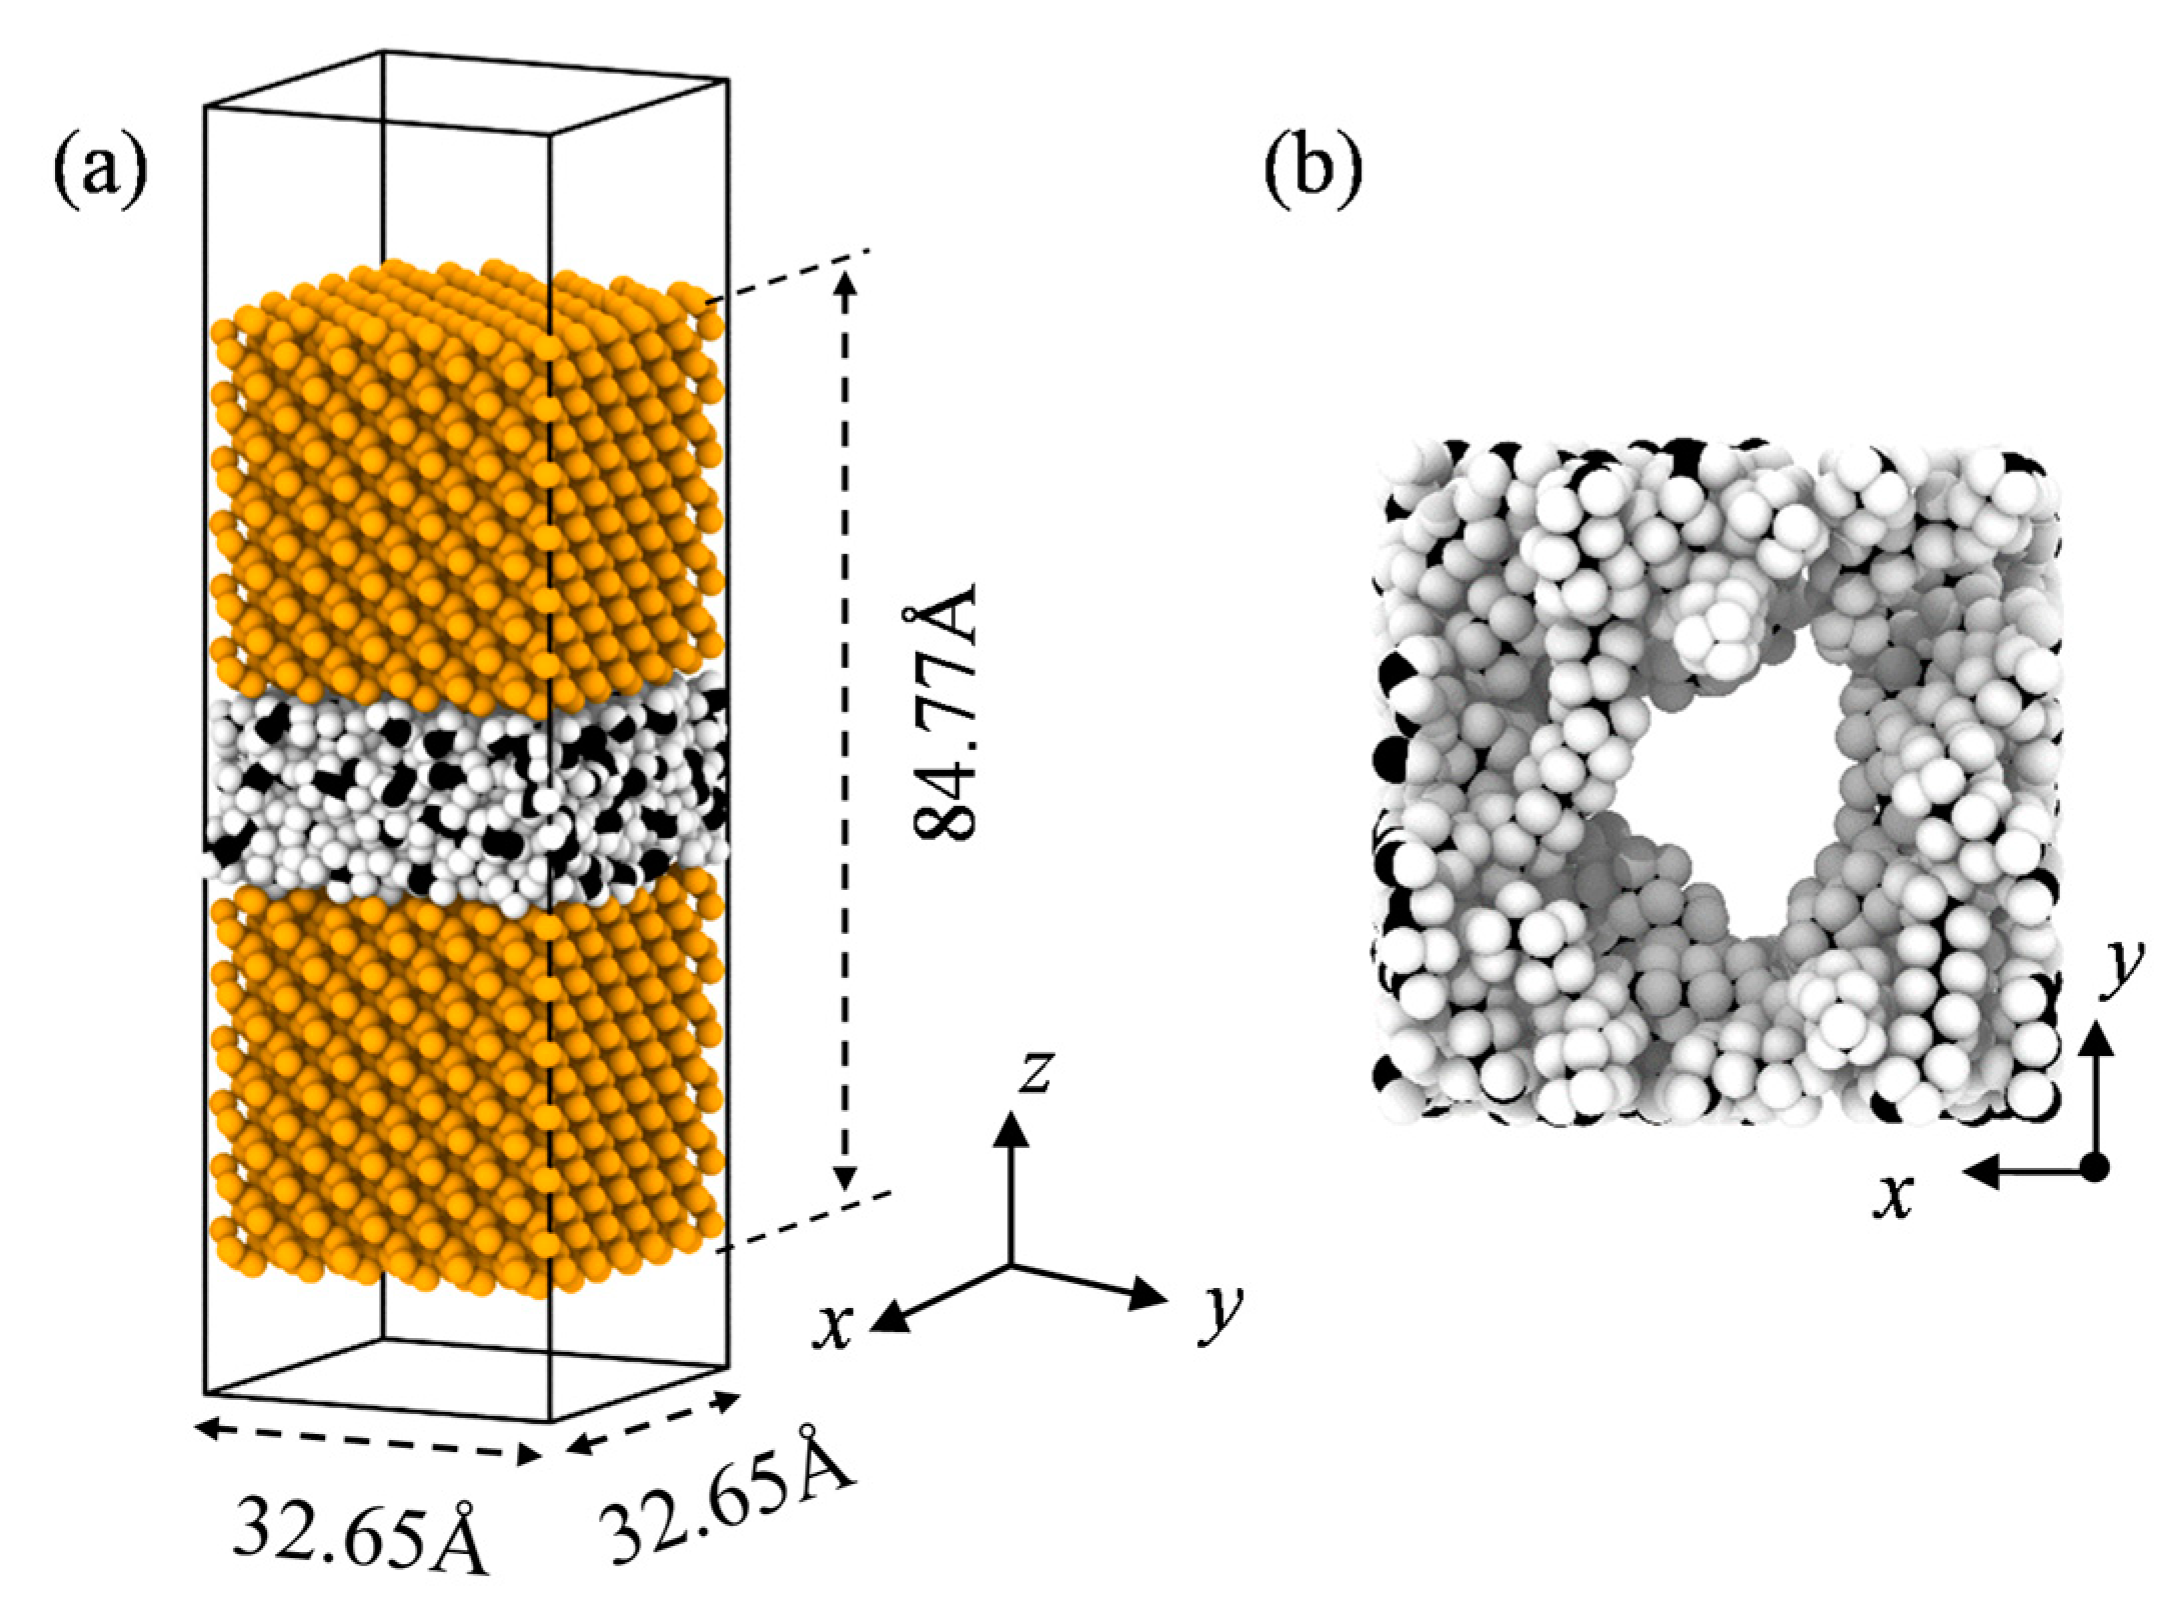
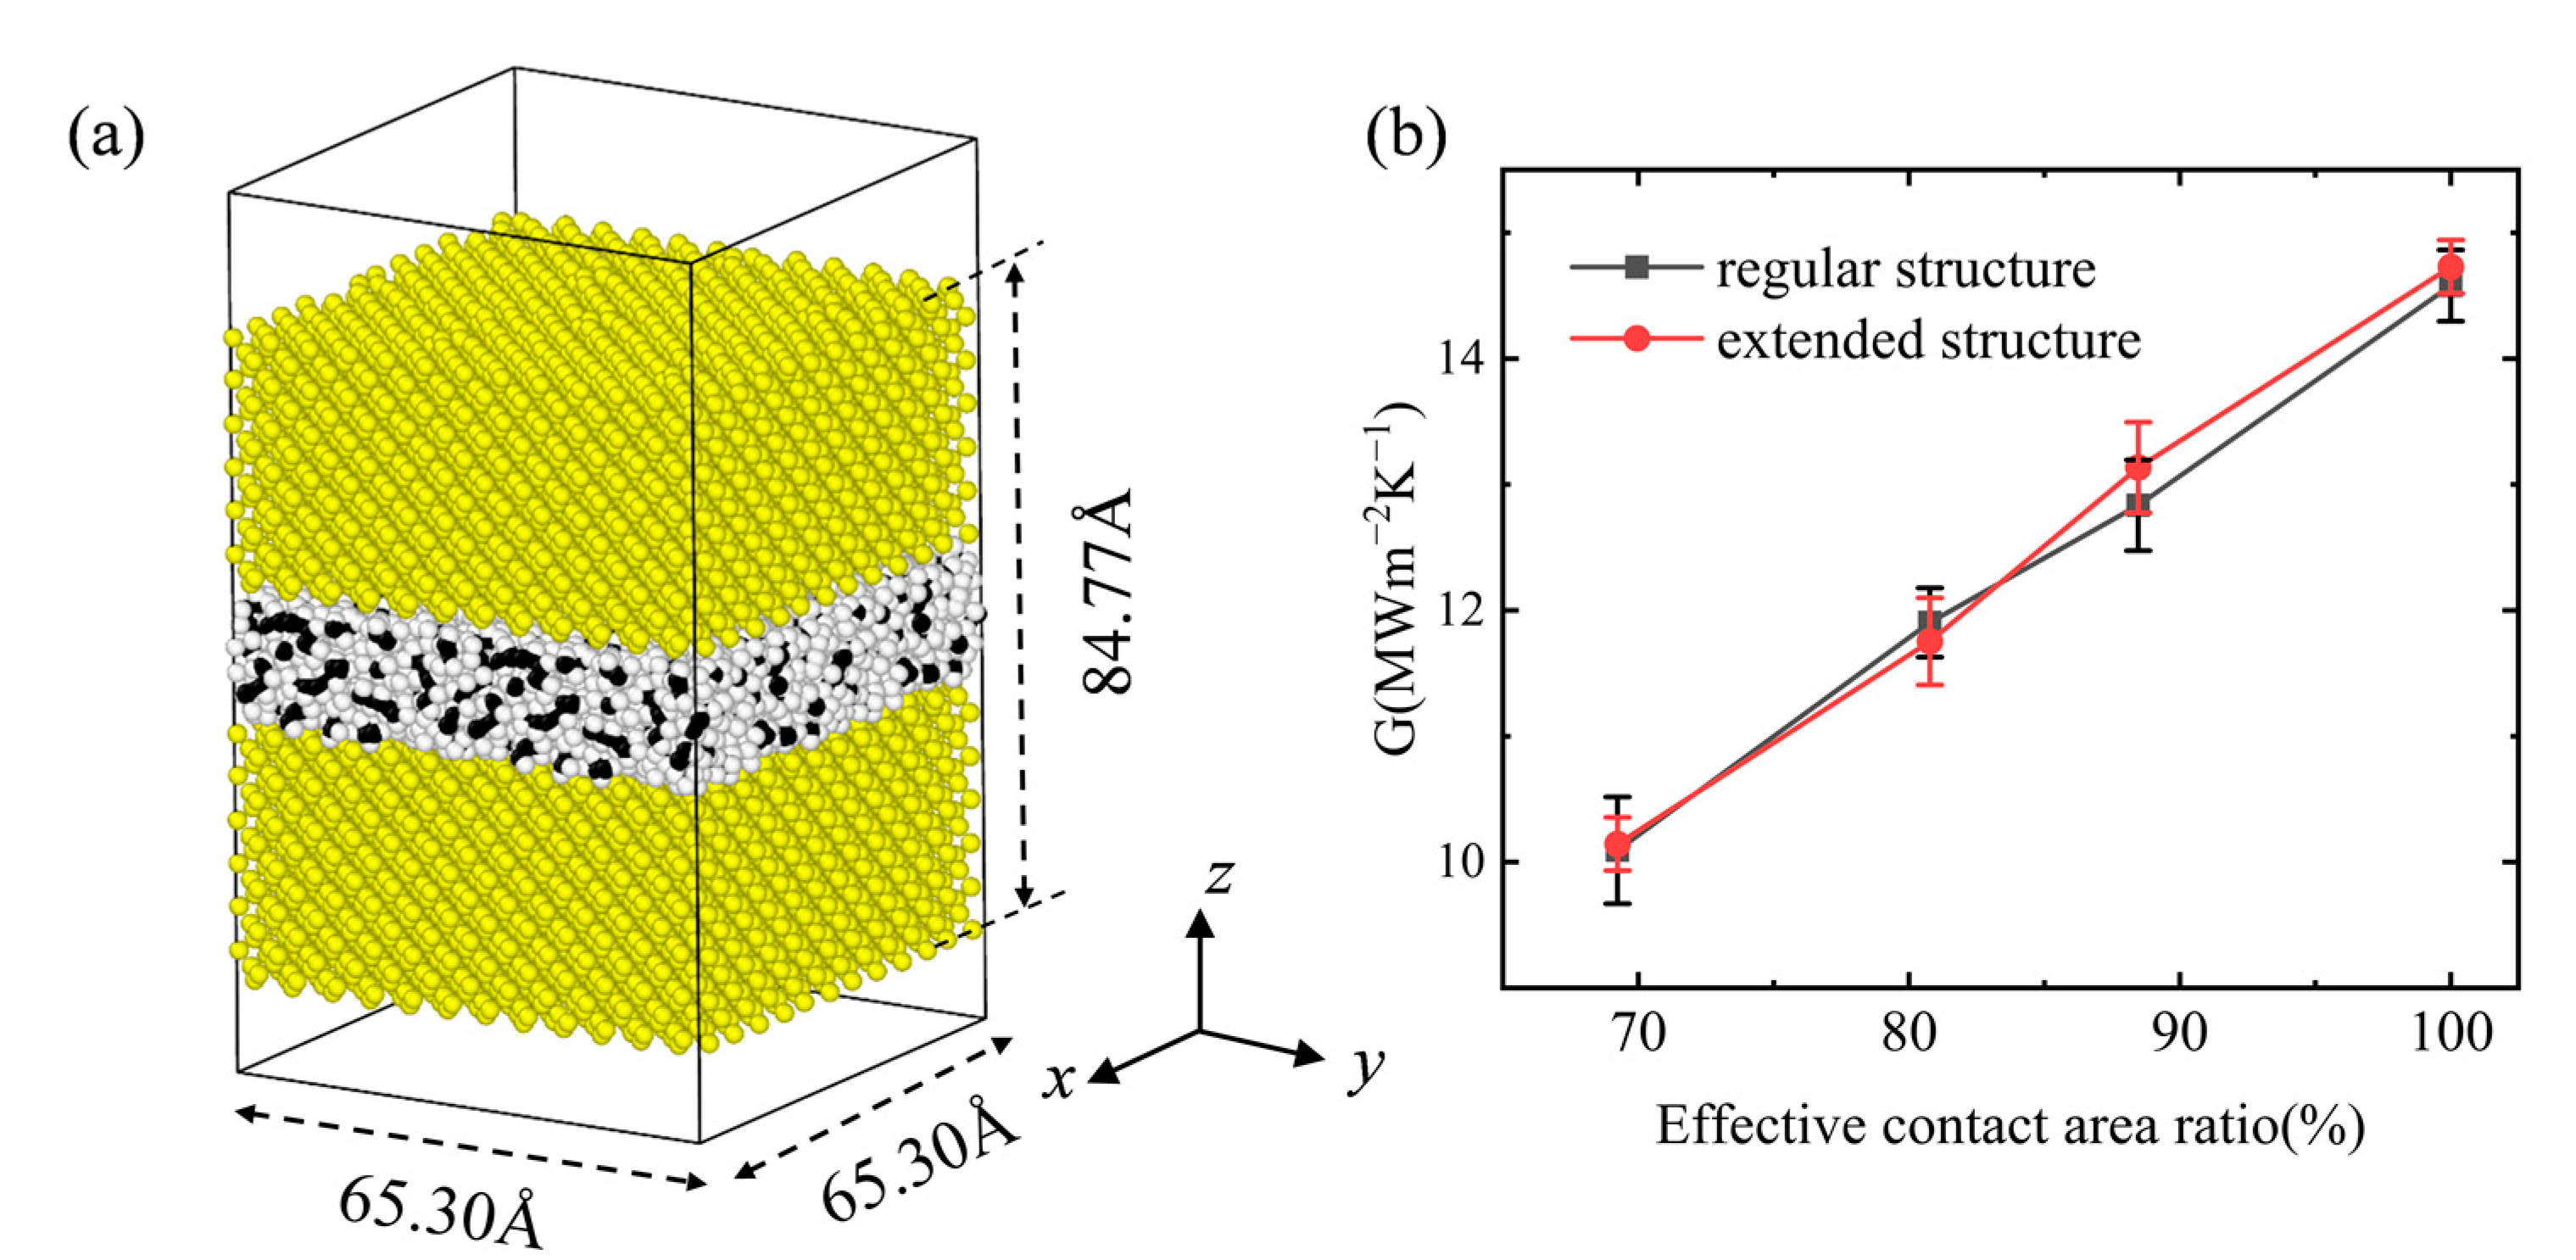
Figure 1a illustrates the simulation model that comprises two face-centered cubic (FCC) silicon blocks separated by a polymer block. The simulation imposed periodic boundary conditions along the x and y directions, while fixing the boundary Si atoms in the z direction to prevent any random motion of the system [23]. The dimensions of the silicon blocks were 3.265 nm × 3.265 nm × 3.265 nm (L × W × H), and the polymer block measured 3.265 nm × 3.265 nm × 1.947 nm. The silicon block exhibits an orthorhombic structure and belongs to the diamond family, with FCC lattices shifted by 1/4 the diagonal length set to each other, along the diagonal direction. Each silicon atom forms four covalent bonds with other silicon atoms, forming an eight-electron stable structure. The top and bottom orthorhombic silicon structures comprised 1728 atoms each. The polymer block was composed of polyethylene (PE), which consisted of 26 long chains of a linear structure with no interference between the individual chains because there were no chemical bonds in any two long chains. Each chain contained 32 CH2 monomers, and the carbon atoms at both ends were connected with hydrogen groups. PE is one of the most widely used polymers with many excellent properties. The reliability of the molecular dynamic simulation of interfacial heat conduction between polyethylene and silicon has also been confirmed many times. Therefore, our selection of PE as an adhesive component not only ensured the correct calculations during the simulation process, but also represented a wider range of polymers. To investigate the possible role of finite size effects, we also established another structure with a 100% increase in both the x and y directions of silicon and PE, and conducted interfacial thermal conductance calculations in the same simulation environment as the above model.
All molecular dynamics (MD) simulations were conducted using the Large-scale Atomic/Molecular Massively Parallel Simulator (LAMMPS) package [24]. The interatomic interactions between C–C, C–H, and Si–Si were described by the Lennard–Jones (LJ) potential functions, with the corresponding parameters presented in Table 1 [25,26]. In our model system, the Si and polymer atoms interacted solely through non-bonding interactions. We focused on the interfacial heat transfer in this paper. In this case, the interfacial conductance was mainly determined by the speed of the sound of the acoustic phonons and the phonon transmission coefficients. We calculated the velocities of longitudinal-acoustic and transverse-acoustic phonons in silicon from the dispersion curves using our model and compared the results with the predictions of the widely used Stillinger–Weber (SW) potential. In particular, the group velocity of the long wavelength longitudinal-acoustic phonons was 8123 m/s in our model compared to 8000 m/s for the SW model. Likewise, long wavelength transverse-acoustic phonons had a group velocity of 5236 m/s in this model compared to 5000 m/s for the SW model. These results showed this model to be in excellent agreement with the SW model. The standard 12/6 Lennard–Jones potential was used for the lj/cut/coul style calculations [27]. The equation used in this study is as follows:
where E is the potential energy between two particles, r is the distance between the particles, ϵ is the depth of the potential energy well, and σ is the distance at which the potential energy between the particles is zero. The specific values of ϵ and σ for the Lennard–Jones potential used in this study are presented in Table 1.
The simulation model was integrated using the Verlet algorithm with a time step of 0.5 fs. The structural optimization of the model was carried out using the conjugate gradient method followed by energy minimization. The system was then subjected to pressure and temperature relaxation for 1 ns (with a time coupling constant of 1 ps) at a microcanonical ensemble of 300 K. The interfacial thermal conductance was determined using the microcanonical ensemble [28].
In this study, we aimed to investigate the interfacial thermal transport between the silicon block and the polymer using a thermal relaxation approach [29]. The approach involved rapidly increasing the temperature of the silicon block by an external perturbation and then allowing it to cool down freely to the ambient temperature while monitoring the temperature of the polymer. The interfacial thermal conductance was then calculated by fitting the temperature of the polymer as a function of time. From Figure 2a, it can be seen that in the initial stage of the simulation, the temperature of the polymer was maintained at 300 K. The rescale method utilizing the velocity rescaling method was employed to induce the external perturbation, whereby the atomic velocities of the upper silicon block were revised to raise its temperature to 500 K [30]. The lower silicon block was not involved in the calculation, and the temperature of the upper silicon block gradually decreased from 500 K. The temperature of the polymer increased until both materials reached essentially the same temperature. The temperature difference between the two is plotted in Figure 2b and is fitted with an exponential decay function.
In Equation (2), the interfacial thermal conductance between the silicon block and the polymer was calculated based on the time decay constant τ obtained from the fitting of the temperature difference evolution ΔT(t) over time. It is important to note that the initial conditions of the simulation could introduce a statistical error in the fitting process, particularly due to the rise and fall of the temperature. To mitigate this, we performed five independent simulations with varied initial conditions, and numerically averaged the resulting temperatures before fitting.
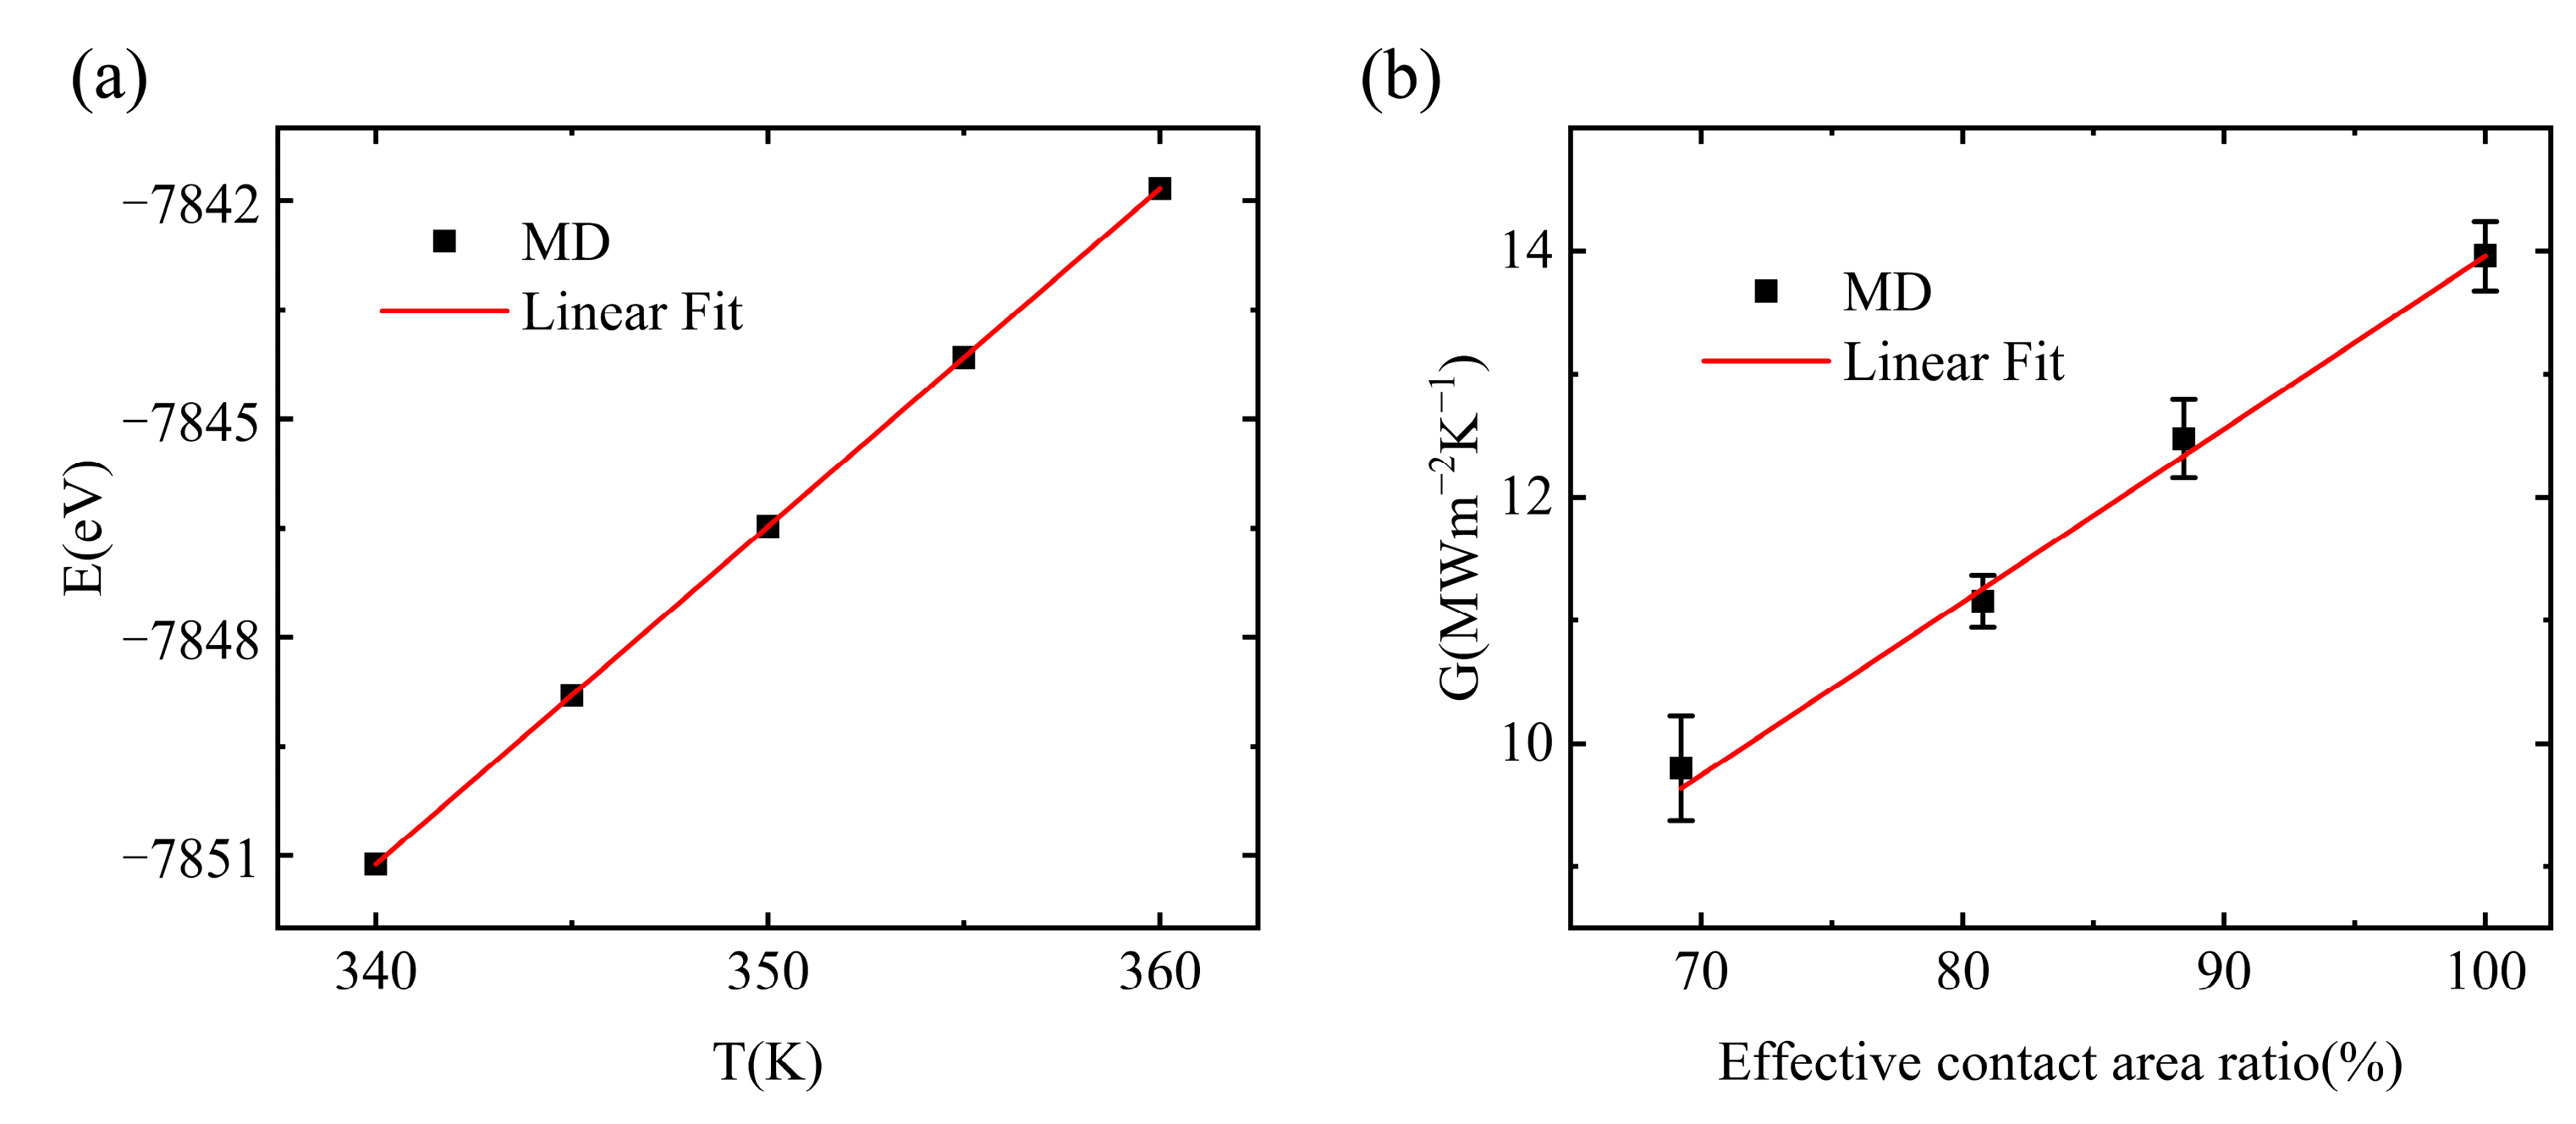
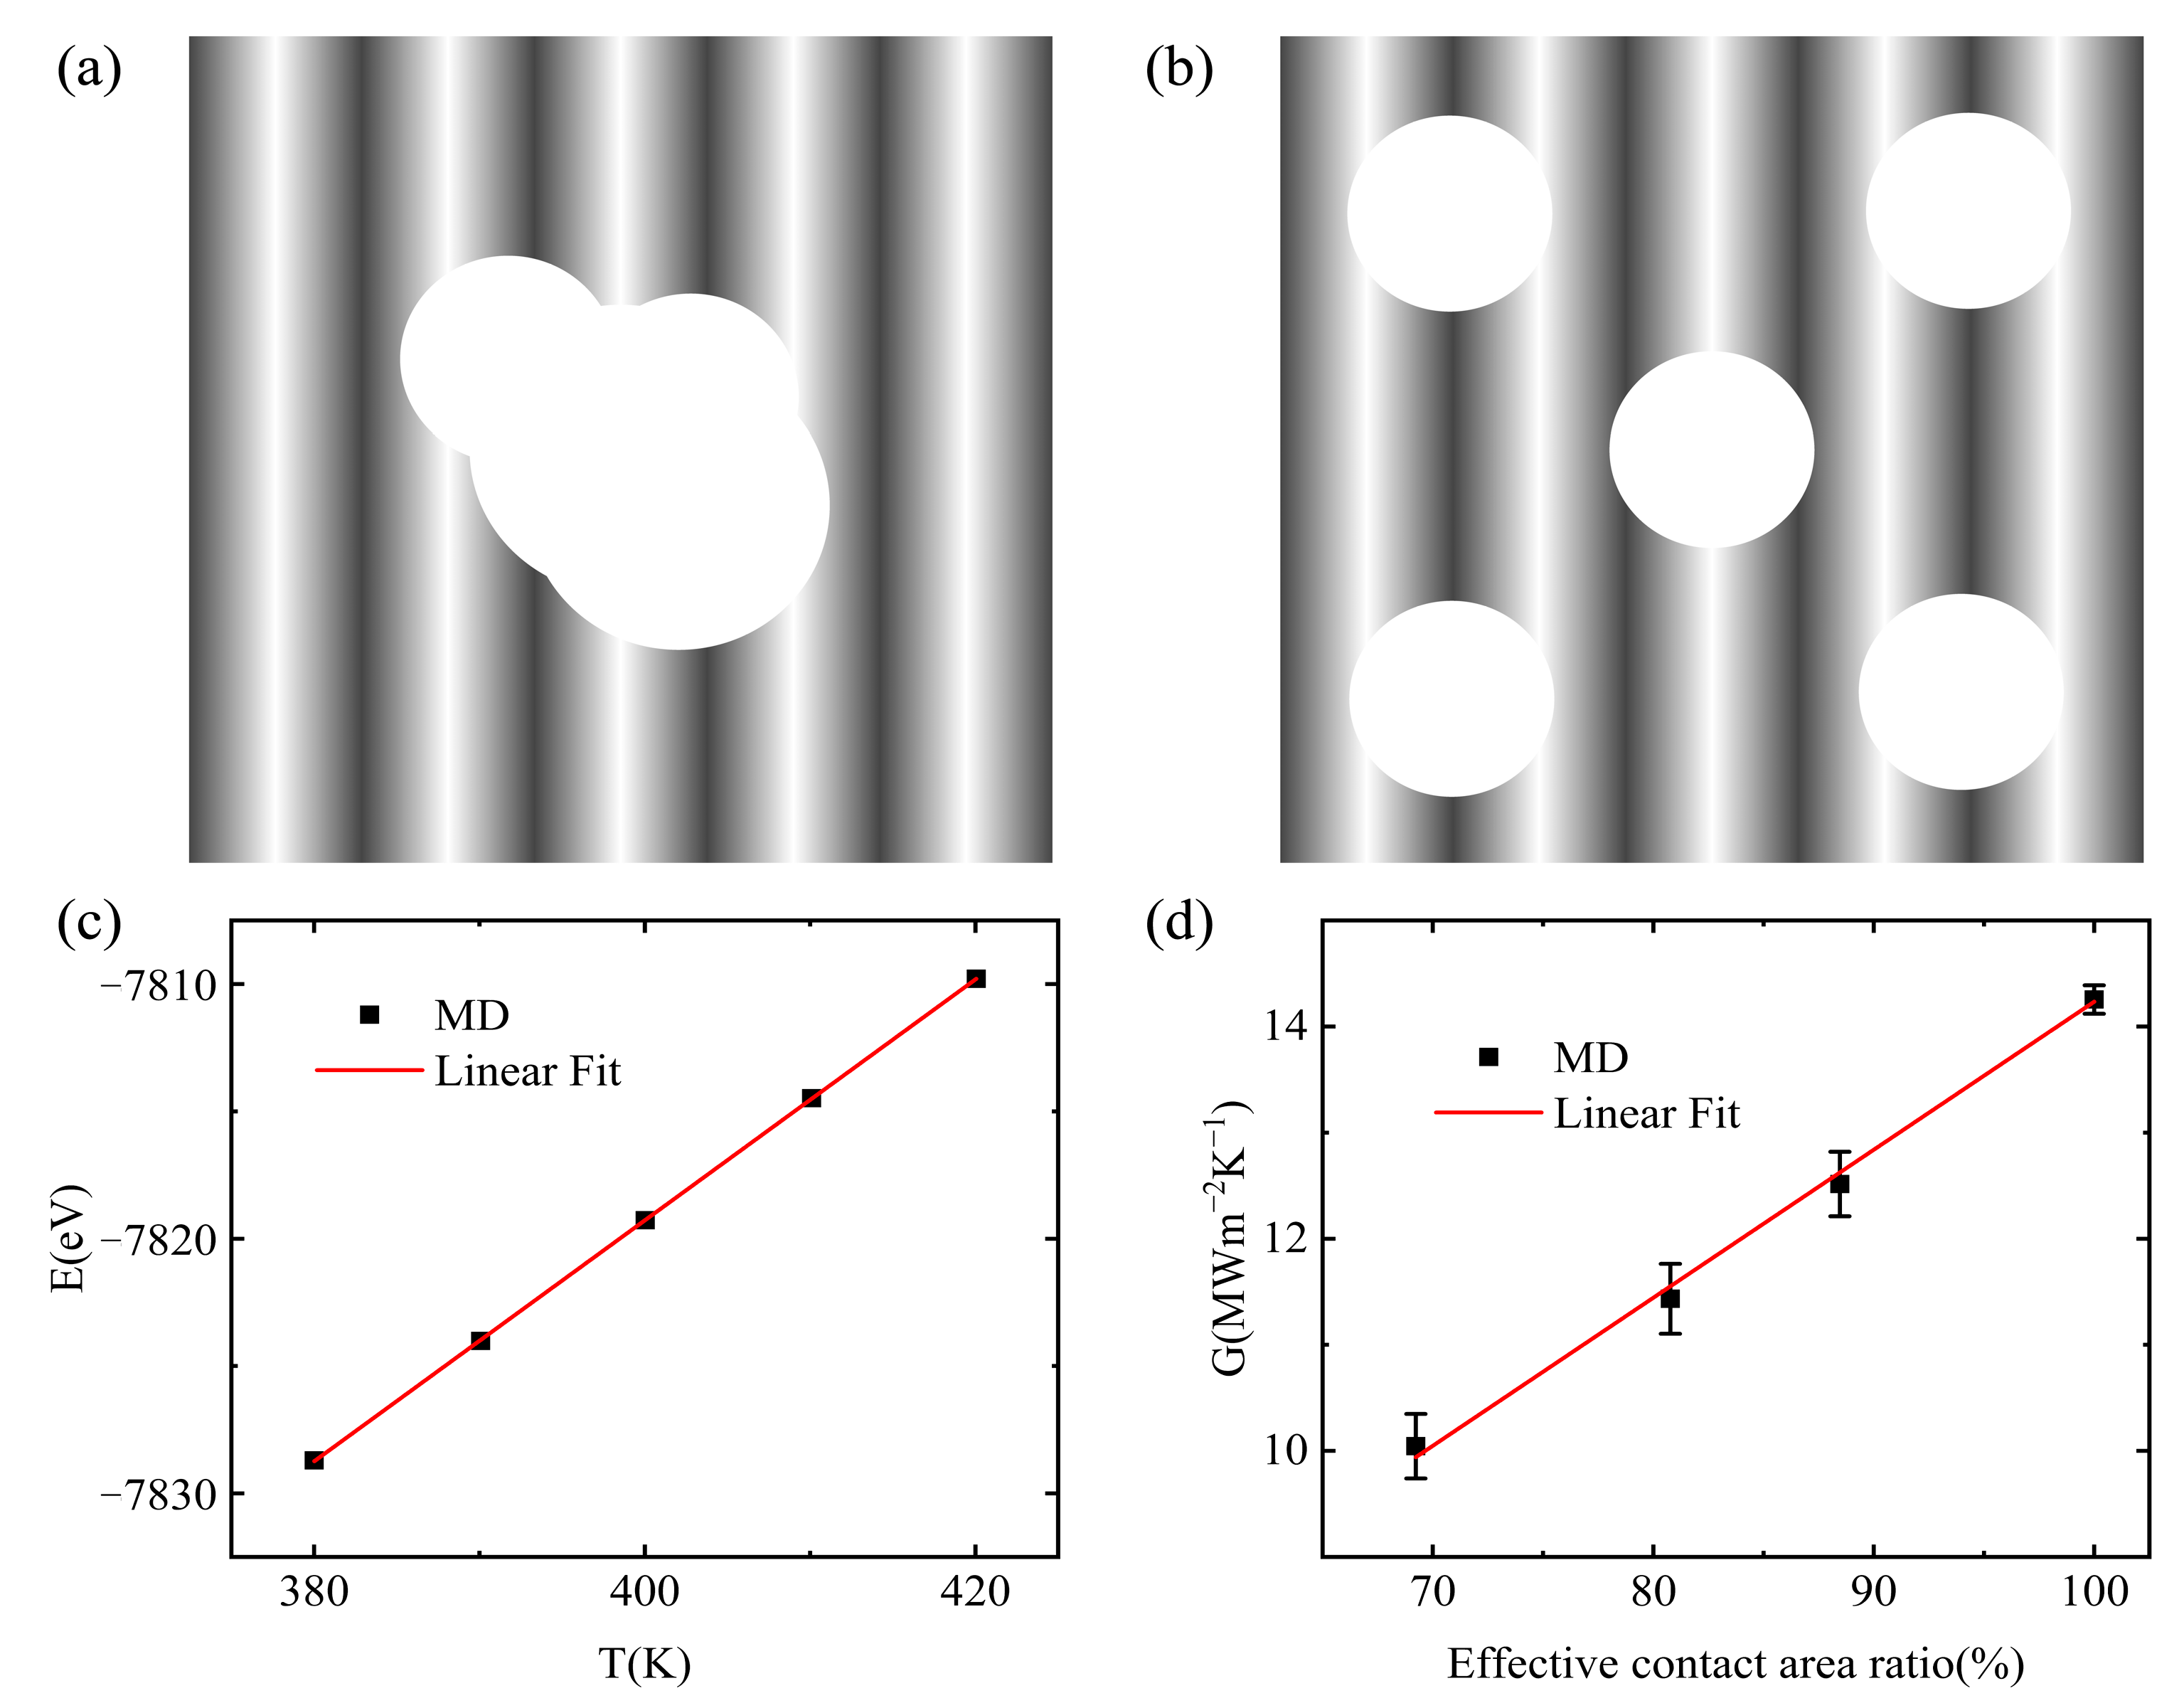
The time decay constant τ obtained from the fit was used along with the cross-sectional area A through which the heat flow passes and the heat capacity C of the silicon block to calculate the interfacial thermal conductance. The heat capacity of silicon was calculated using molecular dynamics methods that rely on the relationship between the system’s energy and temperature [31,32]. To determine the heat capacity at a given temperature, such as 400 K, the total energy E of the system was calculated at temperatures of 380 K, 390 K, 400 K, 410 K, and 420 K under the canonical system synthesis (NVT), and then a linear fit of the energy E versus temperature T was performed (see Figure 2c) [29,33]. To reduce statistical errors, different initial conditions were used for each temperature case, and several independent simulations were performed (five in this study), with a time average of tens of picoseconds required for each simulation. The slope of the linear fit provided the heat capacity of silicon at 400 K.
3. Results and Discussion
3.1. Interfacial Thermal Conductance of a Single Vacuole Model at 500 K
The interfacial thermal conductance between the upper silica block and the polymer at a temperature of 500 K was investigated using the thermal relaxation method. To study the interfacial thermal conductance at different void rates, a model with varying voids in the polymer, as shown in Figure 1d, was established while keeping other parameters the same as the previous model. The interfacial thermal conductance was then calculated using the aforementioned method. Generally speaking, the density of the polymer will change with the introduction of the voids, but because our work is to study the relationship between the effective contact area ratio and the interfacial thermal conductance, after the introduction of the voids, we chose to delete part of the polymer long chain to maintain the consistency before and after the density, so that the thermal conductivity calculation is not affected by the density. To maintain a constant density of about 0.9 g/cm3, which is typical for amorphous PE during the polymer simulation [25], the edges of the voids were fixed using the region and fix wall/region commands. The number of linear polymer chains in the model of Figure 1 was reduced from 26 to 23, 21, and 18, resulting in a reduction of the polymer volume to 88.46%, 80.77%, and 69.23%, respectively, while maintaining a constant density. The effective contact area between the orthorhombic silicon block and the polymer was also reduced proportionally; therefore, the only variable for the calculation of the interfacial thermal conductance of the before-and-after model is the effective contact area between the orthorhombic silicon block and the polymer, and the interfacial thermal conductance was calculated as a function of the effective contact area between the two. The results are shown in Figure 2d. To ensure accuracy, several simulations were performed, as the temperature decay curve needs to be fitted and the rise and fall of temperature can affect the accuracy of the time decay constant τ. The figure shows that the interfacial thermal conductance decreases as the effective contact area between the silicon block and the polymer decreases, indicating that the ratio of the effective contact area is directly proportional to the interfacial thermal conductance and inversely proportional to the void rate. Since the void rate in the polymer binder can affect the adhesion strength, the interfacial thermal conductance calculation can be used to reflect the magnitude of the adhesion strength. Furthermore, we performed interfacial thermal conductance calculations in the same simulation environment and steps for another model that was established with increases in both the x and y directions to investigate the possible role of finite size effects, as shown in Figure 3. The results show that the interfacial thermal conductance of the two models are essentially the same, thus demonstrating negligible finite size effects.
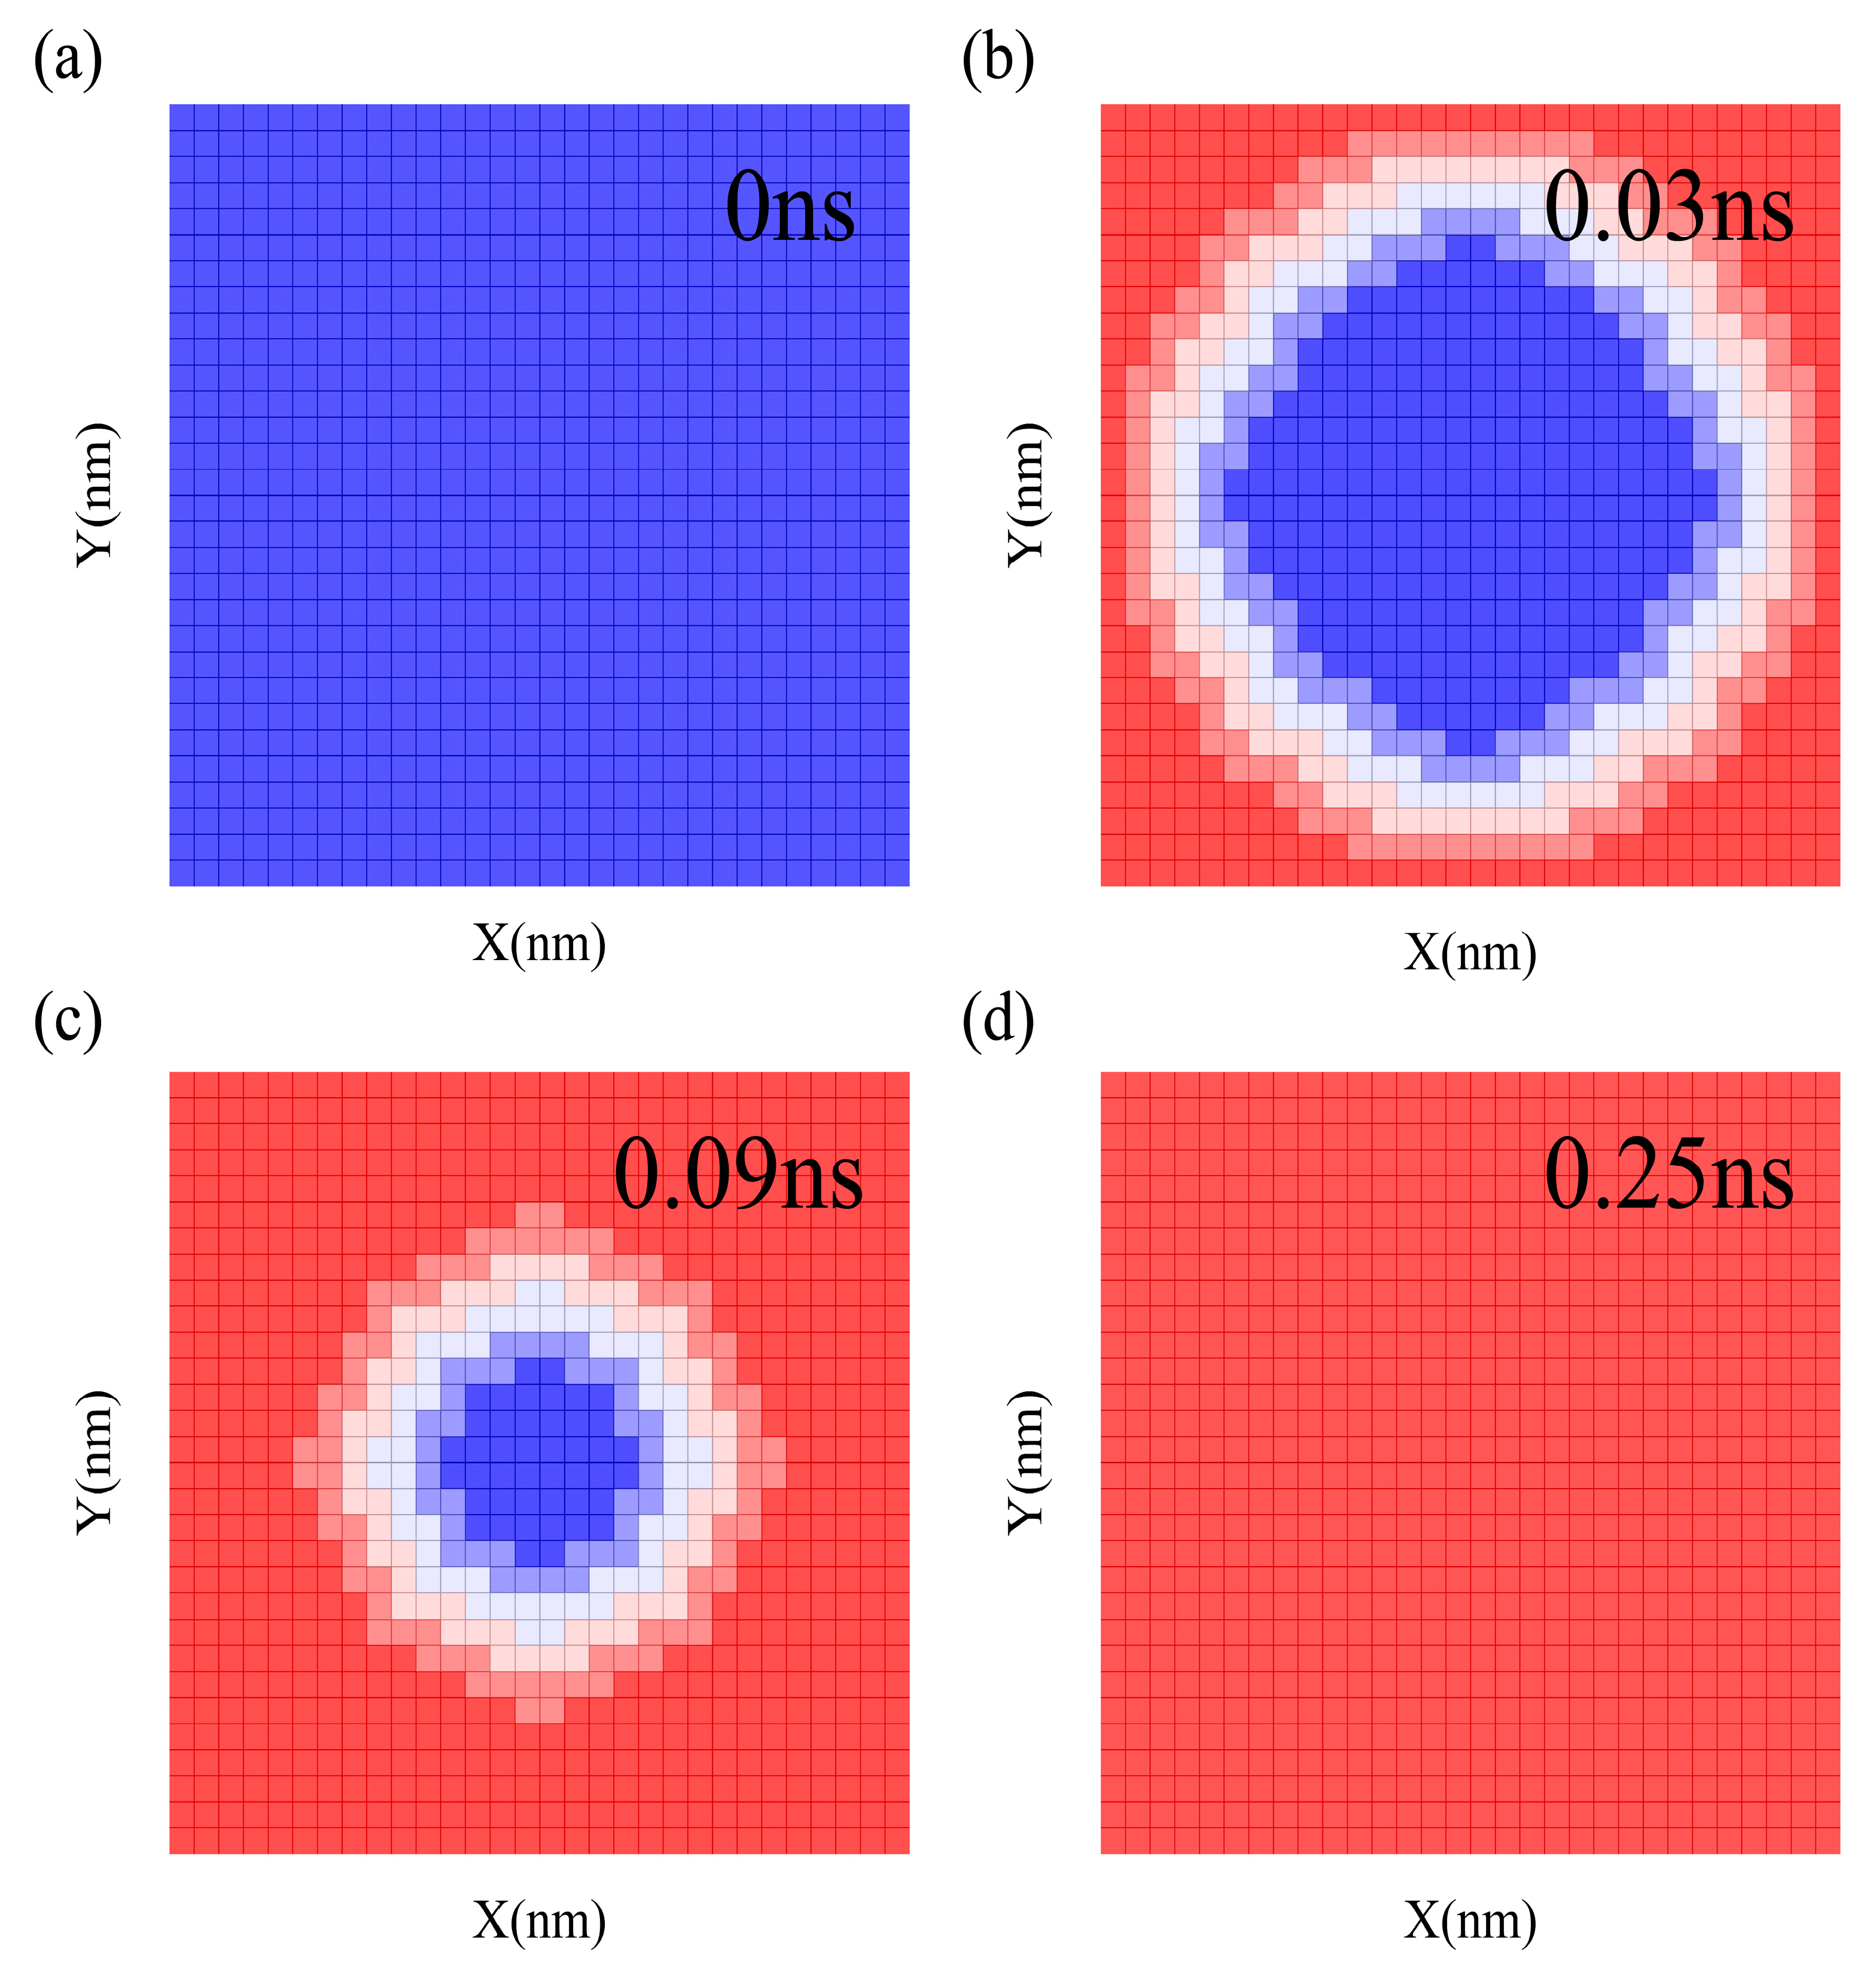
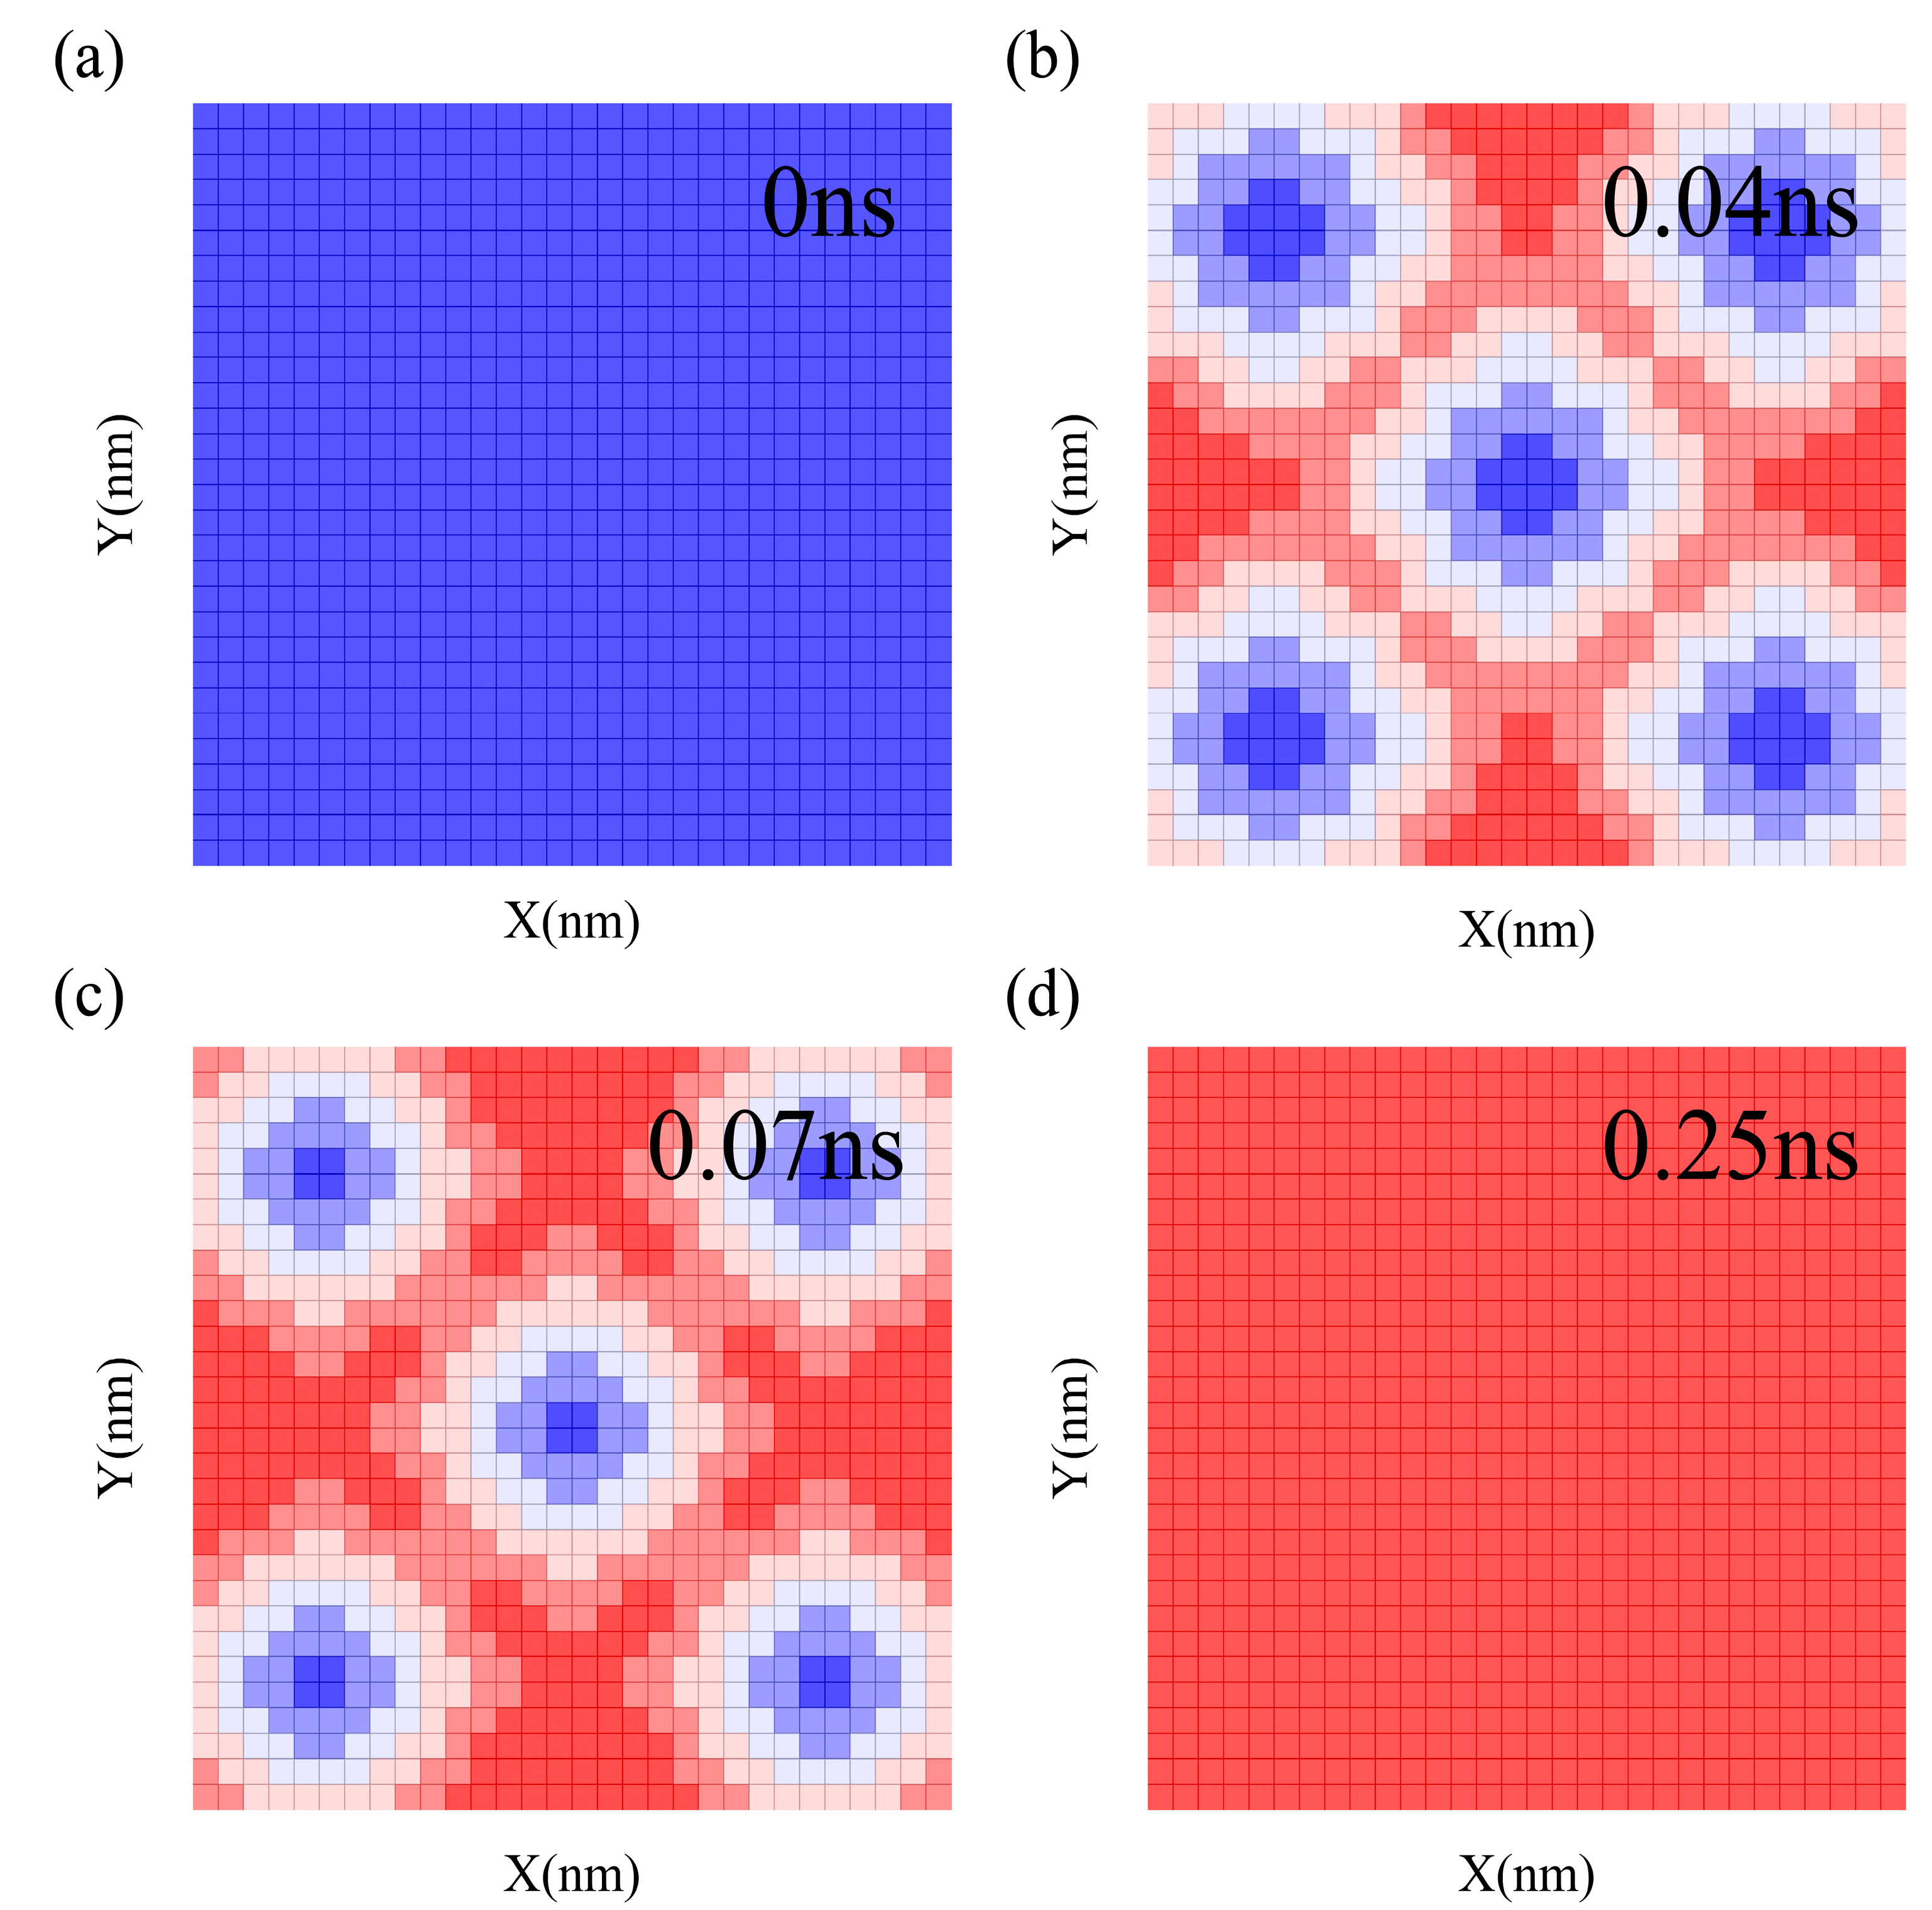
To visualize the impact of the vacuoles on heat transfer during the interfacial thermal conductance calculations using the thermal relaxation method, we selected the layer of silicon atoms closest to the polymer in the lower silicon block to participate in the calculations. This is because the small number of atoms does not compromise the accuracy of the interfacial thermal conductance results for the upper silicon layer with the polymer. We divided the z-directional cross-section of this layer of silicon atoms into 900 equally sized blocks and outputted the temperature averages for four small time periods selected from the beginning to the end of heat transfer to produce the temperature evolution distribution over time, as shown in Figure 4. Figure 4a shows the initial temperature of the layer of silicon at around 300 K, while Figure 4b shows the average temperature distribution of each small piece from 0.28 ns to 0.32 ns during the process. Figure 4c shows the average temperature distribution of each small piece from 0.88 ns to 0.92 ns during the process, and Figure 4d shows the final temperature of around 350 K. The figure illustrates that, due to the presence of a vacuole in the middle position, the silicon in close proximity to the polymer is warmed up first, followed by the heat transfer to the middle region, and the low-temperature range in the middle region decreases over time. Therefore, the interfacial thermal conductance calculation can reflect the proportion of vacuoles present and the interfacial adhesion strength. Therefore, the detection standard can be defined, for example, the interfacial thermal conductance and adhesion effect of a product can be calculated according to the established standard value. If the calculated interfacial thermal conductance is lower than the substandard, the product is deemed unqualified. Conversely, if it is greater than or equal to this value, the product is qualified.
3.2. Interfacial Thermal Conductance of a Single Vacuole Model at 400 K
To minimize the effects of temperature on the interfacial thermal conductance calculations, and the fact that most of the daily products are used at temperatures below 500 K, the simulations were conducted for a 400 K scenario. The model parameters used in the previous section were followed, and the long-chain polymers in the model were reduced to 23, 21, and 18 from the original 26, while maintaining a constant polymer density by adjusting the vacuole edges. This resulted in a reduction of the effective contact area between the polymer and silicon to 88.46%, 80.77%, and 69.23%, respectively. Since the thermal relaxation calculation performed for the upper silicon layer was initially at 400 K and ended at a temperature of about 350 K, the silicon heat capacity calculation was repeated for temperatures ranging from 340 K to 360 K, and a linear fit of the energy versus temperature was performed to determine the heat capacity of silicon at 350 K (as shown in Figure 5a). The interfacial thermal conductance was found to decrease linearly at 400 K as the effective contact area decreased. The results of the interfacial thermal conductance calculation by the thermal relaxation method are shown in Figure 5b, where the interfacial thermal conductance decreases approximately linearly at 400 K when the effective contact area between the polymer and the silicon decreases. The vacuolation rate of the polymer did not affect the interfacial thermal conductance at different temperatures and thus did not have an impact on the interfacial adhesion strength, as depicted in Figure 5.
3.3. Interfacial Thermal Conductance of a Multiple Vacuole Model at 500 K
In practical applications, the presence of multiple vacuoles may also have a significant impact on the interfacial adhesion strength. Therefore, we constructed a single vacuole model, as shown in Figure 6a, to calculate the interfacial thermal conductance at 500 K and 400 K. The results demonstrate that the interfacial adhesion strength can be reflected by the interfacial thermal conductance. We also constructed a model with multiple vacuoles present in the polymer, with the position of each vacuole being fixed, as shown in Figure 6b, for the thermal conductivity calculation. Applying the temperature to the polymer during the simulation process will cause movement of the polymer, resulting in changes in the position and structure of the voids. In order to eliminate the influence of the change of void position and structure on the calculation results of interfacial thermal conductivity, we use the multi-pore model with a fixed void position. All parameters of this model remain the same as the previous model, except that it includes five small vacuoles. The interfacial thermal conductance was calculated for different effective contact areas using the previous thermal relaxation method. The heat capacity of silicon was recalculated due to the presence of multiple vacuoles, and it was calculated using the energy to temperature ratio method, as shown in Figure 6c. The interfacial thermal conductance in the case of multiple vacuoles was further calculated using the thermal relaxation method. As seen in Figure 6d, the interfacial thermal conductance in the presence of multiple vacuoles is still proportional to the effective contact area between the polymer and the silicon. Therefore, the method of calculating the interfacial thermal conductance to reflect the polymer vacuole rate and interfacial adhesion strength is feasible.
To visualize the impact of multiple vacuoles on the heat transfer, we selected the layer of silicon atoms closest to the polymer in the lower silicon block to participate in the heat transfer calculation. We divided the z-direction cross-section of the layer into 30 blocks in the x direction and 30 blocks in the y direction into a total of 900 blocks of equal size, and recorded the average temperature for four small time periods to create the temperature evolution distribution diagram shown in Figure 7. Figure 7a displays the temperature of the silicon layer before the start of heat transfer at approximately 300 K, while Figure 7b shows the average temperature distribution of each small piece from 0.38 ns to 0.42 ns during the process. Figure 7c shows the average temperature distribution of each small piece from 0.68 ns to 0.72 ns during the process and Figure 7d shows the temperature at the end of heat transfer, maintained at approximately 350 K. The figure shows that, as the temperature transfer in a region with multiple vacuoles is lower than in the region of the polymer near the silicon, over time, the heat transfer through other silicon atoms in the planar direction helps to increase the temperature, rather than through the z-direction. Although the number and location distribution of vacuoles are different between a single vacuole and multiple vacuoles, their impact on the interfacial heat transfer is significant. Therefore, whether there is a single vacuole or multiple vacuoles present, the most important factor affecting the interfacial thermal conductance is the effective contact area, and we can directly infer the size and location of vacuoles by measuring the interfacial thermal conductance, which also reflects the interfacial adhesion strength.
4. Conclusions
In this paper, the molecular dynamics method is used to study the measurement of interfacial adhesion strength by calculating the interfacial thermal conductance. We established a model of two silicon blocks separated by a polymer block, and used a thermal dissipation method to calculate the interfacial thermal conductance relationship between the silicon and polymer under different effective contact areas. The effective contact area between the silicon and polymer is changed by deleting the long polymer chain. Under different effective contact areas, the interfacial thermal conductance between silicon and polymer is linearly proportional to the effective contact area. In addition, we carried out calculations under multiple temperatures to eliminate the temperature interference. The porous foam polymer model was further established, and the results showed that the interfacial adhesion effect was linear with the interfacial thermal conductance, regardless of the size and location of the vacuoles. Subsequently, we output the temperature of the adhesive surface for both a single vacuole model and multiple vacuole model. The specific position and size of the vacuoles on the adhesive surface can be determined by measuring the evolution of the surface temperature, and the adhesive coating quality can be judged. It is of great significance for improving the safety and economy of products and extending the service life of products to study the non-destructive testing technology of bond strength by calculating the interfacial thermal conductance, effectively monitoring the product quality, and correctly evaluating the stability of the structure and the safety of the system.
Author Contributions
Conceptualization, J.G. and N.W.; methodology, J.G.; software, N.M.; validation, J.C.; formal analysis, N.M.; investigation, J.G.; resources, N.M.; data curation, J.C.; writing—original draft preparation, J.G.; writing—review and editing, J.G. and N.W.; visualization, J.C.; supervision, N.W. All authors have read and agreed to the published version of the manuscript.
Funding
This work was supported by the National Natural Science Foundation of China (Grant No. 11502217), the China Postdoctoral Science Foundation (No. 2015M570854 and 2016T90949). The Programs of Innovation and Entrepreneurship of Jiangsu Province.
Data Availability Statement
The data presented in this study are available on request from the corresponding author.
Conflicts of Interest
The authors declare no conflict of interest.
References
- Zheng, R.; Lin, J.; Wang, P.-C.; Zhu, C.; Wu, Y. Effect of adhesive characteristics on static strength of adhesive-bonded aluminum alloys. Int. J. Adhes. Adhes. 2015, 57, 85–94. [Google Scholar] [CrossRef]
- Heinzmann, C.; Weder, C.; de Espinosa, L.M. Supramolecular polymer adhesives: Advanced materials inspired by nature. Chem. Soc. Rev. 2016, 45, 342–358. [Google Scholar] [CrossRef] [PubMed] [Green Version]
- Sun, S.; Li, M.; Liu, A. A review on mechanical properties of pressure sensitive adhesives. Int. J. Adhes. Adhes. 2013, 41, 98–106. [Google Scholar] [CrossRef]
- Pethrick, R.A. Design and ageing of adhesives for structural adhesive bonding—A review. J. Mater. Des. Appl. 2014, 229, 349–379. [Google Scholar] [CrossRef]
- Kadioglu, F.; Adams, R.D. Flexible adhesives for automotive application under impact loading. Int. J. Adhes. Adhes. 2015, 56, 73–78. [Google Scholar] [CrossRef]
- Ghobril, C.; Grinstaff, M.W. The chemistry and engineering of polymeric hydrogel adhesives for wound closure: A tutorial. Chem. Soc. Rev. 2015, 44, 1820–1835. [Google Scholar] [CrossRef]
- Saboori, A.; Aversa, A.; Marchese, G.; Biamino, S.; Lombardi, M.; Fino, P. Application of Directed Energy Deposition-Based Additive Manufacturing in Repair. Appl. Sci. 2019, 9, 3316. [Google Scholar] [CrossRef] [Green Version]
- Yang, M.; Rosentrater, K.A. Life Cycle Assessment of Urea-Formaldehyde Adhesive and Phenol-Formaldehyde Adhesives. Environ. Processes 2020, 7, 553–561. [Google Scholar] [CrossRef]
- Shi, C.Y.; Zhang, Q.; Tian, H.; Qu, D.H. Supramolecular adhesive materials from small-molecule self-assembly. SmartMat 2020, 1, e1012. [Google Scholar] [CrossRef]
- Bao, Z.; Gao, M.; Sun, Y.; Nian, R.; Xian, M. The recent progress of tissue adhesives in design strategies, adhesive mechanism and applications. Mater. Sci. Eng. C Mater. Biol. Appl. 2020, 111, 110796. [Google Scholar] [CrossRef]
- Martinsen, K.; Hu, S.J.; Carlson, B.E. Joining of dissimilar materials. CIRP Ann. Manuf. Technol. 2015, 64, 679–699. [Google Scholar] [CrossRef] [Green Version]
- Szabelski, J.; Karpinski, R.; Machrowska, A. Application of an Artificial Neural Network in the Modelling of Heat Curing Effects on the Strength of Adhesive Joints at Elevated Temperature with Imprecise Adhesive Mix Ratios. Materials 2022, 15, 721. [Google Scholar] [CrossRef] [PubMed]
- Vassilopoulos, A.P. The history of fiber-reinforced polymer composite laminate fatigue. Int. J. Fatigue 2020, 134, 105512. [Google Scholar] [CrossRef]
- Bahraminasab, M.; Sahari, B.B.; Edwards, K.L.; Farahmand, F.; Hong, T.S.; Arumugam, M.; Jahan, A. Multi-objective design optimization of functionally graded material for the femoral component of a total knee replacement. Mater. Des. 2014, 53, 159–173. [Google Scholar] [CrossRef]
- Kulisz, M.; Rudawska, A.; Maziarz, M.; Miturska, I.; Szala, M.; Badurowicz, M.; Cel, W.; Chmielewska, M.; Czyż, Z.; Falkowicz, K.; et al. Impact of Selected Structural, Material and Exploitation Factors on Adhesive Joints Strength. MATEC Web Conf. 2019, 252, 01006. [Google Scholar] [CrossRef] [Green Version]
- Zuo, P.; Vassilopoulos, A.P. Review of fatigue of bulk structural adhesives and thick adhesive joints. Int. Mater. Rev. 2020, 66, 313–338. [Google Scholar] [CrossRef]
- Back, J.-H.; Hwang, J.-U.; Lee, Y.-H.; Baek, D.; Park, J.-W.; Kim, H.-J.; Kim, J.-H.; Song, H.-K.; Yoo, M.-J. Morphological study and mechanical property of epoxy-foam adhesives based on epoxy composites for automotive applications. Int. J. Adhes. Adhes. 2018, 87, 124–129. [Google Scholar] [CrossRef]
- Sun, P.; Qin, B.; Xu, J.F.; Zhang, X. High-Performance Supramolecular Adhesives. Macromol. Chem. Phys. 2022, 224, 2200332. [Google Scholar] [CrossRef]
- Back, J.H.; Baek, D.; Shin, J.H.; Jang, S.W.; Kim, H.J.; Kim, J.H.; Song, H.K.; Hwang, J.W.; Yoo, M.J. Resistance to Cleavage of Core(-)Shell Rubber/Epoxy Composite Foam Adhesive under Impact Wedge(-)Peel Condition for Automobile Structural Adhesive. Polymers 2019, 11, 152. [Google Scholar] [CrossRef] [Green Version]
- Miturska-Baranska, I.; Rudawska, A.; Doluk, E. Influence of Physical Modification of the Adhesive Composition on the Strength Properties of Aerospace Aluminum Alloy Sheet Adhesive Joints. Materials 2022, 15, 7799. [Google Scholar] [CrossRef]
- Teng, X.; Jin, M.; Ding, C.; Lu, C. A rapid screening method for thermal conductivity properties of thermal insulation materials by a thermochemiluminescence probe. Chem. Commun. 2020, 56, 12781–12784. [Google Scholar] [CrossRef]
- Wang, J.; Zhang, Z.; Shi, R.; Chandrashekar, B.N.; Shen, N.; Song, H.; Wang, N.; Chen, J.; Cheng, C. Impact of Nanoscale Roughness on Heat Transport across the Solid–Solid Interface. Adv. Mater. Interfaces 2019, 7, 1901582. [Google Scholar] [CrossRef]
- Li, S.; Chen, Y.; Zhao, J.; Wang, C.; Wei, N. Atomic structure causing an obvious difference in thermal conductance at the Pd-H2O interface: A molecular dynamics simulation. Nanoscale 2020, 12, 17870–17879. [Google Scholar] [CrossRef]
- Plimpton, S. Fast parallel algorithms for short-range molecular dynamics. J. Comput. Phys. 1995, 117, 1–19. [Google Scholar] [CrossRef] [Green Version]
- Hu, M.; Keblinski, P.; Li, B. Thermal rectification at silicon-amorphous polyethylene interface. Appl. Phys. Lett. 2008, 92, 211908. [Google Scholar] [CrossRef]
- Faken, D.; Jónsson, H. Systematic analysis of local atomic structure combined with 3D computer graphics. Comp. Mater. Sci. 1994, 2, 279–286. [Google Scholar] [CrossRef]
- Hu, M.; Keblinski, P.; Schelling, P.K. Kapitza conductance of silicon–amorphous polyethylene interfaces by molecular dynamics simulations. Phys. Rev. B 2009, 79, 104305. [Google Scholar] [CrossRef]
- Wei, N.; Xu, L.; Wang, H.Q.; Zheng, J.C. Strain engineering of thermal conductivity in graphene sheets and nanoribbons: A demonstration of magic flexibility. Nanotechnology 2011, 22, 105705. [Google Scholar] [CrossRef] [PubMed]
- Chen, Y.; Zhang, Y.; Cai, K.; Jiang, J.; Zheng, J.-C.; Zhao, J.; Wei, N. Interfacial thermal conductance in graphene/black phosphorus heterogeneous structures. Carbon 2017, 117, 399–410. [Google Scholar] [CrossRef] [Green Version]
- Jund, P.; Jullien, R. Molecular-dynamics calculation of the thermal conductivity of vitreous silica. Phys. Rev. B 1999, 59, 13707–13711. [Google Scholar] [CrossRef] [Green Version]
- Lampin, E.; Palla, P.L.; Francioso, P.A.; Cleri, F. Thermal conductivity from approach-to-equilibrium molecular dynamics. J. Appl. Phys. 2013, 114, 033525. [Google Scholar] [CrossRef]
- Li, L.; Yu, Y.; Ye, G.J.; Ge, Q.; Ou, X.; Wu, H.; Feng, D.; Chen, X.H.; Zhang, Y. Black phosphorus field-effect transistors. Nat. Nanotechnol. 2014, 9, 372–377. [Google Scholar] [CrossRef] [PubMed] [Green Version]
- Melis, C.; Colombo, L. Lattice thermal conductivity of Si1−xGex nanocomposites. Phys. Rev. Lett. 2014, 112, 065901. [Google Scholar] [CrossRef] [PubMed]
Figure 1.
(a) The simulation model setup for the thermal relaxation method. (b) Top view of a single vacuole model.
Figure 1.
(a) The simulation model setup for the thermal relaxation method. (b) Top view of a single vacuole model.

Figure 2.
(a) Temperature evolution diagram of polymer and silicon with time during simulation. (b) Evolution of temperature difference between polymer and silicon with time during simulation. (c) The heat capacity of silicon at 400 K is calculated and linearly fitted by calculating the relationship between temperature and energy. (d) The relationship between the interfacial thermal conductance of a single vacuole model at 500 K and effective contact area ratio.

Figure 3.
(a) Another model that increases the width in both the x and y directions. (b) The relationship between the interfacial thermal conductance and the effective contact area ratio of the two models at 500 K shows that there is basically no size effect.
Figure 3.
(a) Another model that increases the width in both the x and y directions. (b) The relationship between the interfacial thermal conductance and the effective contact area ratio of the two models at 500 K shows that there is basically no size effect.

Figure 4.
(a) The initial 0 ns temperature of the layer of silicon at around 300 K; (b,c) show the temperature distribution of the process in 0.28–0.32 ns and 0.88–0.92 ns; and (d) shows the final 0.25 ns temperature of around 350 K.
Figure 4.
(a) The initial 0 ns temperature of the layer of silicon at around 300 K; (b,c) show the temperature distribution of the process in 0.28–0.32 ns and 0.88–0.92 ns; and (d) shows the final 0.25 ns temperature of around 350 K.

Figure 5.
(a) The heat capacity of silicon at 350 K is calculated and linearly fitted by calculating the relationship between temperature and energy. (b) Relationship between the interfacial thermal conductance of single vacuole model at 400 K and the effective contact area ratio.
Figure 5.
(a) The heat capacity of silicon at 350 K is calculated and linearly fitted by calculating the relationship between temperature and energy. (b) Relationship between the interfacial thermal conductance of single vacuole model at 400 K and the effective contact area ratio.

Figure 6.
(a) Top view of single vacuole model. (b) Top view of multiple vacuole model. (c) The heat capacity of silicon at 400 K is calculated and linearly fitted by calculating the relationship between temperature and energy. (d) The relationship between the interfacial thermal conductance of a multiple vacuole model at 500 K and the effective contact area ratio.

Figure 7.
(a) The initial 0 ns temperature of the layer of silicon at around 300 K; (b,c) show the temperature distribution of the process in 0.38–0.42 ns and 0.68–0.72 ns; and (d) shows the final 0.25 ns temperature of around 350 K.
Figure 7.
(a) The initial 0 ns temperature of the layer of silicon at around 300 K; (b,c) show the temperature distribution of the process in 0.38–0.42 ns and 0.68–0.72 ns; and (d) shows the final 0.25 ns temperature of around 350 K.


Table 1.
Parameters in the L-J potential for carbon (C), hydrogen (H) and silicon (S) atoms.
| Atom 1 | Atom 2 | σ(Å) | ϵ(eV) |
|---|---|---|---|
| C | C | 3.5000 | 0.00286 |
| C | H | 2.9580 | 0.00193 |
| Si | Si | 2.4799 | 0.00173 |
Disclaimer/Publisher’s Note: The statements, opinions and data contained in all publications are solely those of the individual author(s) and contributor(s) and not of MDPI and/or the editor(s). MDPI and/or the editor(s) disclaim responsibility for any injury to people or property resulting from any ideas, methods, instructions or products referred to in the content. |
© 2023 by the authors. Licensee MDPI, Basel, Switzerland. This article is an open access article distributed under the terms and conditions of the Creative Commons Attribution (CC BY) license (https://creativecommons.org/licenses/by/4.0/).
Share and Cite
MDPI and ACS Style
Guo, J.; Ma, N.; Chen, J.; Wei, N. Efficient Non-Destructive Detection of Interface Adhesion State by Interfacial Thermal Conductance: A Molecular Dynamics Study. Processes 2023, 11, 1032. https://doi.org/10.3390/pr11041032
AMA Style
Guo J, Ma N, Chen J, Wei N. Efficient Non-Destructive Detection of Interface Adhesion State by Interfacial Thermal Conductance: A Molecular Dynamics Study. Processes. 2023; 11(4):1032. https://doi.org/10.3390/pr11041032
Chicago/Turabian StyleGuo, Jianhua, Niping Ma, Jiale Chen, and Ning Wei. 2023. "Efficient Non-Destructive Detection of Interface Adhesion State by Interfacial Thermal Conductance: A Molecular Dynamics Study" Processes 11, no. 4: 1032. https://doi.org/10.3390/pr11041032
Note that from the first issue of 2016, this journal uses article numbers instead of page numbers. See further details here.