
Engineered Biomaterials for Reducing Phosphorus and Nitrogen Levels from Downstream Water of Aquaculture Facilities
by
 ,
,
W. F. Rance Bare
1, 
Ethan Struhs
2,
Amin Mirkouei
1,2,*,†,
Kenneth Overturf
3,4 and
Brian Small
4,5 1
Department of Biological Engineering, University of Idaho, Idaho Falls, ID 83402, USA
2
Department of Mechanical Engineering, University of Idaho, Idaho Falls, ID 83402, USA
3
Agricultural Research Service, United States Department of Agriculture, Hagerman, ID 83332, USA
4
Aquaculture Research Institute, University of Idaho, Hagerman, ID 83332, USA
5
Department of Fish and Wildlife Sciences, University of Idaho, Hagerman, ID 83332, USA
*
Author to whom correspondence should be addressed.
†
Current address: Tingey Administration Building, Suite 312, University of Idaho, Idaho Falls, ID 83402, USA.
Processes 2023, 11(4), 1029; https://doi.org/10.3390/pr11041029
Submission received: 28 February 2023
/
Revised: 23 March 2023
/
Accepted: 25 March 2023
/
Published: 29 March 2023
(This article belongs to the Special Issue Advances in Value-Added Products from Waste)
Abstract
:The United States (U.S.) has a nearly USD 17 billion seafood trade deficit annually. However, the U.S. aquaculture industry faces strict micronutrient (e.g., phosphorus and nitrogen) level mandates that negatively impact fish production, especially for the state of Idaho, which produces 70–75% of the nation’s rainbow trout. This study investigates the sustainability benefits of producing engineered biomaterials from lignocellulosic-based feedstocks near collection sites via portable biorefineries for use by fish farms to reduce eutrophication (oversupply of micronutrients) impacts. In this study, sustainability assessments are performed on a case study in southern Idaho, the largest U.S. commercial producer of rainbow trout. The results show that 20 and 60 min of water treatment, using small particle size biomaterial from lodgepole pine, has the highest total phosphorus removal rate, at 150–180 g of phosphorus per 1 metric ton of engineered biomaterials. The results of techno-economic and environmental impacts studies indicate that pinewood-based biomaterials production cost ranges from USD 213 USD 242 per ton and reduces the eutrophication potential by 5–17 kg PO4eq/ton. Additionally, the environmental impact results show that the total greenhouse gas emission for biomaterial production is 47–54 kg CO2eq/ton; however, the used biomaterials after water treatment can be sold for around USD 850 per ton as nutrient-rich soil conditioners. This study concluded that engineered biomaterials from lignocellulosic-based feedstocks could be a sustainable solution to the challenge that aquaculture faces, particularly capturing micronutrients from eutrophic water and reusing them as fertilizers.
1. Introduction
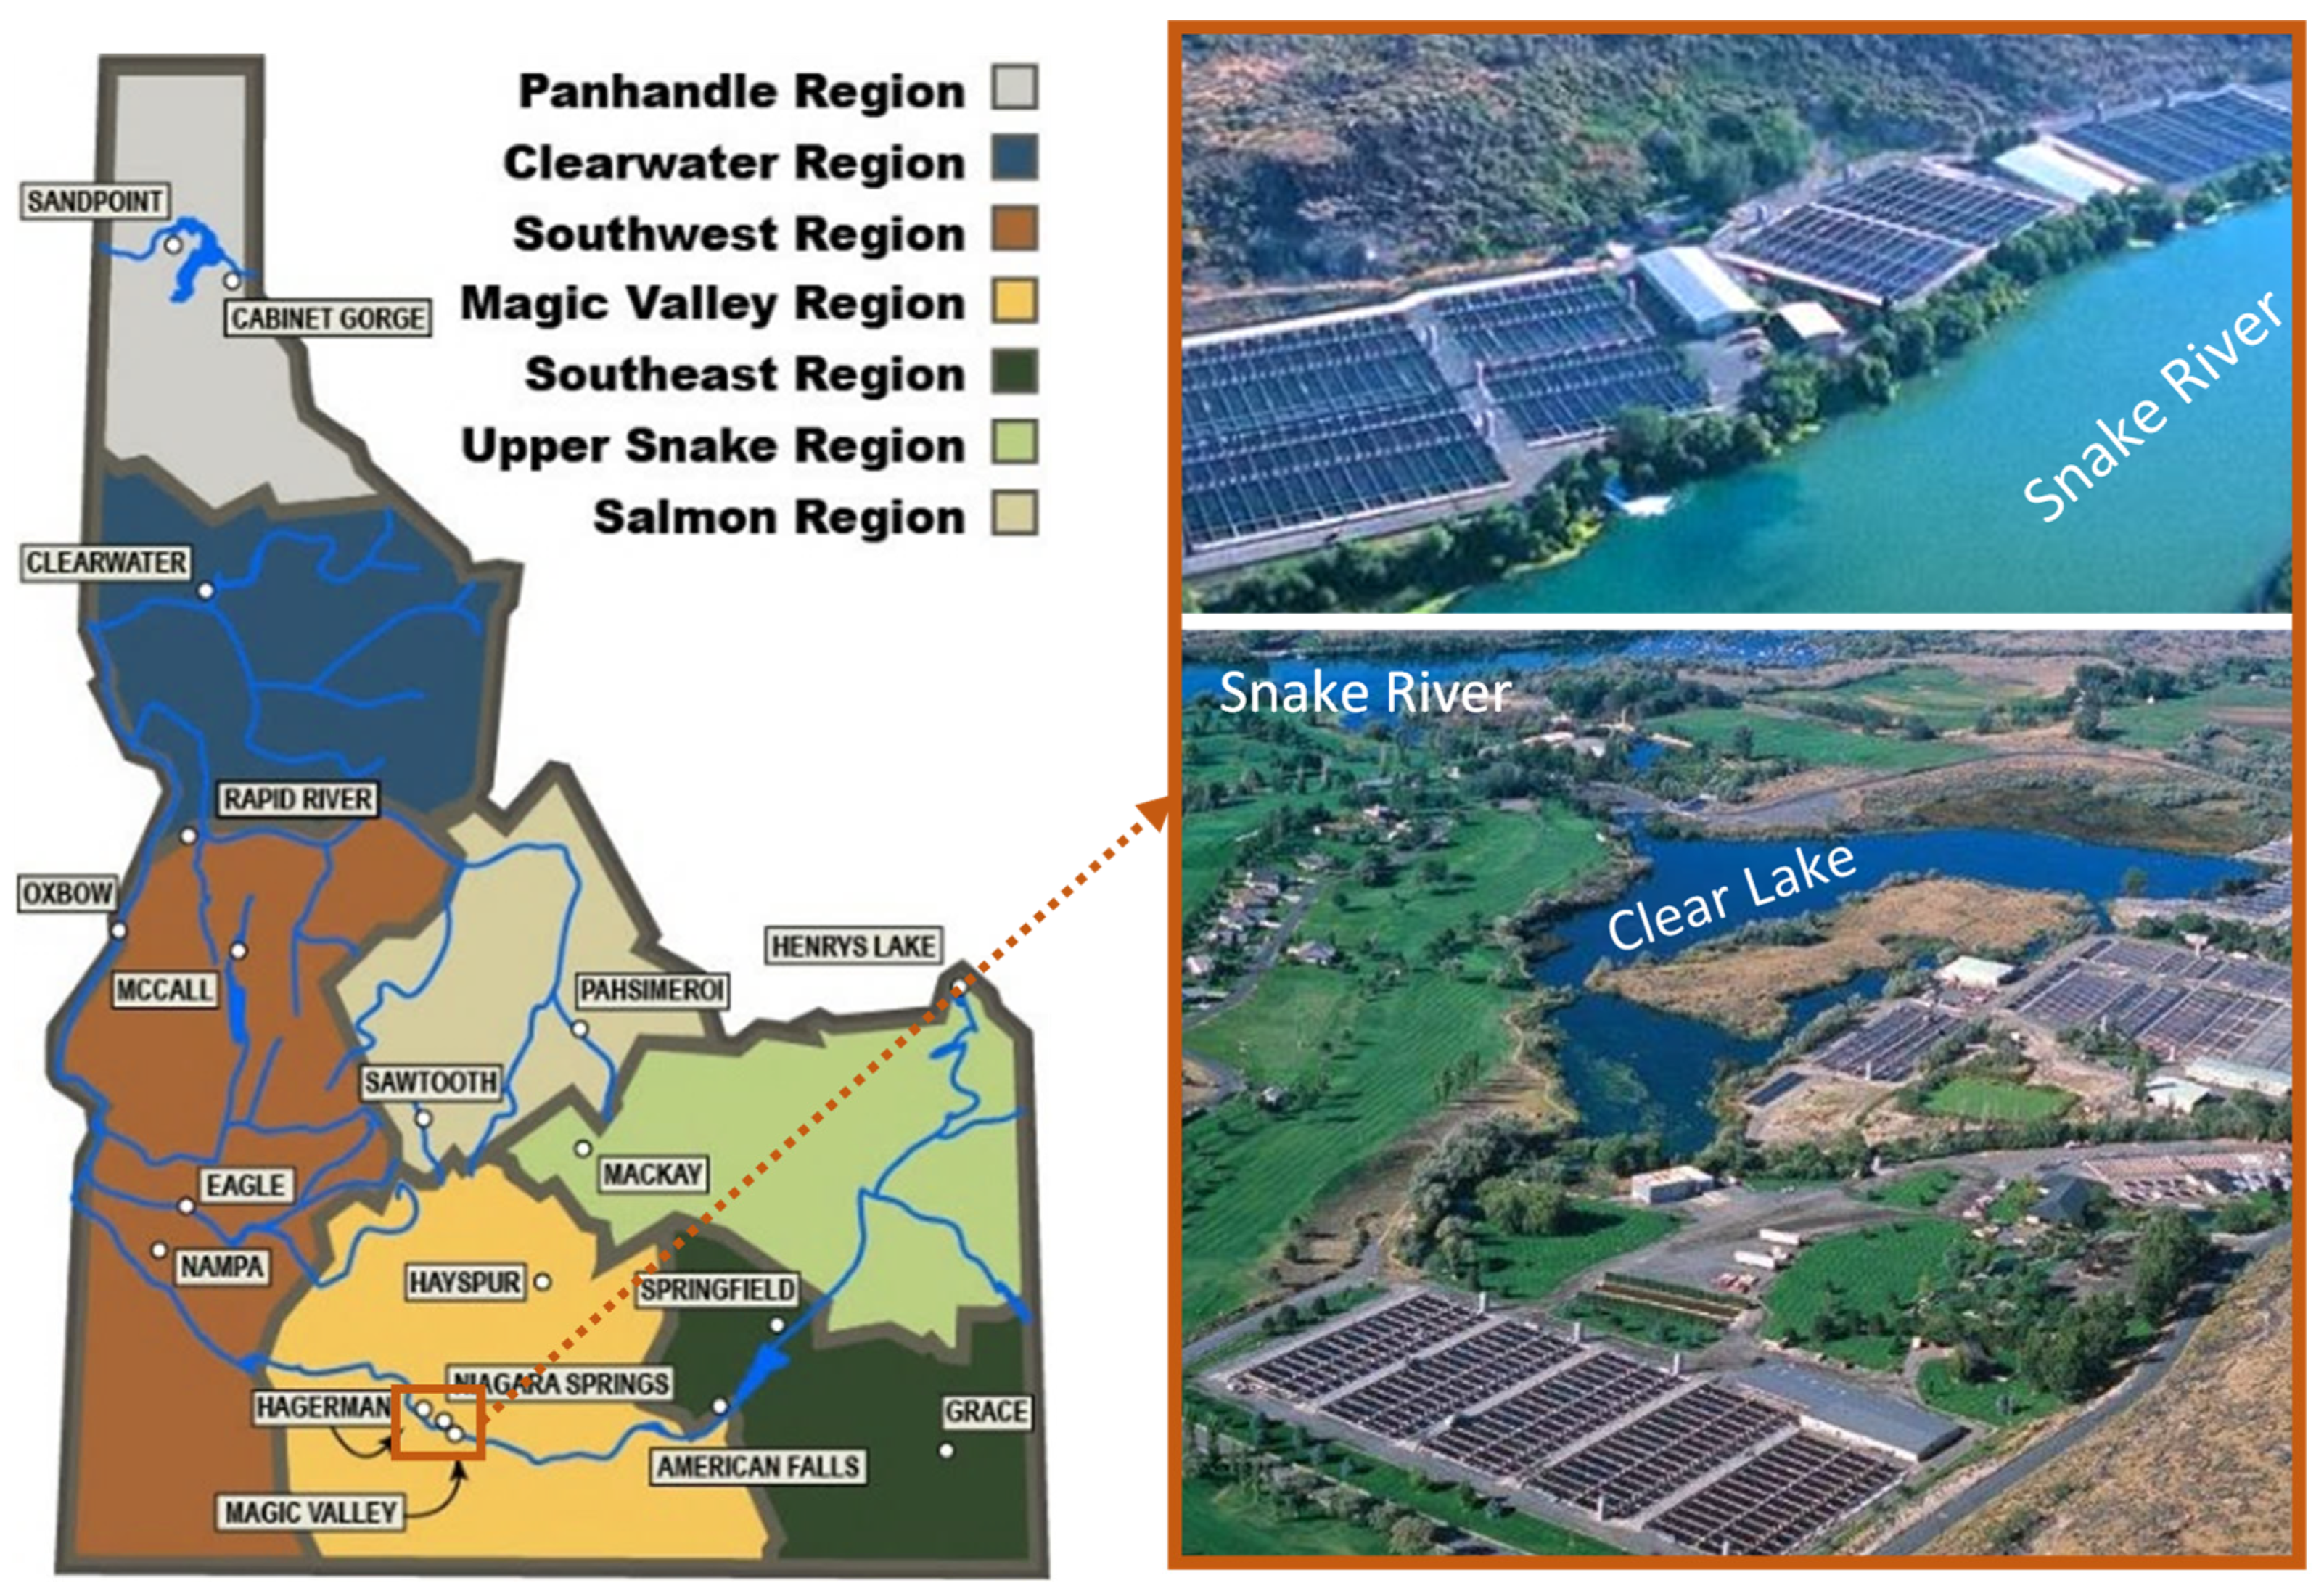
The aquaculture industry has become well-established over the past 40 years, contributing to seafood supply and local job creation, while using local resources [1]. Globally, aquaculture provides more than 50% of the world’s seafood supply. Currently, the aquaculture industry in Idaho ranks as the U.S. largest producer of commercially raised rainbow trout, culturing over 30,000 tons of the U.S.-grown trout annually. In the past, over 100 facilities were permitted to operate in Idaho, of which over 60 are in the Snake River Canyon at Hagerman, using the outflow from the Snake River Aquifer as their water source (Figure 1) [2]. This outflow is extremely high-quality water running at a constant temperature and flow rate. However, the discharge waters from these aquaculture operations run into the mid-reach of the Snake River and include a wide array of pollutants (e.g., fish feces, pathogens, drugs, nutrients, uneaten fish food, algae, and parasites). Idaho fish farms are currently producing over 70% of the rainbow trout raised in the U.S., along with several other species; however, their ability to grow or even continue at current production levels could be in jeopardy. The state of Idaho has been monitoring the effluents from these farms for compliance with the existing phosphorus and nitrogen limitations mandated by the U.S. Environmental Protection Agency (EPA) since 2011. Over the past decade, the Idaho Department of Environmental Quality (IDEQ) analyzed over 1000 water samples, with a majority of the tests exceeding the current phosphorus limit. Monitoring personnel from the IDEQ expect the U.S. EPA to review the current permit conditions in the near term due to concerns regarding eutrophication and the potential for the proliferation of harmful algal blooms in the backwaters of two dams. These backwaters are the summer playground for many residents for fishing, water skiing, canoeing, paddle boarding, and general boating. While phosphorus level is a limiting factor in seafood production (e.g., fish) in the Snake River basin, these micronutrients are issues for all water users throughout the U.S. Thus, sustainable water treatment and aquaculture waste management processes are critical for water quality in the U.S., especially in the northwestern region where a limited water availability exists.
Micronutrients and pollutants discharge can lead to an environmental hazard with changes in oxygen, phosphorus, nitrogen, pH, sediment, and water temperature, consequently decreasing water quality. The effluent wastes can oversupply nutrients (eutrophication) that encourage aquatic plant growth. To the best of our knowledge, there are no commercial products, services, or innovations in the market for improving water quality and the aquaculture industry’s performance. Many studies have been conducted using biomaterials from feedstocks, such as pyrolysis-based char (biochar), to adsorb and remove nutrients and pollutants from waste streams. Earlier studies investigated biomaterials’ adsorption capacities for removing numerous impurities, thereby improving water quality, and engineered biomaterials’ potential for absorbing or immobilizing contaminants [3,4,5,6]. A summary of the recently published studies using biomaterials for water treatment is provided in Table 1.
The novelty of this study lies in exploring the sustainability benefits across the aquaculture industry in Idaho through a novel water treatment system that will assist in meeting EPA standards. This study investigates three main areas: water treatment, techno-economic analysis, and environmental impacts assessment, using engineered biomaterials.
Water treatment. Several methods for phosphorus removal from wastewater have been developed, and some are even used on a commercial scale [22,23]. These methods have varying economic and environmental sustainability benefits. Biochar has been shown in several studies to be an effective adsorbent of phosphorus, which can supply a renewable solution for the recovery of eutrophic waters [18,19,24]. This allows for the capturing and reusing of micronutrients from water for other applications, such as nutrient-rich soil conditioners or fertilizers [11]. Current treatment methods for aquaculture effluents include recycling wastewater, which only builds up the nutrient concentrations, and the development of marshlands where the vegetation utilizes the nutrients for sustained growth. The drawback of this process includes large tracts of land required to develop sufficient detention time for uptake. Water treatment using biomaterials can provide a more consistent treatment result that can take less land and have an economic return upon reuse of the treatment materials as fertilizers or soil conditioners.
Techno-economic analysis (TEA). Prior studies reported that differing costs for phosphorus removal are primarily dependent on reducing phosphorus concentration to a target amount. Sano et al. (2005) found that wastewater treatment in Florida could range from USD 24/kg of phosphorus when going from 300 to 155 ppb to USD 268–USD 1346 to go from 180 to 10 ppb [25]. Tran et al. (2012) reported that a combination of electrocoagulation and flocculation could remove 97% of the phosphorus at a concentration of 5.0 mg/L, leading to a cost of USD 0.19–USD 0.28 per cubic meter of wastewater running continuously. Molinos-Senante et al. (2010) performed a cost–benefit analysis to estimate a shadow price for phosphorus [26]. They found that the cost of phosphorus prevented from being introduced into the environment had a cost savings of EUR 42.74 (around USD 49)/kg (currency updated to 2022 scaling). Malmaeus and Karlsson (2010) found that the mitigation of nutrients in agricultural runoff into surface water in Sweden could save EUR 7–EUR 11 (around USD 10–USD 15)/kg per year.
Environmental impact assessment. On an environmental level, any decrease in wastewater phosphorus will positively impact eutrophication, but may adversely affect global warming potential (GWP). Coats et al. (2011) assessed the GWP of biological and chemical phosphorus removal scenarios [27]. The biological method had between 5.2 and 13.2% less effects on GWP. Remy et al. (2014) examined several filtration technologies to test effluent quality and environmental impacts [28]. They reported that gravity-driven treatment processes could perform significant phosphorus removal while also demanding less chemicals and electricity than other technologies, resulting in lower greenhouse gas (GHG) emissions.
This study estimates the total engineered biomaterial production cost by utilizing a life cycle costing model as part of the techno-economic analysis. In addition, life cycle assessment is used to explore the GWP and eutrophication potential of the proposed biomaterial production and application pathway. On-site production rate and phosphorus adsorption capacity are two key parameters examined in a sensitivity analysis to reduce biomaterial unit price and environmental impacts. The results show that 20 and 60 min of water treatment, using small particle size biomaterial from lodgepole pine, has the highest total phosphorus removal rate (150–180 g of phosphorus per 1 metric ton of engineered biomaterials). Our main focus in this study was on total phosphorus removal because phosphorus is the chief pollutant being discharged from aquaculture facilities in southern Idaho. This study concluded that the proposed approach and lignocellulosic-based materials could reduce the phosphorus and nitrogen levels of downstream waters from fish farms and could be used for other water impurities.
2. Materials and Methods
2.1. Biomaterial Production
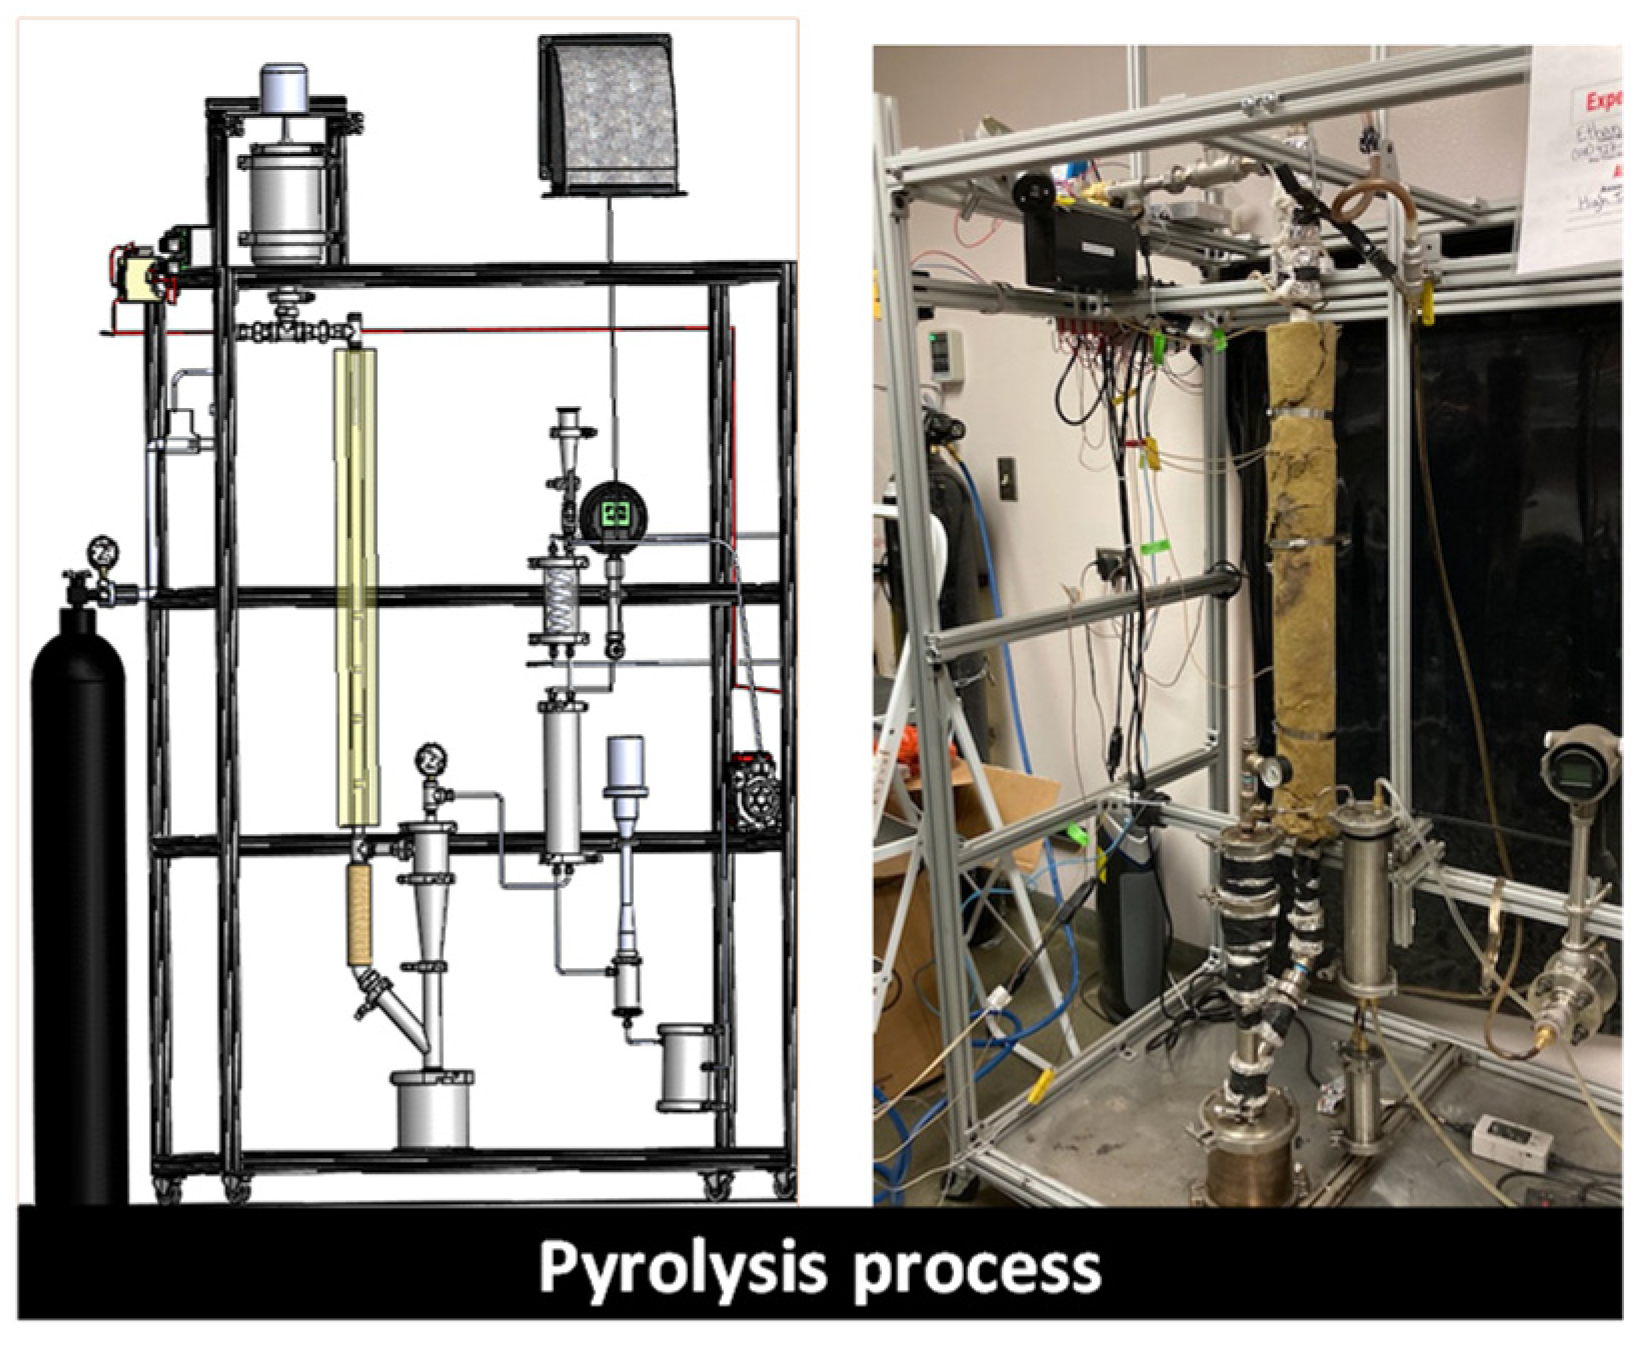
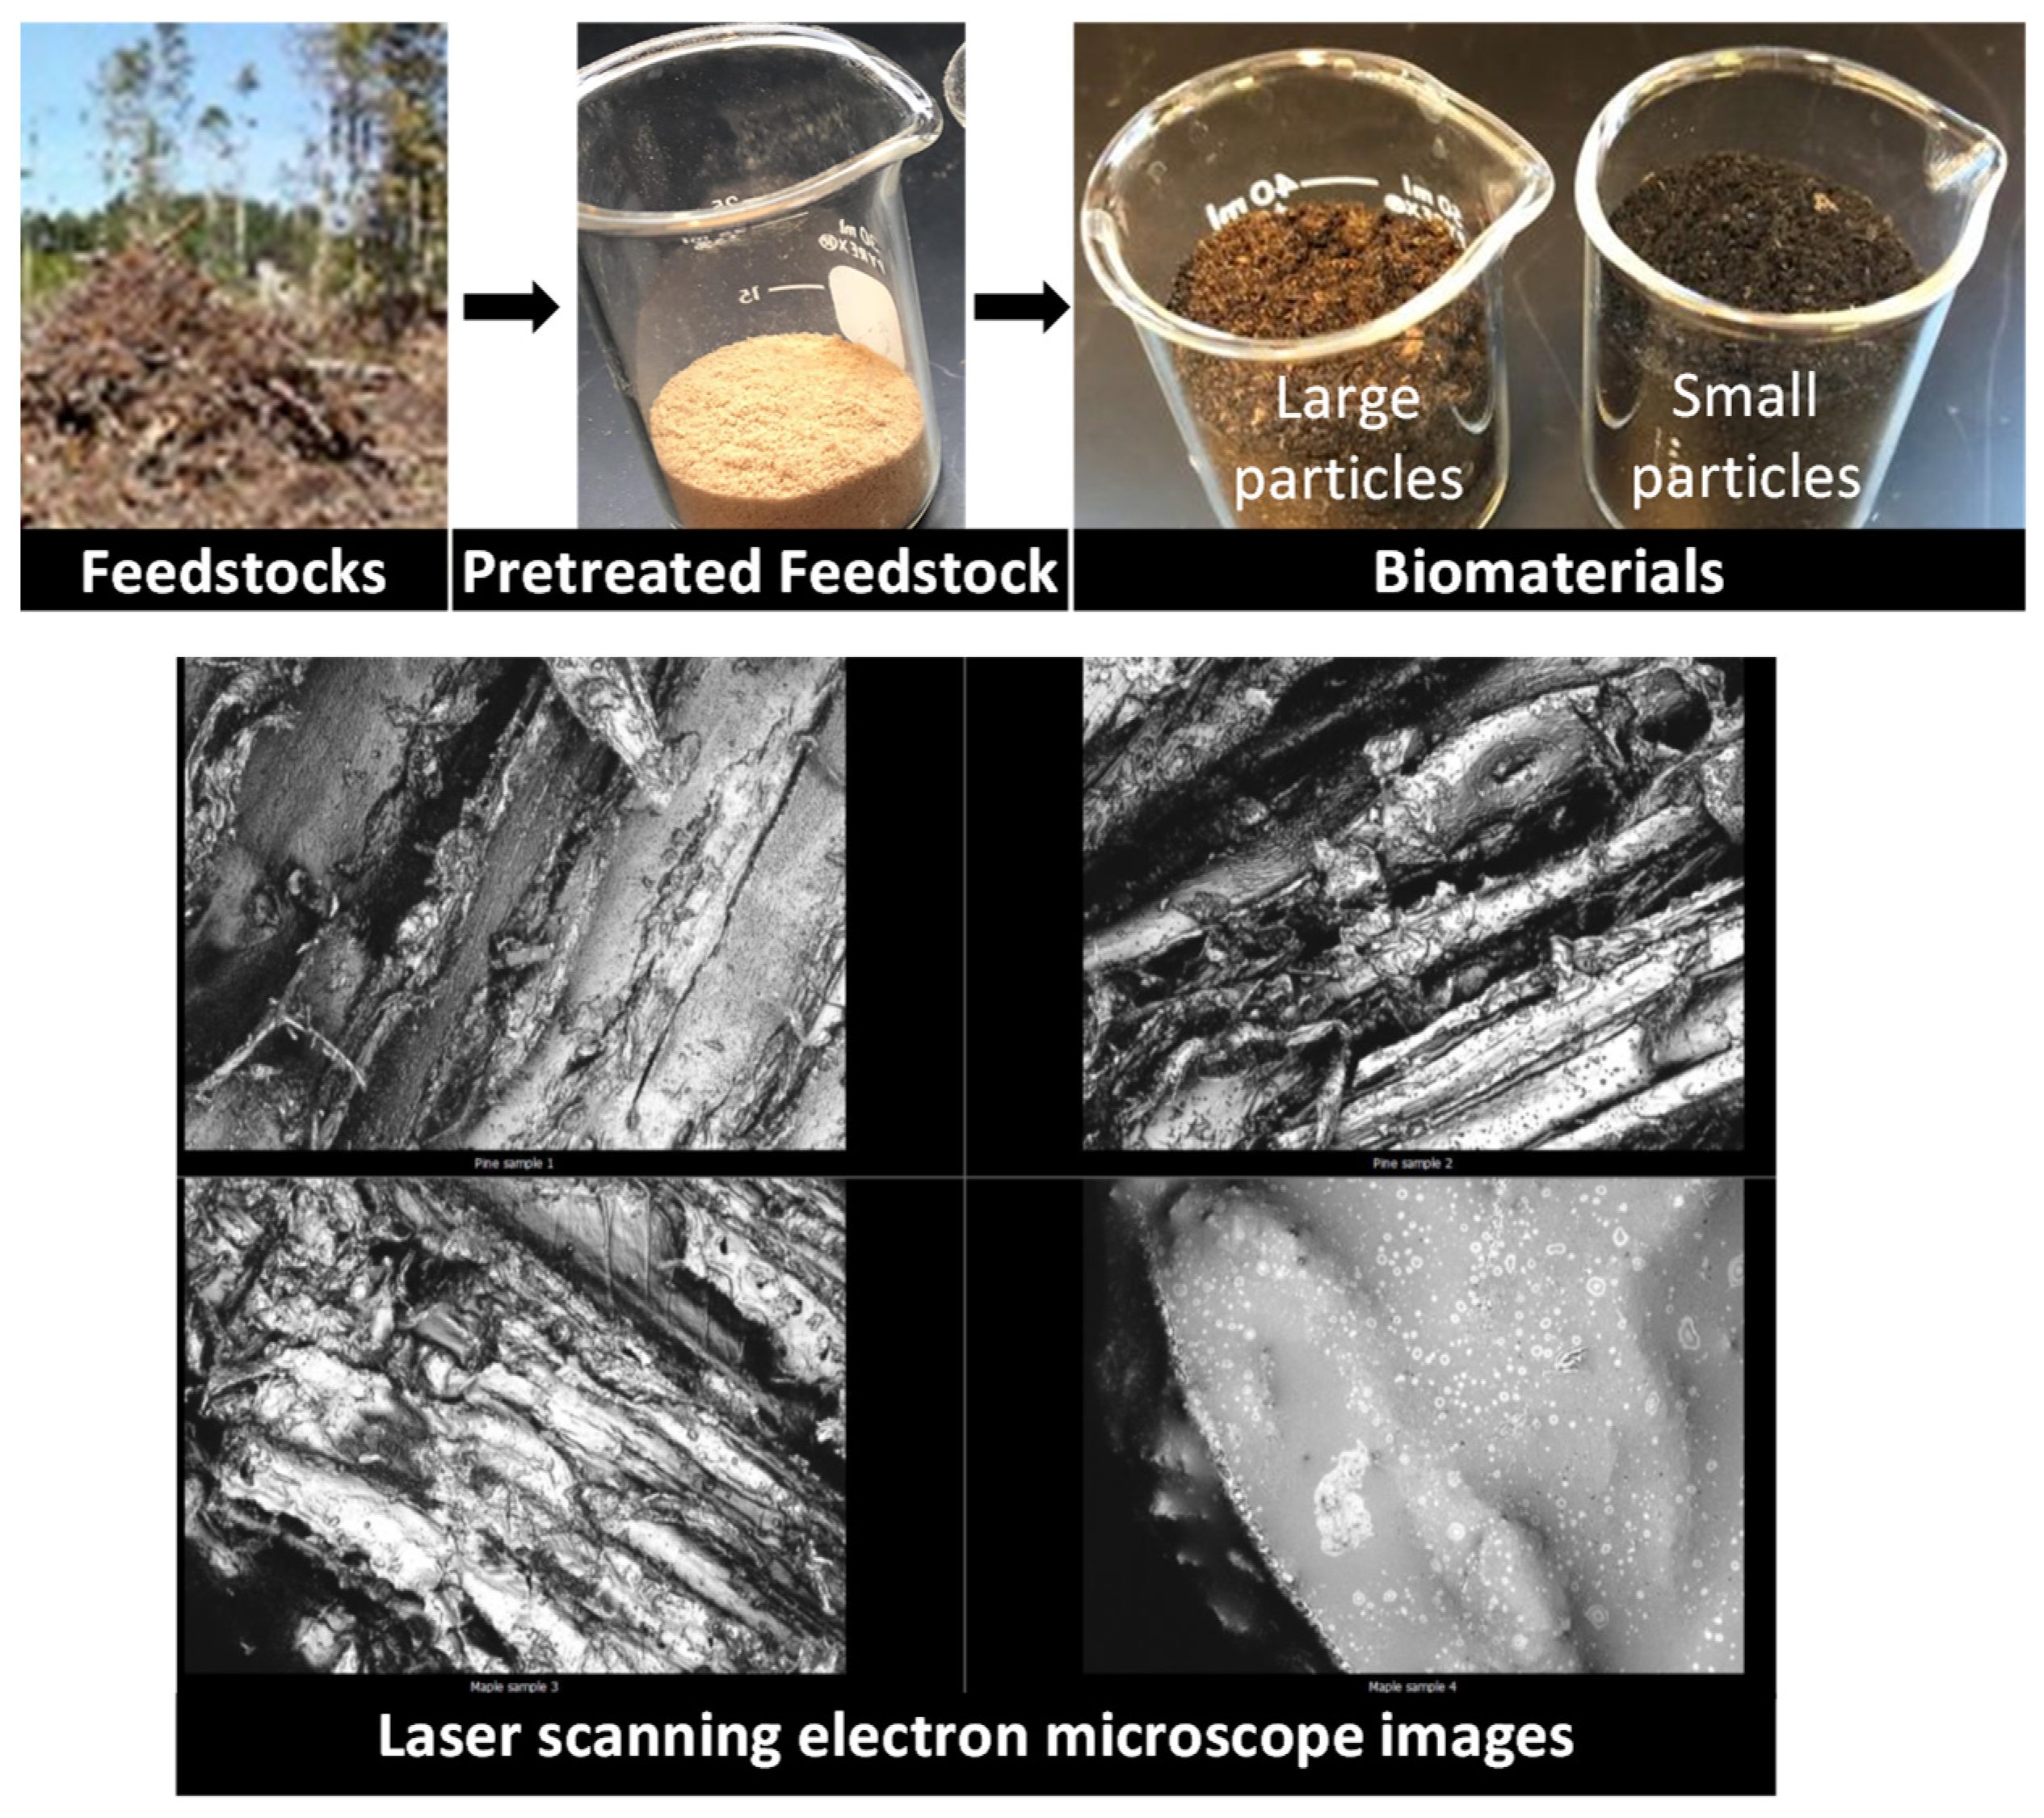
In this study, biomass feedstocks were supplied by Idaho National Laboratory and American Wood Fibers. These feedstocks were converted into biomaterials and used in laboratory and field experiments to identify biomaterial samples with high phosphorus adsorption rates. Biomass feedstocks were ground and classified into small particles (0.5–2 mm) and large particles (2–5 mm), using a grinder. Then, they were dried for 24 h at 90 °C prior to biomaterials production. Biomaterials used in the experiments were produced using a free-fall fast pyrolysis reactor with an integrated fixed-bed slow pyrolysis reactor (Figure 2). Nitrogen was used to create an oxygen-limited environment inside the pyrolysis reactors. Biomass was fed to the system through an auger-type feed system. Biomass passed through the fast pyrolysis reactor with a residence time of 1.5–2 s and into a cyclone, separating the solids from the vapors and gases. The carbonaceous solid was collected in a fixed-bed slow pyrolysis reactor. The fast pyrolysis reactor operated at 550 °C and 5–10 psig, and slow pyrolysis was performed at 350 °C for 30 min producing the engineered biomaterials used in water treatment experiments (Figure 3). In our techno-economic analysis, the required storage facilities and equipment are 0.5 tons (over 1000 lbs.) bulk bags for biomaterials, and a big tanker for bio-oil storage. Moreover, a double-trailer truck is considered for transferring biomaterials from the production site to storage facilities. The capital and variable costs are estimated using an approach reported in the earlier study [29] and adjusted for inflation to 2021, using Producer Price Index [30].
2.2. Water Treatment
The selected biomaterials for field experiments were produced from pine residues due to the high phosphorus removal rate from water during laboratory experiments. Testing biomaterial phosphorus adsorption ability in the field took place at an aquaculture production facility located in Buhl, ID. Water was diverted from fourth-use raceways into several tanks in the amount of 15 gallons each. Water samples were obtained before and after introducing the biomaterials into the water. Experiments were run in triplicate to compare the results and evaluate the phosphorus removal rate and the effectiveness level statistically. Biomaterials were placed into 100-micron mesh water filter sleeves in the amount of 50 g. Two different particle sizes were used: large particle (2–4 mm) and small particle (0.5–2 mm) to determine the adsorption capacity of particle size. Each bag was placed in a separate water tank for designated batch residence times of 5, 20, and 60 min. Biomaterial water filter sleeves were removed after the allotted time and stored prior to shipment to analytical laboratories. The statistical analyses of the Pearson correlation coefficient matrix for various parameters and variables (e.g., the particle size, treatment time, and phosphorus/nitrogen adsorption) were analyzed and generated through Python programming language.
Laboratory Sample Analysis. Phosphorus adsorption studies were performed prior to field experiments to ascertain the most suitable biomass. Loss on drying (LOD) was determined in the air at 105 °C overnight and is reported on an as-received sample basis. The samples were then ground prior to all other analyses. All other results were determined on a dried, ground sample weight basis and calculated to an as-received sample basis except specific conductivity (SC) and pH. Carbon (C), hydrogen (H), and nitrogen (N) are determined following ASTM D5291. We used a Thermo FlashEA 1112 analyzer. Weighed samples were combusted in oxygen at 950 °C. The combustion products were swept with a helium carrier gas through a chromatography column where the H2, N2, and CO2 are separated from other combustion products and measured with a thermal conductivity detector (TCD). Oxygen (O) by difference is calculated as (100-C-H-N-S-ash)% and may be in error due to the oxidation of inorganic components during ashing, double subtraction of components, such as sulfur remaining in the ash, or volatilization of other species (e.g., halogens) not measured or subtracted. Sulfur (S) was determined following ASTM D4239. We used a LECO model S-144DR Sulfur Analyzer. A weighed sample was combusted at 1300 °C in the presence of oxygen to form SO2. The SO2 was then measured by an infrared detector. Ash was determined after slowly stage ashing to 750 °C in air overnight and holding at temperature for 8 h. Ash was determined following ASTM D2974. A weighed aliquot of sample was oxidized in a furnace at 750 °C overnight and held at temperature for 8 h. The sample was reweighed, and the percentage of ash was determined from the difference in the two weights. Fixed carbon (FC) was calculated as 100–moisture LOD– volatile matter (VM)–ash. Higher heating value (HHV) was determined following ASTM D5865. A weighed sample was placed in a sealed bomb, which was pressurized with oxygen. The bomb was placed in a 20 °C water bath, and the system was closed. A firing wire ignited the sample in the bomb. The energy released was measured by the change in temperature in the water bath. The results were reported as BTU/lb. The result for o-Phosphate (o-P) was not calculated. It was analyzed by ion chromatography after a hot deionized water leach of 0.5 g of sample in 50 mL of deionized water at 95 °C for one hour. Analysis by ion chromatography followed US EPA method 300. Phosphorus (P) was determined following US EPA 300.7. A weighed sample was digested completely in a hot oxidizing acid mixture of nitric and perchloric acid. The acidic digestion solution was brought to a fixed final volume in deionized water and analyzed by inductively coupled plasma-atomic emission spectroscopy (ICP-AES). SC and pH were measured on the same hot deionized water leach solution used for o-P analysis. SC was measured with an electrochemical probe.
Field Sample Analysis. For biomaterial nitrate and ammonium nitrogen analysis, the inorganic nitrogen in materials is present as ammonium (NH4+), nitrate (NO3−), and to a small degree, nitrite (NO2−). A 2 N KCl carrier reagent was used for extraction analysis, followed by flow injection analysis (FIA). The applicable range of this method is from 0.1 to 20.0 mg/L nitrite-nitrate nitrogen (NO2-N/NO3-N), and from 0.1 to 10.0 mg/L for ammonium nitrogen (NH4-N). Higher concentrations can be determined by sample dilution. A filtered sample and reagents flow into an analytical cartridge via a peristaltic pump, where mixing occurs. For NO3-N, the mixture is passed through a column containing granulated cadmium-copper to reduce NO3-N to NO2-N. The NO2-N concentration (original presence plus reduced NO3-N) is determined by diazotizing with sulfanilamide and coupling with N-(1-naphthyl)-ethylenediamine dihydrochloride to form a highly colored azo dye. For NH4-N, the mixture is heated. The NH4-N concentration is determined by the amount of indophenol blue produced when NH4-N reacts with salicylate and hypochlorite. The color is intensified by the addition of sodium nitroprusside. The resulting color intensity for both NO3-N and NH4-N is determined by the amount of analyte present. The color streams flow into expanded range detectors, where the color intensity is measured and converted into a digital signal. The FIALab software then displays these signals and reports the resulting values. The reporting limits are approximately 0.8 μg/g for NO3-N and NH4-N. The samples were analyzed within 48 h of the extraction and kept refrigerated when not being analyzed. A 5 g biomaterial sample is used for this analysis. The determination of nitrate/nitrite and ammonium in a biomaterial is complicated by the rapid changes that occur due to ammonification, nitrification, and other microbial and enzymatic processes. It is advised that biomaterials be air-dried or frozen from the sampling site. For biomaterial total phosphorus analysis, the procedures determine total phosphorus in solids digested in 30% nitric acid by Inductively Coupled Plasma Optical Emission Spectrometer (ICP-OES), and Inductively Coupled Plasma Mass Spectrometer Collision/Reaction (ICP-MScx). A sample size of 0.5–1.0 g wet weight, and 0.25 g dry weight is used for this procedure. The reporting limits are updated periodically and are 20 µg/g for dry weight, and 5 µg/g for wet weight.
2.3. Multi-Objective Impacts Assessment Method
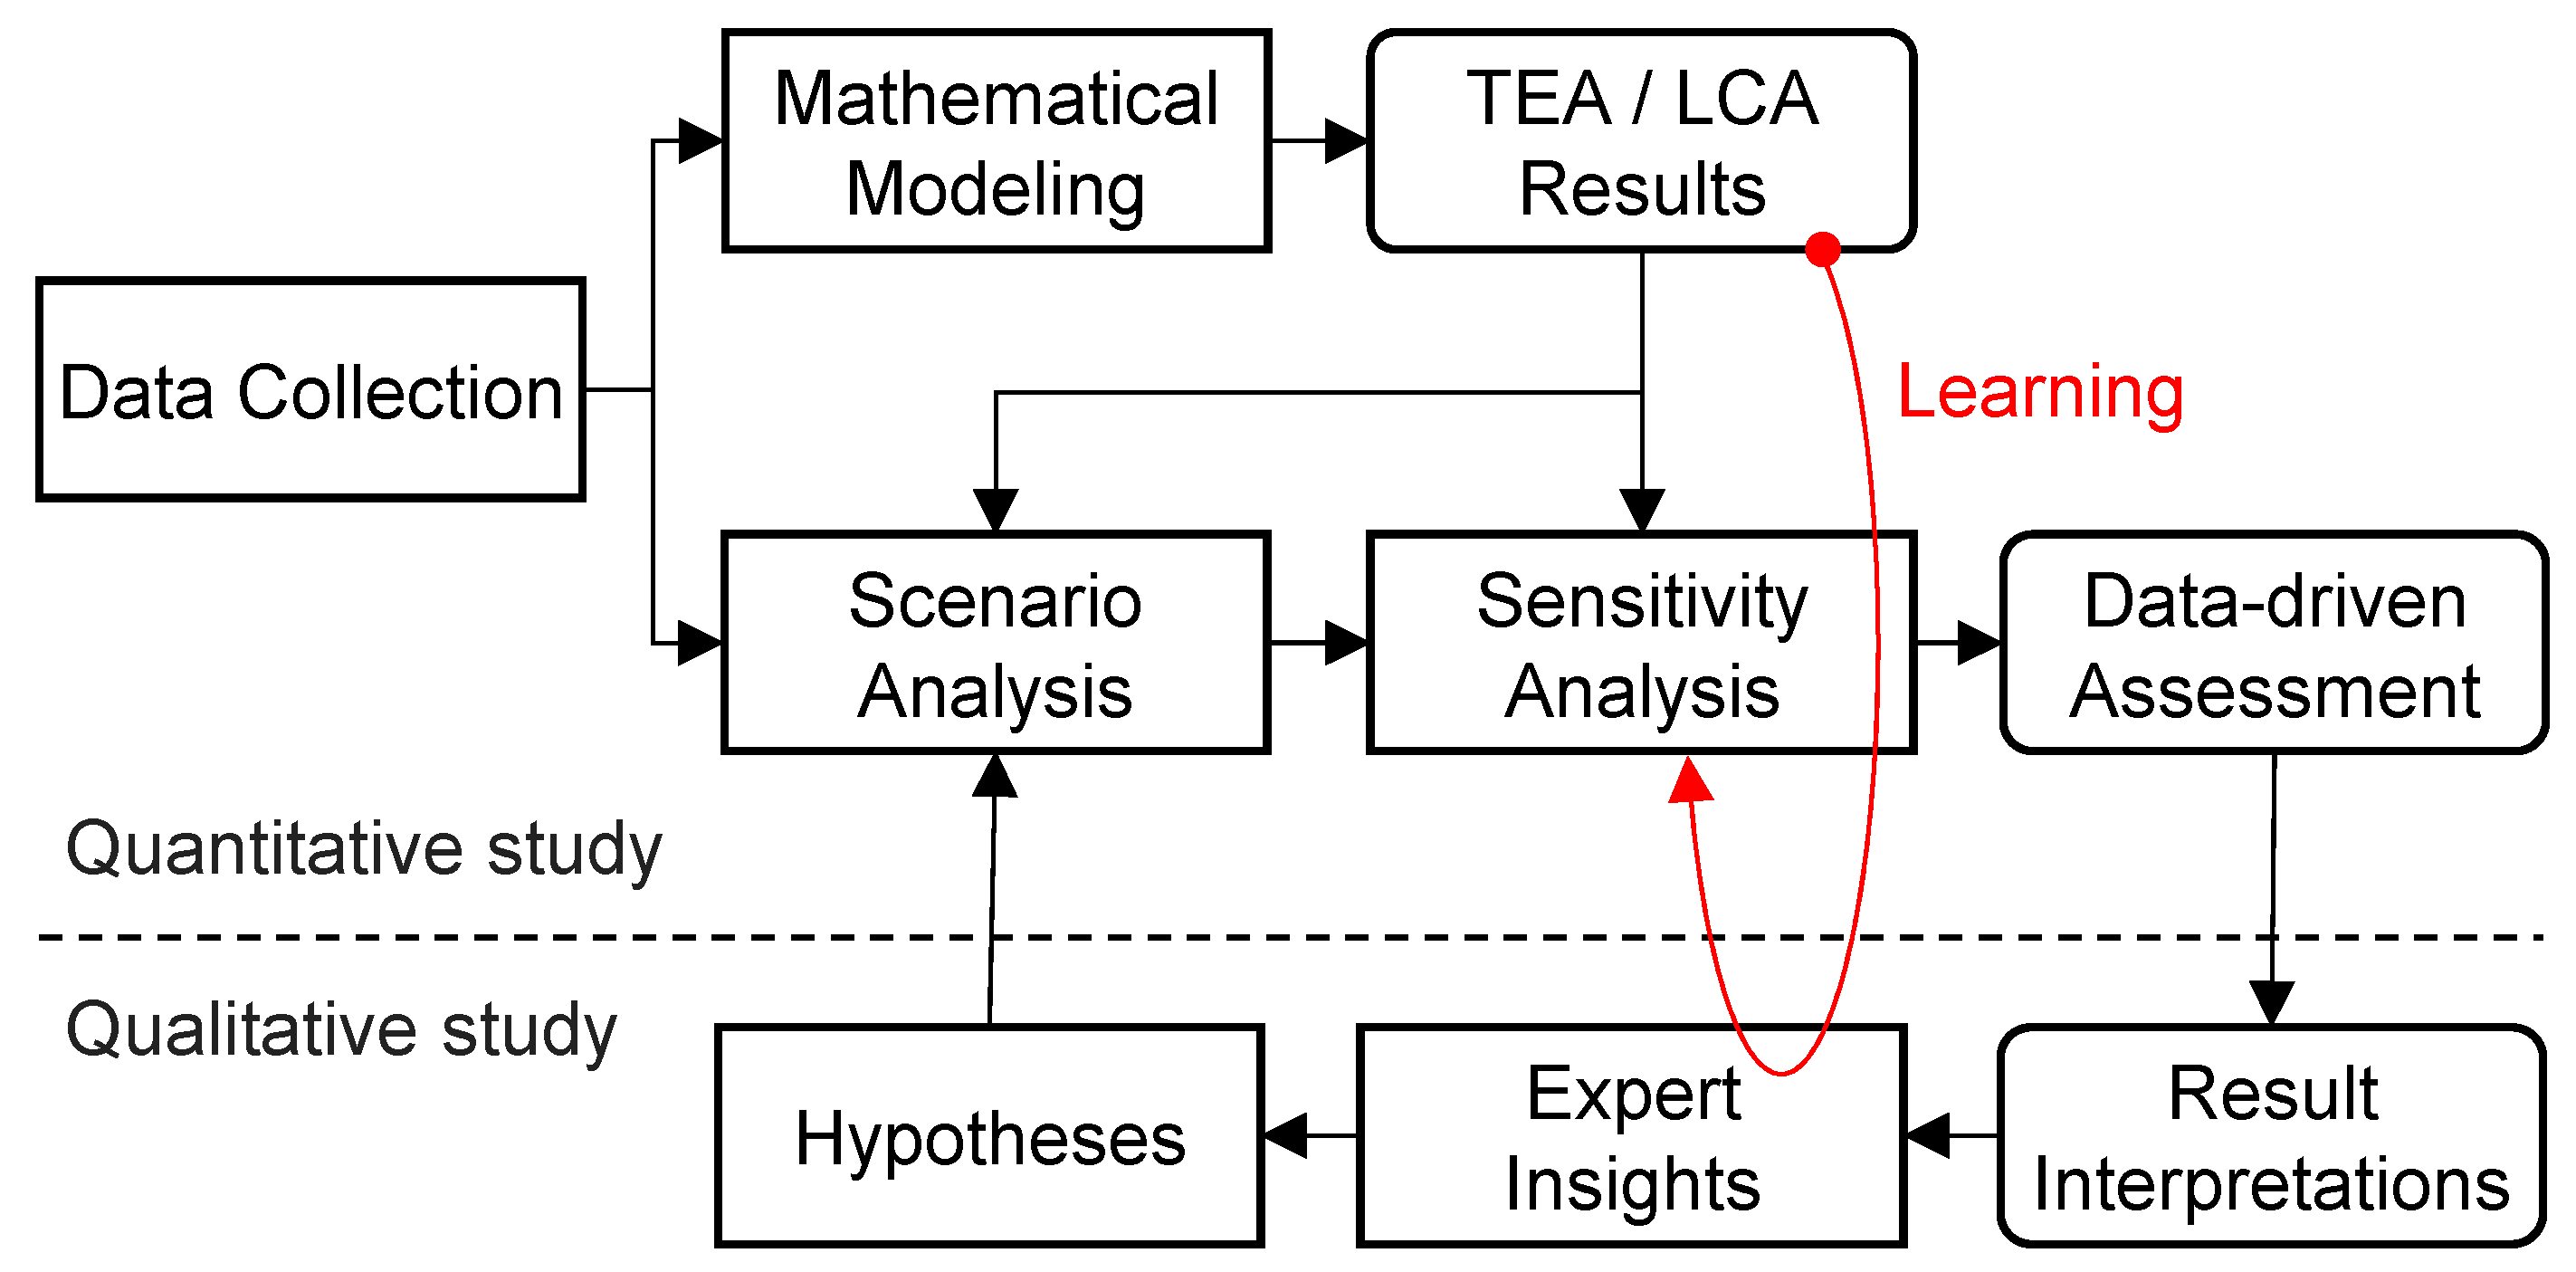
The evaluation procedure for multi-objective impacts assessment includes techno-economic analysis and environmental impacts assessment to explore the sustainability benefits of pinewood-based biomaterials production for removing micronutrients from downstream aquaculture water (Figure 4) [31,32,33]. Biomaterials are presumed to be produced at collection sites located in northwest Oregon that are the most heavily timbered in the U.S. Pacific Northwest. The Oregon Department of Forestry has several collection sites scattered across Clatsop, Columbia, Washington, and Tillamook counties. The main case study considers 20 of these collection sites with an average distance of around 500–550 miles from the fish farms. Different equipment is required for collecting and processing forest residue, including a tractor, wagon, loader, grinder, and rotary dryer. In addition, two portable refinery units are used for the base case study, each with a processing capacity of 50 tons per day. The units are placed close to the collection sites for the on-site conversion of forest residues, nullifying extra fuel and costs required to transport raw materials to biorefineries. The following assumptions are made from prior studies and laboratory experiments for conducting techno-economic and environmental impacts assessment in this study:
- Pyrolysis gas and oil were used for heating the conversion process, and did not require storage or transportation [36].
- Portable biorefinery effective lifetime is assumed to be 10 years, the capacity is 50 dry metric tons of biomass per day, and the annual scheduled refinery process is 328 for 12 h per day [37].
- Annual available forest residue is at least 60,000 metric tons at the 20 collection sites located in Oregon and owned by the Oregon Department of Forestry [38].
- The time horizon is one year, and the type of facilities and utilized equipment are known.
- Environmental savings shadow cost of removing phosphorus was calculated to be USD 62.33/kg removed [26].
- Conversion process yields of pyrolysis char, oil, and gas from forest residue are 40%, 40%, and 20%, respectively, using the proposed portable refinery unit.
- The roundtrip distance from the production site to the storage facility is assumed to be 500 miles (805 km).
- The setup and breakdown of the portable refinery unit is a day, and the mileage charge is USD 1/mile (USD 0.63/km) [34].
Figure 4.
Multi-objective impacts assessment method.

2.4. Techno-Economic Assessment
A life cycle costing model is formulated to explore the use of the proposed portable pyrolysis unit for water nutrient adsorption from fish farms. Both capital (fixed) and operational (variable and labor) costs are considered for total cost estimation, including collection, pretreatment (i.e., grinding and dewatering), portable refinery, storage, transportation, and water treatment. Total cost is calculated, using Equation (1), including the cost of collection (C1), grinding (C2), drying (C3), conversion (C4), storage (C5), distribution (C6), and water treatment (C7). Nomenclature is provided in the Supplementary Materials.
2.5. Environmental Impacts Assessment
The LCA method was applied in this study using OpenLCA (open-source LCA software) in conjunction with data obtained from prior studies to evaluate the environmental impacts of the proposed water treatment method. The LCA study is composed of four phases: definition of goal and scope, life cycle inventory, life cycle impact assessment, and interpretation.
Goal and scope definition: The goal is to assess the environmental impacts of biomaterial production for harmful nutrient adsorption from fish farms. The LCA performed evaluates GWP and eutrophication effects for the life cycle of residues to biomaterials applied to fish farm downstream waters. GWP is calculated using GHG emission factors in kg CO2 equivalent. The contributing constituents are 28 kg CO2 eq./kg CH4 and 265 kg CO2 eq./kg N2O, which are acquired from the Intergovernmental Panel on Climate Change for a 100-year time horizon [41]. Eutrophication is calculated using eutrophication potential in PO4 equivalent, with key factors being 3.07 kg CO2 eq./kg P and 0.24 kg CO2 eq./kg N2O. The scope of this study consists of upstream and midstream processes, including residue collection, on-site preprocessing (size reduction and drying), on-site conversion to biomaterials, on-site reusing intermediate products (pyrolysis oil and gas) for process energy purposes (heat and electricity), and biomaterial distribution. The system boundary is cradle-to-gate, and the functional unit is one kilogram of biomaterials for phosphorus removal from downstream waters.
Life cycle inventory: Input and output parameter data were obtained from prior studies and AGRIBALYSE and OpenLCA databases [42]. The required types of machinery for collecting pine residues are a forwarder and loader. The inputs are residues and diesel for operating the collection machines. The main outputs are diesel combustion emissions from machinery use. The GHG emission factor for upstream of the product system includes collecting and hauling forest residues. The collected residues are loaded into an on-site grinding machine to produce acceptably sized pine particles, and then into a rotary dryer for dewatering. Pretreatment inputs are pine residues and diesel fuel for grinder and dryer machines, and the outputs are pretreated pine residues and the GHG emissions from fuel combustion and water vapor from drying. Producing higher quality residues for the pyrolysis process requires more energy input, generates more emissions, and increases the GWP. After the pretreatment step, a portable pyrolysis unit is used to convert the pretreated residues into biomaterials, utilizing nitrogen (as inert carrier gas) and a heat source powered by the combustion of pyrolysis oil and gas, as well as diesel use for any further energy requirements. The pyrolysis process inputs are pretreated residues, nitrogen, energy supplied by the combustion of byproducts, and cooling water for the condensation of pyrolysis oil, while outputs consist of biomaterials (the focus of this study) and all process emissions. The emissions from pyrolysis byproducts (oil and gas) are considered as biogenic GHGs. Biomaterials are then loaded and transported by truck to fish farms for water treatment. The required diesel fuel and the impacts depend mainly on the distance from collection to the fish farms. Therefore, an LCA study was performed using data from a case study in Buhl, ID. The previously described process was developed into a production system in OpenLCA, allowing for a total pathway impacts assessment and emission production. The production system provides insight into the biomaterial-based water treatment approach.
Life cycle impacts assessment: The impacts assessment was conducted using the CML-IA baseline method in OpenLCA. GWP100 is calculated, using Equations (2)–(9), including upstream and midstream processes, including residues collection, on-site preprocessing (size reduction and drying), on-site conversion to biomaterials, on-site reusing intermediate products (pyrolysis oil and gas) for process energy purposes (heat and electricity), and biomaterial distribution.
- Upstream emission factors and GWP for biomaterial production are calculated, using Equations (2) and (3):
USEF = ERCO2 × USEFCO2 + ERCH4 × USEFCH4 + ERN2O × USEFN2O
USGWP = MP × USEF
- Midstream emission factors and GWP for biomaterial production are calculated, using Equations (4) and (5):
MSEF = ERCO2 × MSEFCO2 + ERCH4 × MSEFCH4 + ERN2O × MSEFN2O
MSGWP = Mbc × MSEF
- Emission factors and GWP of biomaterial transportation are calculated, using Equations (6) and (7):
TREF = ERCO2 × TREFCO2 + ERCH4 × TREFCH4 + ERN2O × TREFN20
TRGWP = Mbc × TREF × D
- Emission factors and eutrophication potential of biomaterial production and application are calculated, using Equations (8) and (9):
EPEF = EPP × EPEFP + EPN2O × EPEFN2O
EP = Mbc × EPEF
Interpretation: Study evaluation from the results of life cycle inventory and life cycle impacts assessment to conduct the interpretation step is given in the Results and Discussion Section. A case study for pinewood-based biomaterial production is conducted to demonstrate the application of the proposed multi-objective impacts assessment method in the U.S. Pacific Northwest.
2.6. Sensitivity Analysis
The biomaterial pathway has various parameters that affect the environmental and economic impacts. Performing sensitivity analysis and varying certain parameters can cause a significant change in the calculated outcomes. Such analysis can provide insight associated with the cost, GHG emissions, and effects on eutrophication, as well as identify key parameters that can optimize economic and environmental performance. Key variables analyzed in this study include biomaterial production rate and phosphorus adsorption capacity.
Effects of biomaterial production rate. The abundance of forest residue and capacity of the collection process allows for a greater daily conversion capacity. Assuming a processing capacity of 50 metric tons per day for each unit, the number of portable refineries could affect the total annual biomaterial production cost and environmental emissions. The base case, along with two additional cases (case 1 and 2) were considered to examine decreased and increased production rates, particularly one biorefinery and four biorefineries which were used for case 1 and 2, respectively. The interpolated curve for biomaterials production cost plotted against the number of refineries is found to change monotonically with the number of portable refineries utilized.
Effects of phosphorus removal rate. Phosphorus adsorption capacity from fish farm effluent is one of the main points of interest in this study. Therefore, it was relevant to verify the sensitivity of removal capability and its effects on cost and eutrophication potential. The range of phosphorus adsorption provided in the results of the field experiments was used for sensitivity calculations to examine the extent of environmental and economic impacts due to adsorption amount. The base case was set to adsorb 100 μg/g with case 3 and case 4 decreasing and increasing adsorption by 50 µg/g, respectively. Varying phosphorus removal creates very slight changes on the cost side.
3. Results
A series of laboratory and field experiments were conducted to investigate the development and effectiveness of various biomaterial recipes from mixed feedstocks (e.g., hardwood, softwood, agriculture residues, and herbaceous) to remove phosphorus, nitrogen, and ammonia from polluted waters and aquaculture effluents.
3.1. Laboratory Results
The results of elemental and proximate analyses show that the biomaterials’ pH, HHV, VM, H, and C reduced, and N, S, ash, o-P, P, and SC increased after water treatment, using various biomaterials, especially lodgepole pine, sorghum, maple, and sugarcane bagasse (Table 2). Particularly, the results indicate that engineered biomaterials from different feedstocks can remove phosphorus from polluted waters, especially lodgepole pine, with the capacity of rapidly adsorbing up to 131 times the initial P concentration found in the untreated biomaterial. These results were obtained utilizing a 1% phosphorous solution prepared by using a commercial phosphorous fertilizer.
3.2. Field Results
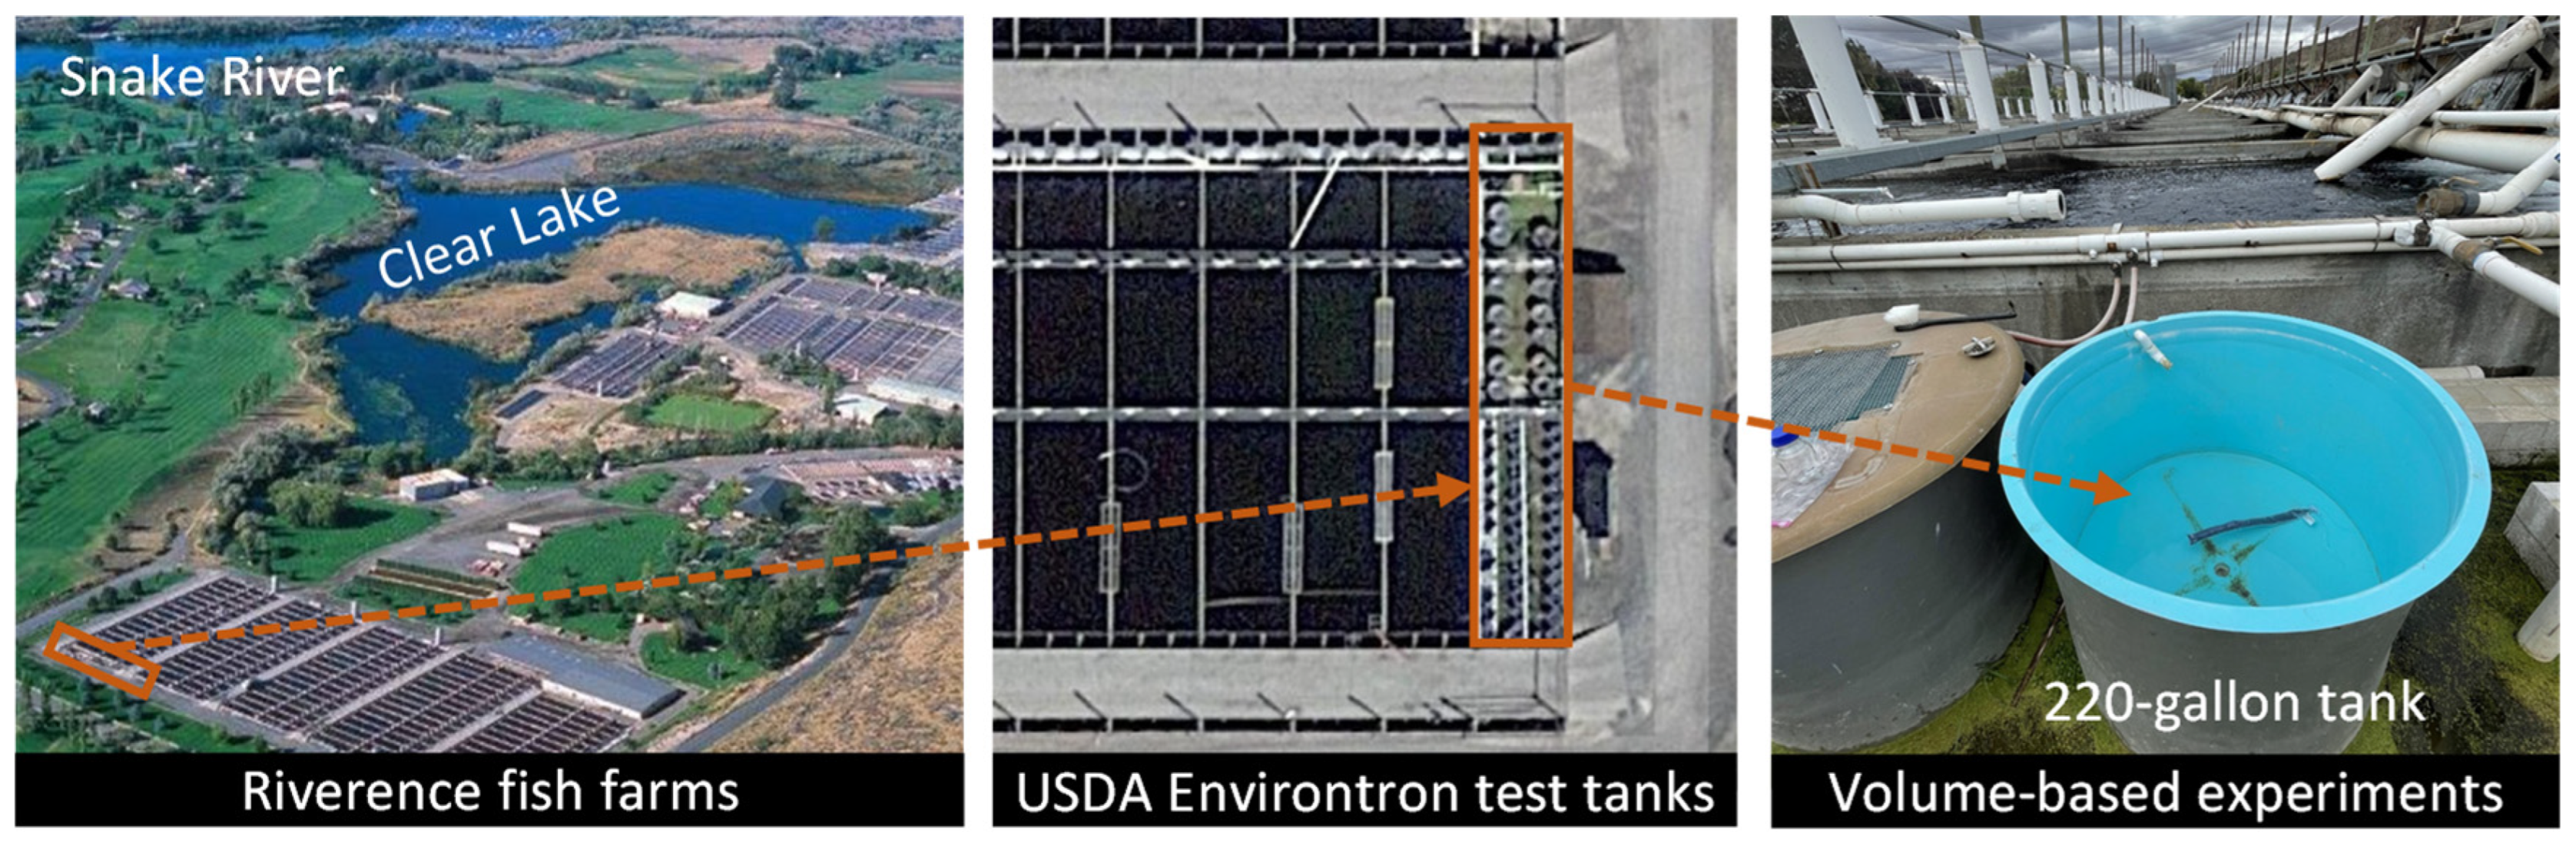
We conducted field experiments in the USDA-ARS tank facility located on a production farm (situated within the Snake River canyon, approximately 16 miles west of Twin Falls) in the Magic Valley, which is the home of over 60 fish farms, producing up to around 41 million pounds per year (75%) of the nation’s commercial rainbow trout, depending upon how many farms are operating each year (Figure 5). The large aquaculture industry in the Magic Valley depends upon two factors: freshwater supply and a temperature range favorable to the rearing of rainbow trout (54–65 °F) [43]. These conditions are met by the Snake River aquifer’s outflow, also known as “Thousand Springs”, which serves as the water source for most farms. These farms significantly impact the surrounding community and the entire Southern Idaho region, currently estimated at more than USD 150 million annually. Employment is presently estimated at over 800 people, with most being low-skilled jobs [2]. Any item that reduces production and eliminates jobs will profoundly affect the economic viability of the area. Field experiments were performed using 220-gallon testing tanks for volume-based experiments. The testing tanks were already designed and built by the U.S. Department of Agriculture (USDA) Agricultural Research Service (ARS) researchers for both volume-based and flow-through processes.
These experiments provide data and information about nutrient adsorption rates from aquaculture effluents, fine particles release, changes in water and biomaterials pH and temperature, and any environmental effects on downstream waters. The field experiment is based on a functioning serial multi-passage aquaculture facility, and has access to production water that varies significantly in water quality, specifically in regard to phosphorus, nitrogen, and ammonia (untreated water results are provided in Table 3).
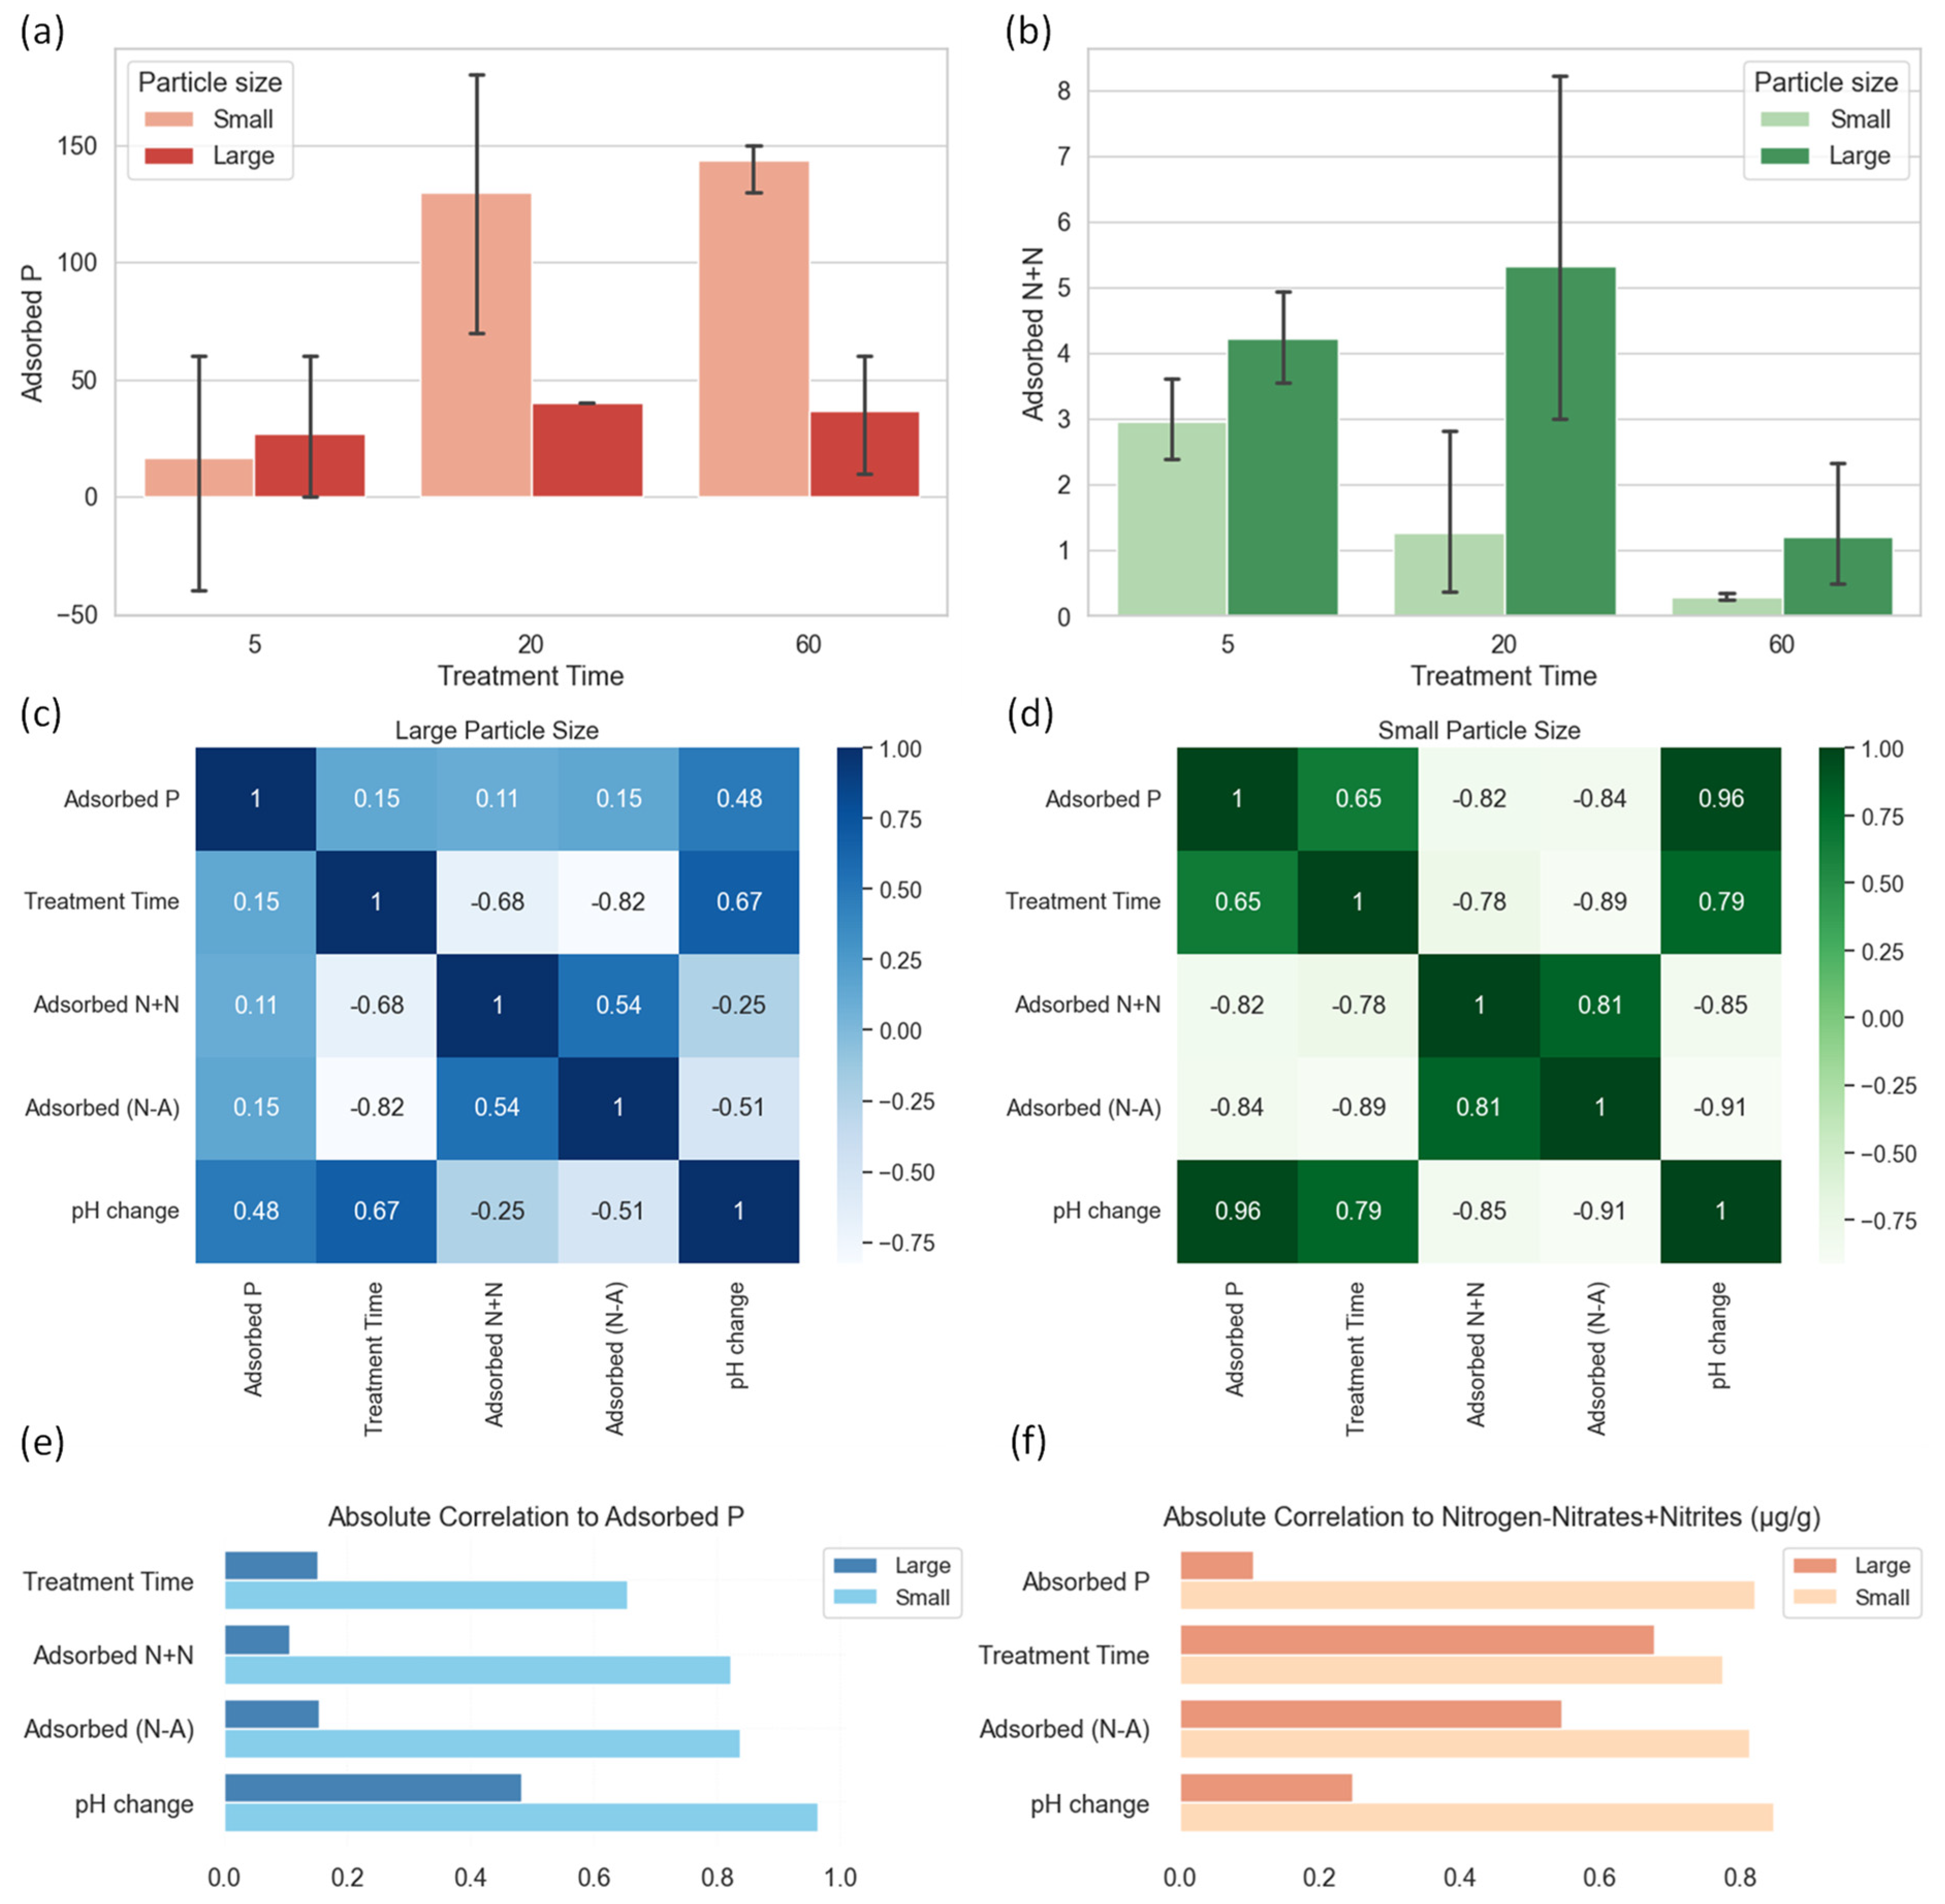
For volume-based experiments, we used different biomaterials and water filter bags, and analyzed the total phosphorus, nitrate, ammonia, and pH of the water and biomaterials before and after treatment. Each experiment was repeated three times to ascertain the repeatability and identify the key factors (e.g., porosity vs. adsorption rate and nutrient removal vs. retention time, and adsorbent material depth vs. holding capacity). Figure 6 presents the results of our field experiments, using lodgepole pine-based biomaterial samples in aquaculture facilities in Buhl, Idaho. We used small and large particle sizes for 5, 20, and 60 min of water treatment in these experiments. The results show that the smaller particle size biomass is more effective at removing phosphorus from the downstream water, the details of which are provided in Table 4. At a low residence time, one of the samples for both large and small particle sizes was shown to release phosphorus instead of adsorbing it, skewing the variations. A larger sample size would be required to prove whether the phosphorus-releasing samples are outliers or whether a low residence time (5 min) is too short of a time frame to have significant adsorption. Additionally, there appears to be a point of saturation, possibly after the 20 min residence time, as 60 and 20 min samples have a similar adsorbed phosphorus capacity. It is worth noting that the 5, 20, and 60 min time intervals were initially chosen arbitrarily with the assumption that they would bracket the max adsorption rate; if not, then future tests would need to extend the time of the tests, determine the time for maximum adsorption and the point at which adsorption was no longer viable. More experiments at time intervals between 5 and 20 min would be necessary to conclude the optimal removal time.
3.3. Techno-Economic Results
The proposed techno-economic assessment study would utilize 32,800 metric tons of pinewood and produce 13,120 metric tons of engineered biomaterials over a one-year time horizon. The results indicated that the total cost (accounting for capital and variable costs) for the base case study with a total processing capacity of 100 metric tons of ground, dry forest residue per day is estimated to be USD 2,617,787 per year (case study assumptions are provided in Methods). The price per metric ton of biomaterials was calculated to be USD 228. The capital and operational costs of each pathway process are provided in Table 5. Approximately 77% of the total cost is due to operating costs, with drying and grinding contributing the most.
3.4. Environmental Impact Results
Life cycle assessment (LCA) was performed for the conversion of pinewood into biomaterials, using the portable pyrolysis refinery unit to delve into sustainable approaches across the lignocellulosic biomass life cycle. The bulk of GHG emissions (excluding water vapor) is attributed to CO2 (>99% of GHGs) produced by the pyrolysis unit. Total pathway emissions are provided in Table 6.
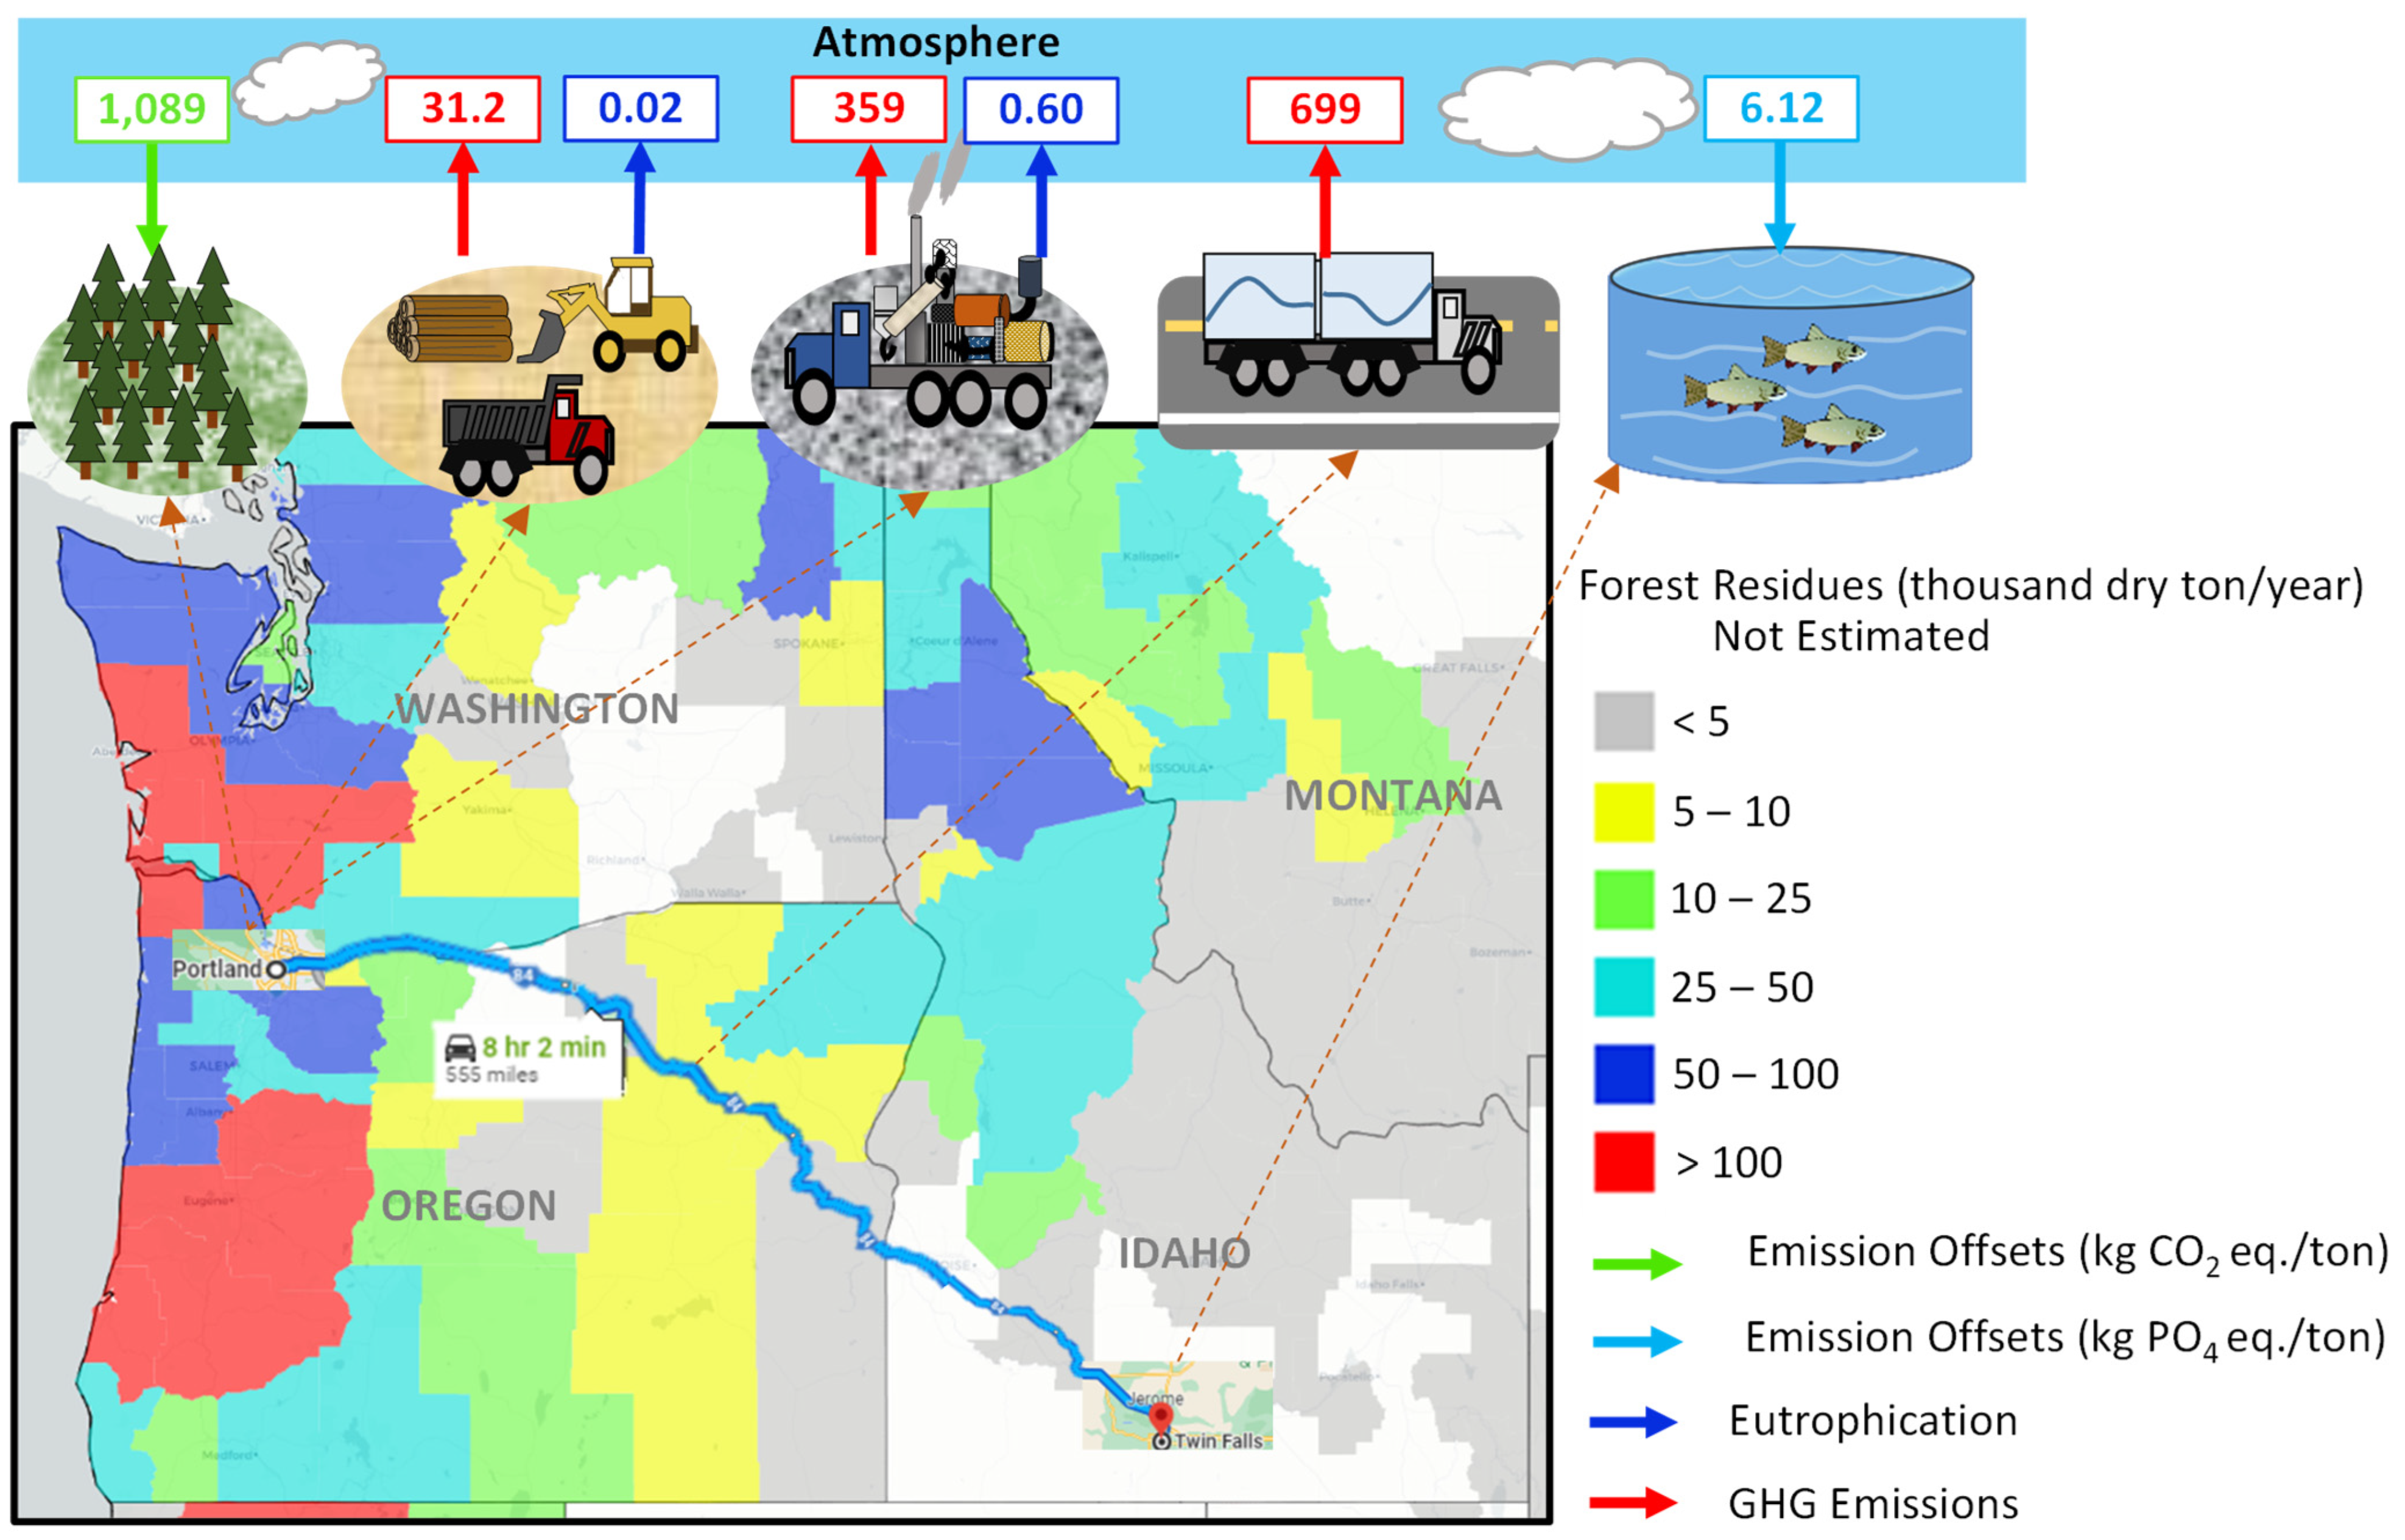
Analyzing the conversion process, the major contributing factors to environmental impact are the combustion of diesel for heating the dryer and pyrolysis unit and powering the machinery (e.g., grinder, dryer, and transportation). The water vapor is generated during the drying process and pyrolysis gas emissions. Based on the LCA study, GWP, human toxicity, and acidification are the main environmental concerns, which could result in adverse climate change, detriment to respiratory health, and danger to aquatic life. An analysis of process impacts proves that transportation was the greatest contributor to GWP, producing roughly 64% of the emissions, followed by preprocessing and pyrolysis with 25% and 8.3% contributions, respectively. The most effective GWP mitigation strategy would be to utilize a forest residue provider closer to the fish farm location. According to the LCA results, the proposed conversion pathway emits 54.5 kg CO2 eq. to produce and use one metric ton of biomaterials. Other affected impact categories for one metric ton of biomaterial are human toxicity as 0.29 kg 1,4-dichlorobenzene eq., acidification as 0.12 kg SO2 eq., and eutrophication as −0.28 kg PO4 eq (Figure 7).
Table 7 presents the environmental impacts of processing 50 metric tons of dry pinewood per day. The results show that the proposed method can reduce the eutrophication potential by approximately 5.5 kg PO4eq./ton. If 1 kg of PO4eq is equivalent to a reduction of 2.75 kg of NOxeq.; a 5 kg PO4eq. per ton reduction is around 15.13 kg NOxeq/ton, and for a 100-yeat time horizon, 1 kg of NOx emissions is equivalent to 298 kg of CO2 emissions. Therefore, a 15.13 kg NOxeq/ton reduction is around 4511.75 kg CO2eq/ton mitigation, since this process releases 1089 kg CO2eq/ton. The total mitigation is around 3422 kg CO2eq/ton. To calculate the carbon credits, if the value is USD 10 per ton of CO2 eq. and 1 carbon credit per ton of CO2 eq reduction, the estimated carbon credit is approximately 3.4 credits per ton.
3.5. Sensitivity Analysis Results
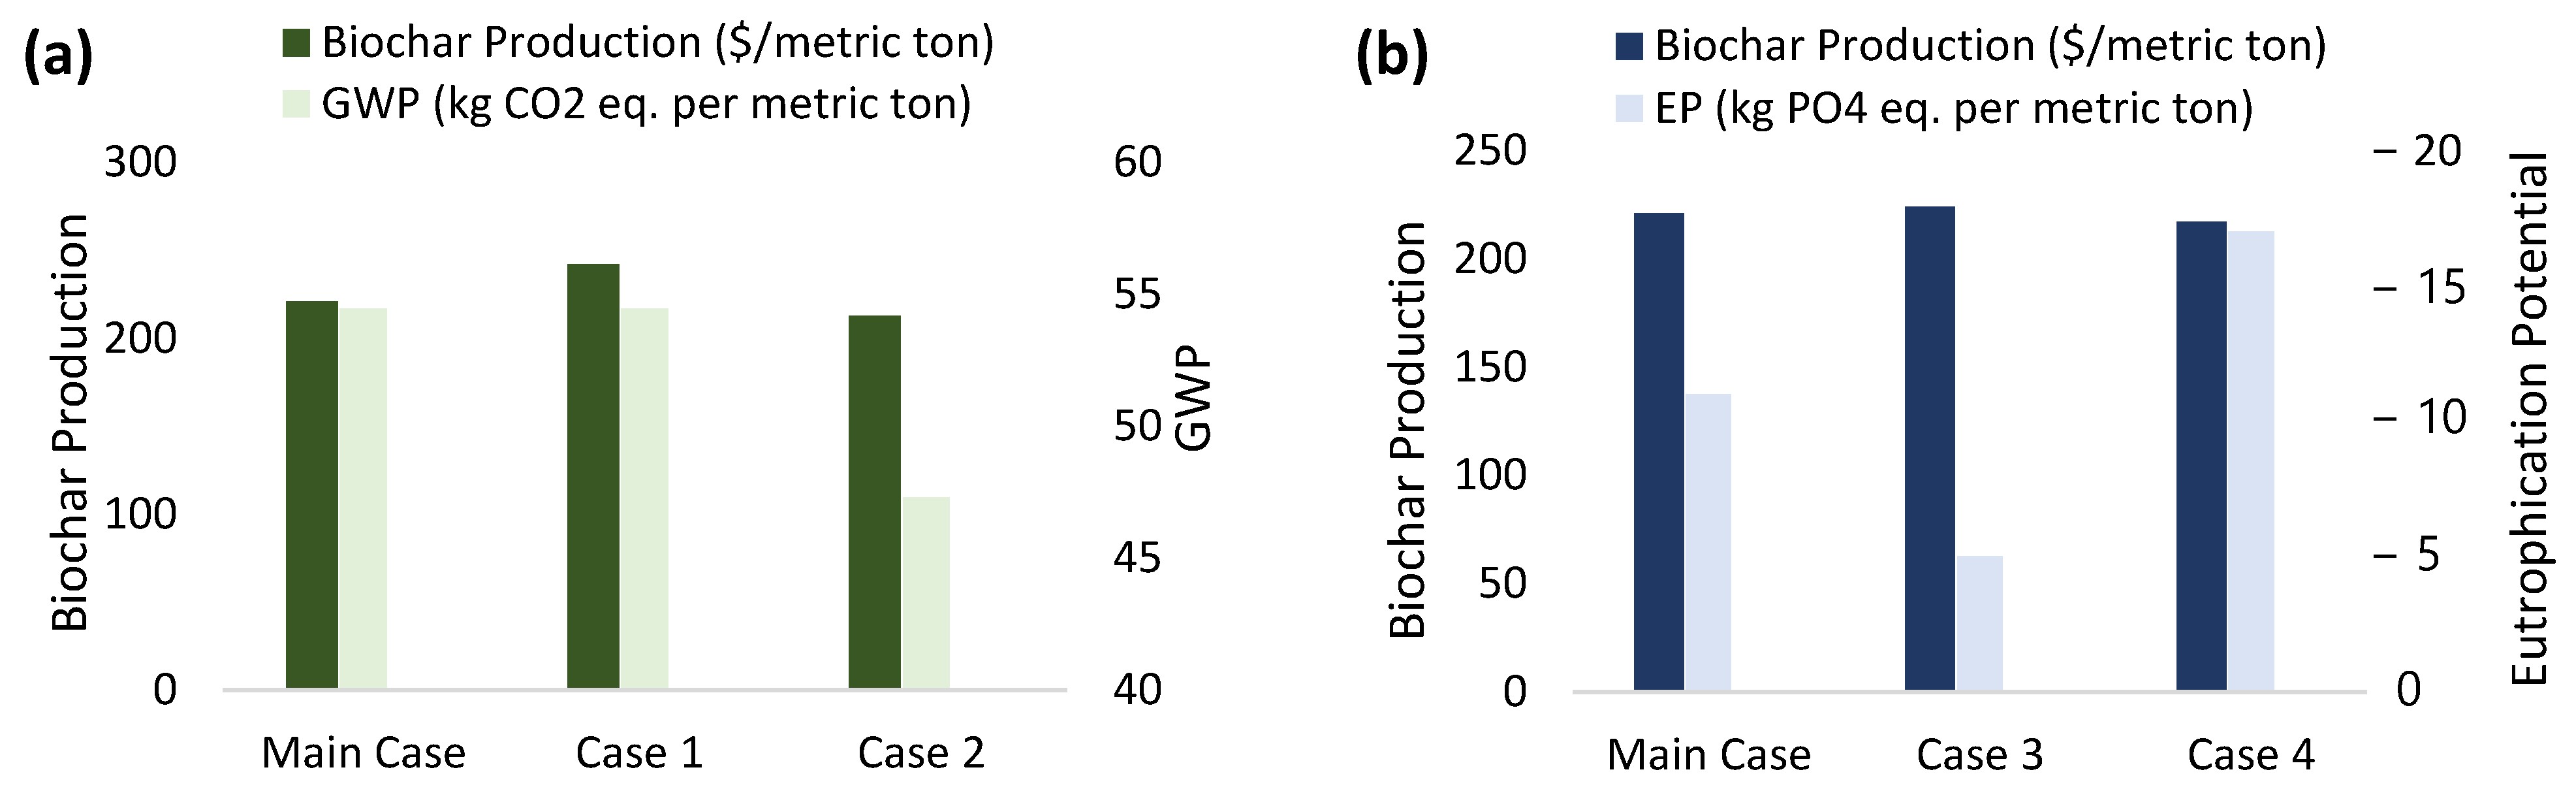
Biomaterial production cost per metric ton increased by around 10% in case 1 (using one biorefinery unit) and decreased by about 4% in case 2 (using four biorefineries) compared to the base case (using two biorefineries). Case 2 produces the largest amount of biomaterial for the lowest cost. This can be attributed to the decreased cost in transportation expenses due to the optimal use of freight capacity. GWP100 shows no change in case 1 and decreases of 7.2 kg CO2 eq. per metric ton of biomaterial (13%) in case 2 compared to the base case (Figure 8a). The base case and case 1 differ linearly in GWP per metric ton of biomaterial produced, while case 2 exhibits a significant decrease. The change in environmental impacts can also be attributed to the transportation process. Transportation is the largest environmental impact driver, and a decrease in emission is found when optimizing freight loads. While adsorption affects the environmental cost of eutrophic water, the amount removed shows a negligible difference in the production pathway costs, with a 1% increase in case 3 (adsorb 50 μg/g) and a 2% decrease in case 4 (adsorb 150 μg/g) compared to the base case (adsorb 100 μg/g). As the amount of adsorption capacity was varied linearly, the eutrophication potential across all three cases also follows a linear pattern, increasing and decreasing by 55% (Figure 8b).
4. Discussion
4.1. Multi-Objective Impacts Assessment
This study aims to improve water quality and the performance of the growing Idaho aquaculture industry, using a multi-objective impacts assessment method. Idaho annually produces from 70 to 75% of the nation’s rainbow trout, a majority of which comes from fish farms in the Hagerman area of southcentral Idaho [2]. High production has caused a major eutrophication problem in the Snake River’s downstream reach, which passes through the Treasure valley, the state’s most highly populated area [45]. A sustainability assessment is used to identify primary causes that influence the cost and environmental impacts, driving fish production away from being sustainable. The major environmental impacts that are concluded on in this study comprise GWP (100 years), eutrophication, human toxicity, and acidification. Similar to earlier studies [11,14], the results of this study will be useful in understanding the environmental impacts of the biomaterial-based water treatment system, and ultimately in establishing future policies for optimizing the outcome of subsequent systems. Emissions produced from the thermal decomposition of biomass feedstocks are considered biogenic (part of nature from natural sources) [46]. Techno-economic modeling and environmental impact assessment are two key components in developing a sustainable pathway evaluation procedure for multi-objective impacts assessment to explore biomaterial production and applications [32]. The results of this study indicate the individual and collective factors affecting the economic and environmental aspects.
Biomaterials production for the purpose of harmful nutrients adsorption could potentially address several sustainability challenges, such as reducing aquaculture pollutants [19], providing renewable water treatment options, and allowing for continuous fish farm operation without severe cost repercussions [18]. This study focuses on using pyrolysis as a conversion technology pathway to convert pinewood residues into engineered biomaterials. Due to the lack of prior studies that analyze the sustainability of renewable eutrophic water nutrient removal and address the multiple facets of sustainability, the recommended evaluation procedure for multi-objective impacts assessment is much needed for managers and policy-makers.
4.2. Sustainable Conversion Pathway
This study combines technological characteristics of biomaterial production and application with sustainability notions to tackle commercialization challenges by exploring the environmental and economic feasibility, using a portable biomass conversion process. This study shows that the conversion pathway and biomaterial application can reduce the production cost and environmental impacts of eutrophic water and enhance sustainability benefits across biomass-to-biomaterial supply chains. Motivation is provided on the need for efficient biomass conversion processes and portable refineries to address collection and transportation challenges, as well as on the downstream challenges of meeting aquacultural nutrient concentration limits and sustainability. The developed decision-making approach employs assessments to support and scale-up sustainable biomaterial production and eutrophic water remediation. These challenges are faced on a global scale, and these results can provide support to other regions, addressing the negative impacts of eutrophication [47].
4.3. Biomaterial Evaluation
We examined a wide range of biomaterial recipes produced from individual and mixed feedstocks, using mixed slow and fast pyrolysis production processes for the removal of harmful micronutrients from aquaculture discharges. Furthermore, we explored different production parameters (e.g., temperature range, heating rate, and residence time) and biomaterial properties (e.g., surface area, architecture, and porosity) to find an efficient water pollution mitigation method and meet the engineering and biological needs of the aquaculture industry. It is found that the biomaterial being used does release fine particles and does not release any harmful compounds (e.g., heavy metals) that can negatively impact fish health; however, this requires further investigation.
This study focused on several aspects, but the priority was to remove water contaminants from the effluent of aquaculture facilities with engineered biomaterials to limit harmful impacts on downstream-receiving water systems. Particularly, that engineered biomaterials (especially lodgepole pinewood) have the potential to remove a significant amount of contaminants and micronutrients (e.g., phosphorus, nitrogen, and ammonia), and their removal rate is higher after 20 min for phosphorus. The initial phosphorus of lodgepole pine biomaterials before water treatment was 0.007%, and after water treatment it increased to 0.919%, which is 131 times the phosphorus adsorption rate. Lodgepole-based materials display the highest phosphorus removal rate. Other biomaterials, such as maple, sorghum, and sugarcane bagasse, display 18.6, 10.5, and 8.6 phosphorus adsorption rates, respectively. The results in Table 2 for different biomaterials from various biomass feedstocks are comparable with the latest published studies [17,18].
Furthermore, a small particle size appears to have higher phosphorus and nitrogen adsorption rate due to a larger surface area than a large particle size. Additionally, biomaterials from lodgepole pine and maple have high potential due to the high relative capture rate, retention, and level of effectiveness per mass compared to other feedstocks. Phosphorus, nitrate, and nitrite adsorption efficiency of the biomaterial increases with smaller particle sizes and longer residence times. Figure 3 shows that in the Pearson correlation coefficient matrix for the smaller particle size, phosphorus adsorption has a strong negative linear correlation to adsorbed nitrogen compounds, and a significant positive correlation with treatment time. Moreover, the adsorption of nitrites and nitrates has a strong negative correlation to both adsorbed phosphorus and treatment time regardless of particle size. Extended treatment times of the smaller-sized biomaterial favor phosphorus adsorption over nitrogen compounds, possibly allowing for a selective adsorption of nutrients of interest. Larger biomaterial particle size has a much lower adsorption capacity than small-sized biomaterials. However, with the high variance of the values over each set of data, further experimentation utilizing more samples is required to draw a proper mechanistic conclusion.
5. Conclusions
It is concluded that biomaterials can remove water contaminants (e.g., phosphorus, ammonia, and other harmful micronutrients) from aquaculture effluents. The removal rate and effectiveness of biomaterials varies, and depends on operational characteristics (e.g., feedstocks or removal methods) and containment water systems (e.g., static or flowing). Additionally, there appears to be a point of saturation, possibly before the 20 min residence time, as 60 and 20 min samples have a similar adsorbed capacity. More experiments at time intervals between 5 and 20 min would be necessary to conclude the optimal removal time. It is further concluded that the socio-economic and environmental benefits of using biomaterials for water contamination mitigation from fish farms are significant. Future exploration directions for future research include:
- Investigation of different conversion processes to produce engineered biomaterials with greater phosphorus adsorption capacity.
- Exploration of biomaterial particle size and residence times to identify the optimal adsorption of phosphorus and nitrogen compounds.
- Exploration of the effective removal method, such as vertical/horizontal screens or filter bags/sleeves.
- Exploration of whether the biomaterials used release any toxic pollutants into downstream-receiving waters from fish farms.
- Exploration of recycling used biomaterials after water treatment for soil–plant health improvement.
Supplementary Materials
The following supporting information can be downloaded at: https://www.mdpi.com/article/10.3390/pr11041029/s1, Nomenclature.
Author Contributions
W.F.R.B., E.S. and A.M. performed the laboratory experiments and conducted TEA and LCA studies; W.F.R.B., E.S., A.M. and K.O. performed the field experiments; W.F.R.B., E.S., A.M., K.O. and B.S. contributed to the conceptual development, experimental design, and data analysis, as well as wrote and reviewed the manuscript. All authors have read and agreed to the published version of the manuscript.
Funding
This research was funded by United States Geological Survey, 104b grant.
Data Availability Statement
Not applicable.
Acknowledgments
The authors wish to acknowledge the United States Geological Survey (USGS) 104b grants for funding this project. The authors also wish to acknowledge inputs and support from USDA-ARS, University of Idaho Aquaculture Research Institute (UI ARI), Riverence Provisions LLC, Idaho Water Resources Research Institute (IWRRI), especially Alan Kolok and Michael Becerra.
Conflicts of Interest
The authors declare no conflict of interest.
References
- FAO Fisheries & Aquaculture—National Aquaculture Sector Overview. Available online: http://www.fao.org/fishery/countrysector/naso_usa/en (accessed on 8 April 2020).
- University of Idaho Aquaculture Research and Extension Activities Provided by UI Extension, Twin Falls County. Available online: https://www.uidaho.edu/extension/county/twin-falls/aquaculture (accessed on 5 December 2022).
- Ahmed, M.B.; Zhou, J.L.; Ngo, H.H.; Guo, W.; Chen, M. Progress in the Preparation and Application of Modified Biochar for Improved Contaminant Removal from Water and Wastewater. Bioresour. Technol. 2016, 214, 836–851. [Google Scholar] [CrossRef] [PubMed]
- Premarathna, K.S.D.; Rajapaksha, A.U.; Sarkar, B.; Kwon, E.E.; Bhatnagar, A.; Ok, Y.S.; Vithanage, M. Biochar-Based Engineered Composites for Sorptive Decontamination of Water: A Review. Chem. Eng. J. 2019, 372, 536–550. [Google Scholar] [CrossRef]
- Rajapaksha, A.U.; Chen, S.S.; Tsang, D.C.; Zhang, M.; Vithanage, M.; Mandal, S.; Gao, B.; Bolan, N.S.; Ok, Y.S. Engineered/Designer Biochar for Contaminant Removal/Immobilization from Soil and Water: Potential and Implication of Biochar Modification. Chemosphere 2016, 148, 276–291. [Google Scholar] [CrossRef] [PubMed]
- Vikrant, K.; Kim, K.-H.; Ok, Y.S.; Tsang, D.C.W.; Tsang, Y.F.; Giri, B.S.; Singh, R.S. Engineered/Designer Biochar for the Removal of Phosphate in Water and Wastewater. Sci. Total Environ. 2018, 616–617, 1242–1260. [Google Scholar] [CrossRef] [PubMed]
- Zhang, F.; Wang, X.; Xionghui, J.; Ma, L. Efficient Arsenate Removal by Magnetite-Modified Water Hyacinth Biochar. Environ. Pollut. 2016, 216, 575–583. [Google Scholar] [CrossRef]
- Vu, T.M.; Doan, D.P.; Van, H.T.; Nguyen, T.V.; Vigneswaran, S.; Ngo, H.H. Removing Ammonium from Water Using Modified Corncob-Biochar. Sci. Total Environ. 2017, 579, 612–619. [Google Scholar] [CrossRef] [PubMed]
- Yoon, K.; Cho, D.-W.; Tsang, D.C.; Bolan, N.; Rinklebe, J.; Song, H. Fabrication of Engineered Biochar from Paper Mill Sludge and Its Application into Removal of Arsenic and Cadmium in Acidic Water. Bioresour. Technol. 2017, 246, 69–75. [Google Scholar] [CrossRef]
- Yin, Q.; Wang, R.; Zhao, Z. Application of Mg–Al-Modified Biochar for Simultaneous Removal of Ammonium, Nitrate, and Phosphate from Eutrophic Water. J. Clean. Prod. 2018, 176, 230–240. [Google Scholar] [CrossRef]
- Novais, S.V.; Zenero, M.D.O.; Barreto, M.S.C.; Montes, C.R.; Cerri, C.E.P. Phosphorus Removal from Eutrophic Water Using Modified Biochar. Sci. Total Environ. 2018, 633, 825–835. [Google Scholar] [CrossRef]
- Chunhui, L.; Jin, T.; Puli, Z.; Bin, Z.; Duo, B.; Xuebin, L. Simultaneous Removal of Fluoride and Arsenic in Geothermal Water in Tibet Using Modified Yak Dung Biochar as an Adsorbent. R. Soc. Open Sci. 2018, 5, 181266. [Google Scholar] [CrossRef] [Green Version]
- Zhou, X.; Zhou, J.; Liu, Y.; Guo, J.; Ren, J.; Zhou, F. Preparation of Iminodiacetic Acid-Modified Magnetic Biochar by Carbonization, Magnetization and Functional Modification for Cd (II) Removal in Water. Fuel 2018, 233, 469–479. [Google Scholar] [CrossRef]
- Yin, Q.; Liu, M.; Ren, H. Removal of Ammonium and Phosphate from Water by Mg-Modified Biochar: Influence of Mg Pretreatment and Pyrolysis Temperature. BioResources 2019, 14, 6203–6218. [Google Scholar] [CrossRef]
- Sarkar, A.; Ranjan, A.; Paul, B. Synthesis, Characterization and Application of Surface-Modified Biochar Synthesized from Rice Husk, an Agro-Industrial Waste for the Removal of Hexavalent Chromium from Drinking Water at near-Neutral PH. Clean Technol. Environ. Policy 2019, 21, 447–462. [Google Scholar] [CrossRef]
- Jang, H.M.; Kan, E. Engineered Biochar from Agricultural Waste for Removal of Tetracycline in Water. Bioresour. Technol. 2019, 284, 437–447. [Google Scholar] [CrossRef] [PubMed]
- Shao, Y.; Zhong, H.; Mao, X.; Zhang, H. Biochar-Immobilized Sphingomonas Sp. and Acinetobacter Sp. Isolates to Enhance Nutrient Removal: Potential Application in Crab Aquaculture. Aquac. Environ. Interact. 2020, 12, 251–262. [Google Scholar] [CrossRef]
- Lin, J.-C.; Cheng, A.-C.; Shiu, Y.-L.; Wong, Y.-C.; Yeh, S.-P.; Simangunsong, T.; Liu, C.-H. Using the Biochar Produced from Spend Mushroom Substrate to Improve the Environmental Condition of Aquaculture Pond. Aquac. Res. 2021, 52, 3532–3539. [Google Scholar] [CrossRef]
- Silva, C.P.; Pereira, D.; Calisto, V.; Martins, M.A.; Otero, M.; Esteves, V.I.; Lima, D.L. Biochar-TiO2 Magnetic Nanocomposites for Photocatalytic Solar-Driven Removal of Antibiotics from Aquaculture Effluents. J. Environ. Manag. 2021, 294, 112937. [Google Scholar] [CrossRef]
- Zhang, X.; Lu, J.; Zhang, G.; Cui, D. Biochar Prepared by Fish Feces Residue: Properties and Its Application for Removing Antibiotics in Aquaculture Tail Water. DWT 2022, 280, 290–296. [Google Scholar] [CrossRef]
- Hung, C.-M.; Chen, C.-W.; Huang, C.-P.; Dong, C.-D. N-Doped Metal-Free Biochar Activation of Peroxymonosulfate for Enhancing the Degradation of Antibiotics Sulfadiazine from Aquaculture Water and Its Associated Bacterial Community Composition. J. Environ. Chem. Eng. 2022, 10, 107172. [Google Scholar] [CrossRef]
- Malmaeus, J.M.; Karlsson, O.M. Estimating Costs and Potentials of Different Methods to Reduce the Swedish Phosphorus Load from Agriculture to Surface Water. Sci. Total Environ. 2010, 408, 473–479. [Google Scholar] [CrossRef]
- Bunce, J.T.; Ndam, E.; Ofiteru, I.D.; Moore, A.; Graham, D.W. A Review of Phosphorus Removal Technologies and Their Applicability to Small-Scale Domestic Wastewater Treatment Systems. Front. Environ. Sci. 2018, 6, 8. [Google Scholar] [CrossRef] [Green Version]
- Mahmoud, M.E.; Nabil, G.M.; El-Mallah, N.M.; Bassiouny, H.I.; Kumar, S.; Abdel-Fattah, T.M. Kinetics, Isotherm, and Thermodynamic Studies of the Adsorption of Reactive Red 195 A Dye from Water by Modified Switchgrass Biochar Adsorbent. J. Ind. Eng. Chem. 2016, 37, 156–167. [Google Scholar] [CrossRef]
- Sano, D.; Hodges, A.; Degner, R. Economic Analysis of Water Treatments for Phosphorus Removal in Florida. IFAS. 2005. Available online: https://www.hydromentia.com/wp-content/uploads/2015/06/2005_Sano-et-al-Economic-Analysis-of-Water-Treatment.pdf (accessed on 13 January 2023).
- Molinos-Senante, M.; Hernández-Sancho, F.; Sala-Garrido, R.; Garrido-Baserba, M. Economic Feasibility Study for Phosphorus Recovery Processes. AMBIO 2011, 40, 408–416. [Google Scholar] [CrossRef] [PubMed] [Green Version]
- Coats, E.R.; Watkins, D.L.; Kranenburg, D. A Comparative Environmental Life-Cycle Analysis for Removing Phosphorus from Wastewater: Biological versus Physical/Chemical Processes. Water Environ. Res. 2011, 83, 750–760. [Google Scholar] [CrossRef] [Green Version]
- Remy, C.; Miehe, U.; Lesjean, B.; Bartholomäus, C. Comparing Environmental Impacts of Tertiary Wastewater Treatment Technologies for Advanced Phosphorus Removal and Disinfection with Life Cycle Assessment. Water Sci. Technol. 2014, 69, 1742–1750. [Google Scholar] [CrossRef]
- Brinker, R.W.; Miller, D.; Stokes, B.J.; Lanford, B.L. Machine Rates for Selected Forest Harvesting Machines. Circular 296 (revised). Ala. Agric. Exp. Stn. Auburn Univ. 2002, 1, 1–22. [Google Scholar]
- U.S. Bureau of Labor Statistics. Producer Price Index by Commodity for Machinery and Equipment: Engineering and Scientific Instruments. Available online: https://fred.stlouisfed.org/series/WPU1185 (accessed on 7 November 2019).
- Mirkouei, A.; Haapala, K.R. A Network Model to Optimize Upstream and Midstream Biomass-to-Bioenergy Supply Chain Costs. In Proceedings of the ASME 2015 International Manufacturing Science and Engineering Conference (MSEC), MSEC2015-9355; 2015. Available online: https://asmedigitalcollection.asme.org/MSEC/proceedings-abstract/MSEC2015/V002T05A011/268050 (accessed on 13 January 2023).
- Struhs, E.; Mirkouei, A.; You, Y.; Mohajeri, A. Techno-Economic and Environmental Assessments for Nutrient-Rich Biochar Production from Cattle Manure: A Case Study in Idaho, USA. Appl. Energy 2020, 279, 115782. [Google Scholar] [CrossRef]
- Hansen, S.B.; Mirkouei, A.; Xian, M. Cyber-Physical Control and Optimization for Biofuel 4.0. 2019. Available online: https://www.proquest.com/openview/f554511a920356a3e93703a42c72ebd8/1?pq-origsite=gscholar&cbl=51908 (accessed on 13 January 2023).
- Zamora-Cristales, R.; Sessions, J.; Murphy, G.; Boston, K. Economic Impact of Truck–Machine Interference in Forest Biomass Recovery Operations on Steep Terrain. For. Prod. J. 2013, 63, 162–173. [Google Scholar] [CrossRef]
- Anderson, N.; Chung, W.; Loeffler, D.; Jones, J.G. A Productivity and Cost Comparison of Two Systems for Producing Biomass Fuel from Roadside Forest Treatment Residues. For. Prod. J. 2012, 62, 222–233. [Google Scholar] [CrossRef] [Green Version]
- Mirkouei, A. Techno-Economic Optimization and Environmental Impact Analysis for a Mixed-Mode Upstream and Midstream Forest Biomass to Bio-Products Supply Chain, Oregon State University. 2016. Available online: https://ir.library.oregonstate.edu/concern/graduate_thesis_or_dissertations/cc08hm25d (accessed on 13 January 2023).
- Thompson, M.A.; Mohajeri, A.; Mirkouei, A. Comparison of Pyrolysis and Hydrolysis Processes for Furfural Production from Sugar Beet Pulp: A Case Study in Southern Idaho, USA. J. Cleaner Prod. 2021, 311, 127695. [Google Scholar] [CrossRef]
- Mirkouei, A.; Haapala, K.R.; Sessions, J.; Murthy, G.S. A Review and Future Directions in Techno-Economic Modeling and Optimization of Upstream Forest Biomass to Bio-Oil Supply Chains. Renew. Sustain. Energy Rev. 2017, 67, 15–35. [Google Scholar] [CrossRef]
- Rigdon, A.R.; Jumpponen, A.; Vadlani, P.V.; Maier, D.E. Impact of Various Storage Conditions on Enzymatic Activity, Biomass Components and Conversion to Ethanol Yields from Sorghum Biomass Used as a Bioenergy Crop. Bioresour. Technol. 2013, 132, 269–275. [Google Scholar] [CrossRef] [PubMed] [Green Version]
- Mirkouei, A.; Kardel, K. Enhance Sustainability Benefits Through Scaling-up Bioenergy Production from Terrestrial and Algae Feedstocks. In Proceedings of the International Design Engineering Technical Conferences and Computers and Information in Engineering Conference, Cleveland, OH, USA, 6–9 August 2017. [Google Scholar] [CrossRef]
- Forster, P.; Ramaswamy, V.; Artaxo, P.; Berntsen, T.; Betts, R.; Fahey, D.W.; Haywood, J.; Lean, J.; Lowe, D.C.; Myhre, G.; et al. Changes in Atmospheric Constituents and in Radiative Forcing; Solomon, S., Qin, D., Eds.; Cambridge University Press: Cambridge, UK; New York, NY, USA, 2007; Chapter 2, Climate Change; The Physical Science Basis. [Google Scholar]
- OpenLCA The Source for LCA Datasets. Available online: https://nexus.openlca.org/database/Agribalyse (accessed on 25 November 2019).
- Adams, P.; James, C. Rainbow Trout (Oncorhynchus Mykiss) Species and Conservation Assessment. 2008; Volume 1, pp. 1–25. Available online: https://www.fs.usda.gov/Internet/FSE_DOCUMENTS/stelprdb5206802.pdf (accessed on 13 January 2023).
- U.S. Department of Energy, National Renewable Energy Laboratory. The Biofuels Atlas. Available online: https://www.nrel.gov/docs/fy11osti/50689.pdf (accessed on 13 January 2023).
- United States Environmental Protection Agency. Middle Snake River, Idaho. Available online: https://cfpub.epa.gov/ncea/risk/era/recordisplay.cfm?deid=15222 (accessed on 13 January 2023).
- United States Environmental Protection Agency. Biogenic Emission Sources. Available online: https://www.epa.gov/air-emissions-modeling/biogenic-emission-sources (accessed on 13 January 2023).
- United States Environmental Protection Agency. EPA’s Efforts to Reduce Nutrient Pollution. Available online: https://www.epa.gov/nutrient-policy-data/epas-efforts-reduce-nutrient-pollution (accessed on 11 January 2023).
Figure 1.
Aquaculture regions in Idaho and fish farm facilities in Magic Valley, Southern Idaho.

Figure 2.
Mixed fast and slow pyrolysis process.

Figure 3.
Engineered biomaterials for field experiments and their microscope images.

Figure 5.
Field experiments, using USDA-ARS testing tanks at Riverence fish farm.

Figure 6.
Analyses of field experiment results: Nitrate-N + Nitrite-N (N+N); Nitrogen-Ammonium (N-A); (a) adsorption of P and (b) adsorption of N+N over the treatment times and particle size; matrix of the Pearson correlation coefficient between each variable for (c) large particle and (d) small particle biomaterial adsorption trend of P and N+N, respectively; (e) absolute values of Pearson coefficients related to P adsorption; and (f) absolute values of Pearson coefficients related to N+N adsorption (figure generated by Python programming language).

Figure 7.
Schematic of emissions cycle, using biomaterials for phosphorus and nitrogen adsorption from downstream fish farm waters, maps from NREL Biofuels Atlas (public domain) [44].
Figure 7.
Schematic of emissions cycle, using biomaterials for phosphorus and nitrogen adsorption from downstream fish farm waters, maps from NREL Biofuels Atlas (public domain) [44].

Figure 8.
Sensitivity analysis: (a) effects of biomaterial production rate; (b) effects of phosphorus removal capacity on environmental and economic impact; (base case) two biorefineries and adsorption rate 100 μg/g; (case 1) one biorefinery; (case 2) two biorefineries; (case 3) adsorption rate 50 μg/g; (case 4) adsorption rate 150 μg/g.


Table 1.
A summary of recent conducted studies, using engineered biomaterials for water treatment.
| Study | Source | Year | Ref |
|---|---|---|---|
| Remove arsenate by magnetite-modified biochar | Invasive species | 2016 | [7] |
| Remove ammonium from water using modified biochar | Corncob | 2017 | [8] |
| Remove arsenic and cadmium in acidic water by modified biochar | Papermill sludge | 2017 | [9] |
| Remove ammonium, nitrate, and phosphate from water by modified biochar | Soybean straw | 2018 | [10] |
| Remove phosphorus from eutrophic water using modified biochar | Sugarcane straw | 2018 | [11] |
| Remove fluoride and arsenic in geothermal water by modified biochar | Yak dung | 2018 | [12] |
| Remove Cd (II) in water by acid-modified magnetic biochar | Palm fiber | 2018 | [13] |
| Remove ammonium and phosphate from water by Mg-modified biochar | Poplar chips | 2019 | [14] |
| Remove hexavalent chromium from drinking water by surface-modified biochar | Rice husk | 2019 | [15] |
| Remove tetracycline in water by engineered biochar | Alfalfa hays | 2019 | [16] |
| Enhance nutrient removal from crab aquaculture by biochar | Maize straw | 2020 | [17] |
| Improve the environmental condition of aquaculture ponds by biochar | Mushroom | 2021 | [18] |
| Remove antibiotics from aquaculture effluents by magnetite-modified biochar | Waste-based | 2021 | [19] |
| Remove antibiotics in aquaculture tail water by biochar | Fish feces residue | 2022 | [20] |
| Remove antibiotics sulfadiazine from aquaculture water by biochar | Coconut shell | 2022 | [21] |
Table 2.
Results of biomaterial elemental and proximate analyses before and after laboratory water treatment experiments.
Table 2.
Results of biomaterial elemental and proximate analyses before and after laboratory water treatment experiments.
| Experiment | LOD | C | H | N | O | S | Ash | VM | FC | HHV | o-P | P | SC | pH | PR * |
|---|---|---|---|---|---|---|---|---|---|---|---|---|---|---|---|
| % | BTU/lb. | % | uS/cm | ||||||||||||
| Lodgepole Pine BT * | 1.7 | 57 | 5.5 | 0.1 | 37 | 0.02 | 1.3 | 71 | 28 | 9303 | 0.03 | 0.007 | 111 | 5.5 | |
| Lodgepole Pine AT * | 18.6 | 54 | 5.4 | 0.5 | 36 | 0.04 | 3.8 | 62 | 34 | 8943 | 2.15 | 0.919 | 345 | 4.3 | 131.3 |
| Sorghum BT | 2.0 | 55 | 4.8 | 1.1 | 28 | 0.08 | 11.0 | 54 | 35 | 9150 | 0.55 | 0.143 | 800 | 7.3 | |
| Sorghum AT | 14.5 | 53 | 4.5 | 1.5 | 27 | 0.11 | 14.0 | 52 | 34 | 8702 | 2.16 | 1.50 | 700 | 5.9 | 10.5 |
| Hybrid Poplar BT | 5.7 | 58 | 5.3 | 0.3 | 33 | 0.04 | 3.7 | 64 | 32 | 9526 | 0.13 | 0.058 | 295 | 5.2 | |
| Hybrid Poplar AT | 17.9 | 58 | 5.3 | 0.5 | 33 | 0.04 | 3.9 | 63 | 33 | 9508 | 0.96 | 0.370 | 235 | 4.8 | 6.4 |
| Sugarcane Bagasse BT | 2.8 | 47 | 4.6 | 0.3 | 32 | 0.03 | 16.7 | 61 | 23 | 7681 | 0.16 | 0.068 | 215 | 5.8 | |
| Sugarcane Bagasse AT | 43.3 | 47 | 4.7 | 0.6 | 33 | 0.04 | 15.3 | 60 | 25 | 7710 | 1.02 | 0.583 | 265 | 5.7 | 8.6 |
| Switchgrass BT | 3.7 | 54 | 4.7 | 0.7 | 29 | 0.07 | 11.1 | 55 | 34 | 8770 | 0.46 | 0.175 | 750 | 6.7 | |
| Switchgrass AT | 22.8 | 55 | 5.1 | 0.7 | 33 | 0.05 | 6.5 | 62 | 32 | 8930 | 0.79 | 0.583 | 280 | 5.4 | 3.3 |
| Hybrid Poplar BT | 4.1 | 60 | 5.0 | 0.2 | 32 | 0.02 | 2.6 | 61 | 37 | 9902 | 0.13 | 0.075 | 270 | 6.0 | |
| Hybrid Poplar AT | 56.8 | 57 | 5.2 | 0.5 | 33 | 0.03 | 3.9 | 64 | 32 | 9487 | 0.53 | 0.355 | 215 | 5.1 | 4.7 |
| Maple BT | 1.5 | 51 | 5.9 | 0.1 | 42 | 0.01 | 0.7 | 80 | 19 | 8208 | 0.02 | 0.027 | 105 | 5.3 | |
| Maple AT | 1.3 | 50 | 5.8 | 0.3 | 42 | 0.02 | 2.0 | 74 | 24 | 8021 | 1.08 | 0.502 | 245 | 4.5 | 18.6 |
* Before treatment (BT); After treatment (AT); Loss on drying (LOD); Carbon (C); Hydrogen (H); Nitrogen (N); Oxygen (O); Sulfur (S); Volatile matter (VM); Fixed carbon (FC); Higher heating value (HHV); o-Phosphate (o-P); Phosphorus (P); Specific conductivity (SC); Phosphorus removal (PR).
Table 3.
Results of fish farm water analyses before field water treatment experiments.
| Experiments | Nitrate-N + Nitrite-N (mg/L) | Ammonia–N (mg/L) | Total Phosphorus (mg/L) | pH |
|---|---|---|---|---|
| Untreated Water, sample 1 | 4.1 | 0.29 | 0.12 | 7.66 |
| Untreated Water, sample 2 | 4.5 | 0.25 | 0.11 | 7.67 |
| Untreated Water, sample 3 | 4.0 | 0.28 | 0.11 | 7.61 |
Reporting limit: 0.1 mg/L.
Table 4.
Results of biomaterial analyses after field water treatment experiments.
| Experiments | Particle Size | Treatment Time (min) | Adsorbed N + N (µg/g) | Adsorbed (N-A) (µg/g) | Adsorbed P (µg/g) | pH Change |
|---|---|---|---|---|---|---|
| TB 1 | Small | 5 | 2.89 | 0.02 | 60 | 0 |
| TB 2 | Small | 5 | 2.40 | 0.29 | −40 | −0.7 |
| TB 3 | Small | 5 | 3.61 | 0.27 | 30 | 0.1 |
| TB 4 | Small | 20 | 2.82 | −0.37 | 70 | 0.5 |
| TB 5 | Small | 20 | 0.63 | −0.29 | 140 | 1.1 |
| TB 6 | Small | 20 | 0.38 | −0.36 | 180 | 1.3 |
| TB 7 | Small | 60 | 0.24 | −0.72 | 150 | 1.4 |
| TB 8 | Small | 60 | 0.30 | −0.67 | 130 | 1.4 |
| TB 9 | Small | 60 | 0.36 | −0.57 | 150 | 1.3 |
| TB 1 | Large | 5 | 3.55 | −0.90 | 20 | 0.6 |
| TB 2 | Large | 5 | 4.21 | −1.27 | 0 | 1.3 |
| TB 3 | Large | 5 | 4.95 | −0.89 | 60 | 1.8 |
| TB 4 | Large | 20 | 8.23 | −1.10 | 40 | 2.6 |
| TB 5 | Large | 20 | 4.77 | −1.12 | 40 | 2.7 |
| TB 6 | Large | 20 | 3.00 | −1.03 | 40 | 3.1 |
| TB 7 | Large | 60 | 2.34 | −1.40 | 40 | 2.7 |
| TB 8 | Large | 60 | 0.82 | −1.40 | 60 | 3.2 |
| TB 9 | Large | 60 | 0.49 | −1.34 | 10 | 2.7 |
Treated biomaterial (TB); Nitrate-N + Nitrite-N (N+N); Nitrogen-Ammonium (N-A); Adsorbed Phosphorus (AP).
Table 5.
Capital and operational costs, and annual utilization rate of each process.
| Process | Capital (USD/yr) | Variable (USD/yr) | Annual Utilization Rate (Metric ton/yr) |
|---|---|---|---|
| Collection | 84,805 | 236,827 | 60,000 |
| Grinding | 163,676 | 582,656 | 37,500 |
| Drying | 55,904 | 862,686 | 37,500 |
| Portable refinery | 242,032 | 49,536 | 16,400 |
| Biomaterials storage | 60,756 | 105,800 | 11,480 |
| Transportation | 99,840 | 345,712 | 50,000 |
| Fish farm | - | 133,720 | 11,480 |
Table 6.
Forest residue-to-water treatment total pathway emissions per day.
| Emissions | Amount (kg) |
|---|---|
| Water vapor | 98,700 |
| Nitrogen | 4140 |
| Carbon dioxide | 2940 |
| Phosphorus, total | −2.00 |
| Carbon monoxide | 2.36 |
| Nitrogen oxides | 4.75 |
| Particulates | 0.44 |
Table 7.
Life cycle impact assessment data, using CML baseline.
| Impact Category | Result | Unit |
|---|---|---|
| Acidification | 2.38 | kg SO-2 eq. |
| Eutrophication | −5.50 | kg PO4 eq. |
| Freshwater Aquatic Ecotoxicity | 0.00 | kg 1,4-dichlorobenzene eq. |
| Climate Change (GWP100) | 1089 | kg CO2 eq. |
| Human Toxicity | 5.7 | kg 1,4-dichlorobenzene eq. |
| Marine Aquatic Ecotoxicity | 0.00 | kg 1,4-dichlorobenzene eq. |
| Ozone Layer Depletion | 0.00 | kg CFC-11 eq. |
| Photochemical Oxidation | 0.06 | kg C2H4 eq. |
| Terrestrial Ecotoxicity | 0.00 | kg 1,4-dichlorobenzene eq. |
Disclaimer/Publisher’s Note: The statements, opinions and data contained in all publications are solely those of the individual author(s) and contributor(s) and not of MDPI and/or the editor(s). MDPI and/or the editor(s) disclaim responsibility for any injury to people or property resulting from any ideas, methods, instructions or products referred to in the content. |
© 2023 by the authors. Licensee MDPI, Basel, Switzerland. This article is an open access article distributed under the terms and conditions of the Creative Commons Attribution (CC BY) license (https://creativecommons.org/licenses/by/4.0/).
Share and Cite
MDPI and ACS Style
Bare, W.F.R.; Struhs, E.; Mirkouei, A.; Overturf, K.; Small, B. Engineered Biomaterials for Reducing Phosphorus and Nitrogen Levels from Downstream Water of Aquaculture Facilities. Processes 2023, 11, 1029. https://doi.org/10.3390/pr11041029
AMA Style
Bare WFR, Struhs E, Mirkouei A, Overturf K, Small B. Engineered Biomaterials for Reducing Phosphorus and Nitrogen Levels from Downstream Water of Aquaculture Facilities. Processes. 2023; 11(4):1029. https://doi.org/10.3390/pr11041029
Chicago/Turabian StyleBare, W. F. Rance, Ethan Struhs, Amin Mirkouei, Kenneth Overturf, and Brian Small. 2023. "Engineered Biomaterials for Reducing Phosphorus and Nitrogen Levels from Downstream Water of Aquaculture Facilities" Processes 11, no. 4: 1029. https://doi.org/10.3390/pr11041029
Note that from the first issue of 2016, this journal uses article numbers instead of page numbers. See further details here.