Article

In Vitro Hypoglycemic Potential, Antioxidant and Prebiotic Activity after Simulated Digestion of Combined Blueberry Pomace and Chia Seed Extracts

by
Elena Mihai
1,
Bogdan-Stefan Negreanu-Pirjol
2,*,
Oana Craciunescu
1,*,
Teodora Ciucan
1,
Andreea Iosageanu
1,
Ana-Maria Seciu-Grama
1,
Ana-Maria Prelipcean
1,
Elena Utoiu
1,
Viorica Coroiu
1,
Ana-Maria Ghenea
3 and
Ticuta Negreanu-Pirjol
2,4
1
National Institute of Research and Development for Biological Sciences, Department of Cellular and Molecular Biology, Splaiul Independentei, No. 296, 060031 Bucharest, Romania
2
Faculty of Pharmacy, “Ovidius” University of Constanta, Capitan Aviator Al. Serbanescu Street, No. 6, Campus, Corp C, 900470 Constanta, Romania
3
S.C. Santo Raphael Srl, Dimitrie Pompei Bvd., No. 3-5, 020335 Bucharest, Romania
4
Academy of Romanian Scientists, Ilfov Street, No. 3, 050044 Bucharest, Romania
*
Authors to whom correspondence should be addressed.
Processes 2023, 11(4), 1025; https://doi.org/10.3390/pr11041025
Submission received: 8 March 2023 / Revised: 18 March 2023 / Accepted: 24 March 2023 / Published: 28 March 2023
(This article belongs to the Section Pharmaceutical Processes)

Abstract

:
This study aimed to evaluate the hypoglycemic potential, antioxidant activity and prebiotic activity of a hydroalcoholic extract of blueberry pomace (BP), an aqueous extract of chia seeds (CS) and a novel combination of BP–CS extracts (BCM) for further use as ingredient of functional food. Spectrometric and HPLC analyses were used to characterize the total phenolic and flavonoid content and composition of BP, while CS was analyzed for total carbohydrate content. Data showed that the BCM mixture exerted an inhibition of α-amylase activity, which was 1.36 times higher than that of BP and 1.25 higher than CS extract. The mixture also showed better scavenging activity of free DPPH radicals than individual extracts, and had an IC50 value of 603.12 µg/mL. In vitro testing indicated that both serum- and colon-reaching products of simulated intestinal digestion of BCM presented the capacity to protect Caco-2 intestinal cells against oxidative stress by inhibition of reactive oxygen species production. In addition, the colon-reaching product of BCM digestion had the capacity to significantly (p < 0.05) stimulate the growth of Lactobacillus rhamnosus and Lactobacillus acidophilus, revealing a prebiotic potential. All these results indicated that improved biological activity of the novel combination of BP and CS extracts could be due to the synergistic action of constituents. The combination is recommended for further testing and the development of novel functional food for controlling type 2 diabetes and gastrointestinal conditions.

1. Introduction

The production of berry juice yields a series of by-products, such as seeds, peel and pulp, known as pomace [1,2,3]. This waste represents 20–30% of the initial biological material and it is often used for biogas production, to feed animals, or in agriculture as compost. However, pomace of different berries (strawberry, blueberry, raspberry, blackberry, cranberry) represents an undervalued natural source of bioactive compounds, such as phenolic acids, flavonoids, anthocyanins and proanthocyanidins, which could also be valorized for the development of novel functional food with beneficial effects on human health and significant activity against inflammation and redox imbalance, along with antitumor and antimicrobial properties [4,5,6,7,8].
Previous studies have shown that the fruits of blueberry shrubs (Vaccinium myrtillus L.) have long been used as a traditional medicine for treating diabetes and various associated cardiovascular complications, and for maintaining the integrity of blood vessels [9]. This action could be attributed to the complex composition of flavonols (quercetin, myricetin), which mainly occur in glycosylated form, and phenolic acids (abscisic acid), but also to anthocyanins, which represent the major component of phenolics and are responsible for amelioration of type 2 diabetes symptoms after oral administration [10]. In addition, the polyphenolic extract of blueberries could inhibit the activity of α-glucosidase and α-amylase [11,12], thus helping to control type 2 diabetes [13] and present high antioxidant potential [14]. Oral administration of phenolics in mice resulted in several beneficial actions, such as ameliorating the effects of a high-fat diet, preventing insulin resistance by modulation of redox signaling pathways [15] and down-regulation of pro-inflammatory cytokine secretion [16]. It has been reported that their action targeted the peroxisome proliferator-activated receptor gamma (PPAR-γ), similar to thiazolidinediones used as anti-diabetic drugs [17]. Blueberries also contain cinchonain I isomers of flavonolignans, and their oral administration can increase the level of plasma insulin, similar to the action of glibenclamide [18]. Shi et al. (2017) reported that blueberry anthocyanins exerted an in vitro activity of decreasing glucose production in H4IIE hepatocytes in variable proportions between 24 and 74% [19]. No studies were found on blueberry pomace.
Recent research directions have indicated that phenolic compounds could be valorized as a new generation of prebiotics, as they stimulate probiotic growth and inhibit pathogenic bacteria in a simulated intestinal environment, interfering with the process of microbial adhesion [20,21]. A polyphenolic extract from grape seeds demonstrated in vivo prebiotic properties, stimulating the metabolism and adhesion of microbiota colonizing the gut [22]. No studies were found on the prebiotic effect of phenolics extract obtained from blueberry pomace.
Besides phenolics, grain-derived polysaccharides have shown important and beneficial actions on patients with type 2 diabetes by inhibition of α-glucosidase and α-amylase, as key digestive enzymes involved in postprandial blood sugar levels [23,24]. Previous experiments have demonstrated the in vitro antioxidant, anti-inflammatory and antidiabetic activity of chia (Salvia hispanica) seeds [25,26,27]. Moreover, chia seeds consumption could improve the function of the digestive tract by stimulating the development of beneficial microorganisms [28]. Although chia seeds contain a significant proportion of dietary fibers [29], no reports were found on polysaccharidic extracts of chia seeds.
The hypothesis of this study took into consideration the fact that ingested phenolics present low bioavailability, poor solubility and instability [30,31], and recent studies have targeted a combination of phenolics with other natural bioactive compounds, such as polysaccharides or proteins, to optimize their benefits for human health [32,33].
In this context, the present study aimed to prepare, for the first time, a mixture of blueberry pomace and chia seed extracts and to investigate its biological properties in experimental models in vitro, before and after simulated gastrointestinal digestion, in terms of α-amylase inhibition, antioxidant and prebiotic capacity, comparatively to individual extracts, in order to demonstrate that its constituents could synergistically act to improve biological activity. In addition, the study proposed valorization of blueberry pomace from Romanian production, to provide a novel source of bioactive ingredients for functional food development with potential economic benefits.

2. Materials and Methods

2.1. Materials

Blueberries (V. myrtillus L.) were harvested from the Research Institute for Fruit Growing, Pitesti, Romania, in 2020. Blueberry pomace was obtained as a by-product during juice production by S.C. Santo Raphael srl, Bucharest, Romania. Chia (Salvia hispanica L.) seeds o Argentinian origin were purchased from BioSano, Piatra Neamt, Romania.
HPLC standards of gallic acid, chlorogenic acid, caffeic acid, p-coumaric acid, ferulic acid, rutin, luteolin 7-glucoside, kaempferol 3-glucoside, myricetin, resveratrol and quercetin were acquired from Merck (Darmstadt, Germany). High purity, thermostable α–amylase from Bacillus sp. (3000 U/mL) (E.C. 3.2.1.1) was purchased from Megazyme (Bray, Ireland). HPLC-grade acetonitrile 99.9%, Folin–Ciocalteu reagent, 3,5-dinitrosalicylic acid (DNS), acarbose, 2,2-diphenyl-1-picrylhydrazyl (DPPH), pepsin from porcine gastric mucosa (E.C. 3.4.23.1), bile salts, trypsin from porcine pancreas (E.C. 3.4.21.4) and other chemical reagents of analytical purity were acquired from Sigma-Aldrich (Schnelldorf, Germany), unless otherwise specified. The Caco-2 human intestinal epithelial cell line from ECACC (Sigma-Aldrich, Schnelldorf, Germany) was used at passage 20. The Dulbecco’s Modified Eagle Medium (DMEM), fetal bovine serum (FBS), non-essential amino acids, glutamax and a mixture of penicillin–streptomycin–neomycin (PSN) were acquired from Sigma-Aldrich (Schnelldorf, Germany).

2.2. Preparation of Bioactive Extracts and Their Mixture

Blueberry pomace was incubated in a drying oven (Memmert, Schwabach, Germany), at 40 °C, for 3 days and ground to a fine powder using an electric mill (Mockmill, Groß-Umstadt, Germany). For extraction, the powder was incubated in ethanol/water 70:30 (v/v), in a ratio of 1:10 (w/v) under magnetic stirring, at room temperature, for 24 h. The extract was centrifuged at 9000× g for 20 min and the residue was extracted again. The reunited supernatants were evaporated in a rotary evaporator (Heidolph, Schwabach, Germany) to remove the solvent and, finally, lyophilized to obtain the blueberry pomace extract (BP), which was stored in a sealed container at −20 °C until further analyses.
Chia seeds were hydrated in distilled water in a ratio of 1:5 (w/v) and occasionally stirred at room temperature for 3 h. Then, polysaccharide extraction was performed in distilled water in a ratio of 1:10 (w/v) in a Soxhlet equipment operated at 100 °C for 1 h [34]. After filtration, the procedure was repeated using the remaining residue. In order to purify the extract, the reunited supernatants were mixed with chilled ethanol solution, in a ratio of 1:3 (v/v) and stored at 4 °C. The precipitate obtained by centrifugation at 9000× g for 20 min was washed with distilled water and lyophilized. The purified chia seeds extract (CS) was stored in a sealed container at −20 °C, until further analyses.
Several mixtures of BP and CS extracts were prepared to different weight ratios. The mixture in a weight ratio of 5:1 (BCM) presented the highest content of phenolics and antioxidant activity and was selected for further analyses.

2.3. Determination of Total Phenolic Content (TPC), Total Flavonoids Content (TFC) and Total Carbohydrate Content

TPC of the extracts was determined according to a Folin–Ciocalteu assay [35] with minor modifications. Briefly, the sample (150 µL) was added to Folin–Ciocalteu reagent (750 μL), vortexed and incubated at room temperature, in the dark, for 5 min. A solution of 12% (w/w) sodium carbonate (2 mL) and distilled water (12.1 mL) was added to the mixture, vortexed and incubated at room temperature, for 30 min. The optical density (OD) of the solution was measured at a wavelength of 765 nm (V-650 spectrometer, Jasco, Japan). A solution of 0.5 mg/mL gallic acid was used to build a standard curve and to calculate the results as gallic acid equivalents (GAE).
TFC was determined according to an aluminum chloride assay [35]. Briefly, methanol (1.5 mL) was combined with the sample (0.5 mL) and 10% (w/w) AlCl3 solution (0.1 mL), vortexed and incubated for 3 min. Then, 1 M sodium acetate solution (0.1 mL) and distilled water (2.8 mL) were added, followed by vortexing and incubation at room temperature, for 30 min. The OD of the solution was measured at a wavelength of 415 nm (V-650 spectrometer, Jasco, Tokyo, Japan). The 0.5 mg/mL quercetin solution served to build a standard curve and calculate the results as quercetin equivalents (QE).
Total carbohydrate content was determined according to AOAC standard [36] by subtracting the content of protein, lipid and ash.

2.4. HPLC Analysis

HPLC analysis was conducted on a HPLC system (Agilent 1200, Agilent, Santa Clara, CA, USA) consisting of quaternary pump, degasser, thermostatted autosampler and diode-array detector. The BP sample was filtered through regenerated cellulose membranes of 0.22 µm porosity, and aliquots (10 µL) were injected on a reverse phase column (Zorbax XDB-C18, 4.6 i.d. × 150 mm, 5 μm) (Agilent, Santa Clara, CA, USA). A mobile phase of 2 mM sodium acetate buffer, pH 3.05 (solvent A) and acetonitrile (solvent B) was used. The elution was carried out at a flow rate of 0.5 mL/min using a linear gradient: 0–30 min, 2–20% B; 30–40 min, 20–30% B; 40–50 min, 30% B; and 50–60 min, 30–2% B [37]. The identification and quantification of compounds was carried out using peak area integration, reported to that of standard phenolic acids and flavonoids, using Chemstation software.

2.5. Determination of α-Amylase Activity Inhibition

The inhibition of α-amylase was analyzed according to Apostolidis et al. [38] with minor modifications. The sample (20 μL) was mixed with 2 U/mL α-amylase (10 μL) and 100 mM phosphate buffer, pH 6.8 (50 μL), in the wells of a 96-well microplate. After incubation at 37 °C for 20 min, 1% starch solution (20 μL) was mixed and the plate was maintained at 37 °C for 30 min. Finally, DNS solution (100 μL) was mixed and the reaction took place at 100 °C. After 10 min, the OD was measured at a wavelength of 540 nm (Spectrostar Nano microplate reader, BMG Labtech, Ortenberg, Germany). A mixture containing distilled water in place of the sample served as control. A solution of acarbose, known as an α-amylase inhibitor, served as a positive control. The inhibition of α-amylase was calculated using the following equation:
Inhibition of α-amylase (%) = (ODcontrol − ODsample/ODcontrol) × 100
The inhibitory concentration of 50% α-amylase activity (IC50, mg/mL) was determined from the regression curve using Microsoft Excel 2018 software.

2.6. Determination of Free Radical Scavenging Capacity

The free DPPH radical scavenging capacity of samples was analyzed as previously described [35]. Briefly, mixtures of different concentrations (10–500 µg/mL) of sample in 0.25 mM DPPH methanolic solution and 0.1 M Tris-HCl buffer, pH 7.4, were prepared. They were incubated at room temperature, in the dark, for 30 min. Measurement of OD was carried out at 517 nm (V-650 spectrometer, Jasco, Tokyo, Japan). A blank was obtained by replacing the sample with the same volume of buffer. The following equation was used:
Free DPPH radical inhibition (%) = (ODblank − ODsample)/ODblank × 100
The antioxidant agent Trolox, an analogue of vitamin E, was used as a positive control. IC50 was calculated from the nonlinear regression curve of DPPH inhibition vs. concentration plot using Microsoft Excel 2018 software.

2.7. In Vitro Simulated Gastrointestinal Digestion

A model of simulated gastrointestinal digestion was carried out in two successive steps as previously described [39], with minor modifications. First, 2.5 mL sample was mixed with 20 mg/mL pepsin solution in 5 M HCl, pH 2, supplemented with 0.9% NaCl (simulated gastric juice), in a shaking water bath fixed at 90 g and a temperature of 37 °C for 2 h. Then, the post-gastric digestion product (PG) was cooled on ice and stored at −20 °C. In the second phase, an aliquot of PG sample was further digested in a beaker with simulated intestinal medium, consisting of 25 mg/mL trypsin and 30 mg/mL bile salts dissolved in 0.1 M NaHCO3 solution, pH 7.5. A dialysis bag (molecular weight cutoff of 12 kDa) was filled with a solution of 0.1 M NaHCO3, pH 7.5, and placed into the beaker to gradually increase the pH, mimicking the gastrointestinal transition. The incubation took place at 37 °C, in the dark, for 2 h, with continuous stirring. A solution was obtained in the dialysis bag containing the digestion products that can pass the intestine into the serum (PS), while the beaker solution contained the products that go into the colon (PC) following digestion. The samples were immediately frozen, until further analyses. For cell culture experiments, all samples (PG, PS, PC) were sterile filtered through 0.45 µm membranes.

2.8. In Vitro Cytocompatibility Testing by Neutral Red Assay

Human Caco-2 intestinal epithelial cells were seeded in the wells of a 96-well culture plate at a density of 1 × 10⁵ cells/mL and cultivated in DMEM supplemented with 20% FBS, 1% glutamax, 1% non-essential amino acids and 1% PSN antibiotic mixture. The plate was incubated in the standard conditions of humidified atmosphere of 5% CO2/95% air at 37 °C. After cell adhesion, the culture medium was replaced by digested samples in different concentrations (100–1500 µg/mL) in fresh medium and the plate was maintained in standard conditions for 24 h.
The cell viability was assessed according to Neutral Red assay [40]. Briefly, cell culture media was replaced with 100 μL of 0.005% (w/w) Neutral Red solution and incubation was carried out at 37 °C, in the dark, for 3 h. After three washes in phosphate-buffered saline, cells were fixed and the stain was extracted from the viable cells by gentle shaking for 15 min. Untreated cells were used as a negative control. A positive control was represented by cells treated with 0.3 mM H2O2. The OD measured at a wavelength of 540 nm (Spectrostar Nano microplate reader, BMG Labtech, Ortenberg, Germany) was proportional to the cell viability, according to the following equation:
Cell viability (%) = (ODsample/ODcontrol) × 100

2.9. Determination of Intracellular Reactive Oxygen Species (ROS) Production by Flow Cytometry

The intracellular ROS production was determined in the same experimental model of adhered Caco-2 intestinal cells treated with 100 µg/mL digestion products, for 24 h, as described above. Then, the cells were oxidative-stressed by treatment with 0.05 mM t-butyl hydroperoxide (t-BHP) for 30 min. The intracellular ROS production was determined by using the cell permeant fluorogenic dye 2′,7′-dichlorofluorescein diacetate (DCFH-DA) [41]. Briefly, a solution of 10 μM DCFH-DA was added to the cells and the plate was incubated for 30 min, to allow formation of DCF fluorescent product analyzed at a BD LSR II flow cytometer (Becton Dickinson, Franklin Lakes, NJ, USA). Untreated cells were used as a negative control. Cells treated with 12 μM ascorbic acid, known as antioxidant agent, served as a positive control. The acquired histograms of fluorescence intensity served to calculate the percentage of ROS production using FACSDiva and FlowJo software.

2.10. Determination of the Prebiotic Effect

The prebiotic effect was evaluated in experimental models in vitro developed using microbial strains of Lactobacillus rhamnosus and Lactobacillus acidophilus, as previously described [42] with minor modifications. Briefly, cultures of bacterial cells in MRS broth medium were incubated at 35 °C for 24 h. The working culture was adjusted at a concentration of 1 × 10⁸ CFU/mL to 0.5 McFarland standard. Then, microbial suspensions were added to the wells of a 96-well microplate and cultivated in the presence of non-digestible products (PC) (100 µg/mL) by incubation at 35 °C for 24 h. Measurements of OD carried out at 600 nm (Sunrise microplate reader, Tecan, Grödig, Austria) were proportional to microbial growth. An untreated culture served as a control.

2.11. Statistical Analysis

Three independent experiments were carried out and the obtained data were presented as mean ± standard deviation (SD) (n = 3). The statistical analysis on each control-sample or sample–sample pair of interest was conducted according to two-tailed, paired Student’s t-test (Microsoft Excel 2018 software, Redmond, WA, USA). Differences were considered statistically significant at p < 0.05.

3. Results and Discussion

3.1. Characterization of Bioactive Extracts

BP and CS extracts were analyzed for TPC, TFC and total carbohydrate content. The results are presented in Table 1. Data showed that BP had 30.40% TPC and 1.89% TFC. A similar TPC value (28.5 g GAE/100 g dry weight) was previously reported for the blueberry pomace extract prepared in HCl-methanol solution at room temperature, and for the extract in H2SO4-methanol solution at 85 °C [43]. CS contained 70.78% carbohydrates, as calculated by subtracting the content of protein, lipids and ash.
HPLC analysis was carried out to provide the concentration of the main phenolics present in BP extract. The results are presented in Table 2. The data indicated that gallic and chlorogenic acid were the main identified phenolic acids, while the flavonoids rutin, quercetin and luteolin 7-glucoside prevailed over the other identified compounds. Resveratrol was quantified in BP extract at a level of 103.43 mg/100 g dry weight. A previous study identified a similar composition of acidified hydroalcoholic extracts in blueberry pomace [44].

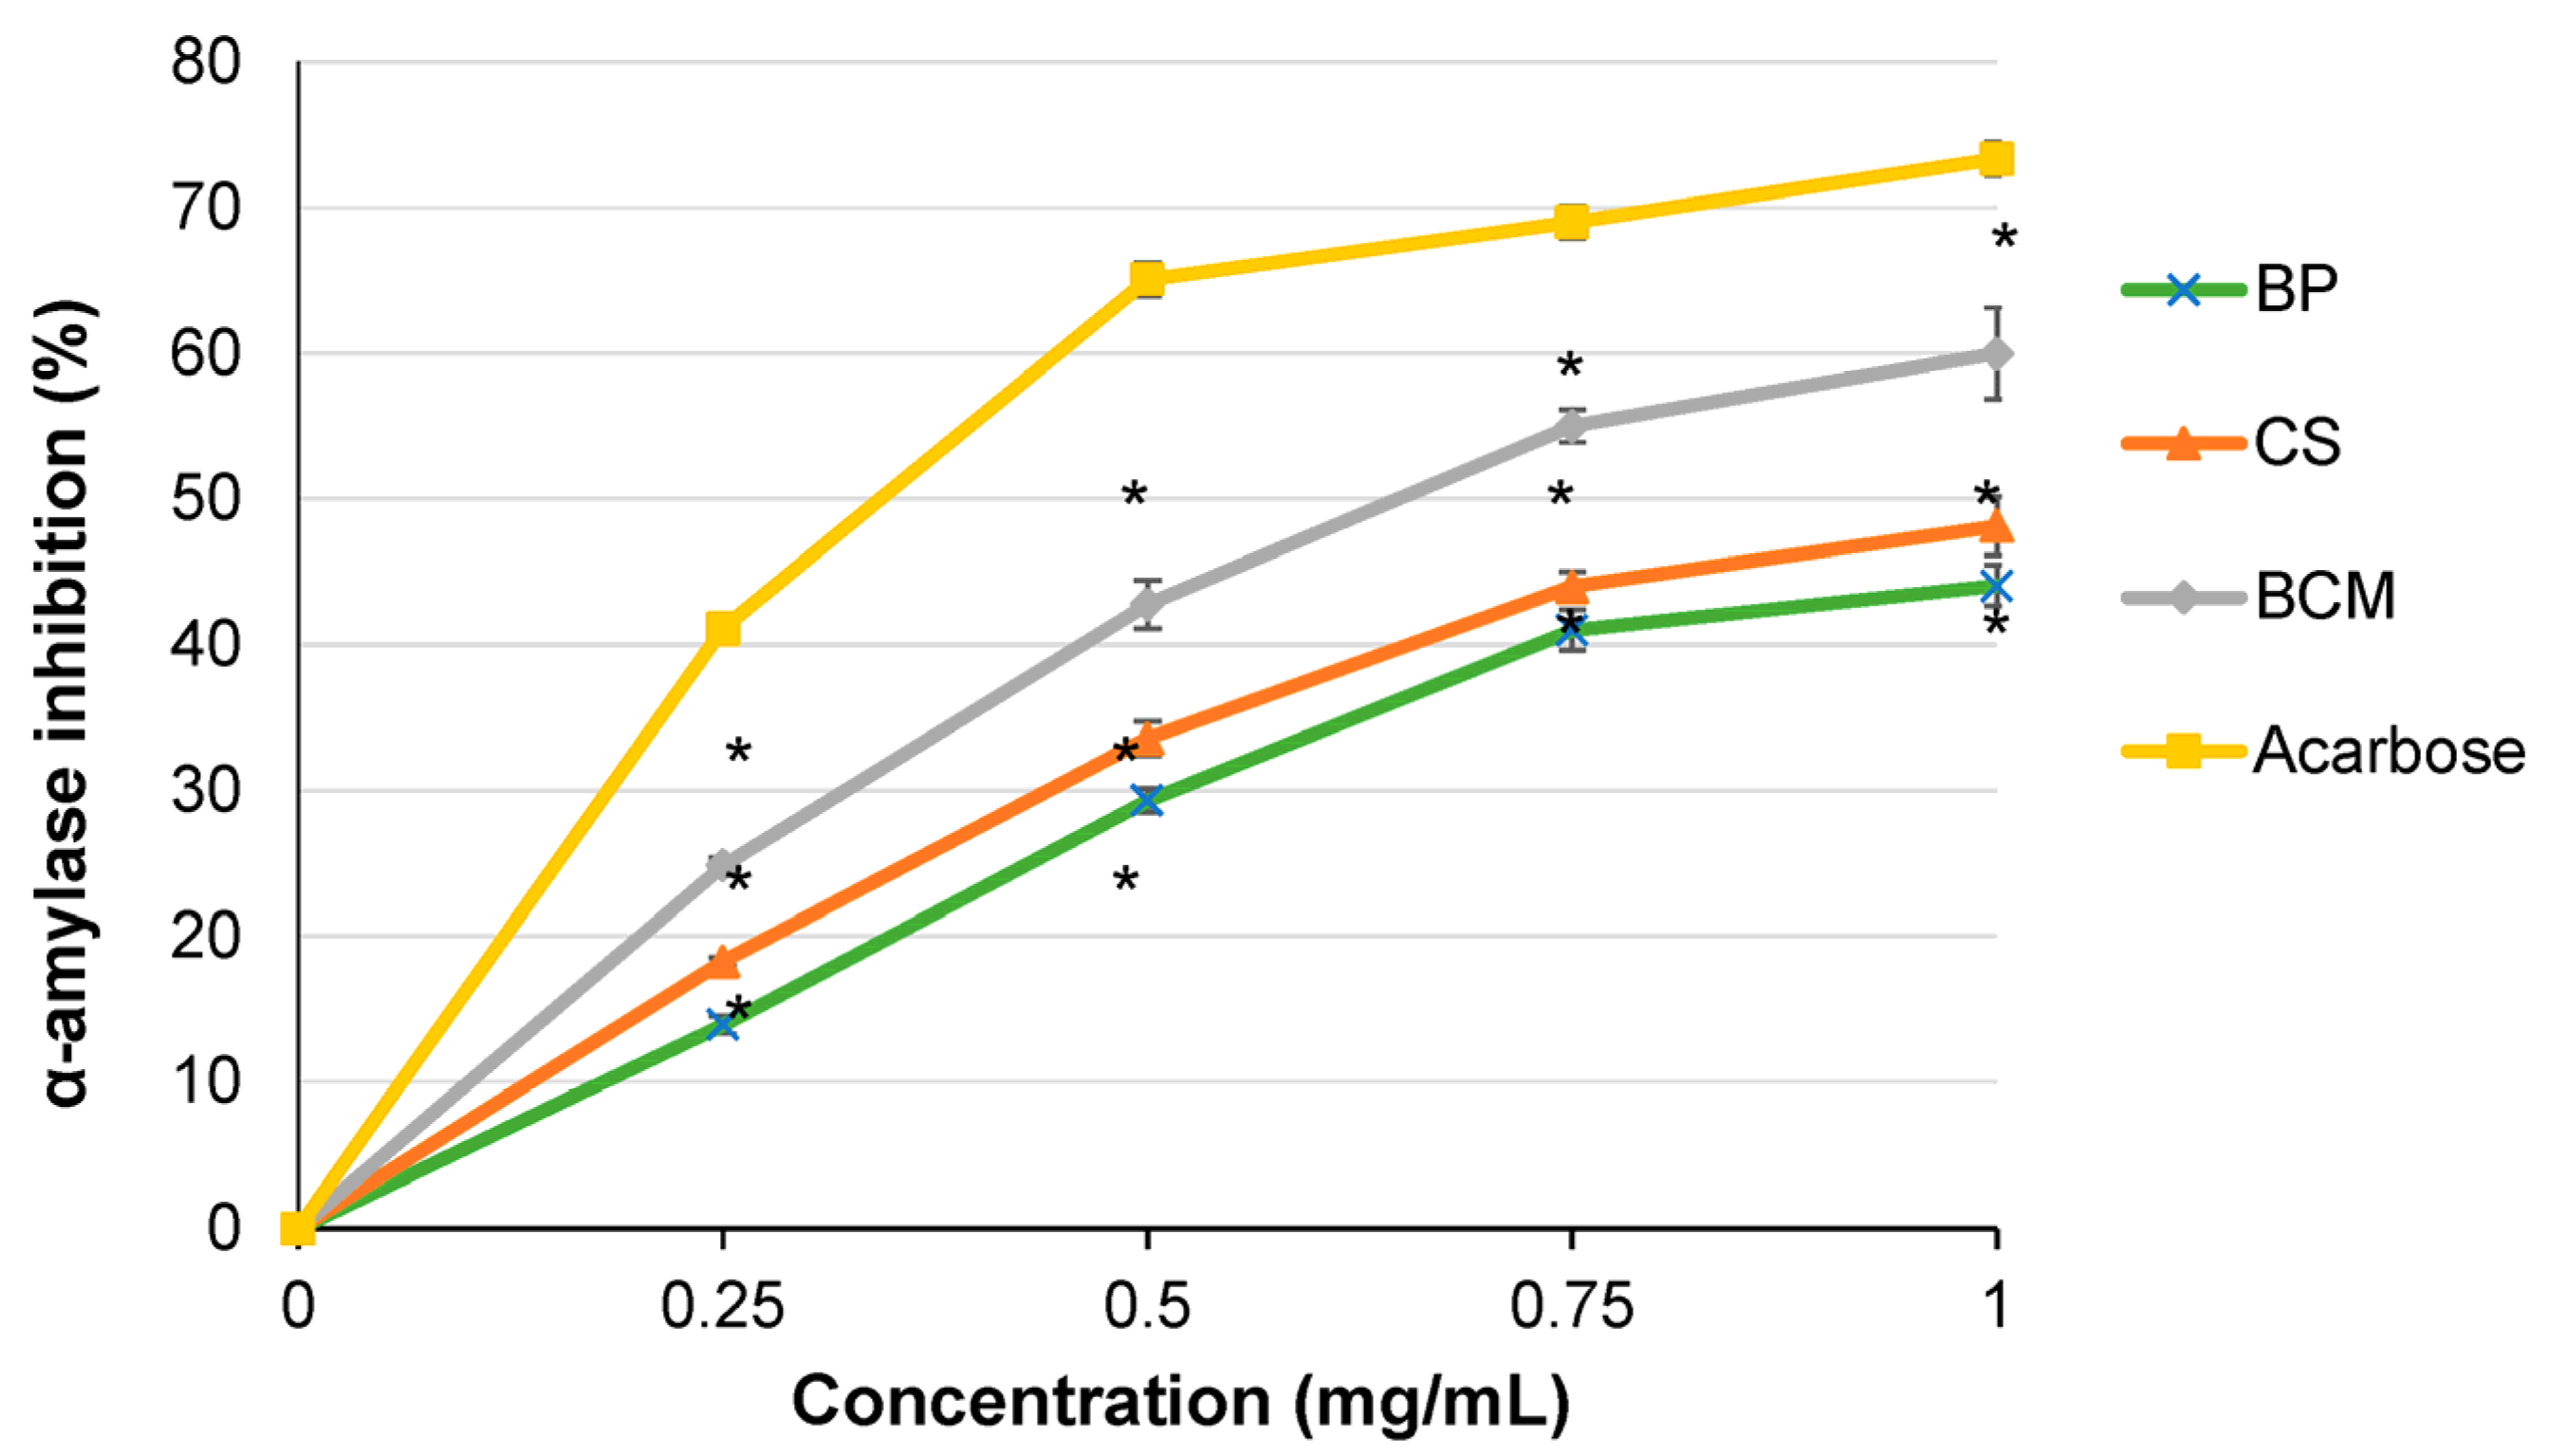
3.2. Inhibition of α-Amylase Activity

Previous studies have reported that phenolic compounds, such as quercetin, rutin, catechin, procyanidins and tannic acid, could inhibit α-amylase activity through hydrophobic interactions [43]. In addition, a diet with chia seeds could control postprandial glycemia and manage the obesity risk in diabetes [45]. For the first time, in the present study, the capacity of BCM mixture to inhibit α-amylase activity was comparatively assessed to both BP and CS individual extracts. The results are presented in Figure 1.
The inhibition of α-amylase activity varied in a dose-dependent manner. The mixture presented the highest inhibition of α-amylase activity, close to that of acarbose, a known inhibitor of α-amylase activity. The mixture had a higher value of inhibition than those of individual extracts, at each tested concentration. The calculated IC50 value of BCM was 0.69 mg/mL, while those of BP and CS were 1.28 and 1.07 mg/mL, respectively. Acarbose had an IC50 value of 0.31 mg/mL. These data indicated that the compounds from BCM could exert a synergistic action that led to inhibition of α-amylase activity.
Similar activity of different methanolic and aqueous extracts of fruit pomace derived from grapes, lemon, orange and pineapple was previously reported in the range of 8–28% α-amylase inhibition [1]. Phenolic compounds, such as gallic and chlorogenic acid, acted as potent antidiabetic agents by inhibiting α-amylase and α-glucosidase activity in vitro and in vivo [46,47]. It was observed that these antioxidant phenolic compounds were found in significant quantities in BP extract and BCM mixture prepared in the present study. In addition, previous in silico studies using a docking program found novel phenolic inhibitors of α-amylase, such as corilagin, baicalein, quinoline and β-sitosterol, and identified the amino acids from the active situs of this enzyme involved in hydrophobic and/or hydrogen-bond interactions [48]. The mechanism of inhibition was described as a noncompetitive polyphenol-enzyme interaction and, in the case of catechins, good correlation between the affinity towards the enzyme and the inhibitory potential was found [49]. It was also found that phenolics represented a supportive treatment of type 2 diabetes and metabolic syndrome [50].

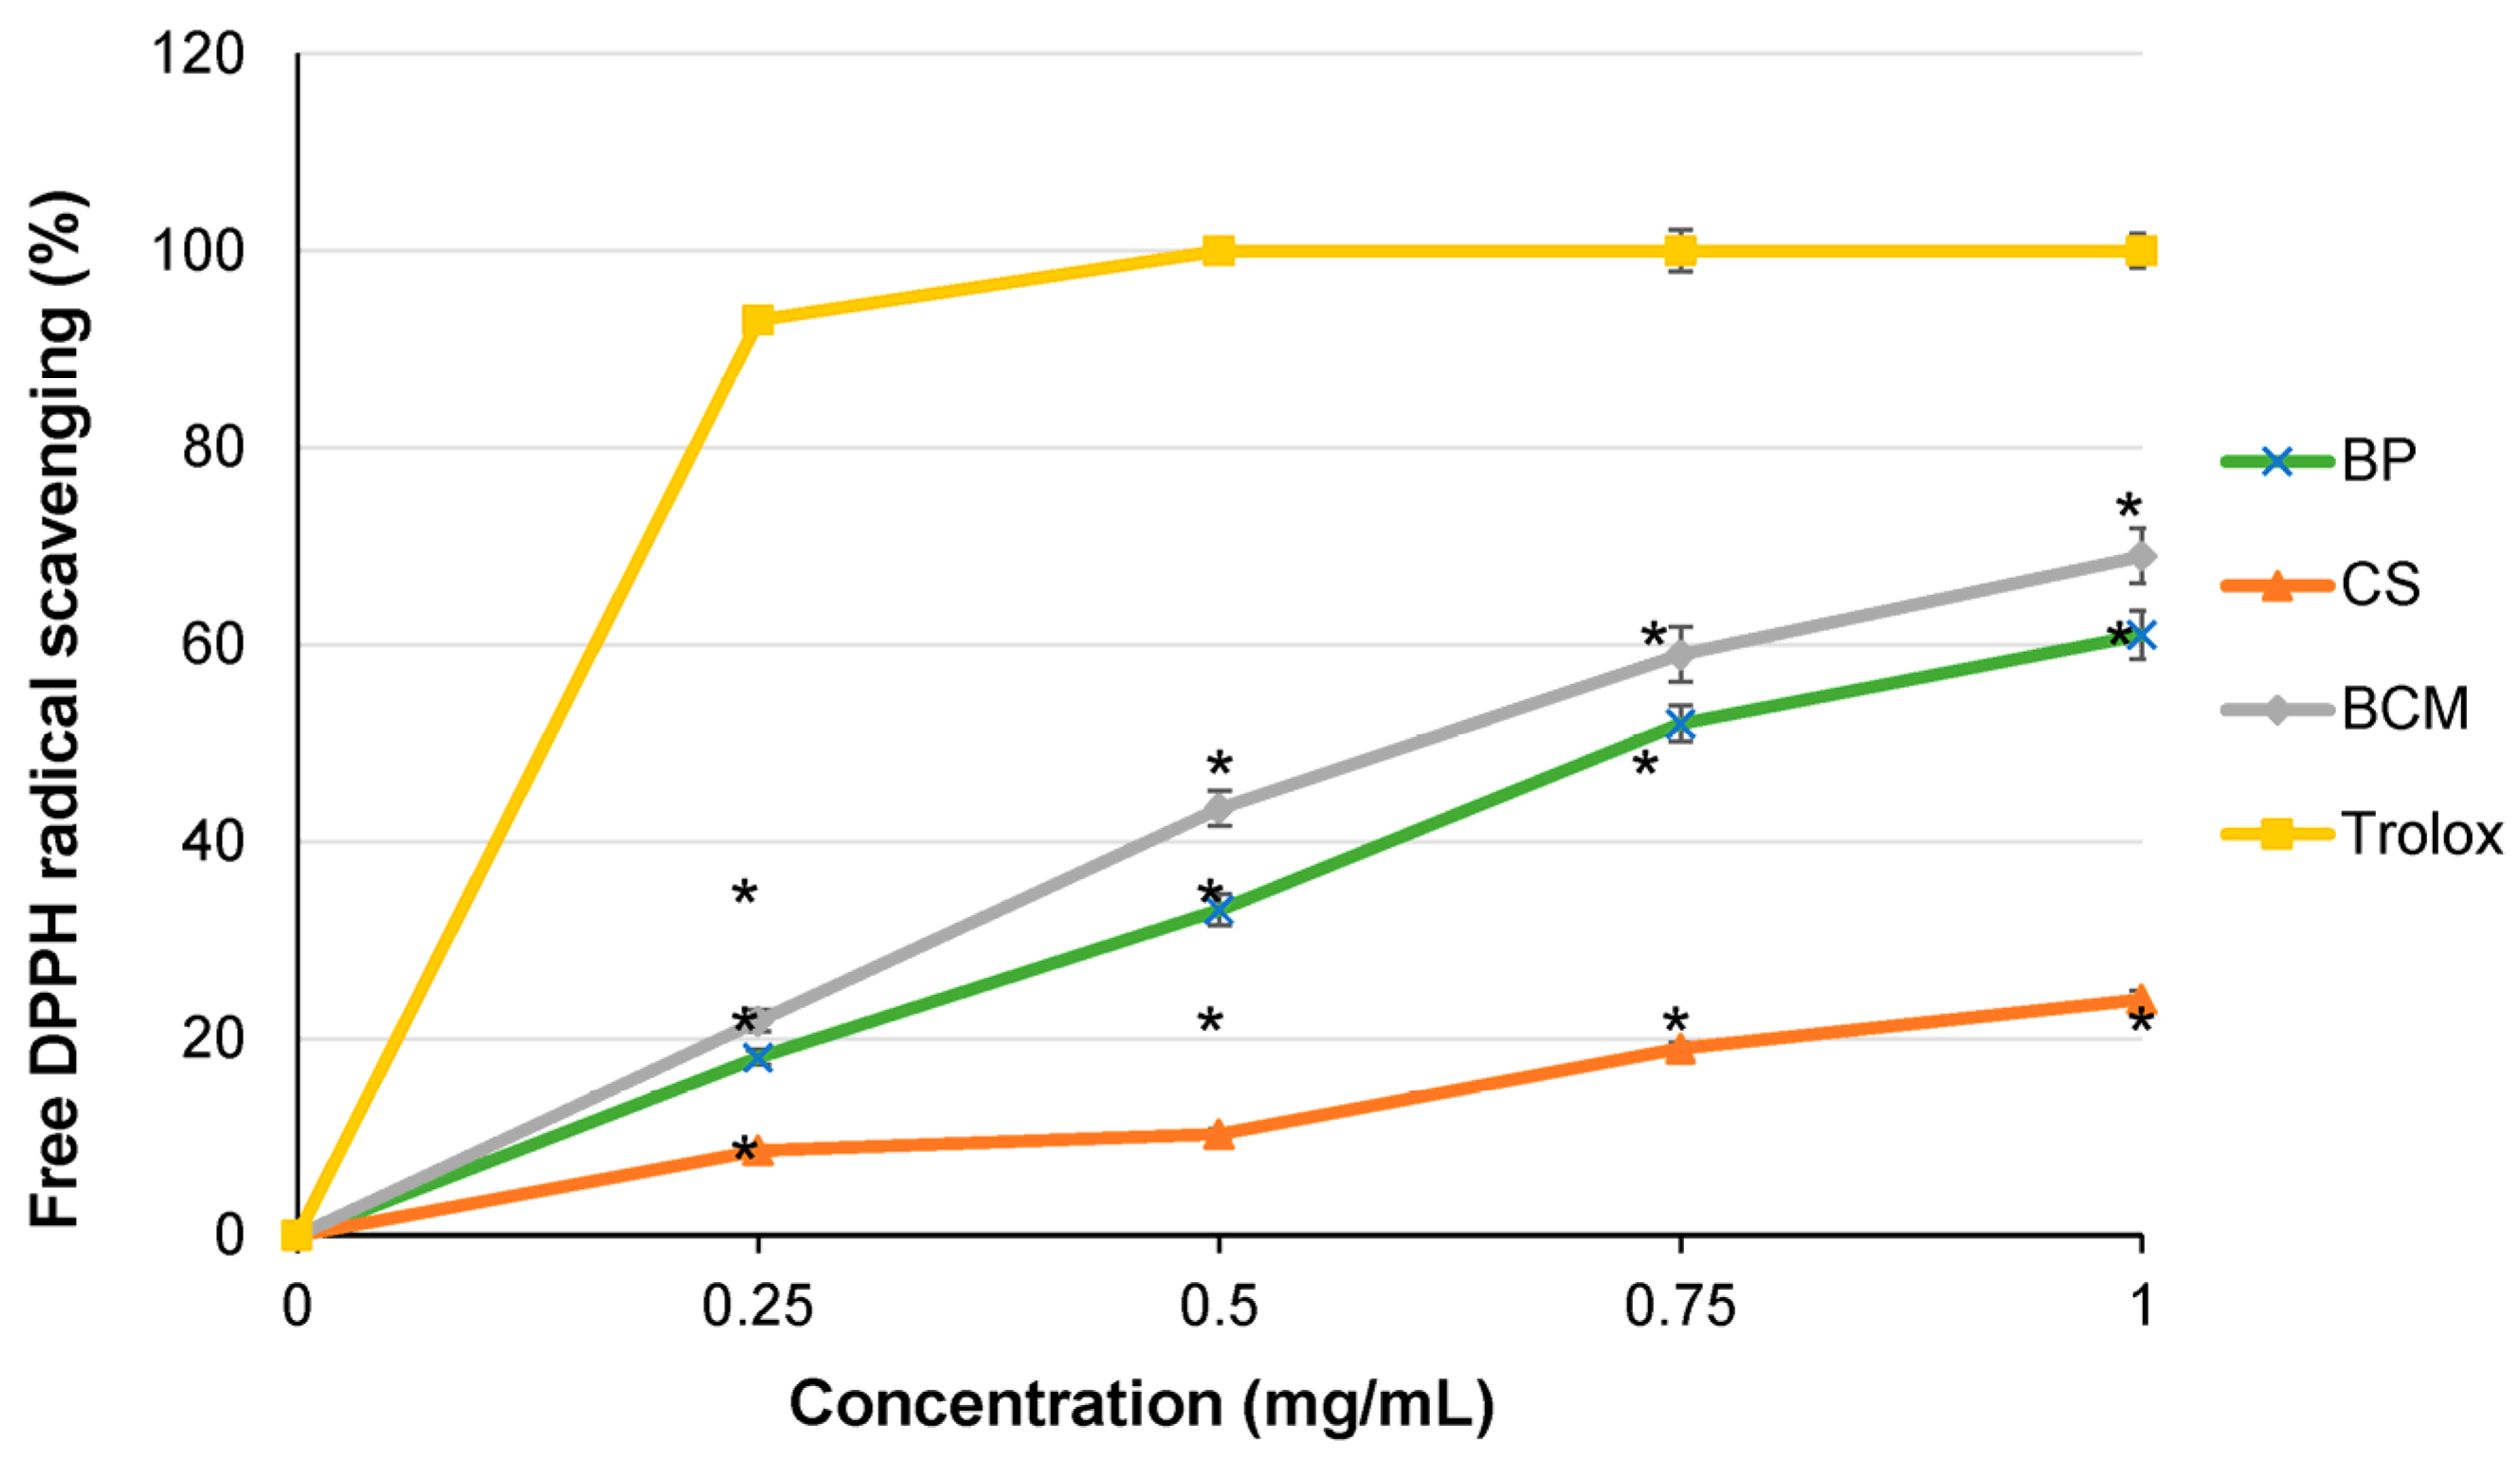
3.3. Free Radical Scavenging Activity

The results of free DPPH radical scavenging activity of BCM and individual extracts of BP and CS are presented in Figure 2. These data show that BCM mixture presented higher antioxidant activity than that of individual extracts. Accordingly, a lower IC50 value (606.12 µg/mL) was calculated for BCM mixture compared to that of BP (681.97 µg/mL). CS had a significantly higher IC50 value (2248.57 µg/mL), indicating low antioxidant activity, and so was not tested further in cell culture experiments. The IC50 value of Trolox, used as antioxidant control, was 127.02 µg/mL.
The capacity of BCM mixture to scavenge free DPPH radicals could be due to the high phenolic content of BP, according to a previous study reporting high correlation coefficient [43]. This activity was also influenced by the structural properties of phenolic constituents, such as the number and position of hydroxyl groups or other substituents [51]. In addition, it has been shown that polysaccharides had a pronounced interaction with fruit polyphenols through covalent, hydrogen and hydrophobic bonds [52], which might increase the antioxidant capacity of such combinations [53].

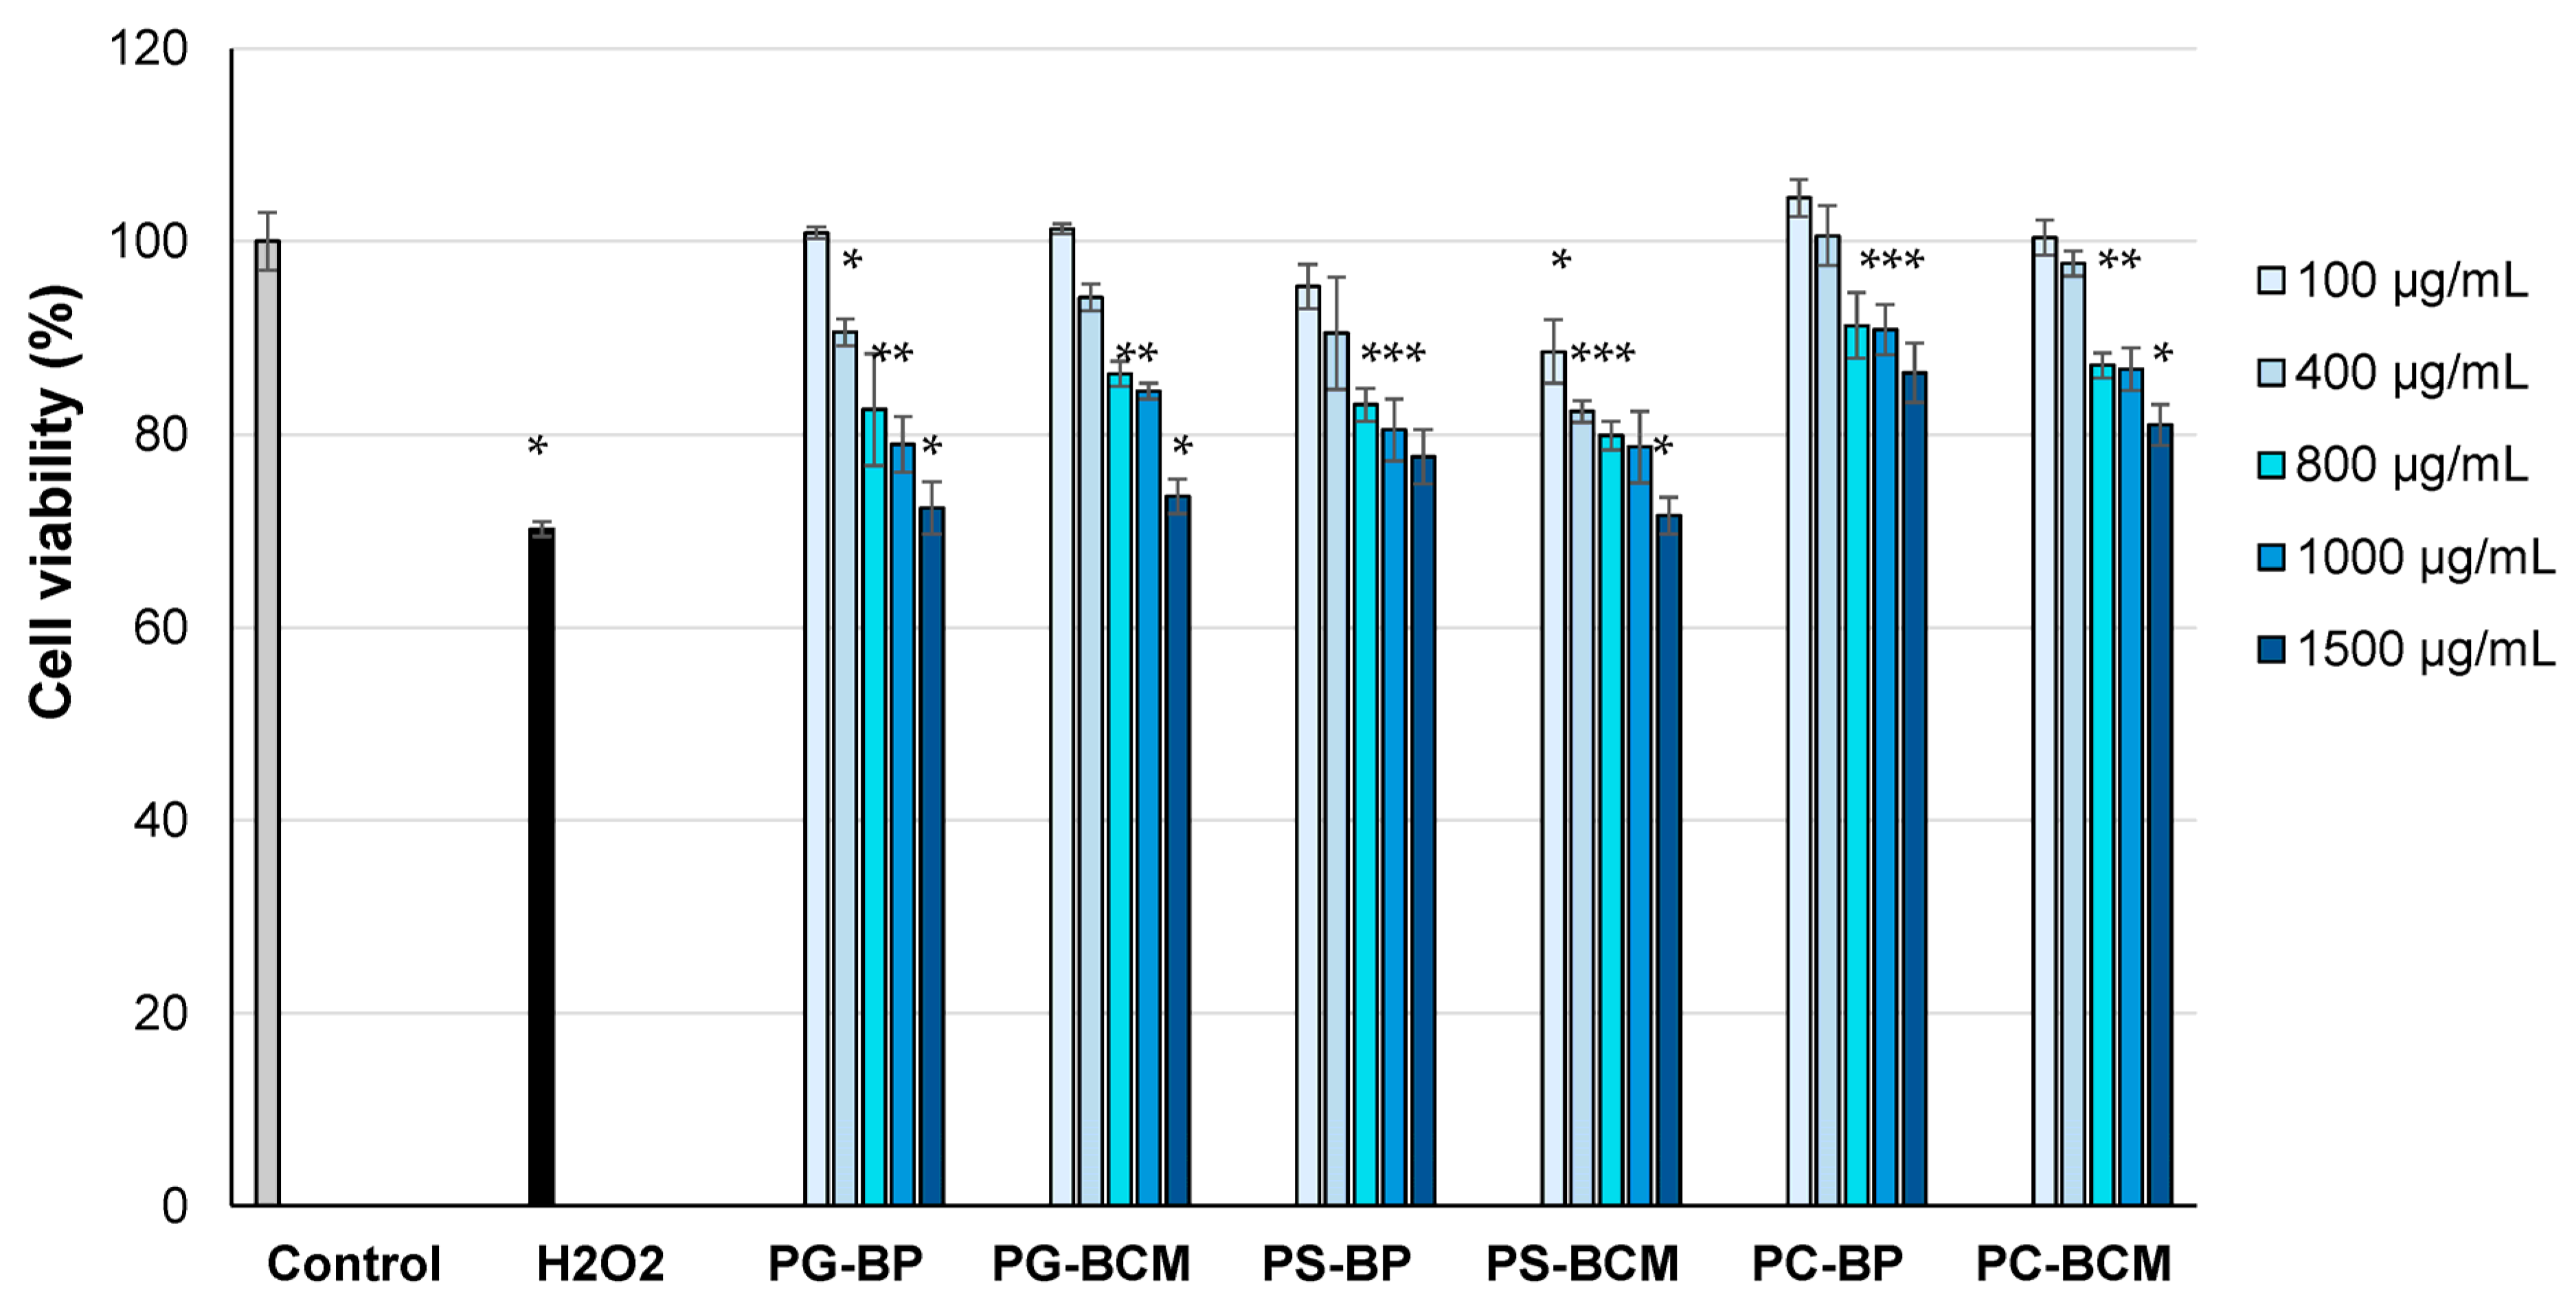
3.4. In Vitro Cell Cytocompatibility

A two-step gastrointestinal digestion was performed on the BCM mixture, and PG, PS and PC products were obtained. The results of in vitro cytocompatibility testing on different concentrations of these products in a Caco-2 intestinal cell line are presented in Figure 3. The values of cell viability varied in a dose-dependent manner. The PG–BCM had good cytocompatibility in concentrations ranging from 100–1000 μg/mL; the cell viability values were close to those of control cells (100%) at a concentration of 100 μg/mL, and higher than 80% at concentrations between 400 and 1000 μg/mL. At 1500 μg/mL, the cell viability was 73.6%, indicating moderate cytocompatibility. The PS digestion product of BCM was also cytocompatible up to 1000 μg/mL (cell viability > 80%) and a value of 71.6% was recorded at 1500 μg/mL. The PC digestion product of BCM was cytocompatible and had values of cell viability higher than 80%, at all tested concentrations. The digestion products of BP had a similar degree of cytocompatibility to that of the BCM mixture.
Based on these data, the cytocompatible concentration of 100 μg/mL digestion products was selected for further experiments in Caco-2 cells.

3.5. Effect on Intracellular ROS Production

An experimental model in vitro was used to assess the effect of PS and PC digestion products of the BCM mixture on the modulation of intracellular ROS production in an oxidative-stressed Caco-2 intestinal cell culture. The histograms acquired by flow cytometry are presented in Figure 4 and the calculated percentages of ROS production are given in Table 3. The results indicate that all tested samples had the capacity to significantly (p < 0.05) decrease the ROS level, compared to the oxidative-stressed cells. It is worth emphasizing that, in the case of cells treated with the PC digestion product of BCM, the ROS level was diminished at a similar value to that of cells treated with ascorbic acid, a known antioxidant agent. An antioxidant capacity was also observed in the case of cells treated with PS–BCM, but the levels of ROS production were slightly higher compared to that of the PC–BCM digestion product. These results confirm that the compounds from the BCM mixture could maintain their antioxidant activity after gastrointestinal digestion. The digestion products of BP presented antioxidant capacity, but to a lower extent than those of BCM.
The results were in accordance with a previous study on polyphenolic extracts of blueberry pomace showing their capacity to inhibit ROS generation in H2O2-treated keratinocytes [54]. Moreover, pre-treatment of cells with blueberry phenolic extract could protect them from H2O2-induced oxidative stress through the p-38 mitogen-activated protein kinase metabolic pathway [55]. In a similar study on blackberry phenolic extracts, their anti-ROS activity in cultured cells was reported after simulated gastrointestinal digestion, a process known to affect their stability and bioavailability in vivo [56]. Previous research reported the beneficial effect of grape polyphenols administration in mice for lowering the intestinal ROS level [57].

3.6. Prebiotic Effect

The results of Lactobacillus rhamnosus and Lactobacillus acidophilus growth in the presence of digestion products reaching the colon are shown in Figure 5. These data indicated that cell growth of both Lactobacillus rhamnosus and Lactobacillus acidophilus bacterial strains was superior in the presence of the PC-BCM digestion product compared to that of untreated control. Thus, the sample has induced a stimulating effect on the growth of each tested strain of Lactobacillus, after 24 h of treatment. Additionally, significantly (p < 0.05) higher values were recorded in the cells treated with PC-BCM compared to those treated with PC-BP. These results demonstrated that the BCM mixture had a better capacity to up-regulate the growth of lactic acid bacteria strains. In addition, they suggested a synergistic action of bioactive compounds from the BCM mixture to stimulate probiotics and gut health.
Several in vitro and in vivo studies have indicated the bioactivity of berry polyphenols in balancing between beneficial Bacteroidetes and Firmicutes through a decrease in short-chain fatty acid production [58]. Blueberry anthocyanin extracts presented prebiotic activity [59], while consumption of a phenolic extract has modulated the gut microbiota of mice, increasing the relative abundance of Bifidobacteria and revealing anti-obesity effects [60]. Phenolic extracts of elderberry skin were also reported to stimulate the growth of the probiotic strain of Lactobacillus rhamnosus, and are recommended for obtaining functional, pro-health food [42]. The combination of phenolics and probiotic strains induced significant beneficial effects on gut motility and microbiota in an in vivo model on Drosophila and in a simulated model of the human gastrointestinal tract, compared to that of each component, providing novel solutions for chronic metabolic diseases [61]. Moreover, chia seeds have high nutritional and therapeutic potential, in particular for gut microbiota due to their chemical composition rich in soluble fiber polysaccharides. Still, there is scarce scientific literature on the prebiotic effect of chia seed polysaccharides. A recent study has reported that chia mucilage protected the probiotics encapsulated in a food film and stimulated their survival increase [62]. Similar studies have reported that oligosaccharidic fractions extracted from grape seeds exerted prebiotic activity towards Lactobacillus acidophilus, improving in vitro bacterial growth [22].

4. Conclusions

For the first time, we proposed a combination of phenolics extract from blueberry pomace and a polysaccharidic extract from chia seeds with optimal biological activity. In vitro results indicated that this formulation exhibited higher inhibition of α-amylase and free DPPH radical scavenging compared to that of individual extracts. After simulated gastrointestinal digestion of the BCM mixture, all products were cytocompatible in human Caco-2 intestinal cells. The products reaching the colon decreased the intracellular ROS production to a similar extent to ascorbic acid, and stimulated lactic acid bacteria growth in a higher proportion than individual extracts.
All these data demonstrated that bioactive constituents from BCM in combination could synergistically act to improve the properties of individual extracts. Further studies could test this new valuable natural composition for applications in nutraceutical formulation for maintaining the functions of the digestive tract, in particular through hypoglycemic, antioxidant and prebiotic effect using in vivo models.

Author Contributions

E.M., O.C. and B.-S.N.-P. designed the study and had major contributions in writing the manuscript; E.M., T.C., E.U. and A.-M.G. performed extraction and biochemical experiments; E.M., T.C., E.U., A.-M.G. and T.N.-P. analyzed and interpreted the data; A.I. and V.C. performed cell culture experiments, data processing and interpretation; A.-M.S.-G. conducted flow cytometry experiments, and analyzed and interpreted the data; A.-M.P. conducted microbial experiments, analyzed and interpreted the data; O.C., B.-S.N.-P., A.I., V.C. and T.N.-P. were involved in writing and editing the manuscript; O.C., B.-S.N.-P. and T.N.-P. were involved in supervision. All authors have read and agreed to the published version of the manuscript.

Funding

This research was supported by the Ministry of Research, Innovation and Digitization, CCCDI-UEFISCDI, project no. PN-III-P2-2.1-PED-2019-3805 within PNCDI III, and funded by Program Nucleu, project no. 23020101 and Program 1—Development of the National R&D System, Subprogram 1.2—Institutional Performance—Projects for Excellence Financing in RDI, contract no. 2PFE/2021.

Data Availability Statement

The datasets used and/or analyzed during the current study are available from the corresponding author on reasonable request.

Conflicts of Interest

The authors declare no conflict of interest.

Abbreviations

BP: blueberry pomace extract; CS: chia seed extract; BCM: mixture of BP and CS extracts in a ratio of 5:1 (w/w); DPPH: 2,2-diphenyl-1-picrylhydrazyl; DNS: 3,5-dinitrosalicylic acid; DMEM: Dulbecco’s Modified Eagle Medium; FBS: fetal bovine serum; PSN: penicillin–streptomycin–neomycin mixture; TPC: total phenolic content; TFC: total flavonoids content; OD: optical density; GAE: gallic acid equivalents; QE: quercetin equivalents; PG: gastric digestion product; PS: intestinal digestion product that pass into the serum; PC: intestinal digestion product that go into the colon; t-BHP: tert-butyl hydroperoxide; ROS: reactive oxygen species; DCFH-DA: 2′,7′-dichlorofluorescein diacetate; SD: standard deviation.

References

  1. Nagarajaiah, S.B.; Prakash, J. Chemical Composition and Bioactivity of Pomace from Selected Fruits. Int. J. Fruit Sci. 2016, 16, 423–443. [Google Scholar] [CrossRef]
  2. Artem, V.; Negreanu–Pirjol, T.; Ranca, A.; Ciobanu, C.; Bratu, M.M.; Popoviciu, D.R.; Moldovan, L.; Vasile, M.; Negreanu-Pirjol, B.S. Total Phenolic Content Correlated with Antioxidant Activity of Some Grape Pomace Biomass Hydroalcoholic Extracts, White and Red Varieties. UPB. Sci. Bull. Ser. B Chem. Mat. Sci. 2021, 83, 61–72. [Google Scholar]
  3. Negreanu-Pirjol, B.S.; Negreanu–Pirjol, T.; Bratu, M.M.; Popescu, A.; Roncea, F.; Miresan, H.; Jurja, S.; Paraschiv, G.M. Antioxidative Activity of Indigen Bitter Cherry Fruits Extract Corellated with Polyfenols and Minerals Content. Geo. Conf. SGEM Adv. Biotechnol. 2014, 1, 239–244. [Google Scholar]
  4. Xiong, J.; Chan, Y.H.; Rathinasabapathy, T.; Grace, M.H.; Komarnytsky, S.; Lila, M.A. Enhanced Stability of Berry Pomace Polyphenols Delivered in Protein-Polyphenol Aggregate Particles to an In Vitro Gastrointestinal Digestion Model. Food Chem. 2020, 331, 127279. [Google Scholar] [CrossRef] [PubMed]
  5. Kumar, S.; Pandey, A.K. Chemistry and Biological Activities of Flavonoids: An Overview. Sci. World J. 2013, 2013, 162750. [Google Scholar] [CrossRef] [PubMed] [Green Version]
  6. Srinivasulu, C.; Ramgopal, M.; Ramanjaneyulu, G.; Anuradha, C.M.; Kumar, C.S. Syringic Acid (SA)—A Review of Its Occurrence, Biosynthesis, Pharmacological and Industrial Importance. Biomed. Pharmacother. 2018, 108, 547–557. [Google Scholar] [CrossRef] [PubMed]
  7. Kropat, C.; Betz, M.; Kulozik, U.; Leick, S.; Rehage, H.; Boettler, U.; Teller, N.; Marko, D. Effect of Microformulation on the Bioactivity of an Anthocyanin-rich Bilberry Pomace Extract (Vaccinium myrtillus L.) In Vitro. J. Agric. Food Chem. 2013, 61, 4873–4881. [Google Scholar] [CrossRef]
  8. Negreanu-Pirjol, T.; Negreanu-Pirjol, B.; Popescu, A.; Bratu, M.M.; Udrea, M.; Busuricu, F. Comparative Antioxidant Properties of some Romanian Foods Fruits Extracts. J. Environ. Prot. Ecol. 2014, 15, 1139–1148. [Google Scholar]
  9. Chu, W.K.; Cheung, S.C.M.; Lau, R.A.W.; Benzie, I.F.F. Bilberry (Vaccinium myrtillus L.). In Herbal Medicine Biomolecular and Clinical Aspects, 2nd ed.; Benzie, I.F.F., Wachtel-Galor, S., Eds.; CRC Press: Boca Raton, FL, USA; London, UK; New York, NY, USA, 2011; pp. 55–73. [Google Scholar]
  10. Zorenc, Z.; Veberic, R.; Stampar, F.; Koron, D.; Mikulic-Petkovsek, M. White Versus Blue: Does the Wild ‘albino’ Bilberry (Vaccinium myrtillus L.) Differ in Fruit Quality Compared to the Blue One? Food Chem. 2016, 211, 876–882. [Google Scholar] [CrossRef]
  11. Li, X.; Bai, Y.; Jin, Z.; Svensson, B. Food-Derived Non-Phenolic α-Amylase and α-Glucosidase Inhibitors for Controlling Starch Digestion Rate and Guiding Diabetes-Friendly Recipes. LWT Food Sci. Technol. 2022, 153, 112455. [Google Scholar] [CrossRef]
  12. Kanner, J. Polyphenols by Generating H2O2, Affect Cell Redox Signaling, Inhibit PTPs and Activate Nrf2 Axis for Adaptation and Cell Surviving: In Vitro, In Vivo and Human Health. Antioxidants 2020, 9, 797. [Google Scholar] [CrossRef] [PubMed]
  13. Karcheva-Bahchevanska, D.; Lukova, P.; Nikolova, M.M.; Mladenov, R.D.; Iliev, I.N. Effect of Extracts of Bilberries (Vaccinium myrtillus L.) on Amyloglucosidase and -Glucosidase Activity. Folia Med. 2017, 59, 197–202. [Google Scholar] [CrossRef] [PubMed] [Green Version]
  14. Može, S.; Polak, T.; Gašperlin, L.; Koron, D.; Vanzo, A.; Poklar Ulrih, N.; Abram, V. Phenolics in Slovenian bilberries (Vaccinium myrtillus L.) and Blueberries (Vaccinium corymbosum L.). J. Agric. Food Chem. 2011, 59, 6998–7004. [Google Scholar] [CrossRef] [PubMed]
  15. Mi, Y.; Zhang, W.; Tian, H.; Li, R.; Huang, S.; Li, X.; Qi, G.; Liu, X. EGCG Evokes Nrf2 Nuclear Translocation and Dampens PTP1B Expression to Ameliorate Metabolic Misalignment under Insulin Resistance Condition. Food Funct. 2018, 9, 1510–1523. [Google Scholar] [CrossRef]
  16. Prince, P.D.; Rodriguez Lanzi, C.; Fraga, C.G.; Galleano, M. Dietary (-)-Epicatechin Affects NF-kB Activation and NADPH Oxidases in the Kidney Cortex of High-Fructose-Fed Rats. Food Funct. 2019, 10, 26–32. [Google Scholar] [CrossRef]
  17. Karppinen, K.; Hirvelä, E.; Nevala, T.; Sipari, N.; Suokas, M.; Jaakola, L. Changes in the Abscisic Acid Levels and Related Gene Expression during Fruit Development and Ripening in Bilberry (Vaccinium myrtillus L.). Phytochemistry 2013, 95, 127–134. [Google Scholar] [CrossRef] [PubMed]
  18. Qa’dan, F.; Verspohl, E.J.; Nahrstedt, A.; Petereit, F.; Matalka, K.Z. Cinchonain Ib Isolated from Eriobotrya japonica Induces Insulin Secretion In Vitro and In Vivo. J. Ethnopharmacol. 2009, 124, 224–227. [Google Scholar] [CrossRef] [PubMed]
  19. Shi, M.; Loftus, H.; McAinch, A.J.; Su, X.Q. Blueberry as a Source of Bioactive Compounds for the Treatment of Obesity, Type 2 Diabetes and Chronic Inflammation. J. Funct. Foods. 2017, 30, 16–29. [Google Scholar] [CrossRef] [Green Version]
  20. Plamada, D.; Vodnar, D.C. Polyphenols-Gut Microbiota Interrelationship: A Transition to a New Generation of Prebiotics. Nutrients 2022, 14, 137. [Google Scholar] [CrossRef]
  21. Long, J.; Guan, P.; Hu, X.; Yang, L.; He, L.; Lin, Q.; Luo, F.; Li, J.; He, X.; Du, Z.; et al. Natural Polyphenols as Targeted Modulators in Colon Cancer: Molecular Mechanisms and Applications. Front. Immunol. 2021, 12, 635484. [Google Scholar] [CrossRef]
  22. Bordiga, M.; Montella, R.; Travaglia, F.; Arlorio, M.; Coisson, J.D. Characterization of Polyphenolic and Oligosaccharidic Fractions Extracted from Grape Seeds Followed by the Evaluation of Prebiotic Activity Related to Oligosaccharides. Int. J. Food Sci. Technol. 2019, 54, 1283–1291. [Google Scholar] [CrossRef]
  23. Lovegrove, A.; Edwards, C.H.; De Noni, I.; Patel, H.; El, S.N.; Grassby, T.; Zielke, C.; Ulmius, M.; Nilsson, L.; Butterworth, P.J.; et al. Role of Polysaccharides in Food, Digestion, and Health. Crit. Rev. Food Sci. Nutr. 2015, 57, 237–253. [Google Scholar] [CrossRef] [PubMed] [Green Version]
  24. Gong, L.; Feng, D.; Wang, T.; Ren, Y.; Liu, Y.; Wang, J. Inhibitors of α-Amylase and α-Glucosidase: Potential Linkage for Whole Cereal Foods on Prevention of Hyperglycemia. Food Sci. Nutr. 2020, 8, 6320–6337. [Google Scholar] [CrossRef] [PubMed]
  25. Benalla, W.; Bellahcen, S. Antidiabetic Medicinal Plants as a Source of Alpha Glucosidase Inhibitors. Curr. Diab. Rep. 2010, 6, 247–254. [Google Scholar] [CrossRef]
  26. Reyes-Caudillo, E.; Tecante, A.; Valdivia-López, M.A. Dietary Fibre Content and Antioxidant Activity of Phenolic Compounds Present in Mexican Chia (Salvia hispanica L.) Seeds. Food Chem. 2008, 107, 656–663. [Google Scholar] [CrossRef]
  27. Kulczynski, B.; Kobus-Cisowska, J.; Taczanowski, M.; Kmiecik, D.; Gramza-Michalowska, A. The Chemical Composition and Nutritional Value of Chia Seeds—Current State of Knowledge. Nutrients 2019, 11, 1242. [Google Scholar] [CrossRef] [Green Version]
  28. Motyka, S.; Koc, K.; Ekiert, H.; Blicharska, E.; Czarnek, K.; Szopa, A. The Current State of Knowledge on Salvia hispanica and Salviae hispanicae semen (Chia Seeds). Molecules 2022, 27, 1207. [Google Scholar] [CrossRef]
  29. Knez Hrnčič, M.; Ivanovski, M.; Cör, D.; Knez, Ž. Chia Seeds (Salvia hispanica L.): An Overview-Phytochemical Profile, Isolation Methods, and Application. Molecules 2019, 25, 11. [Google Scholar] [CrossRef] [Green Version]
  30. Marin, L.; Miguelez, E.M.; Villar, C.J.; Lombo, F. Bioavailability of Dietary Polyphenols and Gut Microbiota Metabolism: Antimicrobial Properties. BioMed Res. Int. 2015, 2015, 905215. [Google Scholar] [CrossRef] [PubMed] [Green Version]
  31. Zhang, L.; McClements, D.J.; Wei, Z.; Wang, G.; Liu, X.; Liu, F. Delivery of Synergistic Polyphenol Combinations Using Biopolymer-Based Systems: Advances in Physicochemical Properties, Stability and Bioavailability. Crit. Rev. Food Sci. Nutr. 2020, 60, 2083–2097. [Google Scholar] [CrossRef]
  32. Lavelli, V.; Sri Harsha, P.S.C.; Ferranti, P.; Scarafoni, A.; Lametti, S. Grape Skin Phenolics as Inhibitors of Mammalian α-Glucosidase and α-Amylase—Effect of Food Matrix and Processing on Efficacy. Food Funct. 2016, 7, 1655. [Google Scholar] [CrossRef] [PubMed] [Green Version]
  33. Saponjac, V.T.; Cetkovic, G.; Canadanovic-Brunet, J.; Pajin, B.; Djilas, S.; Petrovic, J.; Loncarevic, I.; Stajcic, S.; Vulic, J. Sour cherry Pomace Extract Encapsulated in Whey and Soy Proteins: Incorporation in Cookies. Food Chem. 2016, 207, 27–33. [Google Scholar] [CrossRef] [PubMed]
  34. Moldovan, L.; Craciunescu, O.; Balan, M.; Gaspar, A.; Gherghina, E. The Purification, Physico-Chemical Characterization and Bioactivity of Polysaccharides from Viscum album. Rev. Chim. 2008, 59, 1022–1025. [Google Scholar] [CrossRef]
  35. Gaspar-Pintiliescu, A.; Prelipcean, A.M.; Mihai, E.; Ciucan, T.; Anton, R.E.; Popescu, A.F.; Tomescu, J.; Craciunescu, O. Free Radicals Scavenging, Acetylhydrolase Inhibition and Antimicrobial Activity of Aromatic Plant Hydrolate Mixtures. J. Food Measur. Charact. 2022, 16, 3589–3596. [Google Scholar] [CrossRef]
  36. AOAC International. Official Methods of Analysis of AOAC International, 18th ed.; AOAC International: Rockville, MD, USA, 2005. [Google Scholar]
  37. Craciunescu, O.; Constantin, D.; Gaspar, A.; Toma, L.; Utoiu, E.; Moldovan, L. Evaluation of Antioxidant and Cytoprotective Activities of Arnica Montana L. and Artemisia Absinthium L. Ethanolic Extracts. Chem. Cent. J. 2012, 6, 97–107. [Google Scholar] [CrossRef] [PubMed] [Green Version]
  38. Apostolidis, E.; Kwon, Y.I.; Shetty, K. Inhibitory Potential of Herb, Fruit, and Fungal-Enriched Cheese Against Key Enzymes Linked to Type 2 Diabetes and Hypertension. Innov. Food Sci. Emerg. Technol. 2007, 8, 46–54. [Google Scholar] [CrossRef]
  39. Celep, E.; Charehsaz, M.; Akyuz, S.; Acar, E.T.; Yesilada, E. Effect of In Vitro Gastrointestinal Digestion on the Bioavailability of Phenolic Components and the Antioxidant Potentials of Some Turkish Fruit Wines. Food Res. Int. 2015, 78, 209–215. [Google Scholar] [CrossRef]
  40. Voicescu, M.; Craciunescu, O.; Angelescu, D.G.; Tatia, R.; Moldovan, L. Spectroscopic, Molecular Dynamics Simulation and Biological Studies of Flavin Mononucleotide and Flavin Adenine Dinucleotide in Biomimetic Systems. Spectrochim Acta A Molec. Biomolec. Spectrosc. 2021, 246, 118997. [Google Scholar] [CrossRef]
  41. Iosageanu, A.; Ilie, D.; Craciunescu, O.; Seciu-Grama, A.M.; Oancea, A.; Zarnescu, O.; Moraru, I.; Oancea, F. Effect of Fish Bone Bioactive Peptides on Oxidative, Inflammatory and Pigmentation Processes Triggered by UVB Irradiation in Skin Cells. Molecules 2021, 26, 2691. [Google Scholar] [CrossRef]
  42. Coman, M.M.; Oancea, A.M.; Verdenelli, M.C.; Cecchini, C.; Bahrim, G.E.; Orpianesi, C.; Cresci, A.; Silvi, S. Polyphenol Content and In Vitro Evaluation of Antioxidant, Antimicrobial and Prebiotic Properties of Red Fruit Extracts. Eur. Food Res. Technol. 2018, 244, 735–745. [Google Scholar] [CrossRef]
  43. Tagliani, C.; Perez, C.; Curutchet, A.; Arcia, P.; Cozzano, S. Blueberry Pomace, Valorization of an Industry by-Product Source of Fibre with Antioxidant Capacity. Food Sci. Technol. 2019, 39, 644–651. [Google Scholar] [CrossRef] [Green Version]
  44. Loncaric, A.; Celeiro, M.; Jozinovic, A.; Jelinic, J.; Kovac, T.; Jokic, S.; Babic, J.; Moslavac, T.; Zavadlav, S.; Lores, M. Green Extraction Methods for Extraction of Polyphenolic Compounds from Blueberry Pomace. Foods 2020, 9, 1521. [Google Scholar] [CrossRef] [PubMed]
  45. Vuksan, V.; Jenkins, A.L.; Brissette, C.; Choleva, L.; Jovanovski, E.; Gibbs, A.L.; Bazinet, R.P.; Au-Yeung, F.; Zurbau, A.; Ho, H.V.T.; et al. Salba-Chia (Salvia hispanica L.) in the Treatment of Overweight and Obese Patients with Type 2 Diabetes: A Double-Blind Randomized Controlled Trial. Nutr. Metab. Cardiovasc. Dis. 2017, 27, 138–146. [Google Scholar] [CrossRef] [PubMed]
  46. Oboh, G.; Ogunsuyi, O.B.; Ogunbadejo, M.D.; Adefegha, S.A. Influence of Gallic Acid on α-Amylase and α-Glucosidase Inhibitory Properties of Acarbose. J. Food Drug Anal. 2016, 24, 627–634. [Google Scholar] [CrossRef]
  47. Zheng, Y.; Yang, W.; Sun, W.; Chen, S.; Liu, D.; Kong, X.; Tian, J.; Ye, X. Inhibition of Porcine Pancreatic α-Amylase Activity by Chlorogenic Acid. J. Funct. Food. 2020, 64, 103587. [Google Scholar] [CrossRef]
  48. Riyaphan, J.; Pham, D.C.; Leong, M.K.; Weng, C.F. In Silico Approaches to Identify Polyphenol Compounds as α-Glucosidase and α-Amylase Inhibitors Against Type-II Diabetes. Biomolecules 2021, 11, 1877. [Google Scholar] [CrossRef]
  49. Xu, W.; Shao, R.; Xiao, J.B. Is There Consistency between the Binding Affinity and Inhibitory Potential of Natural Polyphenols as Alpha-Amylase Inhibitors? Crit. Rev. Food Sci. Nutr. 2016, 56, 1630–1639. [Google Scholar] [CrossRef]
  50. Xiao, J.; Hogger, P. Dietary Polyphenols and Type 2 Diabetes: Current Insights and Future Perspectives. Curr. Med. Chem. 2015, 22, 23–38. [Google Scholar] [CrossRef]
  51. Platzer, M.; Kiese, S.; Tybussek, T.; Herfellner, T.; Schneider, F.; Schweiggert-Weisz, U.; Eisner, P. Radical scavenging Mechanisms of Phenolic Compounds: A Quantitative Structure-Property Relationship (QSPR) Study. Front. Nutr. 2022, 9, 882458. [Google Scholar] [CrossRef]
  52. Sieminska-Kuczer, A.; Szymanska-Chargot, M.; Zdunek, A. Recent Advances in Interactions between Polyphenols and Plant Cell Wall Polysaccharides as Studied using an Adsorption Technique. Food Chem. 2022, 373, 131487. [Google Scholar] [CrossRef]
  53. Mercado-Mercado, G.; de la Rosa, L.A.; Alvarez-Parrilla, E. Effect of Pectin on the Interactions Among Phenolic Compounds Determined by Antioxidant Capacity. J. Mol. Struct. 2020, 1199, 126967. [Google Scholar] [CrossRef]
  54. Piechowiak, T.; Skora, B.; Grzelak-Blaszczyk, K.; Sojka, M. Extraction of Antioxidant Compounds from Blueberry Fruit Waste and Evaluation of Their In Vitro Biological Activity in Human Keratinocytes (HaCaT). Food Anal. Methods. 2021, 14, 2317–2327. [Google Scholar] [CrossRef]
  55. Vuong, T.; Matar, C.; Ramassamy, C.; Haddad, P.S. Biotransformed Blueberry Juice Protects Neurons from hydrogen Peroxide-Induced Oxidative Stress and Mitogen-Activated Protein Kinase Pathway Alterations. Br. J. Nutr. 2010, 104, 656–663. [Google Scholar] [CrossRef] [Green Version]
  56. Sanchez-Velazquez, O.A.; Mulero, M.; Cuevas-Rodriguez, E.O.; Mondor, M.; Arcand, Y.; Hernandez-Alvarez, A.J. In Vitro Gastrointestinal Digestion Impact on Stability, Bioaccessibility and Antioxidant Activity of Polyphenols from Wild and Commercial Blackberries (Rubus spp.). Food Funct. 2021, 12, 7358–7378. [Google Scholar] [CrossRef] [PubMed]
  57. Kuhn, P.; Kalariya, H.M.; Poulev, A.; Ribnicky, D.M.; Jaja-Chimedza, A.; Roopchand, D.E.; Raskin, I. Grape polyphenols Reduce Gut-Localized Reactive Oxygen Species Associated with the Development of Metabolic Syndrome in Mice. PLoS ONE 2018, 13, e0198716. [Google Scholar] [CrossRef] [Green Version]
  58. Pap, N.; Fidelis, M.; Azevedo, L.; do Carmo, M.A.V.; Wang, D.; Mocan, A.; Pereira, E.P.R.; Xavier-Santos, D.; Sant’Ana, A.S.; Yang, B.; et al. Berry Polyphenols and Human Health: Evidence of Antioxidant, Anti-Inflammatory, Microbiota Modulation, and Cell-Protecting Effects. Curr. Opin. Food Sci. 2021, 42, 167–186. [Google Scholar] [CrossRef]
  59. Zhou, L.; Xie, M.; Yang, F.; Liu, J. Antioxidant Activity of High Purity Blueberry Anthocyanins and the Effects on Human Intestinal Microbiota. LWT 2020, 117, 108621. [Google Scholar] [CrossRef]
  60. Jiao, X.; Wang, Y.; Lin, Y.; Lang, Y.; Li, E.; Zhang, X.; Zhang, Q.; Feng, Y.; Meng, X.; Li, B. Blueberry Polyphenols Extract as a Potential Prebiotic with Anti-Obesity Effects on C57BL/6 J Mice by Modulating the Gut Microbiota. J. Nutr. Biochem. 2019, 64, 88–100. [Google Scholar] [CrossRef] [PubMed]
  61. Westfall, S.; Lomis, N.; Prakash, S. A Novel Polyphenolic Prebiotic and Probiotic Formulation Have Synergistic Effects on the Gut Microbiota Influencing Drosophila melanogaster Physiology. Artif. Cells Nanomed. Biotechnol. 2018, 46, 441–455. [Google Scholar] [CrossRef] [Green Version]
  62. Semwal, A.; Ambatipudi, K.; Navani, N. Development and Characterization of Sodium Caseinate Based Probiotic Edible Film with Chia Mucilage as a Protectant for the Safe Delivery of Probiotics in Functional Bakery. Food Hydrocoll. Health 2022, 2, 100065. [Google Scholar] [CrossRef]
Figure 1. Inhibition of α-amylase activity in the presence of blueberry pomace extract (BP), chia seed extract (CS) and their mixture (BCM). Acarbose served as control. * p < 0.05, compared to control.
Processes 11 01025 g001
Figure 2. Free DPPH radical scavenging activity of blueberry pomace extract (BP), chia seed extract (CS) and their mixture (BCM). Trolox served as control. * p < 0.05, compared to control.
Processes 11 01025 g002
Figure 3. The cell viability of Caco-2 cells treated with post-gastric (PG) and post-intestinal (PS, PC) digestion products of blueberry pomace extract (BP) and BCM mixture for 24 h, assessed by Neutral Red assay. The results are expressed as mean ± SD (n = 3). * p < 0.05, compared to the untreated cells (control).
Processes 11 01025 g003
Figure 4. Flow cytometry analysis of oxidative-stressed Caco-2 cells (B) pretreated with 100 µg/mL of intestinal digestion products PS-BP (D), PS-BCM (E), PC-BP (F) and PC-BCM (G), for 24 h. Untreated cells (A) and cells treated with 12 µM ascorbic acid (C) served as a control.
Processes 11 01025 g004
Figure 5. Growth of Lactobacillus rhamnosus and Lactobacillus acidophilus cultivated in the presence of 100 µg/mL of digestion products reaching the colon (PC) of blueberry pomace extract (BP) and BCM mixture, after 24 h of treatment. The results are expressed as mean ± SD (n = 3). * p < 0.05, compared to untreated control; # p < 0.05, compared to PC-BP.
Processes 11 01025 g005
Table 1. Total phenolic, flavonoid and carbohydrate content of blueberry pomace extract (BP) and chia seed extract (CS). The results are expressed as mean ± SD (n = 3).
SampleTotal Phenolic Content
(g GAE/100 g Dry Weight)
Total Flavonoids Content
(g QE/100 g Dry Weight)
Total Carbohydrates Content
(g/100 g Dry Weight)
BP30.40 ± 1.281.89 ± 0.07 -
CS3.93 ± 0.150.72 ± 0.0370.78 ± 4.41
Table 2. HPLC analysis of phenolic compounds in blueberry pomace extract. The results are expressed as mean ± SD (n = 3).
CompoundQuantity
(mg/100 g Dry Weight)
Gallic acid 5043.27 ± 181.03
Chlorogenic acid1509.41 ± 61.37
Caffeic acid200.60 ± 9.45
p-Coumaric acid251.85 ± 8.75
Ferulic acid118.14 ± 5.18
Rutin609.78 ± 23.26
Luteolin 7-glucoside262.11 ± 12.91
Kaempferol 3-glucoside161.46 ± 6.76
Myricetin175.18 ± 7.22
Resveratrol103.43 ± 4.69
Quercetin316.46 ± 11.84
Table 3. Quantification of ROS production in oxidative stressed Caco-2 cells (B) treated with 100 µg/mL of intestinal digestion products PS-BP (D), PS-BCM (E), PC-BP (F) and PC-BCM (G), performed by flow cytometry. Untreated cells (A) and cells treated with 12 µM ascorbic acid (C) served as a control. The results are expressed as mean ± SD (n = 3). * p < 0.05, compared to the oxidative stressed group; # p < 0.05, compared to ascorbic acid-treated group.
HistogramSampleROS Production (%)
BOxidative-stressed group100.00 ± 4.03
CPS-BP46.70 ± 2.24 *,#
DPS-BCM41.43 ± 1.56 *,#
EPC-BP36.41 ± 2.13 *,#
FPC-BCM34.86 ± 1.06 *
GAscorbic acid (control)30.16 ± 2.12 *
Disclaimer/Publisher’s Note: The statements, opinions and data contained in all publications are solely those of the individual author(s) and contributor(s) and not of MDPI and/or the editor(s). MDPI and/or the editor(s) disclaim responsibility for any injury to people or property resulting from any ideas, methods, instructions or products referred to in the content.

