
Rail Magnetic Flux Leakage Detection and Data Analysis Based on Double-Track Flaw Detection Vehicle

1
College of Automation Engineering, Nanjing University of Aeronautics and Astronautics, Nanjing 211106, China
2
Nanjing Institute of Railway Technology, Nanjing 210031, China
*
Author to whom correspondence should be addressed.
Processes 2023, 11(4), 1024; https://doi.org/10.3390/pr11041024
Submission received: 23 February 2023
/
Revised: 16 March 2023
/
Accepted: 22 March 2023
/
Published: 28 March 2023
Abstract
:The rapid development of the railway industry has brought convenience to people’s lives. However, with the high speed, high frequency and heavy load characteristics of rail use, the safety of rail is seriously threatened. In this paper, a magnetic flux leakage testing (MFL) detection technology of rail based on a double-track flaw detection vehicle is introduced in detail, which can effectively detect the damage of rail top surface, which is the blind area of ultrasonic detection. The magnetic dipole model is used to analyze that the leakage magnetic field in the direction of Bx and Bz above the damage is related to the depth and width of the damage. The relationship between the depth of the damage and the leakage magnetic field is quantitatively studied for the damage with fixed width but varying depth. The finite element simulation tool is used to model and simulate the damage at different depths. After analyzing the different characteristic values, it is found that the peak value of magnetic leakage signal has a certain correlation with the depth of damage, and the natural logarithm function is fitted out—VBx = 0.1451ln(b) + 0.2705, VBz = 2.7787ln(b) + 0.0087. In order to verify the prediction function of the injury depth fitted by the simulation data, the human injury with different depths was processed and the dual-track flaw detector was used to carry out the experiment of high-speed detection environment. The peak-to-peak fitting of the magnetic leakage signals in the direction of Bx and Bz of the experimental results shows that the peak-to-peak variation rule is roughly in line with the natural logarithm function in the simulation. The correlation between the fitting results of the experimental data and the simulation fitting function is analyzed using the Pearson coefficient. The Pearson coefficient in the direction of Bx is ρx = 0.91386. The Pearson coefficient of the Bz direction is ρz = 0.98597, the peak-to-peak value of Bx and Bz direction is positively correlated with the depth of damage and the fitting effect of the Bz direction is better than that of the Bx direction.
1. Introduction
By 2022, the scale of China’s railway network reached 150,000 km, including 30,000 km of high-speed railways, covering more than 80% of major cities; by 2025, the coverage will be expanded, and the scale will reach 175,000 km, including 38,000 km of high-speed railways [1]. At the same time, the rapid development of railways represented by high-speed railways is the key to the peripheral interconnection and the formation of international transport corridors.
During the rapid development and successful application of high-speed railways on a large scale, the safety of rail infrastructure plays an important role in ensuring the safe and smooth operation of railways [2,3]. With the high-speed, heavy-load and high-density railway traffic of the new era, the probability of defect to the infrastructure represented by rails increases, resulting in huge loss and failure [4]. At home and abroad, there have been cases of major railway accidents. In China, more than 40,000 serious injuries and more than 100 broken rails are found on the ordinary speed line every year [5]. The reason that these injuries and defects have not yet occurred on high-speed railways is that high-speed railways adopt a strict mechanism of regular maintenance and replacement, leading to huge maintenance costs [6].
In order to change the maintenance of high-speed railways in China from regular repair to fault repair or condition repair, it is necessary to accurately grasp the rail damage through inspection, and guide the maintenance according to the damage status [7]. It can be seen that the accuracy and time help to discover the defect, and the responses in line with the state of the damage are key to ensuring railway safety, an important guarantee for people’s lives and national property [8,9].
According to existing rolling contact fatigue (RCF) research, the rail bears the pressure and impact load from the wheel, and the defect developed in the operating process directly affects the mechanical structure performance and its use life [10]. The defect poses a threat to different rail positions in its development. The defects can be classified into the following groups by their position, including rail surface fatigue and stress concentration, rail surface defect, rail head transverse crack, rail jaw defect, rail screw hole defect and rail bottom defect [11]. Specifically, the rail surface defect is divided into rail surface material microstructure change, fatigue, abrasion, grinding, rail head surface and near-surface crack, spalling, tread crushing, etc.
Ultrasonic testing (UT) is now commonly used in rail inspection. With a maximum detection speed of 80 km/h, it needs to be carried by a large high-speed rail flaw detection vehicle [12]. It can detect internal large defects by scanning the track head, web and base thoroughly. Based on the principle that propagation speed varies in different media, UT analyzes the received echoes to identify defects. However, ultrasonic waves can produce a large echo signal on the rail surface, making it difficult to effectively detect the rail surface defect. Therefore, rail surface defect detection is still a blind area for UT.
MFL detection is mainly for the damage on the top surface and near surface of the rail. It first needs to magnetize the tested rail. The design principle of the magnetizer is to make the magnetic line of force cut the edge of the defect. When there is a defect on the surface or the near surface of the magnetization path, as the permeability of the material is medium and air is not equal, according to the principle of magnetic flux continuity, magnetic refraction will occur at the location of the defect and will be finally manifested as magnetic leakage [13,14,15]. Therefore, the basic principle of magnetic flux leakage detection is based on the sudden change in permeability at the defect of the measured workpiece.
DC MFL will not produce a skin effect as it works under DC-regulated power supply without the use of a couplant, so it will not affect the detection depth. Rail top surface detection with an array sensor can effectively detect RCF defects such as rail surface abrasion, spalling, indentation, fish-scale defect and so on [16,17,18].
In addition to large defect detection vehicles, domestic railway companies have gradually adopted electric dual-rail defect detectors, with battery-powered miniaturized vehicles, and they carry wheel-based ultrasonic detection equipment at the speed of no more than 20 km/h.
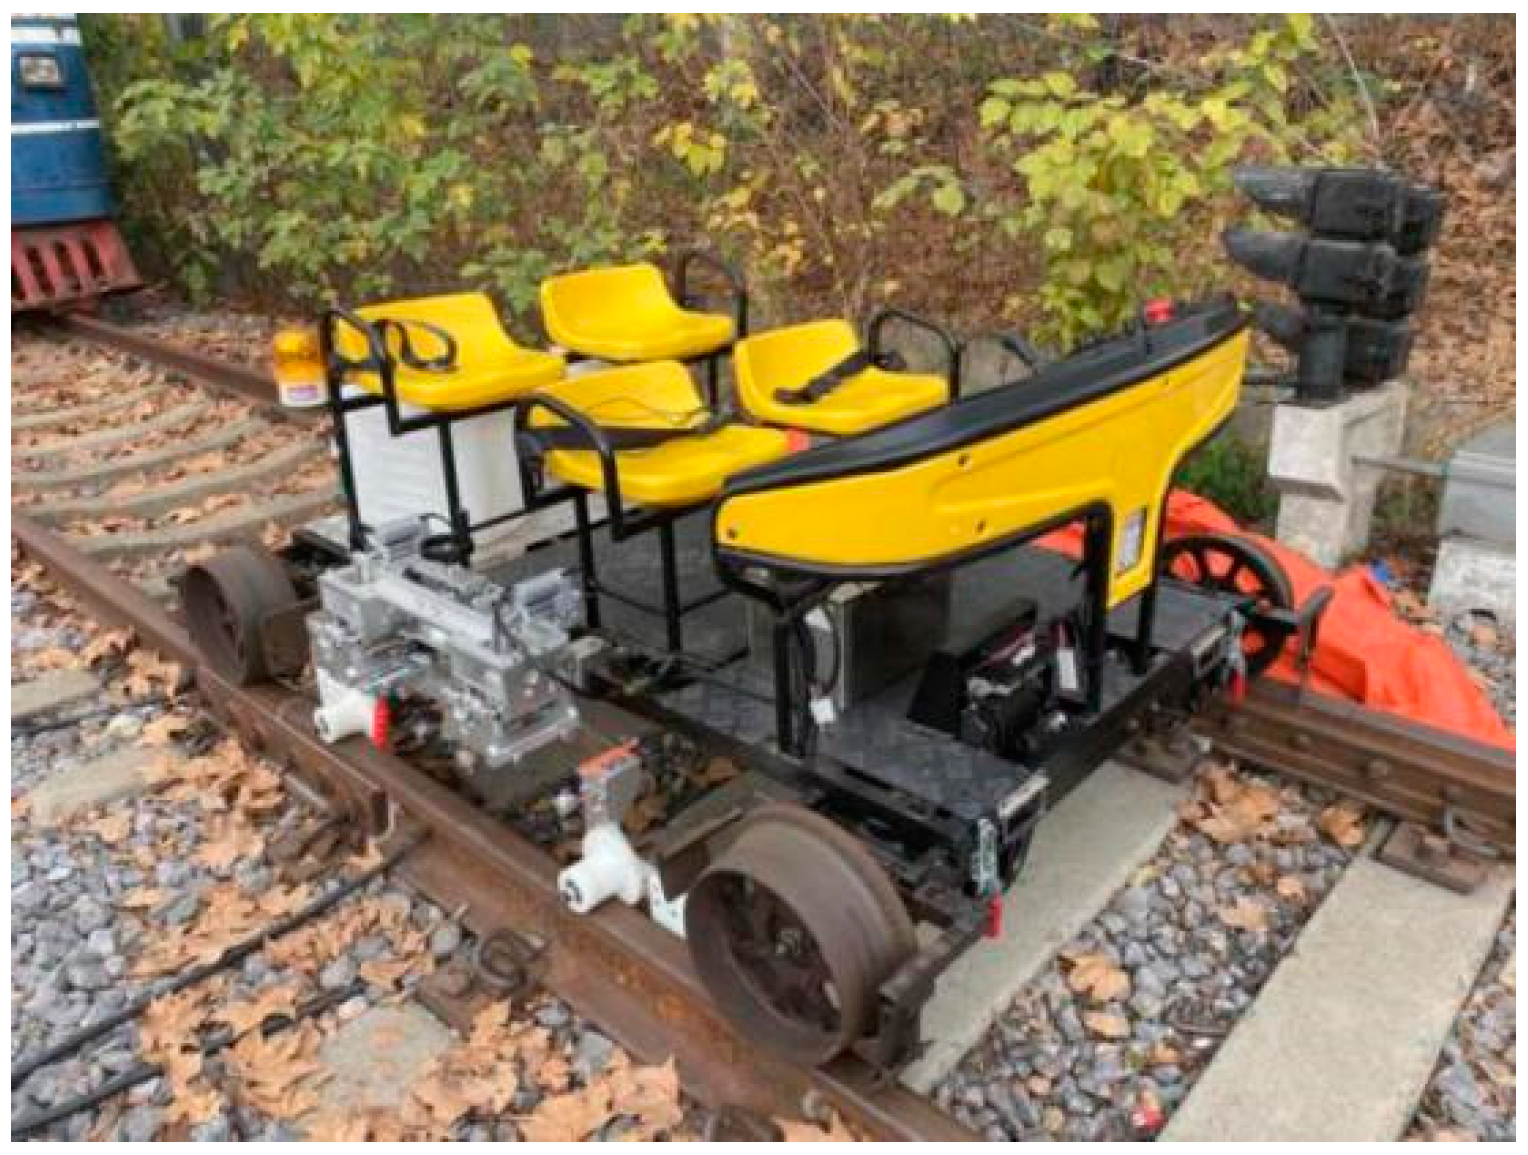
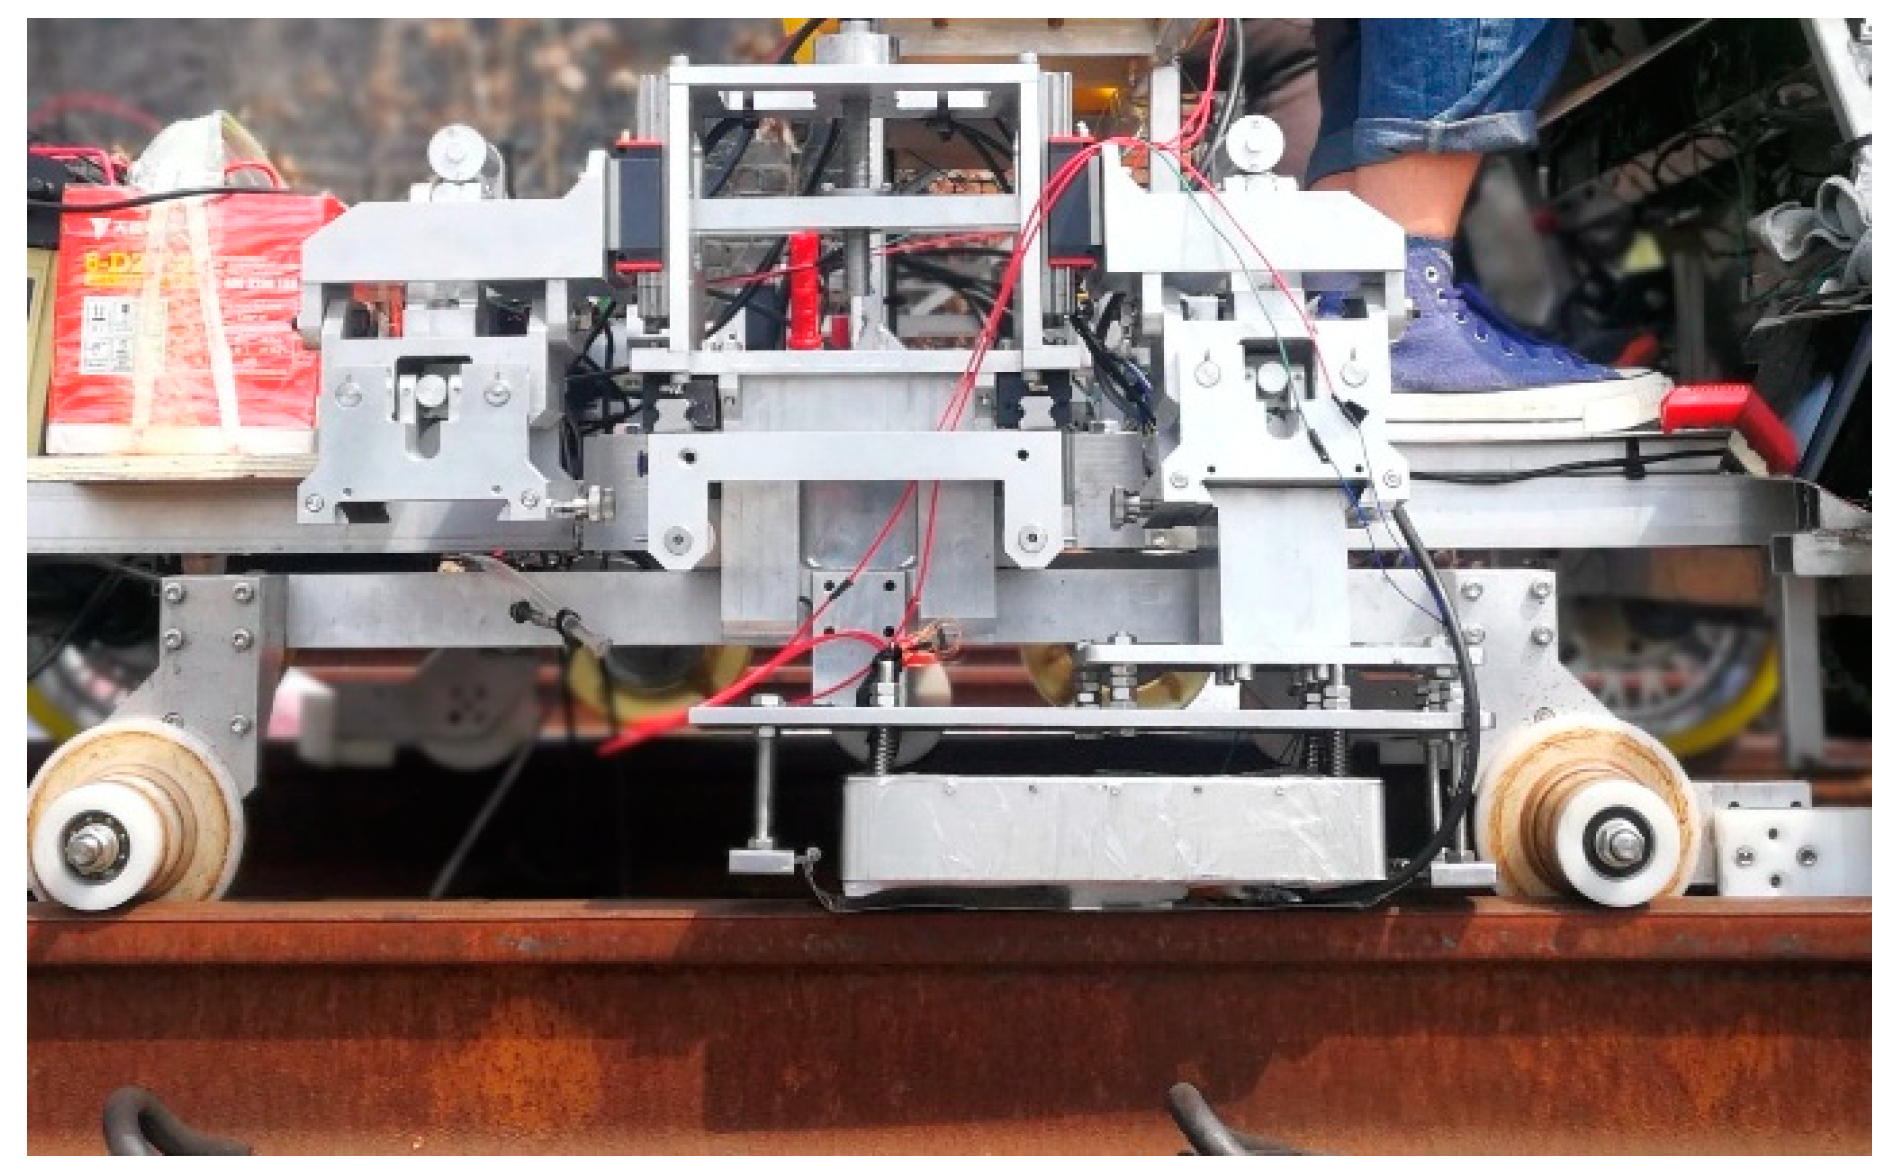
The electric double-track rail flaw detection vehicle is undergoing automation, miniaturization, electrification and integration, of which automatic driving, remote control and automatic detection, as well as automatic defect detection and positioning, are realized gradually [19,20,21,22]. Integrating the MFL with the electric double-track rail flaw detection vehicle greatly improves the accuracy, flexibility and efficiency of rail detection, and greatly protects the safety of people’s lives and property [23,24]. The double-track rail flaw detection vehicle is shown in Figure 1.
In the study of rail damage, Chen et al. used the finite element method to study the velocity effect of railway magnetic flux leakage detection and the identification of rail oblique cracks [25]. Wilson et al. used the magnetic leakage detection method to detect the crack of rail tread [26]. Oliveria and Gao et al. used ANSYS finite element software to establish a two-dimensional mathematical model of the defect leakage field, and obtained the flux density distribution curve via the finite element method [27]. By comparing the characteristic values of the flux leakage density curve, they obtained the characteristics of magnetic flux leakage signals of different defect types and the same defect type, and identified the defect information through the characteristics. The Gao team proposed a track magnetic flux leakage detection system based on AT89C51, based on magnetic flux leakage detection technology [28]. The system is stable, and has the advantages of high detection accuracy and fast speed.
In the research on the depth of damage detection, Antipov et al. proposed a new magnetization system, which detects the depth of rail defects via the magnetic method [29]. Hu Linhai applied infrared thermal imaging technology to detect hole defects in the shallow surface of the aluminum plate which, combined with a genetic algorithm and gradient enhancement algorithm, realized the quantitative evaluation and detection of different apertures and hole depth [30]. All of these methods can be used for the quantitative analysis of damage under specific conditions, but at present there is no depth prediction research on damage under a high-speed detection environment by combining simulation and experiment.
The following sections of this paper introduce the MFL technique, and conduct a quantitative analysis of defects at different depths through simulation. Section 3 describes the MFL system of a double-track rail flaw detection vehicle. The experiment is described in Section 4, including the experimental environment and the data analysis results, by comparing experimental results and simulation results.
2. MFL Technique
The MFL technique is a type of non-destructive testing (NDT) [31] that uses a magneto-dependent sensor to convert the magnetic flux leakage field into voltage signal and extract the defect information in the signal through signal processing techniques such as signal rectification, acquisition and digital filtering after the magnetic field “leak” from the surface defects or near-surface defects of ferromagnetic material being magnetically excited through the DC, AC, AC/DC and permanent magnet excitation.
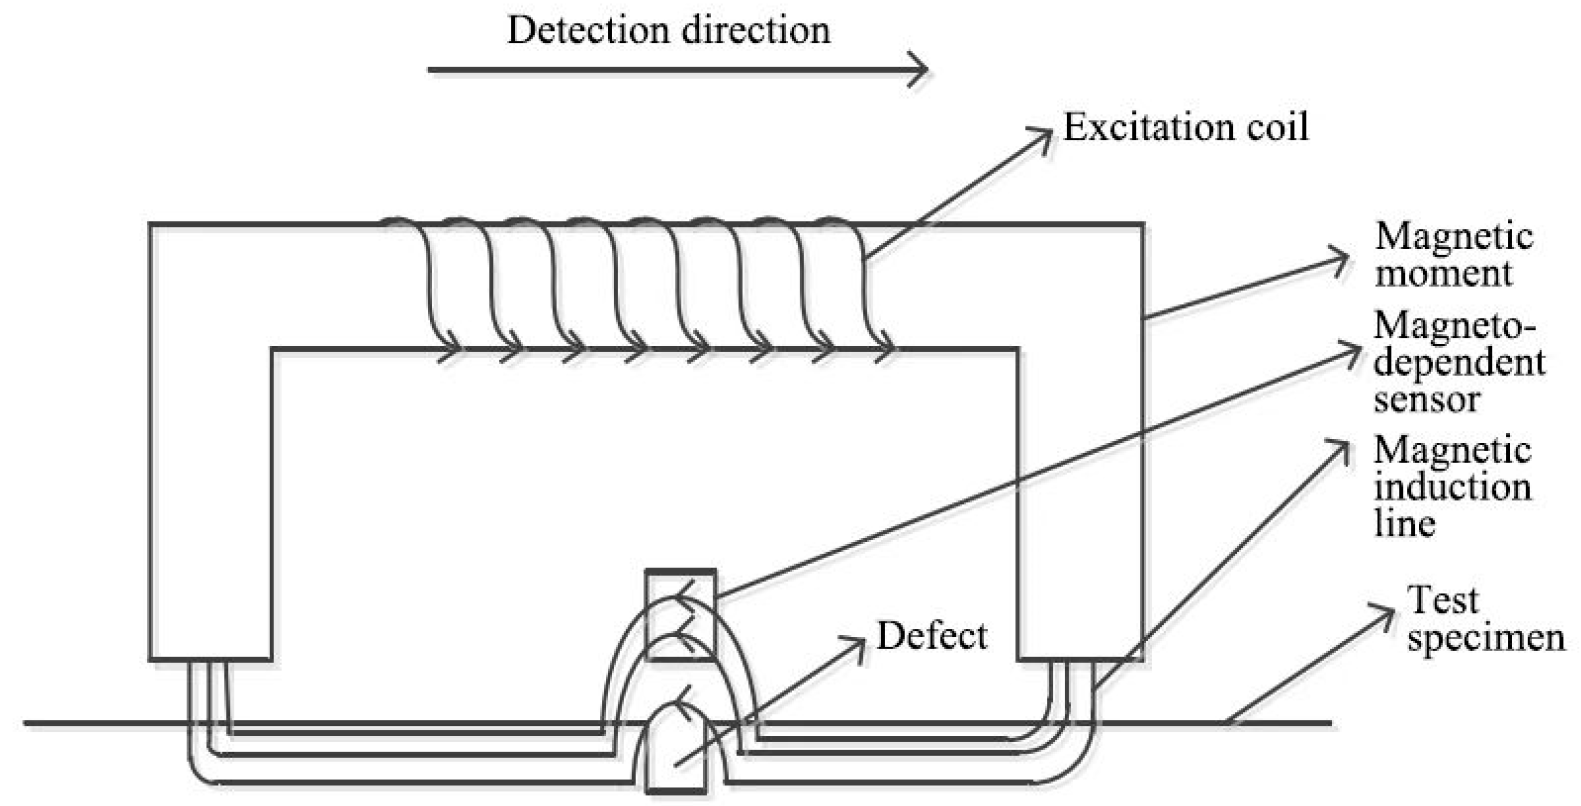
With the advantages of simple structure, simple signal processing, intuitive signal, high reliability, easy automation, small external interference and non-couplant, the DC MFL technique is widely used in line testing fields such as rail, steel pipe, long-distance oil and gas pipelines [32]. As shown in Figure 2, rail, the measured object, is magnetized by the electromagnetic field generated from applied DC excitation. When the magnetic induction line passes through the defect, there will be magnetic refraction at the interface between the air and the rail because of the discontinuity of magnetic conductivity caused by the defect, making part of the magnetic field leak into the air above the defect and form an MFL field due to magnetic diffusion and magnetic compression effects.
2.1. Magnetic Dipole Model
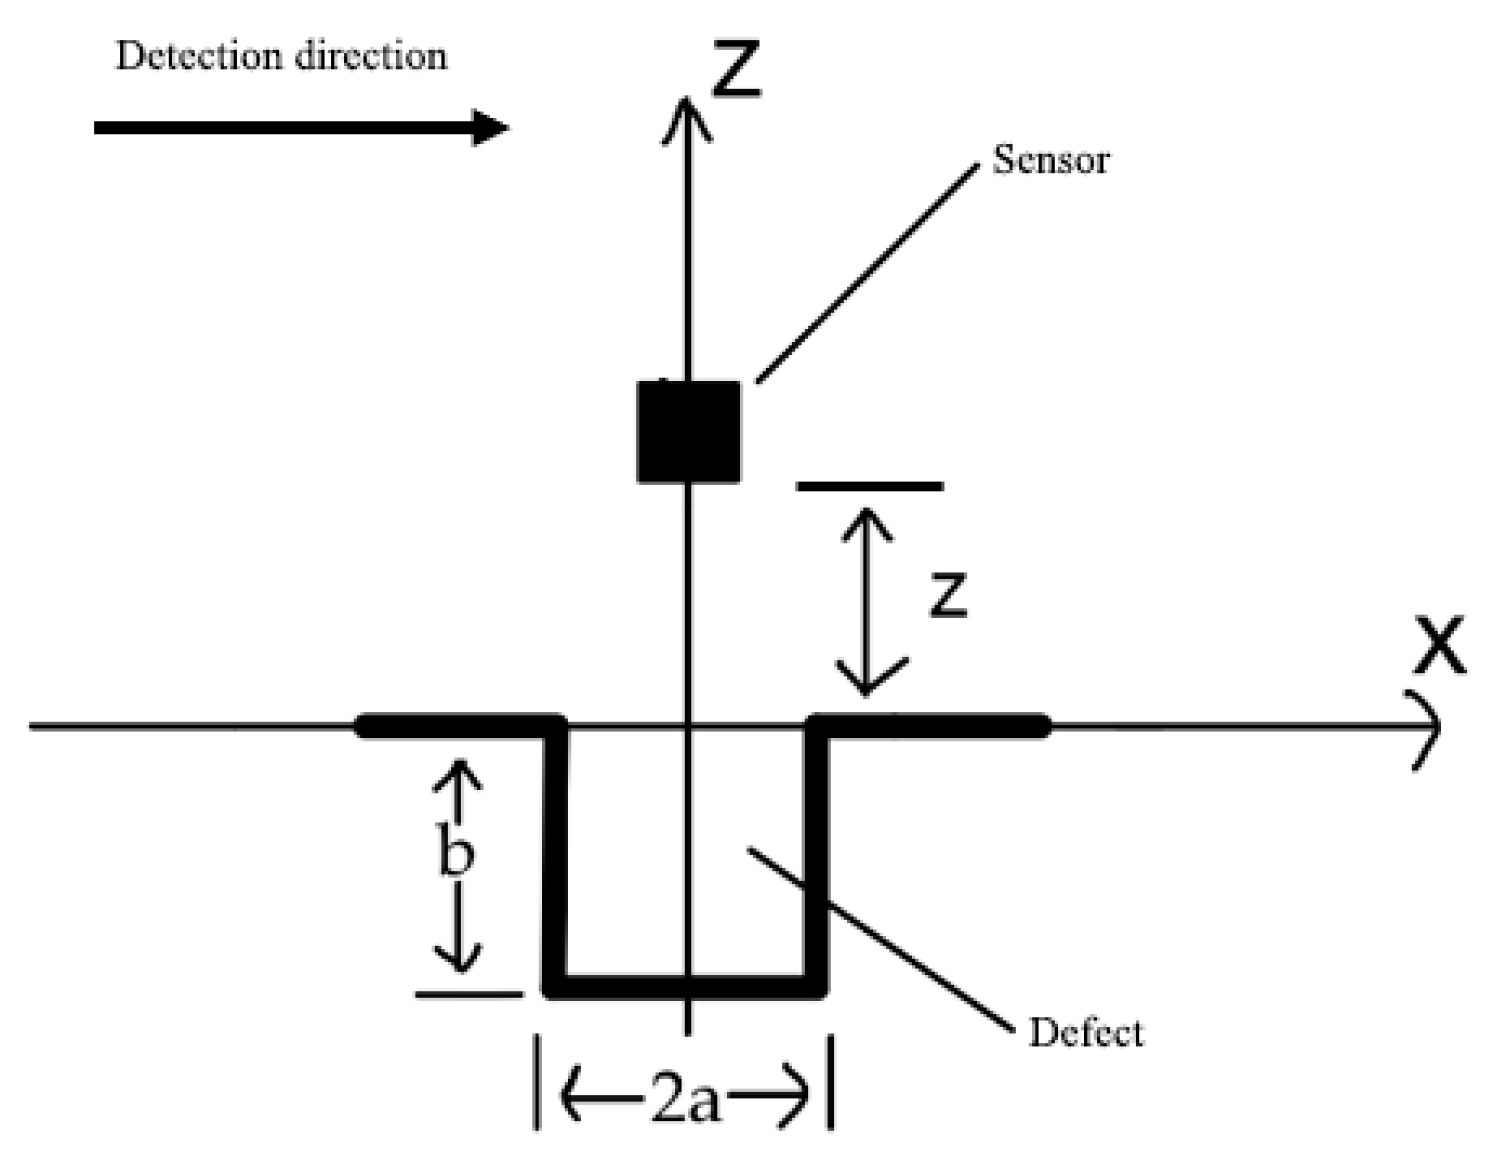
A magnetic dipole model (MDM) analysis was performed above the defect, and the rail defect profile in the direction of train travel is shown in Figure 3.
Assume that the defect width was 2a, defect depth was b, sensor lift-off was z, the coordinate of the sensor right above the defect was and magnetic flux leakage field was . The magnetic flux leakage field was in the x direction and in the z direction. The formula is shown below.
where was the magnetic charge density on the defect side, which was calculated by Formula (3).
where μ was the magnetic conductivity of the material and H was the applied magnetic field intensity.
A magneto-dependent sensor was used to convert magnetic flux leakage field into voltage signal. After signal conditioning, it was collected and finally processed and displayed using PC software.
2.2. Magnetic Flux Leakage Sensor
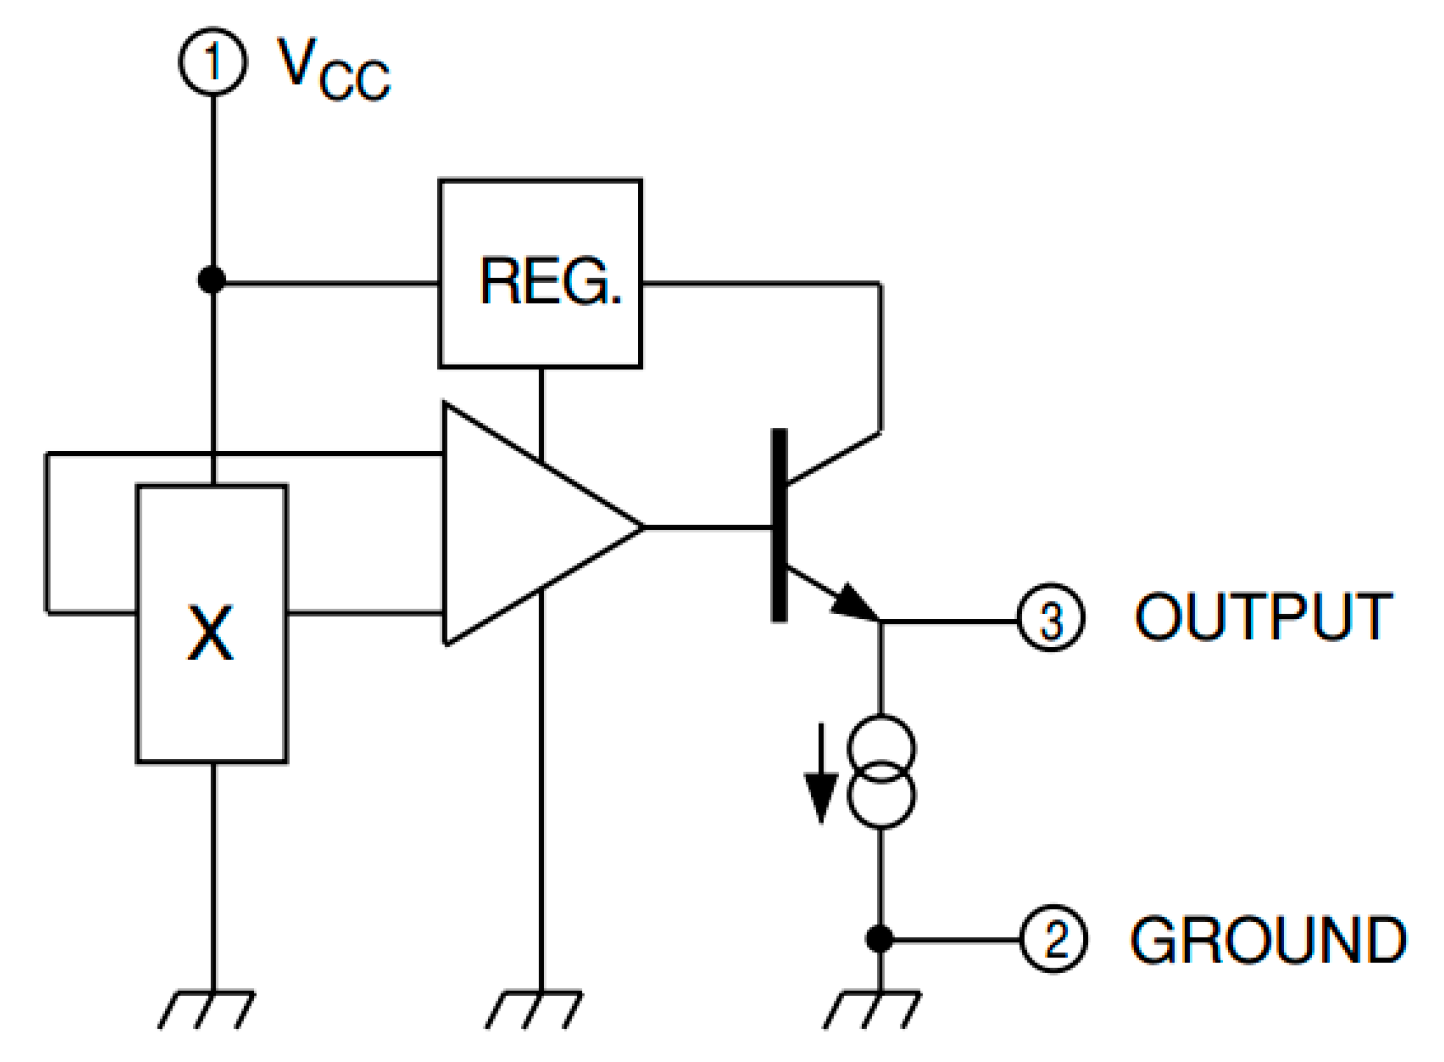
Magnetic flux leakage signals can be extracted through many ways, including giant magneto resistance (GMR) sensor detection, coil detection and Hall sensor detection. The huge volume of the GMR sensor makes it difficult to achieve multi-channel defect reconstruction. Meanwhile, the coil detection method, although it works under a high frequency magnetic field and can effectively detect rail surface defects, demonstrates low efficiency in near-surface buried defect detecting. Thus, we adopted the UGN3503 Hall sensor of high accuracy, good low frequency response and high integration. It is designed as an array sensor for defect reconstruction and good lateral resolution of defects. Figure 4 illustrates the internal structure of the UGN3503 Hall sensor.
3. Quantitative Simulation of Defect Depth
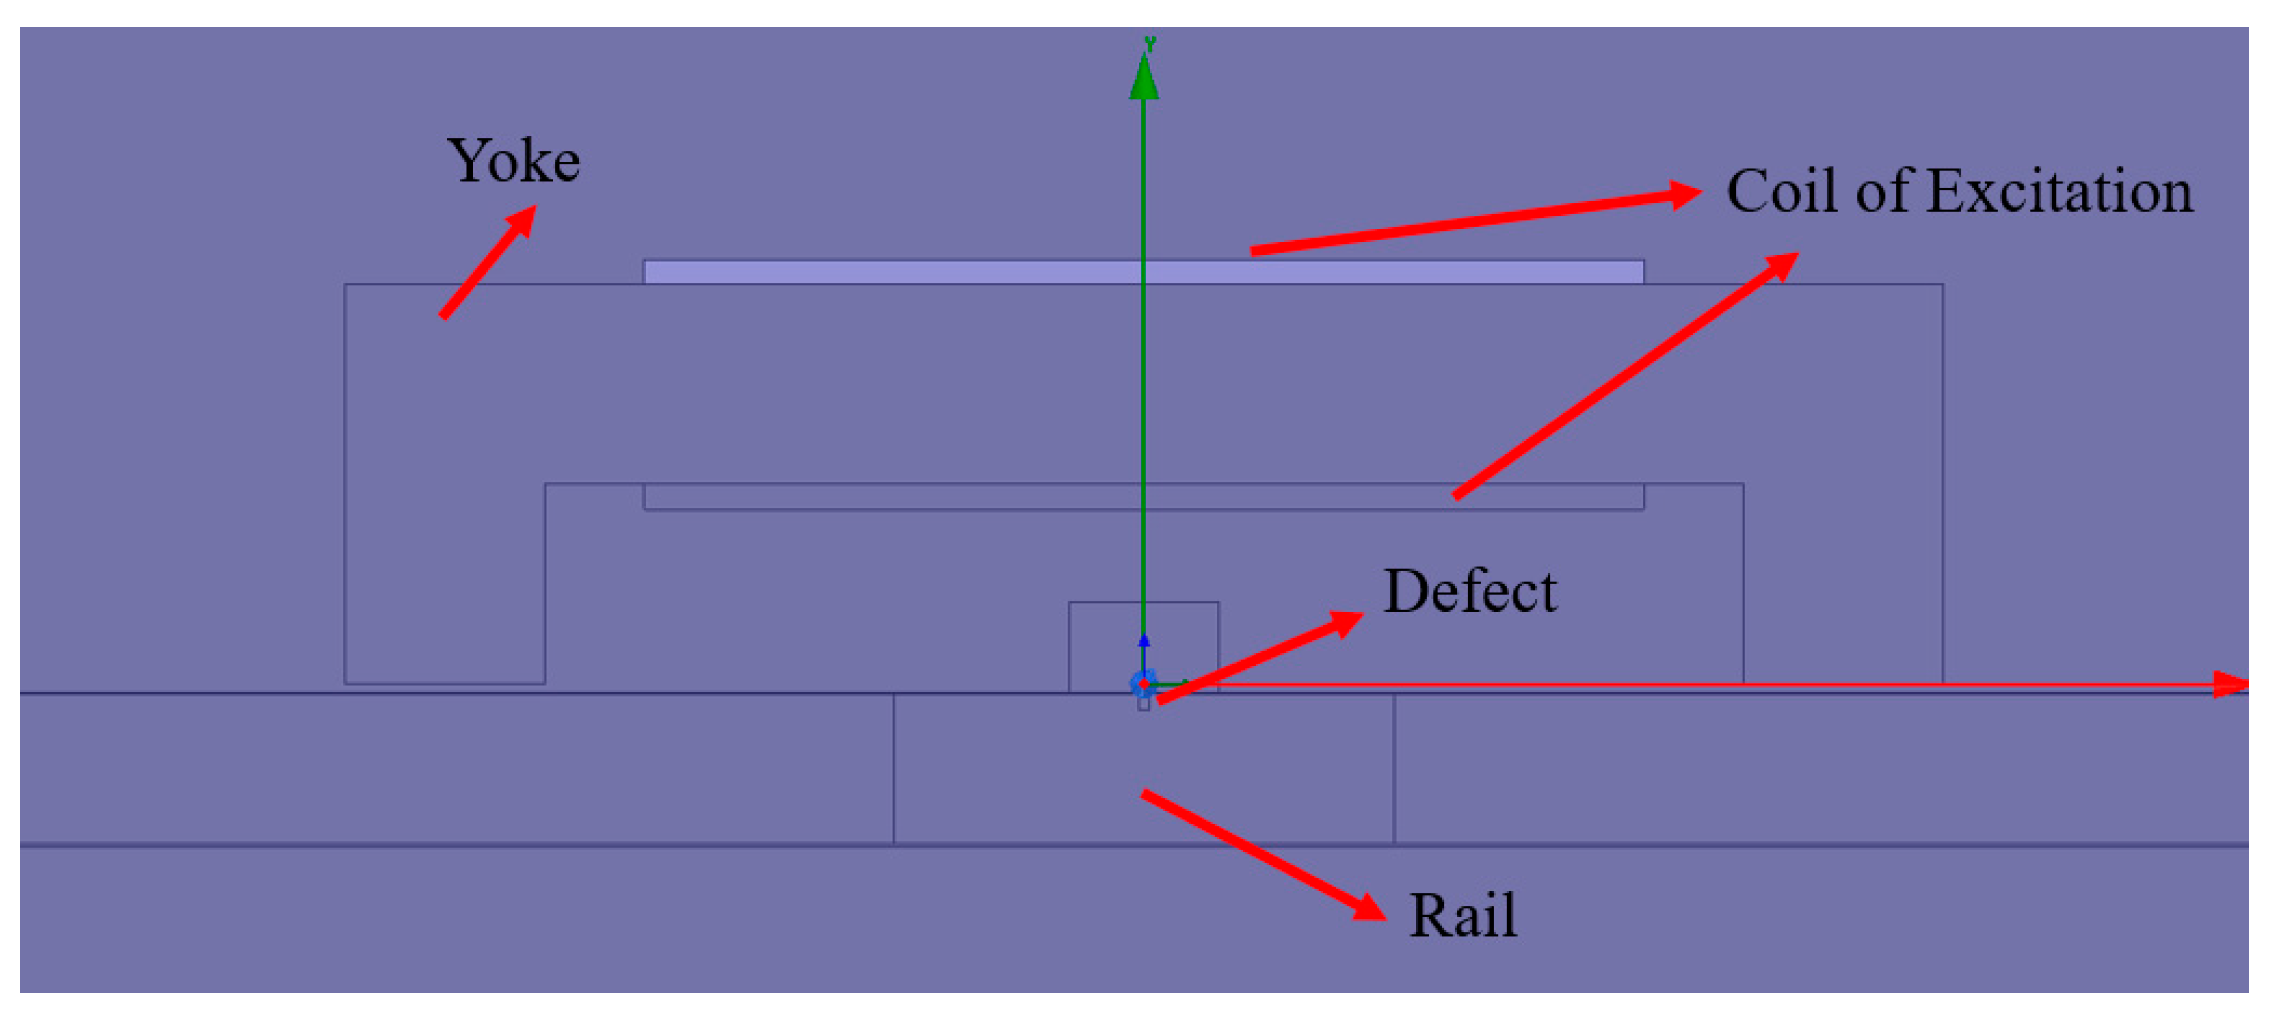
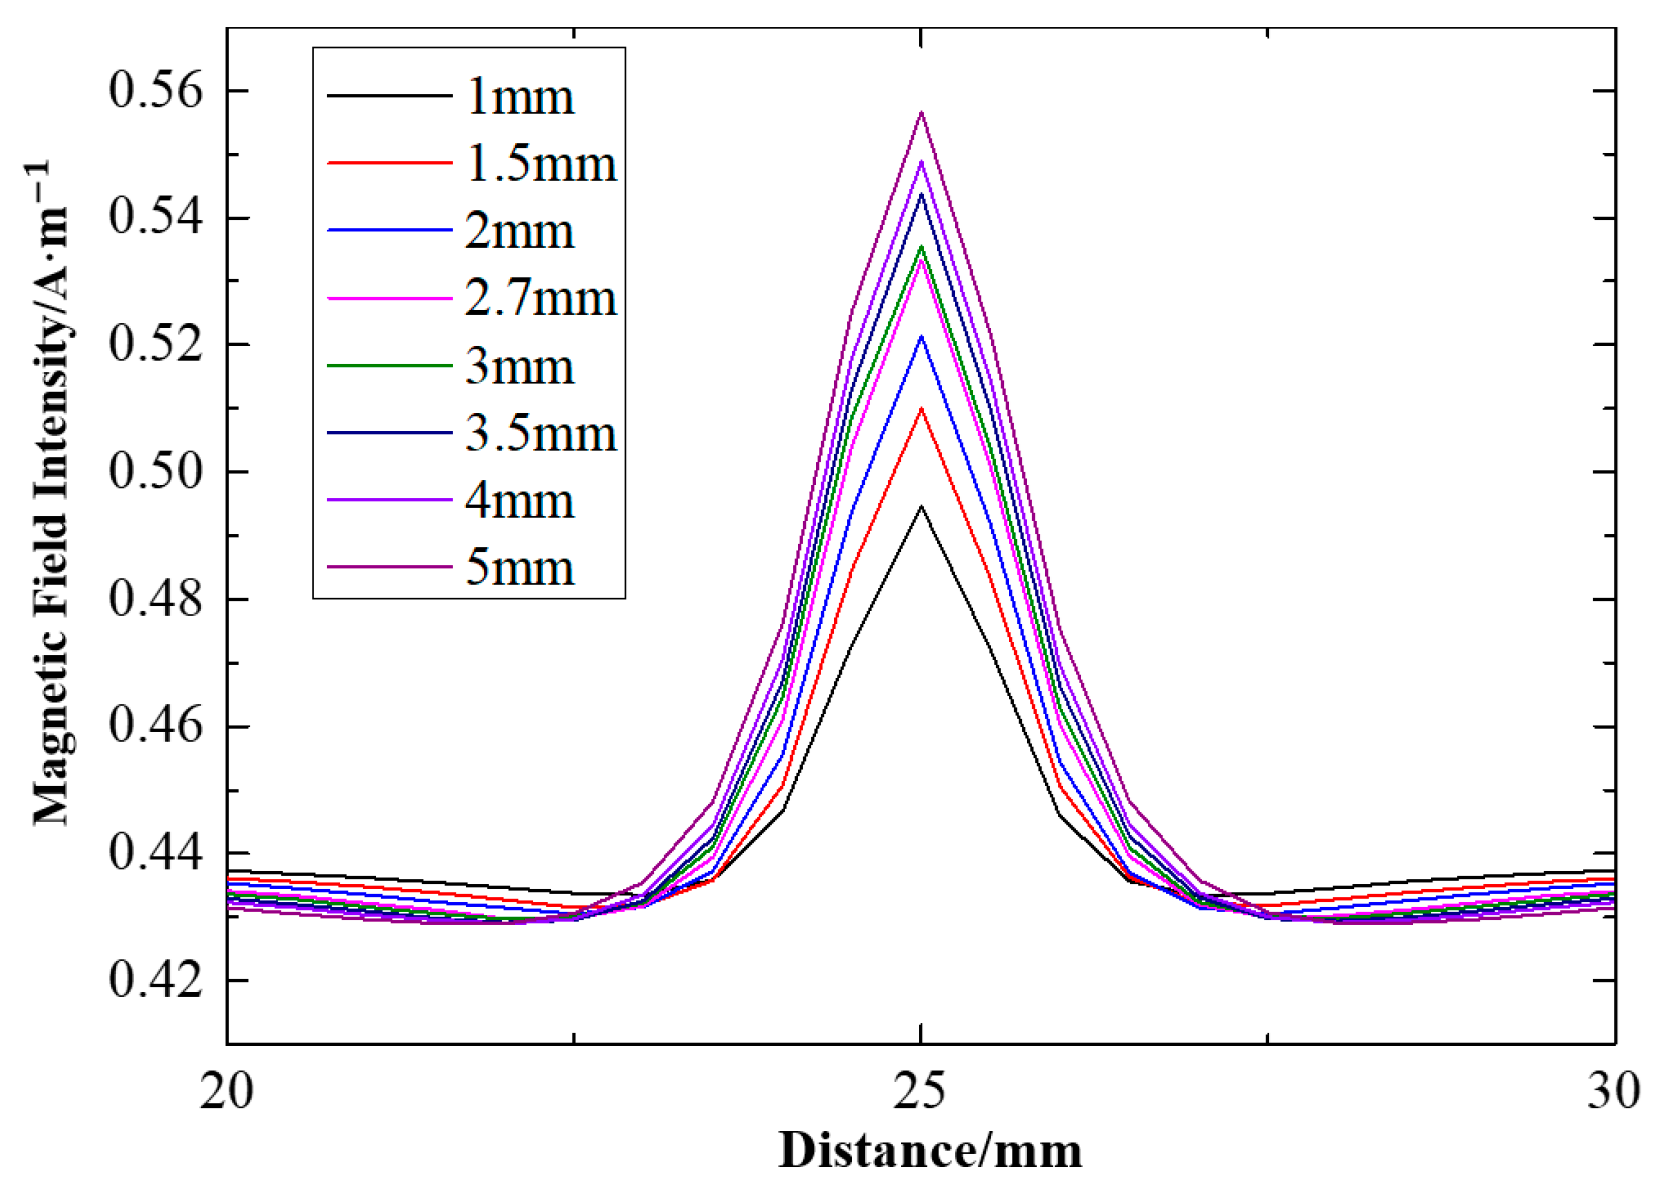
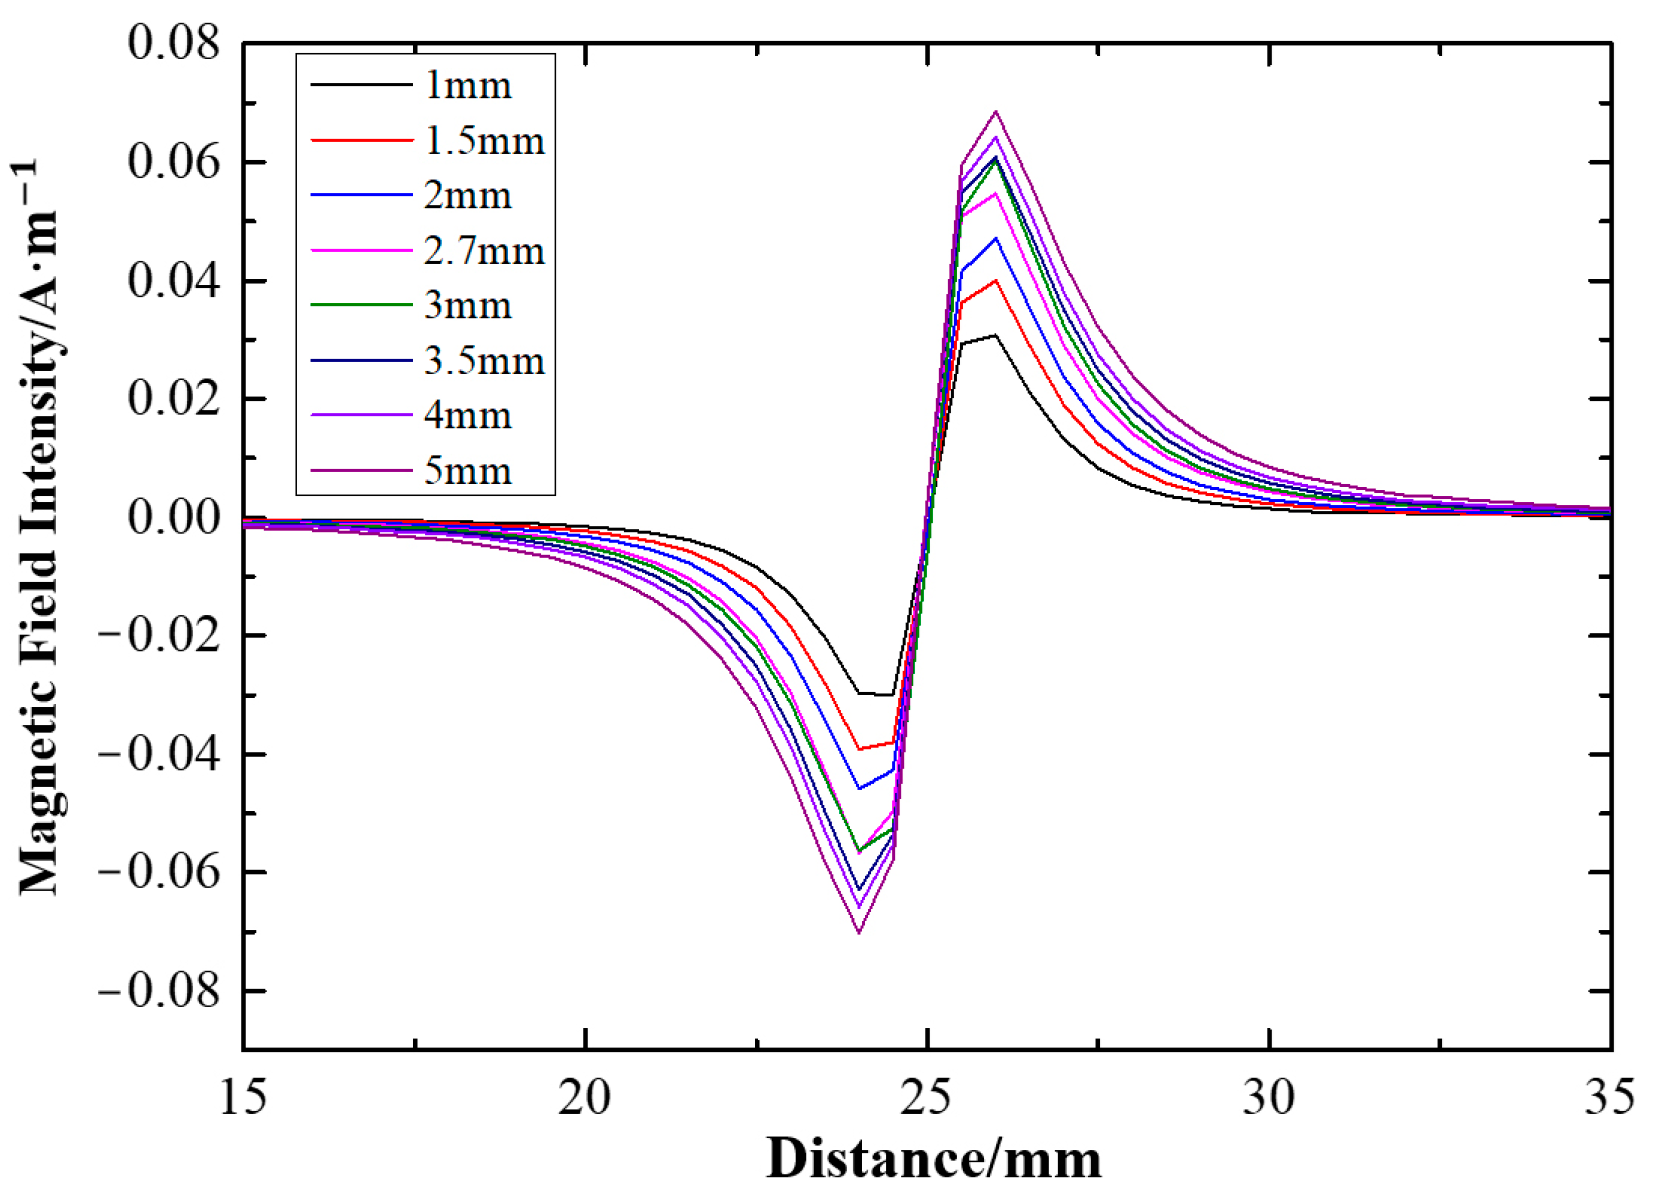
The finite element analysis software used in this paper was ANSYS Maxwell 16, a type of electromagnetic simulation software, which can realize effective electromagnetic simulation via FE simulation analysis [33]. Two-dimensional transient simulation was adopted, including U-type magnetic yoke, coil of excitation, rail, defect, etc. (Figure 5). The simulation of defects at different depths helps discover eigenvalues related to defect depth. The magnetic flux leakage signals in the Bx and Bz directions are shown in Figure 6 and Figure 7, with the former being a unimodal signal and the latter being a bimodal signal.
Set the sensor lift-off to 1 mm, defect width to 0.2 mm, defect depth to 1.0, 1.5, 2.0, 2.7, 3.0, 3.5 and 4.5 mm and motion range to −25~25 mm. The simulation results of the Bx and Bz direction signals are shown in Figure 6 and Figure 7.
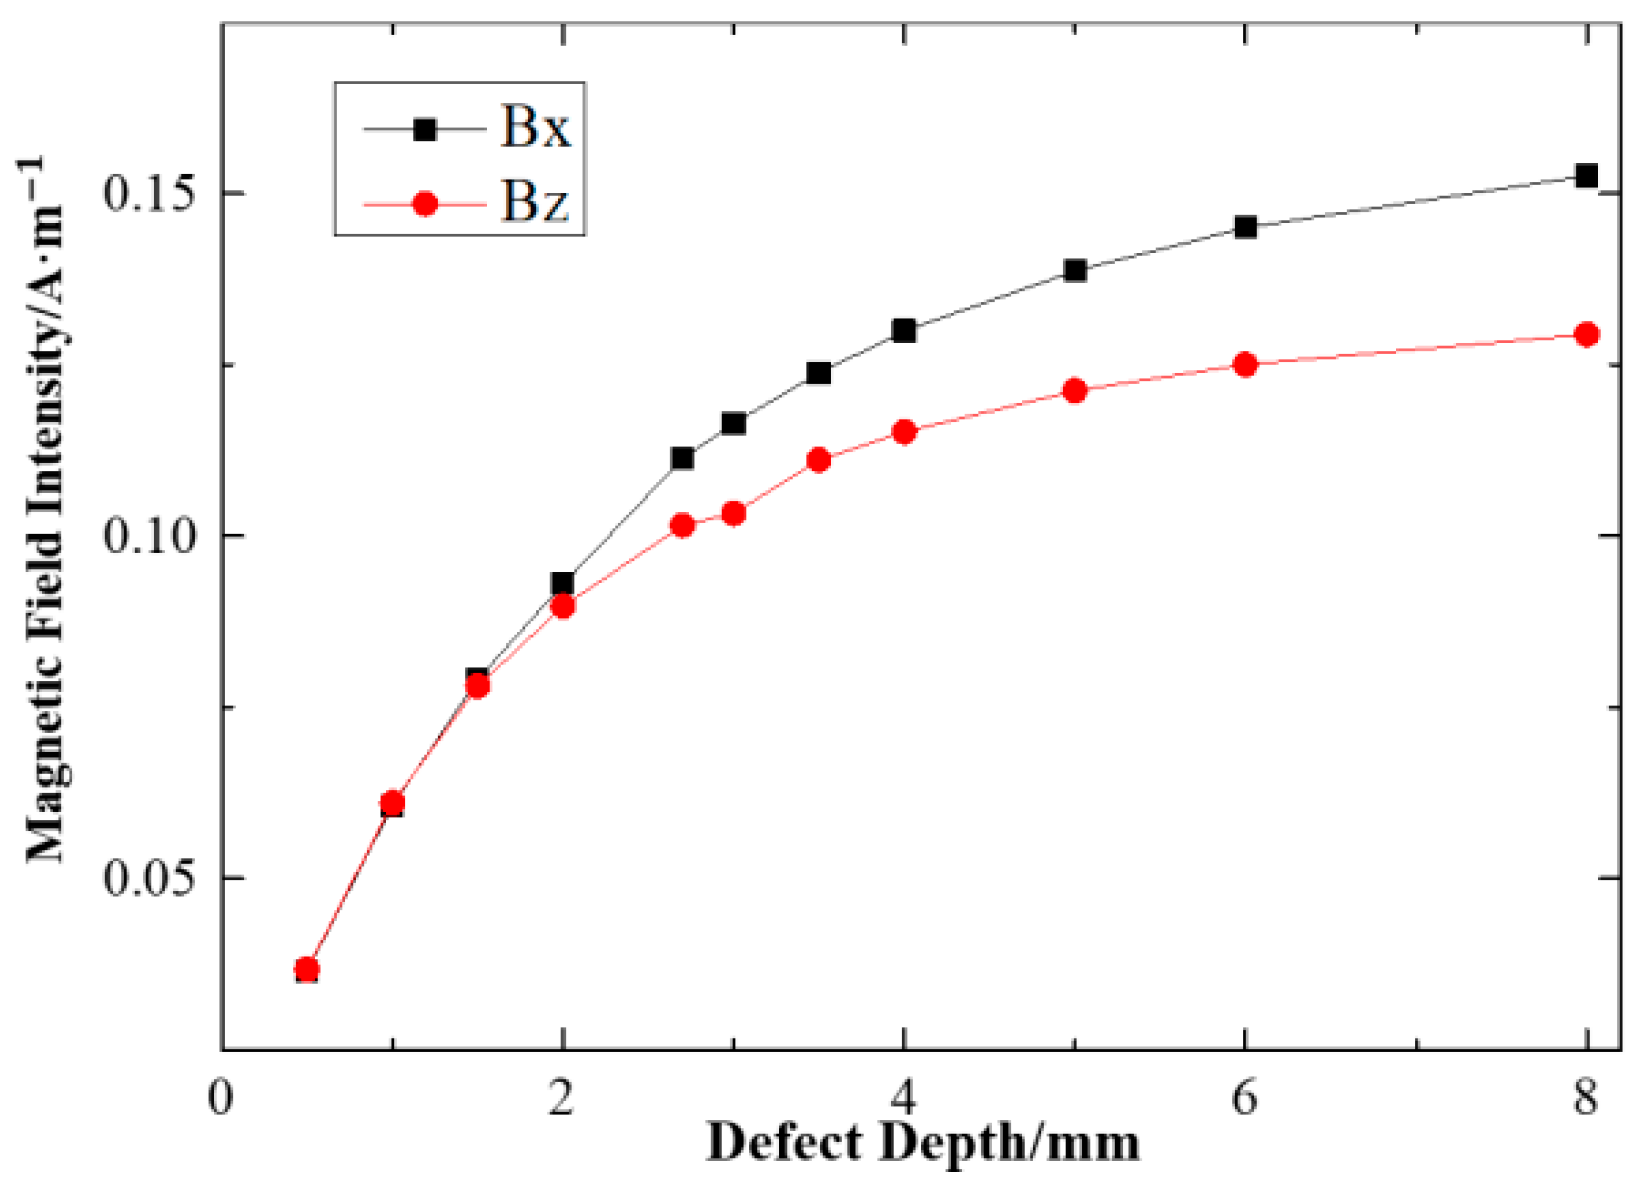
The peak-to-peak value of defect signals increased in both the Bx and Bz directions with defect depth, while the changing rate decreased. The curve trend was similar to a logarithmic function. Therefore, the depth information of unknown parameters can be predicted by establishing a function of defect signal peak-to-peak value and defect depth. The peak-to-peak fitting curve in the Bx and Bz directions is shown in Figure 8. The functional model is shown in Formula (4):
where was the function of defect signal peak-to-peak value changing with defect depth under different operating conditions and was the signal offset. Theoretically, the defect signal peak-to-peak value is greater than or equal to 0; so, the additional constraint condition of was added.
The function formulas of Bx and Bz directions of VBx = 0.1451ln(b) + 0.2705 and VBz = 0.0869ln(b) + 0.1212 were obtained using simulation data, which could be used to predict defect depth. The following section provides a test validation on the demarcated defect via the double-track rail flaw detection vehicle.
4. Design of MFL System and Conditioning Circuit
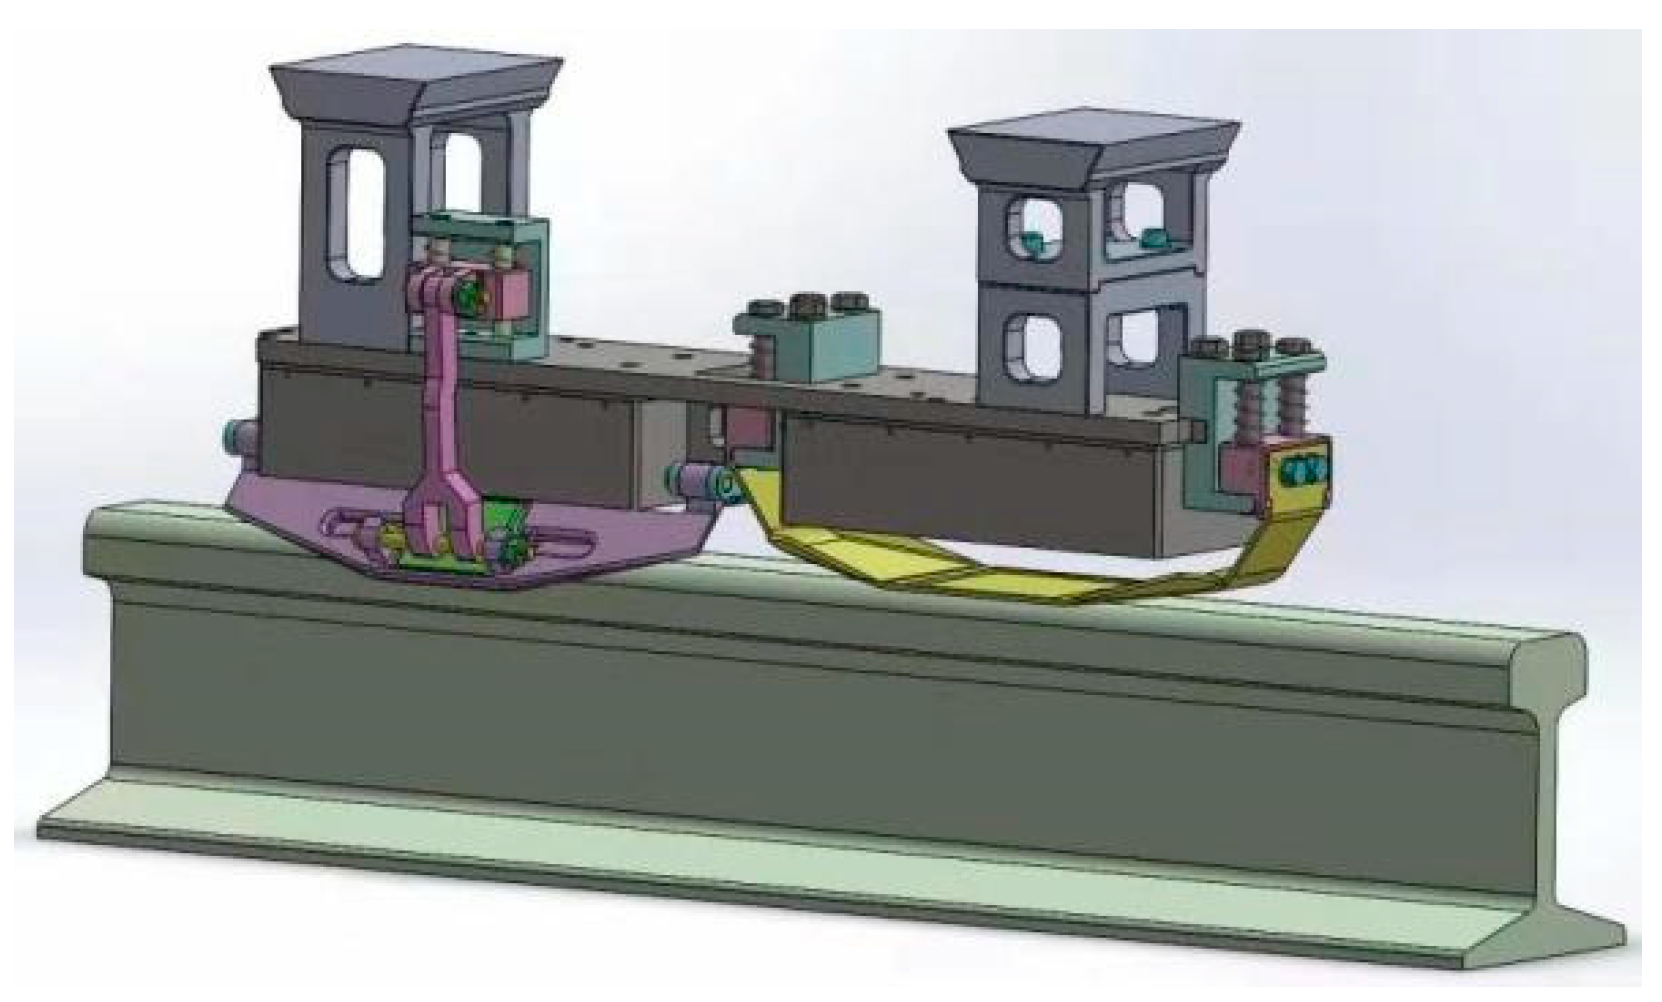
4.1. Sliding Shoe Magnetic Flux Leakage Probe
Due to the unique property of the MFL system, a sliding shoe detection device was designed for the double-track rail flaw detection vehicle [34]. There are two types of device: top surface sliding shoe and side sliding shoe. Each type can be used with a sensor detection plate, respectively. The sliding shoe used non-conductive aluminum sheets to carry sensor detection plates. It was installed below the magnetic yoke, with an elastic structure at both ends, and was closely fit to the rail, which could effectively reduce the vibration interference of the rail joint. The sensor probe was between the sliding shoe and the magnetic yoke. In the process of high-speed detection, the sliding shoe fitted to the rail when moving to avoid damage and to ensure the sensor lift-off of about 1 mm. The installation of the sliding shoe is as shown in Figure 9. The top surface sliding shoe was installed horizontally right above the rail head, and the side sliding shoe was installed diagonally at the inner side of the rail head. The sliding shoe is shown in Figure 10.
After collecting defects on the rail top surface and side, there were problems such as weak magnetic flux leakage field after the excitation of small defects via the magnetizer. Meanwhile, the Hall sensor had a 2.5 V DC component, and there were interference factors caused by probe vibration. Thus, a set of hardware circuits, including filter circuit and amplification circuit, were required for multi-channel signal preprocessing.
4.2. Signal Conditioning Circuit
A Fourier transform spectrum analysis of test data showed that the rail defect signals were mainly low frequency; so, the hardware circuit was designed to filter out the DC component and high frequency electrical noise. The filter circuit was the band-pass filter, filtering signals collected by the Hall sensor. Then, signals were amplified via the amplification circuit, and finally collected and processed via the acquisition card for background analysis. The filter was a two-stage band-pass filter composed of an RC passive high-pass filter and an RC passive low-pass filter. Both filters had the same filter parameters. Resistance of 4.7 kΩ and 1 μF capacitance formed a high-pass filter with a filter frequency of 33.9 Hz; 10 Ω resistance and 1 μF capacitance formed a low pass filter with a filter frequency of 15,923.6 Hz.
The magnetic flux leakage signal intensity of defect after DC excitation was weak as the voltage amplitude was usually less than 0.1 V [35]. However, the noise amplitude introduced by the circuit was usually less than 0.05 V; so, signal amplification was required. Amplification could not only distinguish defect signals more clearly, but it could also prevent interference by other noise signals that were introduced after filtering. The design of an amplification circuit between two-stage band-pass filters can effectively avoid simultaneous amplification of interference signals.
The chip used for signal amplification was AD620, which had low power consumption, good stability and high cost performance. Its linearity was up to 40 ppm and offset voltage was as low as 50 μV. Magnification G could be adjusted by RG, with the magnification of 1–10,000. The formula for magnification was as follows:
The amplifier should have the function of adjusting magnification according to specific requirements under different conditions, including shapes, sizes and depths of rail defects and different inspection speeds and lift-off. The gain of amplifier can be adjusted by adjusting RG with the digital potentiometer AD8403. The adjustable resistance of AD8403 ranged from 50 Ω to 1 kΩ, and the magnification was 50 to 200 times through formula derivation, which met the sampling range of acquisition card. The resistance was adjusted by controlling the microcontroller in the hardware circuit through an acquisition program.
5. Test and Analysis of Artificial Defect Samples
5.1. Introduction of the Defect Samples
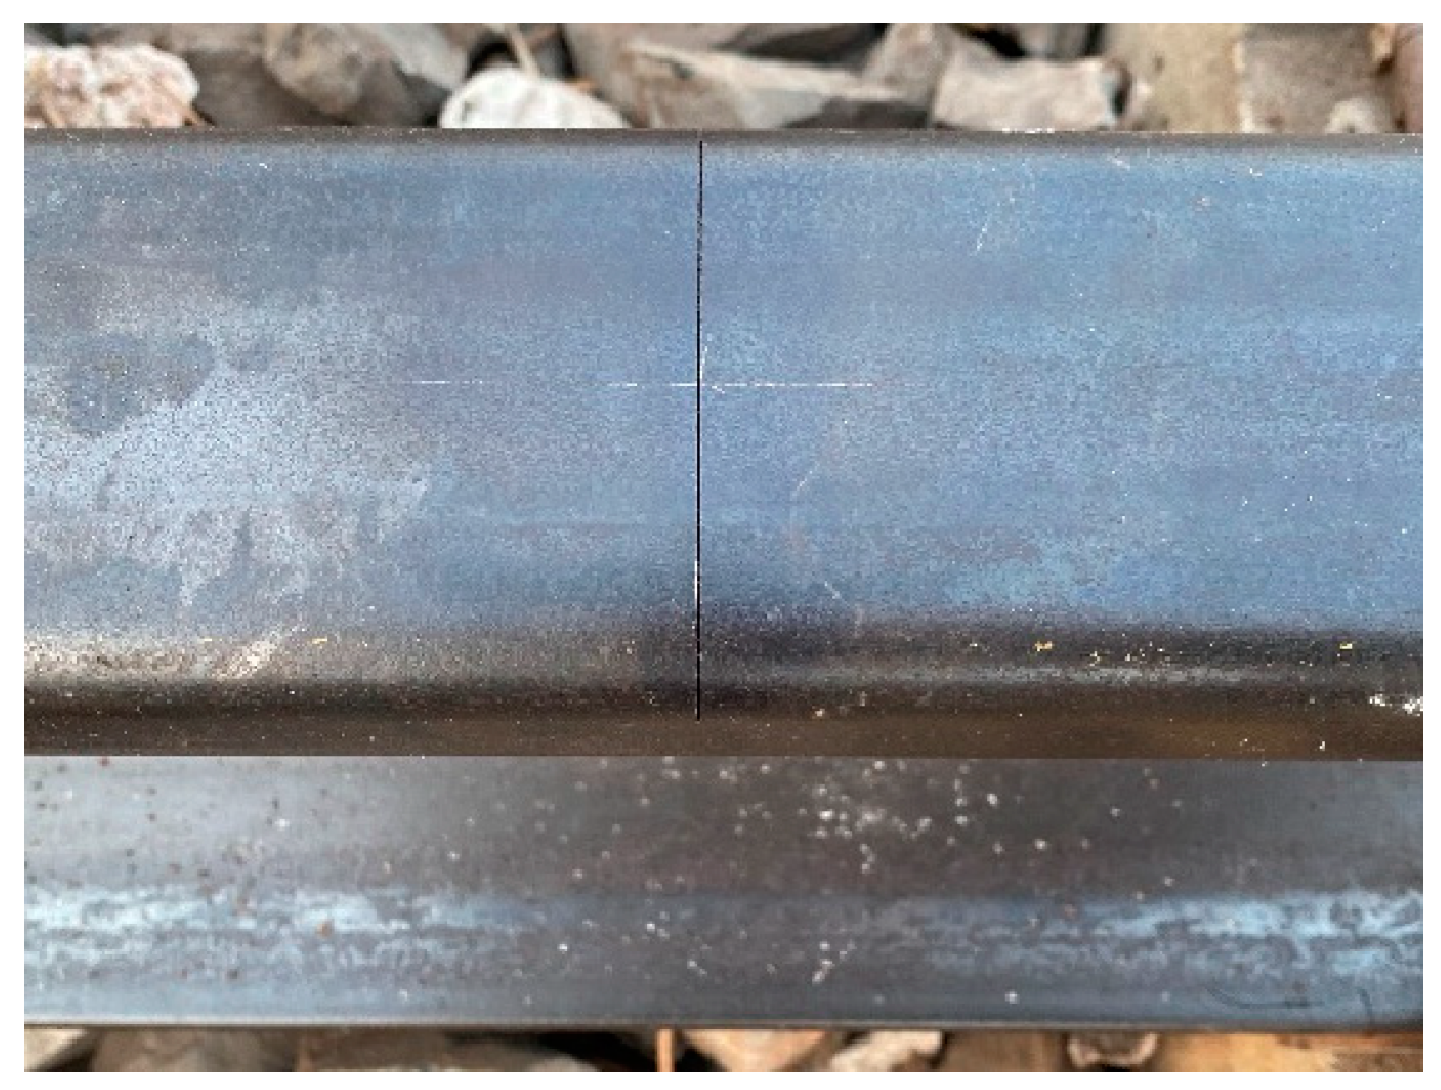
In order to verify the detection capability of the MFL system of a double-track rail flaw detection vehicle, a set of artificial defect samples were processed by EDM for MFL system assessment and quantitative analysis of defect depth. An example of the artificial defect of rail is shown in Figure 11.
The defects were equally deep cracks perpendicular to the direction of the train. The defect width (the direction of the train) was 0.2 mm, and the defect depth is shown in Table 1.
5.2. Analysis of the Detection Results of Defects at Different Depths
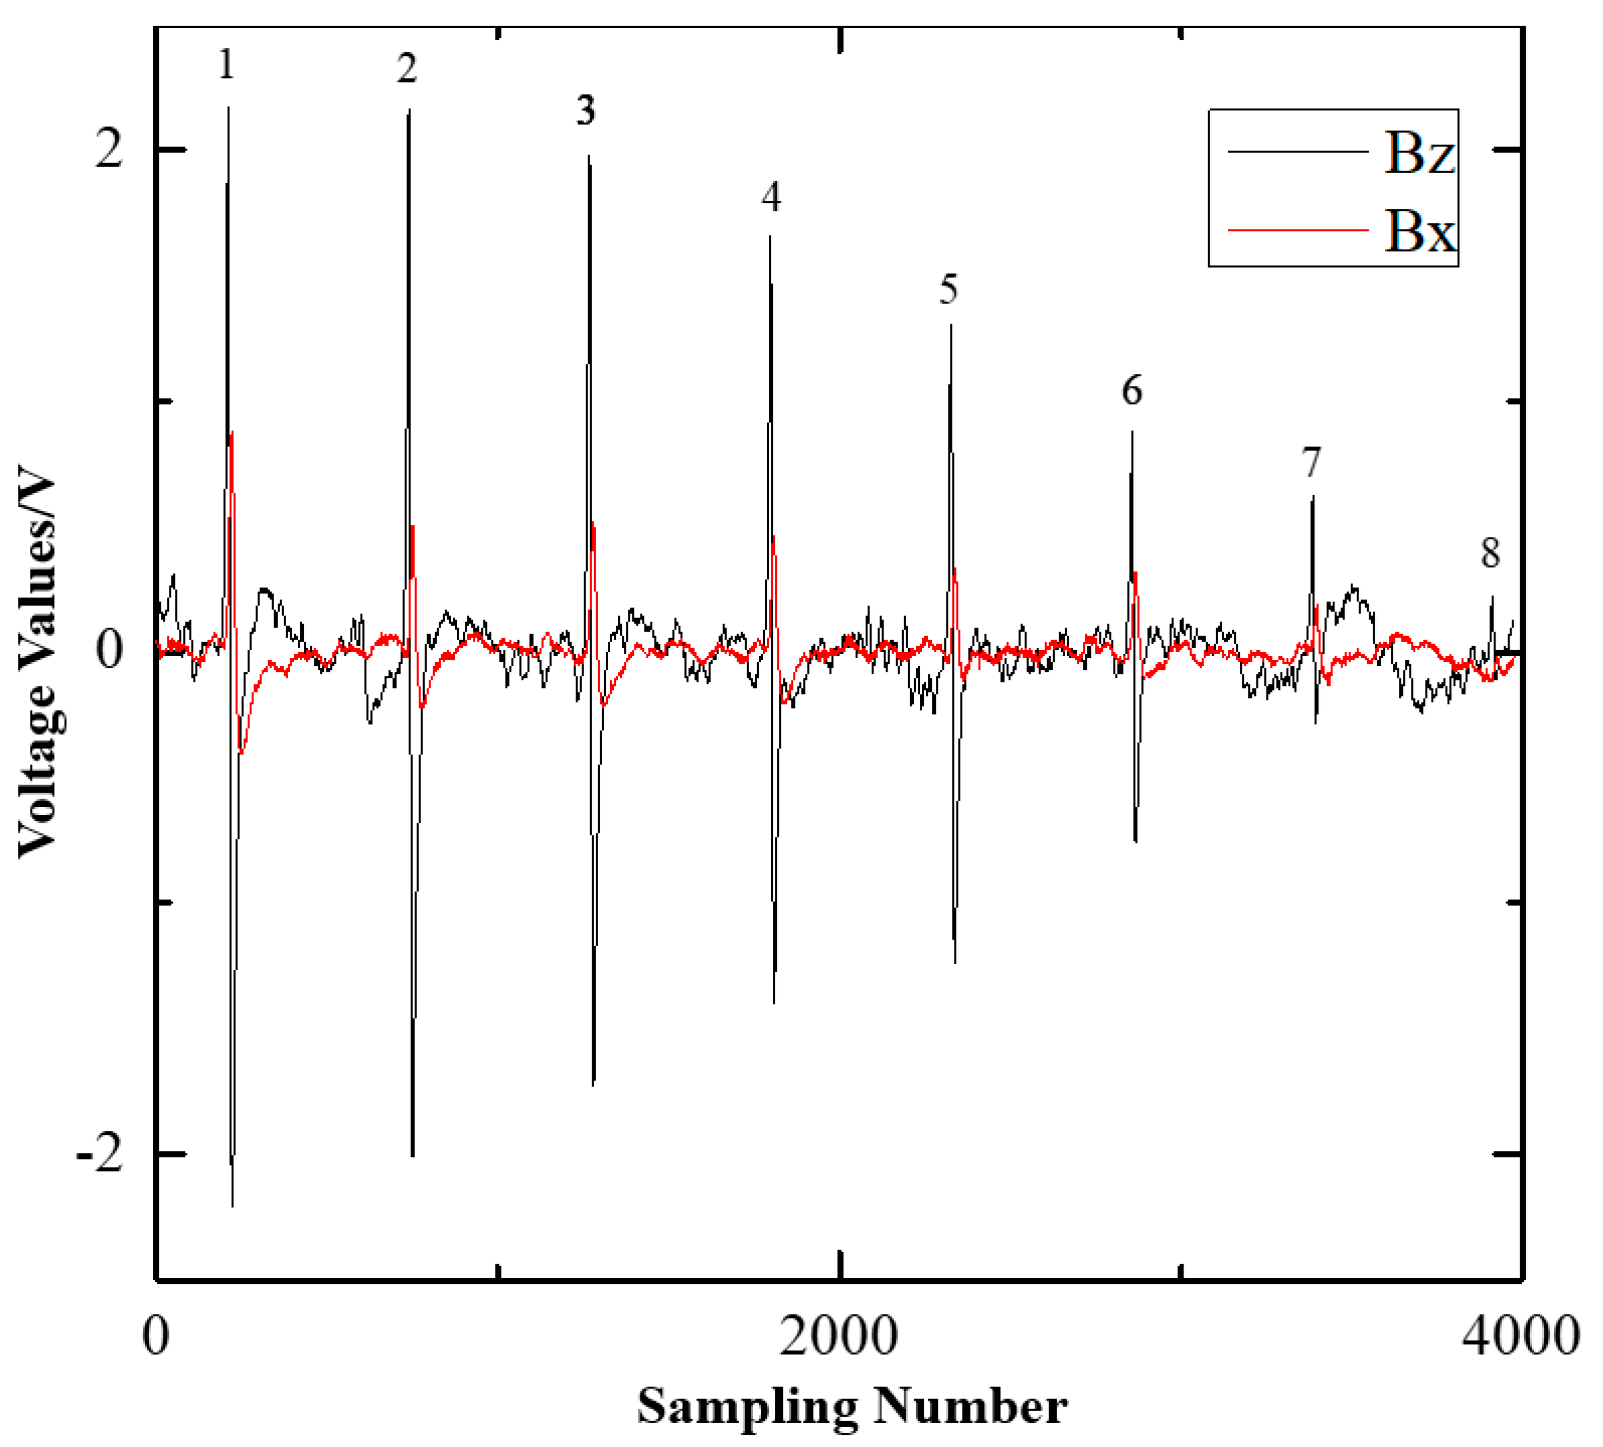
The double-track rail flaw detection vehicle reached a speed of 20 km/h during inspection, and the sensor signal in the X and Z directions of the top surface sliding shoe is shown in Figure 12.
As the figure shows, all eight defects were detected in both the Bx and Bz directions. The defect signal’s peak-to-peak values in the Bz direction were large, and those in the Bx direction were small. The peak-to-peak value of the defect signals in both the Bx and Bz directions increased with defect depth, but its growth rate decreased.
5.3. Analysis of the Features of Defects at Different Depths
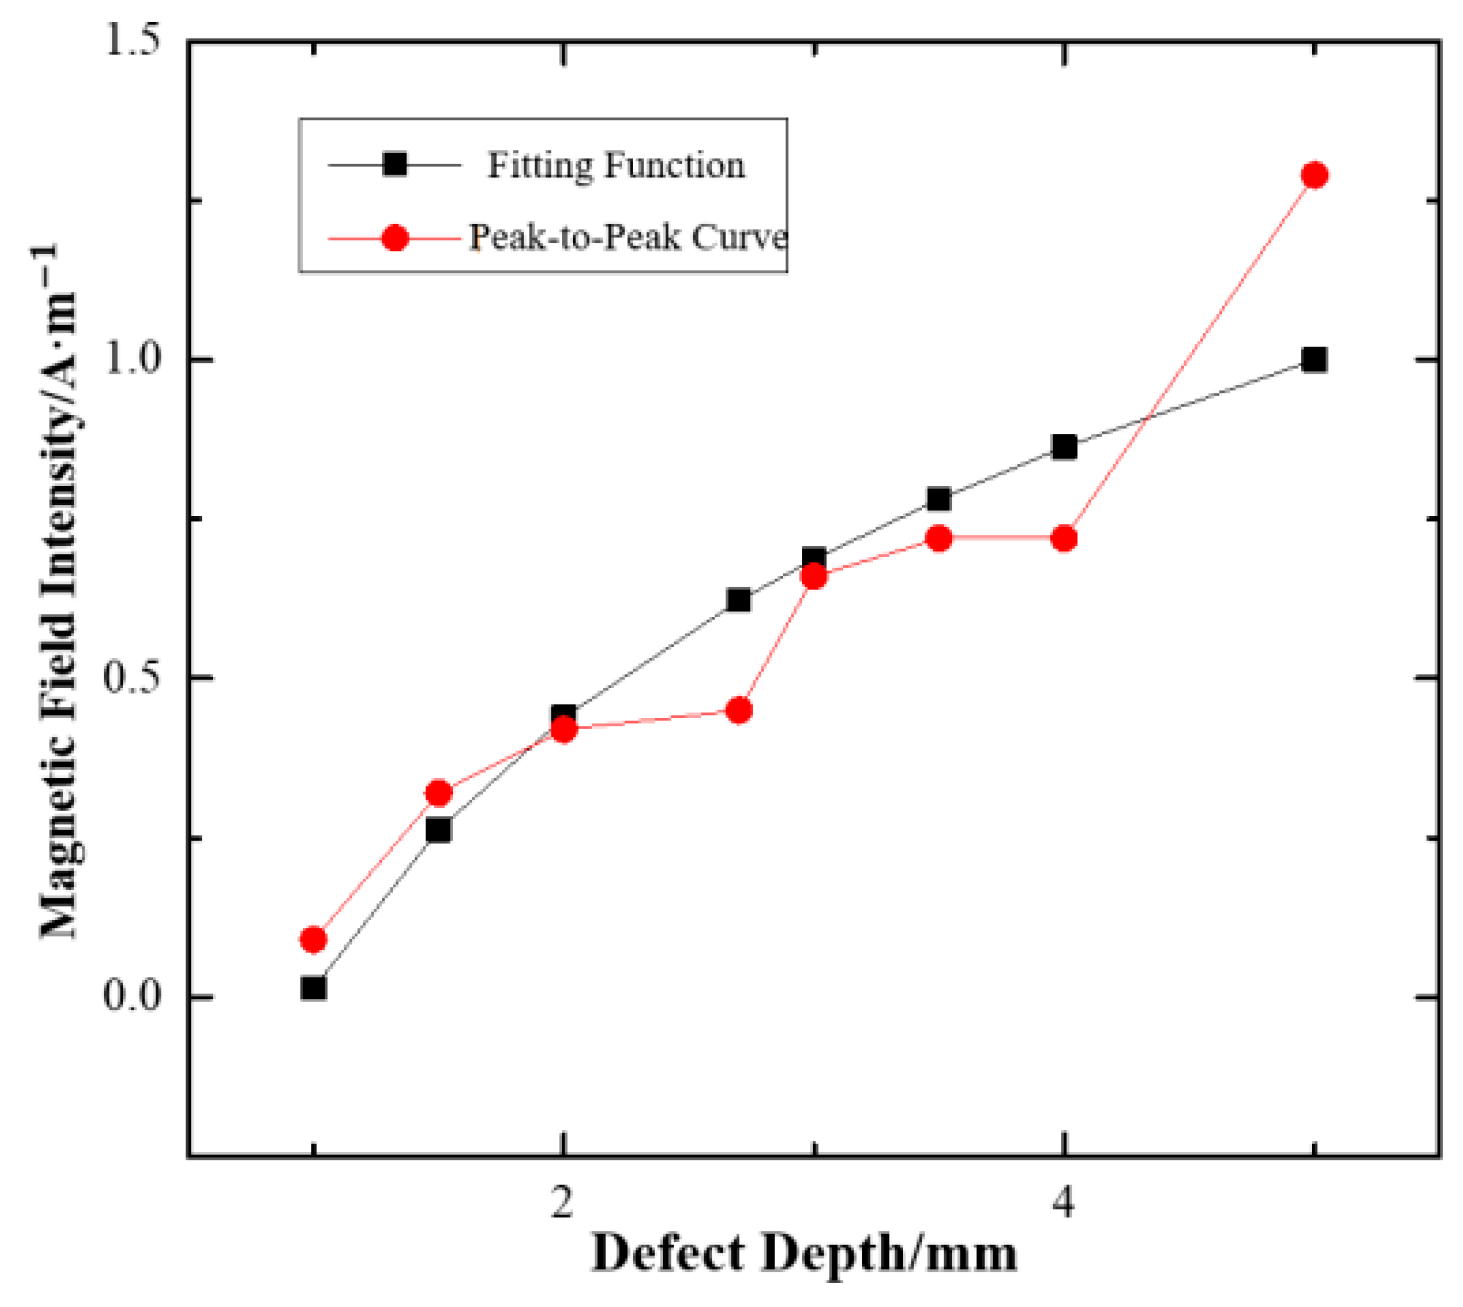
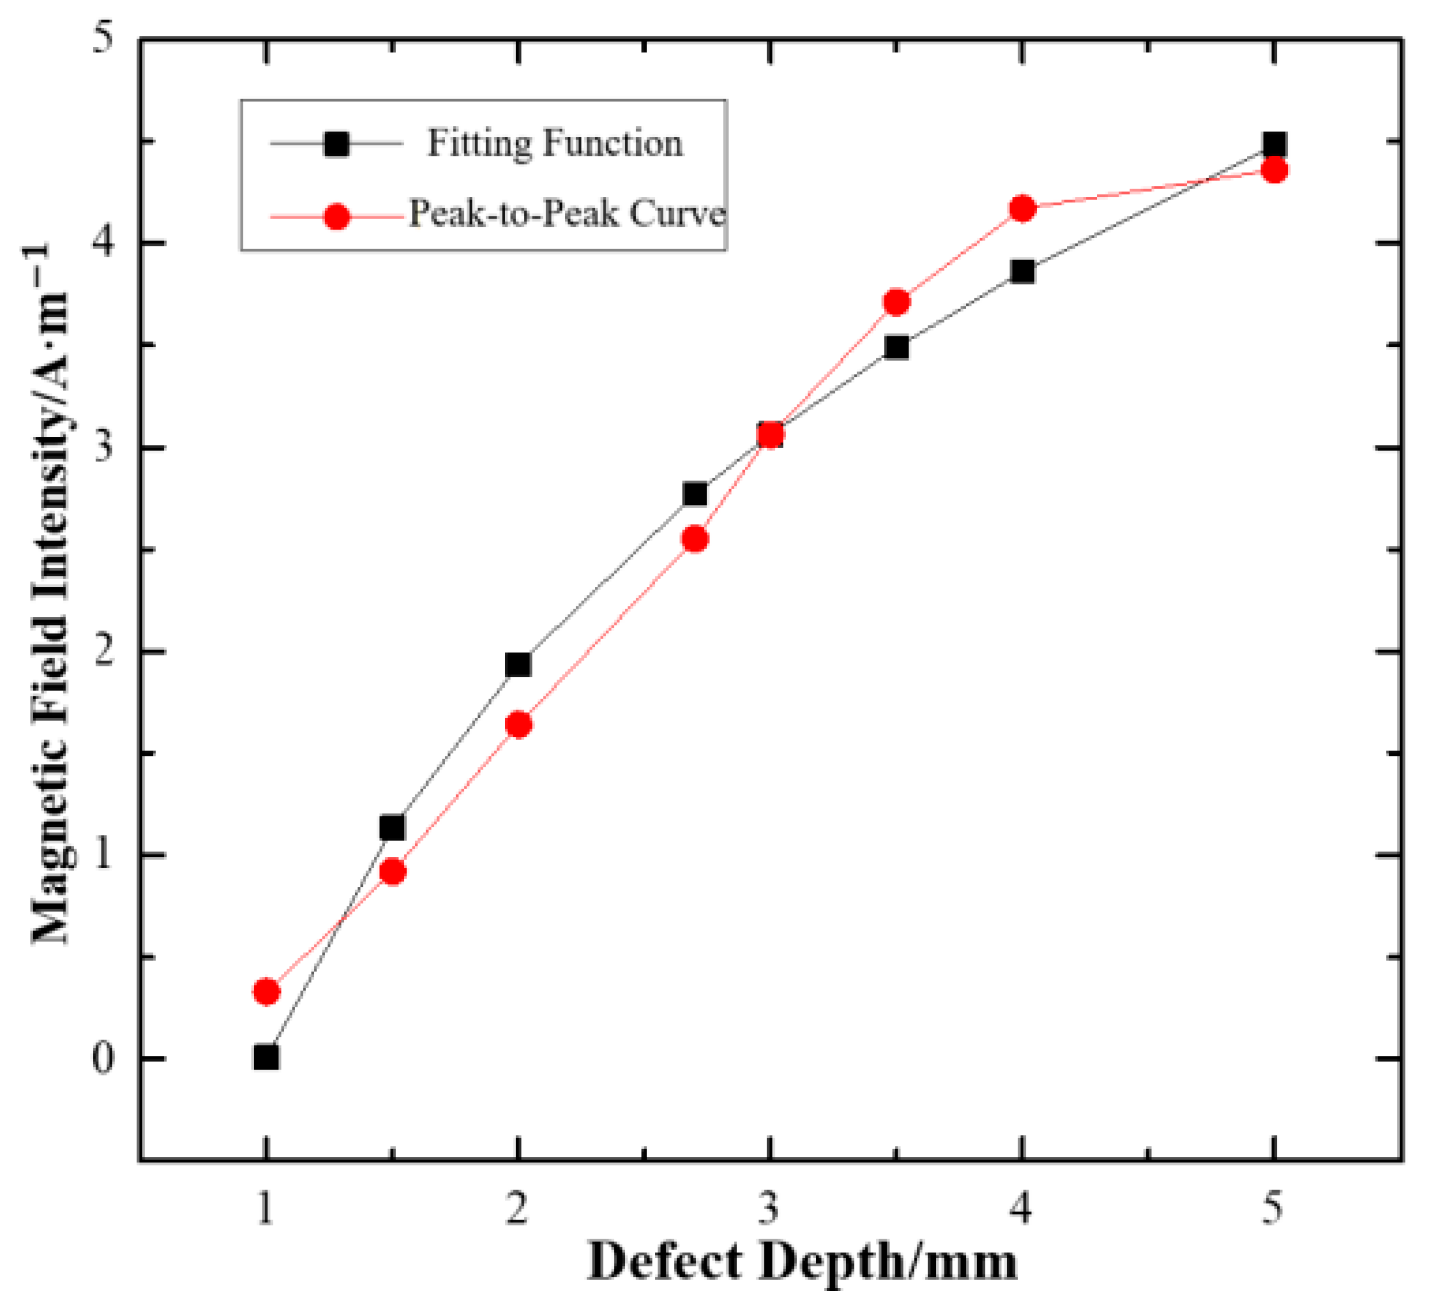
Peak-to-peak value features of eight defect signals in both the Bx and Bz directions were extracted and fitted into a logarithmic function according to the depth of defect (Figure 13 and Figure 14), with VBx = 0.6126ln(b) + 0.0141 in the Bx direction and VBz = 2.7787ln(b) + 0.0087 in the Bz direction. The peak-to-peak value in the Bx direction was small at 2.7 and 4 mm depth, and large at 5 mm depth. The Bz direction basically conformed to the fitted logarithmic function. The function model fitted with the experimental results of the Bx and Bz directions basically tallied with the data in the simulation.
In statistics, the Pearson correlation coefficient, also known as the Pearson product-moment correlation coefficient, PPMCC or PCCs for short, is used to measure the correlation (linear correlation) between two variables X and Y, whose values are between −1 and 1. The Pearson correlation coefficient was calculated to analyze the errors of the fitting results, with = 0.91386 in the Bx direction and = 0.98597 in the Bz direction. A quantitative analysis of the fitting effect was performed with the Pearson correlation coefficient, with 91.4% in the Bx direction and 98.6% in the Bz direction, of which the fitting effect in the Bz direction was better. In the actual quantitative analysis, the defect depth information can be inverted in combination with the results of the Bx and Bz directions. It can be seen from the figure that the peak-to-peak value of 4 mm and 5 mm defects fluctuates greatly, indicating that the prediction accuracy decreases slightly with an increase in damage depth.
6. Conclusions
To solve the problem of difficult detection of rail top surface and near-surface defects via traditional detection techniques, this paper studied the MFL technique for detecting rail top surface defects. The double-track rail flaw detection vehicle ensures accurate and efficient detection effects. The function of defect signal peak-to-peak value and defect depth was obtained through the simulation of defects at different depths. Then, the artificial defect line was detected using the MFL system of a double-track rail flaw detection vehicle. The peak-to-peak value of magnetic flux leakage signals in the Bx and Bz directions was fitted, which verified the function change law in simulation. The errors of the fitting results were analyzed using the Pearson correlation coefficient. The result showed that the fitting effect in the Bz direction was better than that in the Bx direction. It indicates that the MFL system of a double-track rail flaw detection vehicle can perform a quantitative analysis on rail defects under certain conditions, thus providing guidance for rail defect assessment.
Author Contributions
Methodology, Y.W. (Yi Wang); Software, Y.W. (Yi Wang); Validation, Y.S.; Investigation, J.Y.; Resources, Y.W. (Yi Wang); Data curation, K.J. and J.W.; Writing-original draft, Y.W. (Yi Wang); Writing-review & editing, Y.W. (Yuhui Wang) and P.W.; Supervision, Y.W. (Yuhui Wang) and P.W.; Project administration, J.W. All authors have read and agreed to the published version of the manuscript.
Funding
This research received no external funding.
Data Availability Statement
Not applicable.
Conflicts of Interest
The authors declare no conflict of interest.
References
- Mahdavi, H.; Poulios, K.; Kadin, Y.; Niordson, C.F. On the effect of microplasticity on crack initiation from subsurface defects in rolling contact fatigue. Int. J. Fatigue 2022, 161, 106870. [Google Scholar] [CrossRef]
- Jia, Y.; Liang, K.; Wang, P.; Ji, K.; Xu, P. An enhancement method of magnetic flux leakage signals for rail track surface defect detection. IET Sci. Meas. Technol. 2020, 14, 711–717. [Google Scholar] [CrossRef]
- Provezza, L.; Bodini, I.; Petrogalli, C.; Lancini, M.; Solazzi, L.; Faccoli, M. Monitoring the damage evolution in rolling contact fatigue tests using machine learning and vibrations. Met. —Open Access Metall. J. 2021, 11, 283. [Google Scholar] [CrossRef]
- Wranik, J. Simulation of the fatigue crack initiation in SAE 52100 martensitic hardened bearing steel during rolling contact. Lubricants 2022, 10, 62. [Google Scholar]
- Ji, K. A method for detecting surface defects in railhead by magnetic flux leakage. Appl. Sci. 2021, 11, 9489. [Google Scholar] [CrossRef]
- Azad, A.; Lee, J.; Kim, N. Time dependent numerical simulation of MFL coil sensor for metal damage detection. Smart Struct. Syst. 2021, 6, 727–735. [Google Scholar]
- Askarinejad, H.; Dhanasekar, M.; Boyd, P.; Taylor, R. Field measurement of wheel—Rail impact force at insulated rail joint. Exp. Tech. 2015, 39, 61–69. [Google Scholar] [CrossRef]
- Zhang, H.; Qiu, J.; Xia, R.; Cheng, C.; Zhou, J.; Jiang, H.; Li, Y. Corrosion damage evaluation of loaded steel strand based on self-magnetic flux leakage. J. Magn. Magn. Mater. 2022, 549, 168998. [Google Scholar] [CrossRef]
- Sathappan, N.; Tokhi, M.O.; Penaluna, L.; Zhao, Z.; Duan, F.; Shirkoohi, G.; Kaur, A. Development of an MFL coil sensor for testing pipes in extreme temperature conditions. Sensors 2021, 21, 3033. [Google Scholar] [CrossRef]
- Teng, Y.; Zhang, R.; Yang, J.; Qiu, Z.; Chen, X. Comprehensive evaluation of damages in ferromagnetic materials based on integrated magnetic detection. Insight Non-Destr. Test. Cond. Monit. 2022, 64, 206–212. [Google Scholar] [CrossRef]
- Zhang, Q.; Zou, D.; Yang, Q. Research and analysis of damaged morphology and structure on the head of switch rail. Metall. Anal. 2019, 39, 23–28. [Google Scholar]
- Wang, S.; Liu, L.; Liu, H.; Cheng, S. Crack initiation and spalling analysis of inner rail on heavy haul railway curve based on damage accumulation and weight parameter. China Railw. Sci. 2017, 27, 31–35. [Google Scholar]
- Zhang, D.; Zhang, E.; Yan, X. Quantitative method for detecting internal and surface defects in wire rope. NDT E Int. 2021, 119, 102405. [Google Scholar] [CrossRef]
- Chen, H.; Li, S. Collinear nonlinear mixed-frequency ultrasound with FEM and experimental method for structural health prognosis. Processes 2022, 10, 656. [Google Scholar] [CrossRef]
- Huang, N.; Chen, Q.; Cai, G.; Xu, D.; Zhang, L.; Zhao, W. Fault diagnosis of bearing in wind turbine gearbox under actual operating conditions driven by limited data with noise labels. IEEE Trans. Instrum. Meas. 2021, 70, 1–10. [Google Scholar] [CrossRef]
- Jonas, W. Rolling contact fatigue analysis of rails including numerical simulations of the rail manufacturing process and repeated wheel-rail contact loads. Int. J. Fatigue 2003, 25, 547–558. [Google Scholar]
- Zhang, C.; Kordestani, H.; Shadab Far, M. A combined review of vibration control strategies for high-speed trains and railway infrastructures: Challenges and solutions. J. Low Freq. Noise Vib. Act. Control. 2022, 42, 272–291. [Google Scholar] [CrossRef]
- Sun, R.; Wang, J.; Cheng, Q.; Mao, Y.; Ochieng, W.Y. A new IMU-aided multiple GNSS fault detection and exclusion algorithm for integrated navigation in urban environments. GPS Solut. 2021, 25, 1–17. [Google Scholar] [CrossRef]
- Popović, Z.; Radović, V.; Lazarević, L.; Vukadinović, V.; Tepić, G. Rail inspection of RCF defects. Metalurgija 2013, 52, 537–540. [Google Scholar]
- Zong, C.; Wan, Z. Container ship cell guide accuracy check technology based on improved 3D point cloud instance segmentation. Brodogradnja 2022, 73, 23–35. [Google Scholar] [CrossRef]
- Zong, C.; Wang, H.; Wan, Z.B. An improved 3D point cloud instance segmentation method for overhead catenary height detection. Comput. Electr. Eng. 2022, 98, 1. [Google Scholar] [CrossRef]
- Luo, P.; Wang, B.; Wang, H.; Ma, F.; Ma, H.; Wang, L. An ultrasmall bolt defect detection method for transmission line inspection. IEEE Trans. Instrum. Meas. 2023, 72, 1–12. [Google Scholar] [CrossRef]
- Mi, C.; Huang, S.; Zhang, Y.; Zhang, Z.; Postolache, O. Design and Implementation of 3-D Measurement Method for Container Handling Target. J. Mar. Sci. Eng. 2022, 10, 1961. [Google Scholar] [CrossRef]
- Lu, C.; Zhou, H.; Li, L.; Yang, A.; Xu, C.; Ou, Z.; Tian, F. Split-core magnetoelectric current sensor and wireless current measurement application. Meas. J. Int. Meas. Confed. 2022, 188, 110527. [Google Scholar] [CrossRef]
- Deng, Y.; Zhou, X.; Shen, J.; Xiao, G.; Hong, H.; Lin, H.; Wu, F.; Liao, B.Q. New methods based on back propagation (BP) and radial basis function (RBF) artificial neural networks (ANNs) for predicting the occurrence of haloketones in tap water. Sci. Total Environ. 2021, 772, 145534. [Google Scholar] [CrossRef] [PubMed]
- Liu, B.; He, L.Y.; Zhang, H.; Cao, Y.; Fernandes, H. The axial crack testing model for long distance oil—gas pipeline based on magnetic flux leakage internal inspection method. Measurement 2017, 103, 275–282. [Google Scholar] [CrossRef] [Green Version]
- Andersen, R.E.; Nalpantidis, L.; Ravn, O.; Boukas, E. Simultaneous regression-based spatial coverage estimation and object detection with deep learning. Electron. Lett. 2021, 57, 605–607. [Google Scholar] [CrossRef]
- Yang, Z.; Boogaard, A.; Chen, R.; Dollevoet, R.; Li, Z. Numerical and experimental study of wheel-rail impact vibration and noise generated at an insulated rail joint. Int. J. Impact Eng. 2017, 113, 29–39. [Google Scholar] [CrossRef] [Green Version]
- Dudkin, E.; Andreeva, L.; Sultanov, N. Methods of noise and vibration protection on urban rail transport. Procedia Eng. 2017, 189, 829–835. [Google Scholar] [CrossRef]
- Zerbst, U.; Lundén, R.; Edel, K.-O. Introduction to the damage tolerance behaviour of railway rails—A review. Eng. Fract. Mech. 2009, 76, 2563–2601. [Google Scholar] [CrossRef] [Green Version]
- Cannon, D.; Edel, K.; Grassie, S. Rail defects: An overview. Fatigue Fract. Eng. Mater. Struct. 2003, 26, 865–886. [Google Scholar] [CrossRef]
- Gao, J.; Du, G.; Wei, H. The research of defect detection test system based on magnetic flux leakage. In Proceedings of the 2011 6th International Forum on Strategic Technology, Harbin, China, 22–24 August 2011. [Google Scholar]
- Tian, G. Velocity effect analysis of dynamic magnetization in high speed magnetic flux leakage inspection. Ndt E Int. 2014, 64, 7–12. [Google Scholar]
- Antipov, A.; Marpov, A. 3D simulation and experiment on high speed rail MFL inspection. NDT E Int. 2018, 98, 177–185. [Google Scholar] [CrossRef]
- Chen, H.X.; Liu, M.M.; Chen, Y.T.; Li, S.Y.; Miao, Y.Z. Nonlinear lamb wave for structural incipient defect detection with sequential probabilistic ratio test. Secur. Commun. Netw. 2022, 2022, 9851533. [Google Scholar] [CrossRef]
Figure 1.
Physical picture of double-track rail flaw detection vehicle.

Figure 2.
Magnetic flux leakage technique.

Figure 3.
The rail defect profile in the direction of train travel.

Figure 4.
The internal structure of the UGN3503 Hall sensor.

Figure 5.
Magnetic flux leakage simulation model.

Figure 6.
Magnetic flux leakage signals in Bx direction.

Figure 7.
Magnetic flux leakage signals in Bz direction.

Figure 8.
Peak-to-peak fitting curve in Bx and Bz directions.

Figure 9.
The installation of the sliding shoe.

Figure 10.
The sliding shoe.

Figure 11.
Example of artificial defect of rail.

Figure 12.
The sensor signal at different depths.

Figure 13.
Peak-to-peak values’ function and fitting curve in Bx direction.

Figure 14.
Peak-to-peak values’ function and fitting curve in Bz direction.


Table 1.
The defect depth.
| Defect | 1 | 2 | 3 | 4 | 5 | 6 | 7 | 8 |
|---|---|---|---|---|---|---|---|---|
| Depth | 5 | 4 | 3.5 | 3 | 2.7 | 2 | 1.5 | 1 |
Disclaimer/Publisher’s Note: The statements, opinions and data contained in all publications are solely those of the individual author(s) and contributor(s) and not of MDPI and/or the editor(s). MDPI and/or the editor(s) disclaim responsibility for any injury to people or property resulting from any ideas, methods, instructions or products referred to in the content. |
© 2023 by the authors. Licensee MDPI, Basel, Switzerland. This article is an open access article distributed under the terms and conditions of the Creative Commons Attribution (CC BY) license (https://creativecommons.org/licenses/by/4.0/).
Share and Cite
MDPI and ACS Style
Wang, Y.; Wang, Y.; Wang, P.; Ji, K.; Wang, J.; Yang, J.; Shu, Y. Rail Magnetic Flux Leakage Detection and Data Analysis Based on Double-Track Flaw Detection Vehicle. Processes 2023, 11, 1024. https://doi.org/10.3390/pr11041024
AMA Style
Wang Y, Wang Y, Wang P, Ji K, Wang J, Yang J, Shu Y. Rail Magnetic Flux Leakage Detection and Data Analysis Based on Double-Track Flaw Detection Vehicle. Processes. 2023; 11(4):1024. https://doi.org/10.3390/pr11041024
Chicago/Turabian StyleWang, Yi, Yuhui Wang, Ping Wang, Kailun Ji, Jun Wang, Jie Yang, and Yuan Shu. 2023. "Rail Magnetic Flux Leakage Detection and Data Analysis Based on Double-Track Flaw Detection Vehicle" Processes 11, no. 4: 1024. https://doi.org/10.3390/pr11041024
Note that from the first issue of 2016, this journal uses article numbers instead of page numbers. See further details here.