Article

Economic, Exergoeconomic and Exergoenvironmental Evaluation of Gas Cycle Power Plant Based on Different Compressor Configurations

by
Hamad H. Almutairi
1,*,
Abdulrahman S. Almutairi
1,
Suleiman M. Suleiman
2,
Abdulrahman H. Alenezi
1,
Khalid A. Alkhulaifi
1 and
Hamad M. Alhajeri
1
1
College of Technological Studies, Mechanical Power and Refrigeration Engineering Technology, P.O. Box 23167, Safat 13092, Kuwait
2
Energy and Building Research Center, Kuwait Institute for Scientific Research, KISR., P.O. Box 24885, Safat 13109, Kuwait
*
Author to whom correspondence should be addressed.
Processes 2023, 11(4), 1023; https://doi.org/10.3390/pr11041023
Submission received: 9 March 2023 / Revised: 23 March 2023 / Accepted: 25 March 2023 / Published: 28 March 2023
(This article belongs to the Topic Exergy Analysis and Its Applications – 2nd Volume)

Abstract

:
The decision-making process behind the selection of a gas turbine engine (GT) is crucial and must be made in accordance with economic, environmental, and technical requirements. This paper presents the relevant economic, exergoeconomic and exergoenvironmental analyses for four GT engines with different compressor configurations. The GT engine configurations are identified according to the type of compressor: axial, axial-centrifugal, two-stage centrifugal, and centrifugal-centrifugal. The performances of the four GT engines were validated against manufacturer supplied data using specialized software. The economic analysis, a detailed life cycle costing considering the cost to be paid per unit net power obtained from the GT, and subsequent shortest payback period showed that the GT with centrifugal-centrifugal compressor was most economically feasible. This was followed, in order, by the GT-axial, GT-axial-centrifugal, and finally the GT-two-stage centrifugal configuration, where the cost of ownership for a 20 year plan ranges between 8000 USD/kW to about 12,000 USD/kW at different operational scenarios during the life cycle costing. Exergoeconomic assessment provided useful information to enhance the cost-effectiveness of all four systems by evaluating each component separately. The axial-centrifugal configuration registered the lowest CO2 emissions (about 0.7 kg/kWh); all environmental indicators confirmed it is the most environmentally friendly option.

1. Introduction

Electricity generation and utilization of fuel resources have long been topics of significant interest to researchers in scientific institutions, energy corporations, and governments. The rapidly increasing demand for electricity generation is related to an optimistic view of economic growth [1], but can also adversely impact the environment and human health [2]. Most large-scale power plants worldwide are fossil-fuel power plants [3], with the cost of generating electricity fluctuating wildly due to resource shortages [4]. Thus, with the continuing demand for further increases in the standard of living, energy analyses of fossil fuel power plants are becoming more urgent and electrical power generation has been the topic of many studies which emphasize enhancing power generation efficiency.
Fossil-fuel power plants can be classified into gas cycle, steam cycles, and combined gas-steam cycles. The market for electrical power generation tends to prefer gas-steam cycles in a combined heat and power (CHP) configuration since these can reach around 60% efficiency [5]. However, the performance of the gas-steam cycle relies very much on the gas turbine, comprising a compressor, combustion chamber and the turbine, the performance of which can be affected by factors which include fuel type, fuel temperature and mass flow rate, ambient inlet air temperature and humidity, site elevation, inlet and exhaust losses, air extraction, performance degradation, and steam and water injection for power augmentation [6]. Understanding the impact of these parameters on gas cycle performance and power generation is critical. Theoretically, the evaluation of energy systems, including gas-cycles, can typically be performed by evaluating energetic performance based on the first law of thermodynamics [7]. Another evaluation method is to investigate exergetic performance and evaluate according to the second law of thermodynamics [8,9,10]. Using energetic and exergetic analysis together provides a significant understanding of the system being evaluated.
Several studies have confirmed that ambient temperature significantly affects the cycle’s performance [11,12,13]. The impact of varying ambient temperature has been shown to cause drastic fluctuations in electric-power output and efficiency, especially at high ambient temperatures [14]. Most of the research in this area has indicated that exergy destruction is lowest in the compressor, followed by the turbine, and is at maximum in the combustion chamber [15,16,17,18,19].
The wider use of exergy analysis as a tool for assessing various thermal energy applications is a topic of interest for many researchers [20,21,22]. However, the assessment of thermal energy systems should consider the economic factors that are necessary to improve system efficiency and reduce operational costs. In this regard, there are two common ways to perform an economic assessment of thermal energy systems. The first way is by applying Life Cycle Costing (LCC), and the second way is to apply an exergoeconomic assessment. LCC is a method to assess all costs associated with the life cycle and has been widely used for economic evaluation of thermal energy systems [23,24,25,26]. It is considered to be a tool that can help decision makers estimate the total costs of ownership over the lifetime of the thermal energy system being evaluated. Taner and Sivrioglu [27] indicated that calculating the LCC of fossil fuel power plant alternatives requires calculating the costs in present value including investment cost (capital cost), non-fuel operating and maintenance (O&M) costs, fuel costs, and salvage value.
However, for a better understanding of the alternatives, an exergoeconomic assessment provides a more detailed evaluation of the economic performance of each state in thermal energy systems [28]. This approach is applied to identify costs that result from exergy destruction in each component in the thermal energy system. It does this by combining the second law of thermodynamics with economic principles. Several studies available in the literature have considered utilizing exergy analysis to perform an exergo-economic assessment of a GT cycle. Seyyedi, et al. [29] performed detailed thermodynamic, economic, and environmental analyses to optimize a GT cycle. Their study included determining the effect of air preheaters on the thermodynamic cycle and consequential environmental impact.
Boyaqchi and Molaei [30] conducted exergy, exergo-economic, and exergo-environmental assessment of a gas turbine cycle. Their work was based on the multi-objective particle swarm optimization (MOPSO) algorithm, and the objective functions were the total cost rate, exergy efficiency, and CO2 emissions. Igbong and Fakorede [31] conducted an exergo-economic analysis of a GT plant, studying the effects of turbine inlet temperature and compressor pressure ratio. Arora [32] conducted exergoeconomic research on GT power plant components: the combustion chamber, compressor, and exhaust. Mousafarash and Ameri [33] conducted exergy and exergo-economic analyses of a GT power plant considering its performance at different ambient temperatures and partial loads. Avval et al. [34] conducted an exergy-exergo-economic and exergo-environmental multi-objective optimization analysis of a GT power plant. They studied the influence of different design parameters on turbine exergy efficiency, total cost rate of the system, and CO2 emission, investigating how high ambient temperatures led to a low density of air intake to the compressor, enhancing the performance of the gas cycle while minimizing the losses through highly efficient components (i.e., gas turbine, air compressor, combustion chamber) [35].
A study conducted by Almutairi, et al. [36] raised the question of whether the type and configuration of the air compressor can impact on the overall engine performance by interacting with the operating conditions. They investigated several gas turbines with different compressor configurations using the first and second laws of thermodynamics and a detailed exergy analysis. The analysis considered the performance of each configuration as a function of compressor isentropic efficiency, compressor pressure ratio, ambient temperature, and load variation. They found that compressor configuration did affect the performance of the gas turbines relative to the manufacturer’s data, as predicted by the exergetic and energetic analysis. No studies were found in the literature which used economic and exerge-oconomic investigations to test the feasibility of using gas turbines with different compressor configurations. Because of the importance of gas-turbine engines in power applications especially for electricity generation, the present work attempts to fill the research gap by investigating different GT engines with different compressor configurations according to economic, exergo-economic, and exergeo-environment assesments.
For the economic assessment, the study presents a LCC for each GT engine studied, considering the total costs incurred throughout the lifecycle period. For the exerge-oecnomic assessment, the study combines the exergy analysis with economic influences and includes all related costs resulting from inefficiencies in the thermodynamic processes in the major components in the given GT engines. For the exergeo-environment assessment, the study presents three environmental indicators by which to assess the most environmentally and ecologically favorable gas-turbine engine. The study in this regard summarizes its aims as:
  • Producing a LCC assessment for a lifespan of 20 years for the given GT engines with respect to ISO conditions and variation in ambient temperature and loading conditions.
  • Calculating the payback period of each GT engine studied where the delivered power is assumed to be electricity sold at tariff prices.
  • Estimation of exergy costing for all equipment in the given GT engines.
  • Estimation of CO2 emissions at ISO conditions that result from each GT engine considering three environmental indicators, environmental destruction coefficient, environmental destruction index, and environmental benign index.

2. Methodology

2.1. Description of the Studied GT Engines and Compressor Configurations

This work aims to explore the economic and environmental feasibility of four gas engines with different compressor configurations as described previously by Almutairi et al. [36]. Each configuration of the gas engine varied according to the number of shafts or type of compressor. More details about the investigated GT engines are illustrated in Table 1.
It is essential to emphasize three crucial features, the combinations of which influence the ballpark performance of any industrial GT engine: sensitivity of turbomachinery components, the shaft orientation (single or two spools), and the type of compressor (axial or centrifugal). Unlike the turbine operation, which expands the working fluids in the direction of flow, the compressor works to decrease the air volume in the direction of the flow. Thus, discrete low pressure ratio compression stages, particularly for axial compressors, are helpful in minimizing the tendency to an adverse pressure gradient due to the boundary layer problem. Hence, in modern industrial GT engines, many compression stages (up to thirty) can be seen, driving up to five turbine stages. To achieve fewer compression stages and reduce the GT axial length, GT design engineers aim for a higher stage pressure by increasing the shaft rotational speed. The pressure ratio per stage is as shown in Equation (1), and the blade span ratio is shown in Equation (2).
P N P 1 = ( 1 + η T 1   ω 2 r 2 c p ) γ γ 1
s 2 s 1 = ( 1 + η T 1   ω 2 r 2 c p ) 2 ( γ 1 )
The expressions ω , r , and s refer to the rotational speed, tip radius, and span length, respectively. However, root stress limits the front stage blade tip speed, which leads to multiple spool engines that enable the first few front stages to operate at lower rotational speeds than the subsequent stages on a higher speed spool. For these reasons, the compressor performance is significantly affected by any variation in engine rotational speed, unlike the turbine stages that choke in regions close to the engine design points. Hence, the compressor Mach number, a feature of the turbomachinery, significantly affects the overall engine performance.

2.2. GT Engine Modelling

2.2.1. Modelling Preparations

A GT is a complex system in which many components work together to produce shaft power. Accurate GT engine performance modelling involves estimating measurable and non-measurable parameters using numerical approximate component characteristics and aerothermal relationships (also known as physical laws), as shown in Figure 1.
To accurately model the selected gas turbine configurations, this work used an analytical approach based on fundamental aerothermodynamic relationships. The process includes design point (DP) and off-design point (OD) calculations, using specialized software. Important assumptions made during the modelling processes are:
(1)
Typical component maps embedded within the software for the different configurations can be adapted and linearly scaled to satisfy the various engine DP performances.
(2)
The turbine components at the DP operate in the choke region.
(3)
All processes in the gas cycle are in a steady state.
(4)
Natural gas is the fuel, and heat loss from the combustion chamber is equal to 2% of the fuel’s low heating value.
Electric power output and thermal efficiency are the two key performance parameters of the GTs that engine manufacturers specify, typically at ISO conditions (i.e., an ambient temperature of 15 °C, pressure of 1.01 bar, and 60% relative humidity). At the DPs, the thermal efficiency is a function of the thermodynamic cycle parameters (pressure ratio and turbine inlet temperature), component efficiency, and secondary air flows (i.e., cooling and seal flows). The power output, on the other hand, depends on the thermal efficiency and the air mass flow, which define the size of the engine. The greater the inlet mass flow, the larger the engine core diameter and vice versa.

2.2.2. Validation with Manufacturer’s Data

DP modelling, via an iterative function, involved single-point components matching the GT’s key performance parameters with those supplied by the GT manufacturer. The modelling process starts with the assumption of default software parameters and then obtains convergence of specified target parameters after applying the iteration function to certain of the variables. This study presents the procedure that was followed by Almutairi et al. [36] to investigate the given GT engines, and presents the Saturn 20 GT engine as an example on how the validation was performed. Table 2 shows the iteration targets for the Saturn 20 GT engine, which is presented as an example of the validation procedure.
The iteration variables in Table 3 provide a reasonable range of the variables with the maximum values based on the GT state-of-the-art technology. Because thermal efficiency primarily depends on the engine pressure ratio, the iteration targets for the turbine pressure ratio are adjusted until the thermal efficiency and heat rate correspond to the original manufacturer published values at ISO conditions. As a result, the HP compressor pressure ratio, combustor outlet temperature, and inlet corrected mass flow rate are 3.42, 1238.75 K, and 6.99 kg/s, respectively.
Table 4 compares the design point performance specified on the original manufacturer’s website and obtained from the simulation and illustrates the close agreement.
For an off-design point, gas turbine performance predictions require considerable accuracy on the part of the users within the limits of uncertainty in the values of the components. For instance, similar gas-turbine engines can give distinctly different performance behaviors; this is often attributed to component manufacturing and assembly tolerances. GT manufacturers produce operational maps based on extensive testing during the engine’s development, using intrinsic details of the engine component geometry combined with the information derived; these maps remain the engine manufacturer’s exclusive intellectual property. Therefore, developing specific GT models is a complex task; it depends on the accuracy with which the component’s unique behavior is modelled, but which are difficult to obtain due to the commercial sensitivity concerning information about the engine.
Researchers have concentrated on approximating the operational maps using analytical techniques and a few field measurements. The most common method is the so-called scaling of generic maps, in which all the data points on the map are scaled with respect to the design point. Four parameters define the performance map: pressure ratio, isentropic efficiency, corrected mass flow, and corrected speed. Generally, two parameters are defined and the other two are estimated. Other arbitrary parameters that are presented on the map include the β -lines and the ratio of turbine inlet temperature to ambient temperature [37].
Considering that GT performance is highly affected by ambient temperature variations, a parametric study of the design point was performed in this work to simulate the influence of change in ambient temperature and part-load conditions on the critical performance parameters. The parametric study involves ambient temperature variation from 288 K to 328 K. The load was decreased from 100% to 60% to study the impact of part-load on the performance. An increase in the temperature causes a decrease in the air density, resulting in a lower mass flow rate into the engine, so that the power output drops since it is a function of the total mass flow through the engine.

2.3. Economic Analysis

2.3.1. Lifecycle Costing

The economic evaluation of the GT with different compressor configurations considers the non-exergy related costs; these costs include all components of the evaluated systems. The associated costs cover capital investment, O&M, and fuel. In power plant applications, the selection of any GT configuration depends on its life cycle cost, which consists of the capital cost, fuel cost, fixed and variable O&M costs, and the salvage value (SV), as shown in Equation (3) [38]:
L C C = β · C I C P o w e r · H + f η t h + { O M f P o w e r · H + μ · O M v , b } S V
where β is capital charge factor, C I C is capital initial cost (in USD), H is annual operating hours, P o w e r is net rated output (kW), f is specific fuel cost in USD per kWh (in LHV), η t h is net rated LHV thermal efficiency, O M f is fixed O&M cost (USD/kW-yr), O M v , b is variable O&M cost (USD/kW-hr), μ is maintenance cost escalation factor (1.0 for baseload), and SV is salvage value at the end of the lifecycle.
Improving engine reliability and availability have been focal points for owners and operators of industrial GTs, to reduce both the magnitude and variability of O&M costs. Usually, the non-capital elements of GTs, such as the control system, are less reliable and, therefore, their spares are readily available. On the other hand, the aerodynamic components are invariably highly reliable and expensive to keep in stock. Thus, with outages due to capital parts failures, the downtime caused by the unavailability of spares could be significant. Consequently, the maintenance plan generally recommended by engine manufacturers is a preventive (or time-based) approach that depends on fuel type, the number of start-ups, and loading conditions. O&M costs are a function of the engine design, speed of fault isolation, and maintenance implementation.
Due to their extensive application in commercial aero engines and industrial gas turbine engines, axial compressors have undergone considerable research and development to attain high thermal efficiency. This has led to highly efficient axial compressors that operate close to their surge margins, making them susceptible to fouling and requiring advanced inlet air filtration and frequent washing. On the other hand, centrifugal compressors are less efficient, more reliable, and require less maintenance when compared with their axial counterparts; this means that gas turbines with axial compressors will have higher maintenance but lower operational costs. The reverse is the case for gas turbines with centrifugal compressors. Moreover, since the capital cost of a GT depends on its size (specific power), a GT with an axial compressor will be more expensive than an equivalent GT with a centrifugal compressor.
The economic analysis through the lifecycle involves recurring costs (fuel and O&M) that must be estimated in a way that includes consideration of the expected future increases in price. Accordingly, this work considered the “present-value method” (PVM) to estimate the lifecycle cost. The PVM depends on the time equivalent value of past, present, or future cash flows relative to the beginning of the base year [39]. PVM includes a series of uniform payments made during a period of years, as shown in Equation (4). It includes a series of uniform cash amounts (A) that are paid during a period of (n) years considering the discount rate (d), as shown in Equation (4). Table 5 shows financial inputs pertinent to the analysis.
P V = A t = 1 n 1 ( 1 + d ) t = A ( 1 + d ) n 1 d ( 1 + d ) n

2.3.2. Discounted Pay-Back Period

Economic evaluation strongly affects the selection of the GT engine type and compressor configuration. Accordingly, this study presents a detailed economical evaluation of a 20 year plan for the given GTs, considering the installation price and the annual payments for O&M and fuel, and money inflows from selling the electricity produced at tariff prices. The economic evaluation assumes an optimistic scenario for the given GT engines to determine which engine has the shorter payback period. It is necessary to be precise when estimating the initial and future values of associated cash flows for the various operational scenarios during the intended period of operation. The annual cash flows (ACF) are described as in Equation (5); this is the net cash inflow resulting from selling electricity at tariff cost (ET = 0.1 USD/kWhr) multiplied by the net produced power, balanced against fuel cost (FC) and operation and maintenance costs (O&M).
A C F = E T P o w e r O & M + F C
The annual cash flows here are considered as annual returns, and they must be calculated at present value subjected to future discount rate and occurrence period, as shown in Equation (6),
P V = A C F 1 ( 1 + d ) 1 + A C F 2 ( 1 + d ) 2 + A C F 3 ( 1 + d ) 3 + ..... + A C F n ( 1 + d ) n
The capital initial cost (CIC) and annual cash flows during the study plan are represented in terms of net present value, as shown in Equation (7):
N P V = C I C + 1 n A C F n ( 1 + d ) n
The discounted payback period can be obtained according to Equation (8):
C I C + 1 n A C F n ( 1 + d ) n = 0
where (n) represents the number of years needed to obtain the amount of cash from sales of electricity obtained throughout the lifetime of the engine.

2.4. Exergoeconomic Analysis

Exergoeconomics is a method by which the exergy destroyed within the cycle components, fluid streams, and the product may be determined. The purpose of such an approach is to enable the exergy costs to be minimized and the cost effectiveness of the system improved. Exergoeconomic analysis combines economic principles with the second law of thermodynamics.

2.4.1. Exergy Costing

Exergy costs requires consideration of the costs of all the streams exiting from or entering a system that operates at a steady state; it includes both heat transfer to and from the surroundings and work performed in terms of exergy rates. Exergy destruction is determined by the irreversibilities in the system and is determined by summing the differences between exergy transfer out of and into the given system.
The costs associated with the streams entering, exiting, and work and heat are, respectively:
C ˙ i = c i E ˙ i ( entering   work )
C ˙ e = c e E ˙ e ( entering   heat )
C ˙ w = c w E ˙ w ( exiting   work )
C ˙ q = c q E ˙ q ( exiting   heat )
Here c i ,   c e ,   c w , and c q are average costs per exergy unit in USD/GJ.
Typically, exergy costs are presented separately for each system component. From the above equations, it follows that for the kth element in each exergy stream entering a given system, the sum of the costs of capital-investment ( Z ˙ k C I ) and operation and maintenance ( Z ˙ k O M ), plus the cost rates associated with the stream ( C ˙ i ), are equal to the sum of the cost rates of the exiting exergy streams ( C ˙ e ). For the kth element, the general equation relating heat input and power output will be:
C ˙ q , k + Z ˙ k T + i C ˙ i , k = C ˙ w , k + e C ˙ e , k
Substituting (9–12) into (13), we have:
c q , k E ˙ q , k + i c i , k E ˙ i , k + Z ˙ k T = c w , k E ˙ w , k + e c e , k E ˙ e , k  
Applying Equation (14) to every element of the system has the unfortunate result that the number of unknown quantities is greater than the number of equations. This means a number of supplementary equations are needed to obtain a solution. The result is a linear system of equations which may be written in the form of matrices:
[ E ˙ k ] X [ c k ] = [ Z ˙ k ]
where [ E ˙ k ] is an exergy-rate matrix obtained from exergy analysis, [ Z ˙ k ] is a vector matrix representing total cost, obtained from economic analysis, and [ c k ] is a vector matrix representing exergetic cost.

2.4.2. Levelization

Typically, over the life of a plant, fuel, maintenance, and operational costs increase non-uniformly. However, a geometric progression is often assumed whereby the expenditure in a given year is equal to the expenditure of the previous year multiplied by a nominal depreciation rate (1 + ieff).
Present worth (PW) represents the approximated value of the gas turbine engine at a given future year. Salvage value ( S V ) is an estimate of the value to be obtained when the plant is sold at the end of its working life [40,41].
P W = C I C S V   . P W F
S V = j . C I C
where CIC is the initial capital cost, j is the salvage rate (%), and PWF is the present worth factor which is:
P W F ( i , n ) = 1 ( 1 + d ) n
where d is the discount rate and n the relevant number of years.
The annual capital cost (ACIC) is given by:
A C I C = C R F . P W F ( i , n )
To recover the initial capital investment via a series of constant payments over a given time, a capital recovery factor ( CRF ), which includes an agreed discount rate, is used.
C R F = d ( 1 + d n ) ( 1 + d ) n + 1
The hourly levelized cost of plant and kth component are given by:
Z ˙ H = A C I C H
Z ˙ k = Z ˙ H E P C k E P C k
where H is the annual number of hours of operation, which was considered as 8000 h/year.

2.4.3. The Exergoeconomic Parameters

Important exergoeconomic variables used to evaluate and optimize thermal systems are relative cost difference,   r k , and exergoeconomic factor, f k . r k characterizes the relative increase in average cost per exergy unit between fuel and product, and minimising r k is the goal of the optimisation process. For the kth component, r k can be expressed as an objective function [42]:
r k = c p , k c f , k c f , k = 1 η e x , k   η e x , k +     Z ˙ k C I + Z ˙ k O M c f , k E ˙ p , K
where subscript f represents the fuel and and p represents the product.
The two sources that determine the costs of the kth element are exergetic (exergy destruction and loss) and non-exergetic (including capital investment and/or maintenance and operational costs). To minimize r k , it is useful to know the relative importance of these two sources. The exergoeconomic factor can determine the relative value of the two sources. The exergoeconomic factor, f k , can be written as:
f k = Z ˙ k Z ˙ k + c f , k [ E ˙ d , k + E ˙ L , k ]

2.5. Environmental Indicators

Today, it is recognized that global climatic change due to environmental factors such as ozone depletion is a critical issue for humanity. The relationship between energy utilization and the environment began to raise concerns in the 1980s [43]. However, while environmental issues are complex, and it can be difficult to identify or quantify sources, causes, and effects, the science has developed sufficiently for the EU to issue legislation for the reduction of carbon dioxide emissions.
Furthermore, support is being provided by the EU for the promotion of low-carbon technologies with the aim of reducing CO2 emissions, since CO2 is the major greenhouse gas. It is also noted that, for a given thermal load, CO2 is proportional to the efficiency of the system; this means inefficient systems significantly adversely affect the environment.
In this study, three environmental indicators previously introduced by [44]–the environmental destruction coefficient (Ced), the environmental destruction index (Θedi) and the environmental benign index (Θebi)–have been applied and assessed. Table 6 shows mathematical expressions for exergy destruction and exergetic efficiency.

2.5.1. Environmental Destruction Coefficient (Ced)

C e d is inversely related to engine exergetic efficiency as:
C e d = 1 η e x
The reference value of the coefficient unity; this is the case where the engine (such as a gas turbine) has no effect on the environment. The C e d has only one value at any operating condition and it is desireable that its value is as close to unity as possible.

2.5.2. Environmental Destruction Index (Θedi)

The Θedi is an indication of the effect an engine (e.g., gas turbine) has on the environment via exergy wastage (e.g., loss and destruction). The desired value is zero, and this is taken as the reference. The target is always to be as close to the reference value as possible. The equation representing the index is:
Θ e d i = [ E l + E d E f ] C e d

2.5.3. Environmental Benign Index (Θebi)

The Θebi is a measure of how environmentally benign the given energy system is. Θebi is directly and inversely proportional to the Θedi:
Θ e b i = 1 Θ e d i
Θebi ranges between zero and +∞. The higher the index the more environmentally beneficial the engine. Higher values of Θebi result from minimizing exergy losses and destruction.

3. Results and Discussion

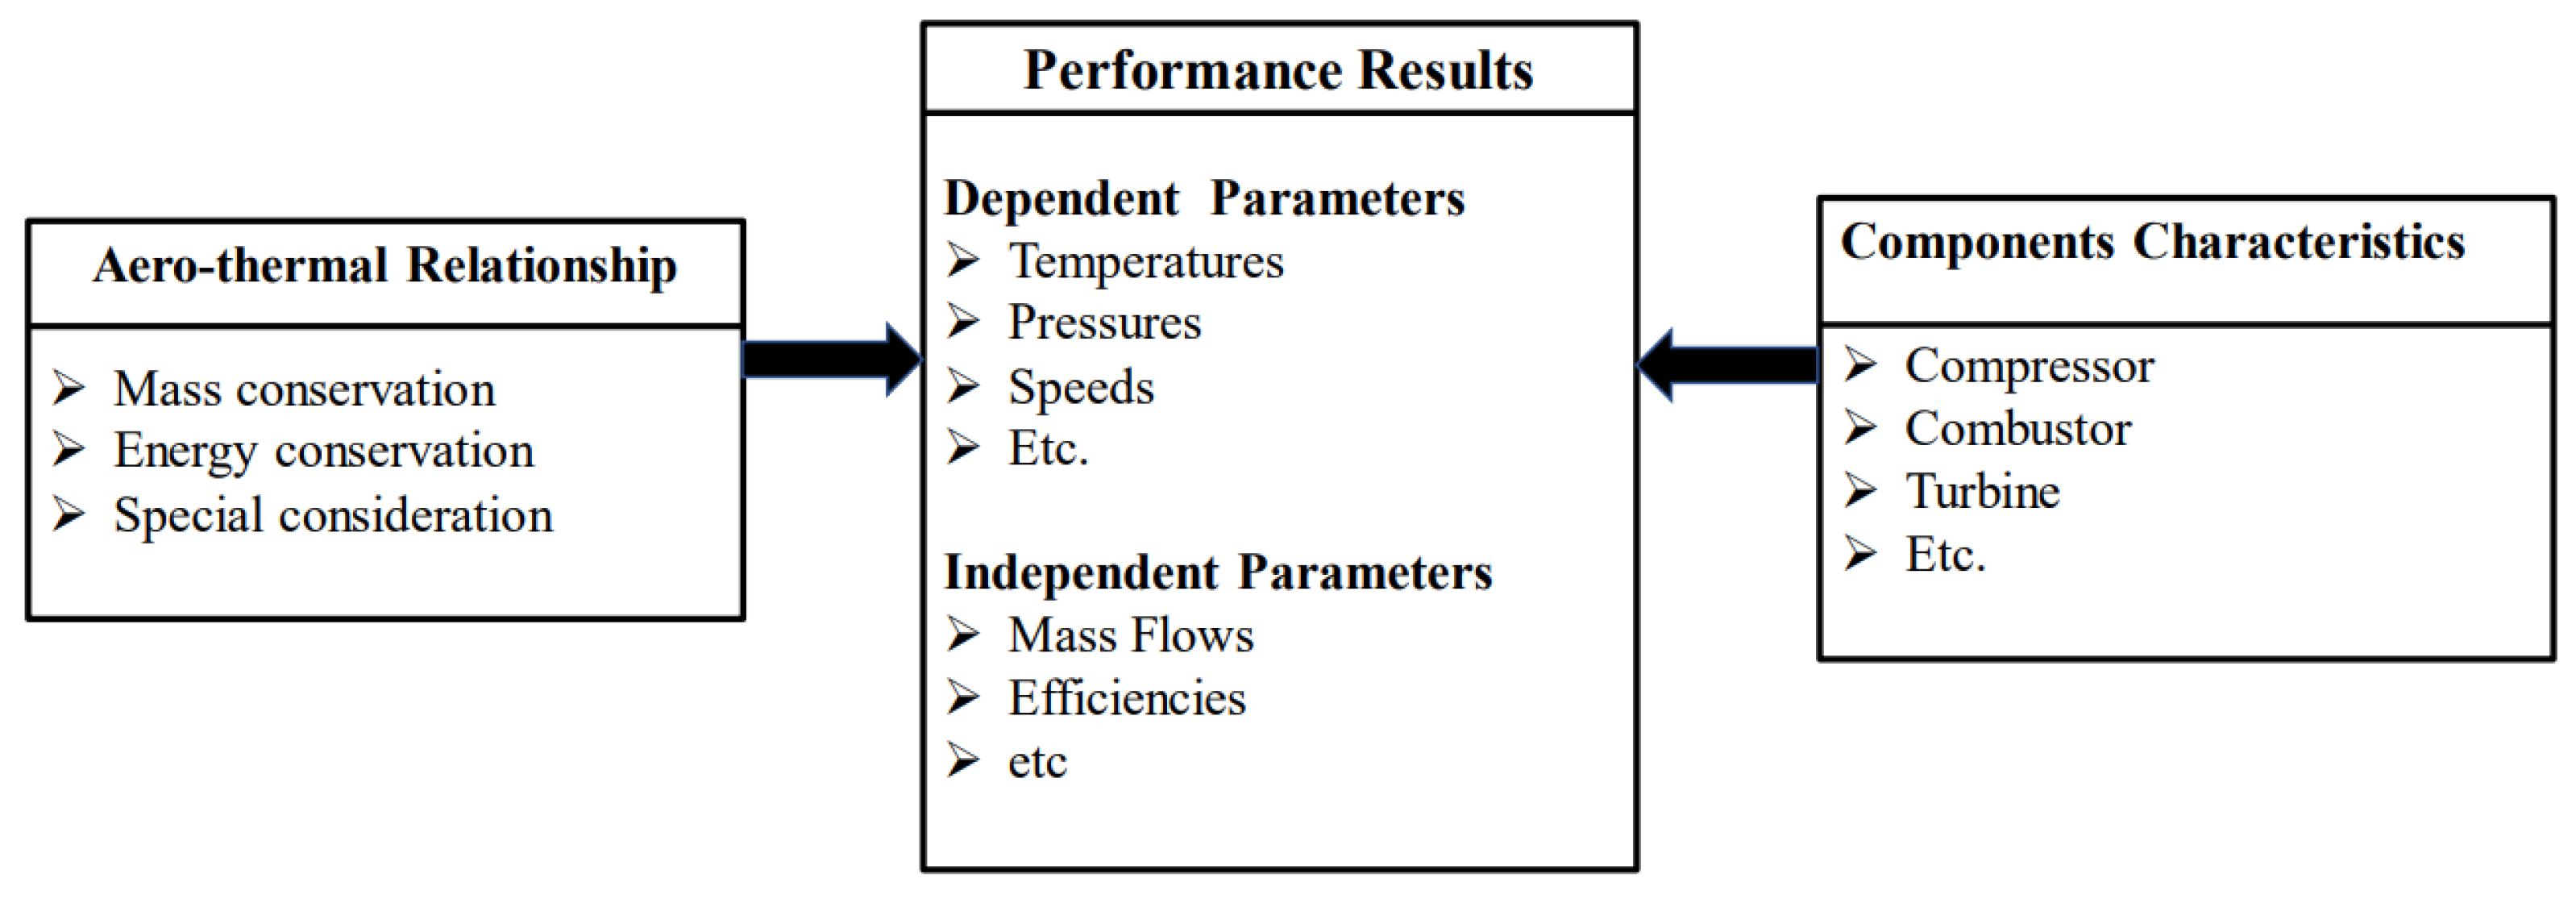
For the GT engine configurations considered, the economic, exergo-economic, and exergeo-environment analyses have been performed and the results are presented in detail in this section. Four different models of GT engine configurations have been considered based on both energetic and exergetic analyses. The compressor configurations of the GT engines were the primary consideration of this work.
The analysis was of the four GT engine configurations under different operational scenarios. The first scenario was to run the given engines under ISO conditions and carry out energetic and exergetic analyses at production loads of 60%, 70%, 80%, 90%, and 100%. For the second scenario, the four engines were run under different ambient temperatures at 100% production load.

3.1. Economic Analysis

The analysis estimated the economic feasibility of each gas engine by calculating the LCCs over 20 years, but did not consider revenues that might be acquired through the sale of electricity. It was assumed that expected costs must be paid over the period of the study plan (20 years). Thus, the work focused on the investment required at the beginning, to be paid for construction and installation, the annual cash needed to operate and maintain the gas engine, the annual cash needed for fuel supply, and finally the cash return from selling the engine after 20 years. 
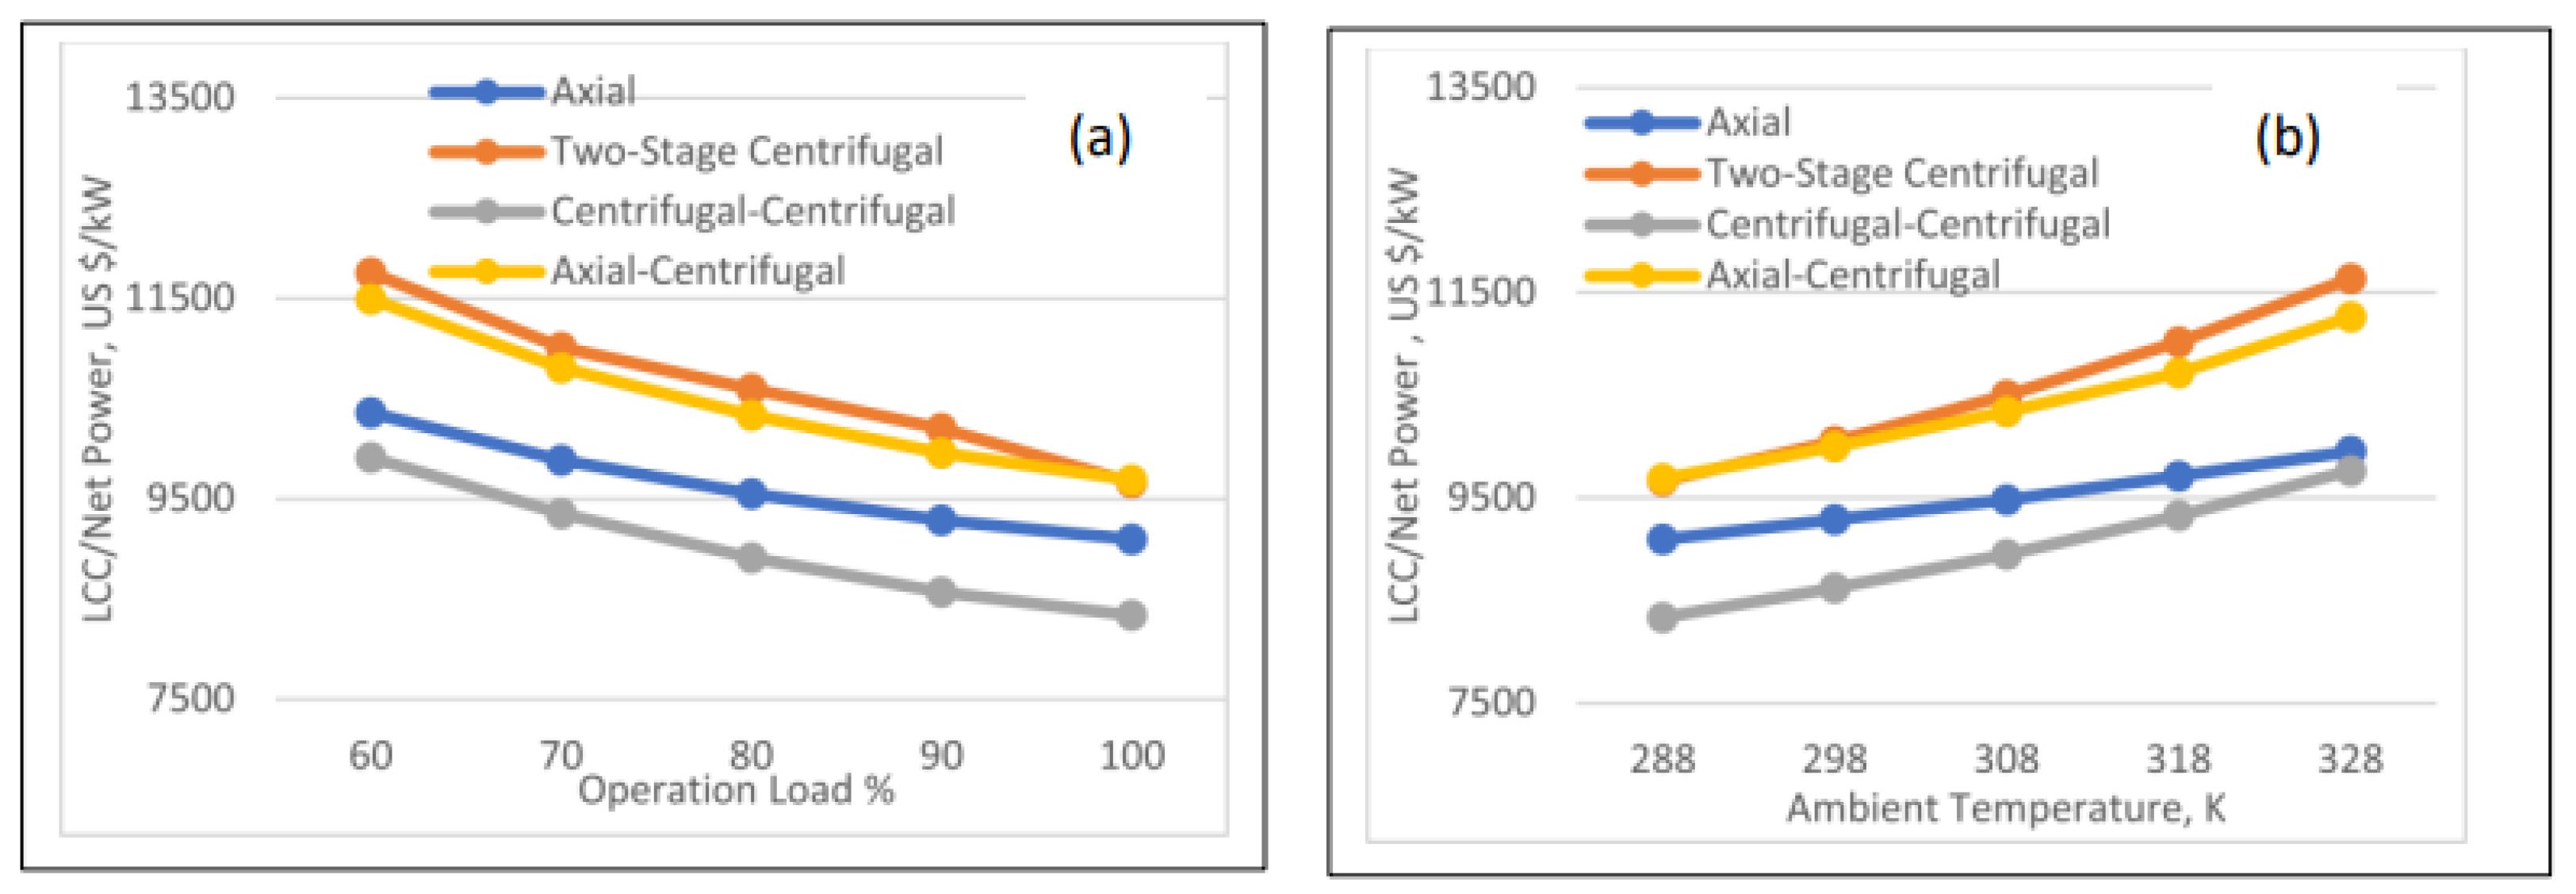
Figure 2 shows (a) lifecycle costs at varying operating loads, and (b) lifecycle costs at varying ambient temperatures.
The four configurations studied were of different sizes, so the lifecycle costs were presented in terms of the cash required to be paid during the life cycle relative to the net power of the GT engine. From Figure 2a, as would be expected, the cost of the net power supplied by the GT engines decline with the increase in production load. In this regard, the centrifugal-centrifugal configuration was the most economically feasible, ranging from 10,000 USD/kW at 60% production load to about 8500 USD/kW at full load. At all operational loads, the order of the other engine configurations was consistent; axial centrifugal, axial, and two-stage centrifugal. However, the axial-centrifugal and the two-stage centrifugal both have the same economic performance at full load, as shown in Figure 2a.
The cost of the net output power of the engine increased with increase in ambient temperature can be seen in Figure 2b. The figure shows that the two-stage centrifugal configuration and the axial-centrifugal configuration have the same LCC at 288 K; this is compatible with the findings presented in Figure 2a. However, the LCC for the two-stage centrifugal increases more rapidly then for the axial-centrifugal as the environmental temperature increases. The centrifugal-centrifugal configuration over the environmental temperature range, considered consistently, has the lowest LCC value. The axial configuration has the lowest rate of increase of LCC, with environmental temperature intersecting with the centrifugal-centrifugal configuration at 328 K.
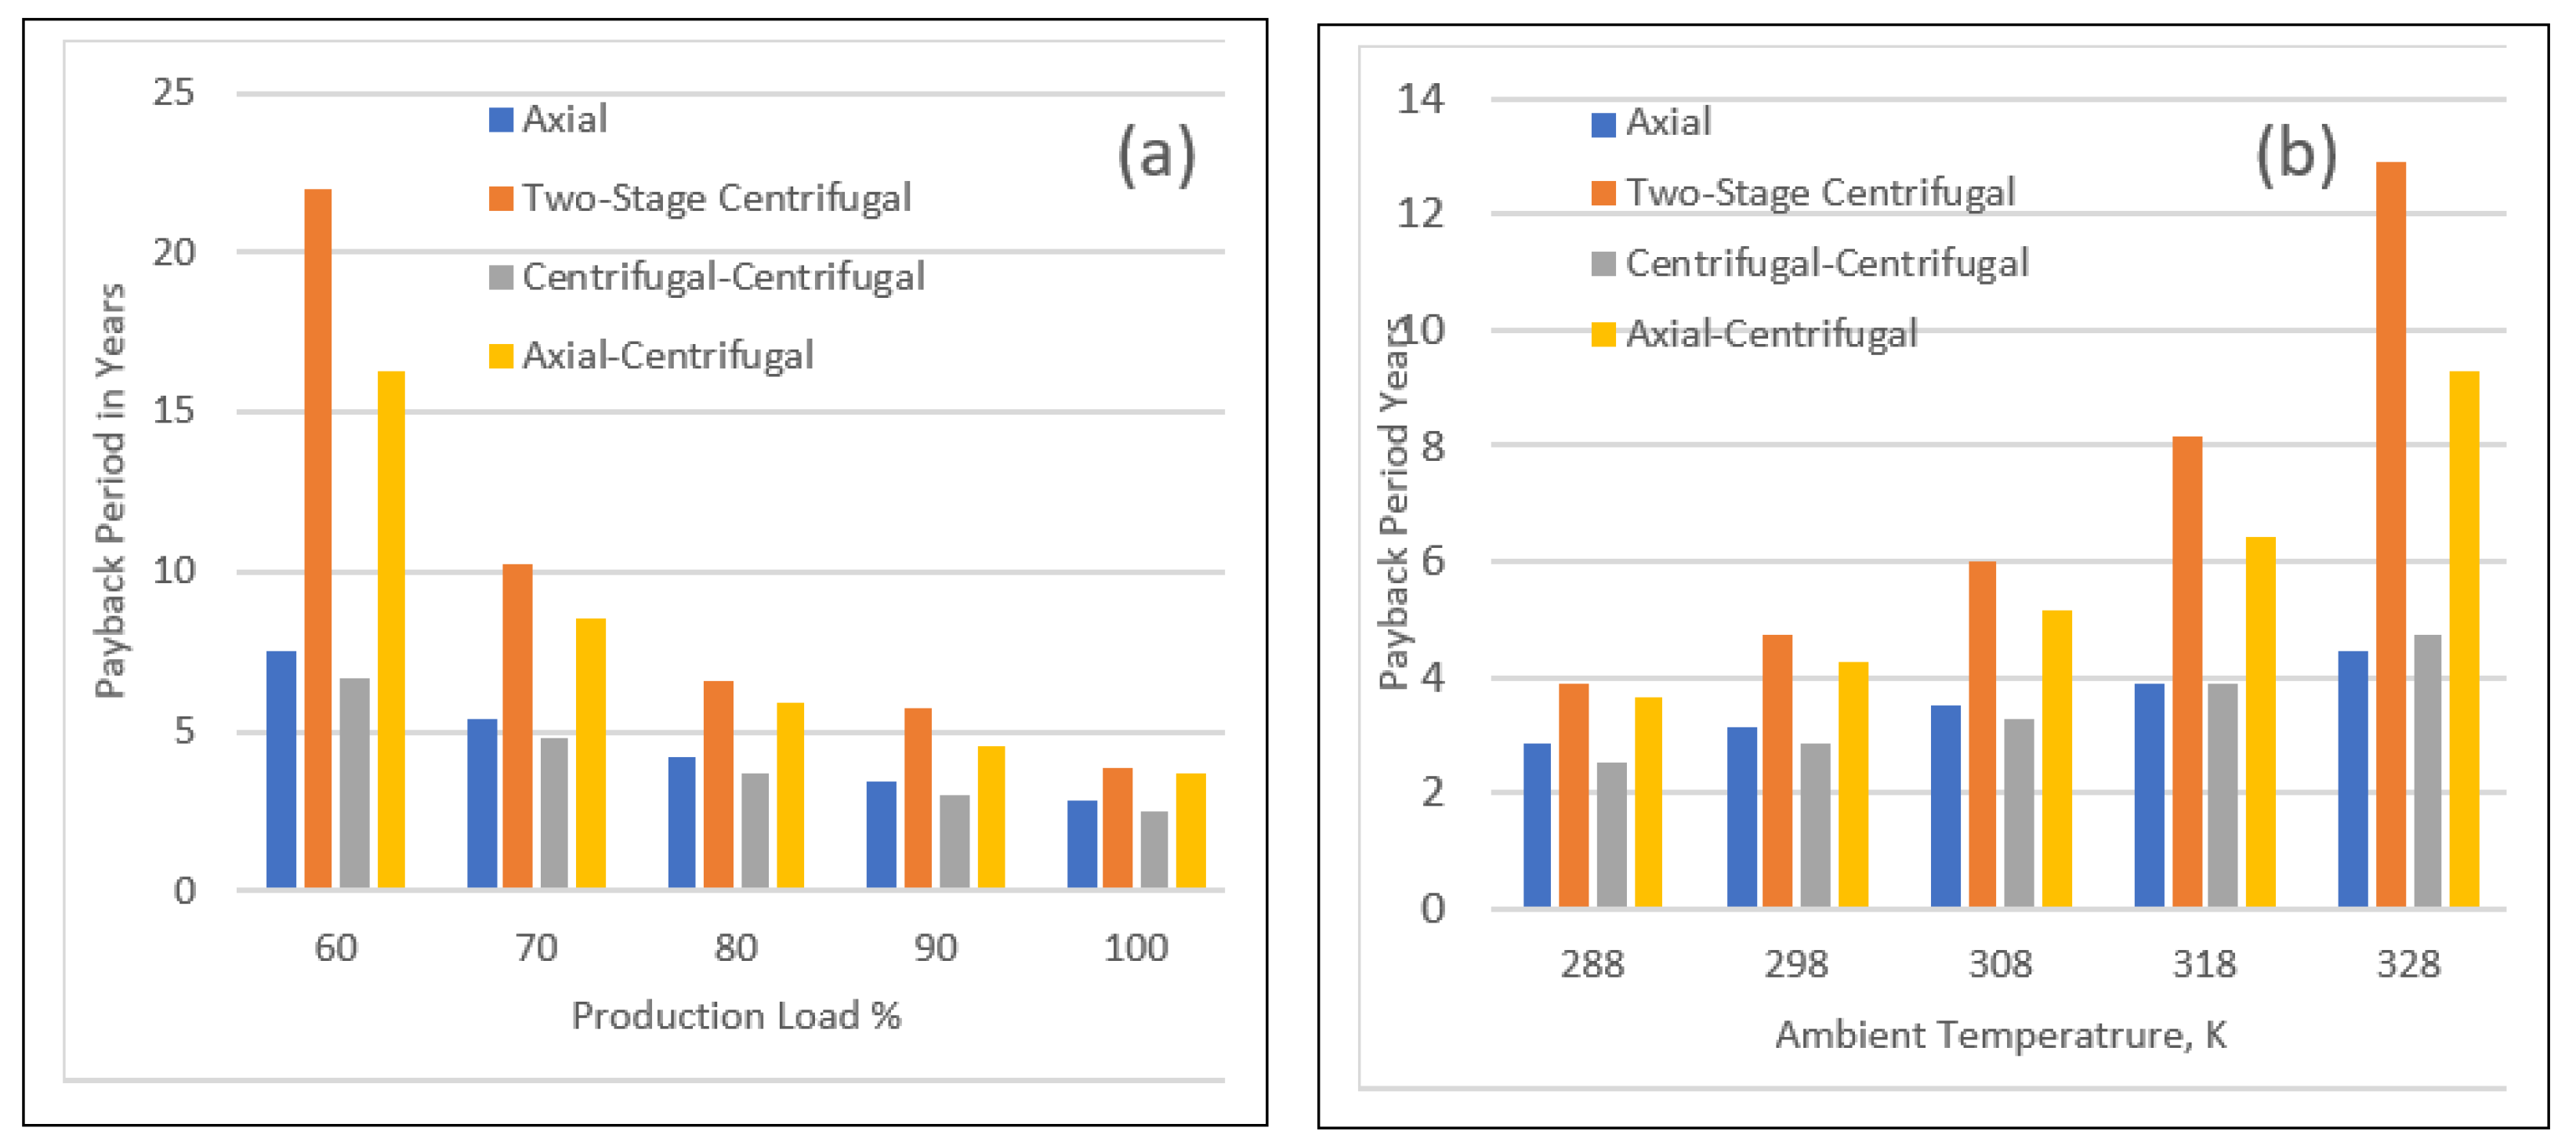
Figure 3 shows the payback periods of each configuration if the output net power is assumed to be electricity sold at tariff price. The feasibility of the four configuration increased with increase in operation load and decrease in ambient temperature, as shown in Figure 3a,b. The gas engine with centrifugal-centrifugal configuration consistently gave the shortest payback period. All configurations perform exactly as expected with respect to the LCC. Figure 3a shows that running the two-stage centrifugal engine is not feasible at 60% load if it is intended to produce electricity over a working life time of 20 years.
From Figure 3b, all configurations have shorter payback periods at lower ambient temperatures, with the centrifugal-centrifugal again giving the shortest payback period at all environmental temperatures, save at 328 K, where it is beaten by the axial configuration.
In conclusion, it can be said that, generally, the centrifugal-centrifugal configuration outperformed all the other configurations in economic feasibility.

3.2. Exergy Economic Analysis

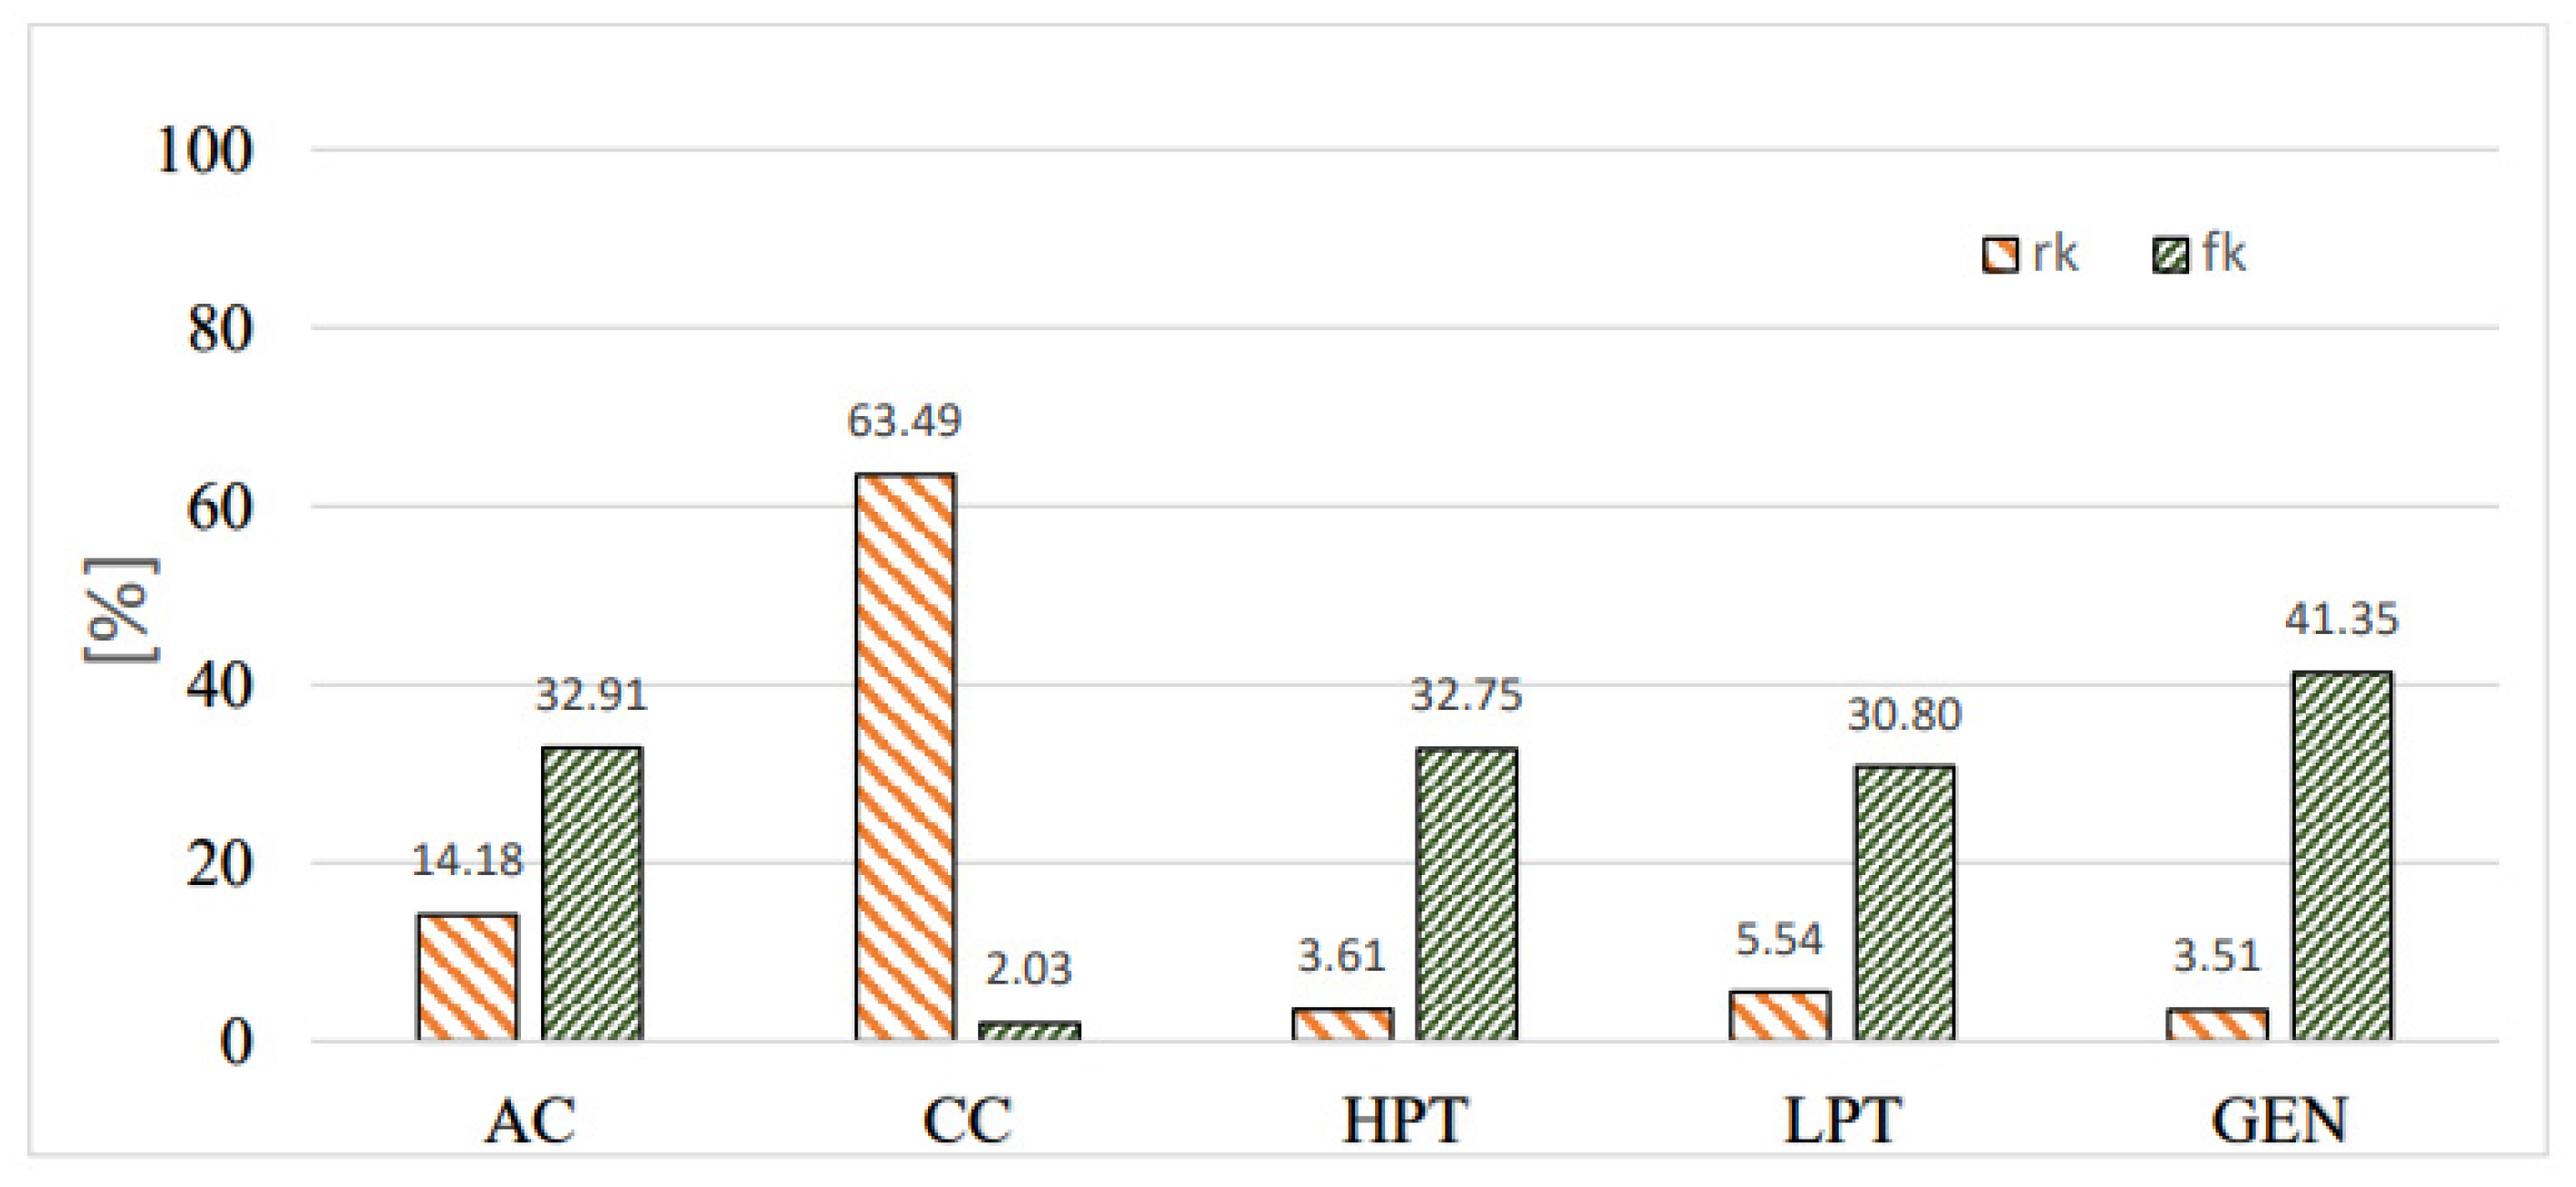
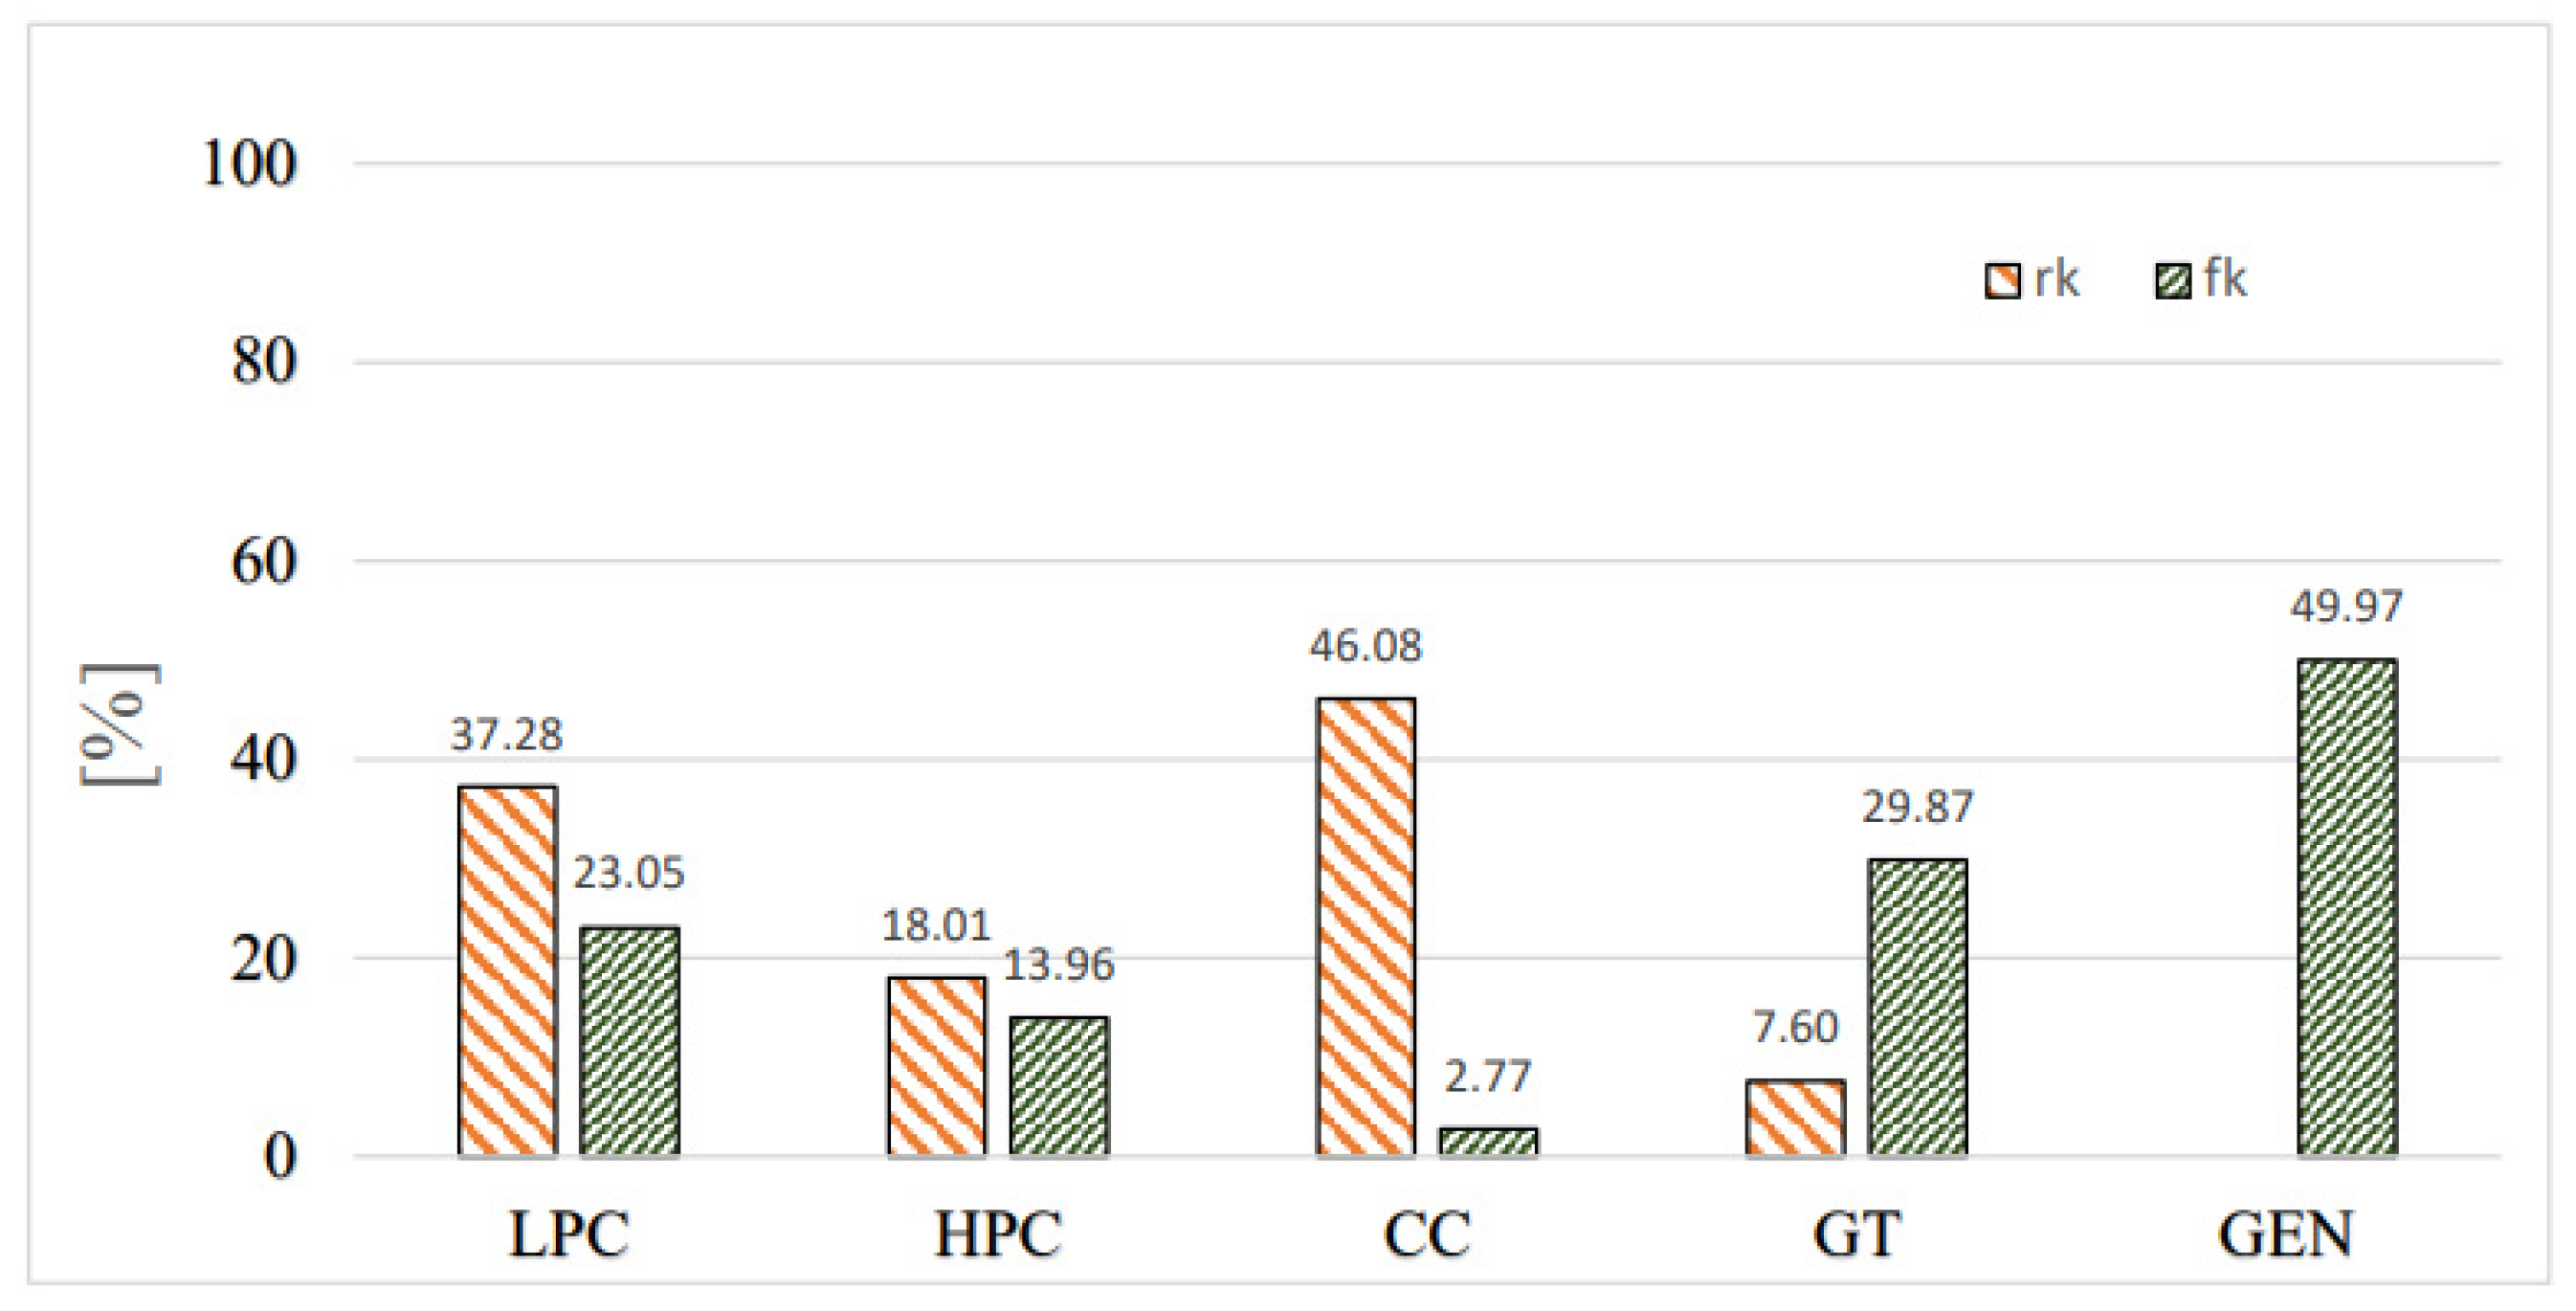
Figure 4 shows the values of both exergoeconomic factor, fk, and relative difference in cost, rk, as percentages for the gas turbine engine with axial compressor. The greatest value for rk occurs in the combustion chamber (CC); this means that it is the most important component from an exergoeconomic viewpoint. Next is the axial compressor, then the LPT, HPT, and GEN, respectively. The CC, relative to the other components, has a high rate of exergy destruction and a correspondingly low value for fk.
The value of fk for all components is below 50%; this means that a cost saving for the entire system could be attained by enhancing the efficiency of the components, even if this incurs an increase in the cost of capital invested. The cost of inefficiencies in each component can be addressed based on operating conditions and design criteria, with the component with the highest relative cost difference having priority.
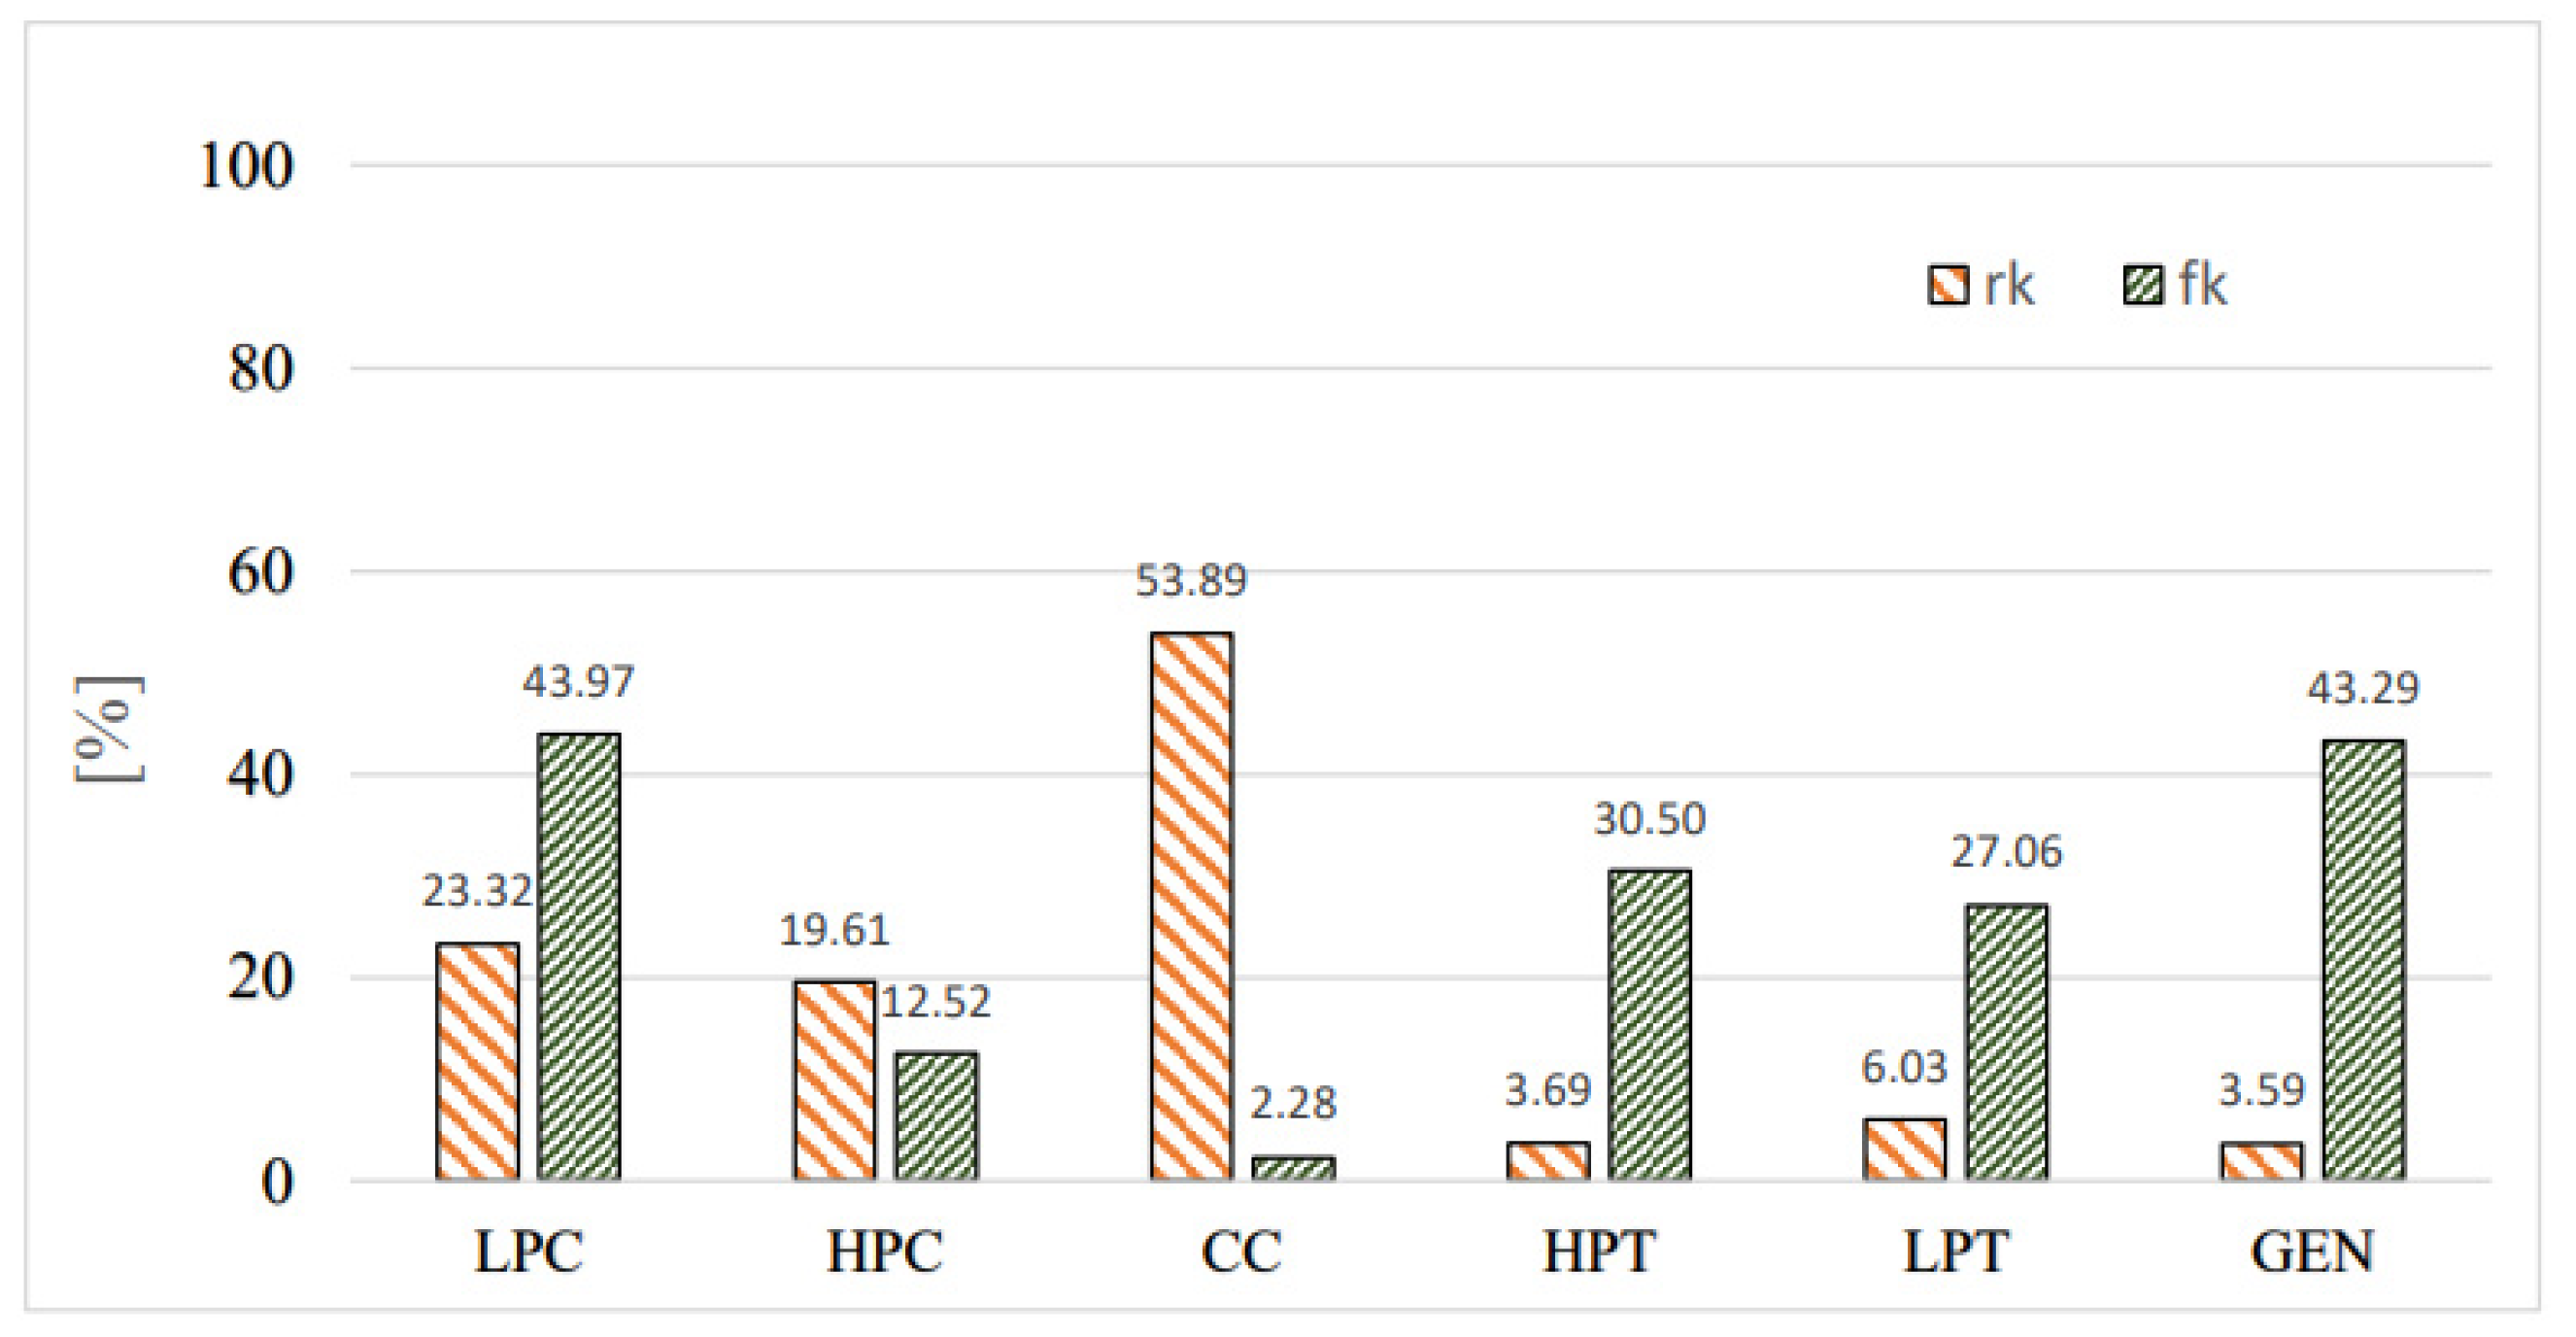
The values of fk and rk as a percentage of GT engine with two-stage centrifugal compressor are shown in Figure 5. The CC is again the greatest cost source relative to all other components. A study of the literature confirms that for gas turbines, the CC is accepted as the primary source of exergy destruction, greater than for any of the rotating components. The gas turbine engine with a two-stage centrifugal compressor has a relatively slight effect on rk and fk when compared to the axial compressor (reference case), due to its relatively low efficiency and capital cost. However, the impact on LPC and HPC is apparent and there is a need for greater efficiency even if it enhances capital cost because the exergy destruction makes a greater contribution to total cost. From an exergoeconomic perspective, after the CC, the LPC is the next most significant component, followed by the HPC. The gas turbine component’s economic efficiency is reduced slightly relative to turbines in the reference case due to the compressor configuration, which affects operating conditions and the quantity of extracting power.
Figure 6 shows the exergoeconomic variables (rk and fk) for the GT engine with axial-centrifugal compressor. The main findings extracted from this figure can be summarized in four points: first, the axial compressor (LPC) shows greater economic efficiency than the centrifugal compressor due to its lower level of irreversibilities, despite its higher investment cost. Second, after the CC, the cold section components have more effect on enhancing the entire system’s cost-effectiveness. Third, the potential for improvement is higher in the centrifugal compressor (HPC). Finally, the irreversibility contributed to the axial compressor is lower than for the reference case. which suggests the target of a relative reduction in investment cost as well.
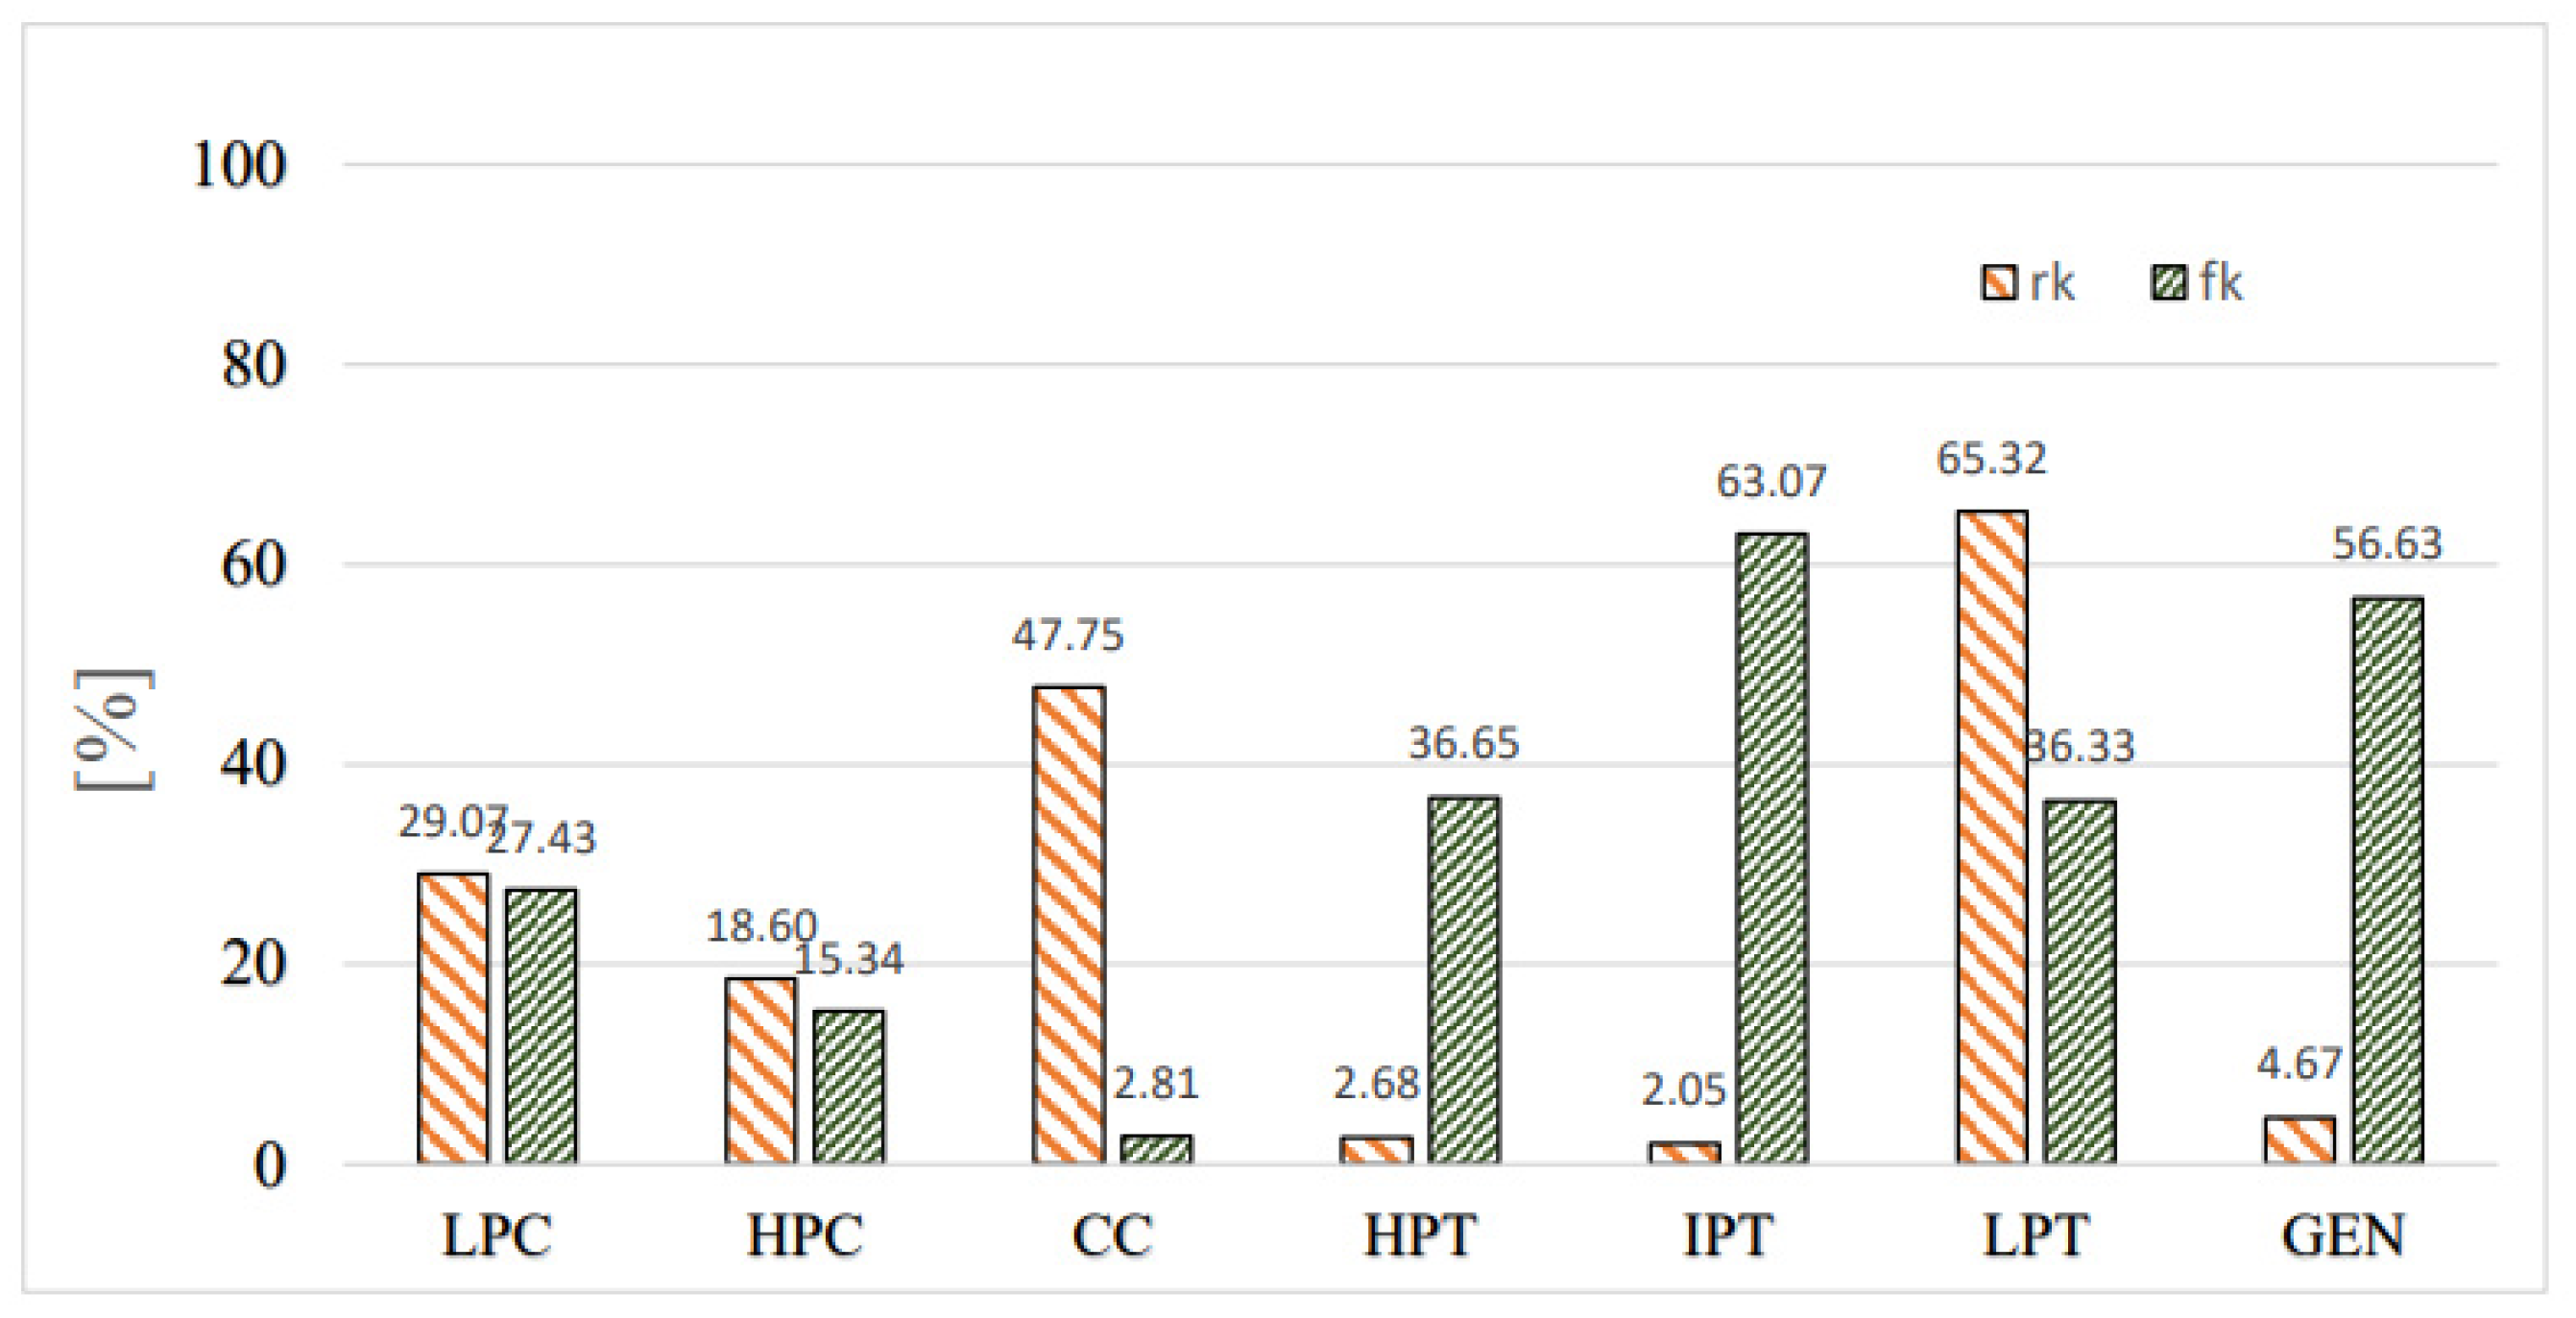
Figure 7 shows the exergoeconomic variables (rk and fk) for the GT engine with centrifugal-centrifugal compressor. From this figure, it is concluded that: first, despite low exergy destruction, the LPT is most important, followed by the combustion chamber, due to varying compressor configurations. The LPC always shows better economic performance than the HPC because of cost due to inefficiencies. Therefore, modifying the design of the compressors by increasing component efficiency or adjusting the operating condition to reduce exergy destruction within the component is necessary. The values of fk for the intermediate pressure turbine (IPT) and electric generator are 63% and 56%, respectively. These values suggest that capital cost should be reduced at the expense of component efficiency. Moreover, the GT engine with centrifugal-centrifugal compressor configuration enhances the exergoeconomic efficiency for all rotating components compared to the GT with two-stage centrifugal compressor. All turbine components registered higher values of fk than for any of the previous cases investigated.
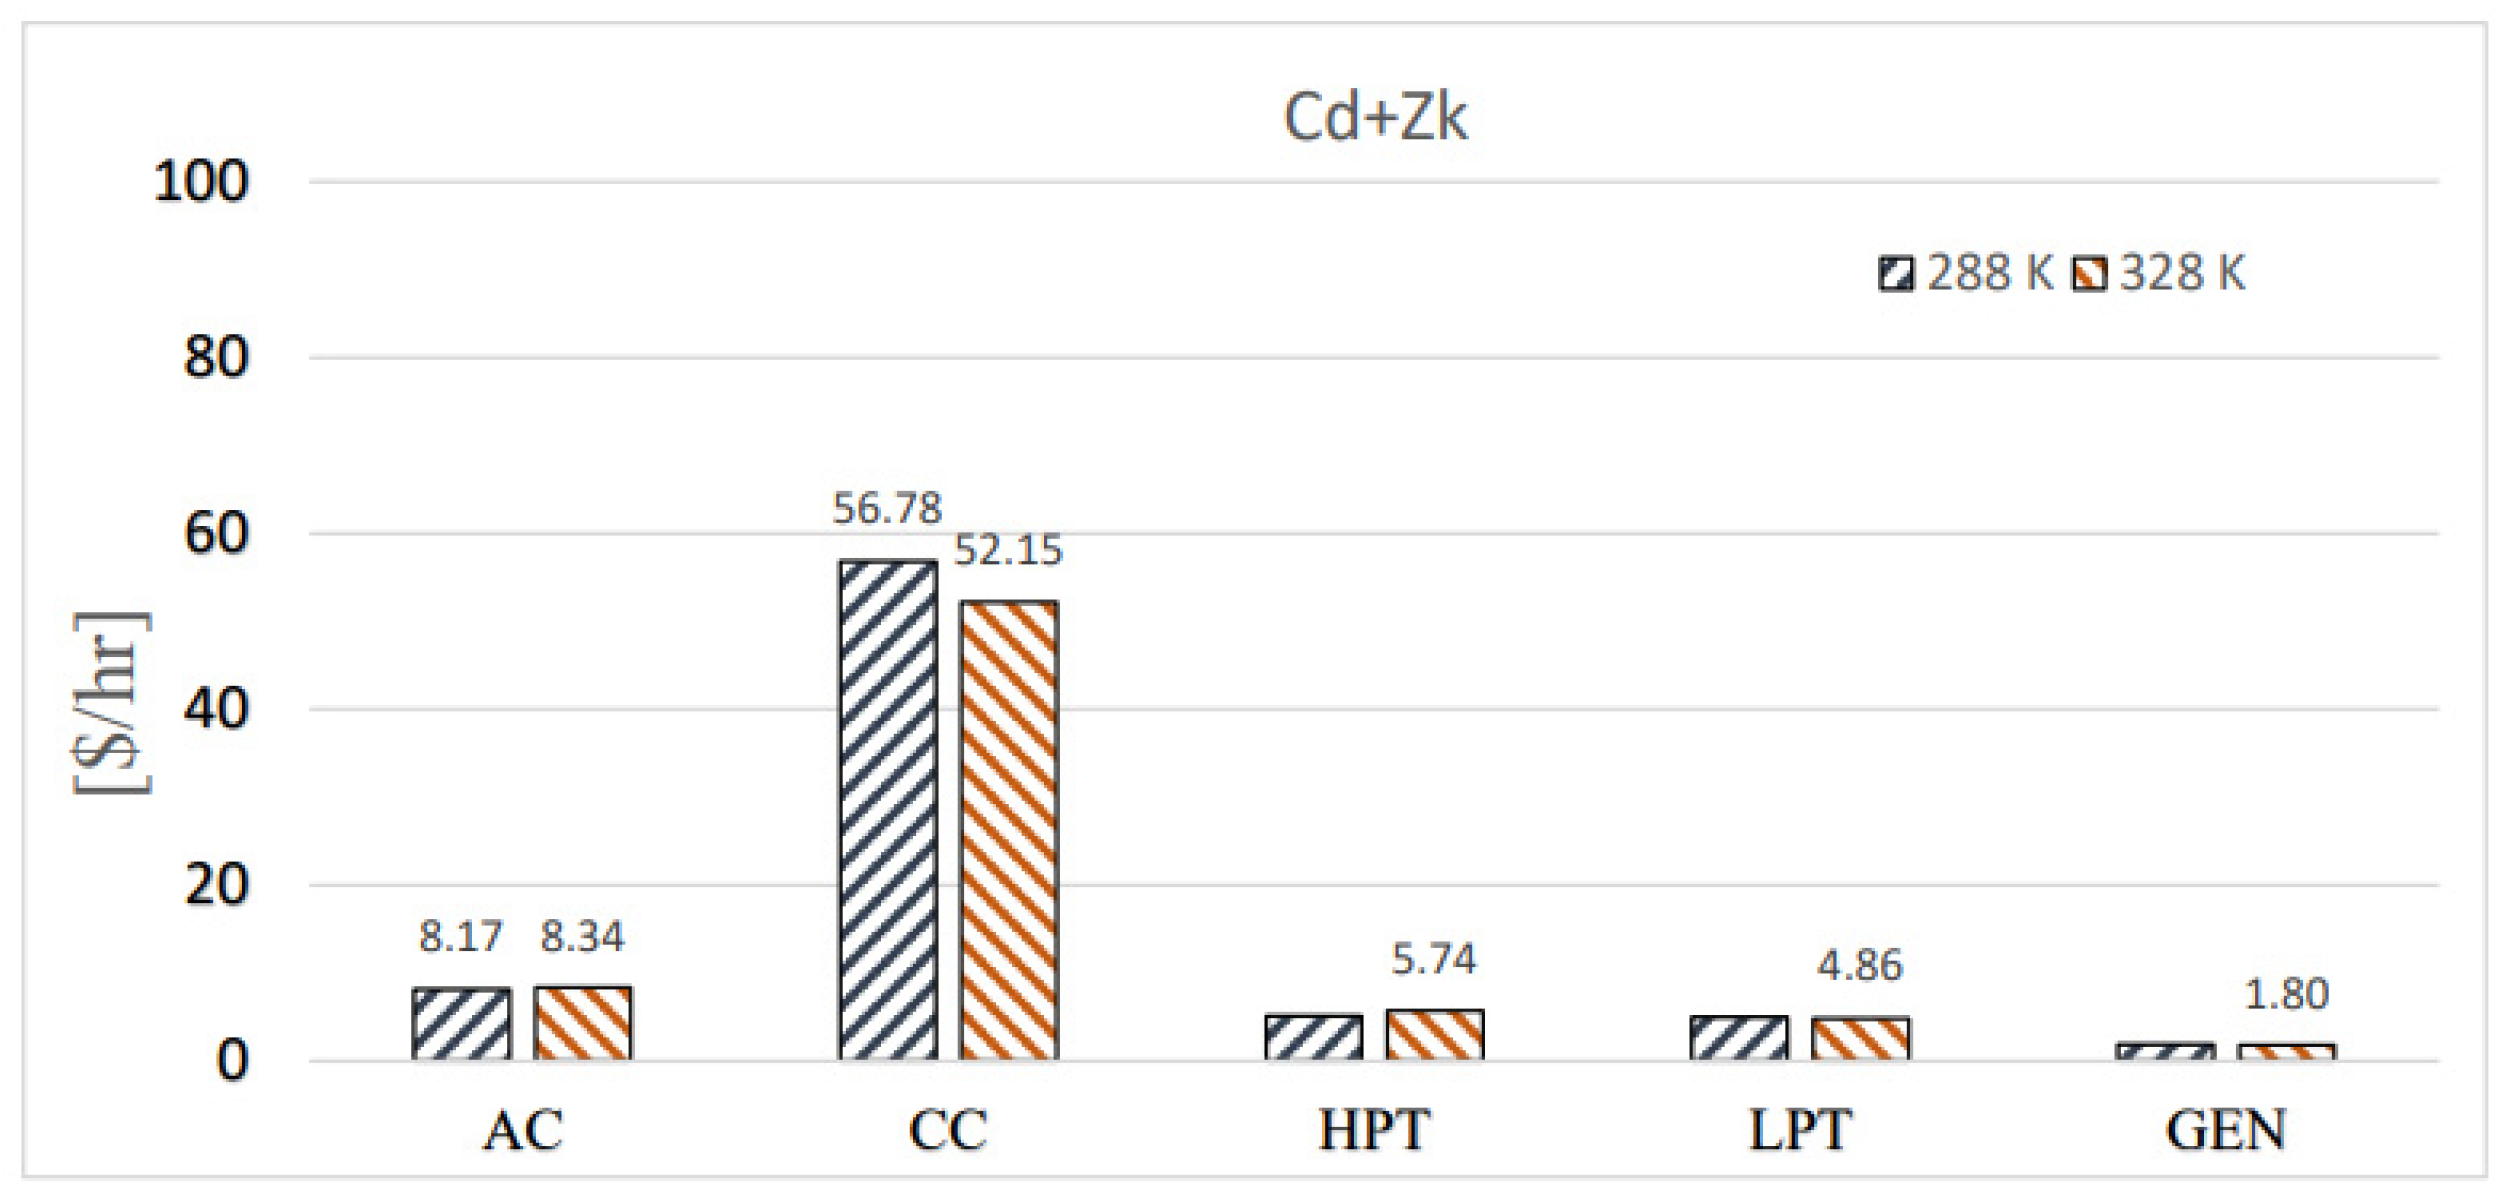
Ambient temperature is deemed a useful statistic by which to assess the local climatic conditions. 
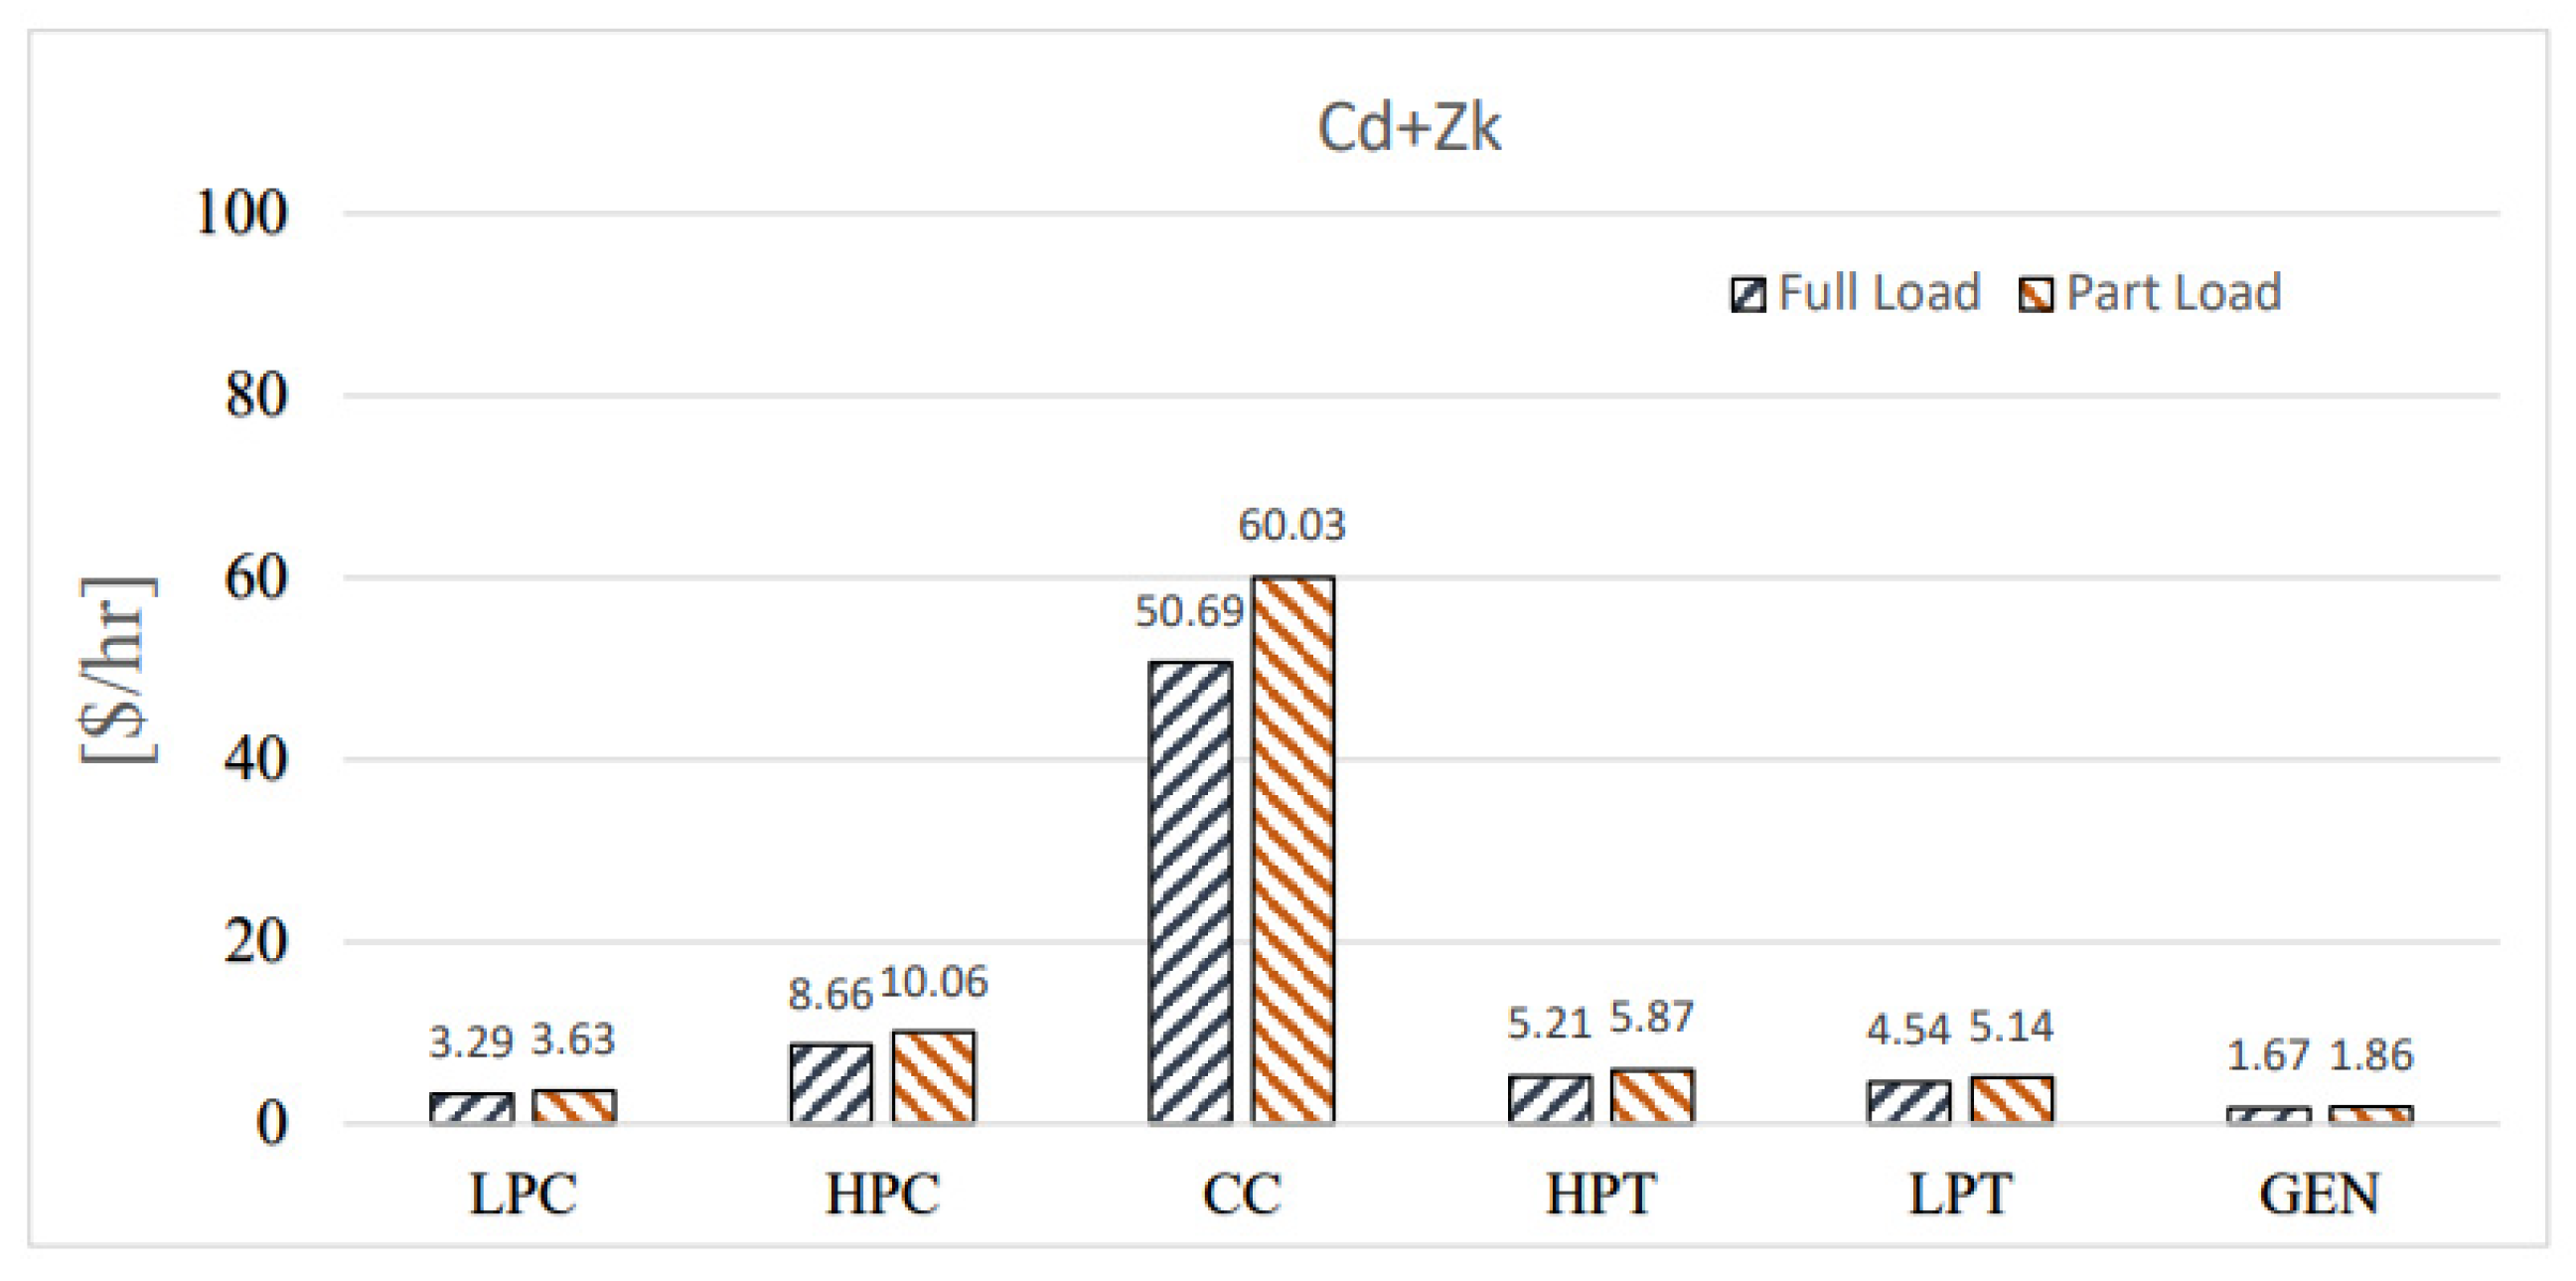
Figure 8 shows the sum of component costs and exergy destruction for every component considered in the GT with an axial compressor under ISO and Kuwait climate conditions. The CC has the greatest value of C ˙ d + Z ˙ k T , followed by AC, the HPT, the LPT, and the GEN, respectively. Increasing ambient temperature adversely affects gas turbine engine efficiency and production because of increased compressor load. In the AC and HPT, an increase in ambient temperature increases both exergy destruction costs and total cost. However, for the CC, an increase in ambient temperature will increase the temperature of the air entering the CC; this causes a reduction in fuel consumption and exergy destruction. A further decrease in exergy destruction costs in the CC is possible by fine-tuning the excess air, or if the reactants are preheated using waste heat from the exhaust gases, decreasing heat lost from the CC. Pre-heating the reactants has the added benefit of decreasing the rate of fuel combusted.
For GT engines producing electricity, grid imbalances or other limitations can lead to low demand, with the GT operating at part-load; an unfavorable condition that reduces engine efficiency. The effect of change in load, from full to 65% part load on exergy destruction and component costs ( C ˙ d + Z ˙ k T ) for the GT engine with axial-centrifugal compressor is shown in Figure 9. The value of C ˙ d + Z ˙ k T for each component increases when the power setting is reduced to part-load due to the increase in specific fuel consumption. The axial compressor (LPC) shows less change with load variation than the centrifugal compressor due to its higher efficiency and lower fuel exergy.

3.3. Exergyenvironmental Analysis

The environmental impact when converting energy resources into different forms of energy can be assessed quantitatively using an exergo-environmental methodology. Environmental impact has been investigated using different indicators (see Table 7). All three environmental indicators show that the GT with axial-centrifugal compressor is the most environmentally favorable and most ecologically efficient, producing the least ecological damage.
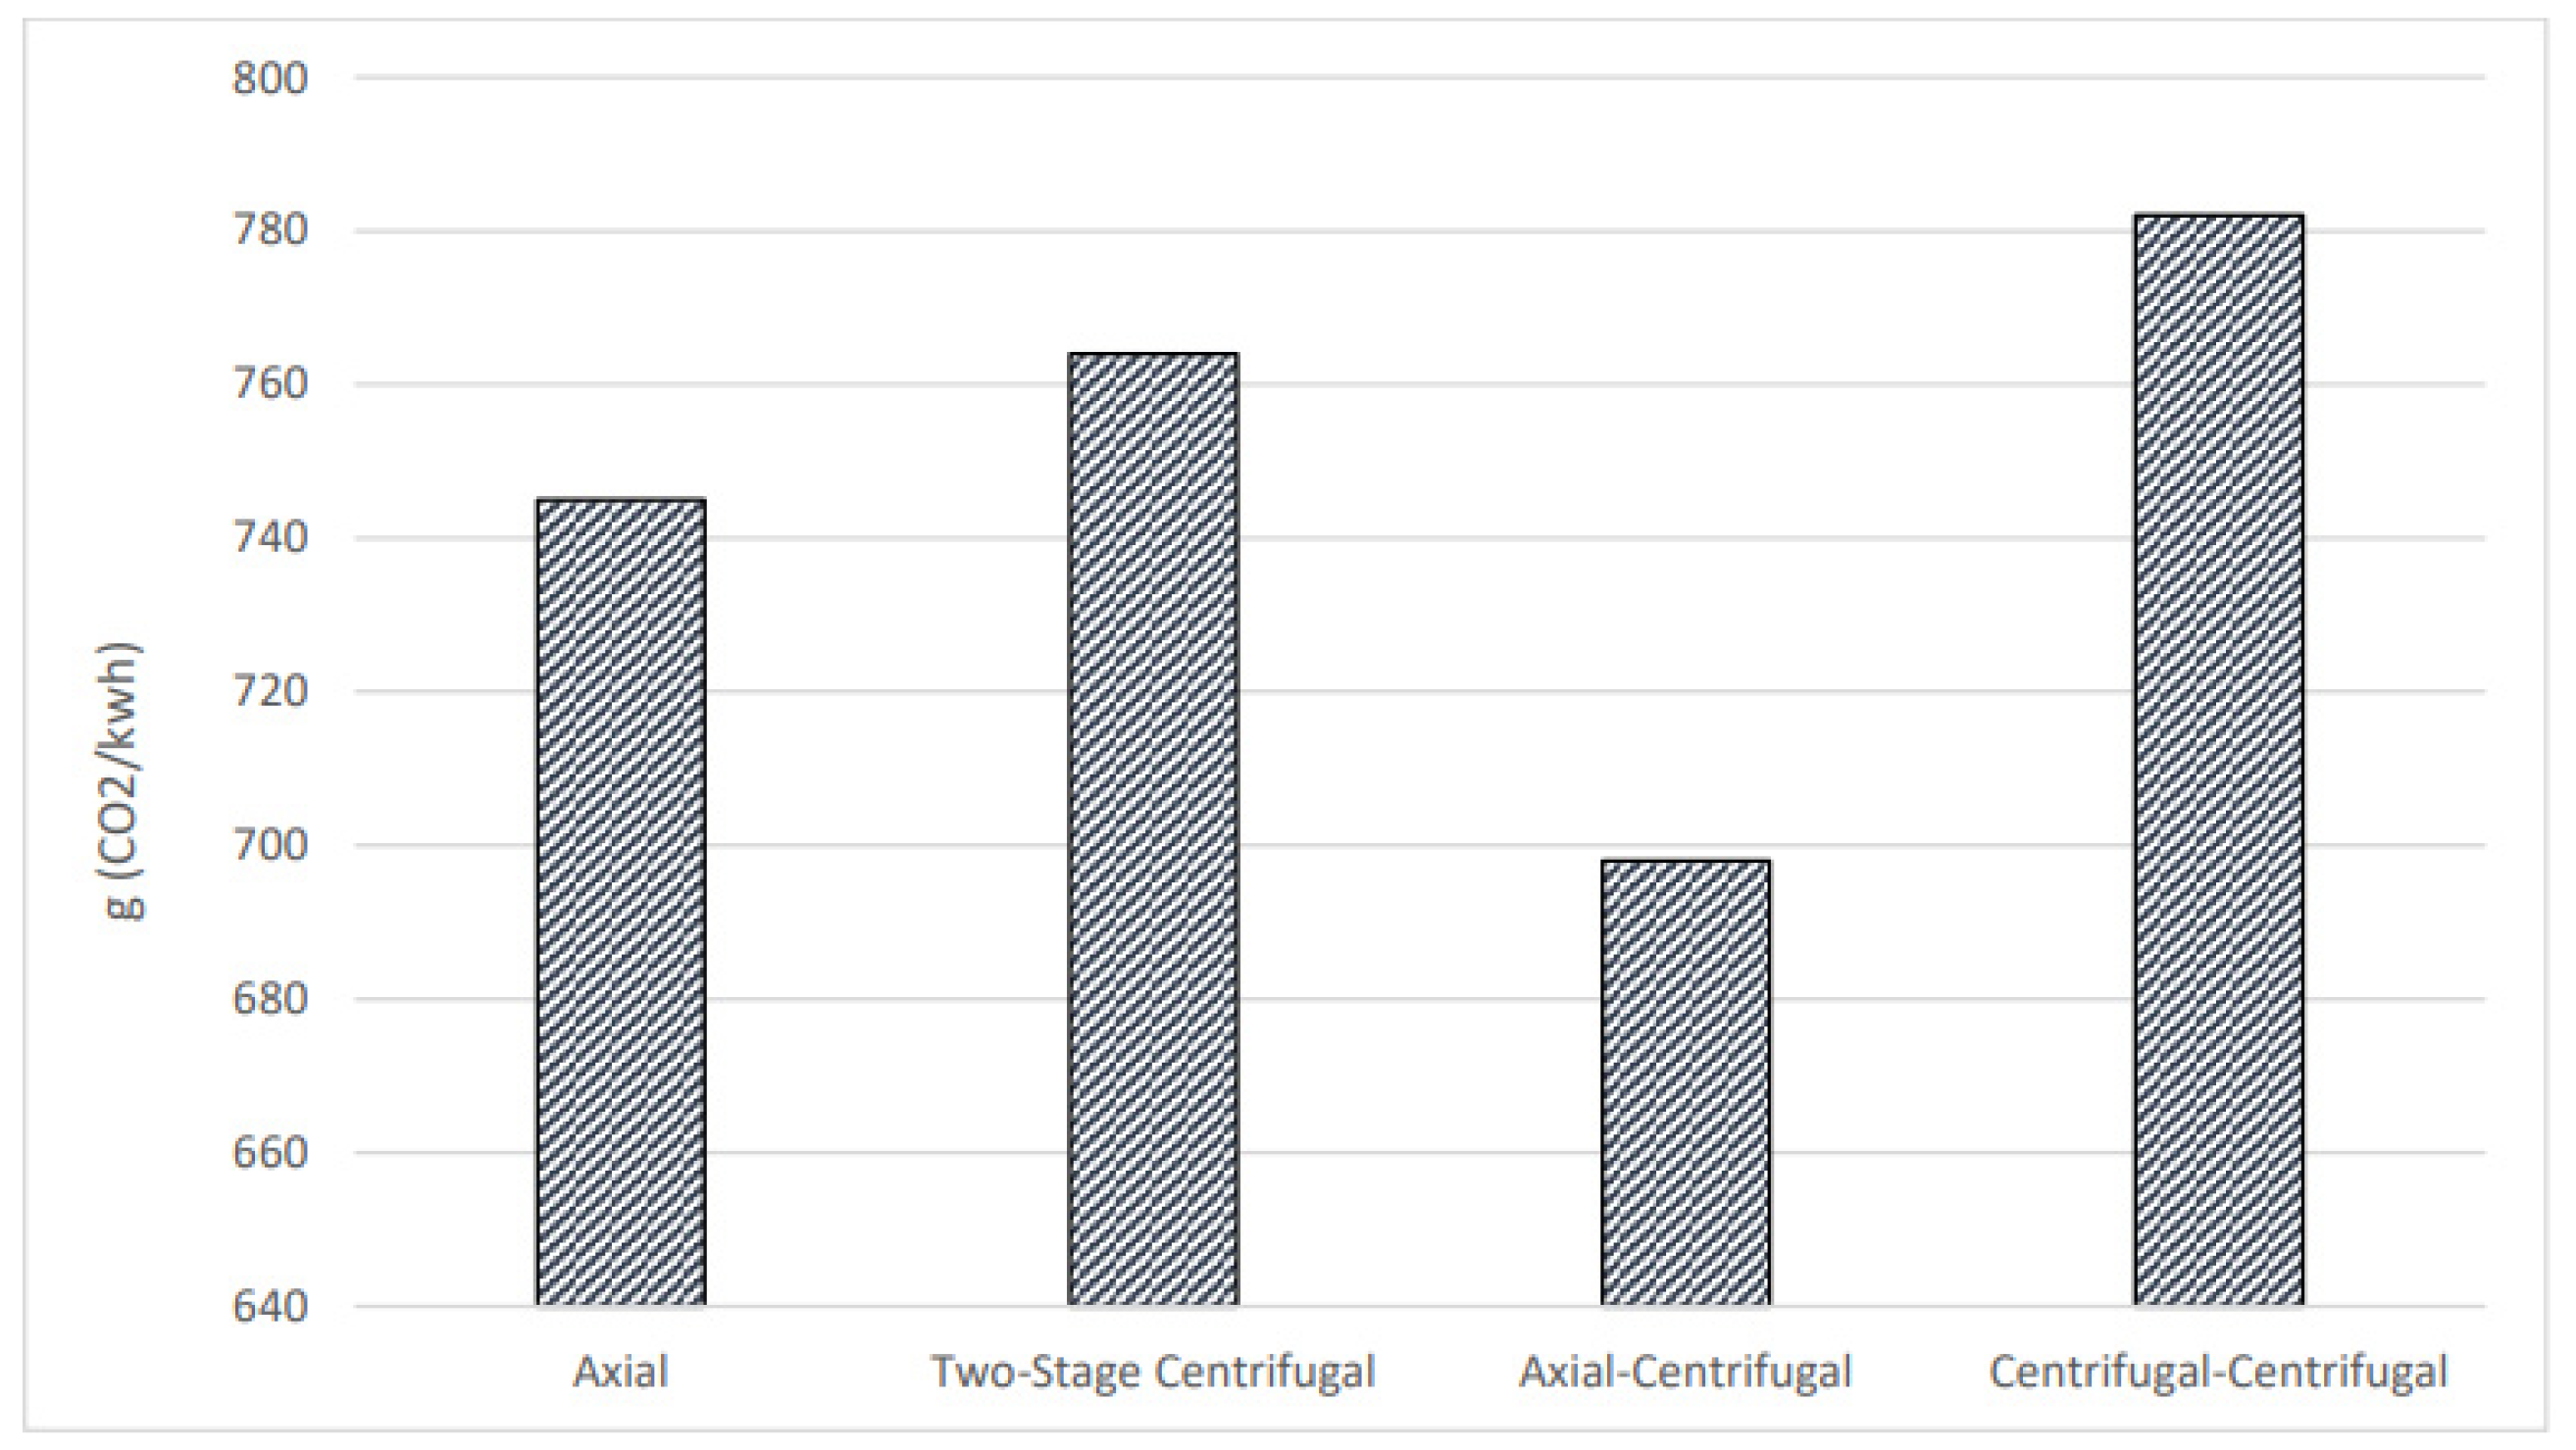
Figure 10 also shows the CO2 emissions for all four proposed GT engines. CO2 emission is strongly related to engine efficiency, as it is a measure of the fuel consumed in the combustion process. The CO2 value increases as the air-fuel ratio increases until the maximum value is achieved at the stoichiometric air-to-fuel ratio (when oxygen from the air and fuel are in perfect balance for combustion) and then decreases in the presence of excess air, e.g., the air-to-fuel ratio increases further. This leads to an important point: for maximum combustion efficiency, the proportion of carbon dioxide in the flue gases should be just less than its peak value. The gas turbine engine with an axial-centrifugal compressor achieved the lowest value of CO2 emissions per kWh when compared with others.
The current study illuminated some significant outcomes of small-scale gas turbine engines from an economical and environmental perspective. The end-user requirement is essential in selecting the appropriate gas turbine among the proposed engines. Lifecycle costing introduces valuable information about the expenses, while exergoeconomic factors help to enhance the system’s cost-effectiveness. It is interesting to note that with small-scale gas turbine engines, the engine size and maintenance cost significantly impact feasibility and economic efficiency; unlike in large-scale capacity, the maintenance cost impact is considered minor. The environmental impact of all gas turbine engines is only associated with operational efficiency and better utilization of resources.

4. Conclusions

Four GT engines with different compressor configurations under different working conditions have undergone economic, exergoeconomic, and exergyenvironmental analyses. Detailed models were developed using specialized software that represented the GT engines being studied and then validated using manufacturer’s published data.
The concluding results from this work are:
  • The costs of the net power produced by the GT engines decreased with an increase in production load and with a decrease in ambient temperature.
  • The GT with the centrifugal-centrifugal configuration is the most economically feasibility in terms of price per kilowatt power produced and shortest payback period. This was followed, in order, by the axial, axial-centrifugal, and the two-stage configuration.
  • The centrifugal compressor has the advantages of low maintenance and high reliability, whereas the advantage of the axial compressor in efficiency has become narrow for small-scale gas turbines. However, all environmental indicators show that the axial-centrifugal configuration is more environmentally benign with lowest value of CO2 emissions per kWh than the other systems considered, due to its high efficiency and lower fuel consumption.
  • The GT with axial configuration is almost as feasible as the GT with centrifugal-centrifugal configuration at the highest ambient temperature (328 K). This is because the axial compressor has higher efficiency and lower irreversibility compared to two-stage centrifugal, centrifugal-centrifugal, and axial-centrifugal compressors.
  • As the power setting is reduced to part-load, the costs associated with exergy destruction and the overall cost for each component grow due to the increase in relative fuel consumption.

Author Contributions

Concentration, methodology, formal analysis, investigation, writing, original draft preparation, H.H.A.; methodology, formal analysis, writing, resources, A.S.A.; validation, software, S.M.S.; resources, visualization, review and editing, A.H.A.; resources and editing, K.A.A.; resources and editing, H.M.A. All authors have read and agreed to the published version of the manuscript.

Funding

This research received no external funding.

Data Availability Statement

Not applicable.

Conflicts of Interest

The authors declare no conflict of interest.

Nomenclature

AUniform cash flow
ACAxial compressor
ACFAnnual return cash flow
ACICAnnual capital cost
C ˙ Cost rate
c Average unit cost
CICInitial capital cost
CCCombustion chamber
COECost of electricity
CRFCapital recovery factor
DPDesign point
DPPDiscounted payback period
E . Exergy rate
ETElectricity tariff
EPCEquipment purchasing cost
fSpecefic fuel cost
f k Exergoeconomic factor
FCFuel cost
GTGas turbine
GENGenerator
HPHigh pressure
HPCHigh pressure compressor
HPTHigh pressure turbine
IPTIntermediate pressure turbine
ISOInternational Standards Organization
LPCLow pressure compressor
LPTLow pressure turbine
nNumber of years
O&MOperation and maintenance cost
OMfFixed annual operation and mainetance cost
OMvbVariable operation and maintenance cost
P Pressure
P n Nth discharge pressure
PVPresent value
PWPresent worth
PWFPresent worth factor
r Tip radius
rkRelative difference in cost
r n Nominal escalation rate
S Span length
S V Salvage value
W . Work rate
Z ˙ Purchase cost rate
Greek symbols
β Capital charge factor
γ Heat capacity ratio
  η e x Exergetic efficiency
η t h Thermal efficiency
μ Maintenance cost escalation factor
Θ e b i Environmental benign index
Θ e d i   Environmental destruction index
ω Rotational speed
Subscript
e Exit
FFuel
iInlet
kComponent
xTotal
wWork
xdDestruction
GTGas turbine

References

  1. REN21. Global Status Report 2018. Available online: http://www.ren21.net/gsr-2018/ (accessed on 10 October 2022).
  2. IEA. World. Energy Outlook 2016 Special Report: Energy and Air Pollution. Available online: https://webstore.iea.org/weo-2016-special-report-energy-and-airpollution (accessed on 5 November 2022).
  3. Di Gianfrancesco, A. The fossil fuel power plants technology. In Materials for Ultra-Supercritical and Advanced Ultra-Supercritical Power Plants; Elsevier: Amsterdam, The Netherlands, 2017. [Google Scholar] [CrossRef]
  4. Kåberger, T. Progress of renewable electricity replacing fossil fuels. Glob. Energy Interconnect. 2018, 1, 48–52. [Google Scholar] [CrossRef]
  5. Maheshwari, M.; Singh, O. Thermodynamic study of different configurations of gas-steam combined cycles employing intercooling and different means of cooling in topping cycle. Appl. Therm. Eng. 2019, 162, 114249. [Google Scholar] [CrossRef]
  6. Brooks, F.J. GE Gas Turbine Performance Characteristics; GE Power Systems: Schenectady, NY, USA, 2000. [Google Scholar]
  7. Sadatsakkak, S.A.; Ahmadi, M.H.; Ahmadi, M.A. Optimization performance and thermodynamic analysis of an irreversible nano scale Brayton cycle operating with Maxwell-Boltzmann gas. Energy Convers. Manag. 2015, 101, 592–605. [Google Scholar] [CrossRef]
  8. Naseri, A.; Bidi, M.; Ahmadi, M.H. Thermodynamic and exergy analysis of a hydrogen and permeate water production process by a solar-driven transcritical CO2 power cycle with liquefied natural gas heat sink. Renew. Energy 2017, 113, 1215–1228. [Google Scholar] [CrossRef]
  9. Ashouri, M.; Ahmadi, M.H.; Pourkiaei, S.M.; Astaraei, F.R.; Ghasempour, R.; Ming, T.; Hemati, J.H. Exergy and exergo-economic analysis and optimization of a solar double pressure organic Rankine cycle. Therm. Sci. Eng. Prog. 2018, 6, 72–86. [Google Scholar] [CrossRef]
  10. Noroozian, A.; Mohammadi, A.; Bidi, M.; Ahmadi, M.H. Energy, exergy and economic analyses of a novel system to recover waste heat and water in steam power plants. Energy Convers. Manag. 2017, 144, 351–360. [Google Scholar] [CrossRef]
  11. Al-Doori, W. Exergy Analysis of a Gas Turbine Performance With Effect Cycle Temperatures. Int. J. Recent Res. Appl. Stud. 2012, 13, 549–556. [Google Scholar]
  12. Egware, H.O.; Obanor, A.I. Exergy Analysis of Omotosho Phase 1 Gas Thermal Power Plant. Int. J. Energy Power Eng. 2013, 2, 197. [Google Scholar] [CrossRef] [Green Version]
  13. Almutairi, A.; Pilidis, P.; Al-Mutawa, N.; Al-Weshahi, M. Exergetic and Sustainability Analysis of an Intercooled Gas Turbine Cogeneration Plant with Reverse Osmosis Desalination System. J. Energy Eng. 2017, 143, 04017016. [Google Scholar] [CrossRef] [Green Version]
  14. De Sa, A.; Al Zubaidy, S. Gas turbine performance at varying ambient temperature. Appl. Therm. Eng. 2011, 31, 2735–2739. [Google Scholar] [CrossRef]
  15. Song, T.W.; Sohn, J.L.; Kim, J.H.; Kim, T.S.; Ro, S.T. Exergy-based performance analysis of the heavy-duty gas turbine in part-load operating conditions. Exergy Int. J. 2002, 2, 105–112. [Google Scholar] [CrossRef]
  16. Almutairi, A.; Pilidis, P.; Al-mutawa, N. Exergetic and Sustainability Analysis of 320 MW Reheat Gas Turbine Engine. Am. J. Energy Res. 2016, 4, 1–10. [Google Scholar] [CrossRef]
  17. Aydin, H. Exergetic sustainability analysis of LM6000 gas turbine power plant with steam cycle. Energy 2013, 57, 766–774. [Google Scholar] [CrossRef]
  18. Egware, H.; Obanor, A.; Itoje, H. Thermodynamic evaluation of a 42MW gas turbine power plant. Int. J. Eng. Res. Afr. 2014, 12, 83–94. [Google Scholar] [CrossRef]
  19. Abam, F.I.; Ugot, I.U.; Igbong, D.I. Effect of Operating Variables on Exergetic Efficiency of an Active Gas Turbine Power Plant. J. Emerg. Trends Eng. Appl. Sci. 2012, 3, 131–136. [Google Scholar]
  20. Liu, R.; Salem, M.; Rungamornrat, J.; Al-Bahrani, M. A comprehensive and updated review on the exergy analysis of ground source heat pumps. Sustain. Energy Technol. Assess. 2023, 55, 102906. [Google Scholar] [CrossRef]
  21. Guedri, K.; Salem, M.; Assad, M.E.H.; Rungamornrat, J.; Malek Mohsen, F.; Buswig, Y.M. PV/Thermal as Promising Technologies in Buildings: A Comprehensive Review on Exergy Analysis. Sustainability 2022, 14, 12298. [Google Scholar] [CrossRef]
  22. Naeimi, A.; Bidi, M.; Ahmadi, M.H.; Kumar, R.; Sadeghzadeh, M.; Alhuyi Nazari, M. Design and exergy analysis of waste heat recovery system and gas engine for power generation in Tehran cement factory. Therm. Sci. Eng. Prog. 2019, 9, 299–307. [Google Scholar] [CrossRef]
  23. Swarr, T.E.; Hunkeler, D.; Klöpffer, W.; Pesonen, H.L.; Ciroth, A.; Brent, A.C.; Pagan, R. Environmental life-cycle costing: A code of practice. Int. J. Life Cycle Assess. 2011, 16, 389–391. [Google Scholar] [CrossRef] [Green Version]
  24. Naves, A.X.; Barreneche, C.; Fernández, A.I.; Cabeza, L.F.; Haddad, A.N.; Boer, D. Life cycle costing as a bottom line for the life cycle sustainability assessment in the solar energy sector: A review. Sol. Energy 2019, 192, 238–262. [Google Scholar] [CrossRef]
  25. Perčić, M.; Ančić, I.; Vladimir, N. Life-cycle cost assessments of different power system configurations to reduce the carbon footprint in the Croatian short-sea shipping sector. Renew. Sustain. Energy Rev. 2020, 131, 110028. [Google Scholar] [CrossRef]
  26. Almutairi, H.H.; Alajmi, A.F.; Ahmed, N.A. A techno-economic analysis of PV solar modules attached to vertical facades of a residential building in a hot arid climate. J. Eng. Res. 2022, 10, 108–123. [Google Scholar] [CrossRef]
  27. Taner, T.; Sivrioglu, M. Energy-exergy analysis and optimisation of a model sugar factory in Turkey. Energy 2015, 93, 641–654. [Google Scholar] [CrossRef]
  28. Lazzaretto, A.; Tsatsaronis, G. SPECO: A systematic and general methodology for calculating efficiencies and costs in thermal systems. Energy 2006, 31, 1257–1289. [Google Scholar] [CrossRef]
  29. Seyyedi, S.M.; Ajam, H.; Farahat, S. Thermoenvironomic optimization of gas turbine cycles with air preheat. Proc. Inst. Mech. Eng. Part A J. Power Energy 2011, 225, 12–23. [Google Scholar] [CrossRef]
  30. Boyaghchi, F.A.; Molaie, H. Advanced exergy and environmental analyses and multi objective optimization of a real combined cycle power plant with supplementary firing using evolutionary algorithm. Energy 2015, 93, 2267–2279. [Google Scholar] [CrossRef]
  31. Igbong, D.L.; Fakorede, D.O. Exergoeconomic analysis of a 100 MW unit GE Frame 9 gas turbine plant in Ughelli, Nigeria. Int. J. Eng. Technol. 2014, 4, 463–468. [Google Scholar]
  32. Arora, R. Energy, exergy and exergoeconomic analyses and optimisation of 137 MW gas power station implementing MOPSOCD. Int. J. Energy Technol. Policy 2020, 16, 327–352. [Google Scholar] [CrossRef]
  33. Mousafarash, A.; Ameri, M. Exergy and exergo-economic based analyses of a gas turbine power generation system. J. Power Technol. 2013, 93, 44–51. [Google Scholar]
  34. Barzegar Avval, H.; Ahmadi, P.; Ghaffarizadeh, A.R.; Saidi, M.H. Thermo-economic-environmental multiobjective optimization of a gas turbine power plant with preheater using evolutionary algorithm. Int. J. Energy Res. 2011, 35, 389–403. [Google Scholar] [CrossRef]
  35. Yucer, C.T. Thermodynamic analysis of the part load performance for a small scale gas turbine jet engine by using exergy analysis method. Energy 2016, 111, 251–259. [Google Scholar] [CrossRef]
  36. Almutairi, A.; Zedan, M.; Alhajeri, H.M.; Alenezi, A. Thermal performance analysis of gas turbine engines based on different compressor configurations. Heat Transf. 2020, 49, 2717–2745. [Google Scholar] [CrossRef]
  37. Chung, J.; Lee, S.; Kim, N.; Lee, B.; Kim, D.; Choi, S.; Kim, G. Study on the effect of turbine inlet temperature and backpressure conditions on reduced turbine flow rate performance characteristics and correction method for automotive turbocharger. Energies 2019, 12, 3934. [Google Scholar] [CrossRef] [Green Version]
  38. Statista. O&M Costs of New Power Plants in the U.S. Available online: https://www.statista.com/statistics/519144/power-plant-operation-and-maintenance-costs-in-the-us-by-technology/ (accessed on 20 February 2023).
  39. Fuller, S.K.; Petersen, S.R. LCCosting Manual for the Federal Energy Management Program; National Institute of Standards and Technology: Gaithersburg, MD, USA, 1996. [Google Scholar]
  40. Bejan, A.; Tsatsaronis, G.; Michael, M. Thermal Design and Optimization; John Wiley & Sons: Hoboken, NJ, USA, 1996. [Google Scholar]
  41. Turan, O.; Aydin, H. Exergetic and exergo-economic analyses of an aero-derivative gas turbine engine. Energy 2014, 74, 638–650. [Google Scholar] [CrossRef]
  42. Aydin, H.; Turan, O.; Midilli, A.; Karakoc, T. Exergetic and exergo–economic analysis of a turboprop engine: A case study for CT7–9C. Int. J. Exergy 2012, 11, 69–88. [Google Scholar] [CrossRef]
  43. Ahmadi, P.; Rosen, M.A.; Dincer, I. Multi-objective exergy-based optimization of a polygeneration energy system using an evolutionary algorithm. Energy 2012, 46, 21–31. [Google Scholar] [CrossRef]
  44. Midilli, A.; Dincer, I. Development of some exergetic parameters for PEM fuel cells for measuring environmental impact and sustainability. Int. J. Hydrogen Energy 2009, 34, 3858–3872. [Google Scholar] [CrossRef]
Figure 1. Gas Turbine Modelling Framework.
Processes 11 01023 g001
Figure 2. (a) Lifecycle costs at varying operating load, and (b) Lifecycle costs at varying ambient temperature.
Processes 11 01023 g002
Figure 3. The payback period of each configuration based on selling electricity (a) at variant production load and (b) at variant ambient temperature.
Processes 11 01023 g003
Figure 4. Exergoeconomic factor (fk) and relative difference in cost (rk) for main components of the gas- turbine engine (axial compressor).
Processes 11 01023 g004
Figure 5. Exergoeconomic factor (fk) and relative difference in cost (rk) for main components of the gas- turbine engine (Two-Stage centrifugal compressor).
Processes 11 01023 g005
Figure 6. Exergoeconomic factor (fk) and relative difference in cost (rk) for the main components of the GT engine (Axial-centrifugal compressor).
Processes 11 01023 g006
Figure 7. Exergoeconomic factor (fk) and relative difference in cost (rk) for the main components of the GT engine (Centrifugal-centrifugal compressor).
Processes 11 01023 g007
Figure 8. Exergy destruction costs and total cost ( C ˙ d + Z ˙ k T ) for GT (axial compressor) at ISO (288 K) and Kuwait conditions (328 K).
Processes 11 01023 g008
Figure 9. Exergy destruction costs and total cost ( C ˙ d + Z ˙ k T ) for GT engine (Axial-centrifugal compressor) at full and part-load (65%).
Processes 11 01023 g009
Figure 10. CO2 emissions in g CO2/kWh for the four proposed systems.
Processes 11 01023 g010
Table 1. The four GT engines with associated compressor types.
NoModelSize kWType of CompressorManufacturer
1Saturn 201185AxialSolar Turbine
2M1A-17D1653Two stage centrifugalKawasaki
3PW1231759Centrifugal-centrifugalPratt & Whitney
4T5317A1284Axial-centrifugalAvco Lycoming
Table 2. Saturn 20 Design-Point Iteration Targets.
Iteration TargetsUnitsValue
1.Overall pressure ratio-6.7
2.Exhaust temperature K793.15
3.Shaft Power DeliveredkW1185
Table 3. Saturn 20 Design Point Iteration Variables and Corresponding Converged Values.
Iteration VariablesUnitsRange ValuesConverged Value
1.HP compressor pressure ratio-2–203.42
2.Burner exit temperatureK1200–25001238.75
3.Inlet Corrected Flowkg/s1–106.99
Table 4. Saturn 20 Design Point Performance Comparison—simulated and original manufacturer’s values.
ParameterUnitOriginal Manufacturer’s Value Simulated Difference Difference (%)
Net OutputkW1185118500
Heat rate, LHVkJ/kWh14,67015,381.7−711.7−4.85
Thermal Efficiency%24.523.404+1.096+4.47
Exhaust Mass Flow Kg/h23,41025,563.6−2153.6−9.20
Exhaust Temperature°C52052000
Table 5. Financial input parameters for the current study.
ParameterInput Value
Discount rate3%
Study period20 years
Specific fuel cost5 USD/GJ
Fuel heat rate46,800 kJ/kg
Salvage value10% of instlllation cost
Table 6. Exergetic efficiencies and exergy destruction rates for different system elements under steady state conditions.
Component Exergy   Destruction   ( E ˙ x d ) Exergetic   Efficiency   ( η e x )
Compressor E ˙ x d , A C = E ˙ x i E ˙ x e + W ˙ C η e x = E ˙ x i E ˙ x e W ˙ C
Combustion Chambers E ˙ x d , C C = E ˙ x i E ˙ x e + E ˙ x f η e x = E ˙ x e E ˙ x i + E ˙ x f
Gas Turbines E ˙ x d , G T = E ˙ x i E ˙ x e W ˙ G T η e x = W ˙ G T E ˙ x i E ˙ x e
The Cycle E ˙ x d   = k E ˙ x d , k η e x = E ˙ x p E ˙ x f =1 − E ˙ x d + E ˙ x l E ˙ x f
Table 7. Environmental indicators for different GT engines under ISO conditions.
No.IndicatorAxial ConfigurationTwo-Stage Centrifugal ConfigurationAxial-Centrifugal ConfigurationCentrifugal-Centrifugal Configuration
1Environmental Destruction Coefficient [Ced]3.8463.9873.7044.065
2Environmental Destruction Index [Θedi]2.8723.0052.6933.061
3Environmental Benign Index [Θebi]0.3480.3330.3710.327
Disclaimer/Publisher’s Note: The statements, opinions and data contained in all publications are solely those of the individual author(s) and contributor(s) and not of MDPI and/or the editor(s). MDPI and/or the editor(s) disclaim responsibility for any injury to people or property resulting from any ideas, methods, instructions or products referred to in the content.

