1. Introduction
The pore structure of shale is complex and includes intragranular pores of organic matter at the nanoscale, intergranular pores of inorganic minerals at the nano-micro scale, and natural fractures at the micron-millimeter scale. The specific surface area of shale rock is an important parameter to characterize the microscopic pore structure, and the specific surface area has an important influence on the adsorption characteristics and swelling properties of the shale matrix [
1,
2,
3,
4,
5,
6,
7].
The specific surface area is defined as the total surface area of pores per unit volume of the rock:
where,
A is the surface area of pores, m
2;
V is volume of the rock sample, cm
3.
The existing methods for testing the specific surface area include indirect and direct methods [
8,
9,
10]. The indirect method mainly refers to the low-temperature nitrogen adsorption method, where the specific surface area of porous materials is measured according to the Brunauer-Emmett-Teller (BET) isothermal adsorption theory or Langmuir isothermal adsorption theory [
11]. This gas adsorption method can measure the specific surface area and pore size of rock; however, the disconnected micropores could not be detected, and the result usually has low-measurement accuracy and high-measurement error. Direct methods include X-ray CT and FIB-SEM scanning [
12,
13,
14,
15,
16,
17,
18]. X-ray CT scanning uses X-ray to penetrate the rock and acquire a three-dimensional image to describe the pore-throat characteristics. According to the different resolutions of CT scanning, different sizes of samples can be used to obtain the pore-throat structural characteristics at the micron and submicron scale [
19,
20,
21]. FIB-SEM scanning uses a focused ion beam to denude the rock and acquire a series of two-dimensional images continuously at nanoscale, and then combines them into a three-dimensional image obtained with a combination of 2D images to describe the three-dimensional pore-throat characteristics of the rock at the nanoscale [
22,
23,
24].
Either X-ray CT or FIB-SEM scanning can only construct a single scale digital rock, which is not accurate enough for shale pore characterization with strong heterogeneity. In order to describe the multiscale pore characteristics, many scholars have investigated the multi-scale modeling methods, which is mainly classified as image superposition method and model integration methods [
25,
26,
27,
28,
29]. Moctezuma et al. introduced a regular network model to describe the pore space system in cavernous formations with primary bedrock pores and secondary cavern pores, and the connectivity between cavern pores and the connectivity characteristics between bedrock pores is further elucidated, this model could characterize the bimodal distribution of pore size and the simulation results (porosity, permeability and capillary force curves, etc.) fit the experimental data well for this type of carbonate rock [
30]. Based on different resolution scanned images, a pore network integration method is proposed by Jiang et al., while high-resolution images was used to generate an equivalent pore network model by random modeling, and a network model describing both macropores and micropores was produced by adding links between networks at different scales [
31]. Mehmani and Prodanovic et al. introduced a network fusion approach which focused on the distribution areas of micropores, a more specific approach was used to generate micropore areas by refining the macropore network, the basic two-phase flow characteristics of multi-scale cores could be analyzed by the fused dual pore network, and the fluid flow characteristics in different systems of micro-pores and macro-pores was elucidated [
32]. Bultrey et al. considered the micropores as “micro-throat” capable of connecting larger pores in heterogeneous rock, and the random pore network model including “micro-throat” was generated to simulate the two-phase flow characteristics [
33]. de Vries et al. constructed a multiscale pore network with the assumption that the microscopic aggregate domain contains a large number of micropores, these microscopic aggregate domains were randomly generated and assigned to the macropore domains, the influence of the aggregate parameters (porosity and permeability) on the dual-porosity pore network is then analyzed, it is found that the increase of aggregate porosity can cause considerable tailing in the breakthrough curves; as the permeability of the aggregates increases, it leads to a change in flow from diffusion-dominated to advection-dominated [
34].
However, due to the structure differences between microfractures and matrix pores, fewer studies are conducted on shale multi-scale spaces that contain both matrix pores and microfractures. In this paper, based on real shale rock, the representative fracture sample, micropore subsample and nanopore subsample are scanned by micro-CT and FIB-SEM, the multi-threshold segmentation algorithm with improved maximum inter-class variance method is introduced to construct the platform of multi-scale digital rock and pore network. And the corresponding pore percentage, matrix percentage and specific surface area are calculated respectively.
2. Materials
The shale sample is selected from the Qianjiang Depression, Jianghan Basin, in mid-eastern China, which is of the thickness of Cenozoic deposited sediments of approximately 6 km. The main subsiding stage with salt formation deposition is from the Eocene Epoch. The Qianjiang Formation deposited during the late Eocene Epoch in the isolated salt lake environment is comprised of approximately 160 cyclothems of alternating salt and mudstone and/or sandstone with a total thickness of over 3500 m. The Qianjiang Formation is divided into four members from top to bottom: Eq1, Eq2, Eq3, and Eq4, with a current brine salinity of 250–330 g/L. The effective source rock with total organic carbon (TOC) of 0.4–3.5 wt% contains chemical evaporites such as non-water kainitite, glaserite, and syngenite rocks; evaporite clastic rocks such as glauberite mudstone; anhydrite rocks; and clastic rocks [
35,
36].
In this paper, digital rock scanning is performed on shale sample extracted from the 10th (from the top to bottom) cyclothem of the Eq3 (Eq34–10 cyclothem) inter-salt shale, as it is the most important target layer for exploration. The buried depth is between 1674.0 m and 1684.5 m. The reservoir initial pressure is 21.24 MPa with a pressure coefficient between 1.26 and 1.35. The initial reservoir temperature is around 73.4 °C.
The sedimentary characteristics of lithofacies association of Eq3
4–10 cyclothem inter-salt shale cores are mostly black, grey-black, and grey-brown with a small amount of grey-white at the bottom, which mainly contains argillaceous dolomite, dolomitic mudstone, argillaceous limestone, and mudstone with glauberite interlayers. Shale laminae are extremely well developed, which are flat and contain no fossils. The distribution of glauberite is relatively dense at the top and bottom with a thickness of approximately 30–50 cm of glauberite interlayer developed at the top, and the mud content increases in the middle and the carbonate increases at the top. This distribution reflects high salinity–low salinity–high salinity lake evolution features. As shown in
Figure 1, the lithology of this sample is argillaceous dolomite, and it develops microfracture and matrix pores with the porosity of 10.2% and permeability of 22.2 mD, while the main mineral is dolomite with the content of 62.72%, also, the quartz, illite and sodium feldspar are mixed in it.
3. Methodology
3.1. Micro CT Scanning
CT scanning technology has been widely used for reservoir structure analysis since 1960s. The principle of CT scanning is to use conical X-rays to penetrate the object and enlarge the image through an objective lens with different magnifications. During CT scanning, the transverse translation and vertical lifting of the sample is used to change the scanning area. The turntable drives the sample to rotate. Every one or two degrees of rotation, the X-ray irradiates the sample to obtain the projection map. The process of CT scanning experiment can be described as follows: after fixing the sample, the X-ray source is turned on and the ray is emitted by the source to pass through the sample, the X-ray intensity decays and the decayed X-rays are irradiated to the detector, and the signal is automatically captured and stored by the image acquisition software. Afterwards, the sample is rotated at a precise angle by controlling the sample holder, and the attenuated X-rays are rescanned and recorded, ending the experiment by rotating the sample a cumulative 360°. After a series of projection maps obtained after 360 degrees of rotation are reconstructed, the three-dimensional image of the core sample is obtained. X-rays pass through the rock, they interact with the atoms of the rock and energy attenuation is caused, while different rock minerals have different absorption coefficients (i.e., attenuation coefficients) for X-rays, the composition of rock minerals can be determined by measuring the absorption coefficient of X-rays. When a beam of X-rays passes through an object, the sum of X-ray absorption coefficients in its path is reflected in the measurement of the X-ray intensity, as shown in the following equation.
where,
Io is the initial intensity of the X-rays,
I is the intensity of the X-rays after passing through the rock, that is, the intensity of the X-rays after they have been attenuated,
i represents the rock component in the path through which the rays pass,
,
are the attenuation coefficient of the
ith component to the X-rays and the length of the component in the current path of the X-rays, respectively. The principle of CT imaging is based on the measurement of X-rays passing through a cross-section of the rock, after which a certain reconstruction method is used to calculate the absorption coefficients, thereby recovering structural information about the rock cross-section.
Micro-CT imaging technology is an important platform to construct 3D digital rock, which could image the rock pore space and skeleton, analyze the pore size and connectivity quantitatively, and characterize the rock pore structure without damaging the sample.
3.2. FIB-SEM Scanning
The FIB-SEM dual beam scanning system is a combination of scanning electron microscopy and focused ion beam, it improves the traditional two-dimensional scanning electron microscopy imaging with a single focused ion beam etching by using scanning electron microscopy imaging and focused ion beam cutting to produce the three-dimensional image inside the sample. Focused ion beam (FIB) technology is a new technique for focusing ion-beam spots to submicron or nanometer scale and achieving fine beam processing by the deflection system. Compared with other high-energy particle beam streams, focused ion beams have larger masses and can cut samples with high-energy and short wavelengths after accelerated focusing, and focused ion beams can also perform micro/nano processing of materials and devices, such as etching and deposition. Scanning electron microscopy (SEM) technology is based on the interaction of high-energy electron and matter to produce a variety of signals in the sample, such as secondary electrons, back-reflected electrons, Osher electrons, X-rays, cathode luminescence, absorption electrons and transmission electrons, etc. These signals are sequentially and proportionally converted to video signals through the detector, the signal amplification is conducted to adjust the brightness of the light point and form a scanning electron microscopy image. The SEM image can be used for secondary electron morphology analysis with high-image resolution, backscattered electron lining analysis, EDS energy spectrum analysis, etc. FIB-SEM double-beam imaging can produce the 3D nanoscale images, which can characterize the pore-structure distribution of tight rock and shale rock at the nanoscale.
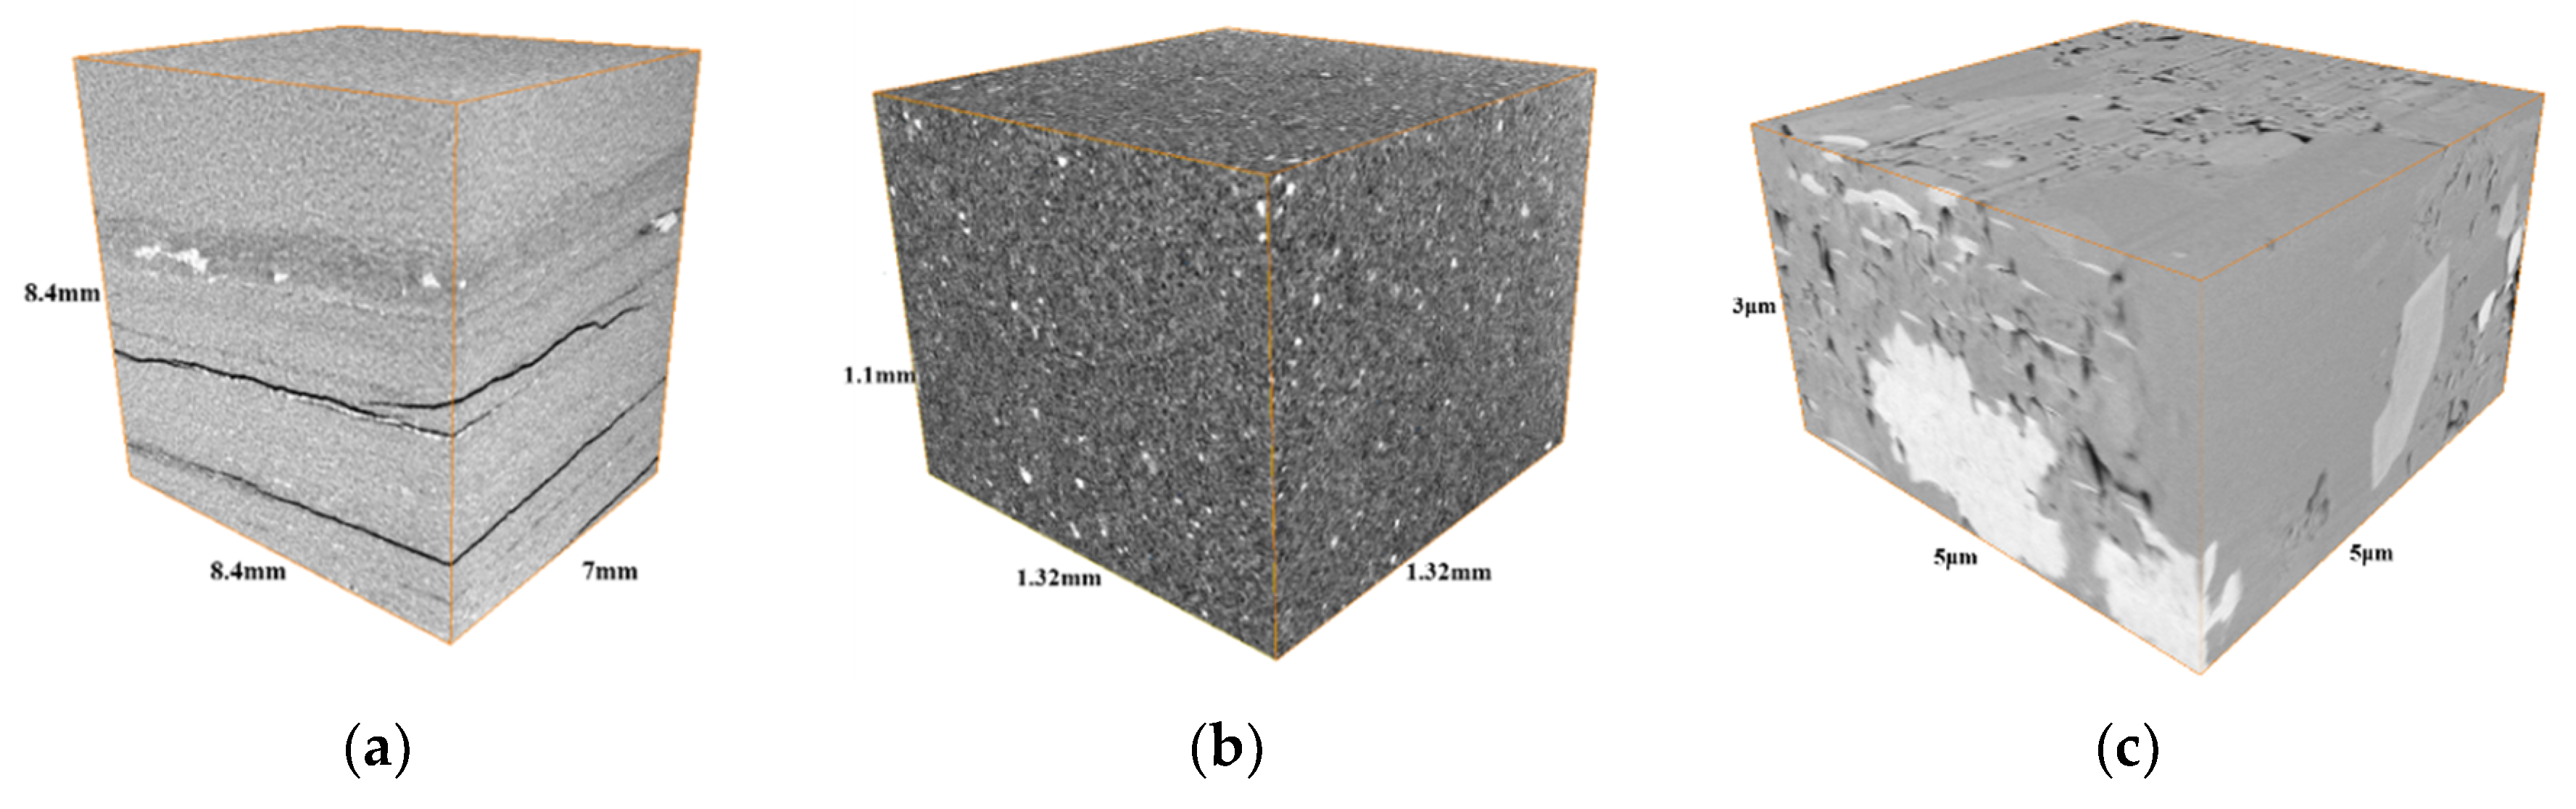
In this study, the samples were prepared in the direction of vertical bedding, and the rock samples were scanned with micro-CT at two scales and FIB-SEM at one scale. Based on the shale rock, the representative microfracture sample, micropore subsample and nanopore subsample were drilled and scanned by micro-CT and FIB-SEM to obtain the corresponding 3D gray images. As can be seen in
Figure 2a, the voxel resolution of the representative fracture sample is 14 μm, the voxel size is 600 × 500 × 600, and the physical size is 8.4 mm × 7 mm × 8.4 mm, which mainly characterizes the microfracture structure. As can be seen in
Figure 2b, the voxel resolution of micropore subsample is 2.2 μm, the voxel size is 600 × 600 × 500, and the physical size is 1.32 mm × 1.32 mm × 1.1 mm, which mainly characterizes the micropore structure. As can be seen in
Figure 2c, the voxel resolution of nanopore subsample is 10 nm, the voxel size is 500 × 500 × 300, and the physical size is 5 μm × 5 μm × 3 μm, which mainly characterizes the nanopore structure.
3.3. Image Processing
The acquired scanning images are binary images, and external disturbances may bring relatively large errors to the image analysis. During the scanning process, the images are sometimes dim, or have disadvantages such as inconspicuous contrast and blurred image frames. Therefore, it is very important to perform preliminary processing of the image without destroying the useful information in the image. In general, the image is pre-processed to remove useless information and highlight useful information, which also lays the foundation for the next step to segment the image more accurately.
- (1)
Brightness adjustment
If the scanning image acquired in the experiment is dim, the display effect can be changed by adjusting the brightness of the scanning image. Image brightness adjustment is a point-processing method, in which a constant is added or subtracted to each pixel in the scanning image.
- (2)
Contrast adjustment
In the scanning experiments, the contrast of the obtained scanning image screen is often not obvious enough or the contrast is too large. When studying the quality of the input scanning image, it is common to first plot a histogram of the grayscale values of the entire image.
- (3)
Sharpening of images
One of the other ways to improve the image quality compared to grayscale conversion is to sharpen the bleed image. This method removes the “blur” phenomenon that causes poor image quality and enables the image to be well-defined. The blurring of the image is caused by the fact that the higher spatial frequency components are weaker than the lower spatial frequency components, and this effect is manifested in the border parts (edges) between uniform gray areas. To eliminate blurring, the higher spatial frequency components can be enhanced. The commonly used sharpening methods are Laplace sharpening and gradient sharpening, and in fact, Laplace sharpening is equivalent to the template operation in image processing.
3.4. Image Segmentation
For micro-nanoscale grayscale images of fractures, micropores and nanopores, the multi-threshold segmentation algorithm with improved maximum inter-class variance (OTSU) method was introduced to construct the platform of multi-scale digital rock. The maximum interclass variance method is used for single-threshold segmentation itself [
37,
38], which is based on the set of a threshold value to obtain the maximum variance between two classes.
In this paper, this principle was used for multi-threshold segmentation. With setting the number of total pixels in image
X as
N, the gray level as
L, and the number of pixels with gray level
i as
Ni, the probability of each gray level is described as follows:
If
m classes exists in the image, there will be
m-1 thresholds [
t1, …,
tn, …,
tm−1] to classify the image into
m classes. These classes are denoted as
C0 = [0, 1, …,
t1], …,
Cn = [
tn + 1,
tn + 2, …,
tn+1], …,
Cm−1 = [
tm−1 + 1,
tm−1 + 2, …,
L − 1], and the interclass variance is defined as:
where the probability of each class [
C0, …,
Cn, …,
Cm−1]:
Average gray level of each class:
where, the total average gray level of the image:
The set of thresholds [t1*, …, tn*, …, tm−1*] is chosen as the optimal threshold, which could let achieve the maximum value.
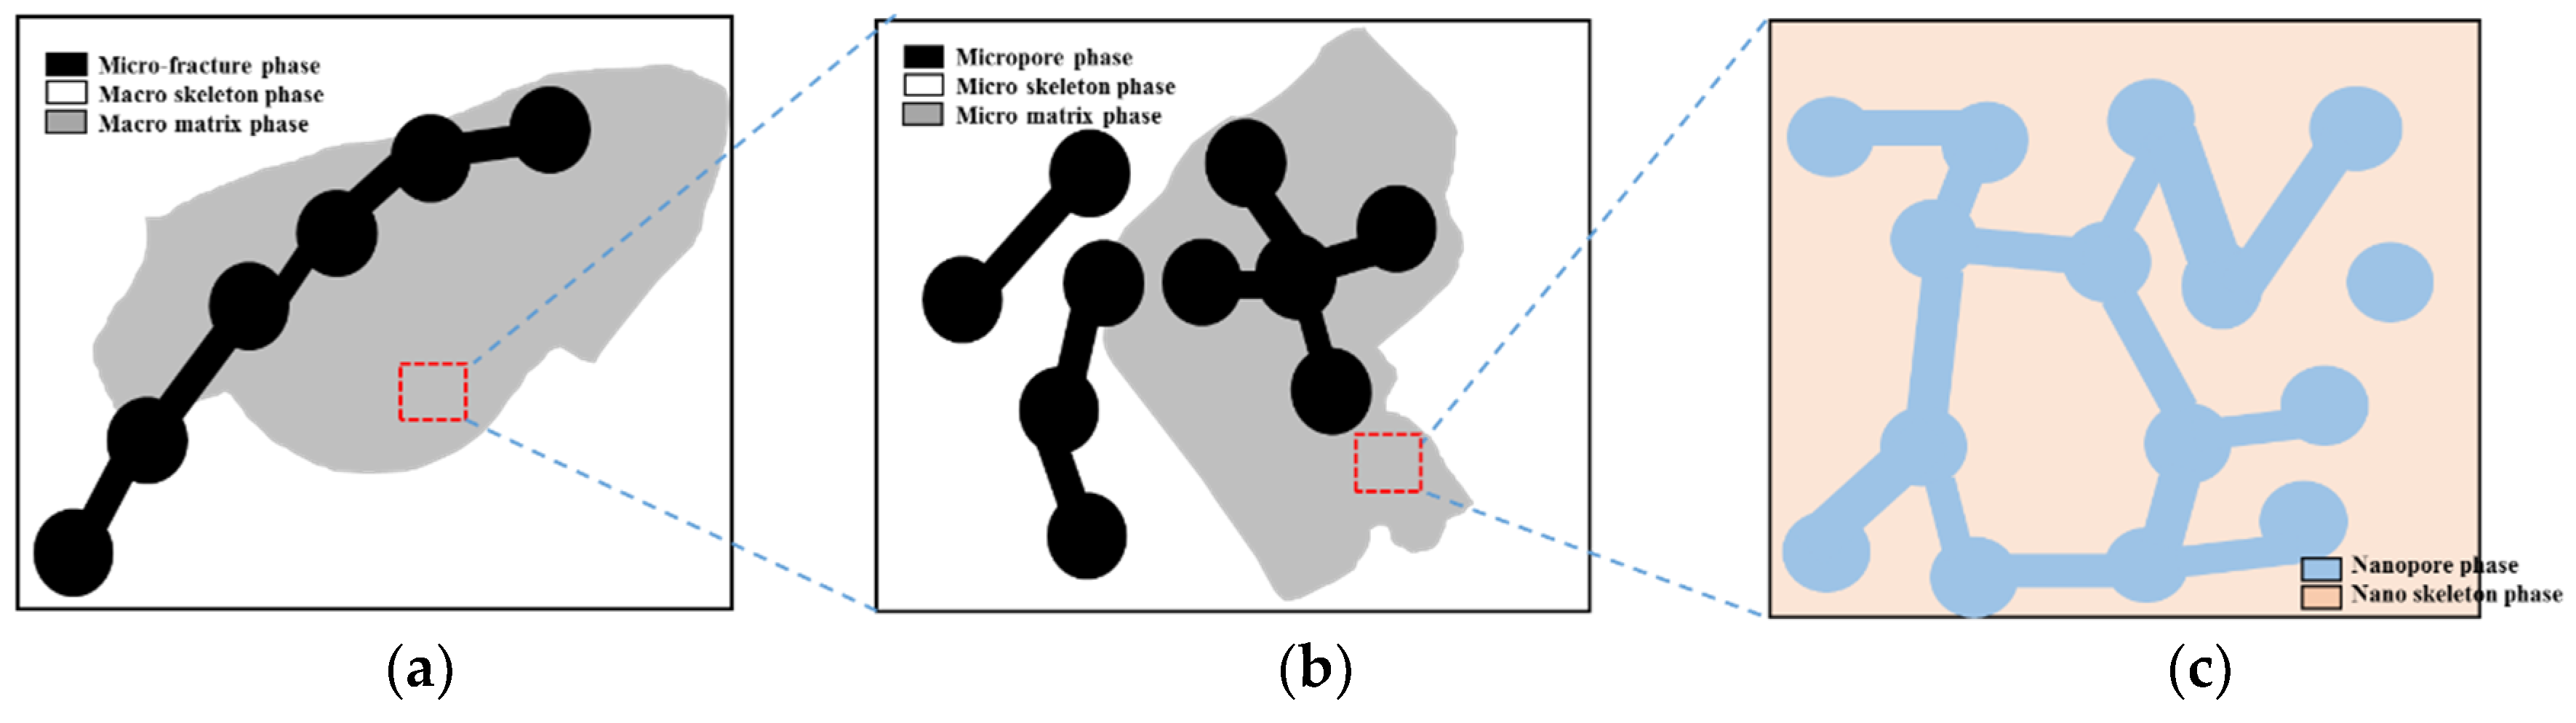
As shown in
Figure 3a, according to the gray level thresholds
and
, the microfracture gray image is divided into three classes:
C0 (microfracture phase),
C1 (macro matrix phase) and
C2 (macro skeleton phase). While
and
, the optimal threshold
t1*,
t2* is chosen to obtain the maximum value of
, which could construct the microfracture digital rock.
As shown in
Figure 3b, according to the gray level thresholds
and
, the micropore gray image is divided into three classes:
C’0 (micropore phase),
C’1 (micro matrix phase) and
C’2 (micro skeleton phase). While
and
, the optimal threshold
t’1*,
t’2* is chosen to obtain the maximum value of
, which could construct the micropore digital rock.
As shown in
Figure 3c, according to the gray-level threshold
, the nanopore gray image is divided into two classes: C”
0 (nanopore phase) and C”
1 (nano-skeleton phase). While
,
, the optimal threshold
t″* is chosen to obtain the maximum value of
, which could construct the nanopore digital rock.
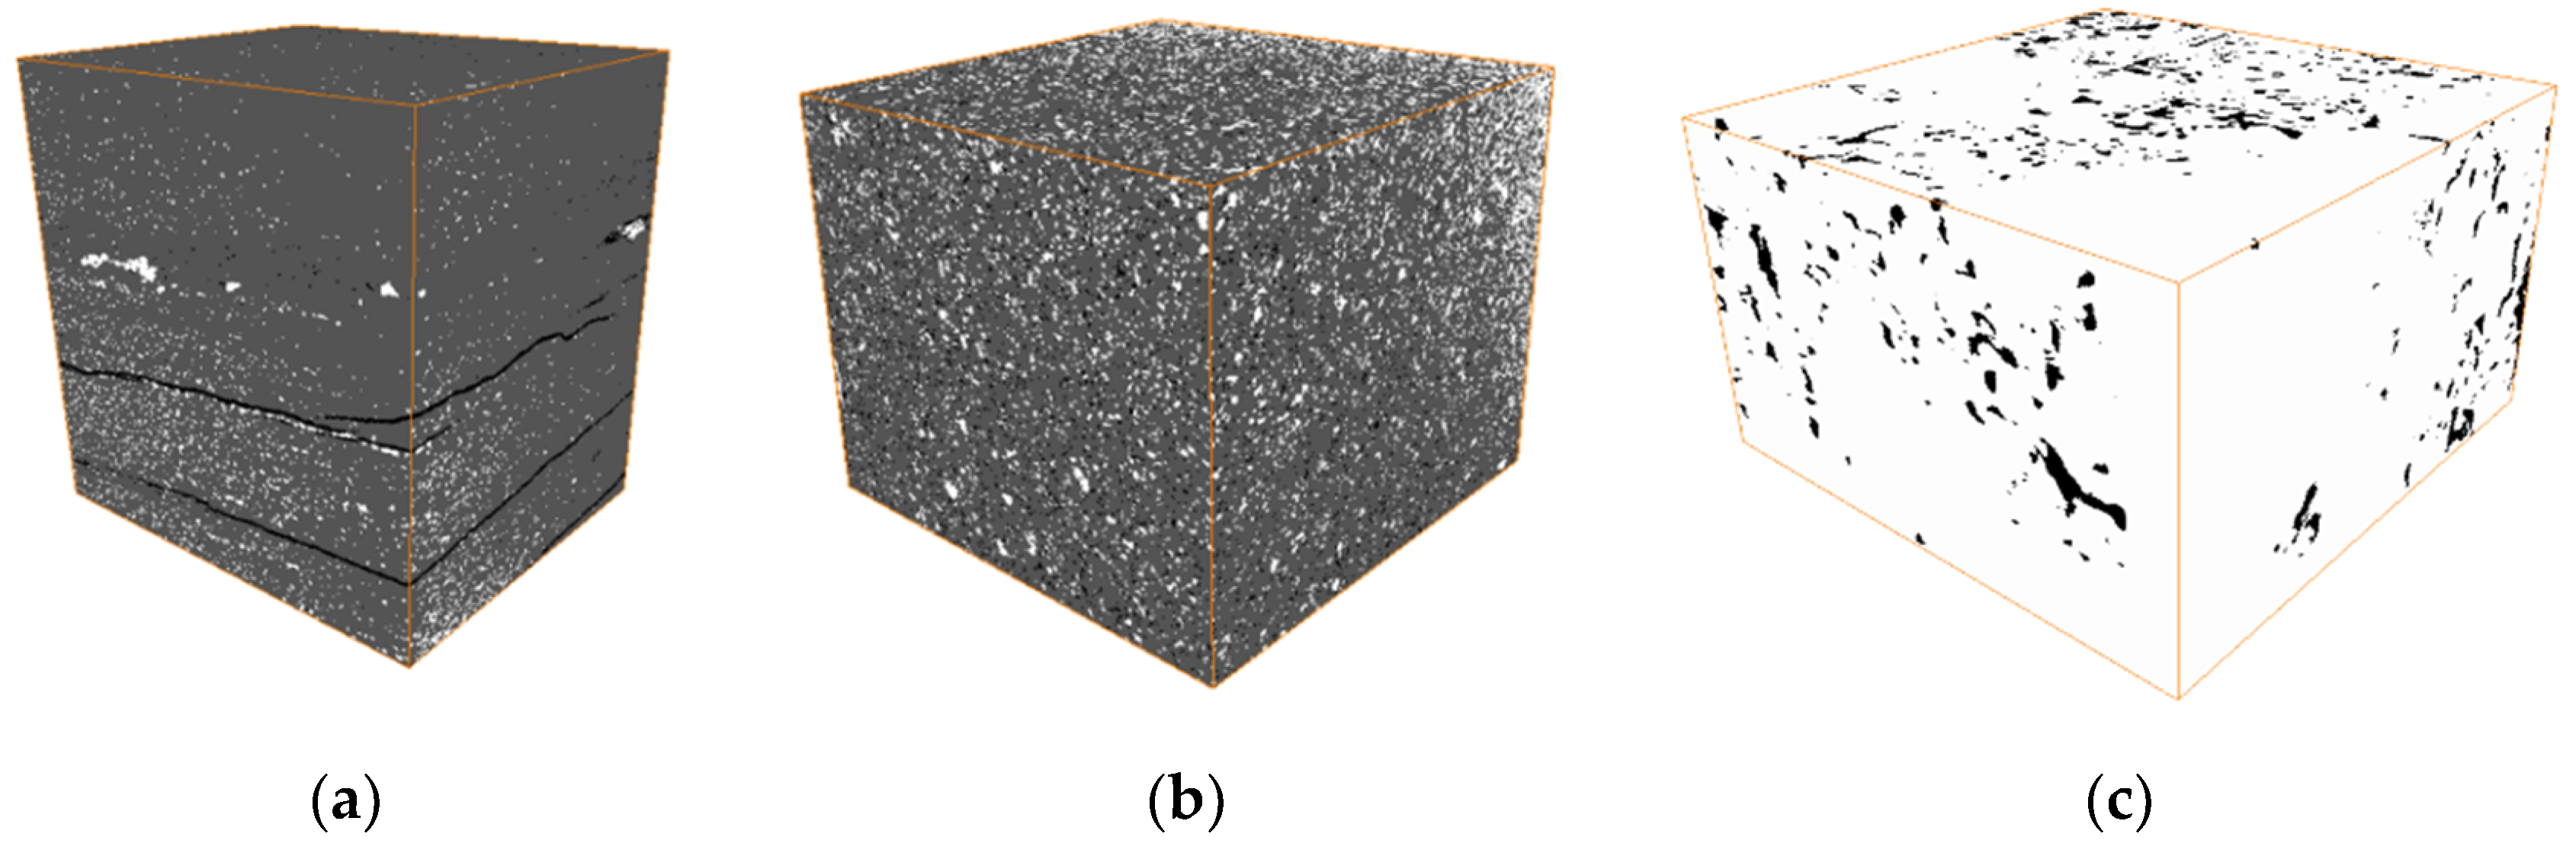
As shown in
Figure 4, the multi-threshold image segmentation algorithm with improved maximum interclass variance method was used to construct the shale multiscale digital rock platform at the micro and nanoscale.
4. Results and Discussions
The single pore scale network model was extracted from the corresponding 3D digital rock. Pore analysis tools were used to extract pore network model from 3D digital rock. These analysis tools were developed by Jiang et al. [
31,
39]. This method extracts the geometrical/topological network that represents the pore structure of a porous medium, referred to as the GT-network. The GT-network extraction algorithm involves a number of steps including: (a) calculation of the 3D Euclidean distance map; (b) clustering of voxels; (c) extraction of the network of the pore space; (d) partitioning of the pore space; and (e) computation of shape factor. From this, a geometry and topology equivalent network model is built with pore sizes, shapes and connectivity based on the 3D digital rock.
During the extraction process of the pore-network model, the real pore space is partitioned into pore and throat elements, and the cross section of each element is characterized with circular, square and arbitrary triangular shapes. The geometry-topology parameters of the pores and throats allows a detailed evaluation of the pore network structure. In the pore network extraction process, the pore space is defined by the maximum inner tangent sphere region, and the radius of the pore inner tangent sphere is determined by the sphere isometric expansion method. Based on the sphere isometric expansion method, the pore space in the digital rock can be precisely divided into the space occupied by the pore and throat elements. The pore radius R is the radius of the tangent sphere inside the pore space. After obtaining the pore space occupied by the pore element, the pore volume can be obtained by counting the number of pore voxels in this pore body. The pore volume probability distribution is characterized by the pore radius corresponding to the pore volume. The throat is defined as a channel connecting each pore. After the division of pore space, the identification of the throat element is relatively simple, and the throat space can be obtained after removing the identified pores in the pore space, and each throat element is isolated from each other, and the volume of the throat element can be obtained by counting the number of throat voxels in each throat space.
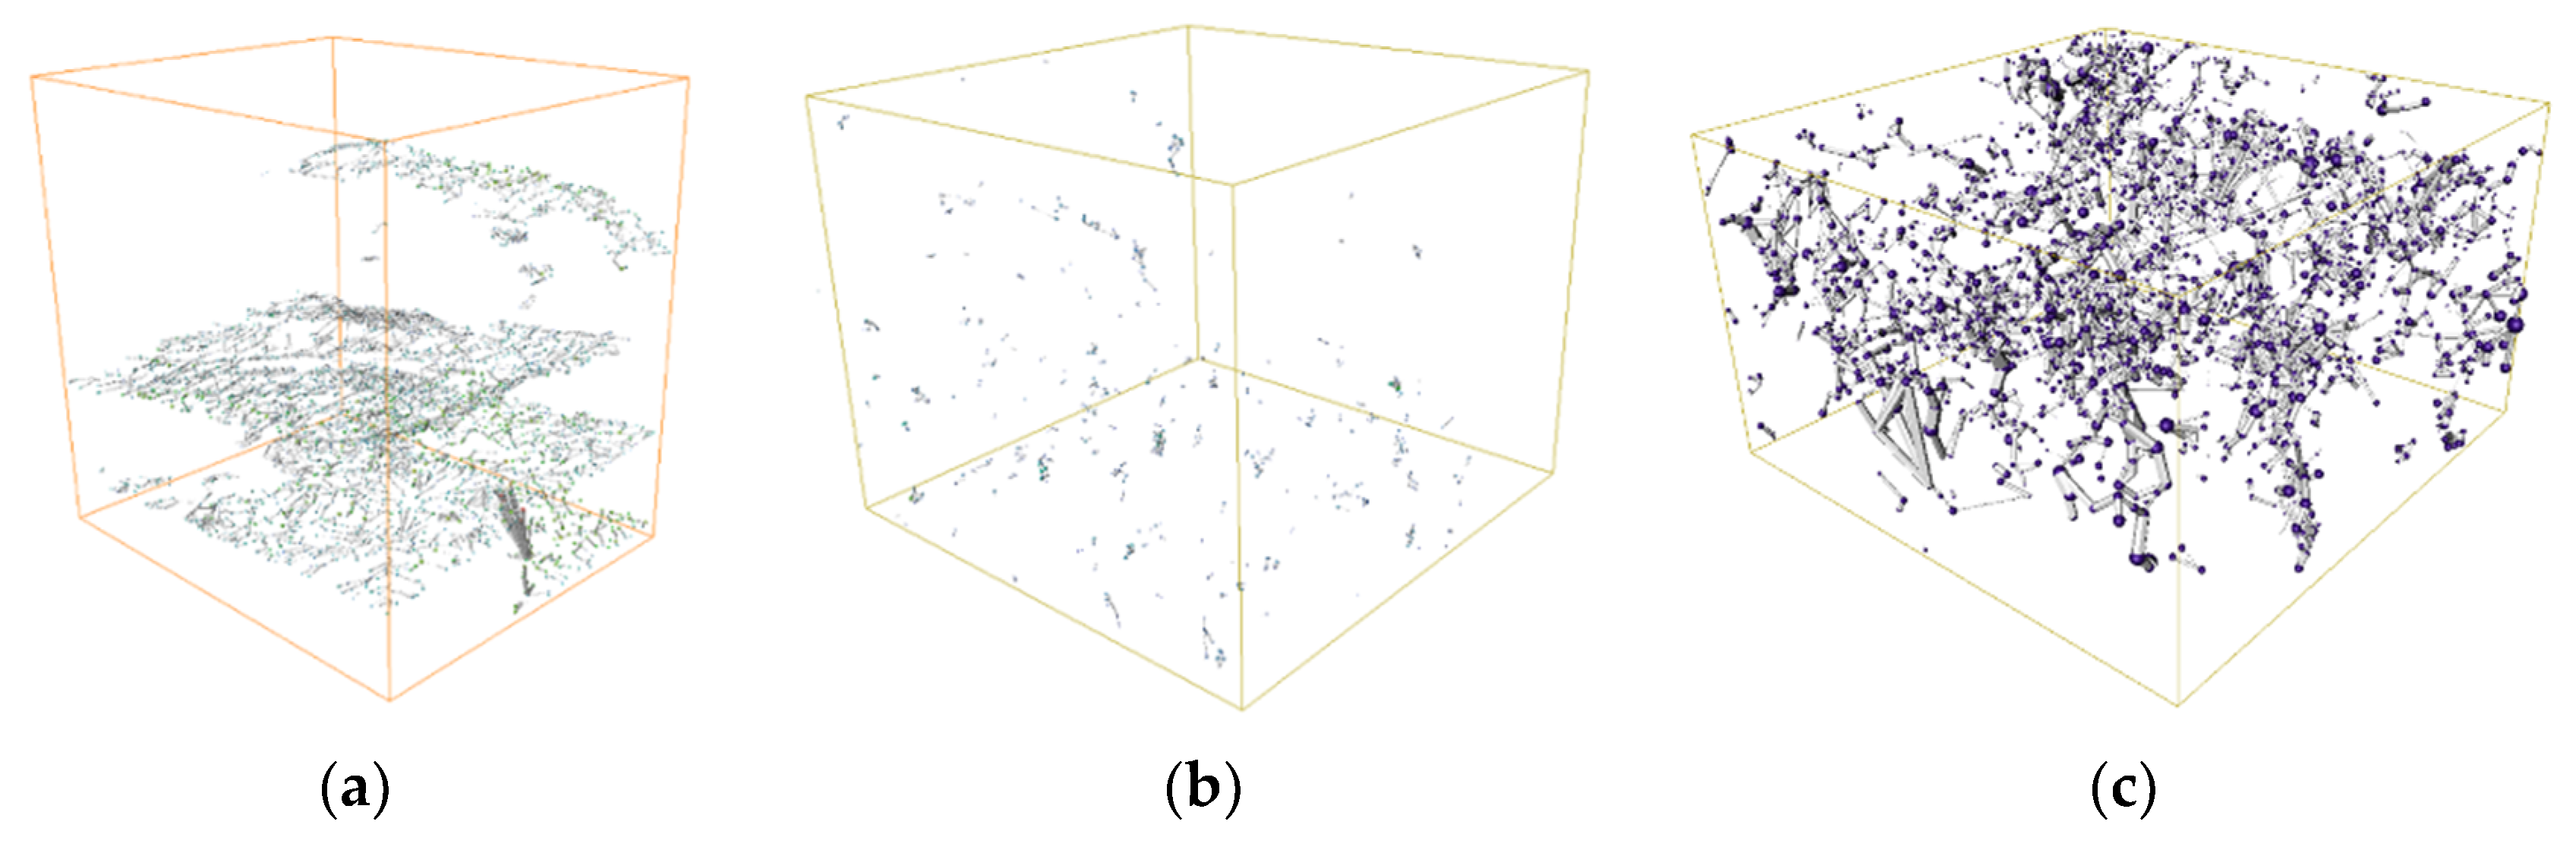
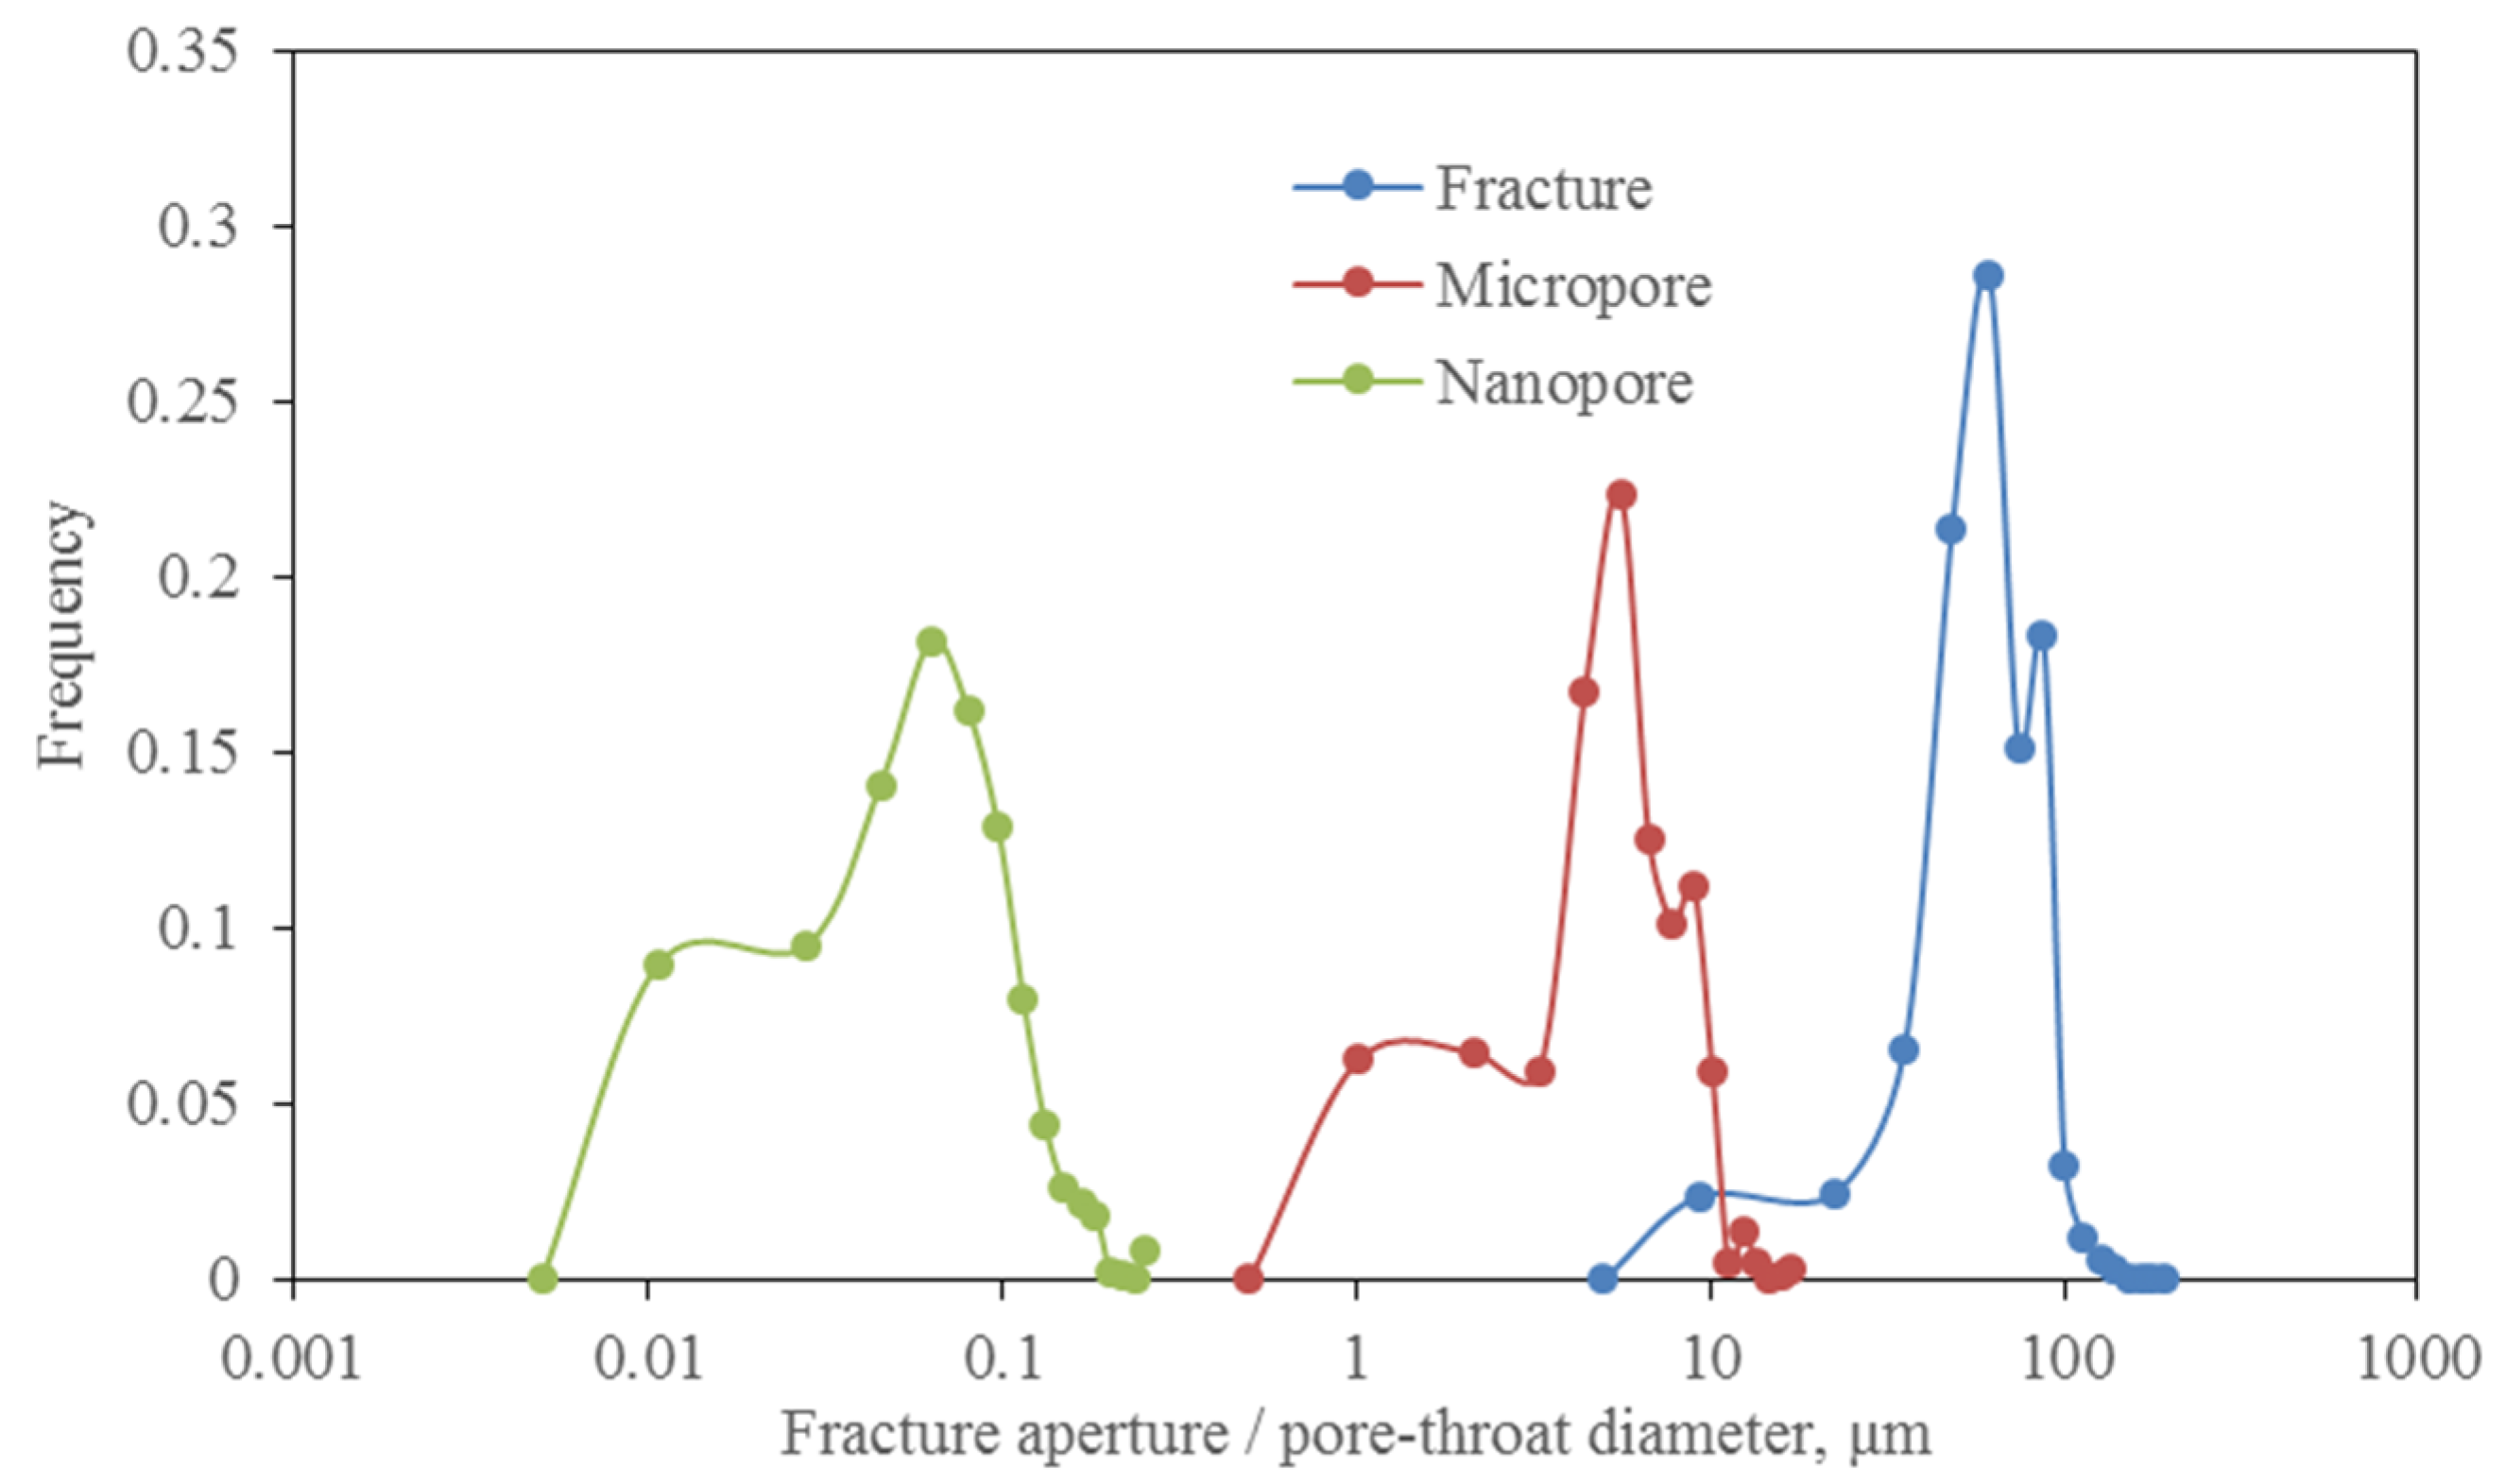
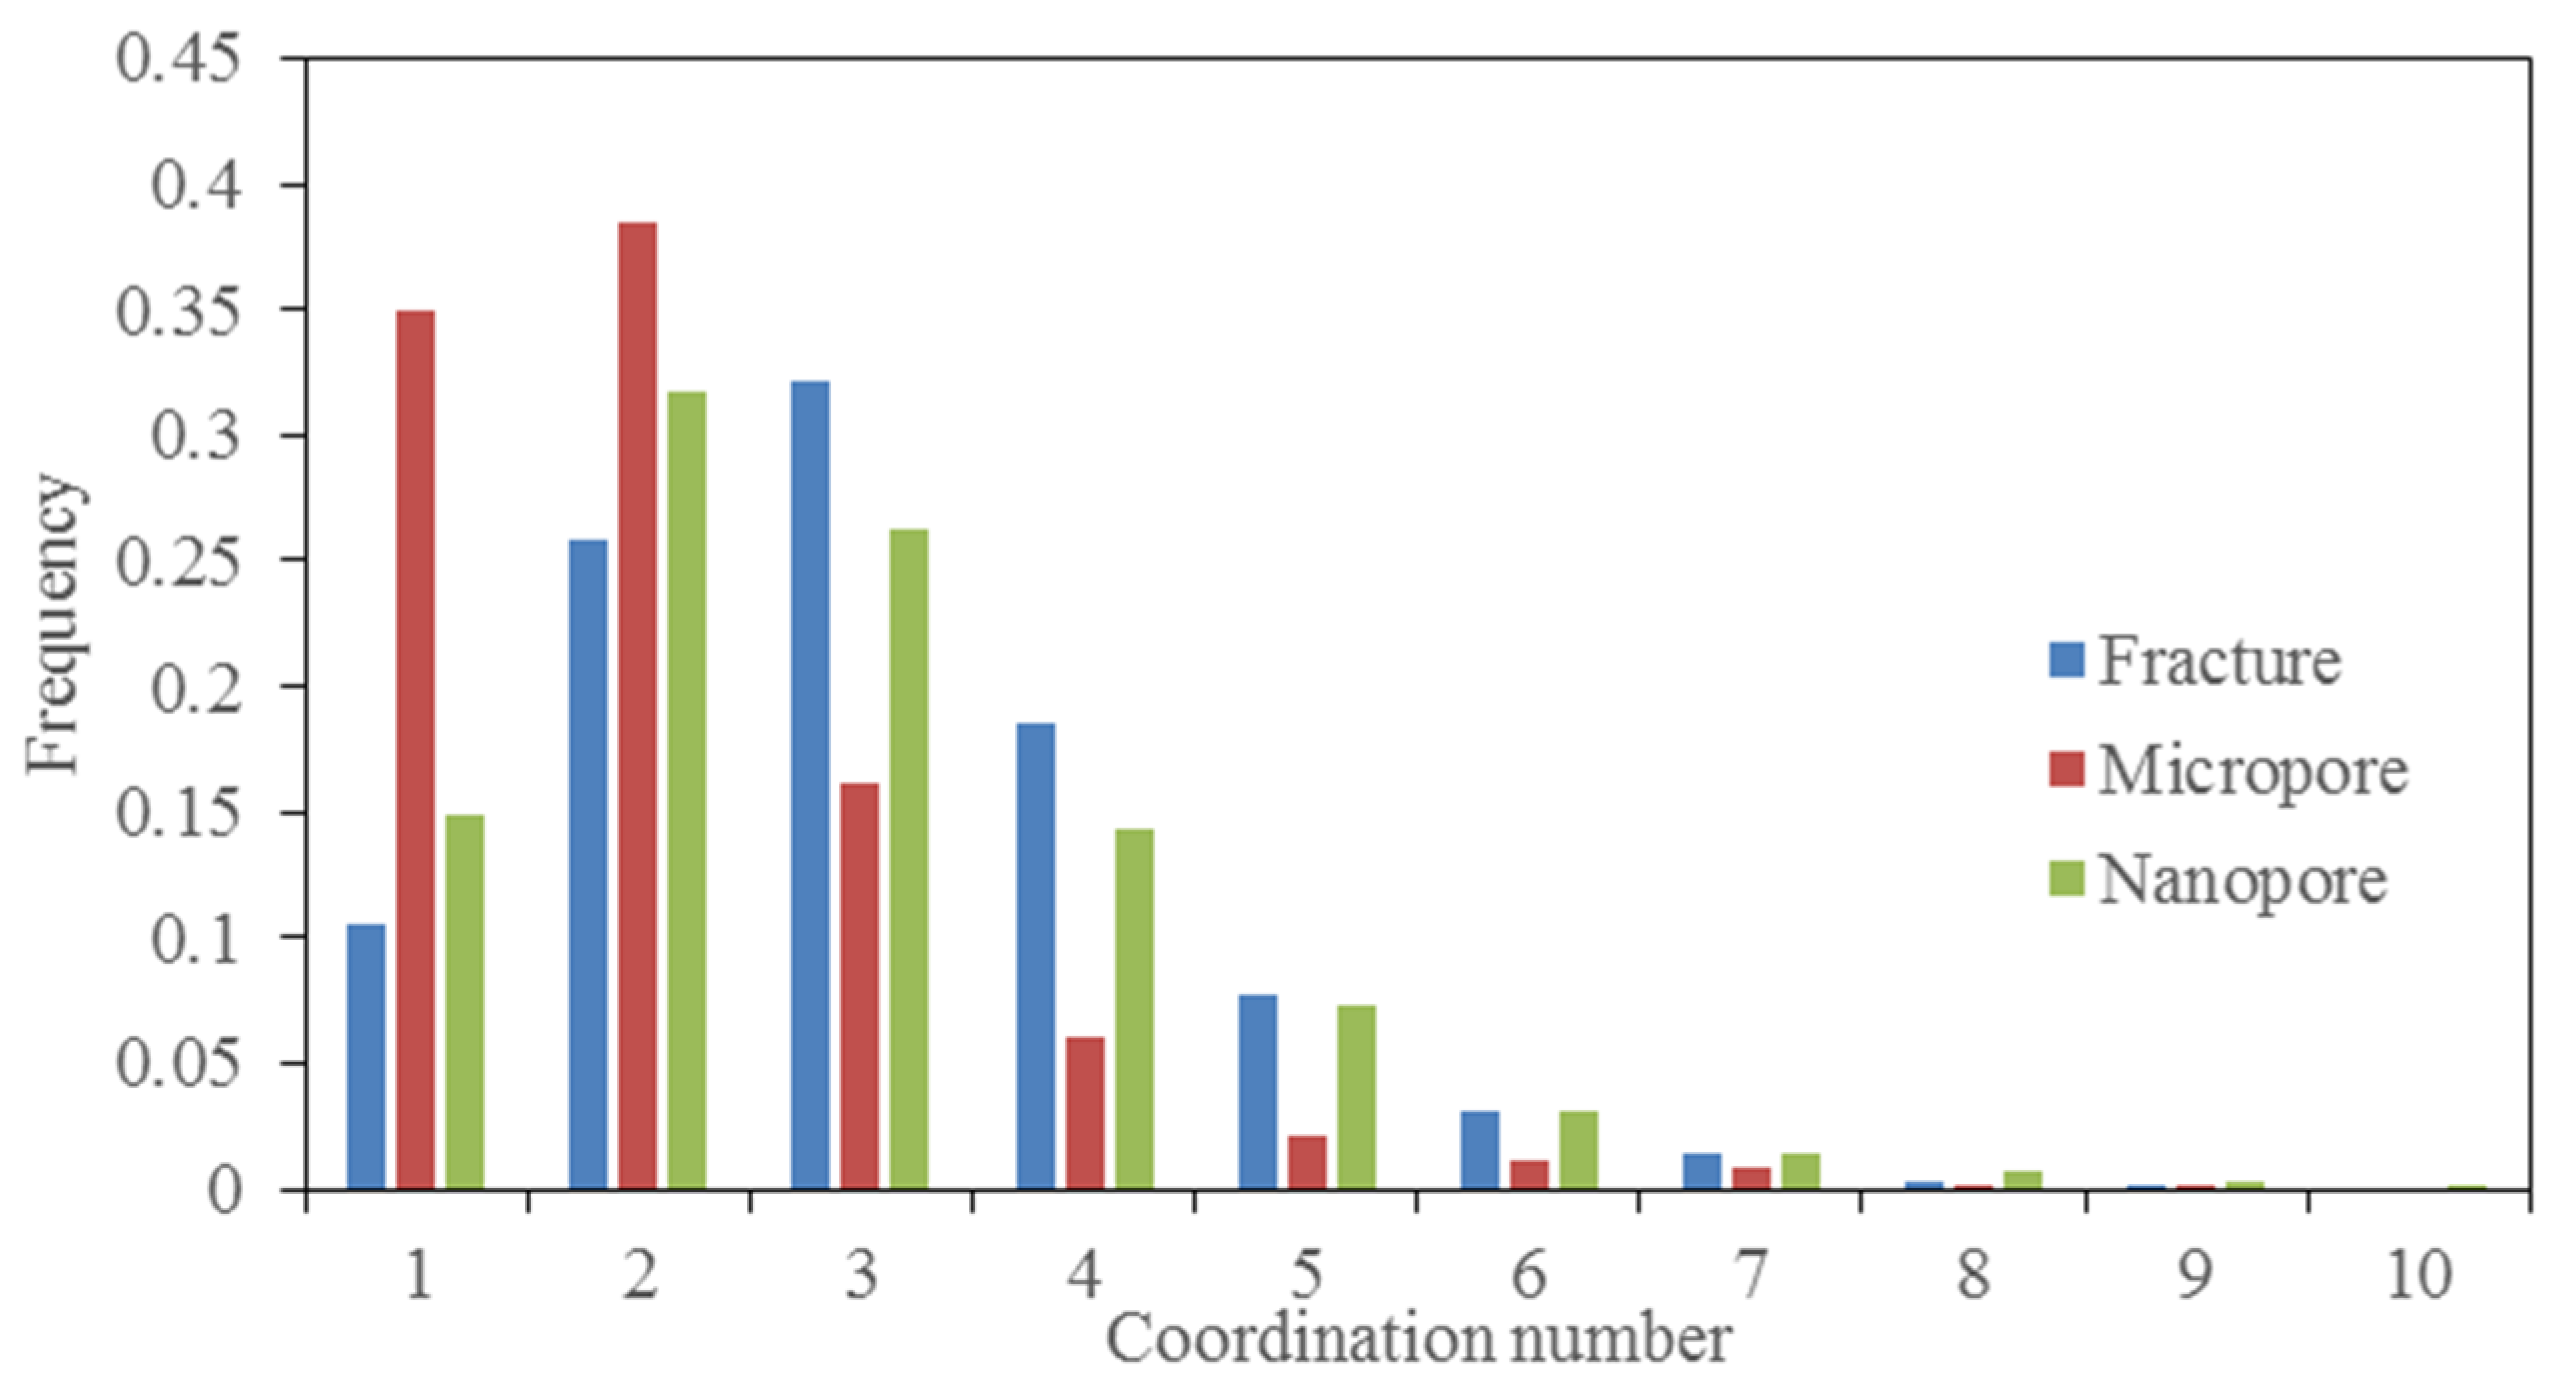
As shown in
Figure 5, based on the microfracture, micropore and nanopore digital rock, the corresponding microfracture and micro/nano pore network models were extracted to obtain the fracture aperture/pore-throat diameter distribution and coordination number distribution at different scales respectively (
Figure 6 and
Figure 7). It was found that the average fracture aperture is 63.8 μm, the average fracture coordination number is 3.05, and the fracture has the best connectivity. The average diameter of micropores is 5.96 μm, the average coordination number of micropore is 2.11, and the micropore has the worst connectivity. The average diameter of nanopores is 75.6 nm, the average nanopore coordination number is 2.88, and the nanopore also has good connectivity.
Based on the different phases at different scales, the nanopore characteristics of nanopore digital rock were fused into the micro-matrix phase of the micropore digital rock, which could obtain the micro/nano pore characteristics. Then, the micro/nano pore characteristics were further fused into the macro-matrix phase of the microfracture digital rock, which can totally obtain the microfracture and micro/nano pore characteristics. With this multiscale digital rock platform, the corresponding specific surface area of the shale rock can be calculated as follows:
where
denotes the specific surface area of the microfracture digital rock, m
2/cm
3.
denotes the percentage of macro matrix phase in the microfracture digital rock, %.
denotes the specific surface area of micropore digital rock m
2/cm
3.
denotes the percentage of micro matrix phase in micropore digital rock, %.
denotes the specific surface area of nanopore digital rock, m
2/cm
3.
As shown in
Table 1, the corresponding matrix percentage and specific surface area were calculated based on the digital rock at different scales, and the specific surface area of multi-scale digital rock was obtained as 3.5837 m
2/cm
3. It can be found that, the specific surface area of both microfracture and micropores are small, while their specific surface area is 2~3 orders of magnitude smaller than that of the nanopores, the specific surface area of shale rock is mainly contributed by nanopores. Moreover, the large specific surface area of the nanopores could store a large amount of gas as an adsorbed state, and will increase the flow resistance, which is not conducive to gas flow.
5. Conclusions
The representative 3D gray images of microfracture sample, micropore subsample and nanopore subsample were obtained with micro-CT and FIB-SEM scanning. The multi-threshold segmentation algorithm with improved maximum inter-class variance method was introduced to construct the platform of multi-scale digital rock; the corresponding microfracture and micro/nano pore network models were extracted to obtain the fracture aperture/pore-throat diameter distribution and coordination number distribution at different scales, respectively.
Based on the image segmentation phases at different scales, the nanopore characteristics of nanopore digital rock was fused into the micro-matrix phase of micropore digital rock, which was used to obtain the micro/nano pore characteristics. Then, the micro/nano pore characteristics was further fused into the macro-matrix phase of microfracture digital rock, which could obtain the microfracture and micro/nano pore characteristics completely, and the corresponding matrix percentage and specific surface area were calculated based on the digital rock at different scales.
It was found that the specific surface area of both microfracture and micropores are small, while their specific surface area is 2~3 orders of magnitude smaller than that of the nanopores, and the specific surface area of shale rock is mainly contributed by nanopores. Moreover, the large specific surface area of nanopores could store a large amount of gas as an adsorbed state, increasing the flow resistance, which is not conducive to gas flow. Results indicated that this is an effective method to calculate the multi-scale specific surface area accurately in shale rock and the adsorption characteristics and swelling properties of the shale matrix.
Author Contributions
Conceptualization, R.H. and C.W.; methodology, C.W.; software, M.Z.; validation, Y.Z. and J.Z.; formal analysis, R.H.; investigation, C.W.; resources, M.Z.; data curation, J.Z.; writing—original draft preparation, R.H.; writing—review and editing, C.W.; visualization, Y.Z.; supervision, C.W.; project administration, M.Z.; funding acquisition, Y.Z. All authors have read and agreed to the published version of the manuscript.
Funding
This work was supported by National Natural Science Foundation of China (No. 52004032, 51804038 and 51704033).
Data Availability Statement
The data presented in this study are available on request from the corresponding author.
Conflicts of Interest
The authors declare no conflict of interest.
References
- Wang, F.P.; Reed, R.M. Pore networks and fluid flow in gas shales. In Proceedings of the SPE Annual Technical Conference and Exhibition, New Orleans, LA, USA, 4–7 October 2009; Society of Petroleum Engineers: New Orleans, LA, USA, 2009. [Google Scholar]
- Alafnan, S.; Yucel Akkutlu, I. The transport mechanisms and dynamics of shale via multiscale multiphysics pore network modeling. J. Energy Resour. Technol. 2020, 142, 1–23. [Google Scholar] [CrossRef]
- Wu, Y.; Tahmasebi, P.; Lin, C.; Ren, L.; Dong, C. Multiscale modeling of shale samples based on low- and high-resolution images. Mar. Pet. Geol. 2019, 109, 9–21. [Google Scholar] [CrossRef]
- Ji, L.; Lin, M.; Cao, G.; Jiang, W. A multiscale reconstructing method for shale based on SEM image and experiment data. J. Pet. Sci. Eng. 2019, 179, 586–599. [Google Scholar] [CrossRef] [Green Version]
- Tahmasebi, P. Nanoscale and multiresolution models for shale samples. Fuel 2018, 217, 218–225. [Google Scholar] [CrossRef]
- Song, W.; Yao, J.; Ma, J.; Sun, H.; Li, Y.; Yang, Y.; Zhang, L. Numerical simulation of multiphase flow in nanoporous organic matter with application to coal and gas shale systems. Water Resour. Res. 2018, 54, 1077–1092. [Google Scholar] [CrossRef]
- Zheng, Y.; Liu, J.; Zhang, B. Analysis of the relationship between specific surface area and pore structure of shales. J. Hebei Univ. Eng. (Nat. Sci. Ed.) 2019, 36, 75–79. [Google Scholar]
- Zhu, W.; Tang, D.; Yu, T. The accurate determination method for BET specific surface based on nitrogen adsorption of shale sample. Sci. Technol. Eng. 2015, 35, 29–32+56. [Google Scholar]
- Cao, Q. Characterization and Techniques of Micropores in Organic-Rich Shale of Chang 7th of Yanchang formation, Ordos Basin. Ph.D. Thesis, Chengdu University of Technology, Chengdu, China, 2016. [Google Scholar]
- Zhao, T. Study on Storage and Microscale Seepage Mechanism of Shale Gas. Ph.D. Thesis, China University of Petroleum, Beijing, China, 2018. [Google Scholar]
- Shabro, V.; Torres-Verdin, C.; Sepehrnoori, K. Forecasting gas production in organic shale with the combined numerical simulation of gas diffusion in kerogen, Langmuir desorption from kerogen surfaces, and advection in nanopores[A]. In Proceedings of the SPE Annual Technical Conference and Exhibition, San Antonio, TX, USA, 8–10 October 2012; Society of Petroleum Engineers: San Antonio, TX, USA, 2012. [Google Scholar]
- Lame, O.; Bellet, D.; Di Michiel, M.; Bouvard, D. Bulk observation of metal powder sintering by X-ray synchrotron microtomography. Acta Mater. 2004, 52, 977–984. [Google Scholar] [CrossRef]
- Tomutsa, L.; Radmilovic, V. Focussed Ion Beam Assisted Three-Dimensional Rock Imaging at Submicron Scale; Ernest Orlando Lawrence Berkeley National Laboratory: Berkeley, CA, USA, 2003. [Google Scholar]
- Lowell, S.; Shields, J.E.; Thommes, M. Characterization of porous solids and powders: Surface area, pore size and density. Part. Technol. 2004, 16, 1620. [Google Scholar]
- Li, B.; Nie, X.; Cai, J.; Zhou, X.; Wang, C.; Han, D. U-Net model for multi-component digital rock modeling of shales based on CT and QEMSCAN images. J. Pet. Sci. Eng. 2022, 216, 110734. [Google Scholar] [CrossRef]
- Wang, M.; Wang, J.; Tao, S.; Tang, D.; Wang, C.; Yi, J. Quantitative characterization of void and demineralization effect in coal based on dual-resolution X-ray computed tomography. Fuel 2020, 267, 116836. [Google Scholar] [CrossRef]
- Nie, X.; Zhang, C.; Wang, C.; Nie, S.; Zhang, J.; Zhang, C. Variable secondary porosity modeling of carbonate rocks based on μ-CT images. Open Geosci. 2019, 11, 617–626. [Google Scholar] [CrossRef]
- Li, J.; Jiang, H.; Wang, C.; Zhao, Y.; Gao, Y.; Pei, Y.; Wang, C.; Dong, H. Pore-scale investigation of microscopic remaining oil variation characteristics in water-wet sandstone using CT scanning. J. Nat. Gas Sci. Eng. 2017, 48, 36–45. [Google Scholar] [CrossRef]
- Yao, J.; Zhao, X.; Yi, Y.; Tao, J. The current situation and prospect on digital core technology. PGRE 2005, 12, 52–54. [Google Scholar]
- Wang, C.; Yao, J.; Yang, Y. Structure characteristics analysis of carbonate dual pore digital rock. J. China Univ. Pet. (Ed. Nat. Sci.) 2013, 37, 71–74. [Google Scholar]
- Wang, C.; Yao, J.; Yang, Y.; Zhang, L.; Pang, P.; Yan, Y. The flow properties of carbonate digital rock based on lattice Boltzmann method. J. China Univ. Pet. (Ed. Nat. Sci.) 2012, 36, 94–98. [Google Scholar]
- Saif, T.; Lin, Q.; Butcher, A.R.; Bijeljic, B.; Blunt, M.J. Multi-scale multi-dimensional microstructure imaging of oil shale pyrolysis using X-ray micro-tomography, automated ultra-high resolution SEM, MAPS Mineralogy and FIB-SEM. Appl. Energy 2017, 202, 628–647. [Google Scholar] [CrossRef]
- Akbarabadi, M.; Saraji, S.; Piri, M.; Georgi, D.; Delshad, M. Nano-scale experimental investigation of in-situ wettability and spontaneous imbibition in ultra-tight reservoir rocks. Adv. Water Resour. 2017, 107, 160–179. [Google Scholar] [CrossRef]
- Kelly, S.; El-Sobky, H.; Torres-Verdín, C.; Balhoff, M.T. Assessing the utility of FIB-SEM images for shale digital rock physics. Adv. Water Resour. 2015, 95, 302–316. [Google Scholar] [CrossRef]
- Cui, J.; Zou, C.; Zhu, R.; Bai, B.; Wu, S.; Wang, T. New advances in shale porosity research. Adv. Earth Sci. 2012, 27, 1319–1325. [Google Scholar]
- Cai, J.; Wood, D.A.; Hajibeygi, H.; Iglauer, S. Multiscale and multiphysics influences on fluids in unconventional reservoirs: Modeling and simulation. Adv. Geo-Energy Res. 2022, 6, 91–94. [Google Scholar] [CrossRef]
- Yang, Y.; Zhou, Y.; Blunt, M.J.; Yao, J.; Cai, J. Advances in multiscale numerical and experimental approaches for multiphysics problems in porous media. Adv. Geo-Energy Res. 2021, 5, 233. [Google Scholar] [CrossRef]
- Yao, J.; Hu, R.; Wang, C.; Yang, Y. Multiscale pore structure analysis in carbonate rocks. Int. J. Multiscale Comput. Eng. 2015, 13, 1–9. [Google Scholar] [CrossRef]
- Karsanina, M.V.; Gerke, K.M.; Skvortsova, E.B.; Ivanov, A.L.; Mallants, D. Enhancing image resolution of soils by stochastic multiscale image fusion. Geoderma 2018, 314, 138–145. [Google Scholar] [CrossRef]
- Moctezuma, A.; Bekri, S.; Laroche, C.; Vizika, O. A Dual Network Model for Relative Permeability of Bimodal Rocks Application in a Vuggy Carbonate. In Proceedings of the International Symposium of the Society of Core Analysts, Pau, France, 21–24 September 2003. [Google Scholar]
- Jiang, Z.; van Dijke, M.I.J.; Sorbie, K.S.; Couples, G.D. Representation of multiscale heterogeneity via multiscale pore networks. Water Resour. Res. 2013, 49, 5437–5449. [Google Scholar] [CrossRef]
- Mehmani, A.; Prodanović, M. The effect of microporosity on transport properties in porous media. Adv. Water Resour. 2014, 63, 104–119. [Google Scholar] [CrossRef]
- Bultreys, T.; Hoorebeke, L.V.; Cnudde, V. Multi-scale, micro-computed tomography-based pore network models to simulate drainage in heterogeneous rocks. Adv. Water Resour. 2015, 78, 36–49. [Google Scholar] [CrossRef]
- De Vries, E.T.; Raoof, A.; van Genuchten, M.T. Multiscale modelling of dual-porosity porous media; a computational pore-scale study for flow and solute transport. Adv. Water Resour. 2017, 105, 82–95. [Google Scholar] [CrossRef]
- Zhao, J.; Zhang, M.; Wang, C.; Mao, Z.; Zhang, Y. Application of the Backpropagation Neural Network Image Segmentation Method with Genetic Algorithm Optimization in Micropores of Intersalt Shale Reservoirs. ACS Omega 2021, 6, 25246–25257. [Google Scholar] [CrossRef]
- Zhang, Y.; Ju, B.; Zhang, M.; Wang, C.; Zeng, F.; Hu, R.; Yang, L. The effect of salt precipitation on the petrophysical properties and the adsorption capacity of shale matrix based on the porous structure reconstruction. Fuel 2022, 310, 122287. [Google Scholar] [CrossRef]
- Wang, L.; Duan, H. Application of Otsu method in multi-threshold image segmentation. Comput. Eng. Des. 2008, 29, 2844–2845. [Google Scholar]
- Otsu, N. A threshold selection method from gray-level histograms. Automatica 1975, 11, 23–27. [Google Scholar] [CrossRef] [Green Version]
- Jiang, Z.; Wu, K.; Couples, G.D.; van Dijke, M.I.J.; Sorbie, K.; Ma, J. Efficient extraction of networks from three-dimensional porous media. Water Resour. Res. 2007, 43, W12S03. [Google Scholar] [CrossRef]
| Disclaimer/Publisher’s Note: The statements, opinions and data contained in all publications are solely those of the individual author(s) and contributor(s) and not of MDPI and/or the editor(s). MDPI and/or the editor(s) disclaim responsibility for any injury to people or property resulting from any ideas, methods, instructions or products referred to in the content. |
© 2023 by the authors. Licensee MDPI, Basel, Switzerland. This article is an open access article distributed under the terms and conditions of the Creative Commons Attribution (CC BY) license (https://creativecommons.org/licenses/by/4.0/).


