Article

Analysis of Sediment and Water Flow and Erosion Characteristics of Large Pelton Turbine Injector

1
Key Laboratory of Fluid and Power Machinery, Ministry of Education, Xihua University, Chengdu 610039, China
2
College of Water Resources and Civil Engineering, China Agricultural University, Beijing 100083, China
*
Authors to whom correspondence should be addressed.
Processes 2023, 11(4), 1011; https://doi.org/10.3390/pr11041011
Submission received: 5 March 2023 / Revised: 21 March 2023 / Accepted: 23 March 2023 / Published: 27 March 2023

Abstract

:
Based on the solid–liquid two-phase flow model, SST k-ω model, and Lagrangian equation model of particle motion, numerical simulations of the sediment–water flow in the injector of a large Pelton turbine were conducted. The distribution rules of pressure, velocity, erosion rate, and erosion location of the injector were obtained by analyzing the sediment–water flow characteristics and sediment erosion distribution characteristics of the injector. The results revealed that the velocity distribution trend of the water inside the cylindrical jet exhibited a nonlinear distribution, and the phenomenon of “velocity deficit” occurred at the end of the needle guide and needle tip, resulting in a decrease in the jet quality of the injector. The sediment particle diameter affected the erosion rate of the needle and erosion location of the needle and nozzle port ring. This study provided guidance for sediment erosion analysis and the prediction of the utility of large Pelton turbines.

1. Introduction

The Himalayan region of China has a large amount of untapped high-head water resources, and Pelton turbines suitable for high head (200–2000 m) play an important role in utilizing these untapped hydraulic energy resources. The high velocity of water flow at the outlet of the Pelton turbine injector, high flow velocity, and high sediment content are the main factors causing the sediment erosion of the hydro-generator set. The erosion of the injector leads to poor jet quality and unit power generation efficiency, and when the erosion is severe, the deviation of the jet from the splitting seriously affects the operational stability of the unit [1]. Studies have reported that the erosion and tear of the injector of Pelton turbines mainly occurs in the needle and nozzle port ring; if 0.5–1 mm of the needle is damaged, the turbine power generation efficiency is reduced by 9% [2].
Currently, the research on Pelton turbines is mainly based on two methods, namely, experimental studies and numerical simulations. Jung In Hyuk et al. [3] experimentally confirmed that needle eccentricity has an important effect on the jet flow of a Pelton turbine. Din Mohammad Zehab Ud et al. [4] used a typical power plant as an example to study the effect of the erosion of sediment particles on the injector of a Pelton turbine using an experimental method. Alomar et al. [5] assessed the performance of the Pelton turbine by changing the nozzle diameter, volume flow rate, and head parameters to obtain the optimum operating conditions. Pang et al. [6] designed a single runner test stand for the hydraulic turbine guide mechanism to obtain different sediment erosion distribution characteristics of the guide vane under different working conditions. With the rapid development of CFDs (Computational Fluid Dynamics) technology and computer capability, numerical simulation is widely used by many researchers. Zhong et al. [7] derived the relationship equation between the nozzle flow and needle stroke by studying the design characteristics of the Pelton turbine injector. Zeng et al. [8,9] evaluated the hydraulic performance of the injector via a transient water–gas two-phase flow simulation, and the results indicated that the reduction in the friction loss and increase in the water head would lead to the decrease in the hydraulic loss. Han et al. [10,11]. studied the hydraulic characteristics of the injector using an Eulerian particle tracking model and demonstrated that the secondary flow has an important effect on the injector. Petley et al. [12] studied the effect of the jet shape on the efficiency of the Pelton turbine and reported that with increasing the opening of the nozzle and needle, the secondary velocity causes the degradation of the free surface, which affects the jet interaction. Finnie [13], Grant et al. [14], Oka et al. [15], and Karimi et al. [16] developed a standard erosion model for the prediction of the erosion of hydraulic turbines. Rai et al. [17,18] developed a simplified erosion model to describe the relationship among sediment properties, erosion velocity, model material properties, and erosion duration; combined with experimental data, they confirmed that the model can be used to predict erosion. Guo et al. [19,20] proposed a new Euler–Lagrange method that can be applied to study solid–liquid–gas transients, and the reliability of the method was demonstrated by comparing the results of sediment erosion calculations with the actual erosion of the power station. Xiao et al. [21] introduced a new particle bounce model to analyze the transient flow field and particle distribution in detail, focusing on the separation of particles and flow lines. Ge et al. [22,23] studied the effects of the sediment particle velocity, concentration, and nozzle opening on bucket erosion through three nonconstant numerical simulations of solid–liquid–gas and proved that the changes in these parameters would affect the bucket walls to various degrees. The experimental study verified the numerical simulation results, which could be used for the prediction of erosion.
Only a few studies on the sediment erosion phenomenon of the large Pelton turbine injector are available. In this study, the solid–liquid two-phase flow model was used to numerically calculate the solid–liquid two-phase flow of the injector. Furthermore, the particle motion Lagrangian equation model was used to track the trajectory of sediment particles, and the Generic erosion model was used to compare the effect of various sediment diameters on the erosion characteristics of the injector of a large Pelton turbine.

2. Mathematical Model

2.1. Turbulence Model

Since the research object was a large Pelton turbine injector with a high Reynolds number and complex structure, the SST k-ω model was chosen to close the multiphase flow control equations. The SST k-ω model is modified to the standard k-ω model through the hybrid function. The SST k-ω model has a higher accuracy and confidence in simulating rotational shear flow at a high Reynolds number than the standard k-ω model. The k-ω model is used at the near-wall surface, whereas the k-ε model is used in other regions. Moreover, the SST k-ω model has better accuracy and credibility for rotational shear flow. Its specific form is given as Equations (1) and (2):
t ρ k + x i ρ k u i = x i Γ k k x j + G k Y k + S k
t ρ ω + x i ρ ω u i = x i Γ ω ω x j + G ω Y ω + D ω + S ω
where t is time, u is fluid velocity, x is coordinate, Gk is the turbulent kinetic energy k-generation term, Gω is the ω-generation term, Γk is the effective diffusion phase of k, and Γω is the effective diffusion phase of ω, where: Γ k = μ + μ t σ k , Γ ω = μ + μ t σ ω , Yk is the divergence phase of k, Yω is the divergence phase of ω, Dω is the orthogonal divergence phase, and Sk and Sω are user-defined source terms. The subscripts i and j are tensor coordinates, μt is the turbulent vortex dynamic viscosity coefficient, σk is the turbulent Prandtl number of k, and σω is the turbulent Prandtl number of ω, where: σ k = 1 0.85 F 1 + ( 1 F 1 ) , σ ω = 1 0.5 F 1 + 0.856 ( 1 F 1 ) , F1 is the value of the wall function, G k = μ t S 2 , S = 2 S i j S i j , S i j = 1 2 u j x i + u i x j , G ω = ρ G k μ t , Yk = ρβ*, where: β* = 0.09. Yω = ρβkω2, where: β = 0.075F1 + 0.0828(1 − F1). D ω = 2 ( 1 F 1 ) ρ σ ω , 2 1 ω k x j ω x j , where σω,2 = 1.168 [24].

2.2. Solid–Liquid Two-Phase Flow Model

Assuming that the solid–liquid model is an incompressible Newtonian fluid, no heat exchange is generated during the flow, and no phase change occurred in both the solid and liquid; the solid–liquid two-phase flow equation is used as follows:
The liquid-phase continuity equation is given as Equation (3):
ϕ f t + x i ϕ f U i = 0
The solid-phase continuum equation is given as Equation (4):
ϕ p t + x i ϕ p V i = 0
The liquid-phase momentum equation is given as Equation (5):
x i ϕ f U i + x k ϕ f U i U k = 1 ρ f ϕ f p x i + ν f x i ϕ f U i x k + U k x i B ρ i ϕ f ϕ g U i V i + ϕ f g i
The solid momentum equation is given as Equation (6):
t ϕ p V i + x k ϕ p V i V k = 1 ρ p ϕ p p x i + ν p x k ϕ p V i x k + V k x i B ρ p ϕ f ϕ p V i U i + ϕ p g i
where Ui is the velocity of water (m/s), Vi is the velocity of sediment (m/s), ρ is the density of phase material (kg/m3), g is the acceleration of gravity (m/s2), ν is the coefficient of kinematic viscosity of phase material, P is the pressure (Pa), xi is the coordinate component, B = 18 1 + B 0 ρ f ν f / d 2 is the interphase action coefficient, d is the sediment particle diameter; the B0 term is introduced to consider other action factors other than the Stokes linear drag action. In general, B0 is a constant, ϕ is the phase volume fraction and has the relational equation, ϕf + ϕp = 1, the subscript f is the liquid phase, p is the solid phase, and I, j, and k are tensor coordinates [25].

2.3. Particle Trajectory Model

The particle trajectory tracking of the discrete phase in the two-phase flow uses a Lagrangian equation model of particle motion [26]. This model is applicable to the case where the volume fraction of the particle phase is <0.005. The controlling equation for the discrete term particles is given as Equation (7):
d u p i d t = 1 K m + ρ ¯ 3 4 d p C D u u p u i u p i + 3 2 d p K B ν π t d u i d τ d u p i d τ d τ t τ + 6 π d p K S ν u j x i 1 2 u j u p j sgn u j x i + 3 4 C M Ω i × u i u p i + K m d u i d t 1 ρ P x i + ρ ¯ g i
where up is the velocity component of the particle (m/s), Km is the virtual mass force coefficient, Km ≈ 0.5. ρ ¯ is the ratio of particle density ρp to fluid density ρ, CD is the particle drag coefficient, CD = 0.44. dp is the particle size, KB is the Basset force coefficient, KB ≈ 6.0. ν is the fluid motion viscosity coefficient, KS is the Saffman lift coefficient, KS ≈ 1.615. CM is the Magnus lift coefficient, CM ≈ 1.0. Ω i = ω p i 0.5 × u i , ωp is the angular velocity of the particle’s own rotation, p is the pressure, g is the acceleration of gravity, and sgn is the sign function.

2.4. Sediment Erosion Model

When sediment impacts an injector, it produces cutting erosion on the injector, and the contact of sediment particles on the surface depends on the nature of the sediment particles and the solid surface. The erosion rate is related to parameters such as the wall material, sediment composition, speed, and impact velocity. The sediment particle density was set to 2650 kg/m³. The generic model [27] was used to predict the erosion distribution and the magnitude of the erosion rate of the injector, which is defined as Equation (8):
R e = p = 1 N P m p c d p f α v b v A f a c e
where Re is the wall erosion rate, Np is the total number of particles, mp is the particle mass flow rate, c(dp) is the particle size function, ƒ(α) is the impact angle function (α is the angle at which the particles impact the wall), b(v) is the function of the relative velocity of the particles (v is the relative velocity of the particles to the wall), and Aface is the wall area (m2). The erosion model parameters were set as follows: the normal bounce coefficient was defined as Equation (9):
ε N = 0.993 0.0307 α + 4.75 × 10 4 α 2 2.61 × 10 6 α 3
The tangential bounce coefficient was defined as Equation (10):
ε T = 0.998 0.029 α + 6.43 × 10 4 α 2 3.56 × 10 6 α 3
The impact angle function was defined in a segmented linear way, and the data are shown in Table 1. The particle size function was set to 1.8 × 10⁻⁹, and the velocity index function was set to 2.6.

3. Geometric Physical Model and Boundary Conditions

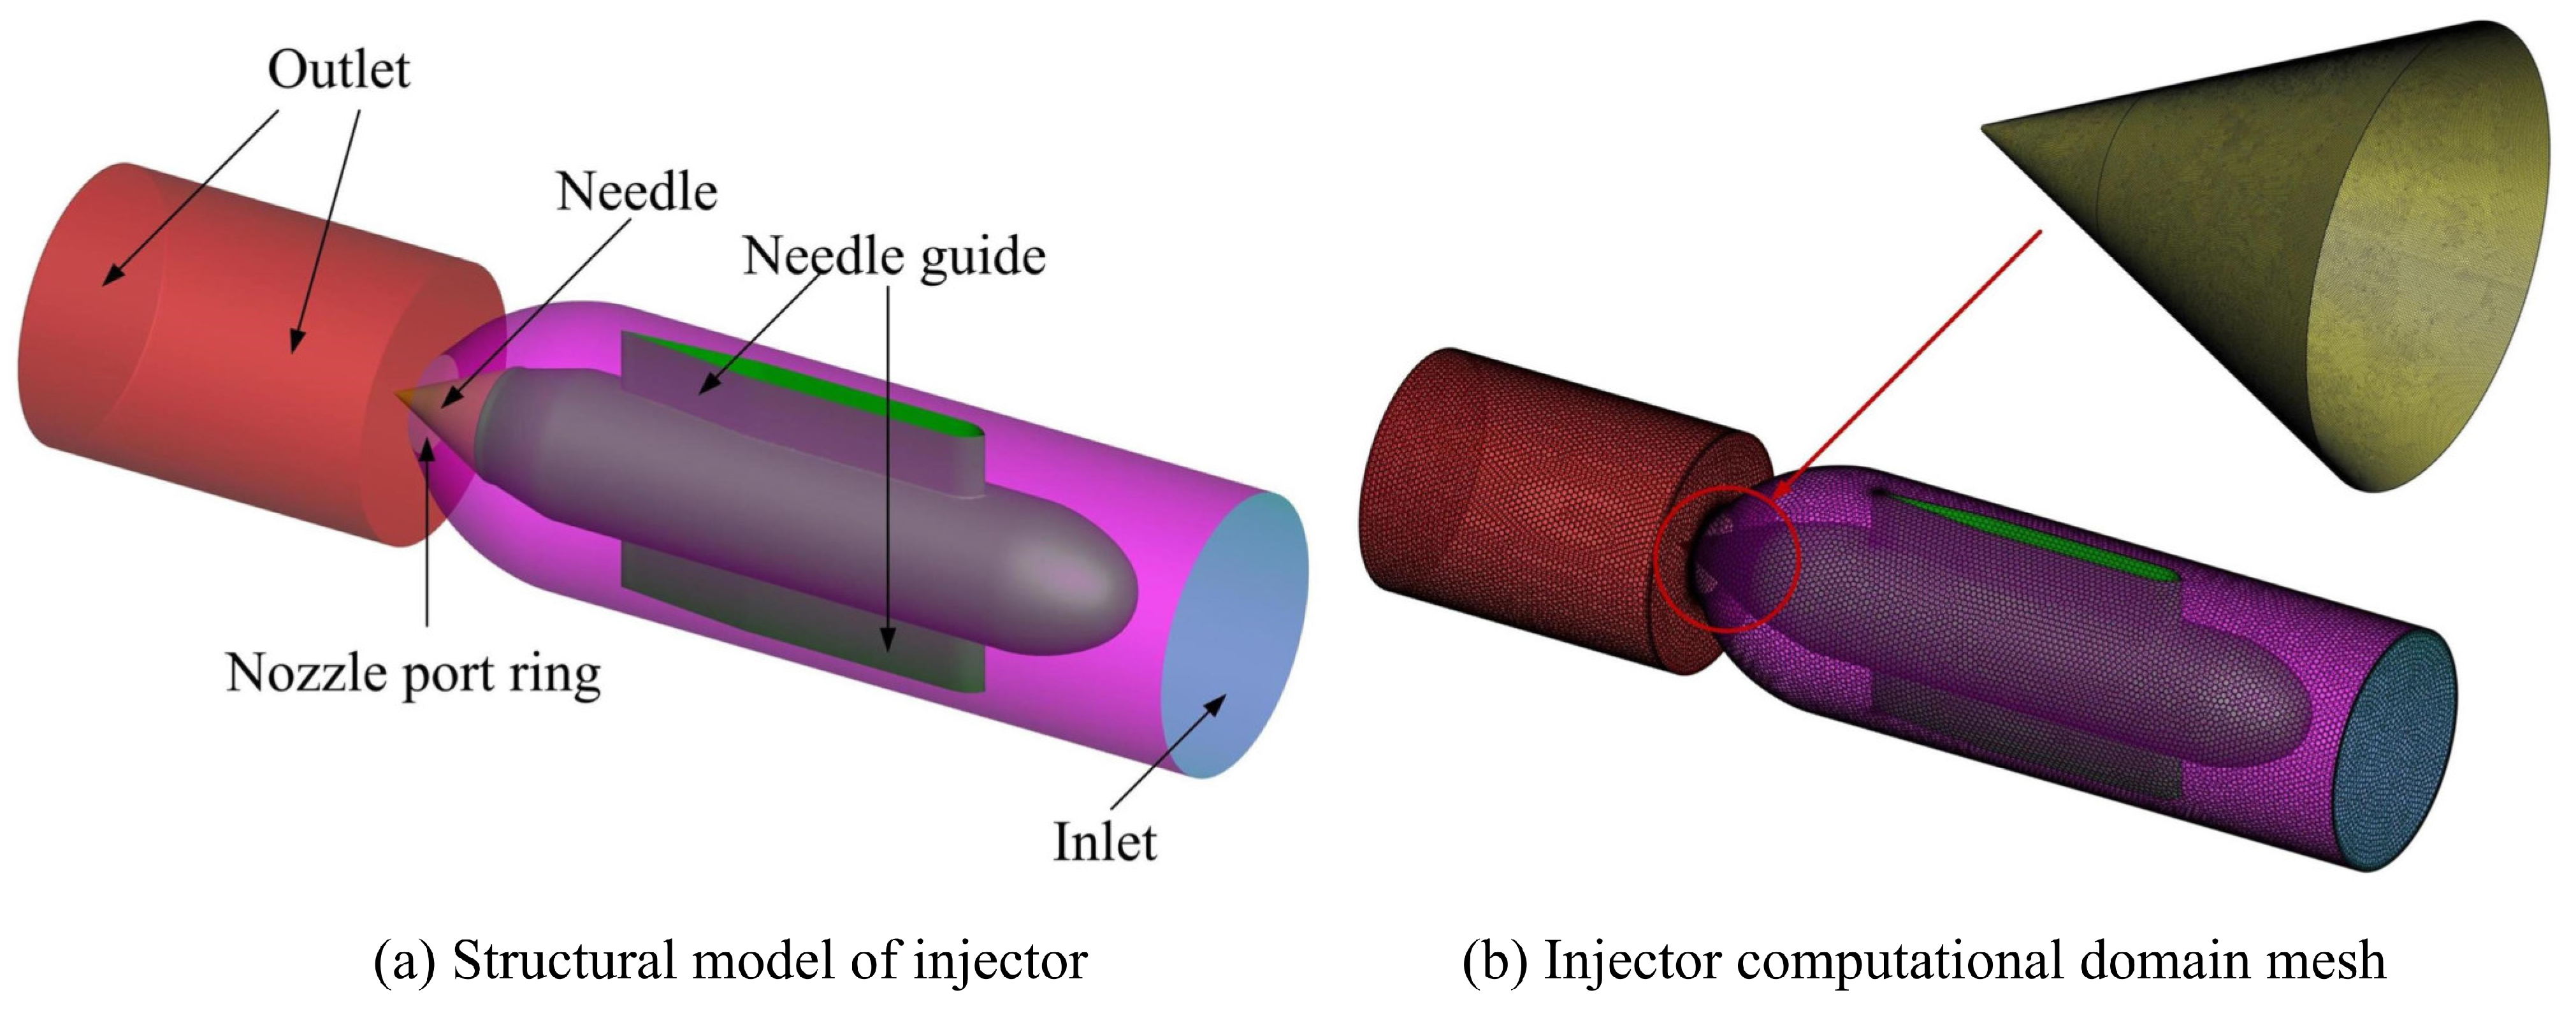
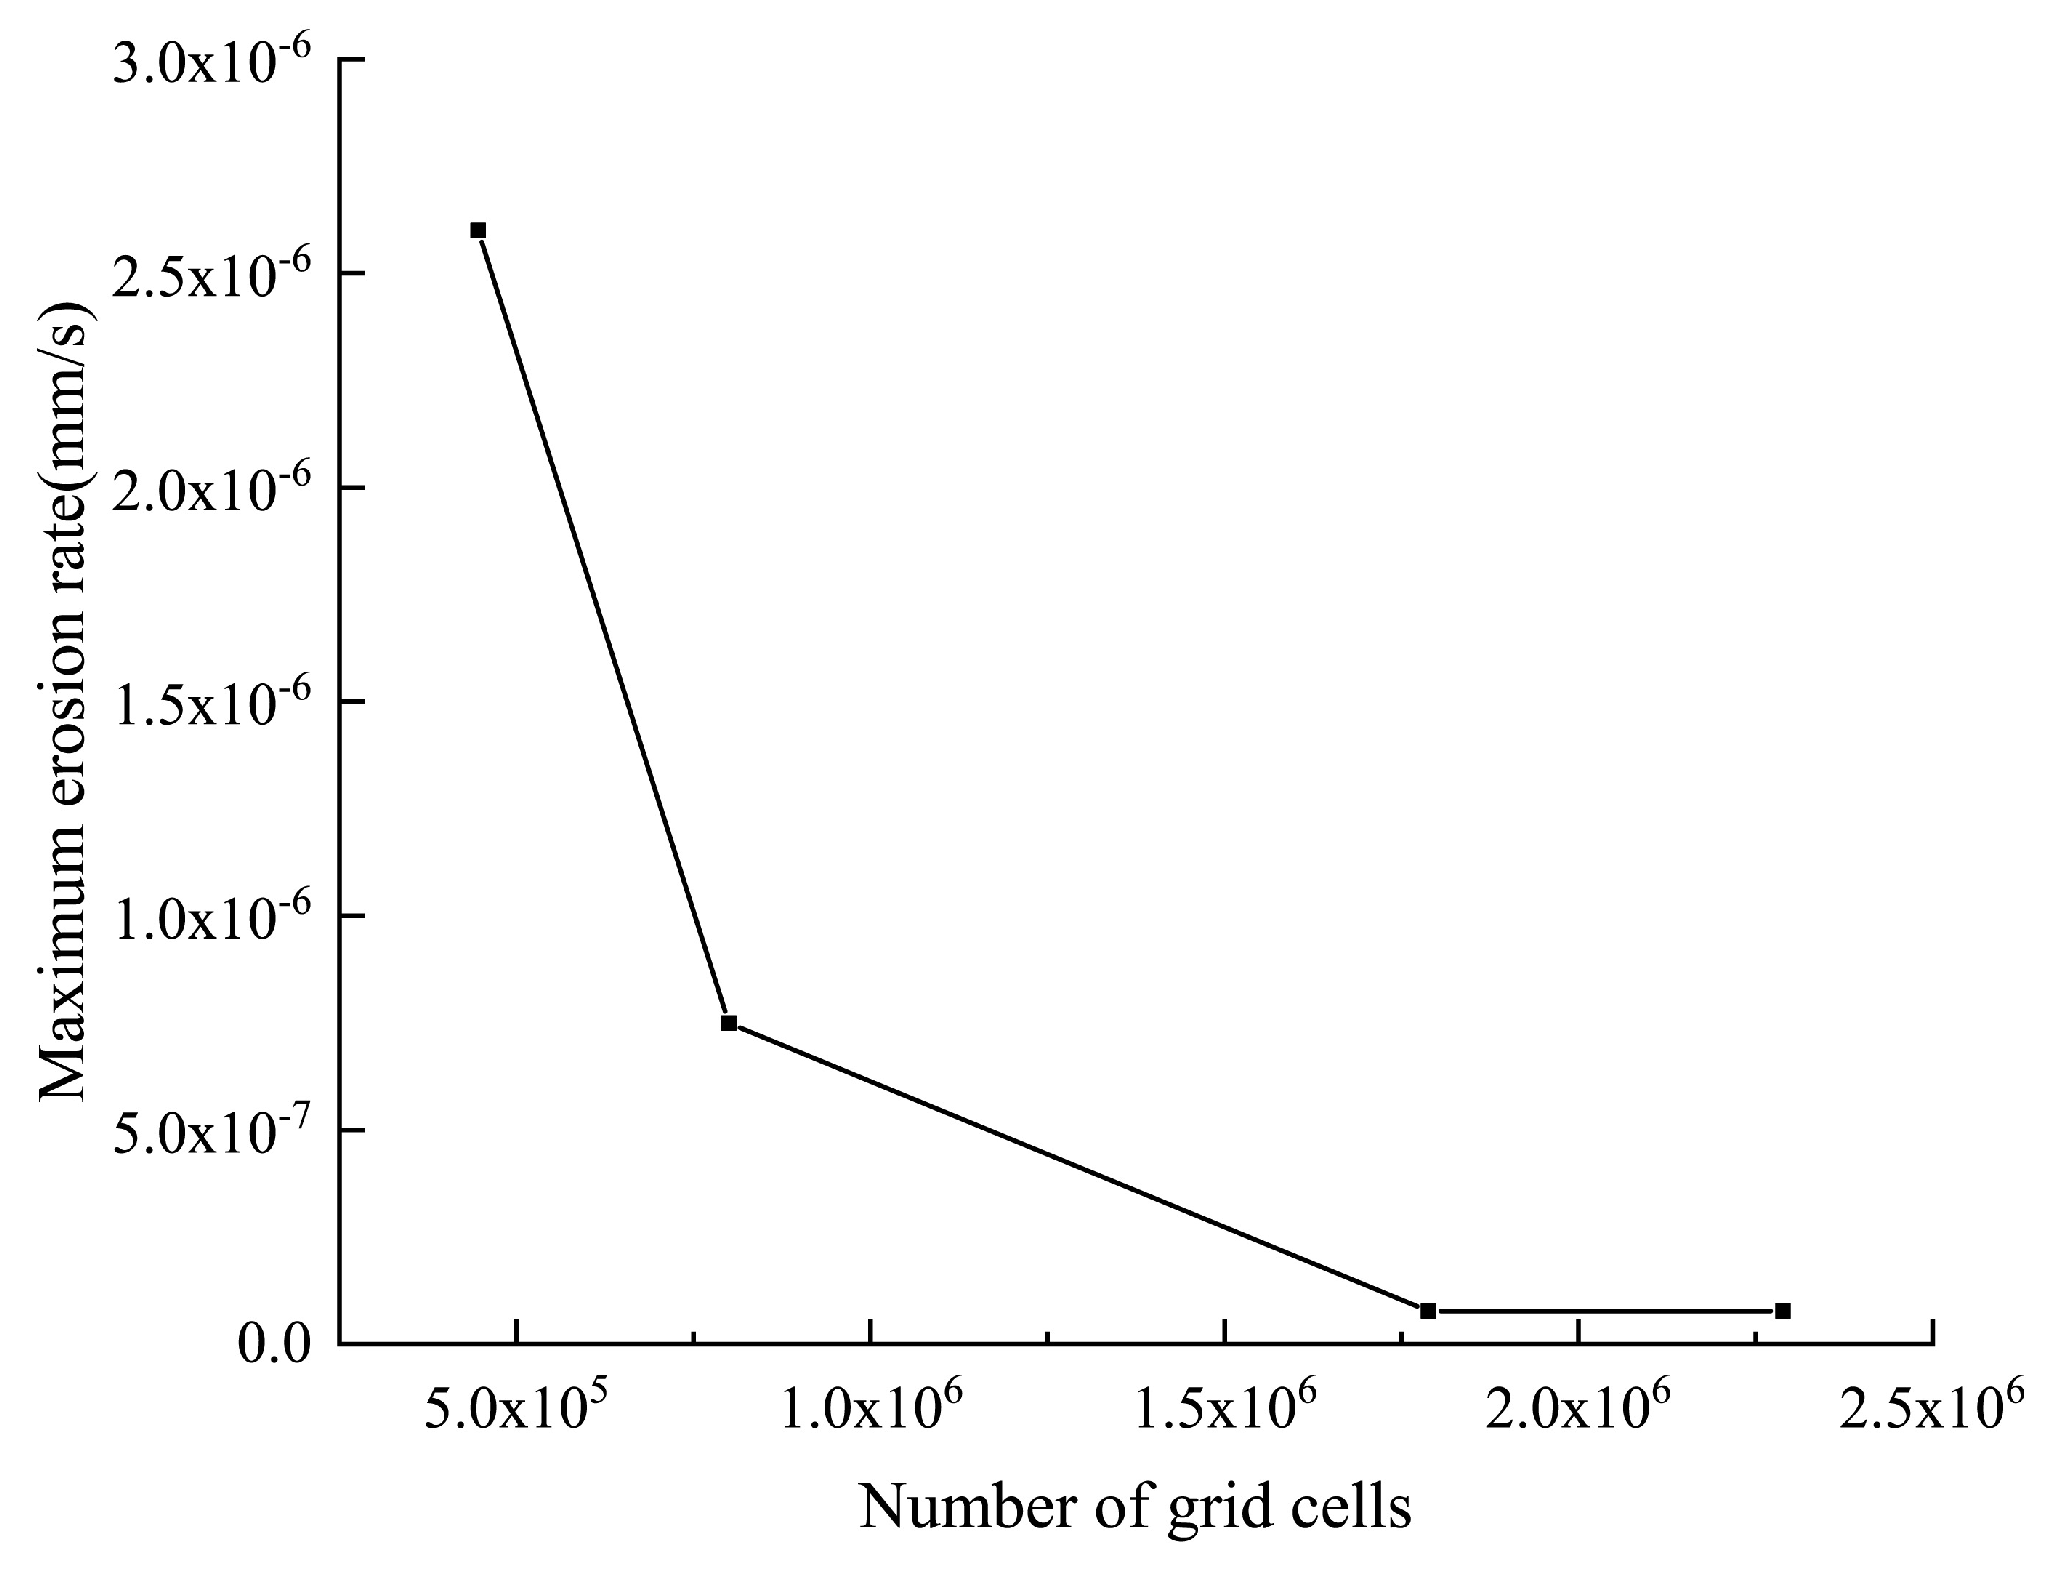
3.1. Geometric Modeling and Meshing

The design parameters of the large Pelton turbine injector in this study are shown in Table 2, and the data were provided by the power station. To accurately calculate the sediment–water flow and sediment particle motion inside the injector, a computational domain model was established (Figure 1). The large Pelton turbine injector is complex; therefore, a polyhedral mesh was used to mesh the injector, and the surface of the injector was locally encrypted to capture the sediment and water flow patterns on the surface of the needle.
The Pelton turbine converts the water flow energy into electrical energy by transforming the pressure potential energy of the high head water flow into the velocity energy of the high-speed jet, and the high-speed jet is used to do work by impacting the bucket. The cylindrical jet velocity V0 of the injector is the main factor that determines whether the impressed turbine runner can efficiently generate electricity. Usually, the cylindrical jet velocity V0 is defined using the following Equation (11):
V 0 = K v 2 g H
where Kv is the jet velocity coefficient considered as 0.98, H is the turbine design head, and g is the local acceleration (m/S2). The design head of the power station was 671 m, and the design value of the cylindrical jet velocity V0 was calculated to be 112.39 m/s.
The accuracy of the calculation results and computer resources should be comprehensively considered while calculating the number of grids in the domain, and the maximum wear rate should be taken as the target to verify the grid independence. The grid models with various numbers are shown in Table 3. When the number of grids increased to approximately 1.8 million, the maximum erosion rate tended to be stable (Figure 2). Considering the required accuracy and computer resources, it was decided to choose the grid model of option 3.

3.2. Boundary Conditions and Calculation Settings

Using a pressure inlet, a total pressure of 6,570,661.482 Pa was set, and a pressure outlet had a pressure of 0 Pa. The wall surface was used as a no-slip solid boundary, and the standard wall function method was used to simulate the flow in the near-wall region. The solution method uses the SIMPLIC algorithm in a discrete format with a second-order windward mode. According to the hydrological data provided by the power station, the mineral composition of the suspended sediment at the dam site was mainly quartz, followed by chlorite, calcite, illite, and kaolinite. The over machine sediment content was 0.06 kg/m3; the median particle size was 0.0142 mm, simplified as spherical particles and shot vertically from the inlet. The incidence velocity was the same as the water flow velocity, and the walls were all set to bounce in contact. Transient calculations were performed for the solid–liquid two-phase flow. The time step was set to 7.77726 × 10⁻⁵ s, and each time step was iterated 20 times.

4. Numerical Calculation Results and Analysis

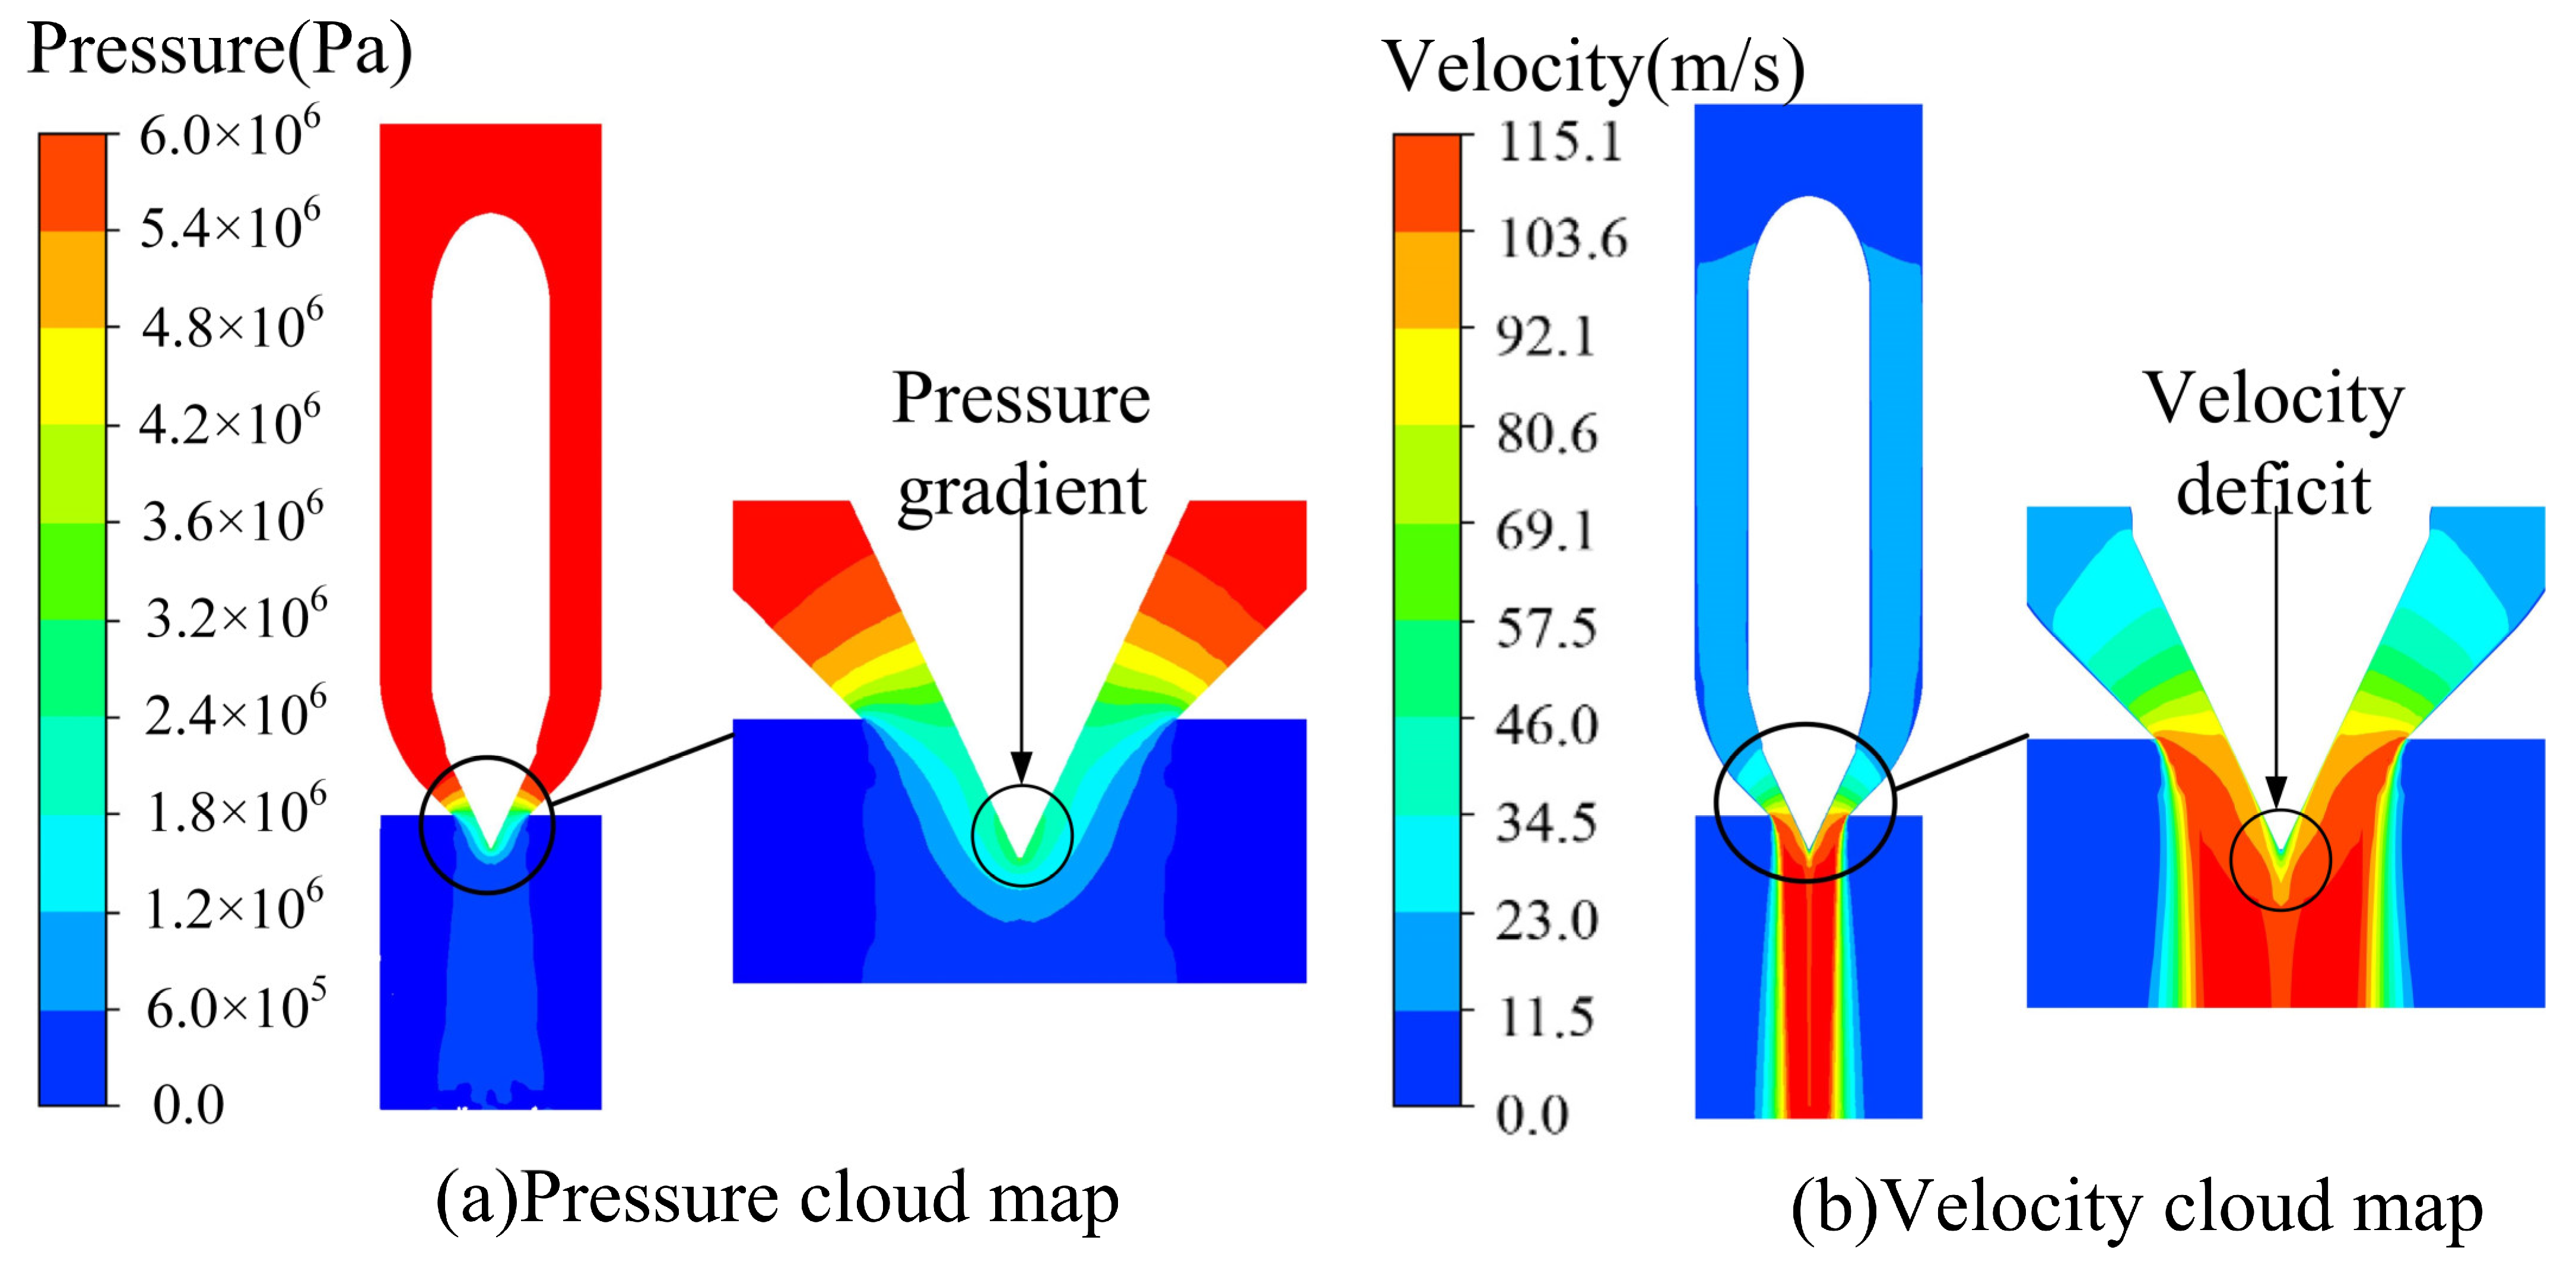
4.1. Analysis of the Flow Field in the Injector

Figure 3 shows the cloud diagram of the flow field inside the injector. The water flow of the Pelton turbine was mainly stored in the form of the pressure potential energy at the inlet end of the injector [Figure 3a], and the potential energy of the water flow was transformed into high-speed kinetic energy through the injector. The water velocity reached the maximum value of 115.1 m/s at the nozzle outlet. A circular water column was formed at the junction of the needle and nozzle. The pressure gradient of the circular water column clearly changed, and the circular water flew out of the nozzle. After the nozzle, part of the atmospheric gas was rolled into the annular water column, forming a high-speed water column jet and impacting the rotor bucket. In the vicinity of the nozzle outlet, with the decrease in the flow channel overflow area, the pressure gradient significantly changed. However, after the annular water column is free from the nozzle mouth binding, the jet began to occur after the sudden expansion phenomenon. The pressure gradient no longer exhibited uniform changes, and the needle tip appeared to be in the local high-pressure region. The water velocity in the needle tip (water column jet center) was lower than the velocity of the surrounding area [Figure 3b]. This phenomenon is known as “velocity deficit” [28], which is usually caused by the persistence of the boundary layer on the surface of the needle. This is widely present in the Pelton turbine injector and will have an impact on the velocity distribution of the jet and jet quality.
To investigate the trend of velocity changes in the flow field within the injector in the direction of the water flow, four sections are taken along the water flow direction as shown in Figure 4. In section S1, the water velocity distribution follows Newton’s law of internal friction; the velocity along the surface of the needle to the inner wall of the nozzle tube uniformly decreases; the same velocity deficit phenomenon occurs at the end of the needle guide, which is because the needle guide at the end of the flow pattern is similar to the cylindrical winding flow; the water flows through the needle guide after the formation of the Carmen vortex, causing the boundary layer separation; and the boundary layer of fluid microclusters are blocked. Varying flow velocities at different radii lead to the varying size of the vortex street at the tail end of the deflector, resulting in the turbulence of the flow pattern there. When the water flows to section S2, the velocity deficit phenomenon is reduced, the flow pattern is stable, and the velocity change gradient is more uniform. When water flows to section S3 (nozzle outlet), the velocity deficit phenomenon generated by the needle guide completely disappears, but the high-speed water here begins to break away from the nozzle restraint. In this section, the water velocity distribution changes, the nozzle surface water velocity is greater than the needle surface water velocity, and the needle tip begins to exhibit velocity deficit phenomenon. When water flows to section S4, the center of the jet begins to exhibit the velocity deficit phenomenon and the center of the jet exhibits water with low velocity; moreover, the jet water column and the atmosphere at the interface exhibit clear changes in the velocity gradient.

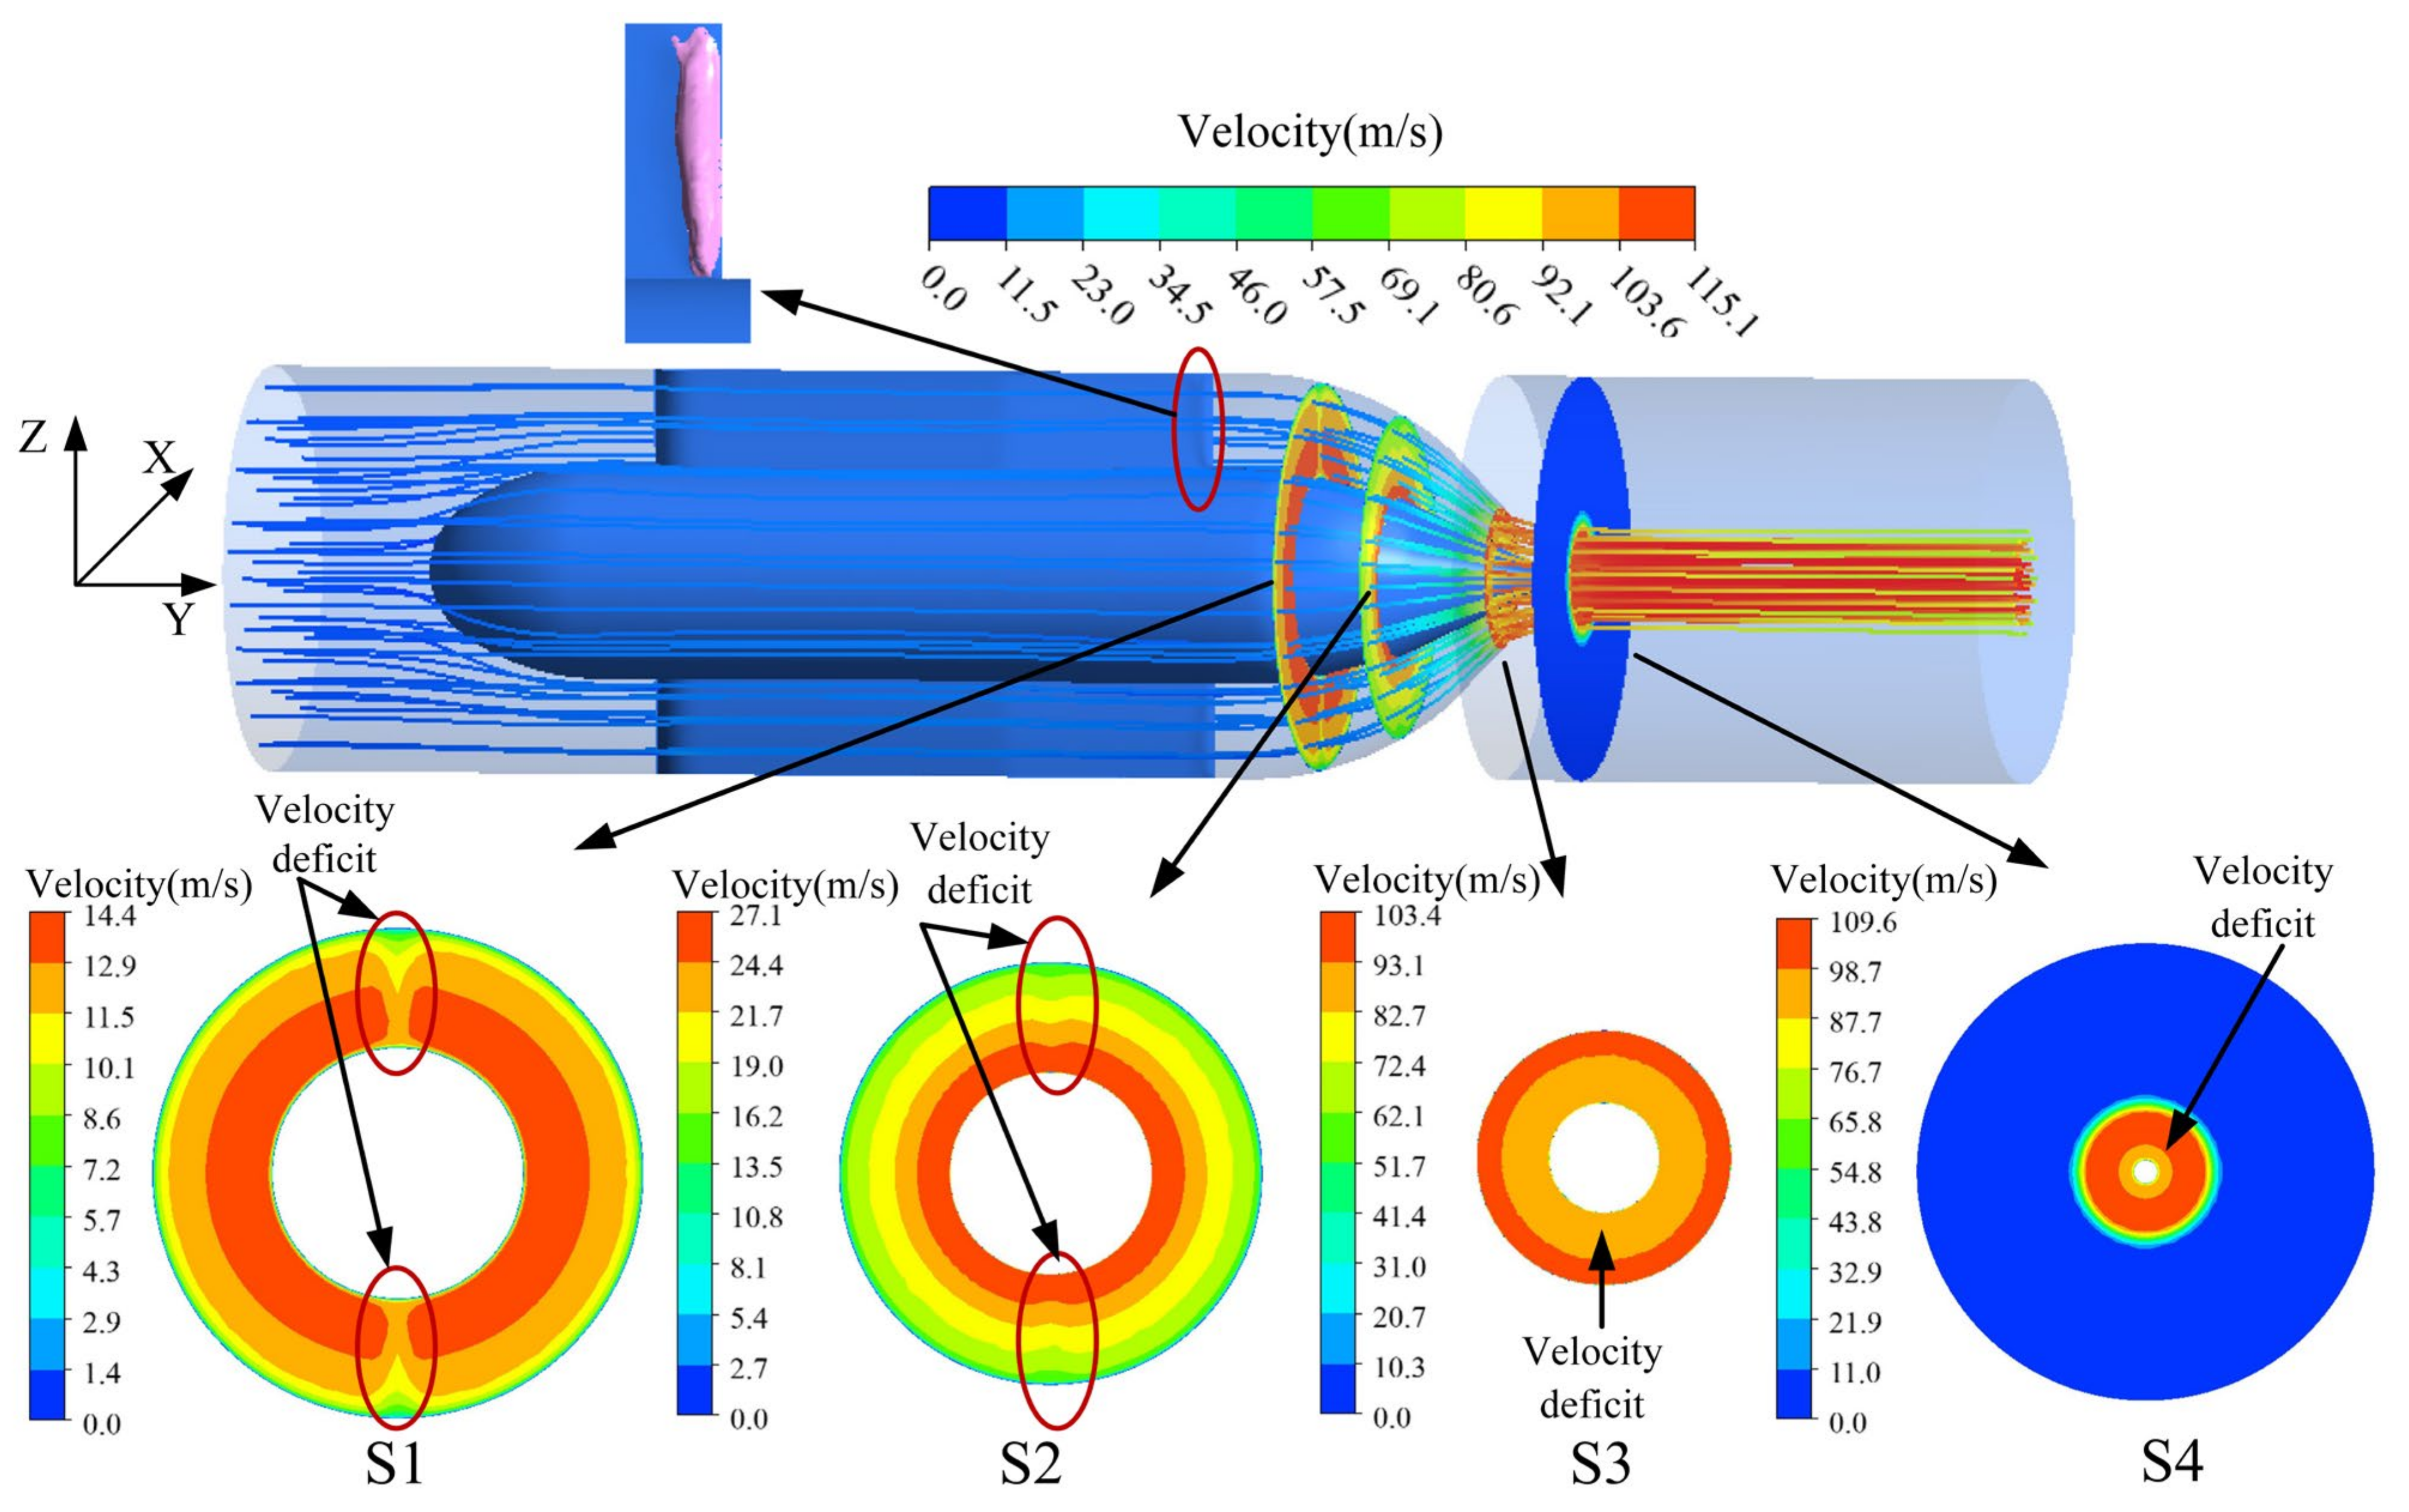
4.2. Analysis of the Velocity Deficit Phenomenon in the Injector

The analysis of the flow field characteristics in the injector revealed a velocity deficit at the end of the needle guide, needle tip, and water–air interface of the cylindrical jet in the injector. Four sections (a, b, c, and d) were uniformly selected from the middle passage between the tail end of the needle guide and section S1. Three sections (e, f, and g) were uniformly selected from the middle passage between sections S2 and S3, and two sections (h and i) were uniformly selected from the middle passage between sections S3 and S4. Velocity values in the X and Z directions in these sections were extracted, and a velocity deficit analysis was performed. The external wall of the needle tube of the injector is defined as the starting point, and the internal wall of the nozzle tube is defined as the end point (Figure 5). For the normalization of the relative positions of various sections, the starting point value is 0, and the end point value is 1.
By comparing the velocity distribution in the X and Z directions of the deflector runner, it can be seen that the velocity deficit phenomenon at the end of the needle guide mainly occurs in the Z direction of the injector (Figure 6), and the velocity deficit rate in the Z direction is larger in the runner at the end of the needle guide. A cross-section was closer to the end of the needle guide, and the velocity deficit phenomenon was more serious compared with the X direction where no velocity deficit occurred. The average value of the velocity deficit was 6.6 m/s. The average velocity deficit in the Z direction was 3.7, 2.8, 2.4, and 2.2 m/s at sections b, c, d, and S1, respectively. As the water moves along the injector, the effect of the vortex trails from the end of the deflector and the velocity of the water diminishes. At the relative position 0.8, the velocity of the water in the flow channel abruptly changes and the rate of reduction in the water velocity increases. This is due to the viscous nature of the water and blocking effect of the boundary layer on the inner wall of the nozzle tube, thus leading to a sudden reduction in the water velocity.
As the injector converts the water flow into a form of energy, the same velocity deficit phenomenon occurs at the tip of the needle tip. The water velocity increases uniformly in the flow path from sections S2 to g (Figure 7). This is the process of converting pressure (potential energy) into velocity (kinetic energy), and the water velocity distribution tends to decrease uniformly along the increasing radius. When water flows from sections g to S3, the trend of change in the distribution of water flow reverses, while the water velocity along the direction of increasing radius continues to increase, which is the needle tip velocity deficit phenomenon. From sections S3 to S4 of the flow channel, the relative position of 0 represents the center of the cylindrical jet; the relative position of 1 represents the water–gas intersection of the cylindrical jet. The relative position is between 0–0.66. It can be observed that the velocity within the cylindrical jet along the radius direction exhibits a gradual increasing trend. At the relative position of 0.66, the velocity is the highest, and the velocity distribution trend takes a sharp turn, exhibiting a downward trend. Sections h, i, and S4 represent the velocity distribution trend inside the cylindrical jet, which indicated that the velocity inside the cylindrical jet first increases steadily, then decreases suddenly and sharply, and does not exhibit a uniform distribution trend. The average velocity of the internal velocity of the cylindrical jet is 111.8 m/s, which meets the power generation requirement of the large Pelton turbine.

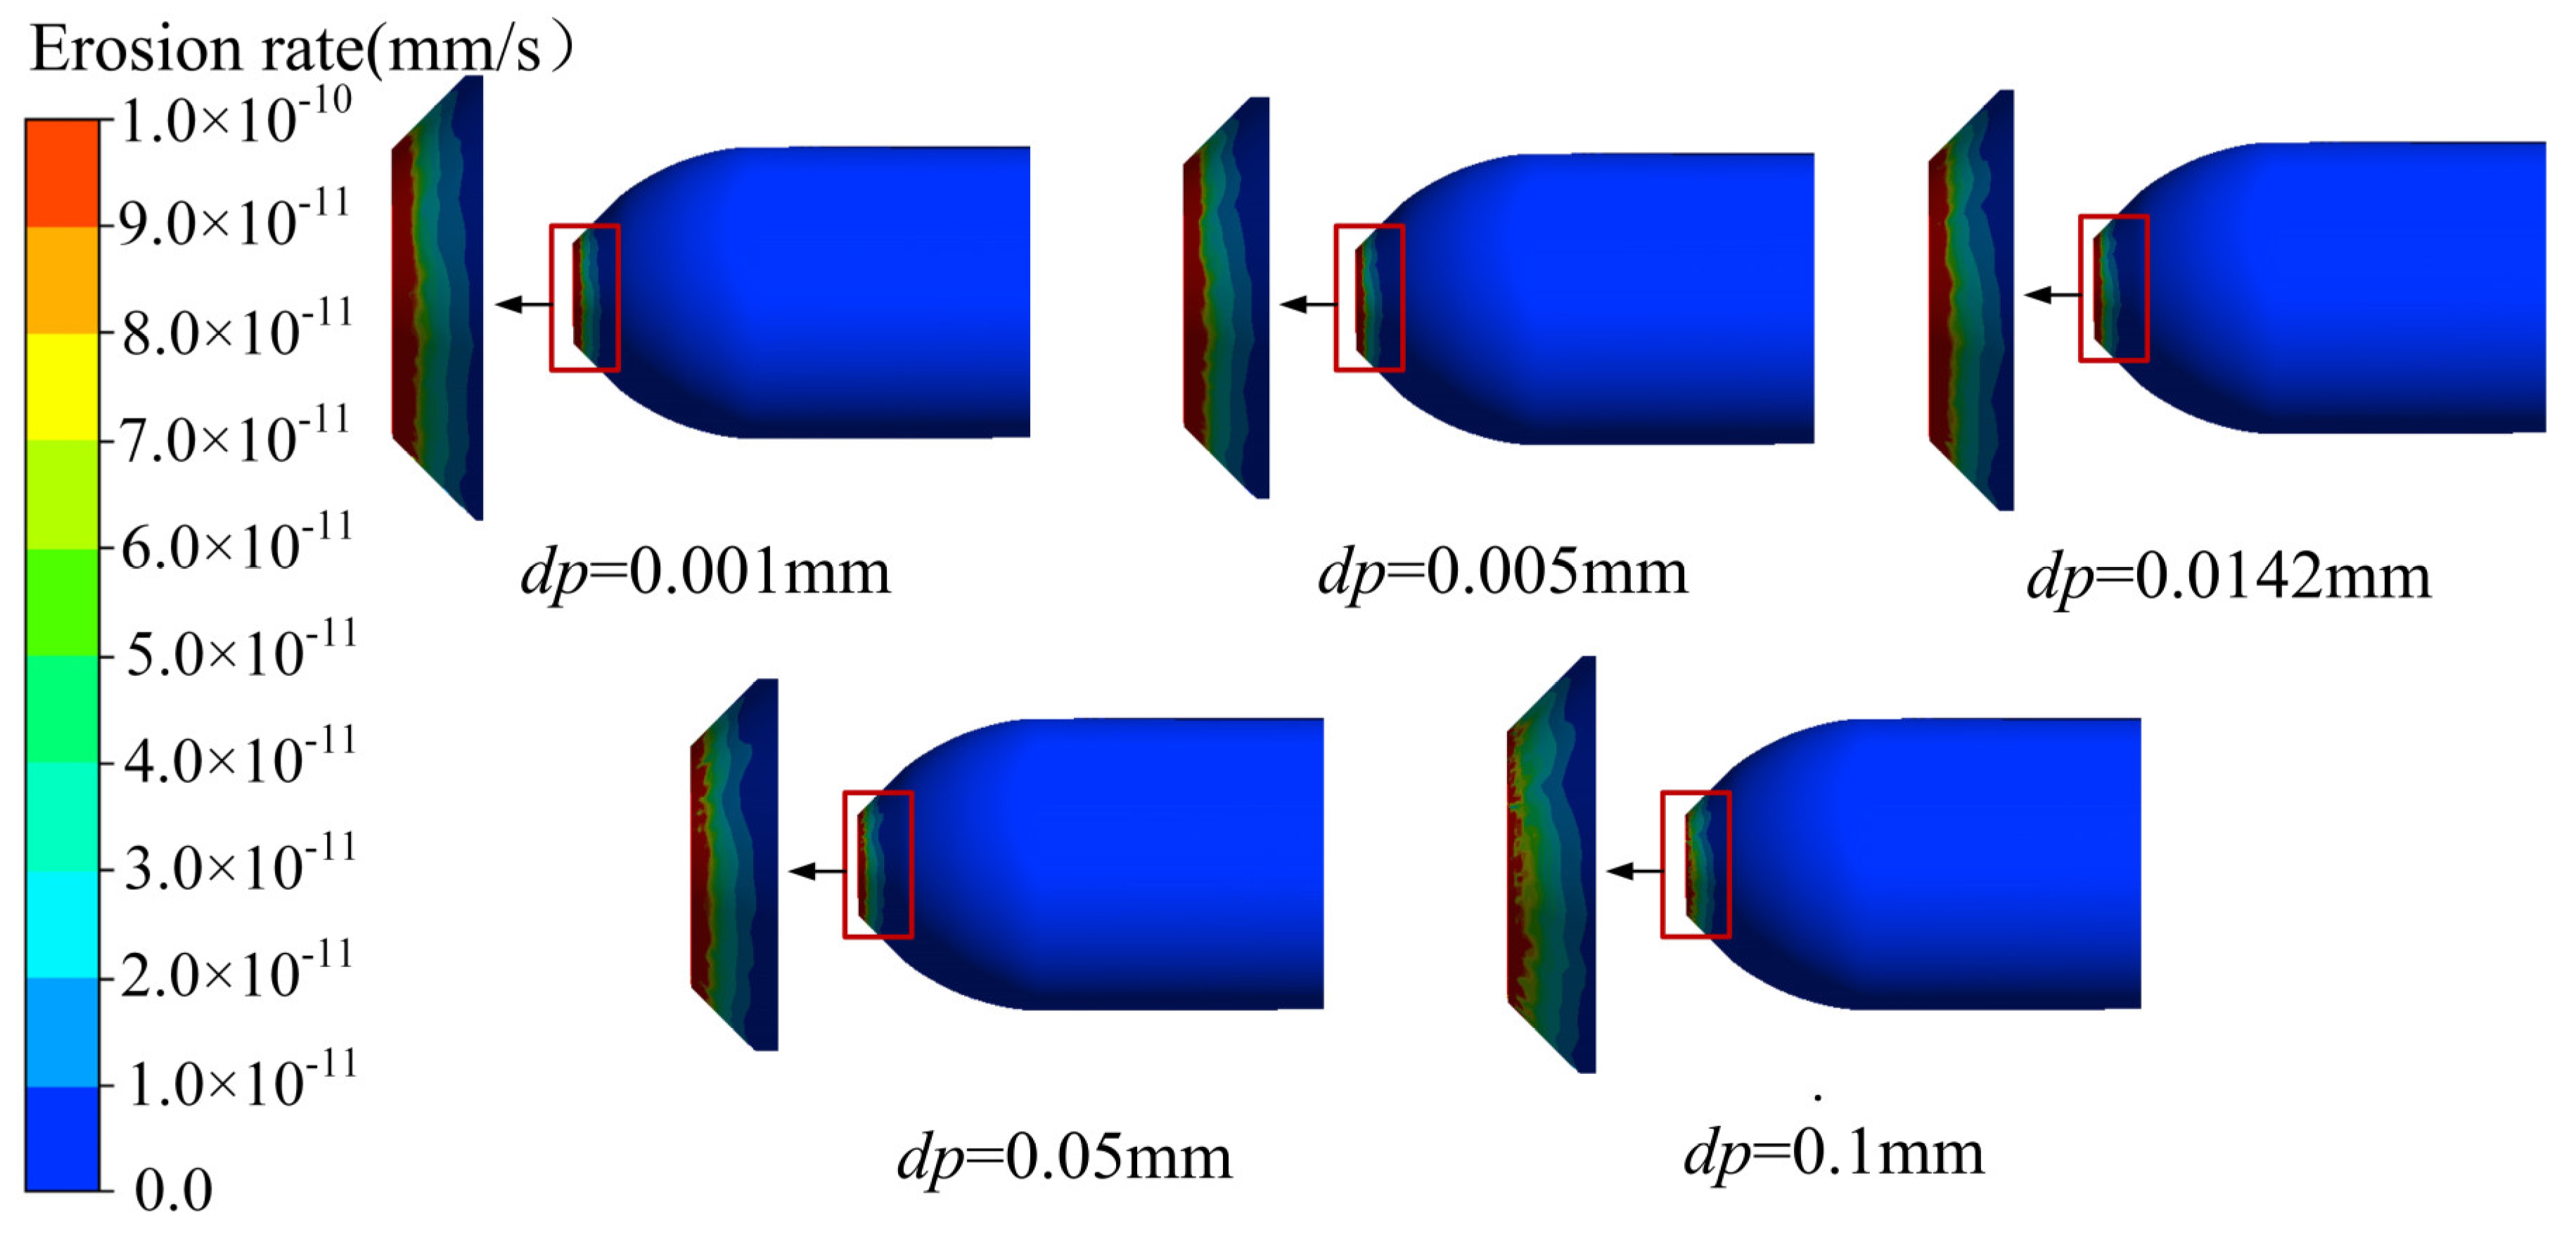
4.3. Effect of Sediment Particle Diameter on the Injector Erosion Analysis

When the sediment and water flow through the cross-sectional contraction annular gap orifice between the needle and nozzle to the atmospheric jet, the flow rate of the sediment and water corresponds to the total water head. The erosion between the needle and the nozzle is in the form of annular gap flow erosion, and the additional kinetic energy of the sediment and the number of effective impacts will increase at the gap. These situations can indicate serious erosion. When the nozzle and needle surface erosion damage increases, roughness increases, and erosion damage is accelerated. The horizontal flow rate along the surface is high in the annular gap of the needle. The gap is small and cannot be fully formed in the vertical part of the sediment velocity. As a result, the sediment in the needle part of the impact angle is small; however, the horizontal micro-cutting ability is large. Therefore, the needle along the direction of the water flow forms a groove-shaped erosion; the nozzle port ring will have obvious signs of erosion. Five different sediment particle diameters [dp = 0.1, 0.05, 0.0142 (median particle size), 0.005, and 0.001 mm] were injected from the inlet of the injector, and the trajectory and erosion characteristics of the sediment particles in the injector were obtained according to the Lagrangian particle trajectory model calculation.
Different sediment particle diameter needle erosion clouds are shown in Figure 8. The erosion in the needle near the inlet part is more serious. This part is more affected by sediment scouring action. Along the flow direction, the erosion gradually weakened. The larger the diameter of the sediment, the more obvious the weakening of the erosion. This is because with the increase in the sediment particle diameter, the flow becomes worse. The sediment particles gradually move away from the surface of the needle, resulting in reduced erosion. In the shrinkage section of the needle, erosion suddenly increased, and with the reduction in the particle diameter, the erosion gradually increased. Because of the reduction in area here, the pressure decreases sharply, resulting in an increase in the speed of the particles and increasing erosion. At the needle tip, due to the centrifugal force, the smaller the sediment particles, the better the flow with the centrifugal force. With the larger diameter of the sediment particles away from the surface of the needle, the smaller diameter of the particles causes mor serious erosion. Due to the influence of gravity and flow characteristics, the erosion of the lower needle guide is greater than the erosion of the upper needle guide. The erosion pattern of the needle rod and the needle guide are grooved, and the erosion of the needle tip is mainly point-like.
Nozzle erosion clouds for different sediment particle diameters are shown in Figure 9. The erosion of the nozzle port ring significantly decreases as the diameter of the sediment particles increases. However, the location of the erosion is very similar. Therefore, the diameter of the sediment particles will have an impact on the erosion rate; however, their impact on the surface erosion range is very small.
The maximum erosion rate of sediment particles of varying diameters is shown in Table 4. The erosion rate of the needle and nozzle port ring increased with the increase in the diameter of the sediment particles, and the erosion rate of the nozzle port ring was more than that of the needle with the same sediment particle diameter. Combining the erosion cloud of the needle and nozzle, it can be observed that the erosion on the surface of the needle is not symmetrical. This is related to the flow characteristics. The change in the size of the sediment particles in the flow is one of the reasons for the asymmetric erosion, whereas the erosion of the nozzle mouth ring exhibits a symmetrical distribution, which is consistent with the prediction model established by Tarodiya Rahul et al. [29,30].
Numerical calculation results indicated that the annual sediment erosion of the nozzle mouth ring and spray needle under the conditions of a sediment content of 0.06 kg/m3 and the dp = 0.0142 mm was 0.767 and 0.243 mm, respectively (1 year of operation). With reference to the erosion assessment standards and profile assessment standards of the Pelton turbine, the sediment erosion of the large Pelton turbine injector was high, and the sediment erosion phenomenon was serious. Long-term operation will lead to a reduction in the jet quality of the injector and reduce the operating life of the unit. Therefore, anti-erosion measures should be taken to address the wear and tear and erosion of the injector.

5. Conclusions

In this study, the solid–liquid two-phase flow model was used to calculate the erosion of the injector of a large Pelton turbine. The Lagrange equation model of particle motion was used to track the sediment particle trajectory and predict erosion with the generic erosion model. The effects of different sediment particle diameters on the erosion rate and erosion location of the injector were compared. The main conclusions were as follows:
(1)
The pressure at the nozzle outlet is minimum. The direction of the pressure gradient changes, and the velocity is maximum. The boundary layer on the surface of the injector causes a velocity deficit, which affects the velocity distribution of the jet and the quality of the jet. Water shoots out of the nozzle, and the maximum jet velocity continues to increase, before decreasing again.
(2)
The sediment particle diameters will affect the erosion of the needle. The smaller the particle size, the more serious the erosion of the needle rod and the head. The erosion of the lower needle guide is more serious than that of the upper needle guide. The erosion of the needle rod and needle guide is groove-shaped. The erosion of the needle is mainly point-like and exhibits asymmetrical distribution.
(3)
The particle size has little effect on the erosion location of the nozzle port ring; however, it has an effect on the erosion amount. The erosion of the nozzle port ring exhibits symmetrical distribution. The erosion of the nozzle port ring is greater than that of the needle with the same sediment particle diameter.
(4)
The sediment erosion of the power station is very serious, and anti-erosion measures are necessary.

Author Contributions

J.L., J.P., Y.H. and H.D. proposed the simulation method; J.L., J.P. and Y.H. completed the numerical simulations; J.P., X.L. and J.L. analyzed the data and wrote the paper. All authors have read and agreed to the published version of the manuscript.

Funding

This research is supported by National key research and development program of China (approval No. 2018YFB0905200), and Hydropower Energy Innovation Capacity Construction Project in Sichuan Province, China (approval No. 2022-510124-04-01-622476).

Data Availability Statement

Not applicable.

Acknowledgments

This research is especially grateful to the National key research and development program of China and Hydropower Energy Innovation Capacity Construction Project in Sichuan Province, China for the funding of the science and technology project, and to Xihua University for their strong support in the theoretical research of the project.

Conflicts of Interest

The authors declare no conflict of interest.

References

  1. Leguizamón, S.; Alimirzazadeh, S.; Jahanbakhsh, E.; Avellan, F. Multiscale simulation of erosive wear in a prototype-scale Pelton runner. Renew. Energy 2020, 151, 204–215. [Google Scholar] [CrossRef]
  2. Liu, X. Hydraulic Turbine Sand and Water Flow and Erosion; Water Conservancy and Hydropower Press: Beijing, China, 2020. [Google Scholar]
  3. Jung, I.H.; Kim, Y.S.; Shin, D.H.; Chung, J.T.; Shin, Y. Influence of spear needle eccentricity on jet quality in micro Pelton turbine for power generation. Energy 2019, 175, 58–65. [Google Scholar] [CrossRef]
  4. Din, M.Z.U.; Harmain, G.A. Assessment of erosive wear of Pelton turbine injector: Nozzle and spear combination–A study of Chenani hydro-power plant. Eng. Fail. Anal. 2020, 116, 104695. [Google Scholar] [CrossRef]
  5. Alomar, O.R.; Abd, H.M.; Salih, M.M.M.; Ali, F.A. Performance analysis of Pelton turbine under different operating conditions: An experimental study. Ain Shams Eng. J. 2022, 13, 101684. [Google Scholar] [CrossRef]
  6. Pang, J.; Liu, H.; Liu, X.; Yang, H.; Peng, Y.; Zeng, Y.; Yu, Z. Study on sediment erosion of high head Francis turbine runner in Minjiang River basin. Renew. Energy 2022, 192, 849–858. [Google Scholar] [CrossRef]
  7. Zhong, Q.; Lai, X.; You, Q. Study of nozzle flow characteristics of impact turbine and its large fluctuation transition process. Hydroelectr. Energy Sci. 2012, 30, 130–132. [Google Scholar]
  8. Zeng, C.; Xiao, Y.; Wang, Z.; Zhang, J.; Luo, Y. Numerical analysis of a Pelton bucket free surface sheet flow and dynamic performance affected by operating head. Proc. Inst. Mech. Eng. Part A J. Power Energy 2017, 231, 182–196. [Google Scholar] [CrossRef]
  9. Zeng, C.; Xiao, Y.; Luo, Y.; Zhang, J.; Wang, Z.; Fan, H.; Ahn, S.-H. Hydraulic performance prediction of a prototype four-nozzle Pelton turbine by entire flow path simulation. Renew. Energy 2018, 125, 270–282. [Google Scholar] [CrossRef]
  10. Han, L.; Zhang, G.F.; Wang, Y.; Wei, X. Investigation of erosion influence in distribution system and nozzle structure of pelton turbine. Renew. Energy 2021, 178, 1119–1128. [Google Scholar] [CrossRef]
  11. Han, L.; Duan, X.L.; Gong, R.Z.; Zhang, G.; Wang, H.; Wei, X. Physic of secondary flow phenomenon in distributor and bifurcation pipe of Pelton turbine. Renew. Energy 2019, 131, 159–167. [Google Scholar] [CrossRef]
  12. Petley, S.; Židonis, A.; Panagiotopoulos, A.; Benzon, D.; Aggidis, G.A.; Anagnostopoulos, J.S.; Papantonis, D.E. Out with the old, in with the new: Pelton hydro turbine performance influence utilizing three different injector geometries. J. Fluids Eng. 2019, 141, e08527. [Google Scholar] [CrossRef]
  13. Finnie, I. Erosion of surfaces by solid particle. Wear 1960, 3, 87–103. [Google Scholar] [CrossRef]
  14. Grant, G.; Tabakoff, W. Erosion prediction in turbo machinery resulting from environmental solid particles. J. Aircr. 1975, 12, 471–478. [Google Scholar] [CrossRef]
  15. Oka, Y.I.; Okamura, K.; Yoshida, T. Practical estimation of erosion damage caused by solid particle impact. Wear 2005, 259, 95–101. [Google Scholar] [CrossRef]
  16. Karimi, S.; Shirazi, S.A.; Mclaury, B.S. Predicting fine particle erosion utilizing computational fluid dynamics. Wear 2017, 376, 1130–1137. [Google Scholar] [CrossRef]
  17. Rai, A.K.; Kumar, A.; Staubli, T. Analytical modelling and mechanism of hydro-abrasive erosion in pelton buckets. Wear 2019, 436, 203003. [Google Scholar] [CrossRef]
  18. Rai, A.K.; Kumar, A.; Staubli, T. Effect of concentration and size of sediments on hydro-abrasive erosion of Pelton turbine. Renew. Energy 2020, 145, 893–902. [Google Scholar] [CrossRef]
  19. Guo, B.; Xiao, Y.; Rai, A.K.; Zhang, J.; Liang, Q. Sediment-laden flow and erosion modeling in a Pelton turbine injector. Renew. Energy 2020, 162, 30–42. [Google Scholar] [CrossRef]
  20. Guo, B.; Xiao, Y.; Rai, A.K.; Liang, Q.; Liu, J. Analysis of the air-water-sediment flow behavior in Pelton buckets using a Eulerian-Lagrangian approach. Energy 2021, 218, 119522. [Google Scholar] [CrossRef]
  21. Xiao, Y.; Guo, B.; Rai, A.K.; Liu, J.; Liang, Q.; Zhang, J. Analysis of hydro-abrasive erosion in Pelton buckets using a Eulerian-Lagrangian approach. Renew. Energy 2022, 197, 472–485. [Google Scholar] [CrossRef]
  22. Ge, X.; Sun, J.; Li, Y.; Zhang, L.; Deng, C.; Wang, J. Erosion Characteristics of Sediment Diameter and Concentration on the Runner of Pelton Turbines. Proc. CSEE 2021, 197, 5025–5033. [Google Scholar]
  23. Ge, X.; Sun, J.; Zhou, Y.; Cai, J.; Zhang, H.; Zhang, L.; Ding, M.; Deng, C.; Binama, M.; Zheng, Y. Experimental and numerical studies on opening and velocity influence on sediment erosion of Pelton turbine buckets. Renew. Energy 2021, 173, 1040–1056. [Google Scholar] [CrossRef]
  24. Ge, X.; Sun, J.; Li, Y.; Wu, D.; Zhang, L.; Hua, H. Numerical simulation of sediment wear characteristics of an impact turbine injector. J. Water Resour. 2020, 51, 1486–1494. [Google Scholar]
  25. Pang, J.; Liu, H.; Liu, X.; Ren, M.; Zhang, P.; Yu, Z. Analysis on the escape phenomenon of oil mist from turbine lower guide bearing based on VOF model. Adv. Mech. Eng. 2021, 13. [Google Scholar] [CrossRef]
  26. Pang, J.; Zhang, H.; Yang, J.; Chen, Y.; Liu, X.B. Numerical and experimental study on sediment erosion of Francis turbine runner for hydropower stations. Chin. J. Hydrodyn. 2020, 35, 436–443. [Google Scholar]
  27. Bajracharya, T.R.; Acharya, B.; Joshi, C.B.; Saini, R.; Dahlhaug, O.G. Sand erosion of Pelton turbine nozzles and buckets: A case study of Chilime Hydropower Plant. Wear 2008, 264, 177–184. [Google Scholar] [CrossRef]
  28. Zhang, H. Pelton Turbine; Springer: Berlin/Heidelberg, Germany, 2016. [Google Scholar]
  29. Tarodiya, R.; Khullar, S.; Levy, A. Particulate flow and erosion modeling of a Pelton turbine injector using CFD-DEM simulations. Powder Technol. 2022, 399, 117168. [Google Scholar] [CrossRef]
  30. Tarodiya, R.; Khullar, S.; Levy, A. Assessment of erosive wear performance of Pelton turbine injectors using CFD-DEM simulations. Powder Technol. 2022, 408, 117763. [Google Scholar] [CrossRef]
Figure 1. Pelton turbine injector and computational domain grid model.
Processes 11 01011 g001
Figure 2. Grid-independence verification.
Processes 11 01011 g002
Figure 3. Flow field cloud in the injector.
Processes 11 01011 g003
Figure 4. Flow line diagram and 4 cross-sectional velocity clouds.
Processes 11 01011 g004
Figure 5. Schematic diagram of the relative positions of the cross-sections of the injector.
Processes 11 01011 g005
Figure 6. Velocity distribution of the flow path from the tail end of the deflector to the S1 section.
Processes 11 01011 g006
Figure 7. Velocity distribution of cross-sectional flow paths S2 to S4.
Processes 11 01011 g007
Figure 8. Erosion patterns of needles with different sediment particle diameters.
Processes 11 01011 g008
Figure 9. Erosion patterns of nozzles with different sediment particle diameters.
Processes 11 01011 g009
Table 1. Definition of impact angle function.
PointAngleValue
100
2200.8
3301
4450.5
5900.4
Table 2. Design parameters of the Pelton turbine injector.
NameNozzle Inlet Diameter/mmNozzle Outlet Diameter/mmNeedle Stroke/mmNumber of Needle Guide/Number
Parameter1502518316.32
Table 3. Different grid number schemes.
Option1234
Numbers of grid cells445,814800,1211,788,1492,288,892
Table 4. Maximum erosion rates for different sediment particle diameters.
Sediment Particle Diameter dp (mm)Needle Maximum Erosion Rate Ren (mm/s)Nozzle Maximum Erosion Rate Res (mm/s)
0.0013.243 × 10−87.718 × 10⁻⁸
0.0051.57 × 10−84.454 × 10⁻⁸
0.01427.701 × 10−92.432 × 10⁻⁸
0.054.761 × 10−91.064 × 10⁻⁸
0.12.832 × 10−99.837 × 10⁻⁹
Disclaimer/Publisher’s Note: The statements, opinions and data contained in all publications are solely those of the individual author(s) and contributor(s) and not of MDPI and/or the editor(s). MDPI and/or the editor(s) disclaim responsibility for any injury to people or property resulting from any ideas, methods, instructions or products referred to in the content.

