Article

Effect of Formation Pressure on Pore Structure Evolution and Hydrocarbon Expulsion in Organic-Rich Marine Shale

1
School of Energy Resources, China University of Geosciences, Beijing 100083, China
2
Coal Reservoir Laboratory of National Engineering Research Center of CBM Development & Utilization, China University of Geosciences, Beijing 100083, China
3
Department of Earth and Environmental Sciences, The University of Texas, Arlington, TX 76019, USA
*
Authors to whom correspondence should be addressed.
Processes 2023, 11(4), 1007; https://doi.org/10.3390/pr11041007
Submission received: 26 February 2023 / Revised: 19 March 2023 / Accepted: 24 March 2023 / Published: 27 March 2023
(This article belongs to the Special Issue Physical, Chemical and Biological Processes in Energy Geoscience)

Abstract

:
Exploring the relationship between formation pressure and shale pore evolution is helpful for the enrichment and development of marine shale gas accumulation theory. The thermal evolution experiment was carried out on the Xiamaling Formation (Pr3x) lowly matured marine shale, which has a similar sedimentary environment to the Longmaxi Formation (S1l) highly matured marine shale. Comparative experiments of open and semi-closed pyrolysis and multiple pore structure characterization techniques, including CO2 and N2 physisorption, mercury intrusion porosimetry, and field emission scanning electron microscopy, were conducted. The marine shale pore evolutionary model under formation pressure is proposed by characterizing pore evolution, and hydrocarbon expulsion and retention for shales under and without formation fluid pressures. The results show that the existence of formation pressure increases the percentage of quartz and reduces the content of clay minerals. The change in formation pressure has no obvious effect on the maturity evolution of shale samples. With the increase of formation pressure, the pore morphology of shale gradually changes from narrow slit pores to ink bottle-shaped pores. The retained hydrocarbons in shale mainly occupy the mesopore space, and the existence of formation pressure promotes hydrocarbon expulsion, especially the hydrocarbon expulsion in the mesopore. In addition, formation pressure improves pore connectivity, especially in the high-over mature stage of shale. With the increase of formation pressure, the micropore volume decreases slightly, the mesopore volume increases significantly, and the macropore volume changes have two stages.

1. Introduction

China has huge shale gas reserves, and the marine shale of the Longmaxi Formation in South China has a large thickness and high organic content, which contributes to high gas production [1,2,3]. In recent years, increasing attention on deep fossil energy, and especially shale oil and gas exploration, have raised concerns regarding pore evolution as well as hydrocarbon retention in organic-rich shales [4,5,6]. Therefore, it is necessary to investigate pore evolution, gas occurrence, and the diagenetic evolution mechanism of organic-rich marine shale reservoirs [7,8,9,10]. In the process of shale thermal maturity evolution, the variation of pore structure directly influences the flow and transport capacity of shale oil and gas [11,12,13,14]. Thus, it is vital to research the pore structure evolution characteristics of shale after being influenced by high temperatures and high pressures. The storage system in shales consists of organic matter (OM) pores, mineral pores, and micro-fractures, which can be divided into three categories according to the aperture range, according to the IUPAC classification: micropore (<2 nm), mesopore (2–50 nm), and macropore (>50 nm) [15]. Pore characterization methods of shale can be divided into two categories: quantitative analysis methods and morphological visualization methods. Quantitative analysis methods can be used to obtain pore structure parameters, such as pore volume (PV), specific surface area (SSA) and pore size distribution (PSD), which includes CO2/N2 gas adsorption [16,17], mercury intrusion porosimetry (MIP) [1], nuclear magnetic resonance (NMR) [18], small-angle neutron scattering (SANS) [19], and small-angle X-ray scattering (SAXS) [20]. Morphological visualization methods are used for the intuitive description of the shape, size, number, and distribution of pores and fractures, and includes a series of analysis techniques, including scanning electron microscope (e.g., FE-SEM, FIB-SEM and HIM) [21], atomic force microscopy (AFM) [22], transmission electron microscope (TEM) [23] and X-ray computed tomography (CT) [11]. The applicability of characterization methods is different. Therefore, multiple testing methods should be integrated to obtain a full-scale of pore parameter.
The key factors influencing the pore evolution of shale include thermal evolution, organic matter type, TOC, mineral and chemical composition, compaction, and burial depth [5,24,25,26,27]. Thermal maturity is one of the most controlling factors for pore evolution and the production of gaseous and liquid hydrocarbon in shales [5,6,8,25]. Recently, various experimental research on shale evolution was carried out under different conditions, such as electromagnetic radiation [28], pyrolytic inert and oxic environments [29], high-temperature water vapor [6], pyrolysis under formation pressure [2,30], pyrolysis under effective stress conditions [12], convection and conduction heating [31], and microwave heating [32]. According to system openness, shale thermal evolution experiments can be divided into three categories: open system, semi-closed system, and closed system [33].
There have been few comparative studies on these experimental results. Zhang et al. [34] studied the influencing factors of lacustrine shale pore evolution by conducting a comparative experiment between closed and semi-closed system pyrolysis, and it was found that in the semi-closed system, a large number of pre-oil and hydrocarbons are discharged periodically, which is conducive to the development of organic pores. Zhao et al. [6] investigated the pore structure and seepage characteristics at different temperatures using oil shale pyrolysis by water vapor injection and found that the increase in pore volume due to pyrolysis temperatures mainly affected pores ranging from 10 nm to 100 nm and occurred in the specific temperature range (400 °C to 425 °C). Gao et al. [5] studied the pore structure evolution characteristics of continental shale in China through open system pyrolysis, and found that the filling of pores by oil generated at a lower temperature resulted in the reduction of the volume of macropores in shale samples, and these filled macropores were released through the thermal cracking of oil at a higher temperature. Song et al. [35] carried out a semi-closed thermal evolution experiment to study pore evolution characteristics at different temperatures by controlling lithostatic pressure and formation pressure, and found that evolutionary scenarios of nanopores can be divided into three stages with the increasing of pyrolysis temperature, including pore decreasing, increasing, and transforming stages. Zhao et al. [6] studied the pore evolution characteristics of shale under high temperature fluid without involving fluid pressure, and it was found that the seepage channel formed at 450 °C, and the best pore connectivity was at 550 °C;. Li et al. [12] studied the relationship between the permeability of marine shale and temperature and fluid pressure, and found that the apparent permeability decreased approximately linearly with the increase of pore pressure and temperature. Shao et al. [30] studied the effects of pressure on gas generation and pore evolution in shale using gold-tube pyrolysis, and indicated that high pressure inhibits residual oil cracking but simultaneously favors the generation of methane-rich gas. Geng et al. [11] conducted a pyrolysis experiment under the coupled effect of temperature and pressure, and reported that the pores and fractures in shale developed increasingly with both the temperature and pressure increasing. However, these studies do not systematically investigate the effect of formation pressure on pore structure evolution and hydrocarbon expulsion, nor clarified the differences in pore evolution with or without formation pressure.
Most of the marine shales in the Sichuan Basin are of high maturity. The low maturity Xiamaling Formation (Pr3x) marine shales from northern China have a similar sedimentary environment to the high maturity Longmaxi Formation (S1l) marine shale, and thus they were selected to conduct thermal evolution experiments. In this work, a comparative experiment of open and semi-closed pyrolysis experiments was carried out, and the pore structure of the solid product was characterized to study the thermal evolution, hydrocarbon expulsion and retention, and pore evolution characteristics of shale with and without formation fluid pressure. Meanwhile, the development models of shale pores under formation pressure are proposed. This research is helpful for the enrichment and development of marine shale gas accumulation theory.

2. Samples and Methodology

2.1. Sample Preparation and Basic Information

An organic-rich and immature shale sample with a total organic carbon (TOC) of 5.74% and an equivalent vitrinite reflectance (EqVRo) of 0.67% was collected from the Neoproterozoic Xiamaling Formation (Pr3x) in Xiahuayuan region of northern China. Before the tests, samples were crushed into small blocks with a size of 1–2 cm. Then the samples were evenly divided into fifteen parts after being mixed to minimize sample errors. One was used for basic analysis (Ro, XRD, and geochemical analysis), seven were used to carry out open-system pyrolysis, and the remaining parts were used for semi-closed thermo-compression pyrolysis experiments. The same experimental temperature points were selected for the pyrolysis experiments of the open and semi-open systems, and the only difference was whether there was formation pressure or not. After the pyrolysis experiments, all of the solid products from the two contrast experiments were provided for Ro, XRD, TOC, geochemical analysis, and pore characterization experiments (including CO2 and N2 adsorption), MIP, and FE-SEM.

2.2. Thermal Evolution Contrast Experiments

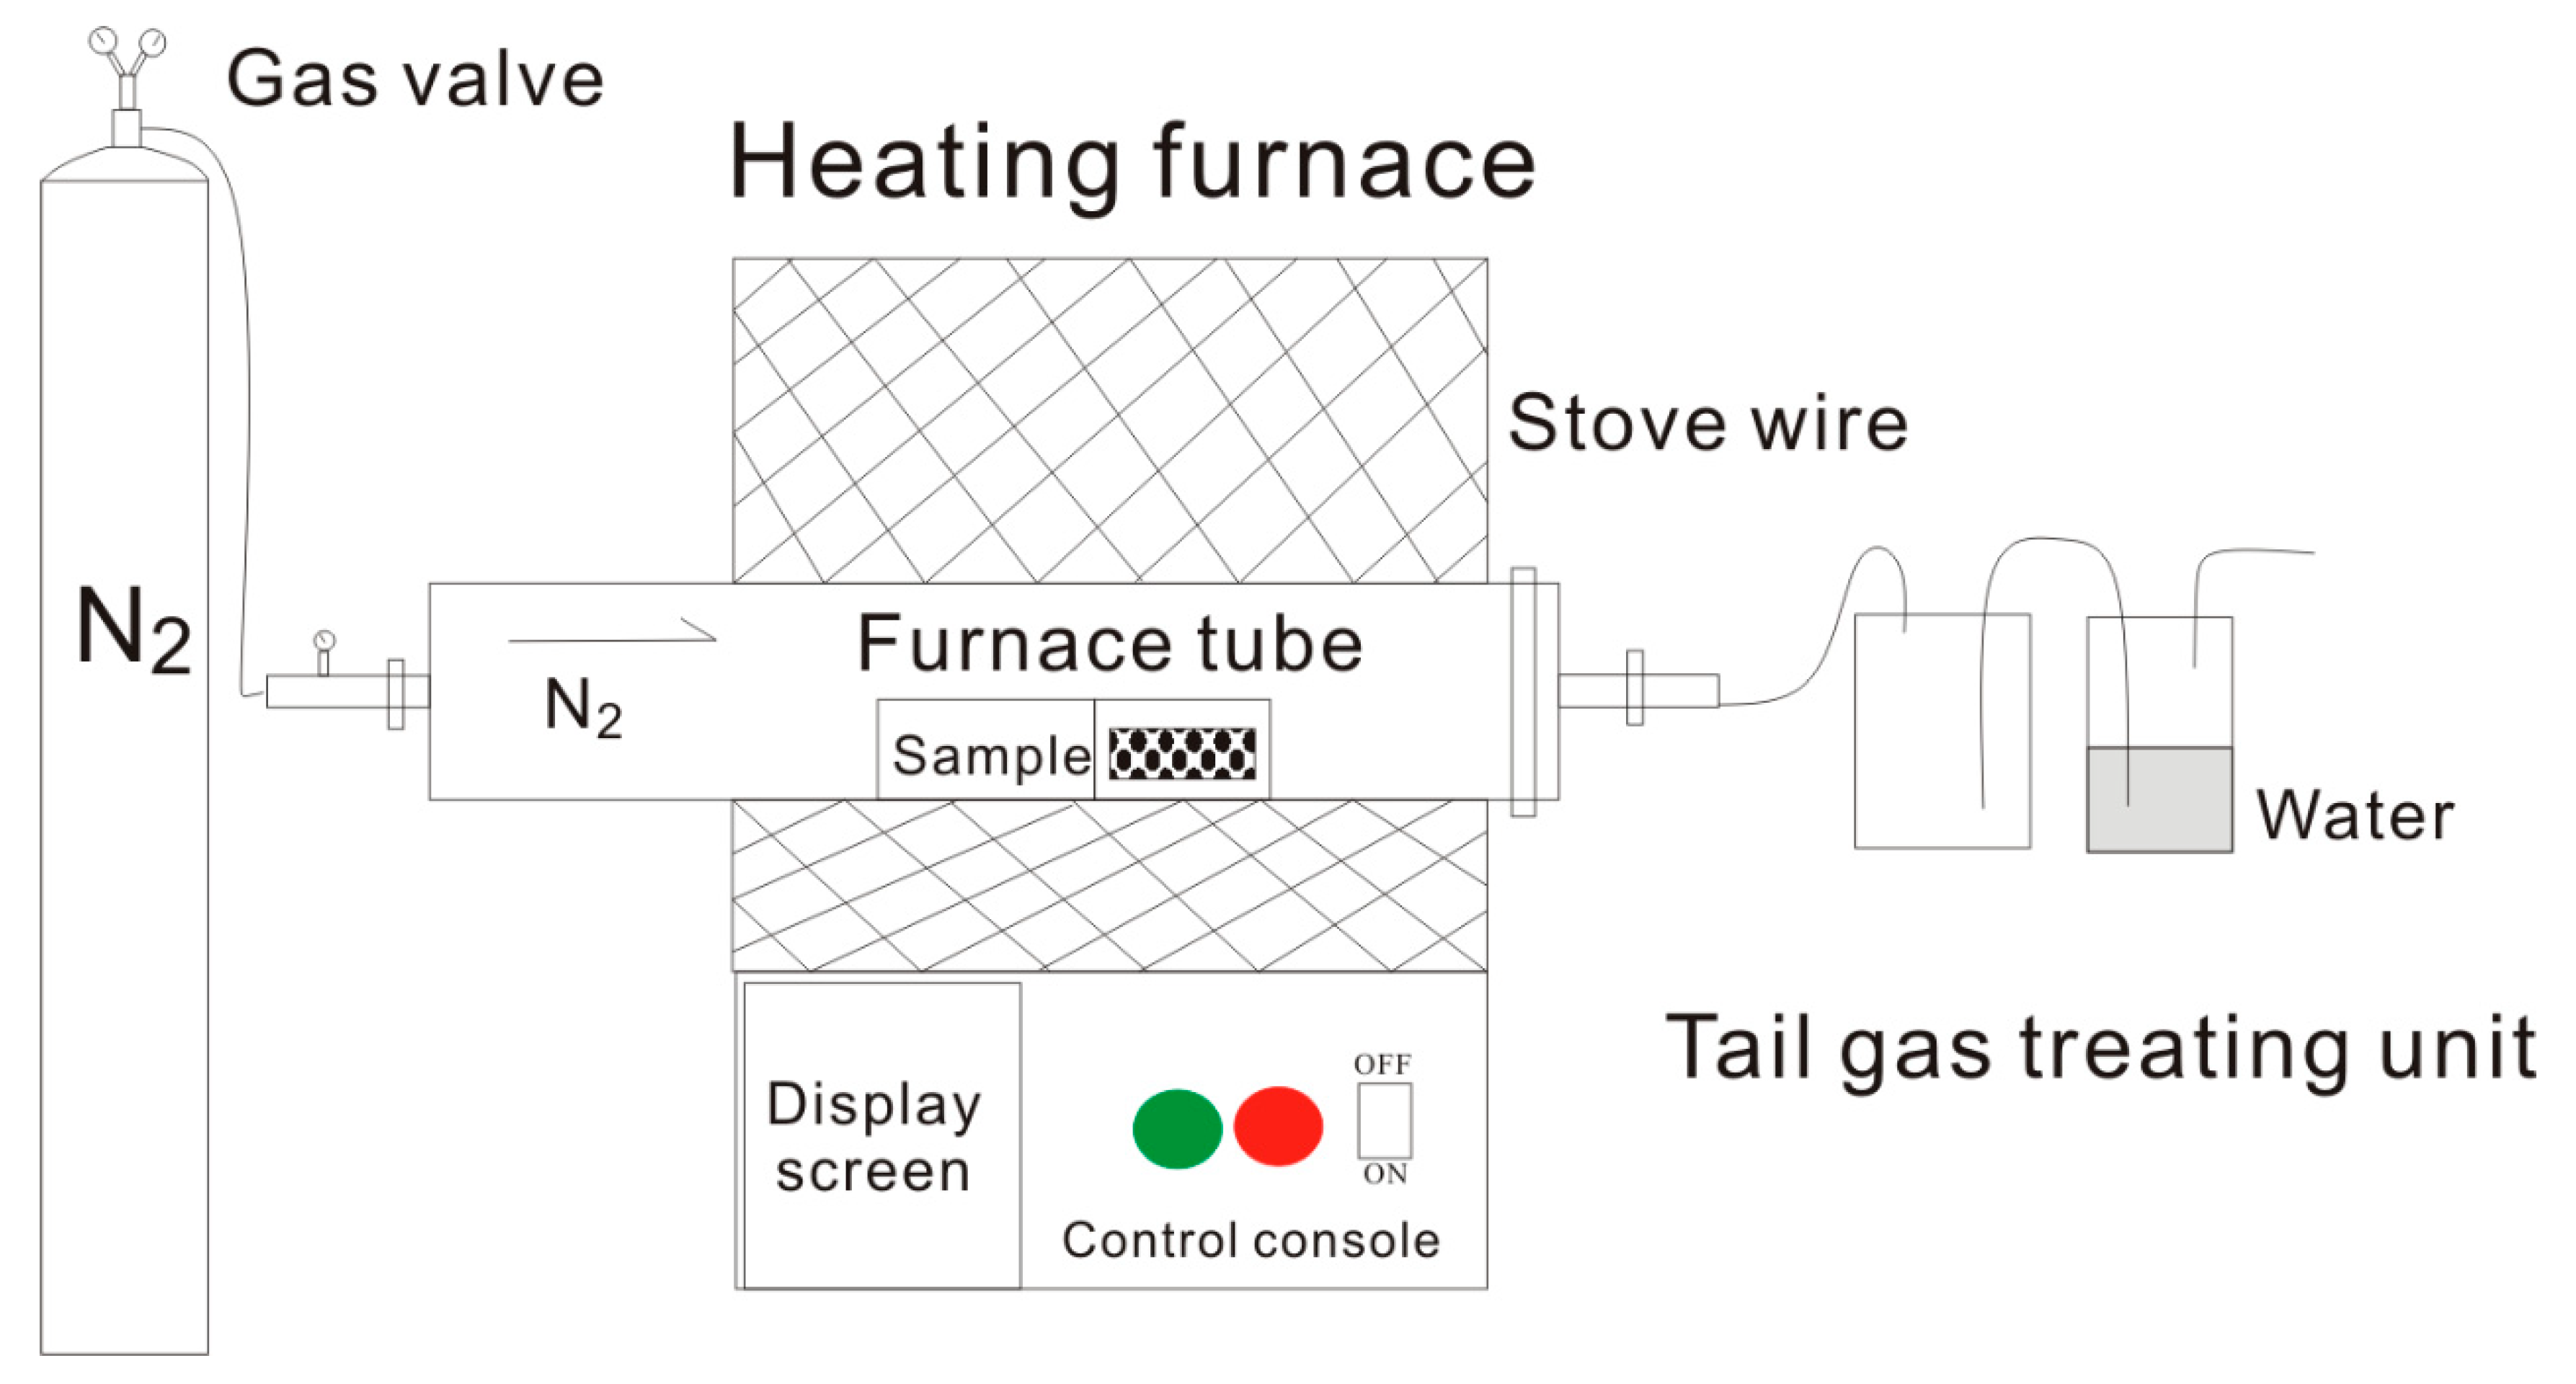
2.2.1. Open System Thermal Evolution Experiments

According to the principle of time-temperature compensation [36], a series of high temperatures with short time can simulate the long-time and low-temperature geological process [37]. In this research, the open system pyrolysis experiments were conducted using an OTF-1200X high-temperature pyrolysis simulator, as shown in Figure 1. The open system pyrolysis instrument contains a control system, reaction system with a furnace tube, heating system, gas supplement system that provided N2, and a tail gas treating unit. Seven paired low-mature Longmaxi shale samples were selected for thermal evolution experiments at 300 °C, 350 °C, 400 °C, 450 °C, 500 °C, 550 °C, and 600 °C (Table 1). Each sample was heated to a preset experimental temperature with a constant rising rate of 5 °C/min, after which they remained at a constant temperature for 72 h.

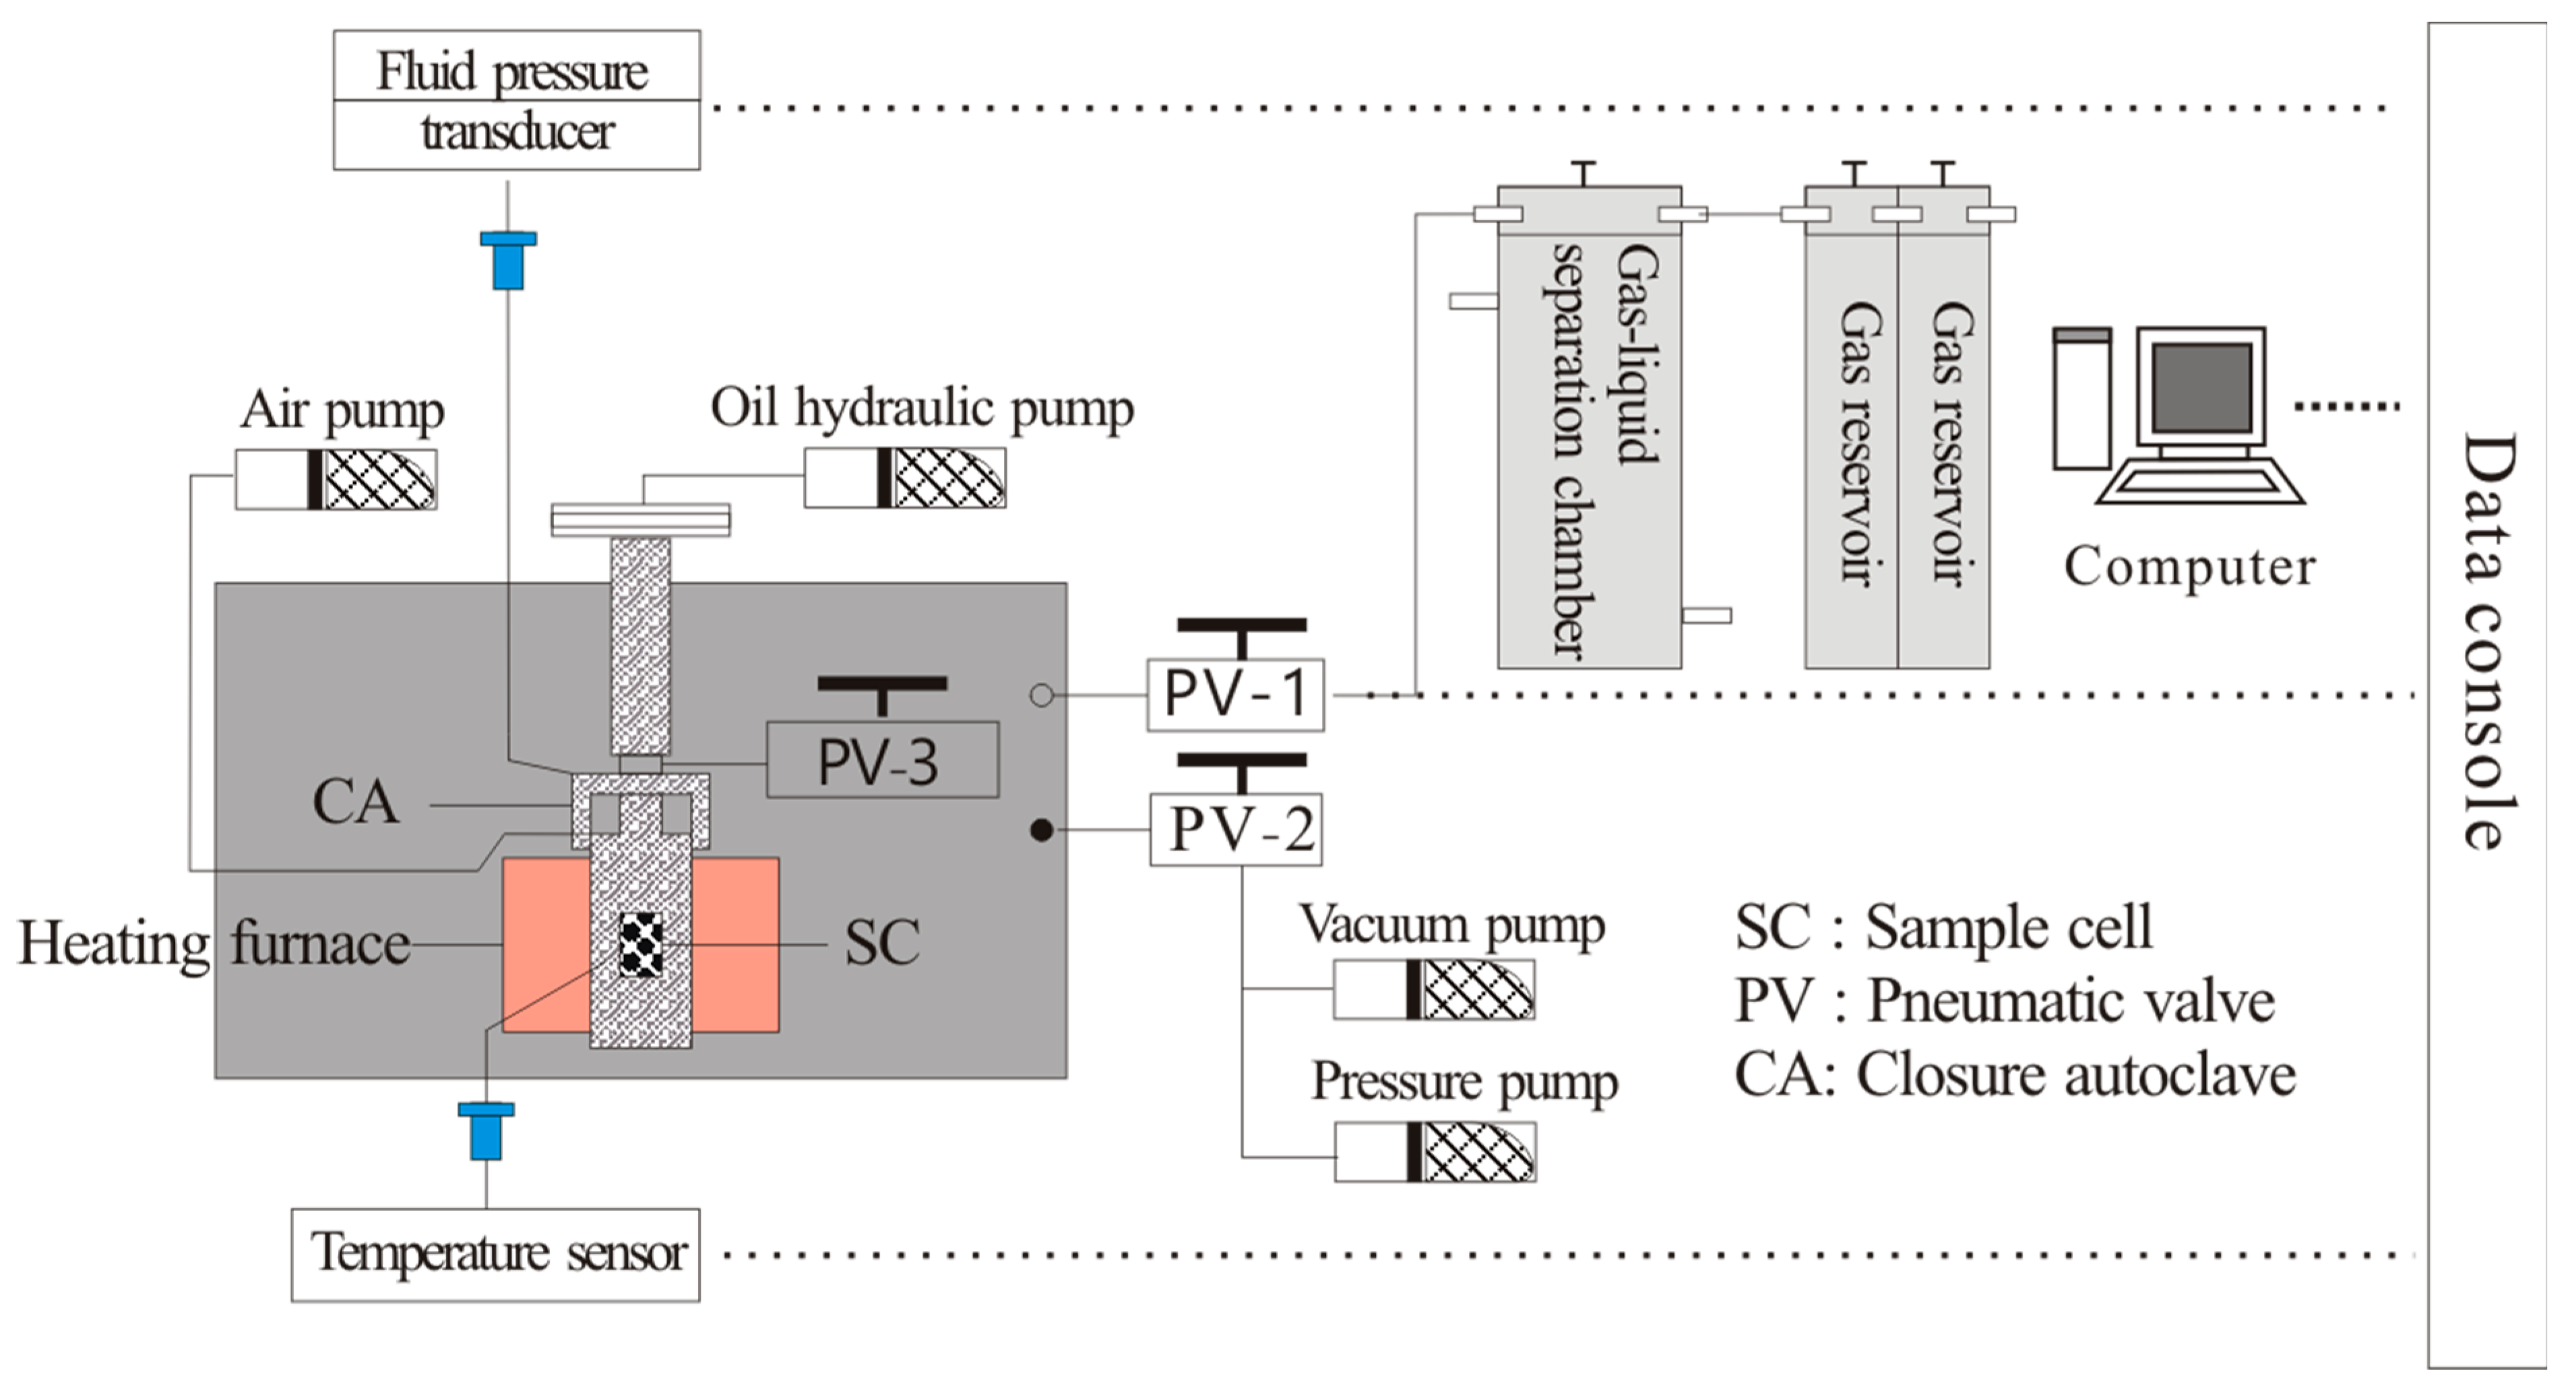
2.2.2. Thermocompression Pyrolysis Experiments

The semi-closed thermocompression pyrolysis experiments were carried out using HXHTST-II and HXSRDE-II high-pressure pyrolysis and diagenetic evolution simulators. As shown in Figure 2, the semi-closed pyrolysis system includes six parts: heating system, fluid supplement system, reaction system, hydraulic control system, software control system, and collecting system [24,38]. The same low-mature marine shale samples that were used for open system pyrolysis were used for semi-closed thermocompression pyrolysis under formation pressure and lithostatic pressure corresponding to seven temperature points (Table 1). The lithostatic pressure and formation pressure were set as the burial and evolution conditions of organic-rich Longmaxi Formation marine shales from the eastern Sichuan Basin of southern China. Each sample was heated to a preset experimental temperature with a constant rising rate of 5 °C/min, after which they were kept at a constant temperature for 72 h.

2.3. Methodologies for Pore Structure Characteristic

Morphological characteristics of micro-nano pores in shales were performed by FESEM. The tests were carried out using the MERLIN FESEM system. Integrated MIP, and N2 and CO2 adsorption methods were employed to quantify the pore volumes (PV), surface area (SA), and pore size distribution (PSD) for full-scale pore sizes. Tests for CO2 physisorption were used to determine pore data of micropores (<2 nm), N2 physisorption was adopted to detect the pore structure parameter of mesopores (2–50 nm), and MIP measurements were carried out to obtain the pore date of macropores (>50 nm) [16,17,39]. The experimental methods were carefully described in our previous works [16,21,40].

3. Results

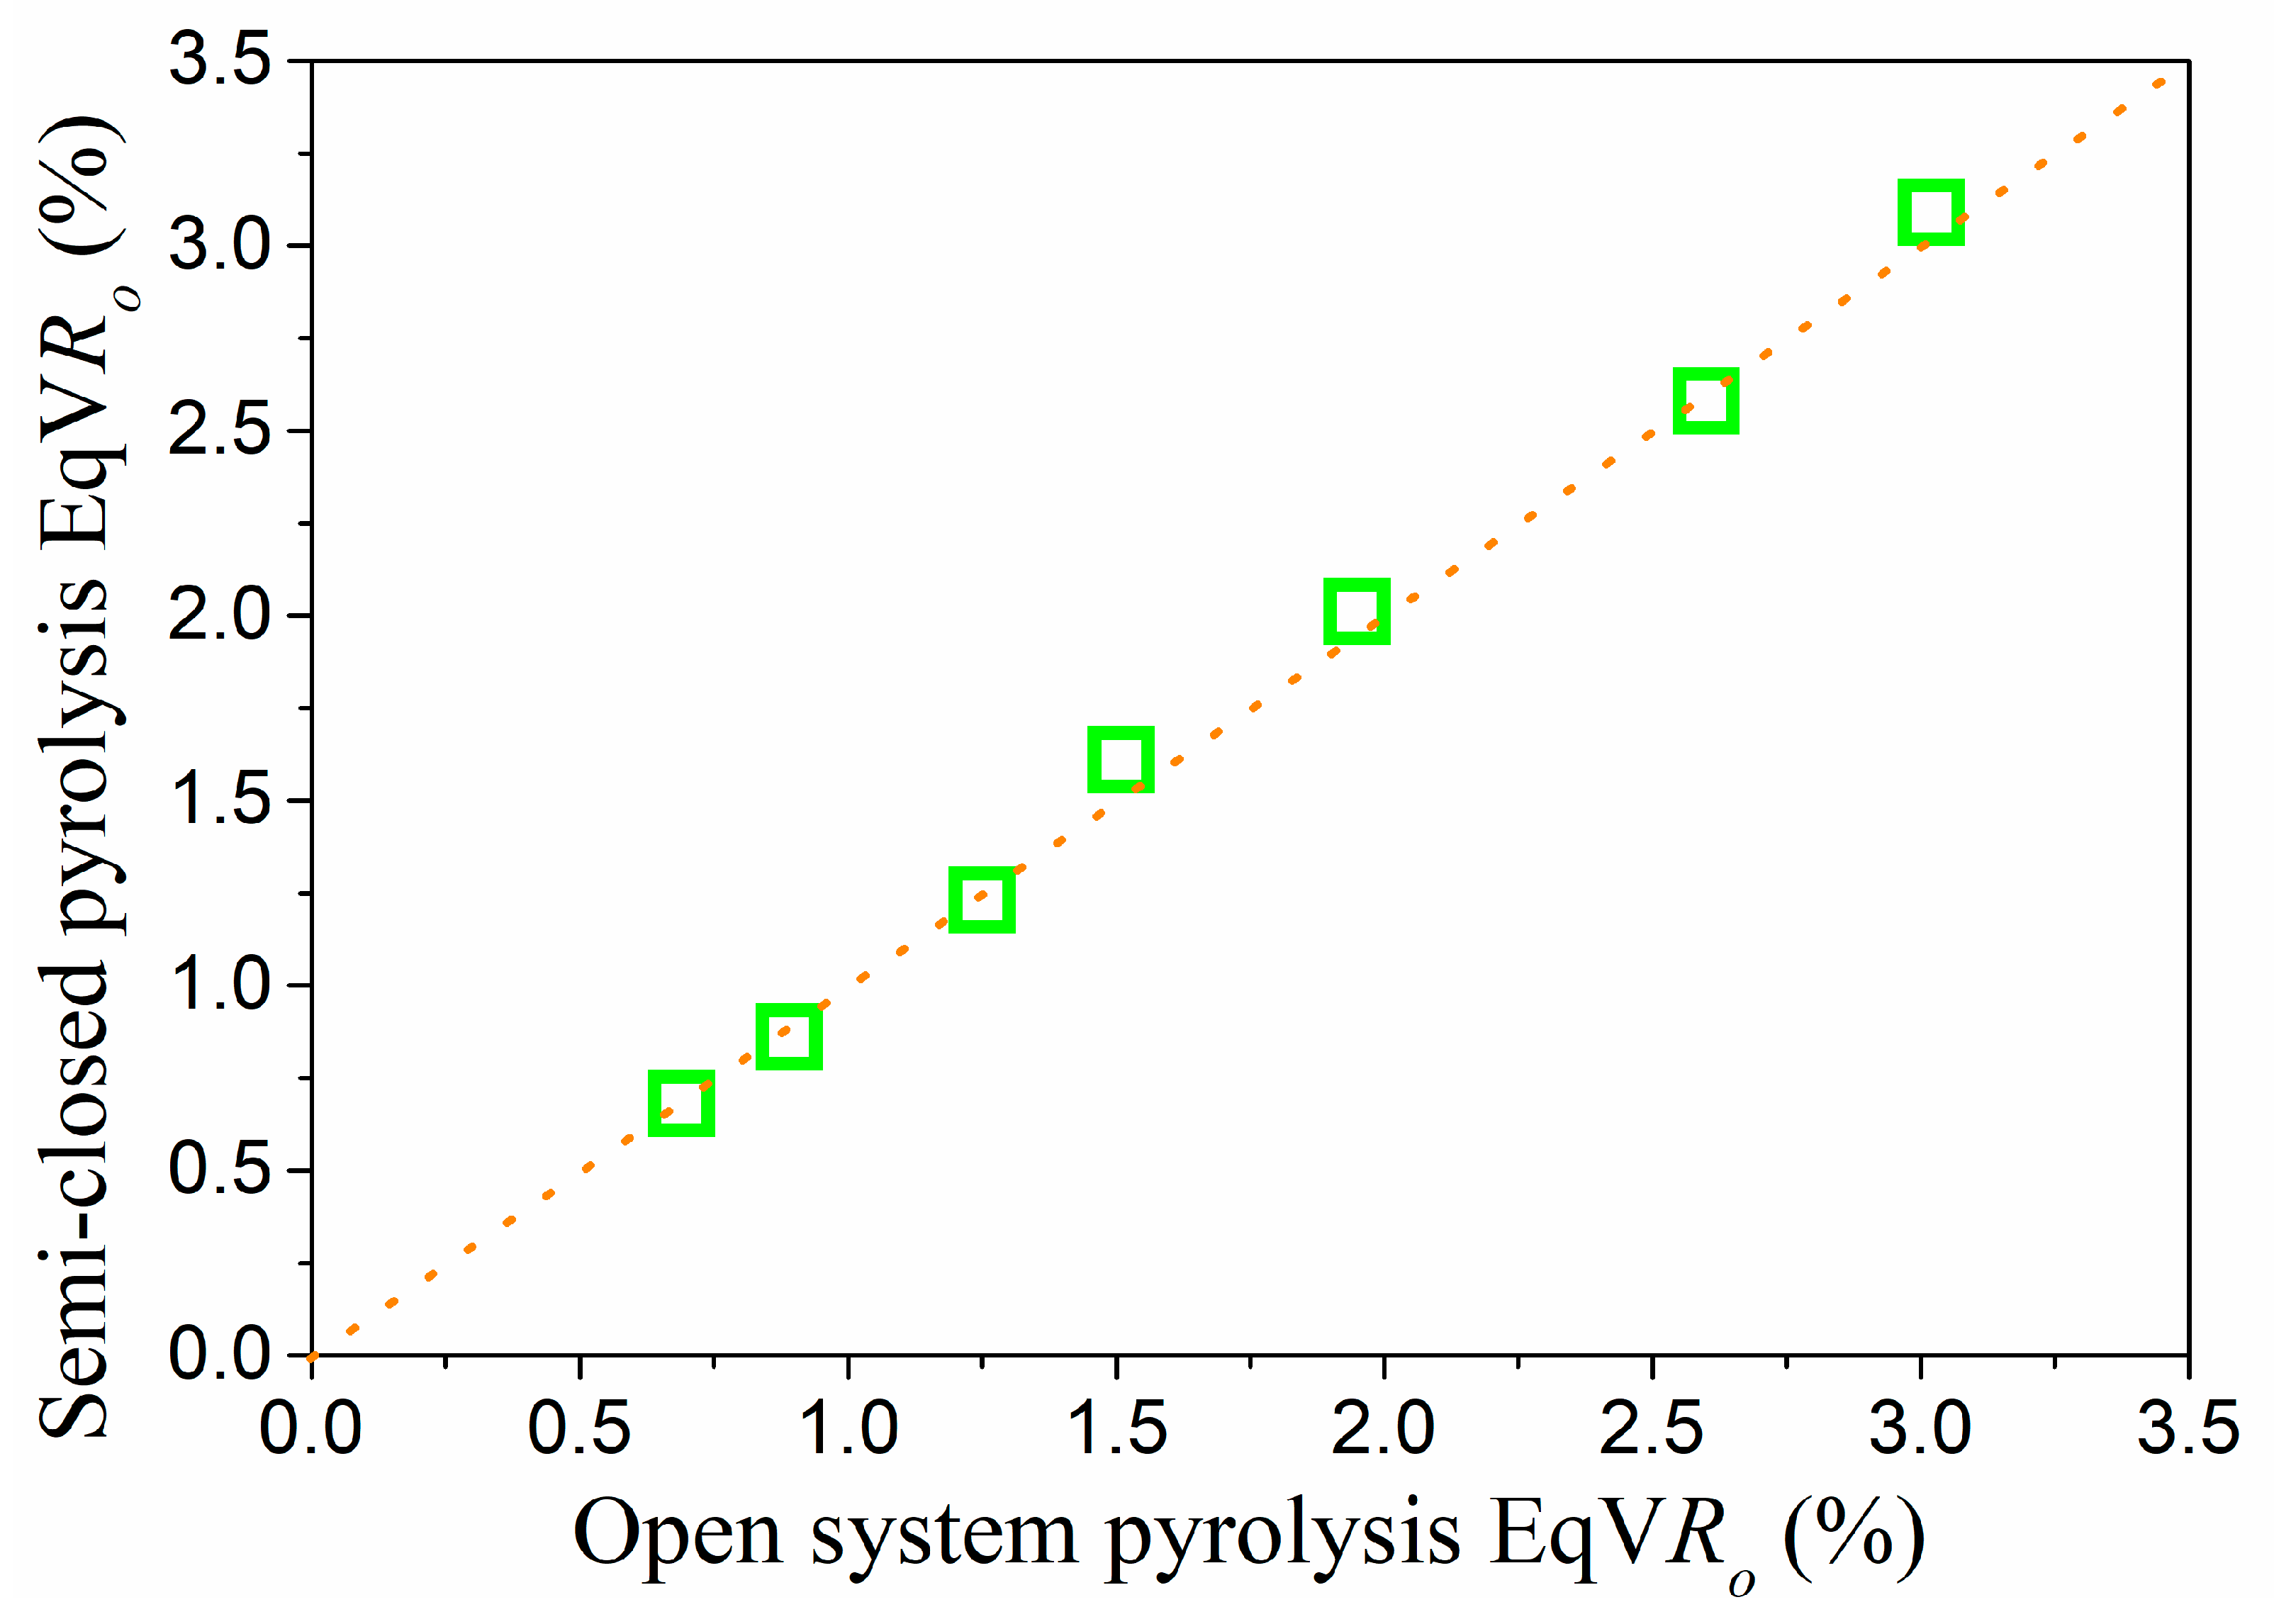
3.1. Open and Semi-Closed Pyrolysis Experiments

Vitrinite reflectance (Ro), representing a measure of the percentage of incident light reflected from the surface of vitrinite particles in sedimentary rock, is usually used to acquire shale maturity [41]. However, since there were no higher plants in the Neoproterozoic Era and only algae and fungi developed in the ocean, biogenic vitrinite could not be found in these marine shales. In this work, the equivalent vitrinite reflectance (EqVRo) was used to characterize shale maturity. Wang et al. [42] have studied the relationship between equivalent vitrinite and bitumen reflectance (BRo) of the marine shale of Longmaxi Formation: EqVRo =1.125 × BRo−0.2062. After the thermal evolution experiment, the bitumen reflectance (BRo) was measured by high solution laser Raman spectroscopy analysis, and the EqVRo was calculated. The results show that the EqVRo increases from 0.68% to 3.09% in the open system pyrolysis while the temperature rises from 300 °C to 600 °C, and EqVRo varied from 0.69% to 3.02% in the semi-closed system pyrolysis from 300 °C to 600 °C. The comparison of these two systems’ pyrolysis is shown in Figure 3. The EqVRo increases with increasing temperature, however, formation pressure has no obvious effect on the maturity evolution of shales. To obtain the quantitative relationship between formation pressure and shale maturity, a comparative experiment of different formation pressures at the same temperature point should be conducted.
The total organic carbon (TOC) decreased from 5.71% to 2.93% in the open system pyrolysis and varied from 5.03% to 1.19% in the semi-closed system when the experimental temperature increased from 300 °C to 600 °C. The quantities of gaseous and liquid hydrocarbon products during open and semi-closed system pyrolysis experiments are listed in Table 2. Due to no pressure being applied in the open system pyrolysis, uncollected liquid hydrocarbons were sporadically stored in the pore, fracture, and sample surface. Gaseous hydrocarbon products, which vary from 0.1 mg/g to 2.68 mg/g, are estimated by the thermal weight loss method. In a semi-closed system, kerogen generates oil and gas as thermal evolution proceeds. Due to the existence of formation pressure, part of the liquid hydrocarbon product is collected after discharge, namely expelled oil. The other part of the liquid hydrocarbon product retained in the pore-fracture system is called residual oil. With the increase of thermal maturity, the liquid hydrocarbon yield increases from 1.64 mg/g to 6.60 mg/g when EqVRo < 1.51%, and then decreases from 6.60 mg/g to 8.81 mg/g when 1.51% < EqVRo < 3.02%. Gaseous hydrocarbons were collected by drainage method, and the gaseous product yield of shale increased gradually from 0.01 mg/g to 3.23 mg/g with the increase of shale thermal maturity [21].

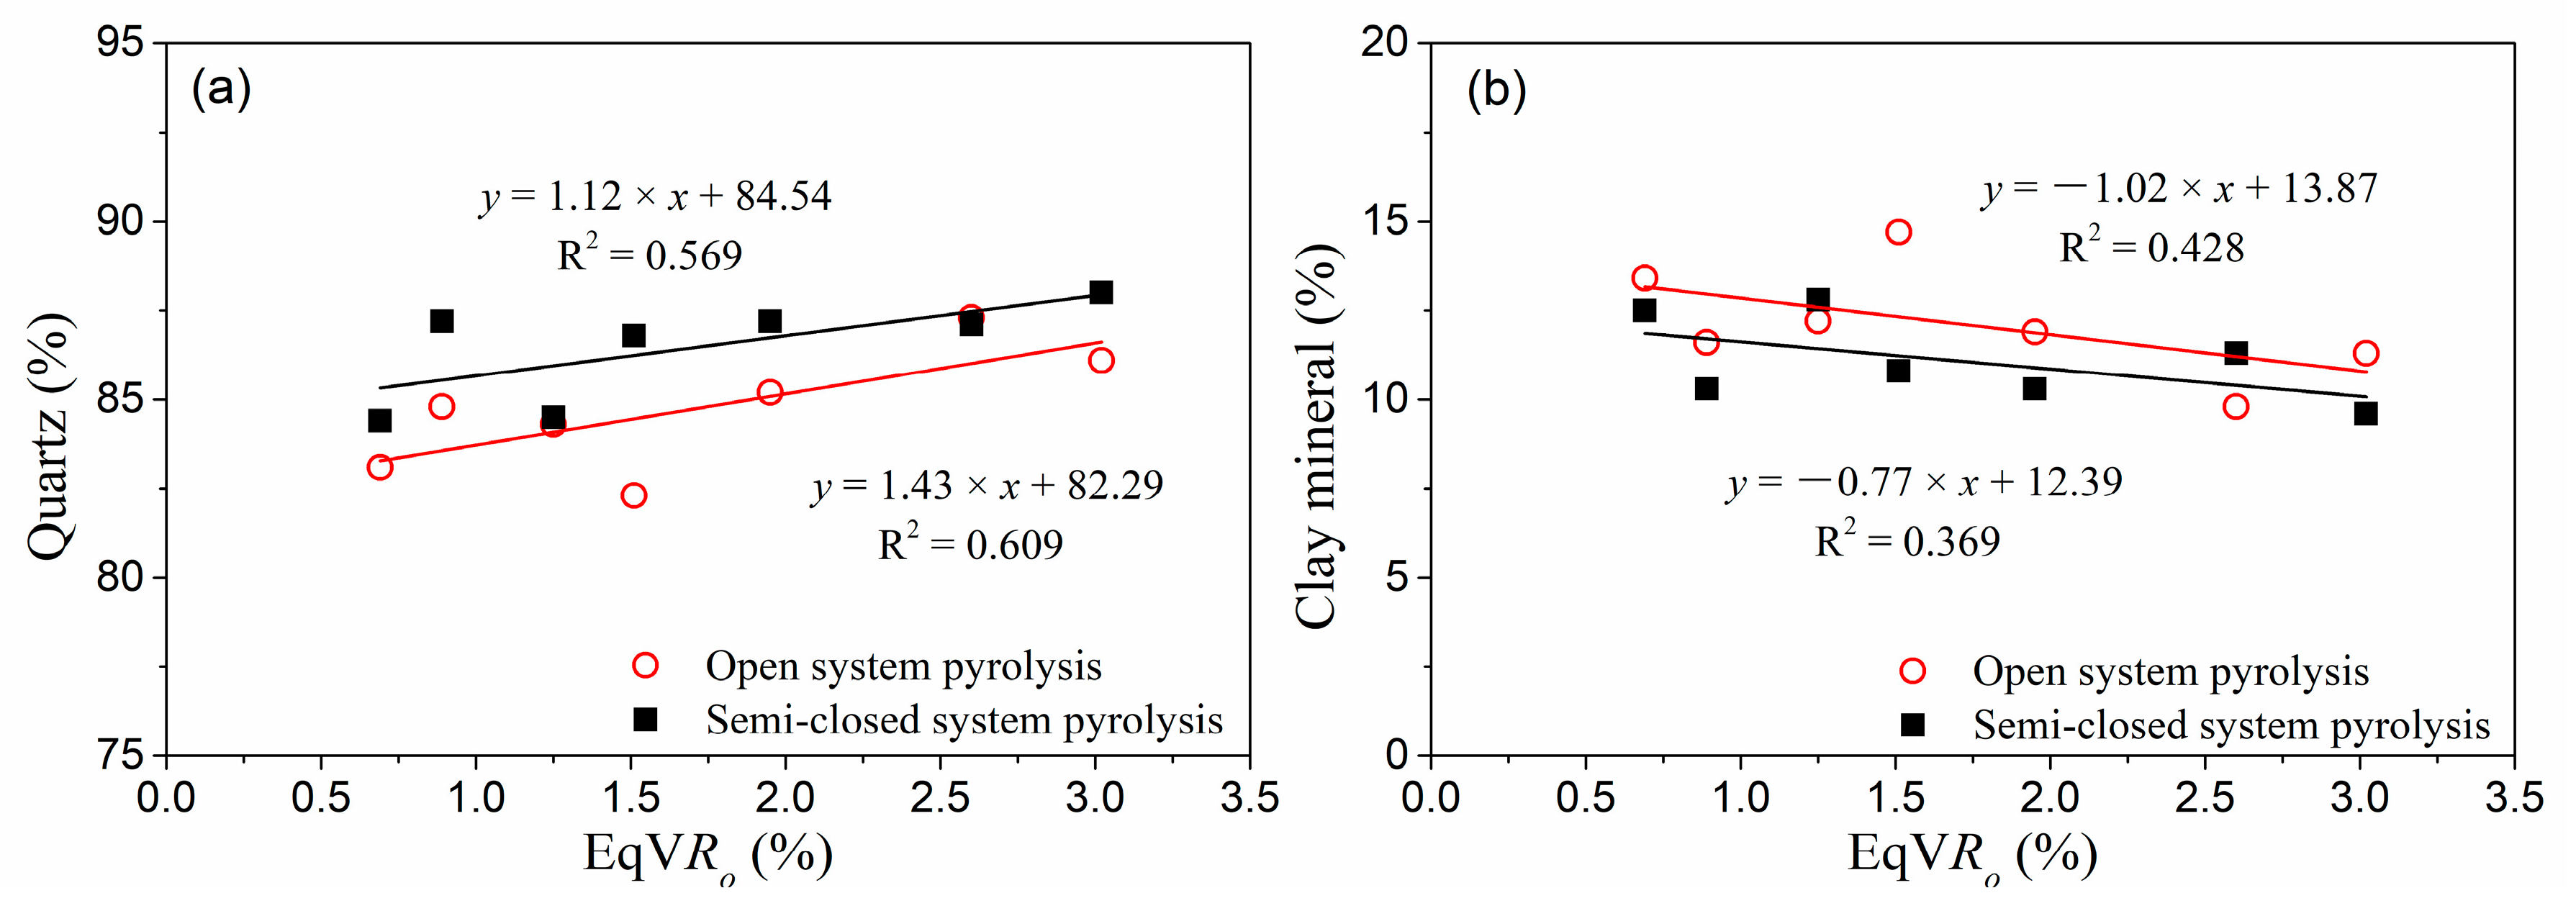
3.2. Mineral Evolution Characteristics

According to XRD analysis, the shale samples are mainly composed of quartz, clay mineral orthoclase, apatite, and pyrite. For both experiments, quartz is the most abundant mineral, followed by clay, and pyrite is the least abundant (Figure 4a). Overall comparison of mineral content between open and semi-closed system pyrolysis experiments are shown in Figure 4b. The mineral contents at each temperature point are distributed near the straight line of 1:1. To make the comparison of mineral content by the two pyrolysis experiments more obvious, a separate comparison was provided for each mineral (Figure 5). For both open and semi-closed system pyrolysis experiments, the quartz content increases with the thermal maturity, while the content of clay minerals decreases with the thermal evolution. Previous studies showed that organic matter produces a large amount of organic acid during thermal evolution. Clay and feldspar can be dissolved by organic acids [43], and the catalytic activity of clay minerals can be strengthened by treatment with weak organic or inorganic acids [27,44]. During thermal evolution, organic acid accelerates the transformation from smectite to illite [27]. After being dissolved by organic acids, feldspar releases K ions and forms quartz; this results in the quartz-filling phenomenon [27,45], which explains the increase in quartz content with the shale thermal evolution. For each of the experimental temperature points, the existence of formation pressure increases the percentage of quartz and decreases the content of clay minerals (Figure 5a,b). This indicates that the formation pressure inhibits the formation of quartz. At the same time, high pressure is conducive to the conversion of montmorillonite and kaolinite to illite. This is because the higher formation pressure promotes the formation of quartz. At the same time, high liquid pressure is conducive to the transformation of montmorillonite and kaolinite to illite [46].

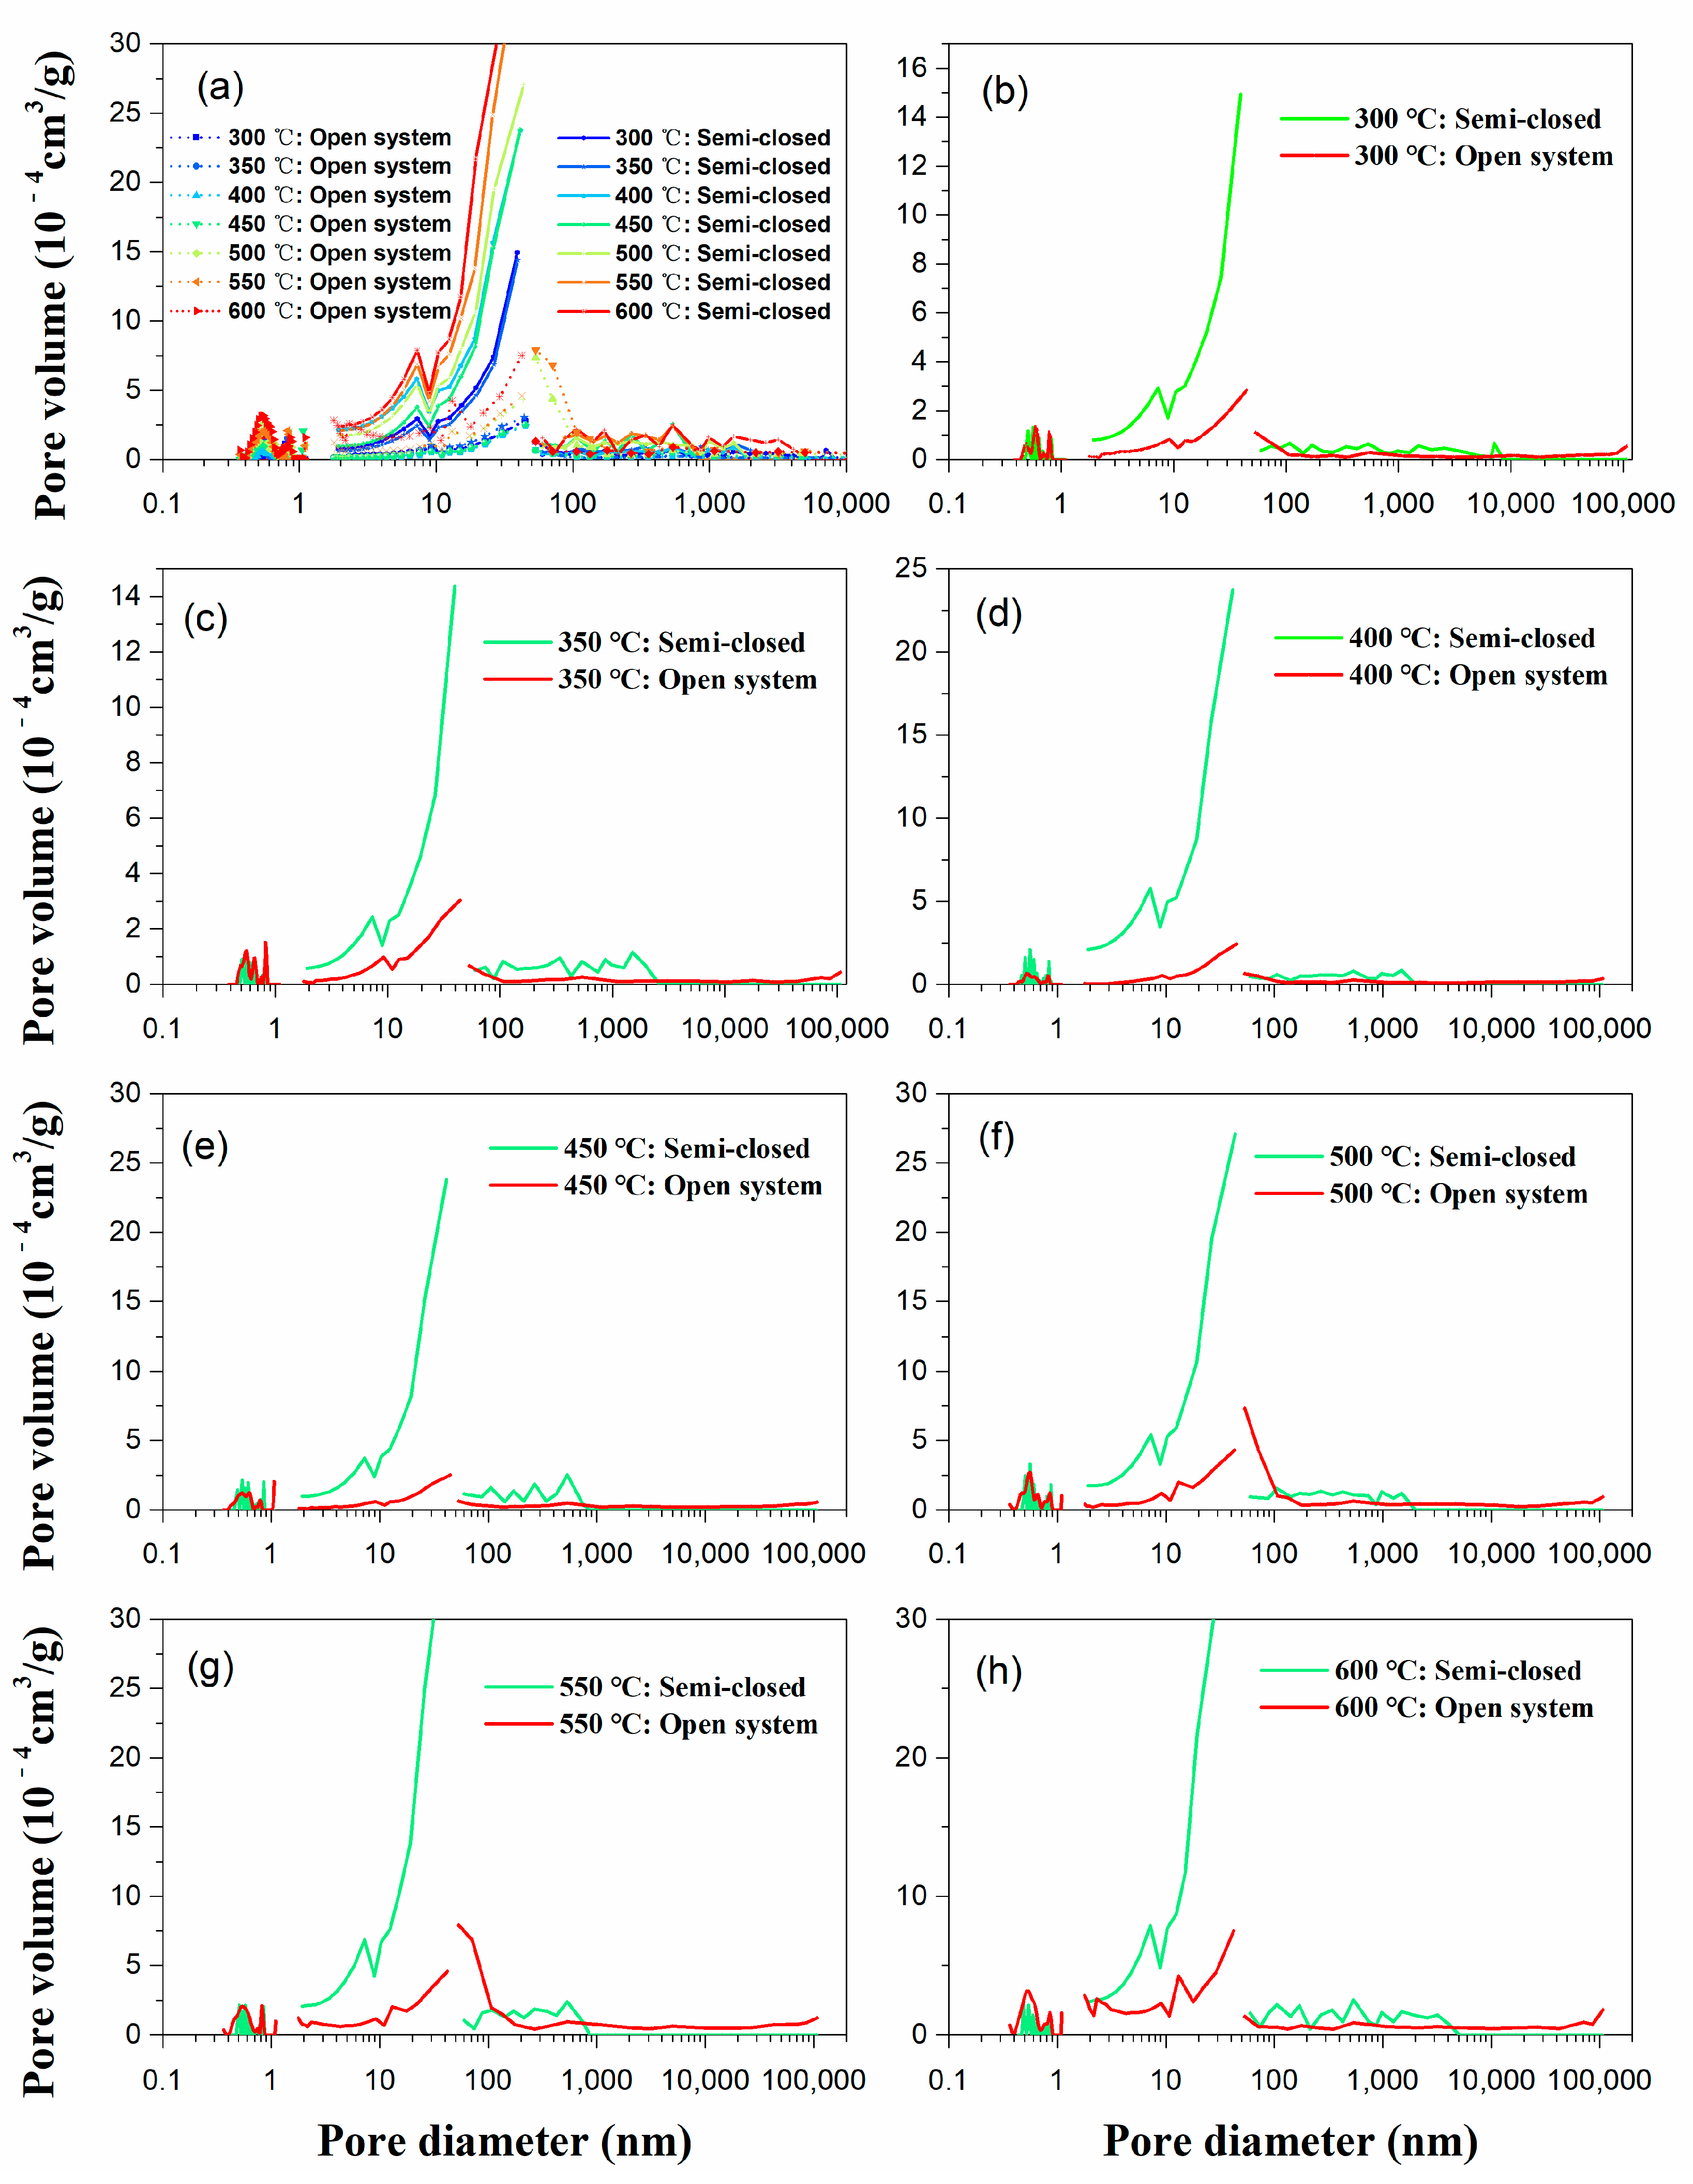
3.3. Pore Structure Evolution Characteristics

To intuitively observe the development of organic pores, FESEM was conducted using shale samples after two pyrolysis experiments (Figure 6). For shales based on open system pyrolysis experiments, there are a large number of inorganic pores and micro-cracks at the lowly matured stage (300 °C–350 °C), and no primary pores can be seen in solid kerogen. During the oil generation stage (350 °C–400 °C), mineral shrinkage fractures occur and smaller pores are difficult to identify due to oil filling because there is no pressure exerted to drive hydrocarbon expulsion in the open system pyrolysis. At the wet gas stage (400 °C–500 °C), solid bitumen and petroleum were generated, pores and cracks developed, gas was released, and the smaller pores appeared. The proportion of smaller pores in the identifiable pore volume in the visual field increased, and secondary minerals were generated due to recrystallization. At the dry gas stage (550 °C–600 °C), organic matter and liquid hydrocarbon were further cracked to produce gas, the pore size of identifiable organic pores became smaller, and the connectivity noticeably increased.
For shale samples based on semi-closed system pyrolysis experiments, organic pores begin to appear in organic matter on shale at the oil generation stage (350 °C–400 °C), and mineral-related pores are reduced by compaction and cementation [8]. At the wet gas stage (400 °C–500 °C), the solid bitumen and petroleum in pores cracking produce secondary organic pores. The presence of fluid pressure makes hydrocarbon expulsion easier, OM pores generated in pyrobitumen were isolatedly distributed with irregular shapes. At the dry gas stage (550 °C–600 °C), organic matter and liquid hydrocarbon were further cracked [21]. The relatively thin pore wall ruptures due to fluid pressure resulting in the formation of connected larger pores, thus improving the connectivity of shale pores [47]. It can be seen from the SEM images of the shale samples in two the thermal evolution experiments that the presence of fluid pressure causes part of the hydrocarbons originally stored in the pores to discharge, increasing the pore volume, especially those with small pore size. Meanwhile, formation pressure breaks down some of the thinner pore walls, increasing the pore connectivity.
The applicability of characterization technologies is variable. Several technologies should be integrated to get the full-scale pore parameter. In this work, CO2 and N2 adsorption/desorption and MIP were used to characterize the pores in shale. Many pieces of research have shown the applicability of this full-scale method [1,26,44]. The CO2, N2, and MIP curves of the shale samples from the two pyrolysis experiments are shown in Figure 7. According to the IUPAC classification, the N2 adsorption/desorption isotherms of the shale samples based on open and semi-closed system pyrolysis are mainly of type IV owning to an obvious hysteresis loop [15]. The type of N2 adsorption hysteresis loop in open system shale samples is Type H4, representing narrow slit pores. However, with the increase of thermal evolution maturity, the hysteresis loop type of shale samples in the semi-closed system gradually changes from Type H4 to Type H2, which represents the pore type gradually changing from narrow slit pore to ink bottle-shaped.
The MIP curve type of the open system is relatively constant. The mercury injection curve has two stages, and the mercury withdrawal efficiency is between 30–40%. After the formation pressure is applied, the first half of the mercury injection curve slows down, indicating that the pore connectivity becomes better. To intuitively describe the evolution characteristics of pore structure, the pore volume of three pore size scales at each thermal evolution stage is shown in Figure 8. With the increase of Ro, the pore volume of the shale samples from the two pyrolysis experiment changes greatly. The volume difference between micropores, mesopores, and macropores of shale samples in the open system is significantly smaller than that in the semi-closed system. The mesopores content of shale samples in the semi-closed system obviously accounts for the largest proportion (Figure 8). The mesopore volumes of the two pyrolysis samples decrease first and then increase with the thermal evolution of shale maturity, however, the change of micropore volume is not obvious. The macropore volume of shales in open-system pyrolysis is increased with the increase of evolution degree, while the changing trend in shales of the semi-closed system pyrolysis is not obvious.

4. Discussion

4.1. Influence of Formation Pressure on Pore Structure

A full-scale pore size distribution (PSD) based on open system and semi-closed system pyrolysis experiments obtained by MIP, CO2, and N2 physisorption is shown in Figure 9. It is apparent that the mesopore volume of the shale samples at each temperature point increases significantly after formation pressure is applied, while the changes of macropore and micropore volume do not follow an obvious trend. At 400 °C–500 °C, part of the micropore size distribution curve of the semi-closed system pyrolysis is higher than that of the open system, indicating that there is a small segment of micropore volume increase due to the existence of formation pressure. At 500 °C and 550 °C, the macropore volume in the 50 nm–100 nm range is higher in the open system than in the semi-open system, indicating that the pore pressure reduces the pore volume at this stage. Therefore, it is inferred that the pressure drives the hydrocarbon flow and occupies the pores in the 50–100 nm pore range.
To determine the effect of formation pressure on the pores at different pore diameters, pore structure parameters of micropores, mesopores, and macropores from open and semi-closed system pyrolysis were calculated. The PSD-based two pyrolysis systems are shown in Table 3. Based on open system pyrolysis, the pore volume of micropores (<2 nm) varied from 7.83 × 10⁻⁴ cm3/g to 44.62 × 10⁻⁴ cm3/g with an average of 21.68 × 10⁻⁴ cm3/g, the pore volume of mesopores changed from 9.80 × 10⁻⁴ cm3/g to 57.37 × 10⁻⁴ cm3/g with an average of 22.57 × 10⁻⁴ cm3/g, and the pore volume of macropores were between 3.86 × 10⁻⁴ cm3/g and 42.94 × 10⁻⁴ cm3/g with an average of 16.25 × 10⁻⁴ cm3/g. Based on semi-closed system pyrolysis, the pore volume of micropores varied from 5.52 × 10⁻⁴ cm3/g to 13.81 × 10⁻⁴ cm3/g with an average of 10.83 × 10⁻⁴ cm3/g, the pore volume of mesopores changed from 37.30 × 10⁻⁴ cm3/g to 166.49 × 10⁻⁴ cm3/g with an average of 88.45 × 10⁻⁴ cm3/g, and the PV of macropores were between 8.22 × 10⁻⁴ cm3/g and 26.94 × 10⁻⁴ cm3/g with an average of 14.81 × 10⁻⁴ cm3/g. Based on open system pyrolysis, the total pore volume (TPV) of shale samples varied from 21.60 × 10⁻⁴ cm3/g to 144.92 × 10⁻⁴ cm3/g with an average of 60.49 × 10⁻⁴ cm3/g, and the TPV of shales based on semi-closed system pyrolysis changed from 54.94 × 10⁻⁴ cm3/g to 206.30 × 10⁻⁴ cm3/g with an average of 114.09 × 10⁻⁴ cm3/g [21].
The pore volume initially decreased, but then increased during open-system pyrolysis (Figure 10a). The pore volume transition is basically consistent with the four stages of thermal maturation. At the maturity stage (300 °C–400 °C, 0.68% < EqVRo < 1.23%), the volume of the mesopores are the largest, followed by micropores and macropores. At the highly matured stage (400 °C–550 °C, 1.23% < EqVRo < 2.58%), before 550 °C, the micropores volume becomes the largest, mesopores follows and the macropores volume are the least. After 500 °C, the volume of the micropores are still the largest, however, they are now followed by the volume of macropores, and the mesopores volume are the smallest. At the overmatured stage (500 °C–600 °C, 2.58% < EqVRo < 3.09%), the mesopores volume are the largest, and the volume of the macropores are equivalent to that of the micropores. For the semi-closed system, the volume of mesopores decreases first and then increases significantly during the thermal evolution of shale, while the volume of micropores and macropores change insignificantly (Figure 10b). Mesopores account for most of the volume (nearly 70% of the total pore volume), which indicates the volume of mesopores is more significantly affected by formation pressure than micropore and macropore.
To intuitively understand the difference in pore volume, the variations in the pore volumes between the two pyrolysis experiments are proposed in Figure 11. The micropore volumes of the shale samples from the semi-closed system pyrolysis is smaller than that of the open system. It shows that in the process of hydrocarbon expulsion driven by formation pressure, the migration of hydrocarbons will block some micropores and reduce the pore volume of micropores [5,48]. However, at the peak of oil generation (EqVRo = 1.23 %), the liquid hydrocarbons and solid bitumen produced by the open system would have filled the pores and reduced the micropore volume at this stage [35,47]. Thus, the micropore volumes of the samples from the two pyrolysis systems is similar at about 400 °C (EqVRo = 1.23 %) (Figure 11b). The mesopore volumes of shale from the semi-closed system pyrolysis greatly exceeds that of the open system (Figure 11c), which shows that the volumes of the mesopores increases significantly after the formation pressure applied. The reason should be that a large number of hydrocarbons are discharged from the pores and the application of pressure causes some thinner pore walls to break, which increases porosity [13,35]. At the same time, it also shows that the retained hydrocarbons are mainly stored in the mesopores of shale. The influence of formation pressure on the macropores of the shale samples presents two stages. Before 500 °C (EqVRo = 2.01%), the macropore volumes of the shale in the semi-closed system is larger than that of the open system, while after 500 °C, the trend is the opposite. Before 500 °C, the open system has no hydrocarbon expulsion pressure. Therefore, more retained hydrocarbons were blocked in the large pores, causing the pore volumes to be smaller than that in the semi-closed system. After 500 °C, solid bitumen and oil cracked to form gas, and the volume of macropores increased. Due to the existence of fluid pressure in the shale of the semi-closed system, the hydrocarbons discharged from the mesopores will occupy parts of the macropore volume or cracks [2,34], therefore, the macropore volumes of the semi-closed volume will be smaller.

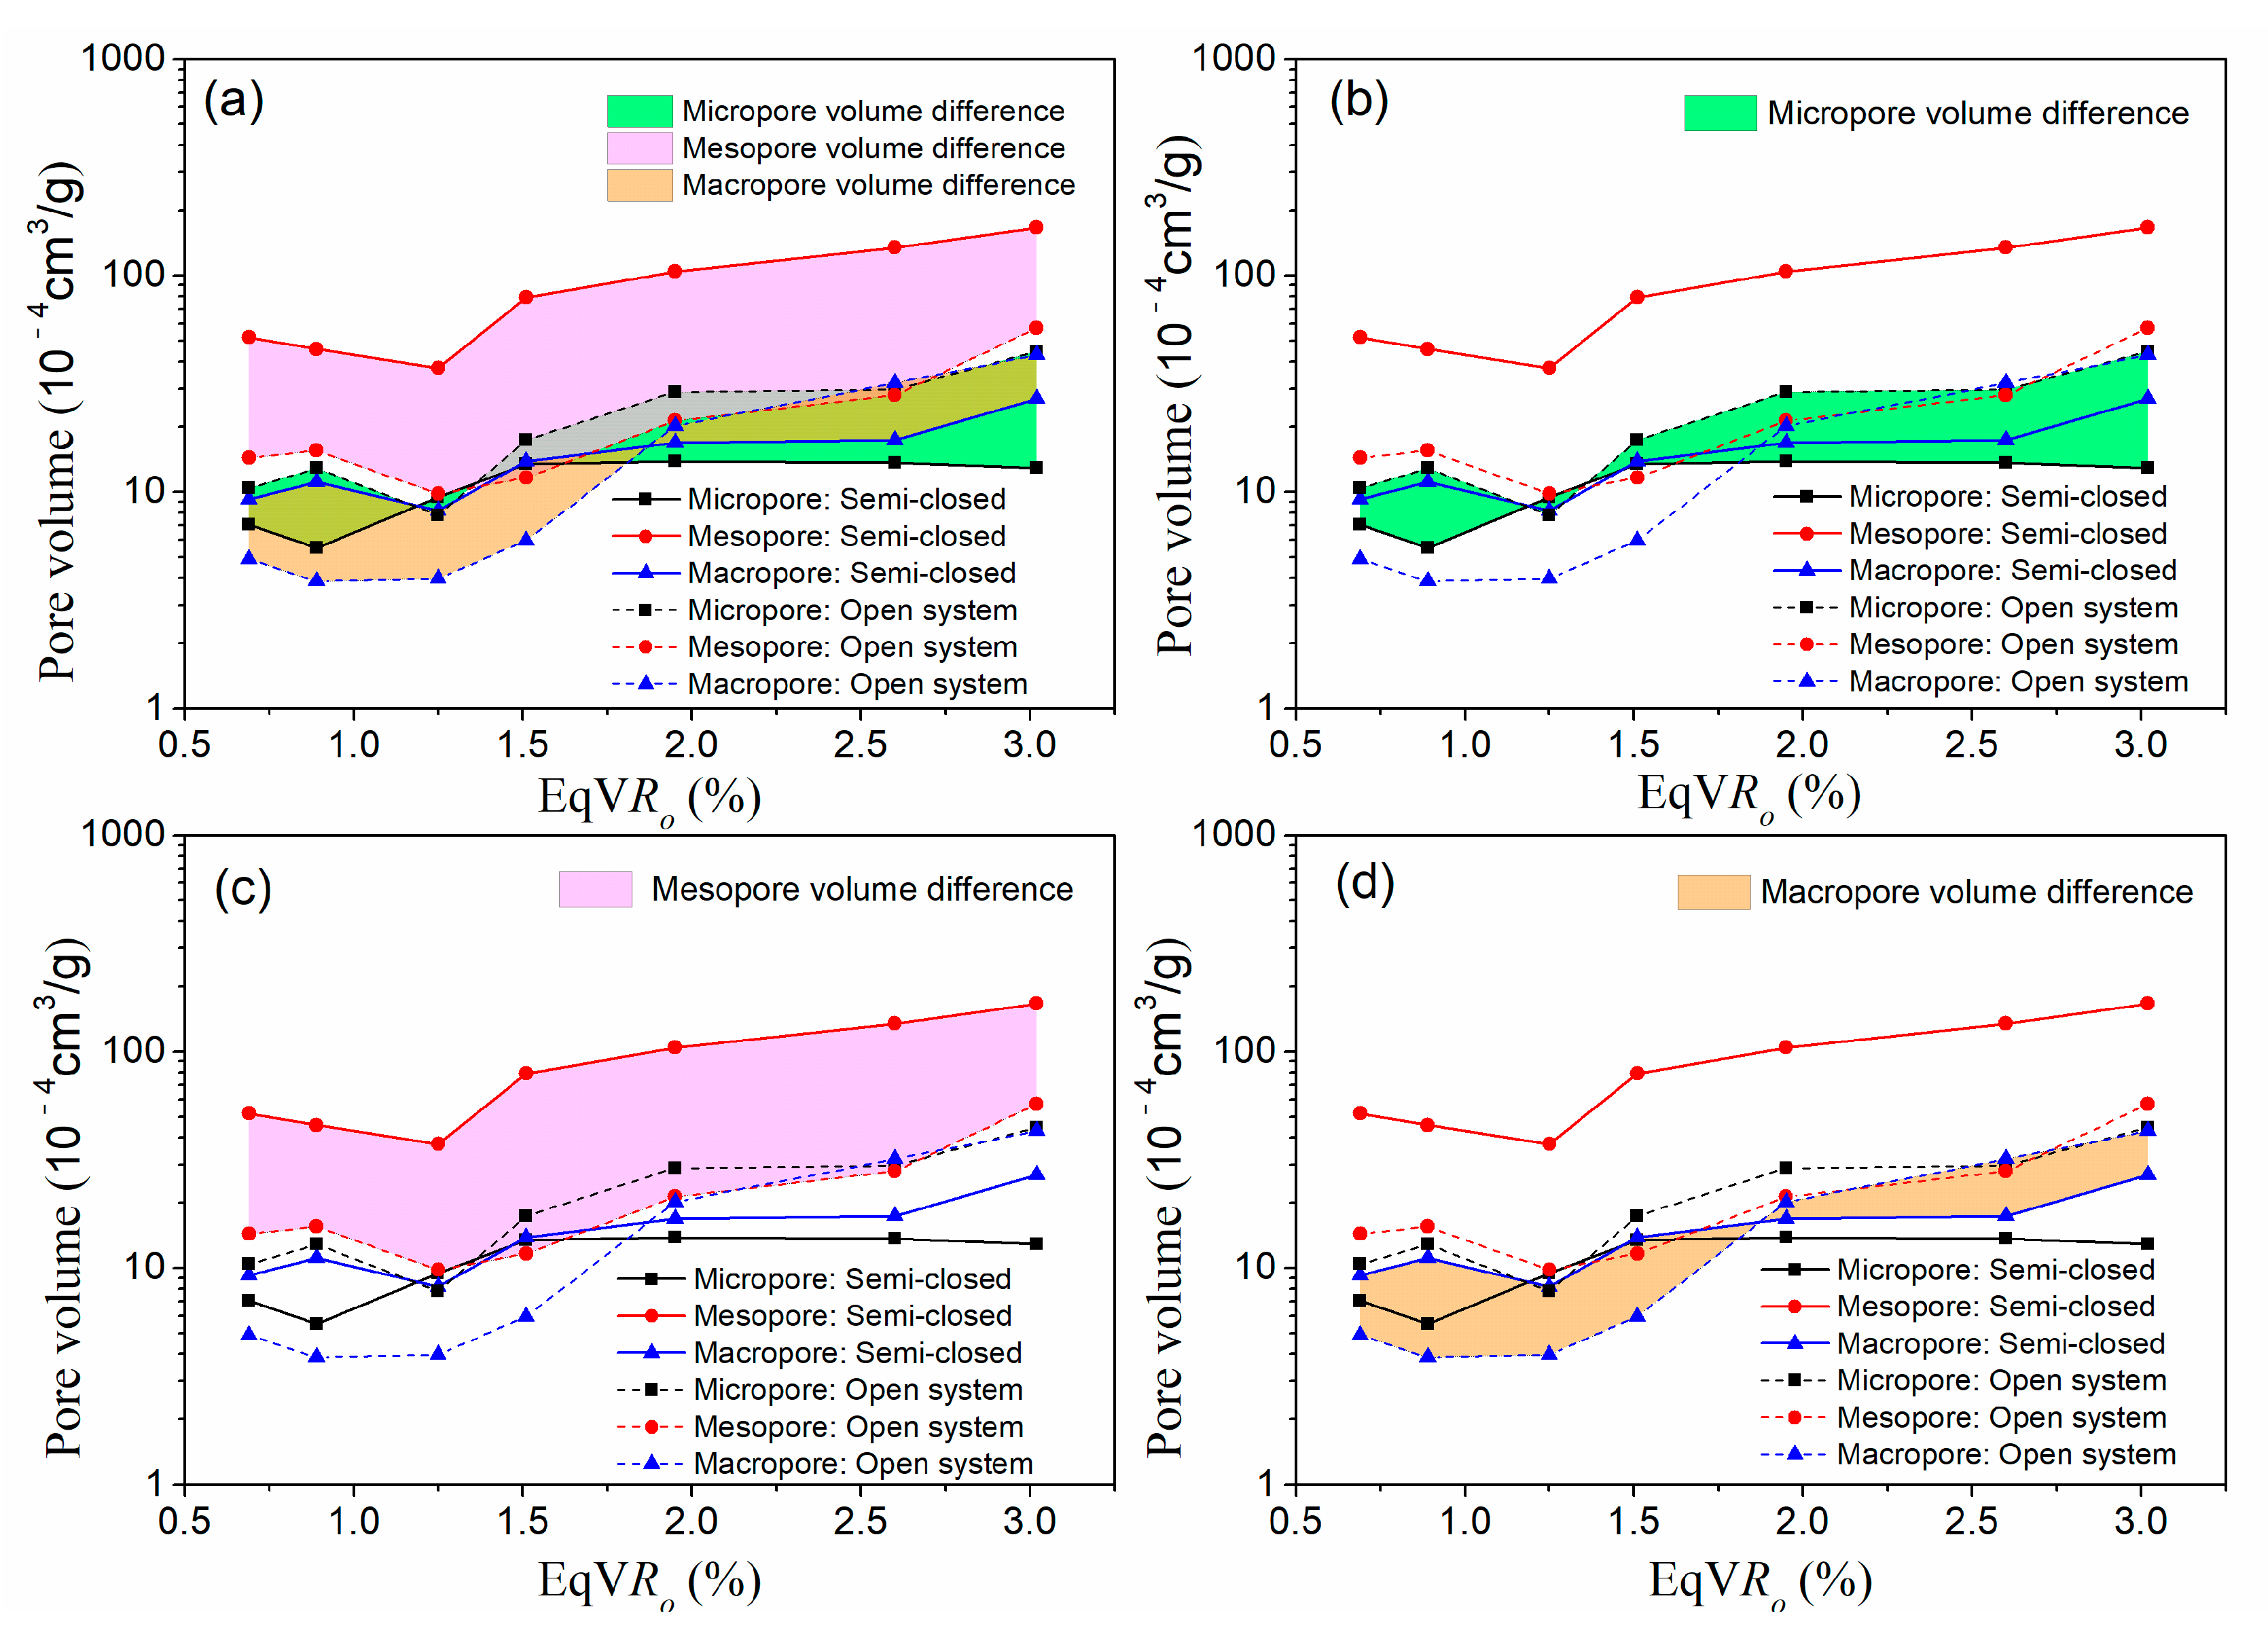
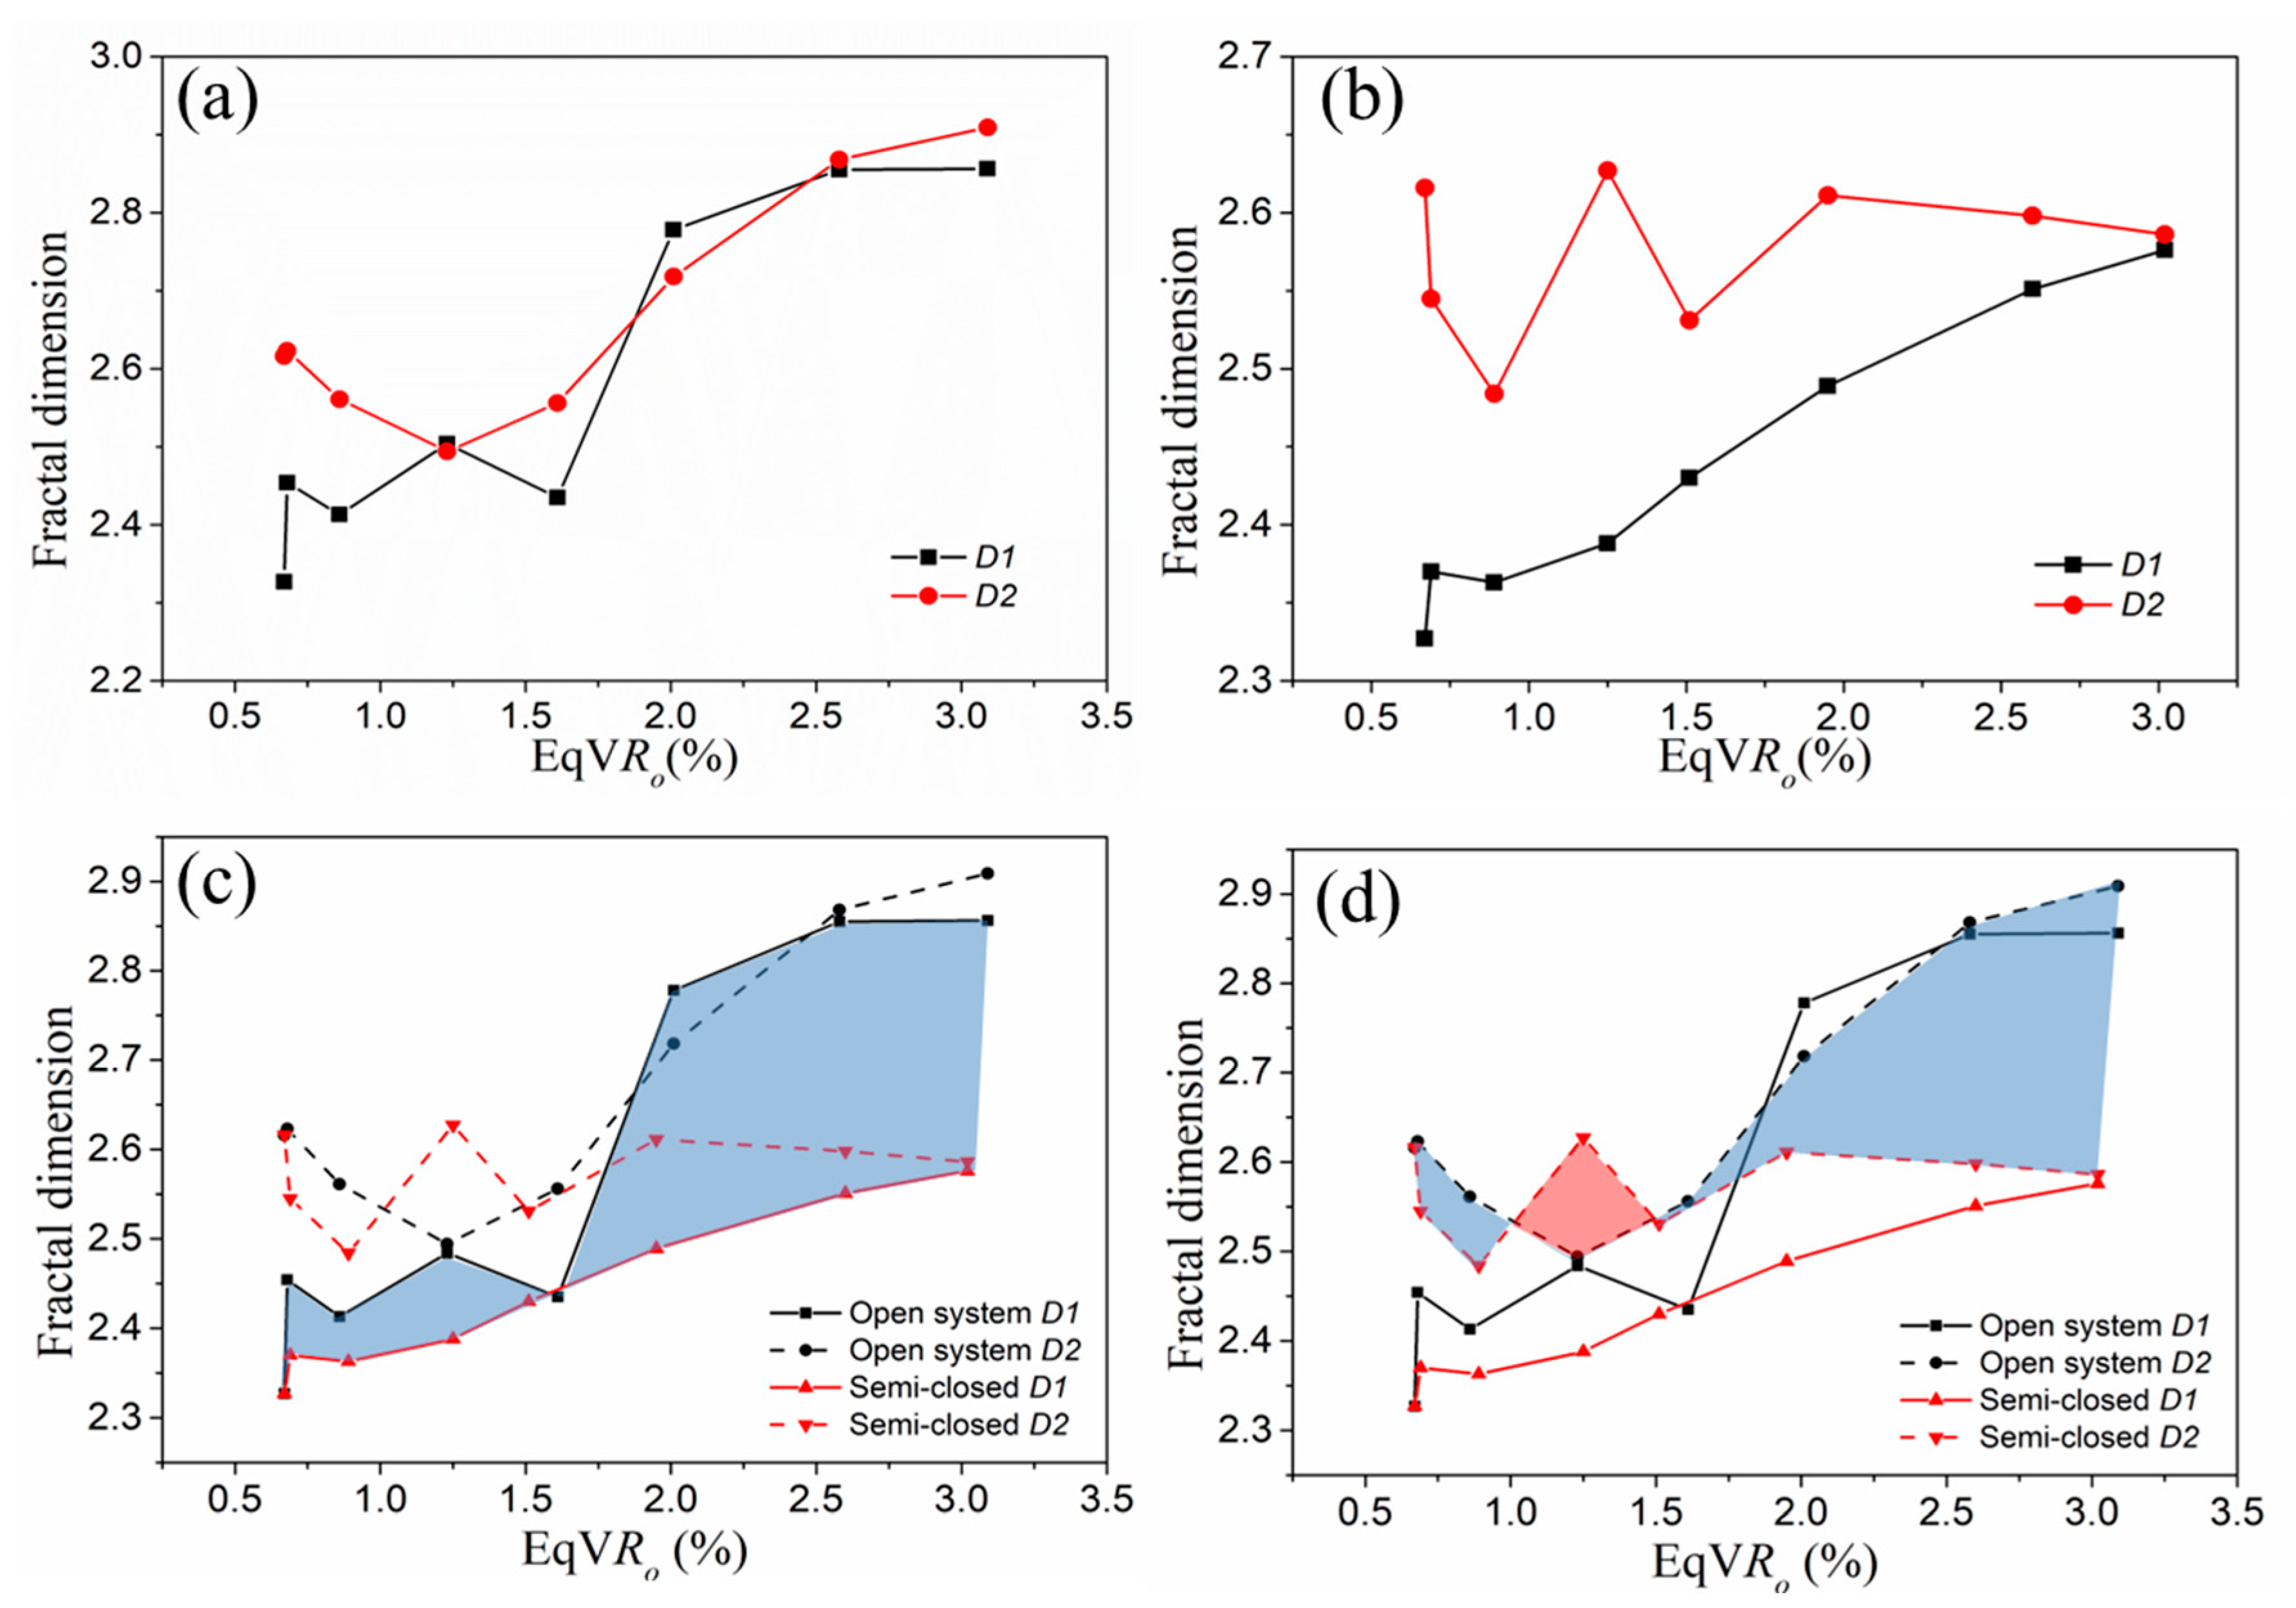
4.2. Influence of Formation Pressure on Pore Heterogeneity

The description of pore heterogeneity is difficult in shale gas reservoirs. The fractal theory is a common way to characterize the heterogeneity of shale pores, which are usually used to characterize the complexity of the pore surface and pore structure of porous material [28,49,50,51]. Through the data of N2 physisorption, the fractal dimension (D) can be obtained to quantitatively describe the pore structure and surface heterogeneity. The relative pressure and adsorption capacity were used to quantitatively acquire the fractal characteristics of shale pores using the Frenkel–Halsey–Hill (FHH) method [28,49,51]:
lnV = ( D 3 ) ln [ ln ( P 0 P ) ] + C
where D is the fractal dimension of pore structure; P0 is the vapor saturation pressure of gas (MPa); C is a constant; P is the equilibrium pressure of N2 (MPa); V is the volume of adsorbed gas molecules at P (cm3/g).
According to N2 physisorption, there are two distinct segments on the plot of lnV vs ln[ln(P0/P)]. At low relative pressure (P/P0 < 0.5), the N2 physisorption is controlled by the van der Waals force. When P/P0 > 0.5, N2 physisorption is mainly dominated by surface tension [20,28,51,52]. The fractal dimension of the two segments can be calculated by using ln(V) and ln[ln(P0/P)] from the N2 adsorption/desorption experiment according to Equation (1). D1 can represent the heterogeneity of pore surface, and D2 can represent the heterogeneity of pore volume and structure [20,28,49,50,51].
Figure 12 shows the fractal dimension fitted curves of the shale samples in the two pyrolysis systems, which show that the adsorption data of the semi-closed system pyrolysis samples are higher than those of the open system except for the two points of 550 °C and 600 °C. The calculation results of the fractal dimensions are shown in Table 3, which shows that the heterogeneity of pore surface and pore volume decreases initially before increasing (creating a “U” shape) during the open system pyrolysis experiments (Figure 13a). Based on the semi-closed system pyrolysis experiment, D1 increases with the increase of shale thermal evolution, while the pore volume heterogeneity (D2) did not show a correlation with shale maturity (Figure 13b). To make the difference of fractal dimension more intuitive, the variations in D1 and D2 between the two pyrolysis experiments are shown in Figure 13c,d. The existence of formation pressure significantly reduced the pore surface heterogeneity because the formation pressure promotes hydrocarbon expulsion, which makes the pore surface rougher and reduces the heterogeneity of the pore surface. The effect of formation pressure on pore structure heterogeneity is three-stage:
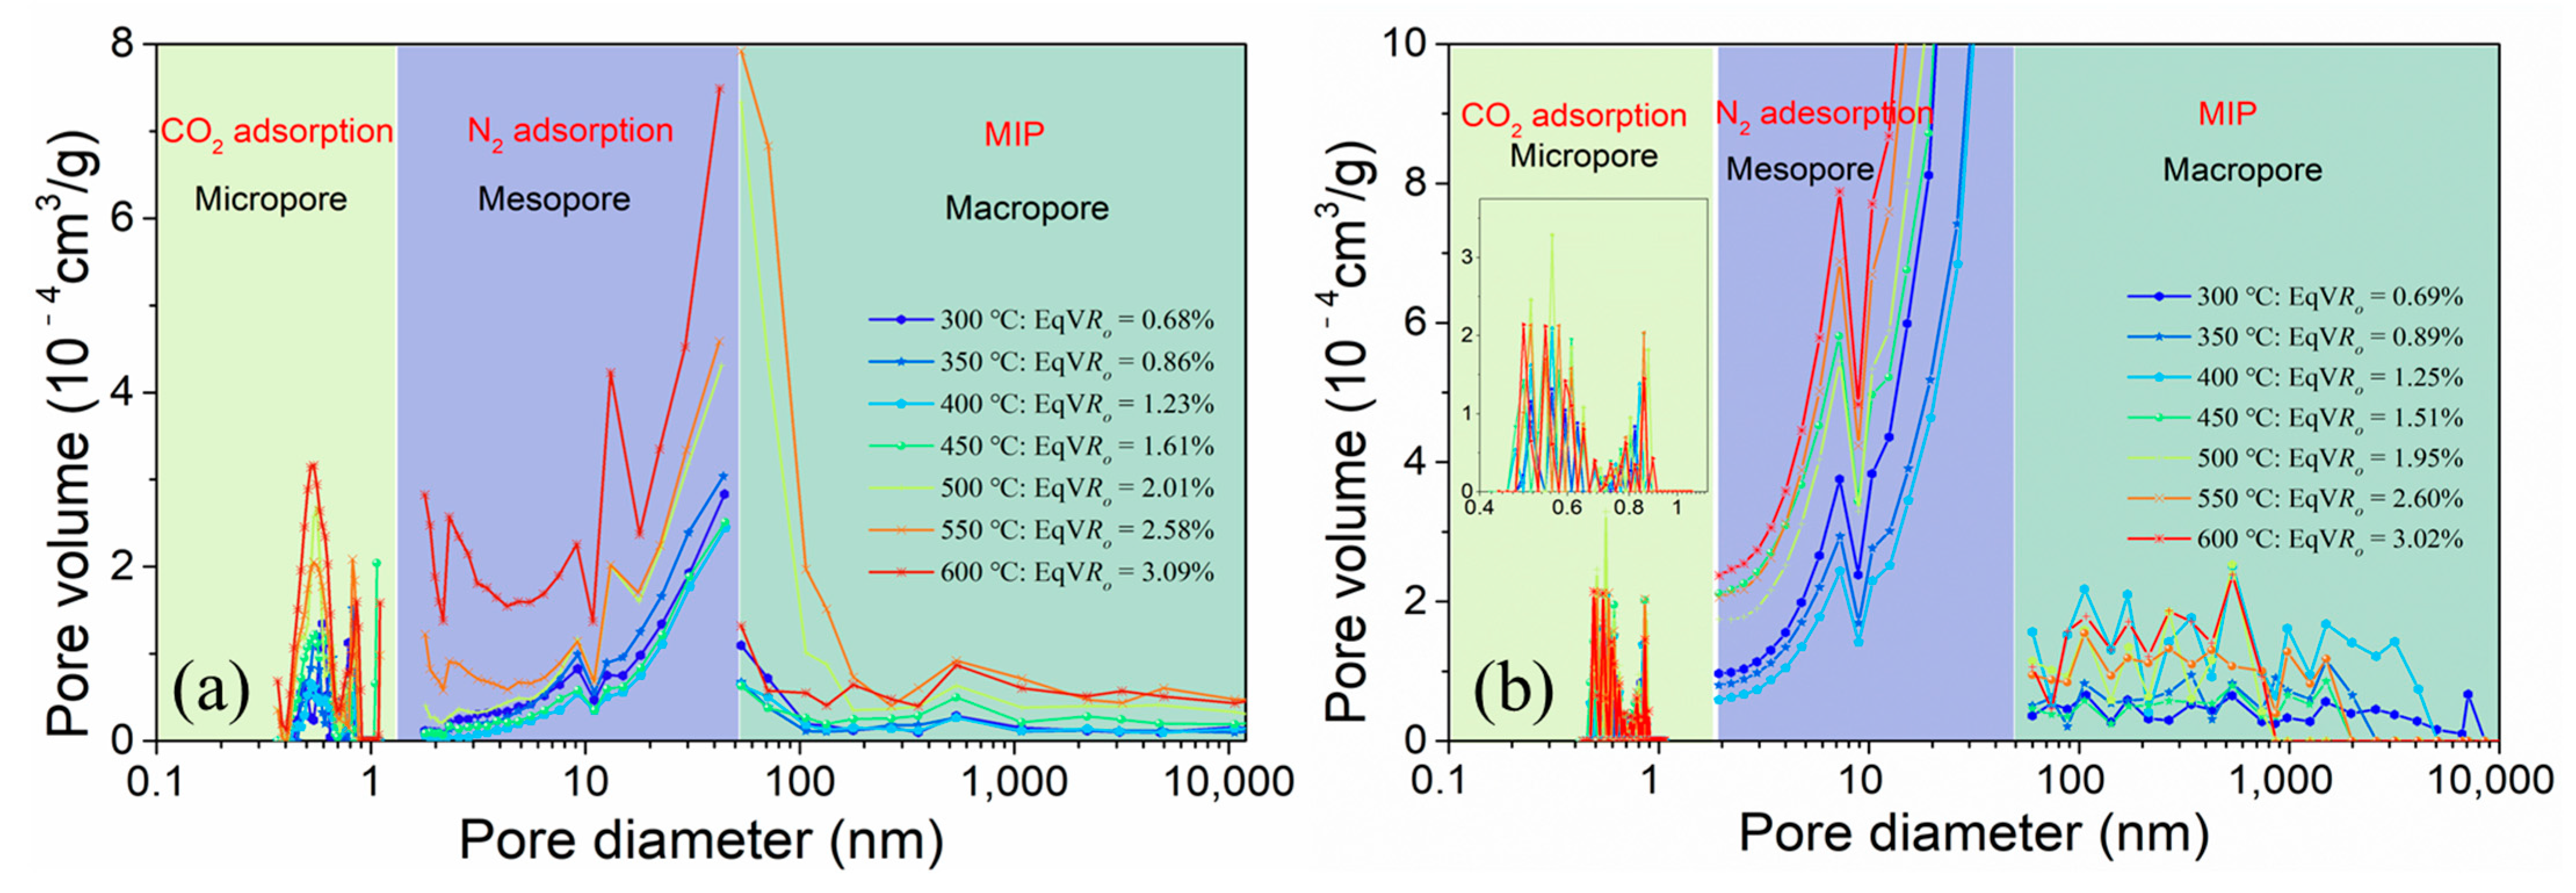
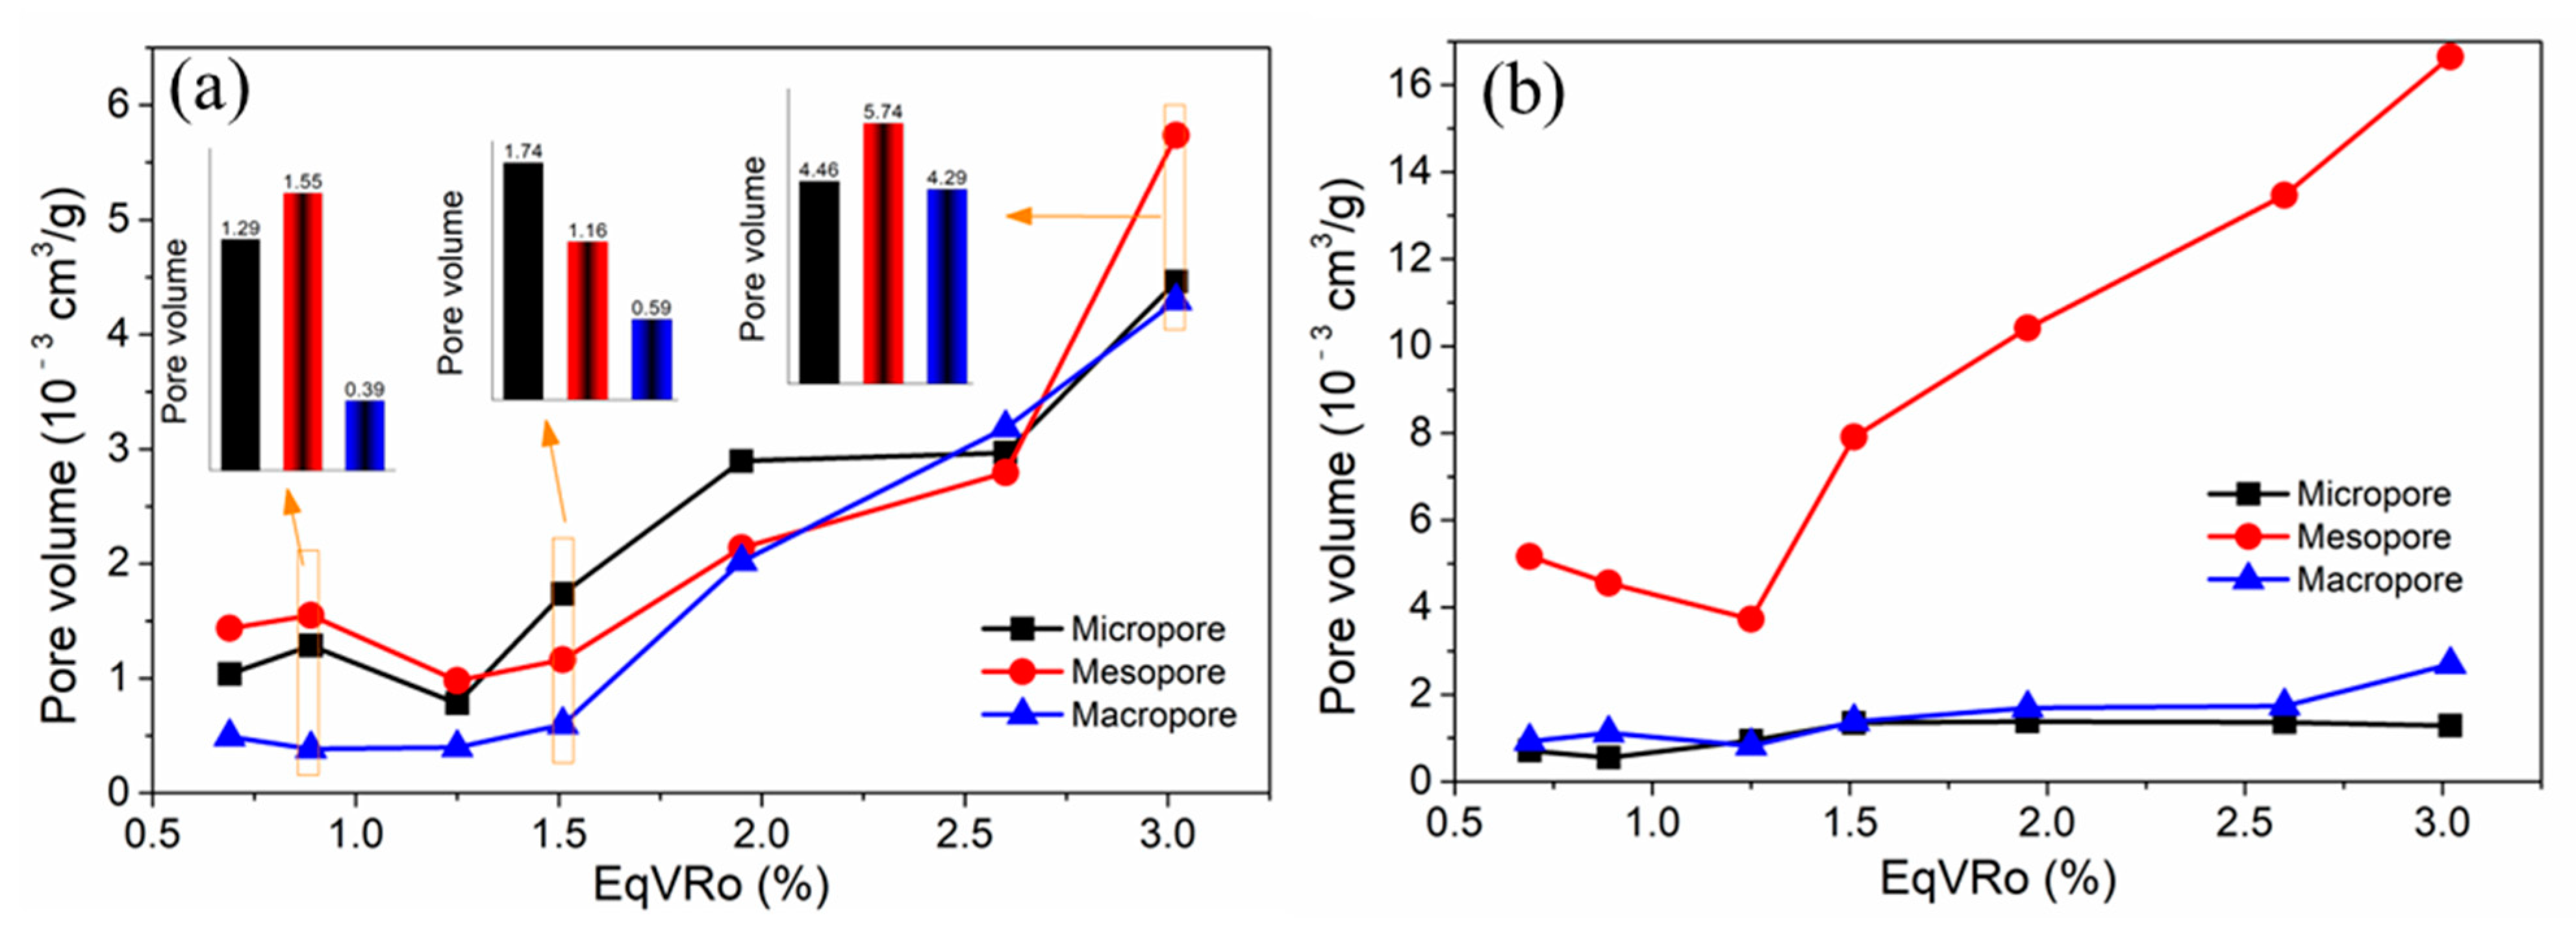
  • When EqVRo < 1.03%, the formation pressure reduces the heterogeneity of pore volume in the other stages. The reason is that the amount of oil produced is low at this stage, the migration of hydrocarbons will block some micropores and reduce the pore volume of micropores (Figure 11b). Thus, the pore volume distribution is more concentrated, reducing the pore heterogeneity.
  • At the peak of oil generation (1.03% < EqVRo < 1.51%), the formation pressure increases pore heterogeneity. The reason is that the retained hydrocarbons occupy the pores before the formation pressure is applied, which makes a small difference between micropore, mesopore, and macropore volumes (Figure 10a). After applying pressure, the difference between these pore volumes becomes larger due to hydrocarbon expulsion (Figure 10b), which increases the heterogeneity of the pore structure.
  • When EqVRo > 1.51%, the formation pressure reduces the heterogeneity of pore volume. In this stage, the partial micropore volume begins to transform into mesopore volume [35], and the existence of formation pressure makes some thinner pore walls rupture, which increases pore connectivity [35,53] and decreases the heterogeneity of pore structure.

4.3. Pore Evolutionary Pattern for Marine Shale

A shale pore evolutionary model based on fluid pressure was established by comparing the evolution process of pore structures and minerals, as well as the generation, expulsion, and retention of hydrocarbons in shale during the two pyrolysis experiments (Figure 14). The coupling relationships between the evolutionary characteristics of organic matter and the pore structure of Neoproterozoic marine shales can be roughly divided into four stages. In the first stage (EqVRo < 0.69%) the evolution of organic matter is in the low mature period, and the shale has not yet entered the oil window. The pores are mostly mineral pores, and there are almost no primary organic pores in the FEM images. The transformation of clay minerals is not obvious. In the second stage (0.69% < EqVRo < 1.25%), a large amount of the liquid hydrocarbons generated by kerogen pyrolysis are stored in pores, which reduces the pore volume of shale. After the formation pressure is applied, the micropore volume increases slightly and the mesopore volume increases significantly. Organic acids produced during hydrocarbon generation dissolves the organic matter and clay minerals, and secondary quartz begins to form [44,45]. The formation of shrinkage cracks is related to hydrocarbon generation (Figure 6b1). In the third stage (1.25% < EqVRo < 2.60%), solid bitumen and crude oil began to pyrolyze to form wet gas, while kerogen is condensed to pyrobitumen. A large number of isolated and dispersed circular pores appear in pyrobitumen. The volume of the micropores in this stage is greatly affected by pressure. The transition from partial micropore volume to mesopore volume makes the micropore volume increase slowly [35]. At the same time, due to hydrocarbon expulsion, the pore morphology gradually changes from narrow slit pores to ink bottle-shaped pores, and the transformation of kaolinite and montmorillonite into illite is common [48]. The fourth stage (2.60% < EqVRo < 3.02%) is the dry gas stage, and light hydrocarbons are rapidly generated. The existence of formation pressure makes some thinner pore walls crack, and increases pore connectivity [35,53].

5. Conclusions

(1)
With the thermal evolution process of marine shale, the quartz content increased, while the content of clay minerals decreased in both the open and semi-closed system pyrolysis experiments. The existence of formation pressure increased the percentage of quartz and decreased the content of clay minerals, and the change of formation pressure had no obvious influence on the maturity evolution of marine shales.
(2)
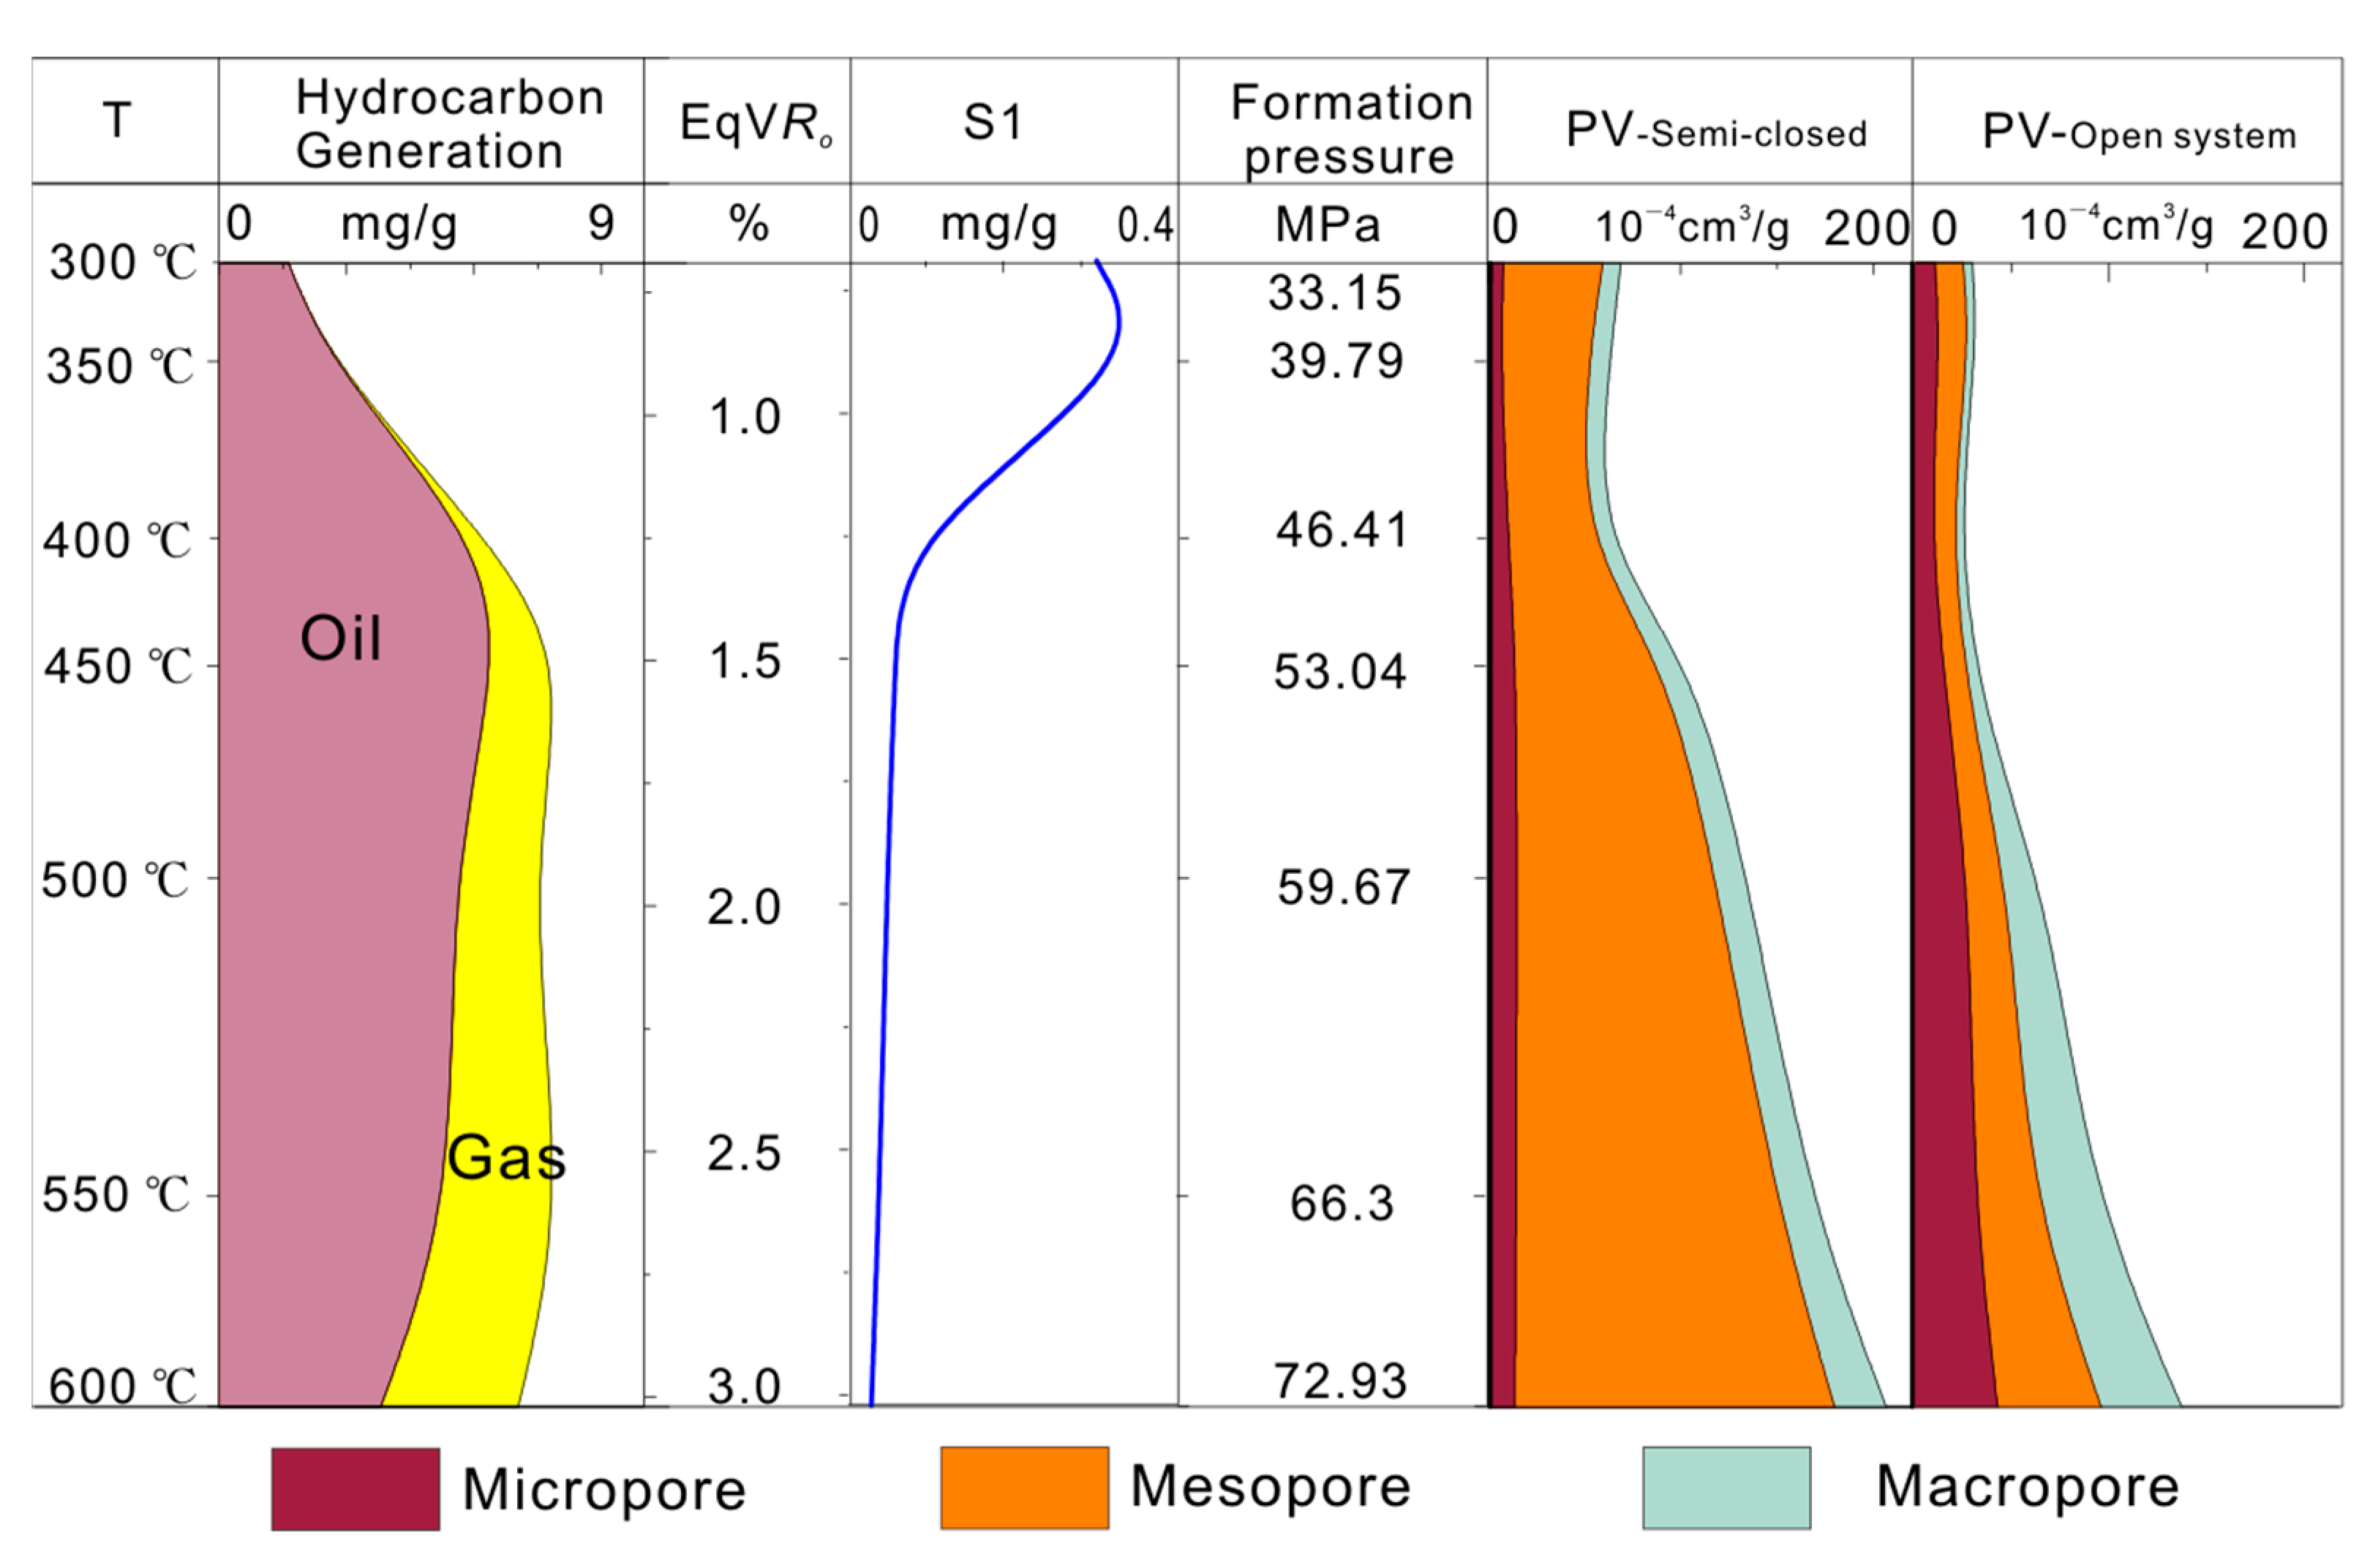
The relationship between formation pressure and pore development is revealed. With the increase of formation pressure, the pore type of shale gradually changes from narrow slit pore to ink bottle-shaped. Formation pressure improves pore connectivity, especially in the high-overmature stage of shale. With the increase of formation pressure, the volume of micropores decreases slightly, the volume of mesopores increases significantly, and the volume of macropores changes in two stages.
(3)
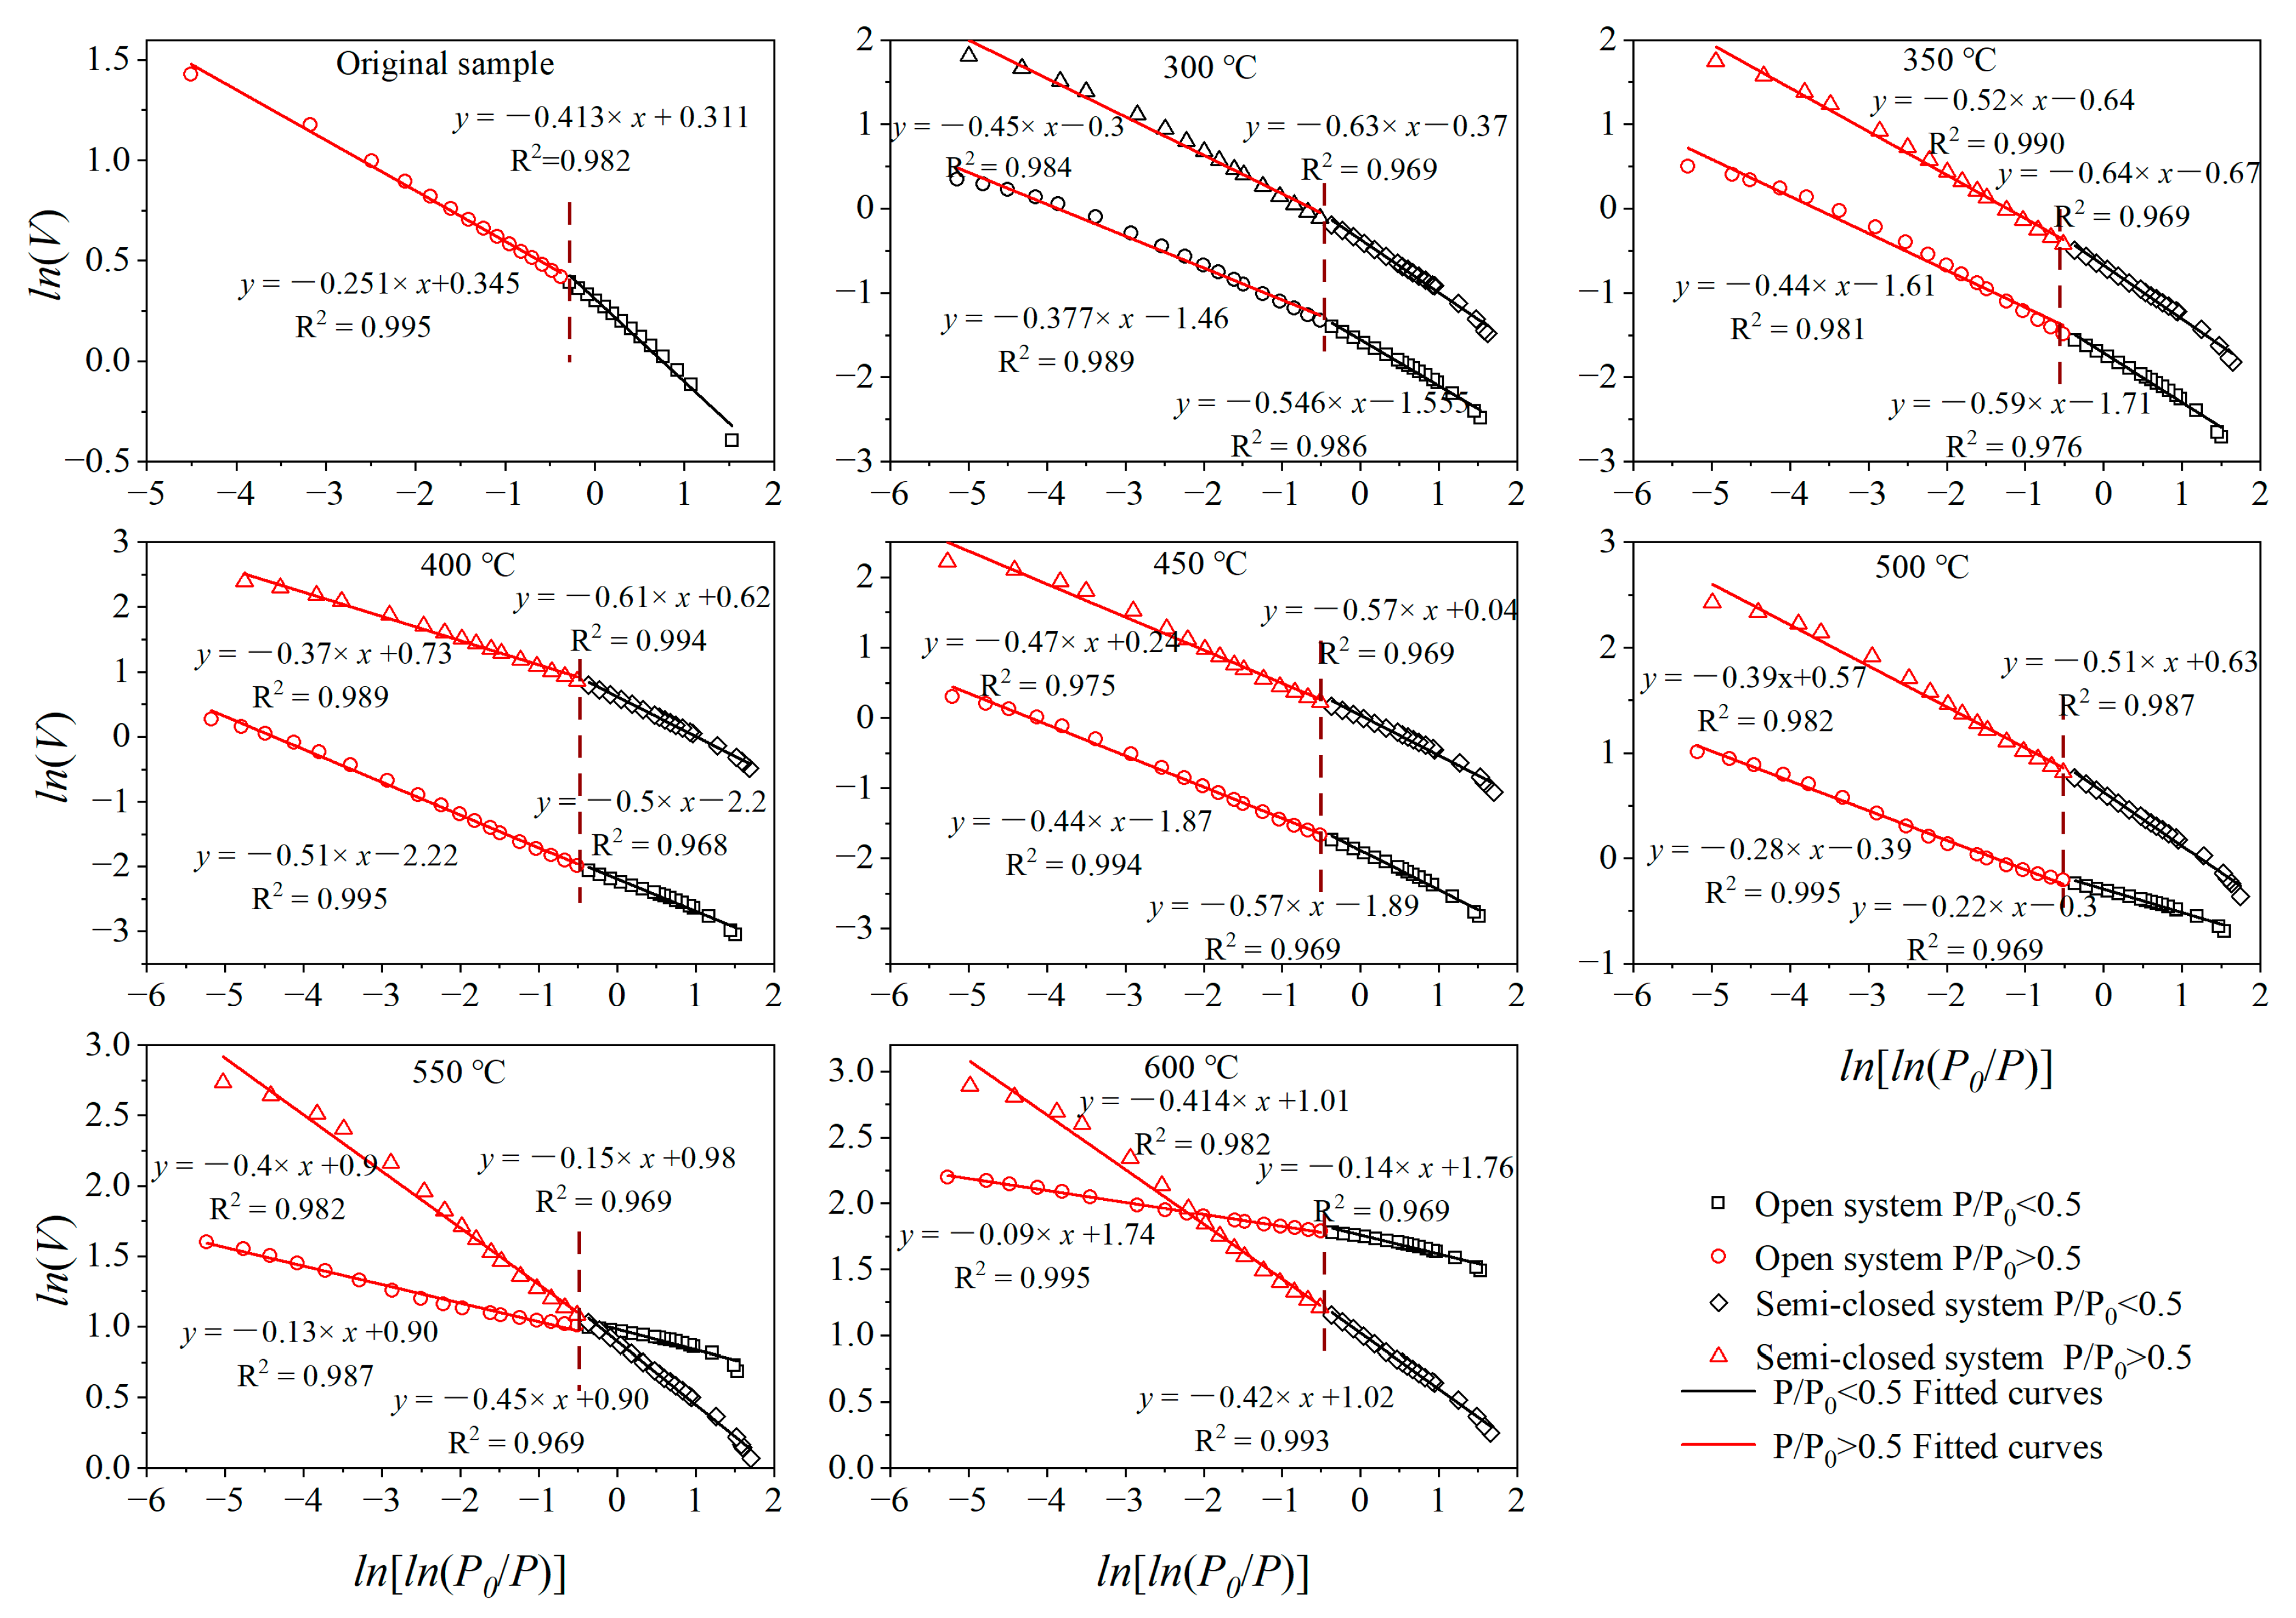
The relationship between formation pressure and pore heterogeneity is revealed. After applying formation pressure, the volume difference between the micropores, mesopores, and macropores of the shale samples became larger. Formation pressure makes the pore surface heterogeneity significantly reduced, while the effect of formation pressure on pore structure heterogeneity is three-stage.
(4)
The pore size/volume results of the comparative thermal evolution experiment show that the retained hydrocarbons mainly occupy the mesopore space of shale, and the existence of formation pressure promotes hydrocarbon expulsion, especially the hydrocarbons in the mesopores.

Author Contributions

D.L. and Y.C. conceived and designed the experiments; X.F. performed the experiments and wrote the paper; X.F. and Y.C. analyzed the data; Q.H. and P.G. revised the paper and provided language support; Y.Q. provided technical support. All authors have read and agreed to the published version of the manuscript.

Funding

This research was funded by the National Natural Science Foundation of China (Grant nos.U19B6003-03-01 and 42030804), the Fundamental Research Funds for the Central Universities (2652022207), and the joint Ph.D. program from China Scholarship Council.

Institutional Review Board Statement

Not applicable.

Informed Consent Statement

Not applicable.

Data Availability Statement

The data used to support the findings of this study are available from the corresponding author upon request.

Conflicts of Interest

The authors declare no conflict of interest.

References

  1. Wang, Y.; Liu, L.; Zheng, S.; Luo, Z.; Sheng, Y.; Wang, X. Full-scale pore structure and its controlling factors of the Wufeng-Longmaxi shale, southern Sichuan Basin, China: Implications for pore evolution of highly overmature marine shale. J. Nat. Gas. Sci. Eng. 2019, 67, 134–146. [Google Scholar] [CrossRef]
  2. Wu, L.; Geng, A.; Wang, P. Oil expulsion in marine shale and its influence on the evolution of nanopores during semi-closed pyrolysis. Int. J. Coal. Geol. 2018, 191, 125–134. [Google Scholar] [CrossRef]
  3. Han, Y.; Horsfield, B.; Wirth, R.; Mahlstedt, N.; Bernard, S. Oil retention and porosity evolution in organic-rich shales. Am. Assoc. Pet. Geol. Bull. 2017, 101, 807–827. [Google Scholar] [CrossRef] [Green Version]
  4. Goodman, A.; Sanguinito, S.; Kutchko, B.; Natesakhawat, S.; Cvetic, P.; Allen, A.J. Shale pore alteration: Potential implications for hydrocarbon extraction and CO2 storage. Fuel 2020, 265, 116930. [Google Scholar] [CrossRef] [PubMed]
  5. Gao, Z.; Xuan, Q.; Hu, Q.; Jiang, Z.; Liu, X. Pore structure evolution characteristics of continental shale in China as indicated from thermal simulation experiments. Am. Assoc. Pet. Geol. Bull. 2021, 105, 2159–2180. [Google Scholar] [CrossRef]
  6. Zhao, J.; Yang, L.; Yang, D.; Kang, Z.; Wang, L. Study on pore and fracture evolution characteristics of oil shale pyrolysed by high-temperature water vapour. Oil Shale 2022, 39, 79–95. [Google Scholar] [CrossRef]
  7. Wang, P.; Zhangm, C.; Li, X.; Zhang, K.; Yuan, Y.; Zang, X. Organic matter pores structure and evolution in shales based on the he ion microscopy (HIM): A case study from the Triassic Yanchang, Lower Silurian Longmaxi and Lower Cambrian Niutitang shales in China. J. Nat. Gas. Sci. Eng. 2020, 84, 103682. [Google Scholar] [CrossRef]
  8. Zhang, Y.; Yu, B.; Pan, Z.; Hou, C.; Zuo, Q.; Sun, M. Effect of thermal maturity on shale pore structure: A combined study using extracted organic matter and bulk shale from Sichuan Basin, China. J. Nat. Gas. Sci. Eng. 2020, 74, 103089. [Google Scholar] [CrossRef]
  9. Liu, X.; Lai, J.; Fan, X.; Shu, H.; Wang, G.; Ma, X. Insights in the pore structure, fluid mobility and oiliness in oil shales of Paleogene Funing Formation in Subei Basin, China. Mar. Pet. Geol. 2020, 114, 104228. [Google Scholar] [CrossRef]
  10. Wei, L.; Mastalerz, M.; Schimmelmann, A.; Chen, Y. Influence of Soxhlet-extractable bitumen and oil on porosity in thermally maturing organic-rich shales. Int. J Coal. Geol. 2014, 132, 38–50. [Google Scholar] [CrossRef] [Green Version]
  11. Geng, Y.; Liang, W.; Liu, J.; Cao, M.; Kang, Z. Evolution of Pore and Fracture Structure of Oil Shale under High Temperature and High Pressure. Energy Fuels 2017, 31, 10404–10413. [Google Scholar] [CrossRef]
  12. Li, G.; Li, G.; Luo, C.; Zhou, R.; Zhou, J.; Yang, J. Dynamic evolution of shale permeability under coupled temperature and effective stress conditions. Energy 2023, 266, 126320. [Google Scholar] [CrossRef]
  13. Wang, T.; Wang, Q.; Lu, H.; Peng, P.; Zhan, X. Understanding pore evolution in a lacustrine calcareous shale reservoir in the oil window by pyrolyzing artificial samples in a semi-closed system. J. Pet. Sci. Eng. 2021, 200, 108230. [Google Scholar] [CrossRef]
  14. Wang, E.; Feng, Y.; Guo, T.; Li, M. Oil content and resource quality evaluation methods for lacustrine shale: A review and a novel three-dimensional quality evaluation model. Earth-Sci. Rev. 2022, 232, 104134. [Google Scholar] [CrossRef]
  15. Sing, K.S.W. Reporting physisorption data for gas/solid systems with special reference to the determination of surface area and porosity (Recommendations 1984). Pure. Appl. Chem. 1985, 57, 603–619. [Google Scholar] [CrossRef]
  16. Cai, Y.; Li, Q.; Liu, D.; Zhou, Y.; Lv, D. Insights into matrix compressibility of coals by mercury intrusion porosimetry and N2 adsorption. Int. J. Coal. Geol. 2018, 200, 199–212. [Google Scholar] [CrossRef] [Green Version]
  17. Bai, L.H.; Liu, B.; Du, Y.J.; Wang, B.Y.; Tian, S.S.; Wang, L. Distribution characteristics and oil mobility thresholds in lacustrine shale reservoir: Insights from N2 adsorption experiments on samples prior to and following hydrocarbon extraction. Pet. Sci. 2022, 19, 486–497. [Google Scholar] [CrossRef]
  18. Su, S.; Jiang, Z.; Xuanlong, S.; Zhang, C.; Zou, Q.; Li, Z. The effects of shale pore structure and mineral components on shale oil accumulation in the Zhanhua Sag, Jiyang Depression, Bohai Bay Basin, China. J. Pet. Sci. Eng. 2018, 165, 365–374. [Google Scholar] [CrossRef]
  19. Clarkson, C.R.; Solano, N.; Bustin, R.M.; Bustin, A.M.M.; Chalmers, G.R.L.; He, L. Pore structure characterization of North American shale gas reservoirs using USANS/SANS, gas adsorption, and mercury intrusion. Fuel 2013, 103, 606–616. [Google Scholar] [CrossRef]
  20. Wang, Q.; Hu, Q.; Ning, X.; Ilavsky, J.; Kuzmenko, I.; Tom, T. Spatial heterogeneity analyses of pore structure and mineral composition of Barnett Shale using X-ray scattering techniques. Mar. Pet. Geol. 2021, 134, 105354. [Google Scholar] [CrossRef]
  21. Fang, X.; Cai, Y.; Hu, Q.; Liu, D.; Gao, P.; Qian, Y. Hydrocarbon Retention and Its Effect on Pore Structure Evolution of Marine Shale Based on Pyrolysis Simulation Experiments. Energy Fuels 2022, 36, 13556–13569. [Google Scholar] [CrossRef]
  22. Graham, S.P.; Rouainia, M.; Aplin, A.C.; Cubillas, P.; Fender, T.D.; Armitage, P.J. Geomechanical characterisation of organic-rich calcareous shale using AFM and nanoindentation. Rock. Mech. Rock. Eng. 2021, 54, 303–320. [Google Scholar] [CrossRef]
  23. Han, Y.; Horsfield, B.; Mahlstedt, N.; Wirth, R.; Curry, D.J.; LaReau, H. Factors controlling source and reservoir characteristics in the Niobrara shale oil system, Denver Basin. Am. Assoc. Pet. Geol. Bull. 2019, 103, 2045–2072. [Google Scholar] [CrossRef]
  24. Sun, L.; Tuo, J.; Zhang, M.; Wu, C.; Wang, Z.; Zheng, Y. Formation and development of the pore structure in Chang 7 member oil-shale from Ordos Basin during organic matter evolution induced by hydrous pyrolysis. Fuel 2015, 158, 549–557. [Google Scholar] [CrossRef]
  25. Tang, X.; Zhang, J.; Jin, Z.; Xiong, J.; Lin, L.; Yu, Y. Experimental investigation of thermal maturation on shale reservoir properties from hydrous pyrolysis of Chang 7 shale, Ordos Basin. Mar. Pet. Geol. 2015, 64, 165–172. [Google Scholar] [CrossRef]
  26. Hu, H.; Hao, F.; Lin, J.; Lu, Y.; Ma, Y.; Li, Q. Organic matter-hosted pore system in the Wufeng-Longmaxi (O3w-S11) shale, Jiaoshiba area, Eastern Sichuan Basin, China. Int. J. Coal. Geol. 2017, 173, 40–50. [Google Scholar] [CrossRef]
  27. Wu, S.; Yang, Z.; Zhai, X.; Cui, J.; Bai, L.; Pan, S. An experimental study of organic matter, minerals and porosity evolution in shales within high-temperature and high-pressure constraints. Mar. Pet. Geol. 2019, 102, 377–390. [Google Scholar] [CrossRef]
  28. Xie, X.; Hu, L.; Deng, H.; Gao, J. Evolution of pore structure and fractal characteristics of marine shale during electromagnetic radiation. PLoS ONE 2020, 15, e0239662. [Google Scholar] [CrossRef]
  29. Chandra, D.; Bakshi, T.; Vishal, V. Thermal effect on pore characteristics of shale under inert and oxic environments: Insights on pore evolution. Microporous Mesoporous Mater. 2021, 316, 110969. [Google Scholar] [CrossRef]
  30. Shao, D.; Zhang, T.; Zhang, L.; Li, Y.; Meng, K. Effects of pressure on gas generation and pore evolution in thermally matured calcareous mudrock: Insights from gold-tube pyrolysis of the Eagle Ford Shale using miniature core plugs. Int. J. Coal. Geol. 2022, 252, 103936. [Google Scholar] [CrossRef]
  31. Wang, L.; Yang, D.; Zhao, Y.; Wang, G. Evolution of pore characteristics in oil shale during pyrolysis under convection and conduction heating modes. Oil Shale 2020, 37, 224–241. [Google Scholar] [CrossRef]
  32. Zhu, J.; Yang, Z.; Li, X.; Wang, N.; Jia, M. Evaluation of different microwave heating parameters on the pore structure of oil shale samples. Energy Sci. Eng. 2018, 6, 797–809. [Google Scholar] [CrossRef]
  33. Yang, X.G.; Guo, S.B. Porosity model and pore evolution of transitional shales: An example from the Southern North China Basin. Pet. Sci. 2020, 17, 1512–1526. [Google Scholar] [CrossRef]
  34. Zhang, Y.; Hu, S.; Shen, C.; Liao, Z.; Xu, J.; Zhang, X. Factors influencing the evolution of shale pores in enclosed and semi-enclosed thermal simulation experiments, Permian Lucaogou Formation, Santanghu Basin, China. Mar. Pet. Geol. 2022, 135, 105421. [Google Scholar] [CrossRef]
  35. Song, D.; Tuo, J.; Zhang, M.; Wu, C.; Su, L.; Li, J. Hydrocarbon generation potential and evolution of pore characteristics of Mesoproterozoic shales in north China: Results from semi-closed pyrolysis experiments. J. Nat. Gas. Sci. Eng. 2019, 62, 171–183. [Google Scholar] [CrossRef]
  36. Connan, J. Time-temperature relation in oil genesis: REPLY. Am. Assoc. Pet. Geol. Bull. 1976, 60, 2516–2521. [Google Scholar]
  37. Gao, Z.; Fan, Y.; Xuan, Q.; Zheng, G. A review of shale pore structure evolution characteristics with increasing thermal maturities. Adv. Geo-Energy Res. 2020, 4, 247–259. [Google Scholar] [CrossRef]
  38. Shi, M.; Yu, B.; Zhang, J.; Huang, H.; Yuan, Y.; Li, B. Evolution of organic pores in marine shales undergoing thermocompression: A simulation experiment using hydrocarbon generation and expulsion. J. Nat. Gas. Sci. Eng. 2018, 59, 406–413. [Google Scholar] [CrossRef]
  39. Ma, Y.; Ardakani, O.H.; Zhong, N.; Liu, H.; Huang, H.; Larter, S. Possible pore structure deformation effects on the shale gas enrichment: An example from the Lower Cambrian shales of the Eastern Upper Yangtze Platform, South China. Int. J. Coal. Geol. 2020, 217, 103349. [Google Scholar] [CrossRef]
  40. Li, Z.; Liu, D.; Cai, Y.; Ranjith, P.G.; Yao, Y. Multi-scale quantitative characterization of 3-D pore-fracture networks in bituminous and anthracite coals using FIB-SEM tomography and X-ray Μ-CT. Fuel 2017, 209, 43–53. [Google Scholar] [CrossRef]
  41. Hu, Q.; Kalteyer, R.; Wang, J.; El-Sobky, H.F. Nanopetrophysical characterization of the Mancos Shale Formation in the San Juan Basin of northwestern New Mexico, USA. Interpretation 2019, 7, SJ45–SJ65. [Google Scholar] [CrossRef]
  42. Wang, Y.; Qiu, N.; Ma, Z.; Ning, C.; Zheng, L.; Zhou, Y. Evaluation of equivalent relationship between vitrinite reflectance and solid bitumen reflectance. J. China. Univ. Min. Technol. 2020, 49, 563–575. [Google Scholar]
  43. Baruch, E.T.; Kennedy, M.J.; Löhr, S.C.; Dewhurst, D.N. Feldspar dissolution-enhanced porosity in Paleoproterozoic shale reservoir facies from the Barney Creek Formation (McArthur Basin, Australia). Am. Assoc. Pet. Geol. Bull. 2015, 99, 1745–1770. [Google Scholar] [CrossRef]
  44. Wang, F.; Guo, S. Influential factors and model of shale pore evolution: A case study of a continental shale from the Ordos Basin. Mar. Pet. Geol. 2019, 102, 271–282. [Google Scholar] [CrossRef]
  45. Xu, L.; Yang, K.; Wei, H.; Liu, L.; Li, X.; Chen, L. Diagenetic evolution sequence and pore evolution model of Mesoproterozoic Xiamaling organic-rich shale in Zhangjiakou, Hebei, based on pyrolysis simulation experiments. Mar. Pet. Geol. 2021, 132, 105233. [Google Scholar] [CrossRef]
  46. Zhang, S.; Yang, Y.; Zhang, L.; Cao, Y. Formation mechanism of secondary quartz and its influence on physical properties of xu 2 Member reservoir in western Sichuan Depression. Xinjiang Pet. Geol. 2023, 44, 25–32. [Google Scholar]
  47. Kang, Z.; Zhao, J.; Yang, D.; Zhao, Y.; Hu, Y. Study of the evolution of micron-scale pore structure in oil shale at different temperatures. Oil Shale 2017, 34, 42–54. [Google Scholar] [CrossRef] [Green Version]
  48. He, W.; Sun, Y.; Shan, X. Organic matter evolution in pyrolysis experiments of oil shale under high pressure: Guidance for in situ conversion of oil shale in the Songliao Basin. J. Anal. Appl. Pyrolysis 2021, 155, 105091. [Google Scholar] [CrossRef]
  49. Ma, B.; Hu, Q.; Yang, S.; Zhang, T.; Qiao, H.; Meng, M. Pore structure typing and fractal characteristics of lacustrine shale from Kongdian Formation in East China. J. Nat. Gas. Sci. Eng. 2021, 85, 103709. [Google Scholar] [CrossRef]
  50. Shan, C.; Zhao, W.; Wang, F.; Zhang, K.; Feng, Z.; Guo, L. Nanoscale pore structure heterogeneity and its quantitative characterization in Chang7 lacustrine shale of the southeastern Ordos Basin, China. J. Pet. Sci. Eng 2020, 187, 106754. [Google Scholar] [CrossRef]
  51. Li, X.; Jiang, Z.; Jiang, S.; Li, Z.; Song, Y.; Jiang, H. Various controlling factors of matrix-related pores from differing depositional shales of the Yangtze Block in south China: Insight from organic matter isolation and fractal analysis. Mar. Pet. Geol. 2020, 111, 720–734. [Google Scholar] [CrossRef]
  52. Liu, C.; Xu, X.; Liu, K.; Bai, J.; Liu, W.; Chen, S. Pore-scale oil distribution in shales of the Qingshankou formation in the Changling Sag, Songliao Basin, NE China. Mar. Pet. Geol. 2020, 120, 104553. [Google Scholar] [CrossRef]
  53. Mastalerz, M.; Schimmelmann, A.; Drobniak, A.; Chen, Y. Porosity of Devonian and Mississippian New Albany Shale across a maturation gradient: Insights from organic petrology’, gas adsorption, and mercury intrusion. Am. Assoc. Pet. Geol. Bull. 2013, 97, 1621–1643. [Google Scholar] [CrossRef]
Figure 1. Schematic diagram of open system pyrolysis experiment.
Processes 11 01007 g001
Figure 2. Schematic diagram of thermocompression pyrolysis experiment system [21].
Processes 11 01007 g002
Figure 3. Comparison of shale thermal maturity based on open and semi-closed system pyrolysis experiment. Data of semi-closed pyrolysis are cited from Fang et al. [21].
Processes 11 01007 g003
Figure 4. (a) Columnar diagram of mineral contents between two pyrolysis experiments, and (b) Mineral contents comparison between two pyrolysis experiments. Notes: OSP-Open system pyrolysis; SSP- Semi-closed system pyrolysis. Data of semi-closed pyrolysis are cited by Fang et al. [21].
Processes 11 01007 g004
Figure 5. Changes of (a) quartz and (b) clay mineral content during thermal evolution of shale under two pyrolysis experiments Data of semi-closed pyrolysis are cited from Fang et al. [21].
Processes 11 01007 g005
Figure 6. (1) SEM images of pyrolysis samples at temperatures from 300 to 450 °C. (2) SEM images of pyrolysis samples at temperatures from 500 to 600 °C. Notes: (a1g1) samples based on open system pyrolysis: (a1) micro-fracture in inorganic mineral at 300 °C, Ro = 0.68%; (b1) mineral shrinkage pore and interpores at 350 °C, Ro = 0.86%; (c1) secondary mineral at 400 °C, Ro = 1.23%; (d1) OM pore at 450 °C, Ro = 1.61%; (e1) OM pore at 500 °C, Ro = 2.01%; (f1) OM pore at 550 °C, Ro = 2.58%; (g1) OM pore at 600 °C, Ro = 3.09%. (a2g2) Samples based on semi-closed system pyrolysis: (a2) dissolved pores and pyrite at 300 °C, Ro = 0.69%; (b2) original OM pores developed at 350 °C, Ro = 0.89%; (c2) liquid hydrocarbon and microfracture at 400 °C, Ro = 1.25%; (d2) there are a large number of OM pores in the pyrobitumen of shale at 450 °C, Ro = 1.51%; (e2) OM pores at 500 °C, Ro = 1.95%; (f2) OM pores with good connectivity in shale at 550 °C, Ro = 2.60%; and (g2) large size OM pore with good connectivity in shale at 600 °C, Ro = 3.02%. (a2g2) are cited from Fang et al. [21].
Processes 11 01007 g006aProcesses 11 01007 g006b
Figure 7. (a1,a2) CO2 adsorption isotherms, (b1,b2) N2 adsorption/desorption isotherms, and (c1,c2) MIP curves from the two pyrolysis experiments. Data of semi-closed pyrolysis are cited from Fang et al. [21].
Processes 11 01007 g007
Figure 8. Full-scale pore size distribution of pyrolysis shales obtained by MIP, N2 and CO2 physisorption based on (a) open system and (b) semi-closed system pyrolysis experiments [21].
Processes 11 01007 g008
Figure 9. Full-scale pore size distribution based on open system and semi-closed system pyrolysis experiments by MIP, and CO2 and N2 physisorption. (a) Full-scale PSD of all samples; the dashed lines are data of open system pyrolysis, and the solid lines are semi-closed system pyrolysis. (bh) Full-scale PSD of shale with temperature from 300 to 600 °C; the red curves are data of open system pyrolysis, the green curves are data of semi-closed system pyrolysis. Data of semi-closed pyrolysis are cited from Fang et al. [21].
Processes 11 01007 g009
Figure 10. Changes of pore volume of shale during (a) open system and (b) semi-closed system pyrolysis experiments. Data of semi-closed pyrolysis are cited from Fang et al. [21].
Processes 11 01007 g010
Figure 11. The difference in pore volume in the shale samples between the open and semi-closed system pyrolysis experiments. (a) Total comparison of pore volume; (b) micropore volume difference; (c) mesopore volume difference; (d) macropore volume difference. Data of semi-closed pyrolysis are cited from Fang et al. [21].
Processes 11 01007 g011
Figure 12. Plots of ln(V) versus ln[ln(P0/P)] from low-temperature nitrogen physisorption isotherm data using the open system and semi-closed system pyrolysis experiments. Data of semi-closed pyrolysis are cited from Fang et al. [21].
Processes 11 01007 g012
Figure 13. Relationships between fractal dimension and Ro based on (a) the open system and (b) semi-closed system pyrolysis experiments; (c) pore surface fractal dimension variation between the open and semi-closed system pyrolysis experiments during shale thermal evolution; (d) pore structure fractal dimension variation between the open and semi-closed system pyrolysis experiments during shale thermal evolution. Note: D1 is the pore surface fractal dimension, and D2 is the pore structure fractal dimension. Data of semi-closed pyrolysis are cited from Fang et al. [21].
Processes 11 01007 g013
Figure 14. Pore evolution model of organic-rich marine shale based on formation pressure.
Processes 11 01007 g014
Table 1. Experimental conditions for open and semi-closed pyrolysis experiments.
Sample No.XHY-1XHY-2XHY-3XHY-4XHY-5XHY-6XHY-7
T, (°C)300350400450500550600
Sample no.XHY-01XHY-02XHY-03XHY-04XHY-05XHY-06XHY-07
T, (°C)300350400450500550600
H, (m)2500300035004000450050005500
Pf, (MPa)33.1539.7846.4153.0459.6766.372.93
Pl, (MPa)56.7568.179.4590.8102.15113.5124.85
Note: T = Simulated temperature, °C; H = Simulated burial depth, m; Pf = Formation pressure, MPa; Pl = Lithostatic pressure, MPa.
Table 2. Results of open and semi-closed pyrolysis experiments and Rock-Eval pyrolysis parameters.
Sample TypeSample No.TEqVRoLGTOCTmaxHIS1S2
(°C)(%)(mg/g)(mg/g)(%)(°C)(mg/gTOC)(mg/g)(mg/g)
OriginalXHY-0.67--5.74432308.060.8910.55
Open systemXHY-13000.68-0.035.71436295.32.456.31
XHY-23500.86-0.215.68446285.193.214.29
XHY-34001.23-0.585.32466232.14.323.19
XHY-44501.61-1.494.89487201.596.133.21
XHY-55002.01-2.334.01509178.585.172.14
XHY-65502.58-3.683.44541141.465.241.19
XHY-76003.09-4.412.93569114.514.320.32
Semi-closed systemXHY-013000.691.640.005.03440268.60.324.62
XHY-023500.892.570.014.32447181.210.392.99
XHY-034001.256.120.222.15535175.910.072.41
XHY-044501.516.601.691.83560121.80.061.83
XHY-055001.955.421.811.5355984.960.051.1
XHY-065502.65.562.611.2443427.420.040.34
XHY-076003.023.813.231.194493.480.030.04
Notes: T = experimental temperature, °C; EqVRo = equivalent vitrinite reflectance, %; L = liquid hydrocarbon yield, mg/g; G = gaseous hydrocarbon yield, mg/g; TOC = total organic carbon, %; Tmax = the temperature at the maximum release of hydrocarbons occurs during Rock-Eval pyrolysis, °C; HI = hydrogen index, mg/gTOC; S1 = hydrocarbon released from source rock under 300 °C, mg/g; S2 = hydrocarbon released from source rock under 300–600 °C, mg/g. Data of semi-closed pyrolysis are cited from Fang et al. [21].
Table 3. PSD and fractal dimension of shale samples based on open and semi-closed pyrolysis experiments.
Sample
no.
PV-OSP (10−4 cm3/g)D1-OSPD2-OSPSample
no.
PV-SSP (10−4 cm3/g )D1-SSPD2-SSP
<2 nm2–50 nm>50 nmTPV-OSP<2 nm2–50 nm>50 nmTPV-SSP
XHY-110.3914.374.9129.672.452.62XHY-017.0851.709.2868.062.372.55
XHY-212.8615.503.8632.222.412.56XHY-025.5245.6211.1462.282.362.48
XHY-37.839.803.9721.602.502.49XHY-039.4237.308.2254.942.392.63
XHY-417.3811.635.9834.992.442.56XHY-0413.4879.1413.81106.442.432.53
XHY-528.9821.3820.2070.552.782.72XHY-0513.81104.1916.92134.922.492.61
XHY-629.6827.9431.8789.492.862.87XHY-0613.63134.6817.39165.712.552.60
XHY-744.6257.3742.94144.922.862.91XHY-0712.87166.4926.94206.302.582.59
Note: OSP = pore data based on open system pyrolysis; SSP = pore data based on semi-closed system pyrolysis; PV = pore volume; TPV = total pore volume; D1 is the pore surface fractal dimension; D2 is the pore structure fractal dimension. Data of semi-closed pyrolysis are cited from Fang et al. [21].
Disclaimer/Publisher’s Note: The statements, opinions and data contained in all publications are solely those of the individual author(s) and contributor(s) and not of MDPI and/or the editor(s). MDPI and/or the editor(s) disclaim responsibility for any injury to people or property resulting from any ideas, methods, instructions or products referred to in the content.

