Article

Integrated Biobased Processes for Nanocellulose Preparation from Rice Straw Cellulose

by
Sirirat Jirathampinyo
1,
Warathorn Chumchoochart
1 and
Jidapha Tinoi
2,3,*
1
Interdisciplinary Program in Biotechnology, Graduate School, Chiang Mai University, Chiang Mai 50200, Thailand
2
Department of Chemistry, Faculty of Science, Chiang Mai University, Chiang Mai 50200, Thailand
3
Center of Excellence in Materials Science and Technology, Chiang Mai University, Chiang Mai 50200, Thailand
*
Author to whom correspondence should be addressed.
Processes 2023, 11(4), 1006; https://doi.org/10.3390/pr11041006
Submission received: 4 March 2023 / Revised: 19 March 2023 / Accepted: 24 March 2023 / Published: 26 March 2023

Abstract

:
High-potential nanomaterials were derived from rice straw using the integrated biobased processes of enzymatic hydrolysis with green organic acid hydrolysis assisted with ultrasonication pretreatment. The optimization condition of nanocellulose preparation by enzymatic hydrolysis via central composite design (CCD) achieved a maximum nanocellulose content of 32.37 ± 0.47% using a cellulase concentration of 107.06 U/mL and 0.13% (w/w) of rice straw cellulose. The ultrasonication-assisted pretreatment prior to enzymatic hydrolysis improved nanocellulose preparation to 52.28 ± 1.55%. Integration with oxalic acid hydrolysis increased the nanocellulose content to 64.99 ± 0.16%. Granular nanocellulose was obtained and consisted of a 105–825 nm nanosize with a zeta potential value of −34.5 mV, and nanocellulose suspension showed high stability without aggregation. In addition, the remaining rice straw cellulose after oxalic acid was microcrystalline nanocellulose. All prepared nanocellulose represented a functional group as original cellulose but had a low crystallinity index (CrI) of 15.68% that could be classified as amorphous nanocellulose. Based on their characteristics, all nanocellose could be further applied in food, cosmetics, and pharmaceuticals. Moreover, the results indicated that the rice straw could be an alternative non-edible cellulose source for preparing potential nanocellulose via a controlled hydrolysis process.

Graphical Abstract

1. Introduction

Nanocellulose is a natural cellulose fiber that can be prepared from cellulose; it is represented in plants and animals and produced by bacteria. Nanocellulose is generally contained in a nanosize diameter and is several micrometers in length. According to the types of nanocellulose and based on their morphological characteristics, nanocellulose can be categorized into six groups, including cellulose nanocrystals (CNCs), cellulose nanofibrils (CNFs), amorphous nanocellulose (ANC), cellulose microfibrils (CMFs), microcrystalline cellulose (MCC), and cellulose nanoyarn (CNY) [1]. Over the past few years, researchers have represented the attractive properties of nanocellulose—e.g., excellent mechanical properties, high surface area for modification, biocompatibility, biodegradability, and low toxicity. Therefore, nanocellulose can be applied in many fields, such as biomedical, pharmaceutical, nanocomposite, cosmetics, environmental, etc. [2,3,4,5].
Nanocellulose is typically prepared via various approaches such as acid hydrolysis, enzymatic hydrolysis, oxidative, mechanical, and combination methods [6,7]. Among these approaches, concentrated strong acid hydrolysis is commonly used for CNC preparation. However, various economic and environmental concerns challenge conventional methods for nanocellulose preparation. Solid acids have shown the advantage of easing acid recovery by crystallization at a low temperature. The current study selected an organic acid, oxalic acid, to hydrolyze cellulose into nanocellulose. Oxalic acid has low water solubility at room temperature but is highly soluble at high temperatures, with results in the effective hydrolysis of cellulose at high concentrations. Li et al. [8] produced CNCs with a high yield of 80.6% from plant-based acid through oxalic acid hydrolysis. Chen et al. [9] found that the nanocellulose content (approximately 25%) from eucalyptus obtained by using 50% oxalic acid at 100 °C for 45 min and reducing sugar content was less than 10%. In addition, by combining oxalic acid hydrolysis with mechanical pretreatment, pressured homogenization demonstrated high nanofibrillation yields (76.5%) [10]. Meanwhile, Bondancia et al. [11] used another organic acid, citric acid, to produce CNCs. Even though the results revealed a high content of nanocellulose (23.1 ± 0.9%) and high acid recovery for later reuse, the low strength of the green acid resulted in low migration of the acid into the cellulose and high energy consumption (e.g., high temperature, prolonged process).
Moreover, enzymatic hydrolysis is a compromise method, due to its being performed in mild conditions and the fact that it does not produce harmful waste. Enzymatic pretreatment has shown great potential in deconstructing cellulose into nanofibrils via commercial endoglucanase. The pretreatment time and the enzyme dosage were optimized using response surface methodology [12]. Chen et al. [13] prepared granular CNCs with diameters of 30 nm from cotton pulp fiber by using a cellulase concentration of 300 U/mL and a hydrolysis time of 5 h. Nevertheless, nanocellulose preparation through enzymatic hydrolysis was operated for a long time and obtained variable types of nanocellulose. Enzymatic hydrolysis is often incorporated with other methods to solve this problem. Ultrasonication with the hydrodynamic forces of ultrasound is a process for the defibrillation of cellulose fiber. Employing acid hydrolysis with ultrasonic treatment improved the production yield and quality of CNCs from palm oil empty fruit bunch pulps. The increase in yield was due to the enhancement of acid accessibility by ultrasonic pretreatment [14]. Cui et al. [15] used the green preparation of rod-like CNCs with a lengths of 200–500 nm and widths of 10 nm through ultrasonic-assisted enzymatic hydrolysis. Therefore, the process for intensification with the combination of technologies improved the efficiency of nanocellulose preparation, including increasing production yield, reducing the reaction time, and improving the characteristics of the nanocellulose.
In previous studies, several of them used renewable cellulose sources for nanocellulose preparation, such as sugar bagasse [16], eucalyptus [17], pineapple leaf [18], cotton [13,19], and rice straw [20]. Thailand is recognized as one of the main rice producers in Asia. However, every kilogram of harvested rice can generate a rice straw byproduct of around 1 to 1.5 kg [21]. Therefore, the abundance of rice straw as agricultural waste was discarded as a leftover in the field, which led to eliminating the rice straw by burning it in open areas to prepare the land for the next crop. Thus, the burning field caused a severe impact on human health. Aquino et al. [21] reported that the lignocellulosic composition of rice straw was mainly composed of cellulose (32–38%). Thakur et al. [20] used rice straw to produce nanocellulose by sulfuric acid hydrolysis. The highest yield of nanocellulose (90.28%) was obtained from 75% sulfuric acid at 30 °C and a hydrolysis time for 5 h. The results revealed a rod-like shape with a 5–15 nm diameter. Therefore, rice straw could be considered a suitable source for preparing nanocellulose, because it is low-cost and sustainable.
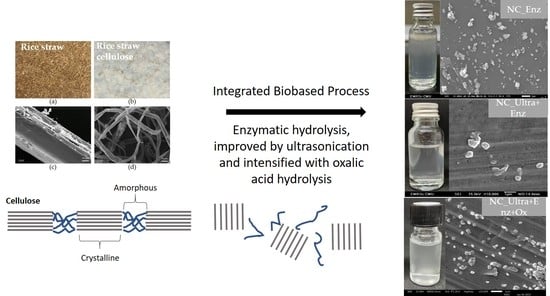
This study aimed to establish the preparation of nanocellulose from rice straw through enzymatic hydrolysis consisting of ultrasonication-assisted pretreatment and integration with green acid hydrolysis. The rice straw cellulose was prepared via alkaline pretreatment and a bleaching process. A central composite design (CCD) achieved the optimized variable level in the enzymatic hydrolysis. Moreover, this study aimed to improve the efficiency of nanocellulose production by ultrasonication-assisted pretreatment of rice straw cellulose prior to enzymatic hydrolysis and intensified the nanocellulose preparation from rice straw residue using green acid hydrolysis. The different types of nanocellulose were obtained and characterized using scanning electron microscopy (SEM), dynamic light scattering (DLS), zeta potentials, Fourier transform infrared (FTIR), and X-ray diffractometry (XRD).

2. Materials and Methods

2.1. Materials

Rice straw (Oryza sativa) strain DR105 was provided from a local field in San Sai (Chiang Mai, Thailand). After drying at 60 °C in a hot air oven overnight, the rice straw was ground into small particle sizes and sieved through a 24 wire mesh. The ground rice straw was kept in an airtight plastic bag and stored at room temperature. The iKnowZyme® Cellulase (endoglucanase, EC 3.2.1.4) (13,000 IU/mL) is a liquid enzyme from iKnowZyme, Bangkok, Thailand.

2.2. Cellulose Extraction

Rice straw was alkali-pretreated with 5% NaOH solution at a ratio of 1: 20 (w/v) under the autoclaving condition for 20 min (modified from Kobkham et al. [22]). The rice straw was filtrated and washed with distilled water until a neutral pH was obtained and was then dried at 60 °C in a hot air oven overnight. After that, the alkali-pretreated rice straw was bleached with 2% sodium chlorite at 70 °C for 2 h. Rice straw cellulose was obtained by filtration, washed with deionized water until the pH became neutral, and dried in a hot air oven overnight at 60 °C.

2.3. Lignocellulosic Composition

The lignocellulosic composition of rice straw, alkaline-pretreated rice straw, and rice straw cellulose were determined by forage fiber analysis [23]. This method is a rapid procedure for determining plant cell wall constituents by determining the insoluble fiber in neutral detergent. The sample was exposed to neutral detergent fiber (NDF), acid detergent fiber (ADF), acid detergent lignin (ADL), and acid-insoluble ash (AIA).
The NDF is defined as the cell wall constituents (cellulose, hemicellulose, and lignin) obtained from the yield recovered after refluxing with a neutral detergent fiber reagent for 1 h. After that, the solution was filtrated through a crucible filter, washed with DI water followed by acetone, dried, and weighed.
ADF is an estimate of soluble hemicellulose in an acid detergent solution containing sulfuric acid and cetyl trimethyl ammonium bromide via refluxing of the sample for 1 h. Then, the residue was separated by filtration and washing with DI water and acetone. The solid residue was dried and weighed. The obtained residue comprised cellulose, lignin, and acid-insoluble ash (mainly silica).
The ADL was used to evaluate the cellulose content after hydrolyzing the ADF with the acid detergent solution containing 72% sulfuric acid for 3 h, and the solid residue was filtered, washed, dried, and weighed. The remained residue refers to lignin and acid-insoluble ash.
AIA is designed to determine the amount of insoluble ash in sulfuric acid from the ADL process. The ADL residue was ignited at 500 °C for 3 h in the furnace and weighed.
The percentages of hemicellulose, cellulose, and lignin were then evaluated using the following equation:
Hemicellulose (%) = %NDF − %ADF
Cellulose (%) = %ADF − %ADL
Lignin (%) = %ADL − %AIA
The ground-dried samples were heated with the concentrated nitric acid on a hot plate stirrer until the solution was clear. The hydrogen peroxide was added and heated until the solution was colorless. The digested solution was diluted and analyzed by the ICP-OES.

2.4. Nanocellulose Preparation

2.4.1. Optimization of Nanocellulose Preparation Using Enzymatic Hydrolysis

The two variables, cellulase concentration (10–300 U/mL) and rice straw cellulose concentration (0.05–0.20%, w/v), were employed to optimize the condition of enzymatic hydrolysis in nanocellulose preparation. A total of 13 runs of the central composite design (CCD) with two variables and five levels were evaluated for the interaction effects on nanocellulose preparation by response surface methodology, as shown in Table 1. The statistical software Design-Expert® version 7.0.0 (Stat-Ease Inc., MN, USA) was used to generate an experimental design. According to the designed experiment, the condition was carried out in 25 mL of 50 mM acetate buffer (pH 5.0) and incubated at 30 °C with a shaking rate of 120 rpm for 1 h in a shaking incubator (ThermoStableTMIS-20, Daihan Scientific (Thailand) Co., Ltd., Seoul, South Korea). The reaction was stopped by boiling for 10 min. After that, the mixture was centrifuged using a J2-MC centrifuge (Beckman, New York, USA) at 10,000 rpm for 15 min, and the supernatant was collected for reducing sugar evaluation. The precipitate was dispersed into the DI water in an ultrasonication bath (Branson, Connecticut, USA) for 10 min. The solid residue of rice straw cellulose was separated by centrifugation at 3500 rpm for 10 min, and the nanocellulose suspension was collected in a glass bottle and stored at 4 °C before further characterization. The solid residue of rice straw cellulose content was also calculated.

Validation of Nanocellulose Preparation in Optimal Condition

The optimized cellulase and rice straw cellulose concentrations were validated by the predicted nanocellulose preparation to ensure quadratic model fitting.

2.4.2. Improvement of Nanocellulose Preparation by Ultrasonic-Assisted Pretreatment

The rice straw cellulose was added to 50 mM acetate buffer (pH 5.0) and treated with a high-intensity ultrasonic processor (VCX 750, Sonics®, Manchester, CT, USA) using 500 W and 20 kHz for 5 min (at the amplitude of 65%, pulses of 2 s on and 1 s off). Afterward, the treated rice straw cellulose was hydrolyzed by enzymatic hydrolysis under optimal condition. The reaction was stopped, and the mixture was separated. The supernatant was then determined for the reducing sugar content. The precipitate was dispersed in DI water and centrifuged to obtain nanocellulose suspension for characterization. The solid residue of rice straw cellulose was then further hydrolyzed.

2.4.3. Intensification of Nanocellulose Preparation by Integrated Oxalic Acid Hydrolysis

After enzymatic hydrolysis was assisted with ultrasonic treatment, the solid residue of rice straw cellulose was hydrolyzed using 50% oxalic acid at 100 °C for 45 min (modified from Chen et al. [24]). The reaction was terminated by adding 50 mL of hot DI water and quickly filtrated under a vacuum. The oxalic acid in the filtrate was recrystallized. The aliquot was collected, and the precipitate was resuspended with DI water, followed by centrifuging at 10,000 rpm for 10 min until the pH became neutral. The obtained nanocellulose was dispersed using an ultrasonic bath for 10 min and centrifuged at 3500 rpm. The nanocellulose suspension and remaining rice straw cellulose were evaluated and characterized.

2.5. Analysis Methods

Nanocellulose Content

The content of nanocellulose was calculated using the following Equation (1) [24]
N a n o c e l l u l o s e   c o n t e n t   % = W W 1 W 2 / W × 100
where W is the weight of rice straw cellulose (g), W1 is the total reducing sugar content (g), and W2 is the weight of solid residue of rice straw cellulose (g).
The reducing sugar content was determined by the DNS method. The absorbance of the reacted solution was measured at 540 nm.
The solid residue of rice straw cellulose was obtained after enzymatic hydrolysis. The residue was dried in a hot air oven at 60 °C overnight and weighed.

2.6. Characterization of Rice Straw Nanocellulose

2.6.1. Scanning Electron Microscopy

The surface morphology of rice straw cellulose, nanocellulose, and solid residue cellulose was observed using a field emission scanning electron microscope (FE-SEM, JSM-6335 F, JEOL, Tokyo, Japan) at the accelerating voltage of 15 kV. The samples were placed on Cu tape and coated with gold.

2.6.2. Dynamic Light Scattering and Zeta Potential Analysis

The hydrodynamic particle size distribution of nanocellulose solution and zeta potentials were determined by Zetasizer (Zen 3600, UK).

2.6.3. Fourier Transform Infrared Spectroscopy

Fourier transform infrared spectroscopy investigated the chemical functional groups represented in rice straw cellulose and nanocellulose structure. The chemical structure was analyzed using an FTIR spectrometer (Tensor 27, Bruker, Billerica, MA, USA) with a wavenumber between 400–4000 cm−1. The samples were dried at 105 °C for 3–5 h. Then, the samples were mixed with KBr and pressed under a vacuum to form pellets.

2.6.4. X-ray Diffractometry

All dried samples of rice straw cellulose and nanocellulose were prepared on a glass sample holder, and the diffraction intensity was observed using a X-ray diffractometer (Miniflex II, Rigaku, Japan) with angular scanning of 3° to 60°. The crystallinity index (CrI) was calculated with following Equation (2) [25].
C r l = I c I am / I c × 100 %
whereas Ic is the diffraction intensity of reflections at 2θ of 22.7o for the crystal face of cellulose structure, and Iam is the diffraction intensity of the amorphous domain at 2θ of 18.0o.

3. Results

3.1. Lignocellulosic Composition and Characterization of Rice Straw Cellulose

The lignocellulosic composition of rice straw, pretreated rice straw, and rice straw cellulose are summarized in Table 2. Rice straw was mainly composed of cellulose, followed by hemicellulose and lignin. After pretreatment, the cellulose content increased significantly from 35.6% to 81.4%, while hemicellulose and lignin decreased to 6.6% and 4.6%, respectively. Moreover, bleaching by NaClO2 was used after alkali pretreatment. The results showed an increase in cellulose content (87.7 ± 0.73%), while hemicellulose and lignin content were found in trace amounts. The total ash content in rice straw was found to be 13.4% (w/w), and a silica content of about 6.2 ± 0.08% was obtained, as is shown in Table 2. After alkali pretreatment, total ash and silica were eliminated for 93% and 97%, respectively. The bleaching process showed that total ash and silica were not found in the rice straw cellulose. Therefore, these results indicated that the obtained rice straw cellulose could be utilized as a source of cellulose in nanocelulose preparation.
Figure 1a,b show the physical aspect of the rice straw and rice straw cellulose. The characteristics of rice straw showed that the color of the rice straw after the pretreatment and bleaching process changed from golden brown to white. In addition, Figure 1c,d present the morphologies of the rice straw by SEM. The results found that the surface of the rice straw was tightly packed, while, after bleaching, it demonstrated a smooth texture and more exposure to the individual microfibrils.

3.2. Optimization of Nanocellulose Preparation by Enzymatic Hydrolysis

The optimization of the nanocellulose preparation by enzymatic hydrolysis via central composite design (CCD) was carried out, and the results are represented in Table 3. The results found that a high nanocellulose content of 32.8 and 33.4% was obtained from experimental runs 5 and 11 as compared with the predicted response values of 31.0 and 32.4%, respectively. It is noted that the cellulase concentration was less than 155 U/mL, and the rice straw cellulose concentration was 0.13%, which led to the highest nanocellulose content. While the cellulase concentrations increased to 258 and 300 U/mL, the nanocellulose content decreased to 21.2% and 23.7%, respectively. Furthermore, the cellulase concentration was 155 U/mL, and the rice straw cellulose varied at 0.05, 0.20, and 0.13%. The nanocellulose content increased to 25.4, 29.7 and 32.5%, respectively (runs 7–10). Consequently, the rice straw cellulose concentration was appropriate at 0.13%. In addition, the center point was designed to determine the experiment error between the predicted and actual response values. The results showed a minimal difference between the predicted and actual values in each run.
Moreover, the interaction effects and the level of each variable were also investigated. The independent variables of cellulase and rice straw cellulose concentrations were estimated to optimize the enzymatic hydrolysis of the rice straw cellulose to obtain the nanocellulose content as the response value. The second-order polynomial equation based on the actual values was followed in Equation (3).
N a n o c e l l u l o s e   c o n t e n t   % = 32.42 2.28 X 1 + 1.47 X 2 + 1.90 X 1 X 2 2.65 X 1 2 3.04 X 2 2
where X1 and X2 are the cellulase and rice straw cellulose of concentrations, respectively.
The second-order regression model also demonstrated that the model was significant from an f-value of 14.87 with a low probability value (p-value) of 0.0013 (Table 4). The coefficients of determination (R2) and adjusted R2 were found to be 91% and 85%, respectively. These values indicated that the variation of nanocellulose content was explained by cellulase concentration (X1) and rice straw cellulose concentration (X2) by up to 91.39%, and this further supported the accuracy of the model—the low coefficient of variation (CV) was 5.25%. The regression coefficients and their significance of the response surface quadratic model on the nanocellulose isolation were illustrated in Table 4. All model terms of linear terms (X1 and X2), the interactive terms (X1X2), and quadratic terms (X12 and X22) were significant, with p-values of less than 0.05. Therefore, the cellulase and rice straw cellulose concentrations possessed an influence on the nanocellulose preparation. The terms of cellulase concentrations (X1 and X12) significantly negatively affected nanocellulose preparation. The terms of rice straw cellulose concentration (X2 and X22) had positive and negative effects. Furthermore, the interactive model term of X1X2 positively affected the preparation of the nanocellulose.
The three-dimensional response surface plot (Figure 2) represents the regression equation and interaction effect of the variables to locate the optimized levels of each variable for maximum response. The effect of cellulase concentration and rice straw cellulose concentration revealed that the high nanocellulose content was around the center point. The contour and response surface plot showed that the nanocellulose content decreased by increasing the cellulase concentration (X1) over 155 U/mL and the rice straw cellulose concentration by more than 0.13%. Moreover, the cellulase concentration displayed more importance than the rice straw cellulose concentration, because the cellulase concentration was a significant adverse effect on the nanocellulose preparation. The concentrations of cellulase (107.06 U/mL) and rice straw cellulose (0.13% w/v) were acquired from the regression model equation. In these optimized levels of variables, the maximum nanocellulose content was found to be 32.4% (w/w), which was successfully validated at 98% of the predicted value (33.1%, w/w). Therefore, the model was approved to be adequate.

3.3. Improvement of Nanocellulose Preparation via Integrated Biobased Processes

The integration processes for nanocellulose preparation using the ultrasonication assisted-treatment of rice straw cellulose prior to enzymatic hydrolysis under optimal conditions was evaluated. Figure 3 represents the contents of nanocellulose, reducing sugar, and a solid residue of the rice straw cellulose. When compared to using only enzymatic hydrolysis, the ultrasonication assisted-treatment improved the cellulose hydrolysis, and the results remained at a lower solid residue of rice straw cellulose content of 21.7 ± 0.59%. On the other hand, the nanocellulose and reducing sugar contents increased, especially the nanocellulose content, which significantly increased from 32.4 ± 0.47% to 52.3 ± 1.55%. The results indicated that the rice straw cellulose treated by ultrasonication improved the enzymatic hydrolysis efficiency for nanocellulose isolation.
Moreover, the intensification of the nanocellulose preparation from rice straw cellulose by enzymatic hydrolysis was also revealed by the integration with green acid hydrolysis. A weak organic acid, oxalic acid, was used to hydrolyze the solid residue of the rice straw cellulose after enzymatic hydrolysis. The results demonstrated that the nanocellulose content increased to 65.0 ± 0.16% (w/w). A trace amount (lower than 10%) of the remaining rice straw cellulose was obtained.

3.4. Characterization of Nanocellulose

3.4.1. Morphologies

The appearances of nanocellulose suspensions from enzymatic hydrolysis, enzymatic hydrolysis improved with ultrasonication, and intensification by oxalic acid hydrolysis are shown in Figure 4. All nanocellulose suspensions had colloidal properties, thus indicating that the nanocellulose was dispersed in the solution. In contrast, the remaining rice straw suspension obtained from intensification oxalic acid hydrolysis was slightly settled down in a few minutes. The morphologies of all the nanocelluloses were observed by SEM. Figure 5 illustrates that nanocellulose had the dispersion of spherical shapes or granular nanocellulose in all fractions. At the same time, the microcrystalline cellulose (MCC) presented in the remaining rice straw fraction after oxalic acid hydrolysis.

3.4.2. Particle Size Distribution

The particle size distribution and surface charge (zeta potential) of the nanocellulose were determined by dynamic light scattering and the zeta potential technique. Figure 5 shows that the particle sizes of the nanocellulose via enzymatic hydrolysis and ultrasonication-assisted pretreatment were in the 140–955 nm range, and the average sizes of nanocelluloses were 472 nm and 537 nm, respectively. In contrast, the particle size distribution of the nanocellulose from intensification by oxalic acid hydrolysis was broad, with a distribution at an average size of 786 nm. Moreover, the zeta potential values explaining the surface charge and stability of the nanocellulose suspension were evaluated. All samples displayed negative surface charges with zeta potential values of −34.2, −38.8, and −34.5 mV for enzymatic hydrolysis, enzymatic hydrolysis improved by ultrasonication, and intensification by oxalic acid hydrolysis fractions, respectively. The results revealed that the obtained granular nanocellulose could be well dispersed in the solution due to electrostatic repulsion.

3.4.3. Functional Group of Nanocellulose Structure

The FTIR spectra were performed to identify the functional groups in rice straw cellulose and nanocellulose structures, as is shown in Figure 6. The peak at 3500–3100 cm−1 was attributed to O-H stretching vibrations. The 2918 cm−1 peak was attributed to C-H stretching vibration, while the 1652 cm−1 and 1523 cm−1 peaks presented the H-O-H stretching vibration of adsorbed water in the cellulose structure. C-H bending and C-C ring stretching vibrations were introduced in the 1373 cm−1 and 1165 cm−1 peaks, respectively. The region of 1058 cm−1 corresponded to C-O-C pyranose ring stretching vibration. The peak at 895 cm−1 was associated with the vibration absorption of cellulosic β-glycosidic linkages, and the spectra band at 668 cm−1 was C-OH out-of-plane bending.

3.4.4. Crystallinity

The XRD patterns and crystallinity indexes of the rice straw cellulose and nanocellulose were analyzed by X-ray diffraction. Figure 7 demonstrated that the diffraction pattern of the rice straw cellulose exhibited peaks around 2θ of 15.6°, 16.4°, 22.3°, and 34.5° that were defined as a cellulose type I [20]. The crystallinity indexes (CrI) were 48.8%. The diffraction peaks of nanocellulose from enzymatic hydrolysis, enzymatic hydrolysis improvement by ultrasonication, and intensification by oxalic acid hydrolysis were prominent at around 22°, and CrI values were found to be 30.6%, 16.3%, and 19.5%, respectively, as is shown in Table 5. At the same time, the Crl values of the microcrystalline cellulose as a remaining rice straw cellulose fraction were at 53.2–53.9%.

4. Discussion

The chemical composition of raw rice straw showed a high cellulose content. Moreover, the selected alkali pretreatment and bleaching process of the rice straw demonstrated a very high content of cellulose of about 87.7%. The pretreatment of rice straw could eliminate the hemicellulose and lignin content by approximately 79% and 91%, respectively. The results related to Kobkham et al. [22] studied the alkaline pretreatment of rice straw with 30% NaOH under autoclaving conditions and obtained a high cellulose content. Modenbach and Nokes [26] indicated that the alkaline pretreatment result in cleavage of the ester bond cross-linking between cellulose, hemicellulose, and lignin, thus resulting in the accessibility of the enzymatic hydrolysis. In addition, the bleaching process removed the remaining residues of lignin and hemicellulose by breaking down the conjugated bonds of phenolic compounds and organic matter from oxidation reactions [27,28]. Lee et al. [17] used rice straw as the cellulose to prepare nanocellulose by acid hydrolysis. After alkali pretreatment with NaOH and bleaching by NaClO2, the results showed cellulose (94.1%). Therefore, these results indicated that the obtained rice straw cellulose could be utilized as a source of cellulose in nanocelulose preparation.
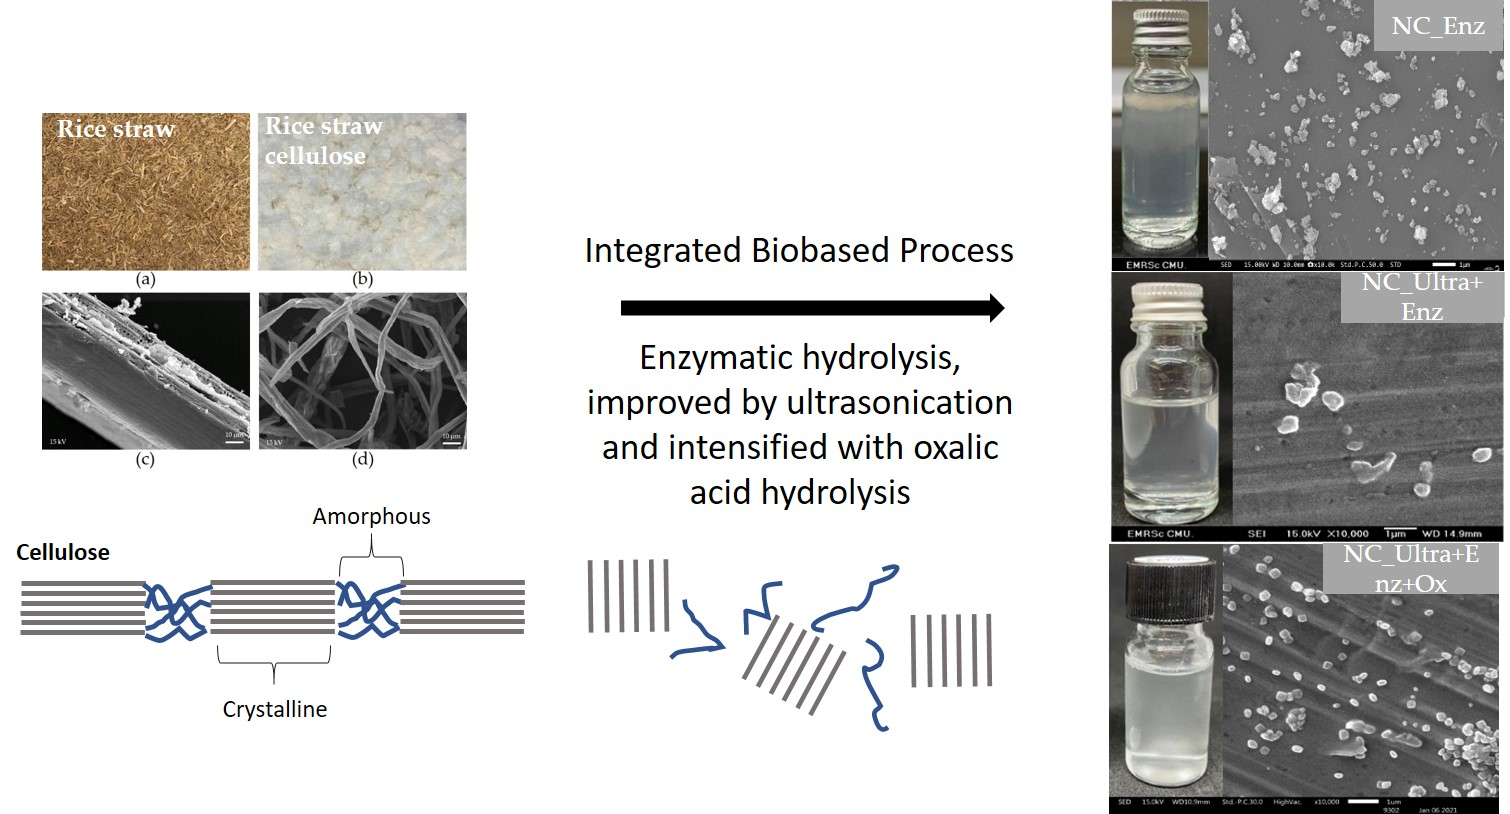
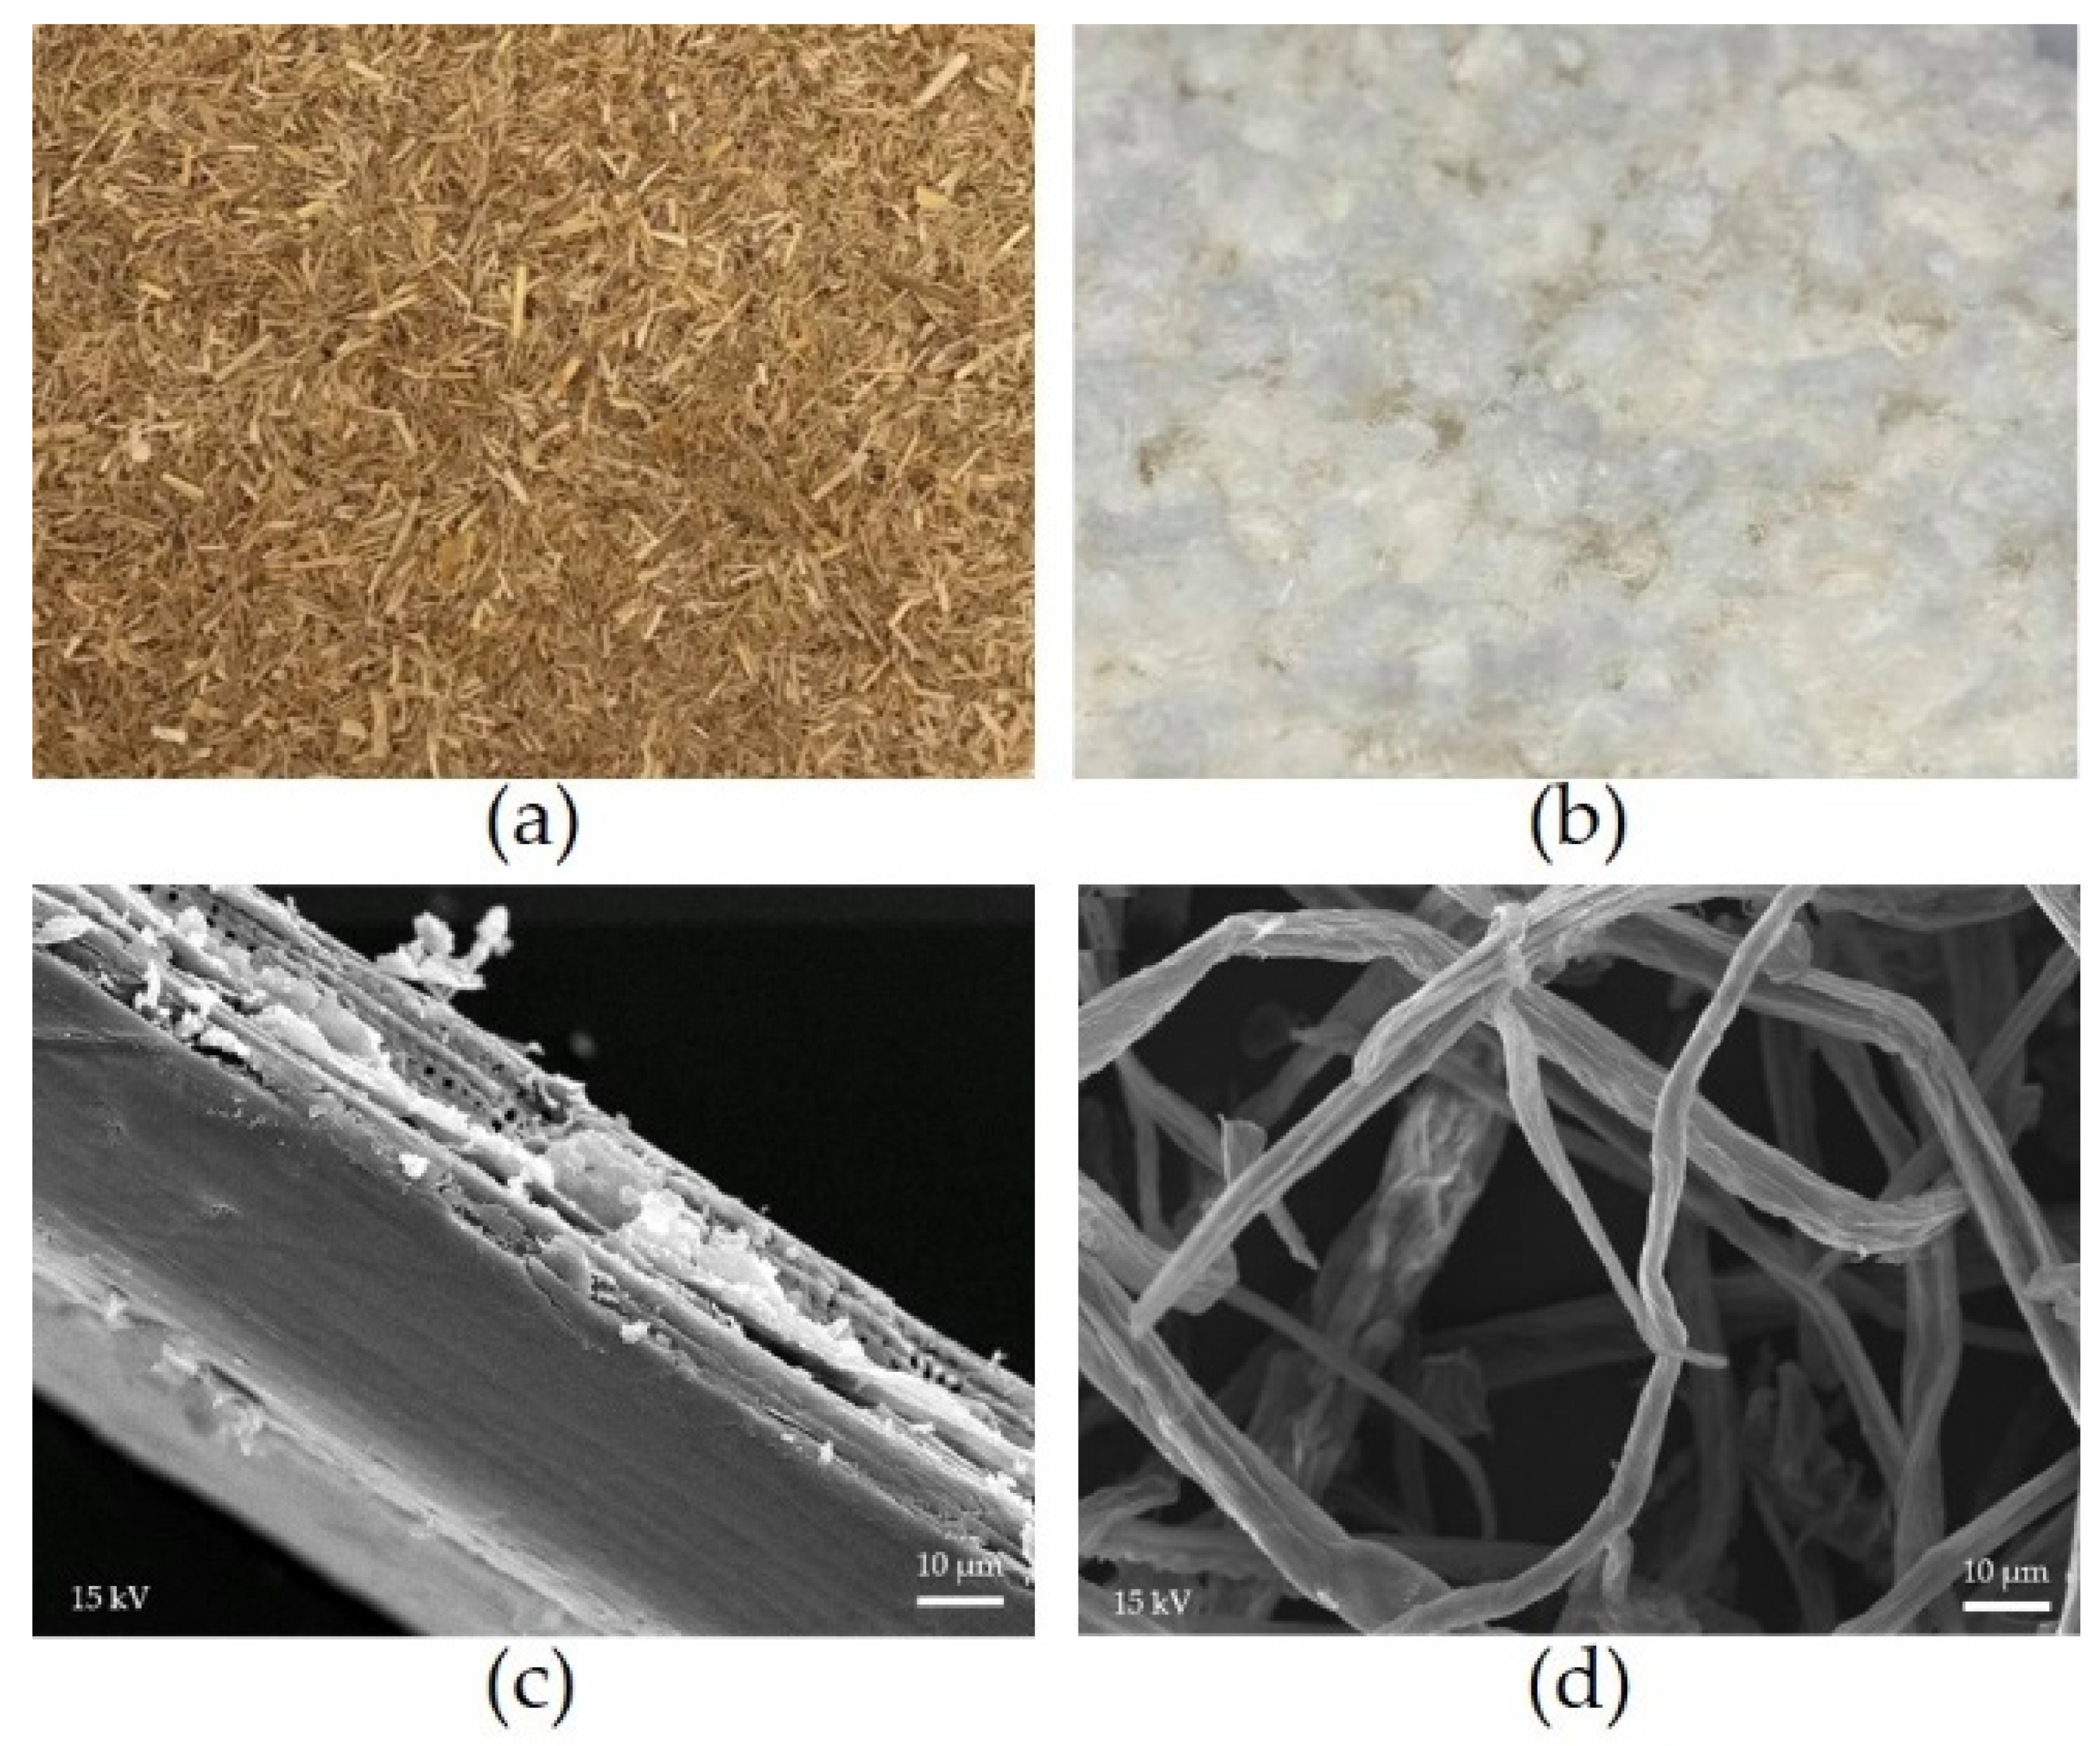
The appearance of the rice straw and rice straw cellulose demonstrated the change in color of the rice straw to white after the pretreatment and bleaching process. The results corresponded to Kampeerapappun [28], who obtained white corn husk cellulose after an alkali-pretreatment and bleaching process and indicated that almost pure cellulose was obtained. In addition, the morphologies of rice straw cellulose by SEM revealed that the chemical pretreatment by NaOH destroyed the complex lignocellulosic structure or recalcitrance of rice straw under autoclaving conditions and the bleaching process. Therefore, the surface of rice straw cellulose increased the opportunity for hydrolysis in nanocellulose preparation, especially enzymatic hydrolysis [29].
A five-level cellulase concentration and rice straw cellulose concentration with five replications of center points (as shown in Table 3) were studied. The design matrix of central composite design (CCD) of 13 runs represented the actual values of variables along with the predicted and actual response of nanocellulose content. Moreover, Table 4 illustrates the response surface quadratic model fitting for the ANOVA. The second-order regression model was statistically valid when the f-value had a low probability value (p-value) less than 0.05 at a 95% confidence level. The R2 (91%) showed more than 80%, thus exhibiting a good fit of the regression model and a coefficient of variation (CV) of less than 10%. A lower CV evaluated the excellent reliability of the experiment. Hence, the regression model was adequate to predict the expected optimization. The positive and negative effects of each variable on the nanocellulose isolation were investigated through the coefficient estimate value. The regression coefficients and their significance of the response surface quadratic model on nanocellulose preparation were displayed.
The results revealed that a high cellulase concentration significantly negatively affected nanocellulose preparation, because rice straw cellulose was hydrolyzed into the reducing sugar with a high conversion rate to result in a decreasing nanocellulose content. The rice straw cellulose concentration demonstrated that a high concentration was applied, thus resulting in a lower nanocellulose content. This was due to the fact that the cellulose can absorb the water and leaves low mass transfer in the solution, thereby inhibiting the cellulose, which corresponded to Aguiar et al. [29]. Furthermore, the interactive model term of cellulose and rice straw cellulose concentration (X1X2) had positively affected the nanocellulose preparation.
The regression equation demonstrated a graphic of a three-dimensional response surface plot, as is shown in Figure 2, and represents the relationship between the experimental level of each cellulase and rice straw cellulose concentration to the response value. The results showed that high substrate concentrations led to more significant enzyme inhibition by the substrate or product. Additionally, the high concentration of enzyme loading caused an increase in hydrolyzing the cellulose chains into glucose. This research revealed that the concentrations of cellulase (107 U/mL) and rice straw cellulose (0.13% w/v) resulted in the maximum nanocellulose content of 32.4% (w/w). The results related to Chen et al. [30], who achieved the highest content (20.17%) of nanocellulose from the pulp using a cellulase concentration of 200 U/Ml.
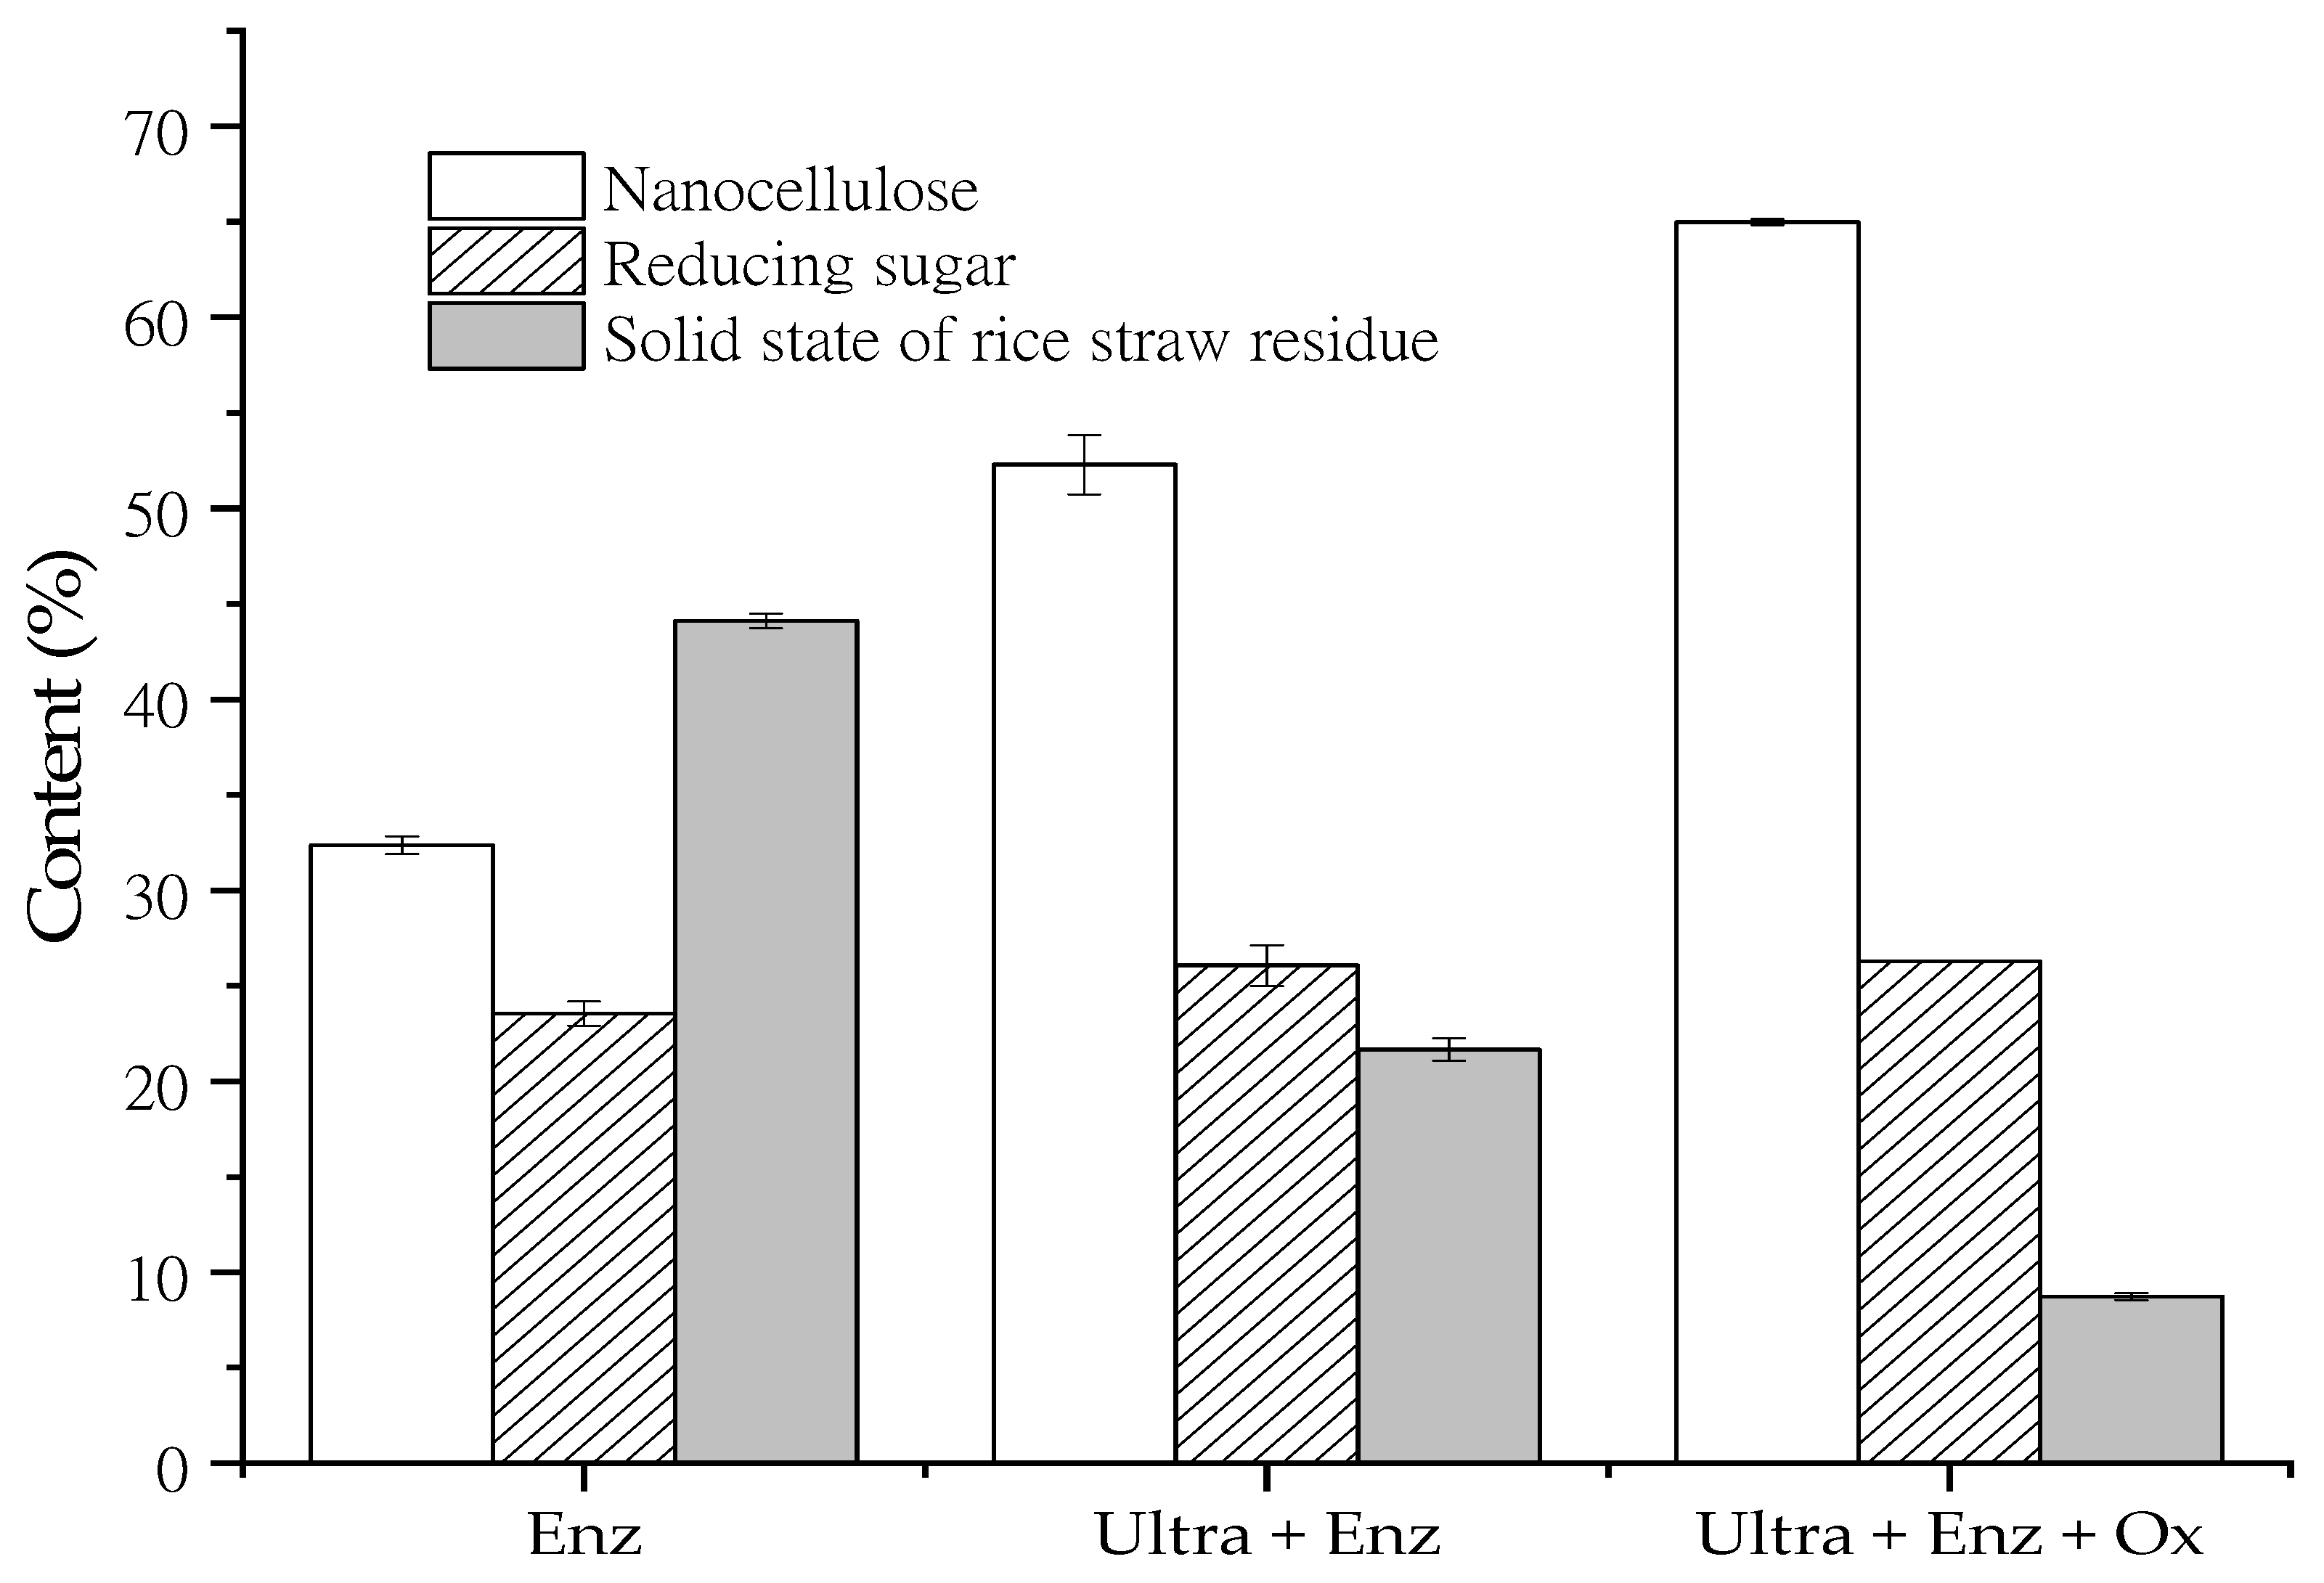
The nanocellulose preparation from rice straw cellulose was improved by ultrasonication-assisted treatment prior to enzymatic hydrolysis under optimal conditions. Figure 3 revealed increased nanocellulose content, reducing sugar concentration, and cellulose hydrolysis compared to enzymatic hydrolysis alone. The nanocellulose content increased appropriately by about 61.5%. The results indicated that the ultrasonic probe could distribute a higher intensity of ultrasonication as a cavitation effect. Cavitation is the formation of bubbles in a liquid by ultrasonic waves. The bubbles can collapse the cellulose chain and destroy the hydrogen bonding and Van der Waals between microfibrils, thus resulting in the accessibility of enzymes [31]. The ultrasonication generates the cavitation energy and breaks down the intermolecular hydrogen bond during treatment, thus allowing the enzyme to penetrate the amorphous region of cellulose [32]. As a result, ultrasonication increased the nanocellulose yield by releasing and dispersing the nanocellulose in the suspension.
Moreover, nanocellulose preparation from rice straw cellulose by enzymatic hydrolysis was intensified by the integration with oxalic acid hydrolysis. The results demonstrated that the nanocellulose content increased to 65.0 ± 0.16%(w/w), thereby leading to more than 90% cellulose hydrolysis. The nanocellulose content was very encouraging compared to other biobased approaches, due to the swelling structure of the solid residue of rice straw cellulose that led to hydrolyzing by oxalic acid. Li et al. [8] produced cellulose nanocrystals from softwood with oxalic acid for 30 and 60 min. The cellulose nanocrystal content was obtained at about 58.3% and 80.6%, respectively. Moreover, Chen et al. [24] used 60% oxalic acid to hydrolyze bleached kraft eucalyptus pulp fiber.
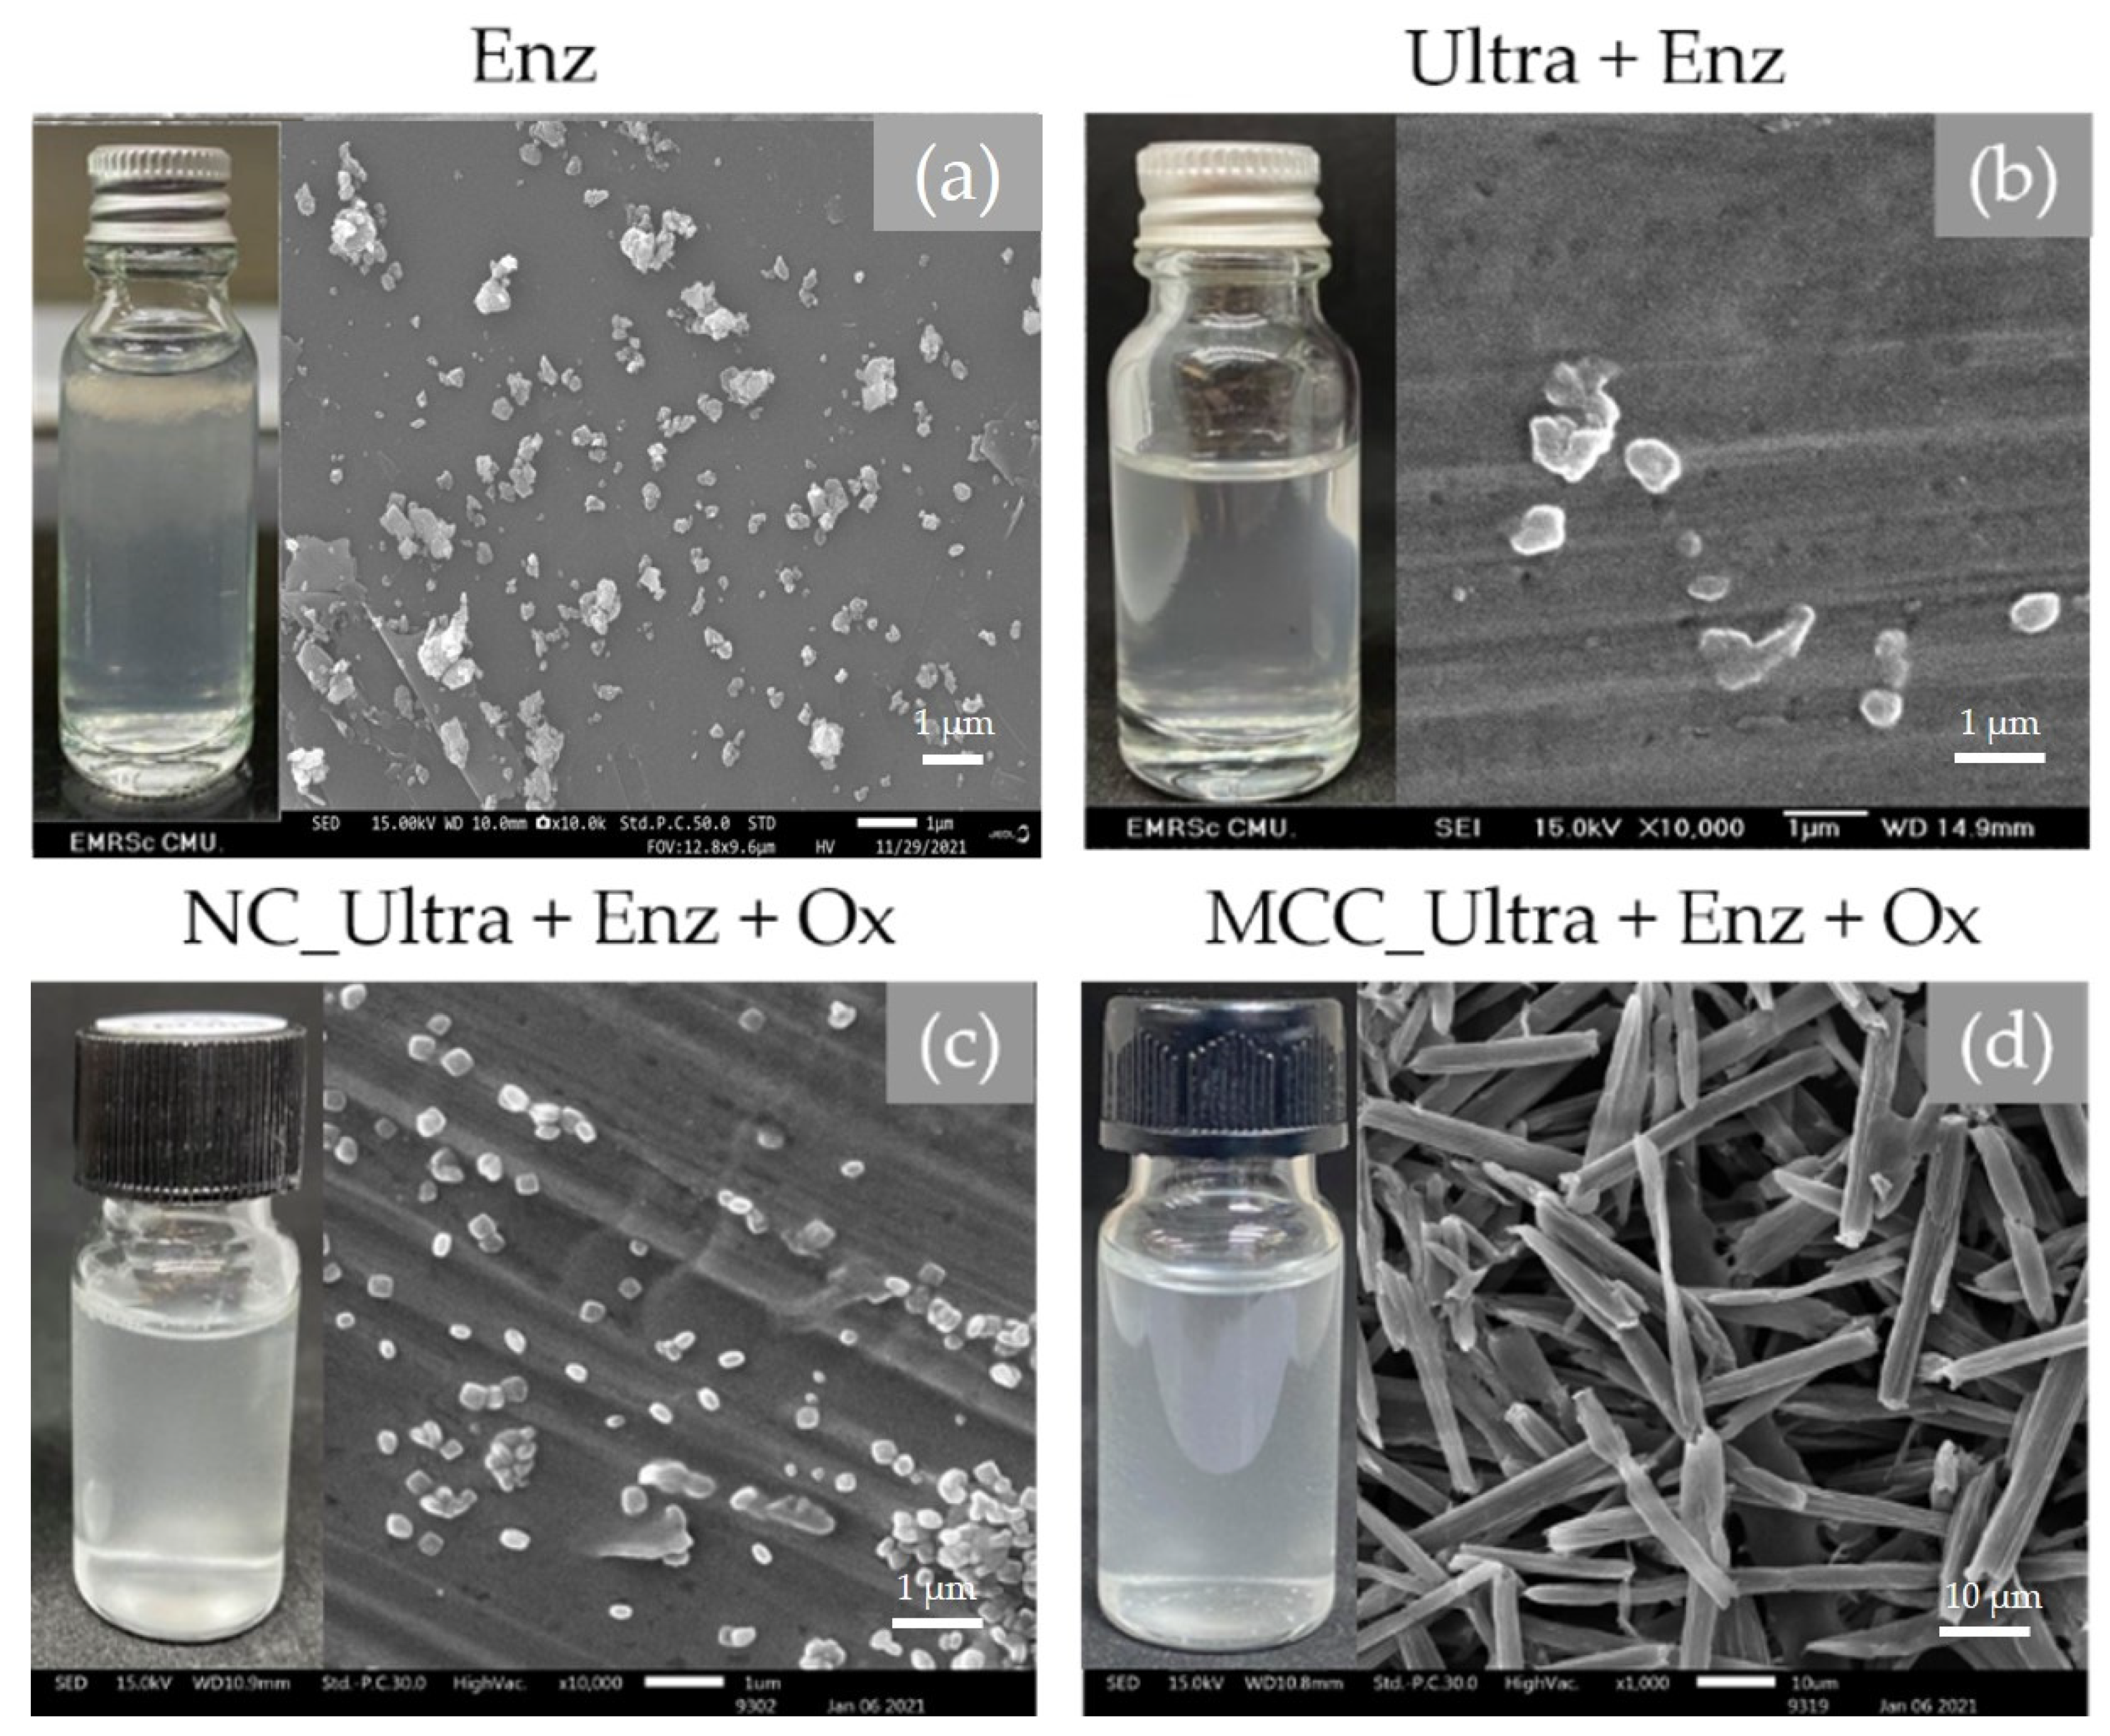
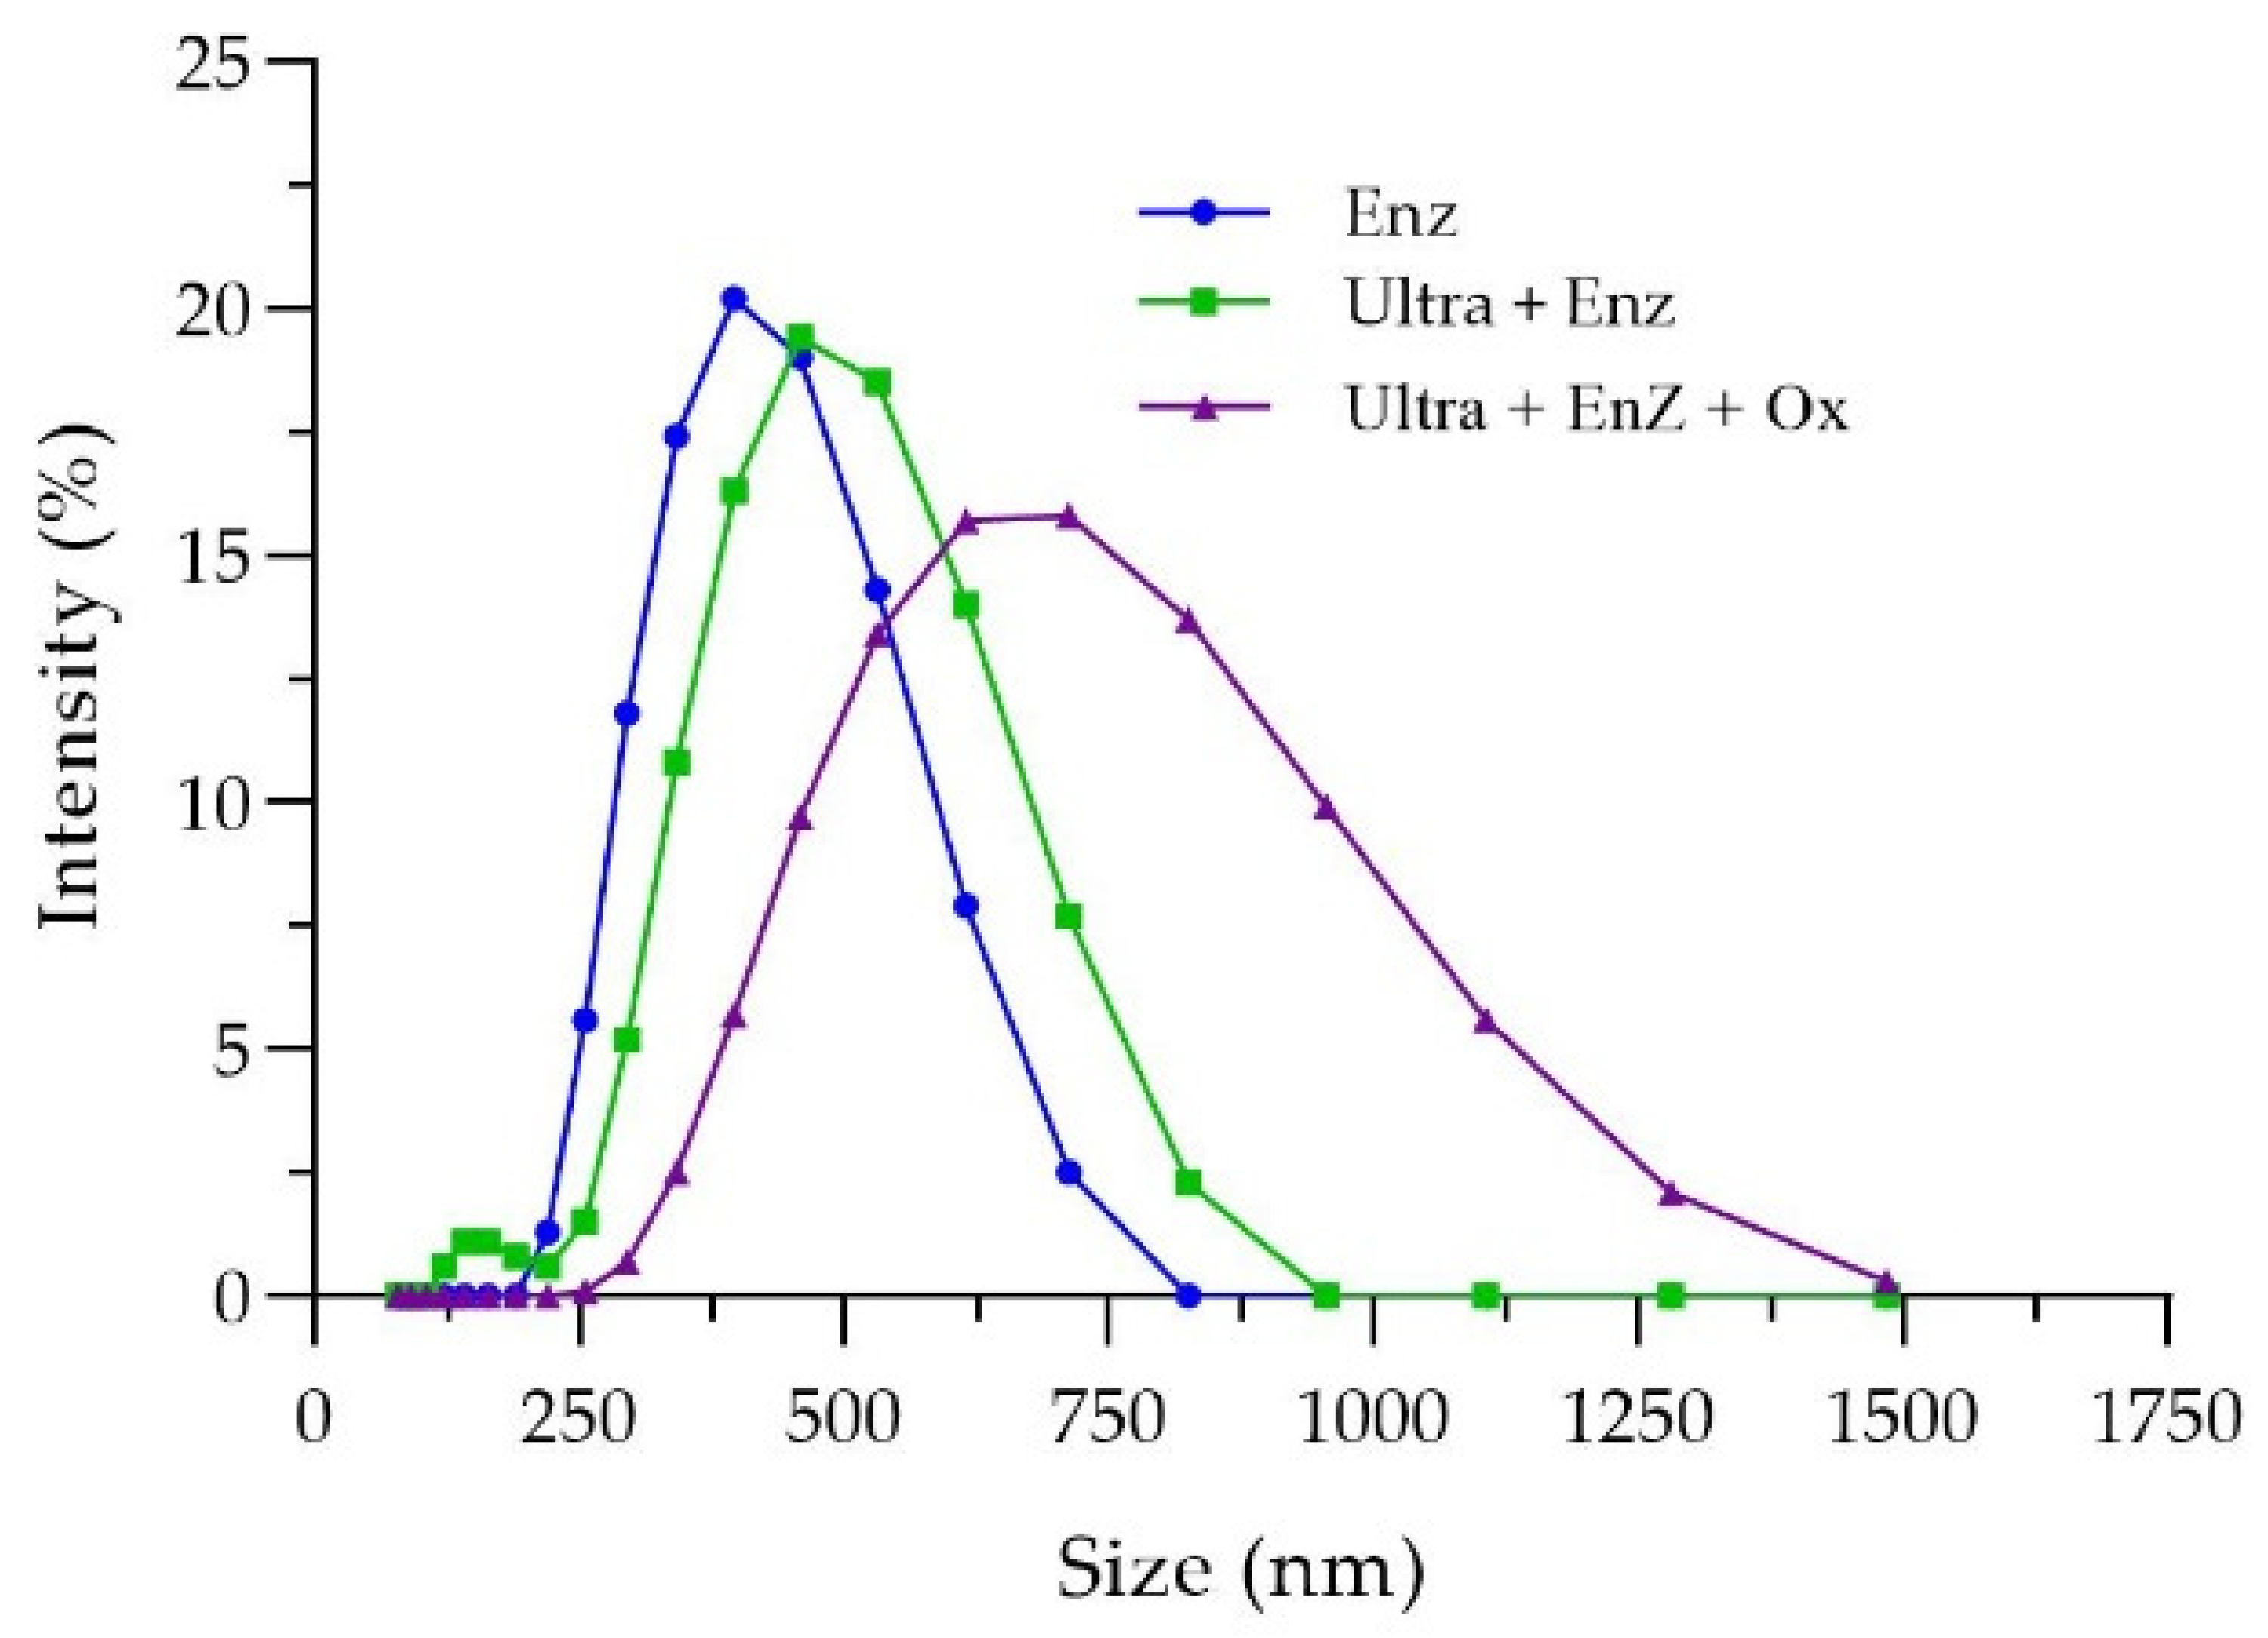
The characteristics of nanocellulose from rice straw cellulose, such as morphology, size distribution, zeta potential, functional group, and crystallinity, were determined. The SEM photographs demonstrated that all nanocellulose was spherical or granular shaped. The appearances of nanocellulose suspension were all turbid and homogenously dispersed in DI water. According to Chen et al. [30], the results reported that the product obtained from pulp fiber hydrolysis with a cellulose concentration at 200 U/mL were spherical particles with a particle size of about 30 nm, which were mixed with irregular rod-like particles of several hundreds of nanometers in length. Moreover, Chen et al. [9] obtained granular nanocellulose from cotton by enzymatic hydrolysis at 100 U/mL. They reported that a low cellulase concentration mainly acted on the amorphous regions by endoglucanase and split the cellulose microfibers at the amorphous regions to obtain the nanocellulose. When the cellulase concentration was higher, both amorphous and crystalline regions were hydrolyzed by endoglucanase. Chen et al. [24] obtained needle-like cellulose nanocrystals along with large particles of fibrous cellulosic solid residue after the hydrolysis of bleached kraft eucalyptus with oxalic acid.
In addition, zeta potential measurement is a crucial characterization technique for investigating the surface charge of nanoparticles in a colloidal solution and the predictability of the nanosuspension stability. The zeta potential of nanoparticles was generally in the range of −30 to +30 mV, thereby indicating colloidal stability. A higher positive or negative than 30 mV of zeta potential values demonstrates that the nanosuspension is moderately stable and provides a long-term nanoparticle dispersion in the solution due to the electrostatic repulsion of the individual particle [33,34]. The higher the zeta potential, the more likely the suspension is to be stable, as the charged particles extrude each other, and this force overcomes the natural tendency to aggregate. It can provide valuable information about the behavior of particles in emulsions, foams, and aggregations of nanocellulose, which should be low for good results as a reinforcement agent. All produced nanocellulose suspensions obtained from rice straw hydrolysis by integrated biobased processes resulted in zeta potentials of −34.2 to −38.8 mV. According to Xu and Chen. [35], they also reported that the zeta potential values of nanocellulose from enzymatic hydrolysis were −31.13 and −31 mV. The nanosuspension was stable for several weeks without agglomeration.
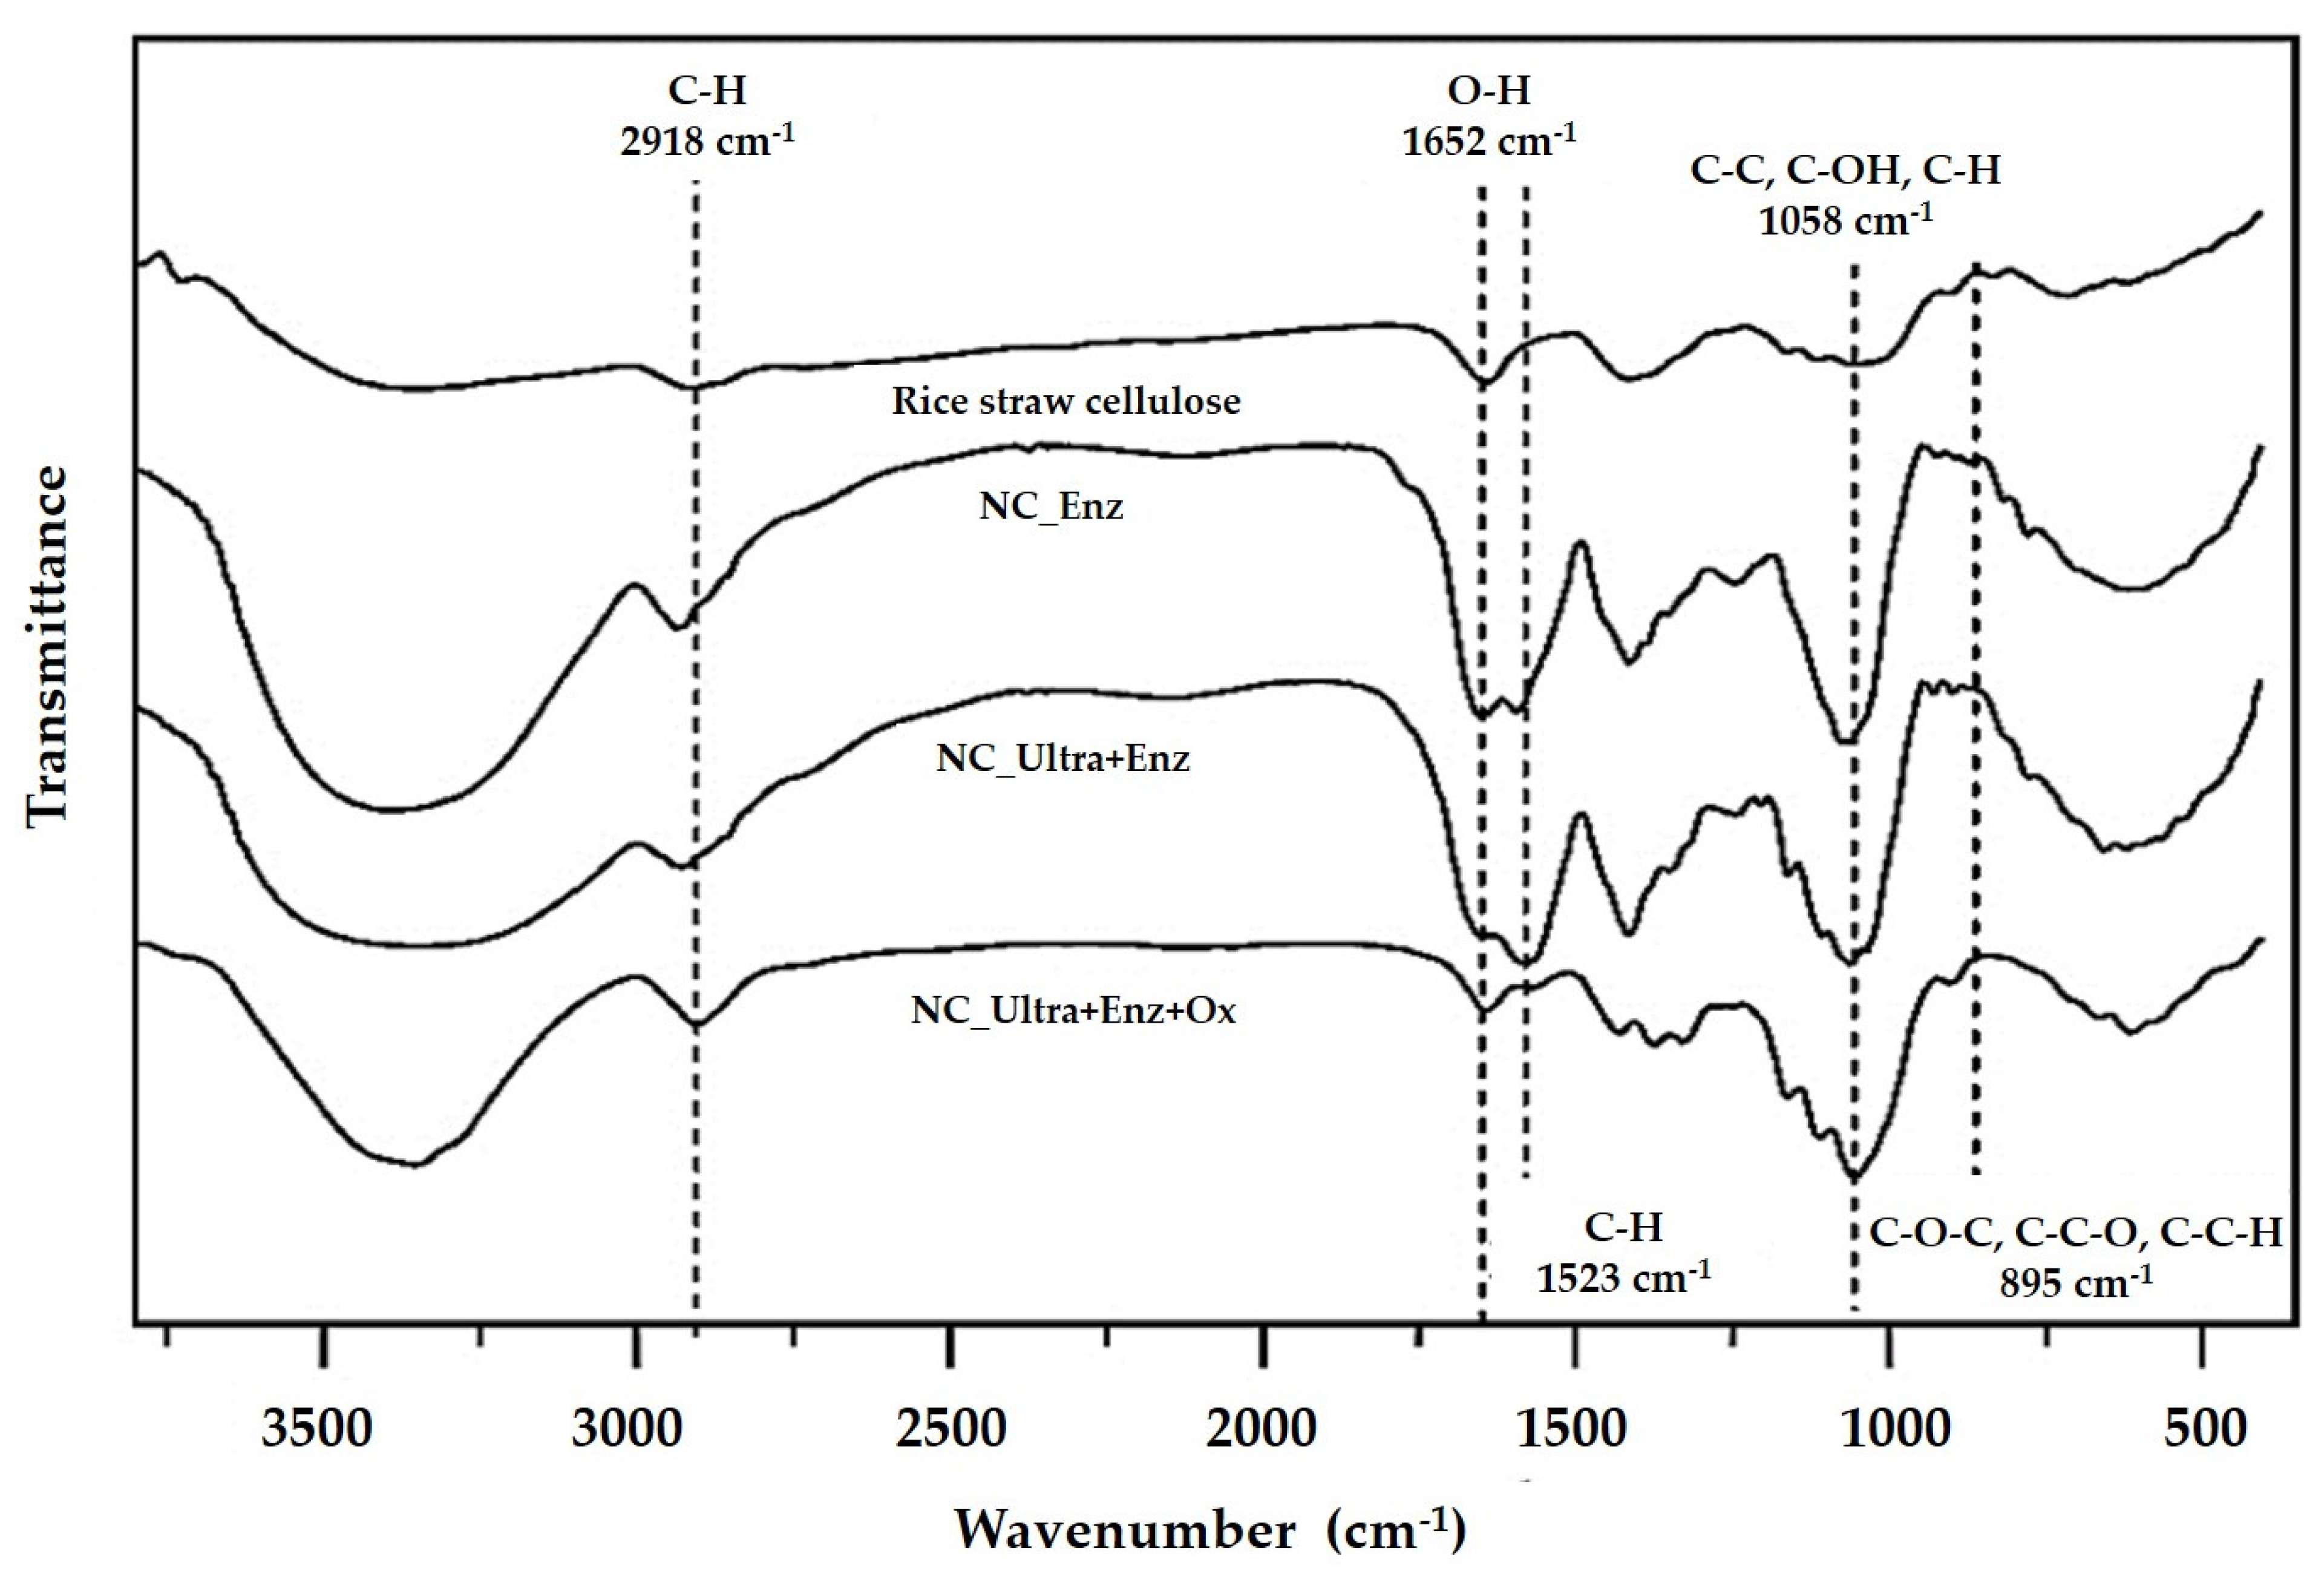
Figure 6 displays the FTIR spectra of rice straw cellulose and nanocellulose. The results indicated that the represented functional groups of prepared nanocelluloses were similar to cellulose. The intensities of the nanocellulose structure were more potent than the rice straw cellulose, especially for the adsorption bands of water, due to an increase in the surface as a nanosize, greater exposure of the -OH groups to the environment, and more adsorbed water molecules on the surface, including the other groups that were be exposed [13].
In addition, this research indicated that the prepared nanocellulose from enzyme hydrolysis with/without ultrasonic pretreatment and intensified by oxalic acid hydrolysis represented the abundant surface hydroxyl groups to result in high hydrophilicity and availability for modification.
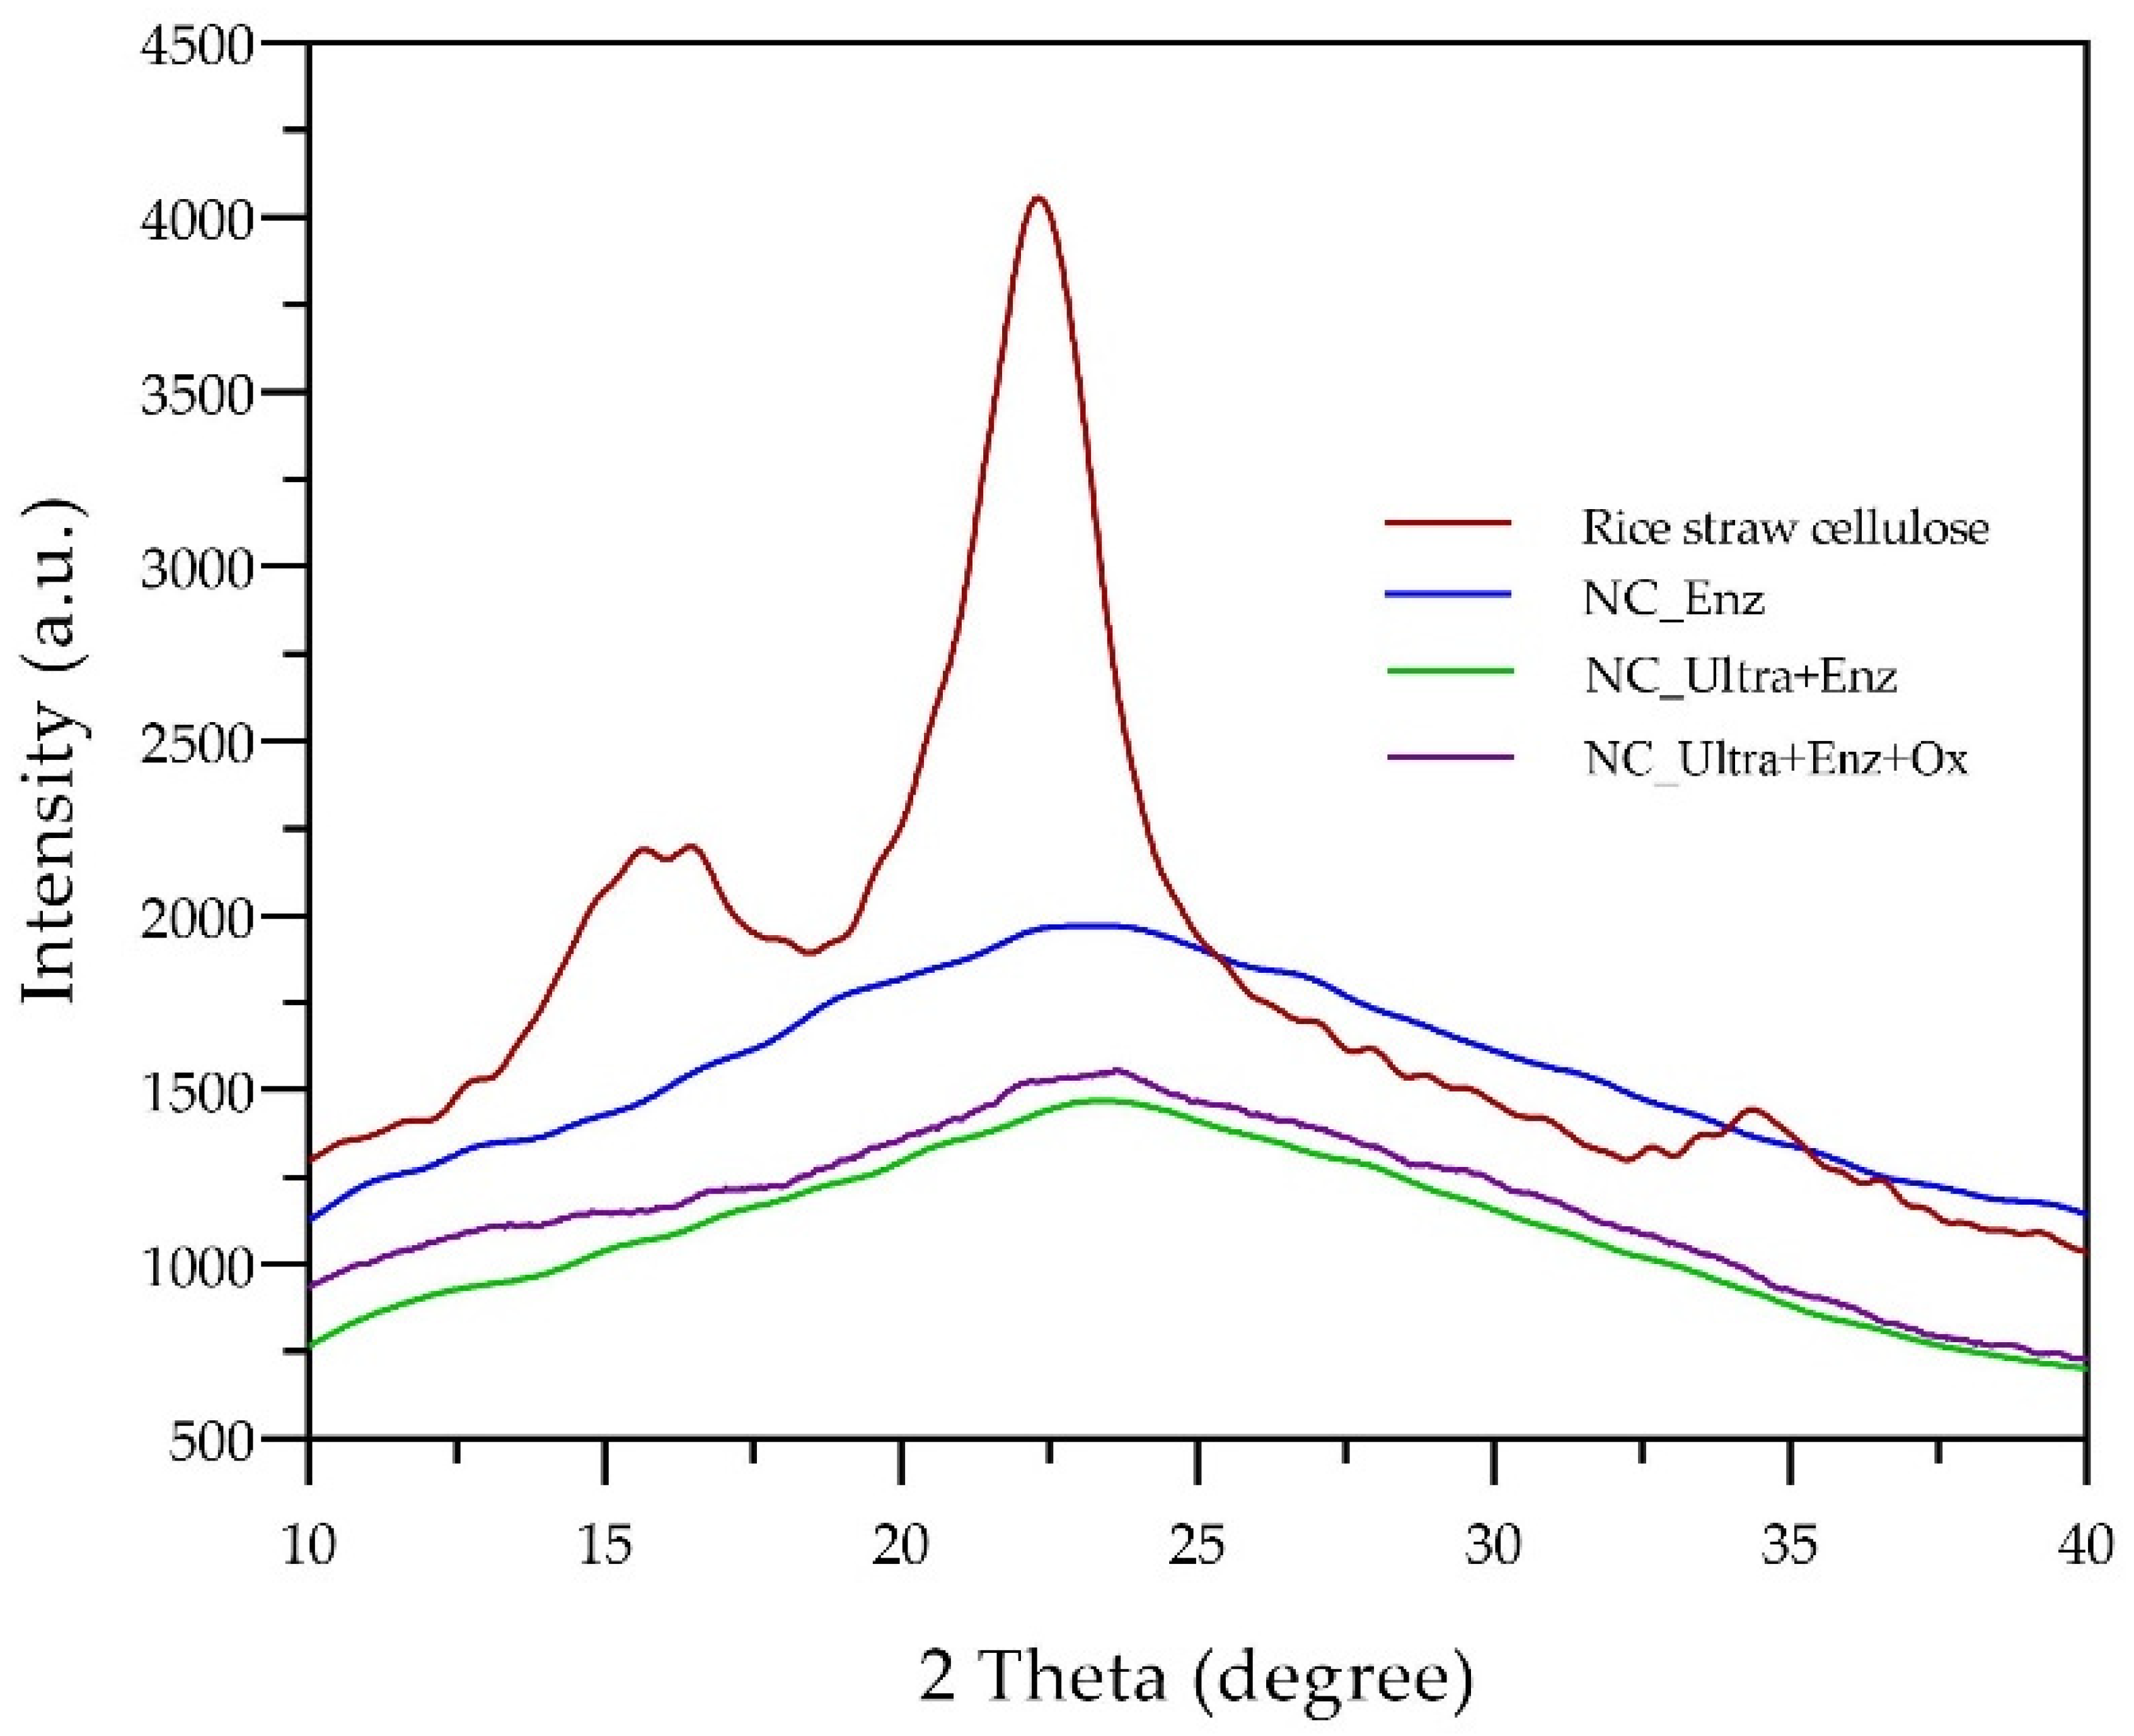
The results revealed that integrated biobased processes affected the crystalline structure of the rice straw cellulose. As a result, the XRD patterns of prepared nanocellulose from rice straw by integrated biobased processes represented the crystallinity change from rice straw cellulose. Furthermore, the Crl values of obtained nanocellulose were obviously decreased and had a low crystallinity (16.3–30.6%). The results corresponded to Ioelovich [36], who obtained amorphous nanocellulose with CrI values of 20–25% from cotton cellulose using sulfuric acid hydrolysis. Meanwhile, the CrI values of the remaining solid residues of the rice straw cellulose were between 53.2 and 53.9%. The results corresponded to Kalita et al. [37], who produced microcrystalline cellulose from fodder grass. The CrI was found to be 57%. In addition, Ternite et al. [38] reported that the CrI of microcrystalline cellulose from cotton linter was 65%. The results demonstrated that all nanocelluloses represented the characteristics of amorphous nanocellulose due to a lower Crl. A low (CrI < 25%) refers to high amorphous regions that can be classified as amorphous nanocellulose. The characteristic properties of amorphous regions contributed to the flexibility, high sorption ability, hydrophilicity, and accessibility of the reagents [1]. This research indicated that the integrated processes based on the optimized enzymatic hydrolysis demonstrated a potential approach for producing amorphous granular nanocellulose characteristics when using rice straw as a cellulose source. Furthermore, the prepared granular nanocelluloses could be further used as a thickening agent, thereby making it possible to modify them for immobilizing the bioactive substances in cosmetic, pharmaceutical, and medical applications.

5. Conclusions

Rice straw can be used as a promising cellulose source for nanocellulose preparation. The nanocellulose was prepared successfully via an integrated biobased approach. The optimized condition of enzymatic hydrolysis in nanocellulose preparation achieved the highest nanocellulose content of 32.4 ± 0.47%. The integration of ultrasonication-assisted treatment prior to enzymatic hydrolysis and intensified with green acid hydrolysis was sufficient to improve the nanocellulose preparation and achieved a high nanocellulose content (65.0 ± 0.16%). The prepared nanocellulose was classified as an amorphous nanocellulose represented by a granular shape with a negative charge surface. The nanocellulose suspension had colloidal stability. FTIR and XRD proved that the chemical structure of the nanocellulose and crystal pattern were similar to rice straw cellulose. Moreover, all nanocellulose was defined as amorphous nanocellulose that has feasibility for various applications.

Author Contributions

Conceptualization, J.T.; Formal analysis, S.J.; Funding acquisition, J.T.; Investigation, S.J. and W.C.; Methodology, S.J. and W.C.; Project administration, J.T.; Resources, J.T.; Software, S.J.; Supervision, J.T.; Validation, S.J. and W.C.; Writing—original draft, S.J.; Writing—review and editing, J.T. All authors have read and agreed to the published version of the manuscript.

Funding

This research was supported by Chiang Mai University.

Institutional Review Board Statement

Not applicable.

Informed Consent Statement

Not applicable.

Data Availability Statement

The research created experimental data that can be found in the tables and figures presented in this manuscript.

Acknowledgments

The authors would like to thank the Department of Chemistry, the Faculty of Science, and the Faculty of Medicine at Chiang Mai University for providing the analytical tools in this research study. The authors would like to thank the Teaching Assistant and Research Assistant (TA-RA) Scholarships from the Graduate school at Chiang Mai University.

Conflicts of Interest

The authors declare no conflict of interest. The funders had no role in the design of the study; in the collection, analyses, or interpretation of data; in the writing of the manuscript; or in the decision to publish the results.

References

  1. Kargarzadeh, H.; Ioelovich, M.; Ahmad, I.; Thomas, S.; Dufresne, A. Methods for extraction of nanocellulose from various sources. In Handbook of Nanocellulose and Cellulose Nanocomposites; Wiley-VCH Verlag GmbH & Co. KGaA: Hoboken, NJ, USA, 2017; pp. 1–49. [Google Scholar]
  2. Grishkewich, N.; Mohammed, N.; Tang, J.; Tam, K.C. Recent advances in the application of cellulose nanocrystals. Curr. Opin. Colloid Interface Sci. 2017, 29, 32–45. [Google Scholar] [CrossRef]
  3. Trache, D.; Tarchoun, A.F.; Derradji, M.; Hamidon, T.S.; Masruchin, N.; Brosse, N.; Hussin, M.H. Nanocellulose: From fundamentals to advanced applications. Front. Chem. 2020, 8, 392. [Google Scholar] [CrossRef]
  4. Phanthong, P.; Reubroycharoen, P.; Hao, X.; Xu, G.; Abudula, A.; Guan, G. Nanocellulose: Extraction and application. Carbon Resour. Convers. 2018, 1, 32–43. [Google Scholar] [CrossRef]
  5. Meftahi, A.; Samyn, P.; Geravand, S.A.; Khajavi, R.; Alibkhshi, S.; Bechelany, S.; Barhoum, A. Nanocelluloses as skin biocompatible materials for skincare, cosmetics, and healthcare: Formulations, regulations, and emerging applications. Carbohydr. Polym. 2022, 278, 118956. [Google Scholar] [CrossRef] [PubMed]
  6. Pradhan, D.; Jaiswal, A.K.; Jaiswal, S. Emerging technologies for the production of nanocellulose from lignocellulosic biomass. Carbohydr. Polym. 2022, 285, 119258. [Google Scholar] [CrossRef] [PubMed]
  7. Ribeiro, R.S.; Pohlmann, B.C.; Calado, V.; Bojorge, N.; Pereirajr, N. Production of nanocellulose by enzymatic hydrolysis: Trends and challenges. Eng. Life Sci. 2019, 19, 279–291. [Google Scholar] [CrossRef] [Green Version]
  8. Li, D.; Henschen, J.; Ek, M. Esterification and hydrolysis of cellulose using oxalic acid dihydrate in a solvent-free reaction suitable for preparation of surface-functionalised cellulose nanocrystals with high yield. Green Chem. 2017, 19, 5564–5567. [Google Scholar] [CrossRef] [Green Version]
  9. Chen, L.; Zhu, J.Y.; Baez, C.; Kitin, P.; Elder, T. Highly thermal-stable and functional cellulose nanocrystals and nanofibrils produced using fully recyclable organic acids. Green Chem. 2016, 18, 3835–3843. [Google Scholar] [CrossRef]
  10. Bastida, G.A.; Schnell, C.A.; Mocchiutti, P.; Solier, Y.N.; Inalbon, M.C.; Zanuttini, M.Á.; Galván, M.V. Effect of oxalic acid concentration and different mechanical pre-treatments on the production of cellulose micro/nanofibers. Nanomaterials 2022, 12, 2908. [Google Scholar] [CrossRef]
  11. Bondancia, T.J.; de Aguiar, J.; Batista, G.; Cruz, A.J.; Marconcini, J.M.; Mattoso, L.H.C.; Farinas, C.S. Production of nanocellulose using citric acid in a biorefinery concept: Effect of the hydrolysis reaction time and techno-economic analysis. Ind. Eng. Chem. Res. 2020, 59, 11505–11516. [Google Scholar] [CrossRef]
  12. Wang, S.; Gao, W.; Chen, K.; Xiang, Z.; Zeng, J.; Wang, B.; Xu, J. Deconstruction of cellulosic fibers to fibrils based on enzymatic pretreatment. Bioresour. Technol. 2018, 267, 426–430. [Google Scholar] [CrossRef]
  13. Chen, X.Q.; Pang, G.X.; Shen, W.H.; Tong, X.; Jia, M.Y. Preparation and characterization of the ribbon-like cellulose nanocrystals by the cellulase enzymolysis of cotton pulp fibers. Carbohydr. Polym. 2019, 207, 713–719. [Google Scholar] [CrossRef] [PubMed]
  14. Zrina, Z.A.Z.; Beg, M.D.H.; Rosli, M.Y.; Ramli, R.; Junadi, N.; Alam, A.K.M.M. Spherical nanocrystalline cellulose (NCC) from oil palm empty fruit bunch pulp via ultrasound assisted hydrolysis. Carbohydr. Polym. 2017, 162, 115–120. [Google Scholar]
  15. Cui, S.; Zhang, S.; Ge, S.; Xiong, L.; Sun, Q. Green preparation and characterization of size-controlled nanocrystalline cellulose via ultrasonic-assisted enzymatic hydrolysis. Ind. Crops Prod. 2016, 83, 346–352. [Google Scholar] [CrossRef]
  16. Kumar, A.; Negi, Y.S.; Choudhary, V.; Bhardwaj, N.K. Characterization of cellullose nanocrystals produced by acid-hydrolysis from sugarcane bagasse as agro-waste. J. Mater. Phys. Chem. 2014, 2, 1–8. [Google Scholar]
  17. Lee, B.M.; Jeun, J.P.; Kang, P.H.; Choi, J.H.; Hong, S.K. Isolation and characterization of nanocrystalline cellulose from different precursor materials. Fibers Polym. 2017, 18, 272–277. [Google Scholar] [CrossRef]
  18. Mahardika, M.; Abral, H.; Kasim, A.; Arief, S.; Asrofi, M. Production of nanocellulose from pineapple leaf fibers via high-shear homogenization and ultrasonication. Fibers 2018, 6, 28. [Google Scholar] [CrossRef] [Green Version]
  19. Morais, J.P.S.; Rosa, M.d.F.; Filho, M.d.s.M.d.S.; Nascimento, L.D.; do Nascimento, D.M.; Cassales, A.R. Extraction and characterization of nanocellulose structures from raw cotton linter. Carbohydr. Polym. 2013, 91, 229–235. [Google Scholar] [CrossRef] [Green Version]
  20. Thakur, M.; Sharma, A.; Ahlawat, V.; Bhattacharya, M.; Goswami, S. Process optimization for the production of cellulose nanocrystals from rice straw derived α-cellulose. Mater. Sci. Energy Technol. 2020, 3, 328–334. [Google Scholar] [CrossRef]
  21. Aquino, D.; Del Barrio, A.; Trach, N.X.; Hai, N.T.; Khang, D.N.; Toan, N.T. Rice straw-based fodder for ruminants. In Sustainable Rice Straw Management; Gummert, M., Hung, N.V., Chivenge, P., Douthwaite, B., Eds.; Springer International Publishing: Cham, Switzerland, 2020; pp. 111–129. [Google Scholar]
  22. Kobkham, C.; Tinoi, J.; Kittiwachana, S. Alkali pretreatment and enzyme hydrolysis to enhance the digestibility of rice straw cellulose for microbial oil production. KMUTNB J. Appl. Sci. Technol. 2018, 11, 247–256. [Google Scholar] [CrossRef]
  23. Van Soest, P.J.; Robertson, J.B.; Lewis, B.A. Methods for dietary fiber, neutral detergent fiber, and nonstarch polysaccharides in relation to animal nutrition. J. Dairy Sci. 1991, 74, 3583–3597. [Google Scholar] [CrossRef] [PubMed]
  24. Chen, X.; Deng, X.; Shen, W.; Jiang, L. Controlled enzymolysis preparation of nanocrystalline cellulose from pretreated cotton fibers. BioResources 2012, 7, 4237–4248. [Google Scholar]
  25. Oh, S.Y.; Yoo, D.I.; Shin, Y.; Kim, H.C.; Kim, H.Y.; Chung, Y.S. Crystalline structure analysis of cellulose treated with sodium hydroxide and carbon dioxide by means of X-ray diffraction and FTIR spectroscopy. Carbohydr. Res. 2005, 340, 2376–2391. [Google Scholar] [CrossRef] [PubMed]
  26. Modenbach, A.A.; Nokes, S.E. Effect of sodium hydroxide pretreatment on structural components of biomass. ASABE 2014, 57, 1187–1198. [Google Scholar]
  27. Sharma, S.; Tsai, M.-L.; Sharma, V.; Sun, P.-P.; Nargotra, P.; Bajaj, B.K.; Chen, C.-W.; Dong, C.-D. Environment friendly pretreatment approaches for the bioconversion of lignocellulosic biomass into biofuels and value-added products. Environments 2023, 10, 6. [Google Scholar] [CrossRef]
  28. Kampeerapappun, P. Extraction and characterization of cellulose nanocrystals produced by acid hydrolysis from corn husk. J. Met., Mater. Miner. 2015, 25, 19–26. [Google Scholar]
  29. Aguiar, J.d.; Bondancia, T.J.; Claro, P.I.C.; Mattoso, L.M.C.; Farinas, C.S.; Marconcini, J.M. Enzymatic deconstruction of sugarcane bagasse and straw to obtain cellulose nanomaterials. ACS Sustain. Chem. Eng. 2020, 8, 2287–2299. [Google Scholar] [CrossRef]
  30. Chen, X.Q.; Deng, X.Y.; Shen, W.H.; Jia, M.Y. Preparation and characterization of the spherical nanosized cellulose by the enzymatic hydrolysis of pulp fibers. Carbohydr. Polym. 2018, 181, 879–884. [Google Scholar] [CrossRef] [PubMed]
  31. Lin, C.; Wang, Q.; Deng, Q.; Huang, H.; Huang, F.; Huang, L.; Ni, Y.; Chen, L.; Cao, S.; Ma, X. Preparation of highly hazy transparent cellulose film from dissolving pulp. Cellulose 2019, 26, 4061–4069. [Google Scholar] [CrossRef]
  32. Sayyed, A.J.; Mohite, L.V.; Deshmukh, N.A.; Pinjari, D.V. Effect of ultrasound treatment on swelling behavior of cellulose in aqueous N-methyl-morpholine-N-oxide solution. Ultrason. Sonochem. 2018, 49, 161–168. [Google Scholar] [CrossRef]
  33. Joseph, E.; Singhvi, G. Chapter 4—Multifunctional nanocrystals for cancer therapy: A potential nanocarrier. In Nanomaterials for Drug Delivery and Therapy; Grumezescu, A.M., Ed.; William Andrew Publishing: New York, NY, USA, 2019; pp. 91–116. [Google Scholar]
  34. Kumar, A.; Singh Negi, Y.; Choudhary, V.; Kant Bhardwaj, N. Characterization of cellulose nanocrystals produced by acid-hydrolysis from sugarcane bagasse as agro-waste. Mater. Chem. Phys. 2020, 2, 1–8. [Google Scholar] [CrossRef]
  35. Xu, J.T.; Chen, X.Q. Preparation and characterization of spherical cellulose nanocrystals with high purity by the composite enzymolysis of pulp fibers. Bioresour. Technol. 2019, 291, 121842. [Google Scholar] [CrossRef] [PubMed]
  36. Ioelovich, M. Peculiarities of cellulose nanoparticles. Tappi J. 2014, 13, 45–51. [Google Scholar] [CrossRef]
  37. Kalita, R.D.; Nath, Y.; Ochubiojo, M.E.; Buragohain, A.K. Extraction and characterization of microcrystalline cellulose from fodder grass and its potential as a drug delivery vehicle for isoniazid, a first line antituberculosis drug. Colloids Surf. B 2013, 108, 85–89. [Google Scholar] [CrossRef] [PubMed]
  38. Terinte, N.; Ibbett, R.; Schuster, K.C. Overview on native cellulose and microcrystalline cellulose I structure studied by X-ray diffraction (WAXD): Comparison between measurement techniques. Lenzing. Ber. 2011, 89, 118–131. [Google Scholar]
Figure 1. Appearances of (a) rice straw and (b) rice straw cellulose and SEM micrographs of (c) rice straw and (d) rice straw cellulose with 1000× magnification.
Processes 11 01006 g001
Figure 2. Response surface plot of nanocellulose preparation by enzymatic hydrolysis depends on the varied concentrations of cellulase and rice straw cellulose.
Processes 11 01006 g002
Figure 3. Nanocellulose content obtained from the intensification of rice straw cellulose hydrolysis via integrated biobased approaches.
Processes 11 01006 g003
Figure 4. Appearances and SEM micrographs of nanocellulose suspensions obtained from rice straw cellulose hydrolysis via integrated biobased approaches of (a) enzymatic hydrolysis (Enz), (b) ultrasonication prior to enzymatic hydrolysis (Ultra + Enz), and (c) intensification by oxalic acid hydrolysis (NC_Ultra + Enz + Ox) (at 10,000×) and (d) microcrystalline cellulose of remaining rice straw cellulose (MCC_Ultra + Enz + Ox)(at 1000×).
Processes 11 01006 g004
Figure 5. Particle size distributions of nanocellulose from rice straw cellulose via integrated biobased approaches; enzymatic hydrolysis (Enz), ultrasonication prior to enzymatic hydrolysis (Ultra + Enz), and intensification by oxalic acid hydrolysis (Ultra + Enz + Ox).
Processes 11 01006 g005
Figure 6. FTIR spectra of rice straw cellulose and nanocelluloses prepared by the integrated biobased approaches; enzymatic hydrolysis (NC_Enz), ultrasonication prior to enzymatic hydrolysis (NC_Ultra + Enz), and intensification by oxalic acid hydrolysis (NC_Ultra + Enz + Ox).
Processes 11 01006 g006
Figure 7. XRD diffractogram of rice straw cellulose and nanocellulose from rice straw cellulose hydrolysis via integrated biobased approaches; enzymatic hydrolysis (NC_Enz), ultrasonication prior to enzymatic hydrolysis (NC_Ultra + Enz), and intensification by oxalic acid hydrolysis (NC_Ultra + Enz + Ox).
Processes 11 01006 g007
Table 1. Codes and actual levels of each variable of the central composite design.
VariablesCodeLevel of Variables
−α−10+1
Cellulase concentration (U/mL)X11052155258300
Rice straw cellulose concentration (%, w/v)X20.050.070.130.180.20
Table 2. Lignocellulosic composition of raw material and treated rice straw.
MaterialsLignocellulosic Content (%, w/w)
Cellulose Hemicellulose Lignin AshSilica
Rice straw35.6 ± 0.2022.2 ± 0.665.3 ± 0.3013.4 ± 0.106.2 ± 0.08
Alkaline-pretreated rice straw81.4 ± 0.016.6 ± 0.931.5 ± 0.900.98 ± 0.350.19 ± 0.03
Rice straw cellulose87.7 ± 0.734.6 ± 0.490.5 ± 0.3500
Table 3. Central composite design with independent variables.
RunX: Independent Variables Y: Response
(Nanocellulose Content, % w/w)
X1
[Cellulase] (U/mL)
X2
[Rice Straw Cellulose] (%, w/v)
PredictedActual
1520.0729.927.7
22580.0721.221.2
3520.1829.026.7
42580.1827.927.8
5100.1331.032.8
63000.1324.223.7
71550.0524.325.4
81550.2028.429.7
91550.1332.432.5
101550.1332.432.4
111550.1332.433.4
121550.1332.432.1
131550.1332.432.5
Table 4. Analysis of variance for the quadratic model.
SourcesCoef.F-Valuep-Value
Model 14.870.0013
X1−2.2817.790.0039
X21.477.370.0300
X1X21.9061.170.0419
X12−2.6521.000.0025
X22−3.0427.540.0012
R2 = 0.9139, CV = 5.25%, Coef. = coefficient estimate.
Table 5. The crystallinity index of rice straw nanocellulose and remaining rice straw cellulose from various integrated biobased processes.
SampleCrI (%)
NanocelluloseRemaining Rice Straw Cellulose
Rice straw cellulose-48.8
NC_Enz30.653.9
NC_Ultra + Enz 16.353.2
NC_Ultra + Enz + Ox 19.553.3
Enzymatic hydrolysis (NC_Enz), ultrasonication prior to enzymatic hydrolysis (NC_Ultra + Enz), and intensification by oxalic acid hydrolysis (NC_Ultra + Enz + Ox).
Disclaimer/Publisher’s Note: The statements, opinions and data contained in all publications are solely those of the individual author(s) and contributor(s) and not of MDPI and/or the editor(s). MDPI and/or the editor(s) disclaim responsibility for any injury to people or property resulting from any ideas, methods, instructions or products referred to in the content.

