1. Introduction
Blockage of drainpipes during the construction and operation stages of tunnels always has a significant negative effect on the stability of tunnel lining structures. According to statistics, blockages in tunnel drainpipes cause around 70% of liner leakage [
1]. Researchers at home and abroad have studied the blockage of tunnel drainpipes.
Lee et al. [
2] studied the influences of groundwater seepage on the stability of tunnel structure based on the Seoul subway project in South Korea. Gao Chunjun et al. [
3] investigated the stress variation law of tunnel lining under five different blocking situations and four different groundwater levels. Jiang Yajun et al. [
4] analyzed the causes of drainage system blockage in karst tunnels from the perspective of the karst dynamic system of carbonate rock. The relationship between pore water pressure on surrounding rocks and stress on surrounding rock of the tunnel, as well as the damage range of the tunnel, was proposed by Rong Chuanxin et al. [
5]. Peng Haikuo et al. [
6] obtained the law of tunnel structural stress under different water levels through the fluid–solid coupling analysis of immersed tunnels. Xu Jun et al. [
7] analyzed various stress responses of tunnel structures with and without water pressure. In order to analyze the seepage field and stress field of the tunnel and surrounding rocks under various working conditions, Yue Jian et al. [
8] established a calculation model of tunnel structure under the fluid–structure interaction and presented recommendations for actual construction based on supervision on the spot. The Jiaozhou Bay Subsea Tunnel in Qingdao’s secondary lining structure was studied by Yuan Bo et al. [
9] in relation to the effect of water pressure after lining and the subsequent maintenance of the tunnel drainage system. In order to examine the external water pressure of the lining, Wang Xiuying et al. [
10] developed a calculation model based on the principle of “limiting drainage by blocking” and then tested it in engineering. Chen Li [
11] explored the blockage of drainpipes by studying the factors of the blockage of drainpipes in railways. Yu Qinghao [
12] conducted experiments to examine drainage system obstruction. Zhou Zhuo [
13] suggested that corrugated longitudinal drainpipes should be employed locally as a strategy to prevent the blockage based on an investigation of the causes of tunnel drainpipe blockages in karst areas. Jiang Haixia [
14] compiled the various drainage hole modeling techniques and developed a simulation technique to increase calculation efficiency and accuracy. By using a numerical model to examine the obstruction of the tunnel drainage blind pipe, Xiang Lihui [
15] came to the conclusion that under various obstruction situations, the groundwater level increased to diverse degrees around the tunnel structure.
A global hybrid loading control method is proposed so that stress control and strain control can be realized simultaneously [
16]. Shiau J et al. [
17] studied the finite element limit analysis technique, the stability of the elliptical cavity above the defective water pipe and its related failure mechanism numerically. Based on the coupled computational fluid dynamics discrete element method (CFD-DEM), the seepage flow is simulated under the conditions of different coarse particle size distribution, flow velocity and inflow fine particle concentration [
18]. Computational fluid dynamics discrete element method (CFD-DEM) is used to model the failure process. Seepage has a significant impact on the failure mechanism and support pressure. The permeability of tunnel working face is the key factor leading to the difference in support pressure under different hydraulic conditions [
19]. Rigorous upper bound and lower bound solutions of elliptical tunnel stability are derived based on the advanced finite element limit analysis. Comprehensive design tables and equations are proposed for stability evaluation [
20]. An accurate and reliable prediction scheme of tunnel stability based on the artificial neural network (ANN) is proposed [
21]. From a microscopic point of view, the mobilization of soil particles is analyzed to explain the formation of multiple soil arches [
22]. A series of tri-layer CFD-DEM models are established considering eight mono- and poly-dispersed filter materials to study how particle size distribution (PSD) affects retention capability [
23]. Macroscopic and microscopic impacts of the transmission on suffusion are analyzed in detail, including the percentage of eroded fine mass, the spatial distribution of residual particles, the evolution of velocity field and particle movements, and added fine particle migrations [
24]. A coupled computational fluid dynamics and discrete element method (CFD-DEM) model is developed to simulate the formation and long-term impermeable stability of filter cake considering different infiltration conditions, including the cohesiveness of bentonite slurry and the permeability of sandy ground [
25].
Currently, groundwater seepage and tunnel excavation disturbances are the main topics of study on the stability of tunnel structures, while numerical models of drainage system obstruction have received very little attention. In this paper, the fluid–structure interaction model was established by finite difference software FLAC3D, and the influence of tunnel drainage system blockage on tunnel lining structure and surrounding rock groundwater was analyzed.
2. Project Overview
Liaoshan Tunnel is designed as a two-hole bidirectional tunnel that extends 31,700 m to the right and 3197 m to the left. The tunnel roof can be buried up to a maximum depth of 274.8 m. The slopes at the tunnel’s entry and exit are both naturally occurring slopes, with a gradient of typically 30–45 degrees. The gravel and clay-containing Quaternary residual slope deposit makes up the majority of the surface layers of the entrance and exit slope, with crushed gravel and dirt from the construction of the road covering some places. According to the geological survey report of the ZK29+450-ZK29+480 and K29+473-K29+467 sections, the total length of the tunnel is 5474 m, with a maximum depth of the tunnel crown. The surrounding rocks of the tunnel are mainly moderately weathered dolomite limestones, with medium–thick layered structures and well-developed structural planes. The rock mass is generally well mixed and relatively intact but may be locally fractured. The groundwater is mainly composed of water from bedrock fissures and karst, and there is a high chance that it also contains a significant volume of water that can appear as linear or seepage flow. Although the surrounding rocks can support themselves to a reasonable extent, there is a chance of localized collapse and the development of medium- to large-scale landslides. The uniaxial compressive strength of moderately weathered dolomite limestones in this section is Rc = 39.52 MPa, the Poisson’s ratio is KV = 0.60 and the modified Barton’s Q-value is [BQ] = 294, indicating that the surrounding rock is grade IV2. Thus, this section was selected for modeling and numerical analysis.
3. Numerical Model
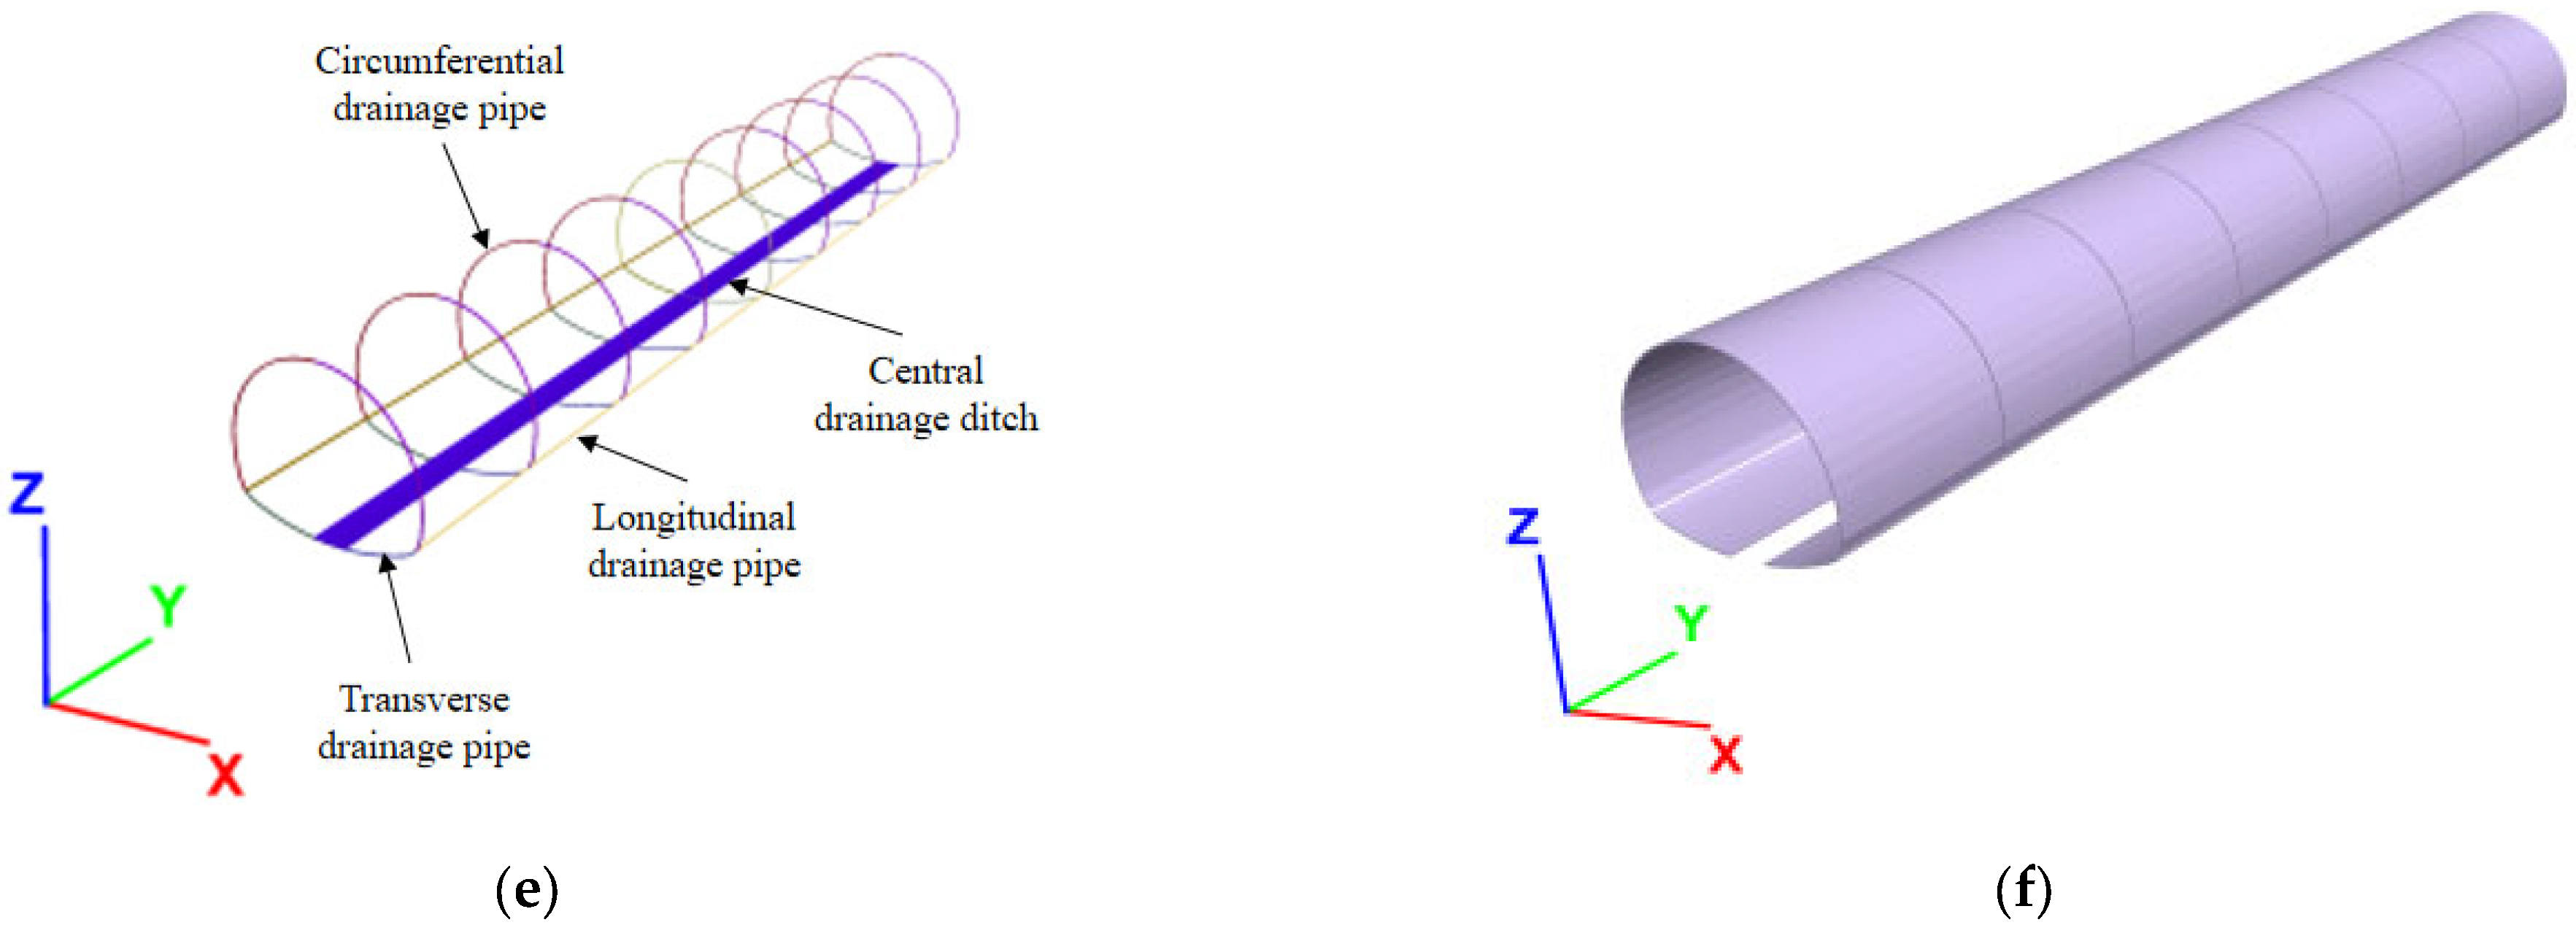
Relying on the actual project of Liaoshan Tunnel of the E-Han Expressway, the tunnel drainage system model is established to analyze the stress, strain and pore water pressure of the tunnel structure and surrounding rock under the normal working condition of the tunnel drainage system, and to study the influence of crystal blockage at different positions of the tunnel drainage system (circumferential drainage pipe, transverse drainage pipe, drainage pipe joint, etc.) on the tunnel structure and surrounding rock.
3.1. Fundamental Assumptions
The large-scale geological structure was ignored in this research and treated as a uniformly distributed rock mass pore structure since the change in displacement field, stress field and seepage field was the focus for study. By conducting an in situ single-hole water pressure test, the equivalent permeability coefficient of the rock mass was determined. The formula for calculating the material permeability coefficient
KW is shown as follows:
where
—the length of the pressure water test section;
—the radius of the water pressure pile hole.
For numerical calculations, a fluid–structure interaction model was created using FLAC3D. The model is based on the following fundamental assumptions:
- (1)
According to the Mohr–Coulomb yield criterion, the rock mass is an ideal elastic–plastic material that is isotropic, continuous and homogeneous.
- (2)
The main rock types of the tunnel surrounding rock are limestone, dolomite and marble. As a result, when developing the model, these three rock kinds are taken into account.
- (3)
The boundary conditions of the model are simplified by assuming that the groundwater surrounding the rock is a steady horizontal water head barrier.
3.2. Mohr–Coulomb Yield Criterion
The yield criterion is used to describe the conditions that must be observed when the material is transformed from the elastic state to the plastic state under different stress states and continues to undergo irreversible plastic deformation.
According to the different relationships between materials and hydrostatic pressure, the yield criteria are divided into two categories: the first category is that the material is related to deviator stress but not hydrostatic pressure and is composed of three main stress axes parallel to the hydrostatic pressure axis, which are equally tangent to the cylindrical surface. Some methods are widely used for assessing metal materials, including the Tresca yield criterion and Mises yield criterion. The second type is called friction material. Different from the first type, this material is related to hydrostatic pressure. The average stress will have a great impact on the yield of this material. The divergent yield surface usually follows the hydrostatic pressure axis in the stress space. The geotechnical materials and concrete materials studied in this paper are suitable for this kind of yield criterion (
Table 1).
The Mohr–Coulomb yield criterion can reflect the sensitivity of different compressive strengths of rock and soil materials to normal stress, and it can also reflect the influence of three equal pressures caused by hydrostatic pressure. In addition, it can be applied to various scenarios, and parameters can be easily obtained and determined. Therefore, the Mohr–Coulomb yield criterion is adopted for this study.
The expression of the Mohr–Coulomb yield criterion is as follows:
The yield criterion expressed by principal stress is as follows:
The invariant can be expressed as follows:
where
.
3.3. Modeling
The paper mainly studies the change in groundwater level after the drainage system is blocked, which further affects the stress and deformation of the support structure. Therefore, the initial height of the groundwater level was set at 50 m above the top of the tunnel under various calculation conditions. When the drainage system was blocked to different degrees, the water discharged from the groundwater was different, and therefore the groundwater level changed differently.
Based on the aforementioned fundamental presumptions and material properties, the FLAC3D model and boundary conditions were created.
- (1)
Calculation model
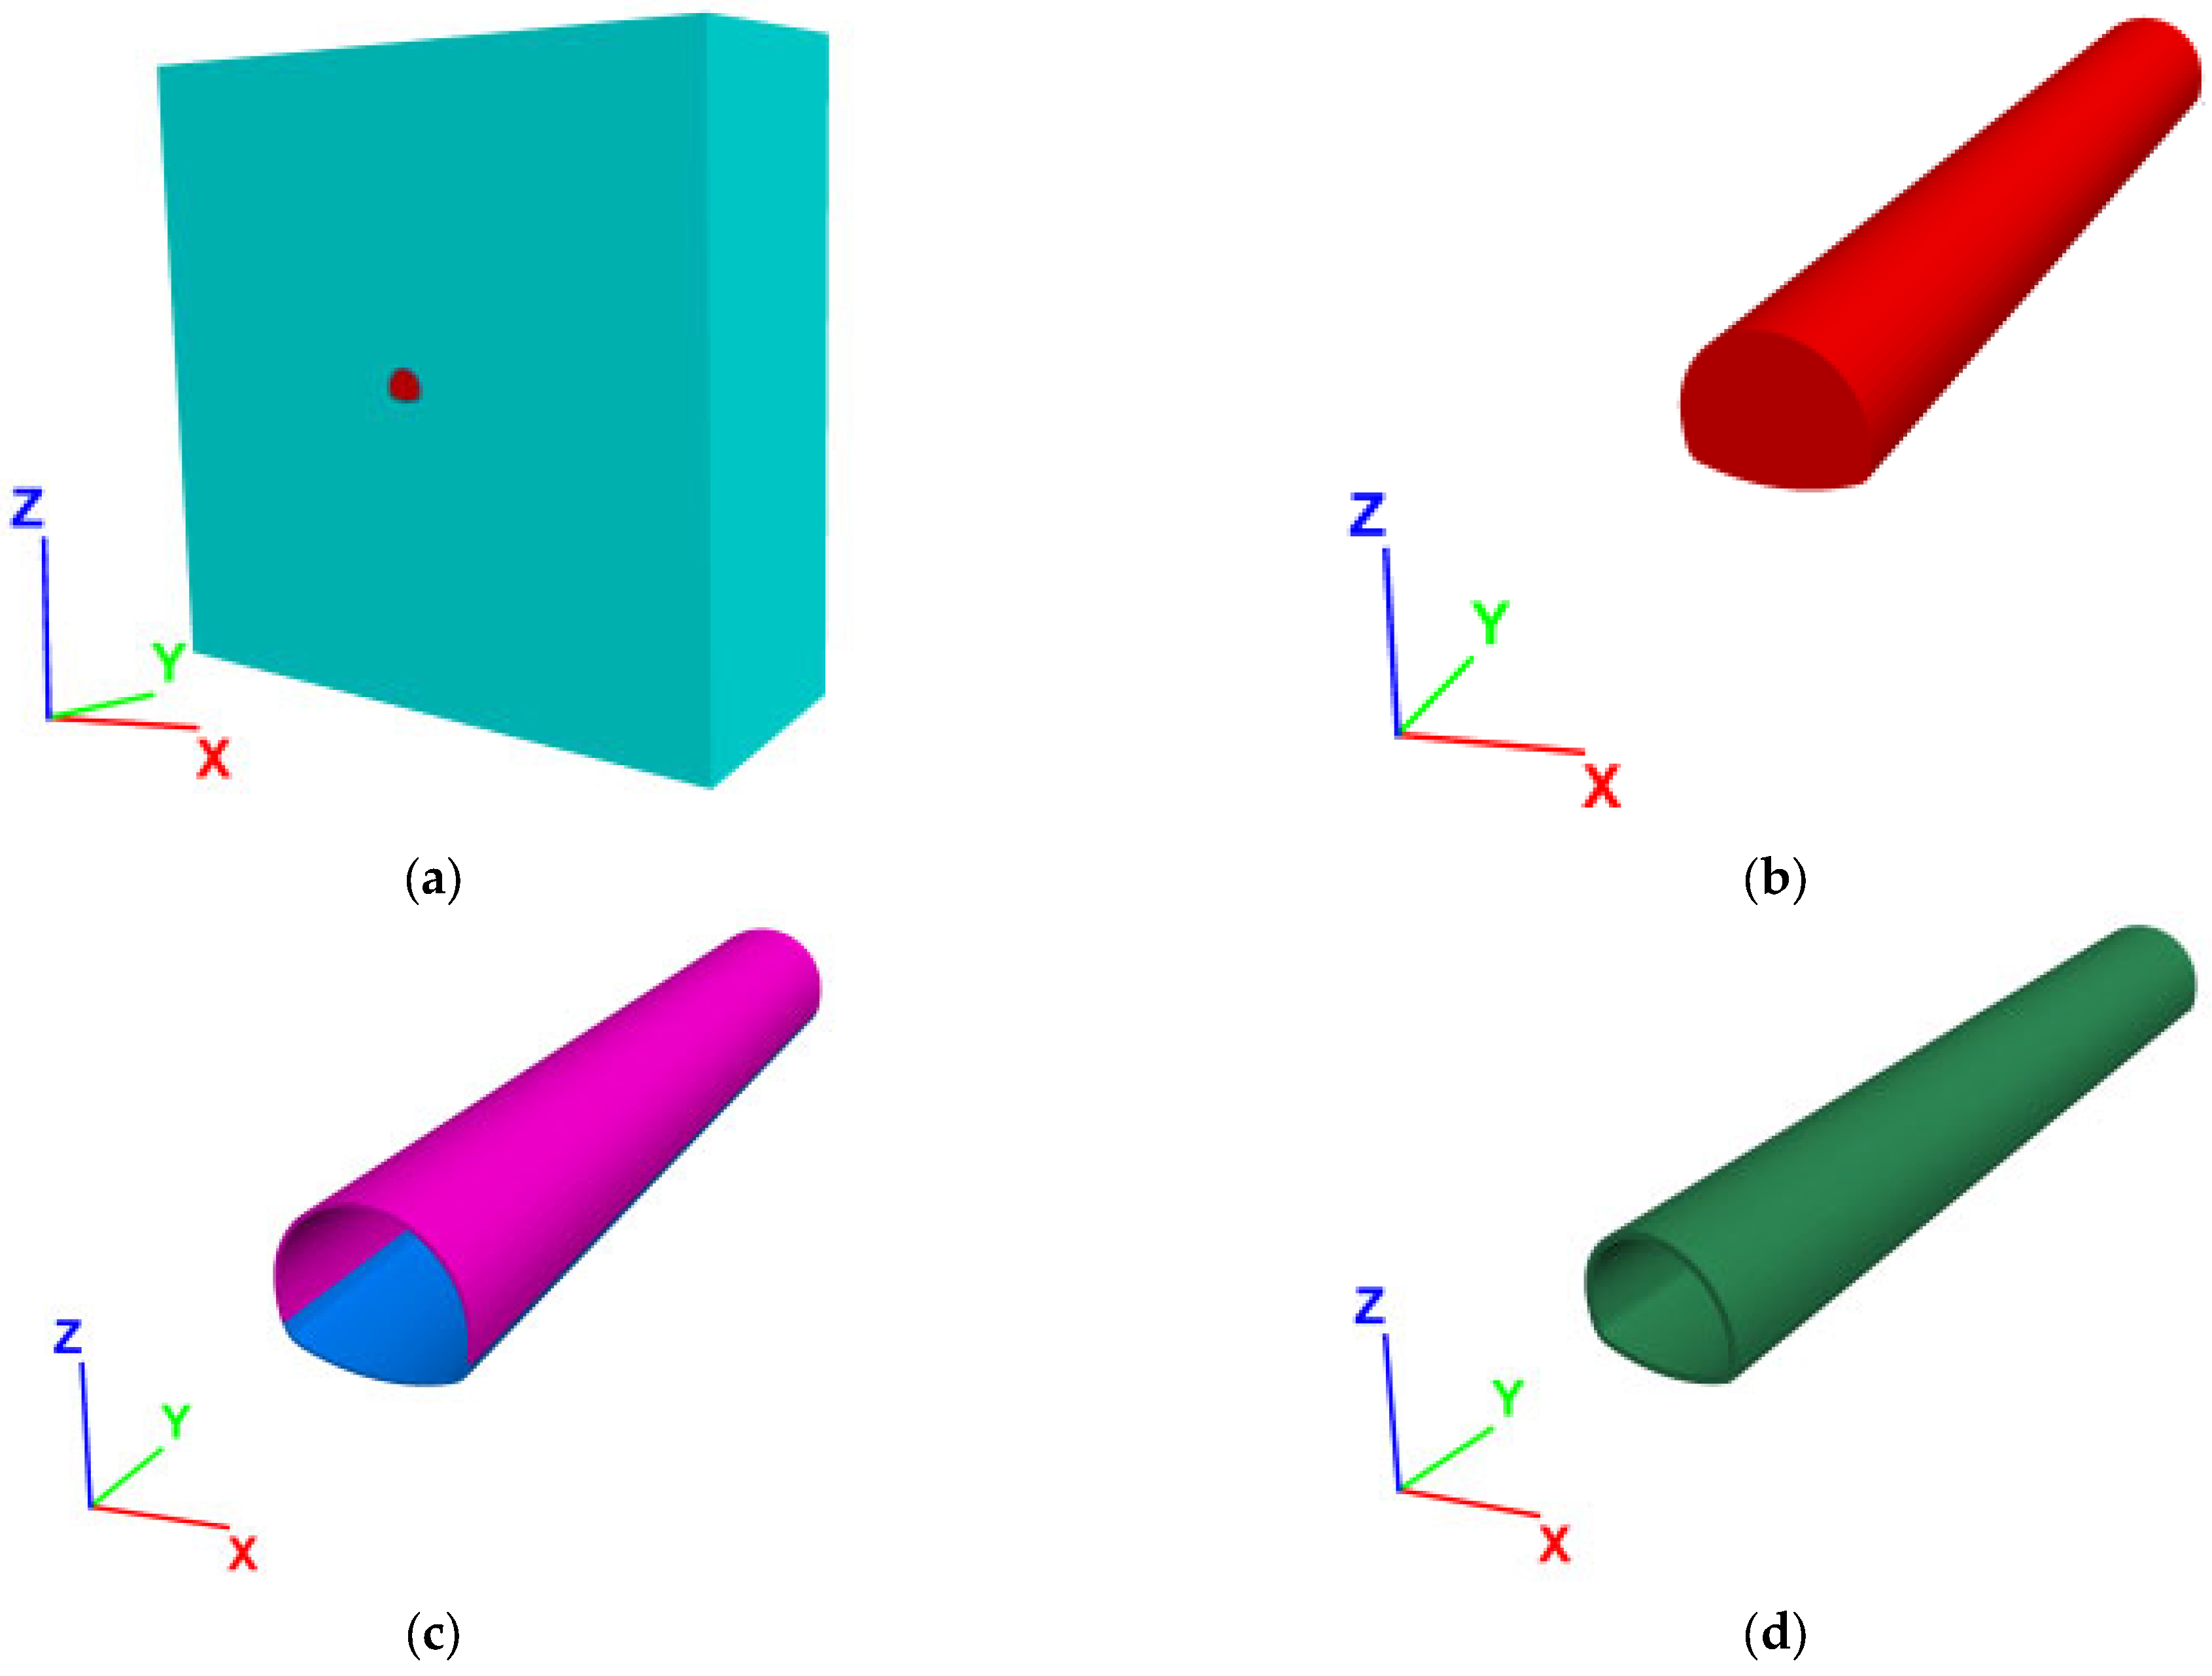
Modeling was established for a tunnel depth of 100 m, with an axial length of 80 m, and a distance of 10 m between adjacent circular drainpipes. The T model for the drainage system was made up of 8 units, with 10 m serving as the design unit. The tunnel extended 100 m to the left and right, and 100 m down. The overall model size was 210 m × 80 m × 210 m (length × width × height).
- (2)
Displacement boundary condition
The model’s front and back sides, as well as both of its sides in the horizontal direction, were all subjected to directional displacement constraints. The bottom of the model was also subjected to directional displacement constraints, while the top surface of the model was left as a free boundary with no restrictions.
- (3)
Seepage boundary condition
The pore water pressure boundary was established for rock and soil below groundwater level. Pore water pressure was linearly proportional to depth under these boundary conditions and grew as depth rose.
- (4)
Drainage system model
Modeling the tunnel drainpipe in accordance with the size of the actual structure was not practical since it was a hollow cylindrical entity with a small overall model pipe size. In this paper, the tunnel drainpipe was regarded as a special material characterized by strong permeability and a high material permeability coefficient. Based on measurements made on the spot, a drainpipe with a substantially similar permeability coefficient was chosen (
Table 2). The numerical analysis calculation model is shown in
Figure 1.
3.4. Working Condition Calculation and Measuring Points Monitoring
A normal drainage control group was created based on the various blockage locations and the symmetry of blockage placements. The calculations were divided into seven working conditions, and models were established to perform numerical calculations and simulations. The calculation scenarios are shown in
Table 3.
The measuring points were primarily set up to keep track of displacement, changes in pressure on the tunnel lining and water pressure at the top of the tunnel lining. This allowed for simultaneous monitoring of the three values of stress, displacement and pore water pressure at each measurement site. The layout of the measuring points was mainly split into two parts. One part was arranged along the contour of the tunnel lining, with measuring points placed clockwise around the initial support at the top of the tunnel, and one ring of measuring points was set up every 5 m along the tunnel axis. The rest of the measuring points were arranged within the surrounding rock within a range of 25 m upwards from the top of the tunnel, with measuring points placed every 2 m in depth, and also one group of measuring points was set up every 5 m along the tunnel axis. The specific layout of the measuring points is shown in
Figure 2.
4. Results Analysis
4.1. Analysis of Unblocked Drainpipe
In this section, the influence law of tunnel drainage system blockage is analyzed from three aspects of pore water pressure, lining stress and displacement by numerical results.
4.1.1. Analysis of Pore Water Pressure
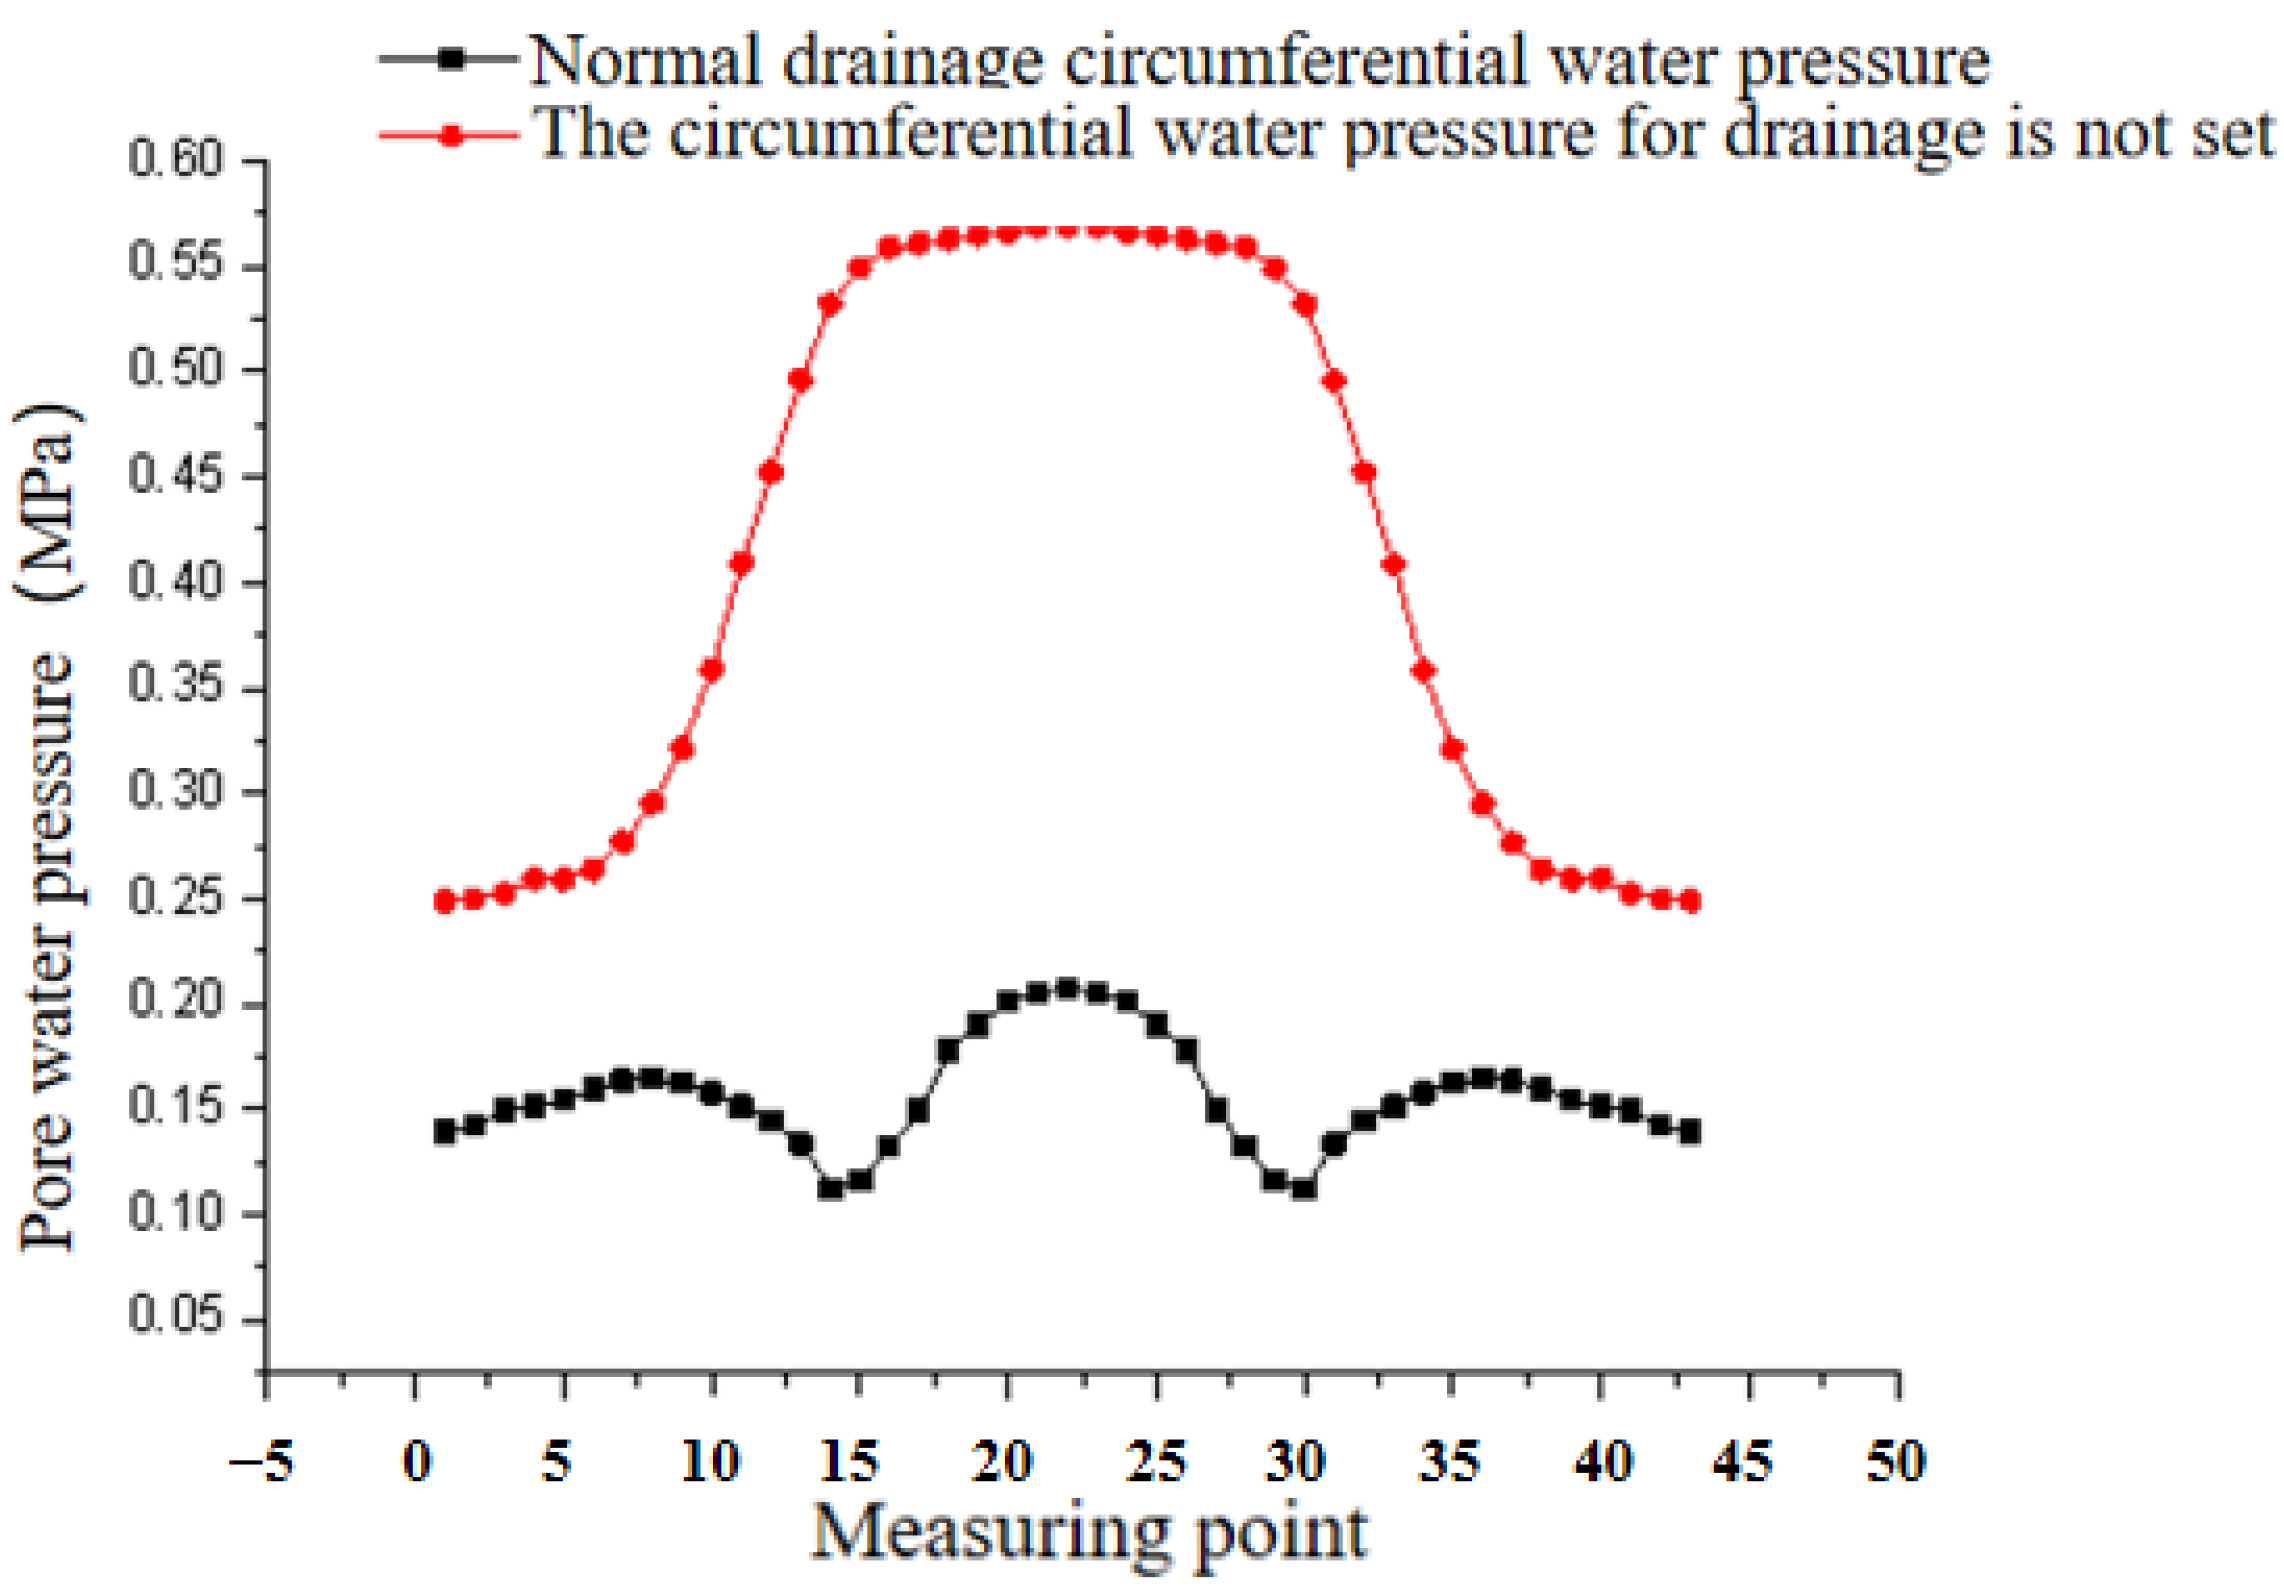
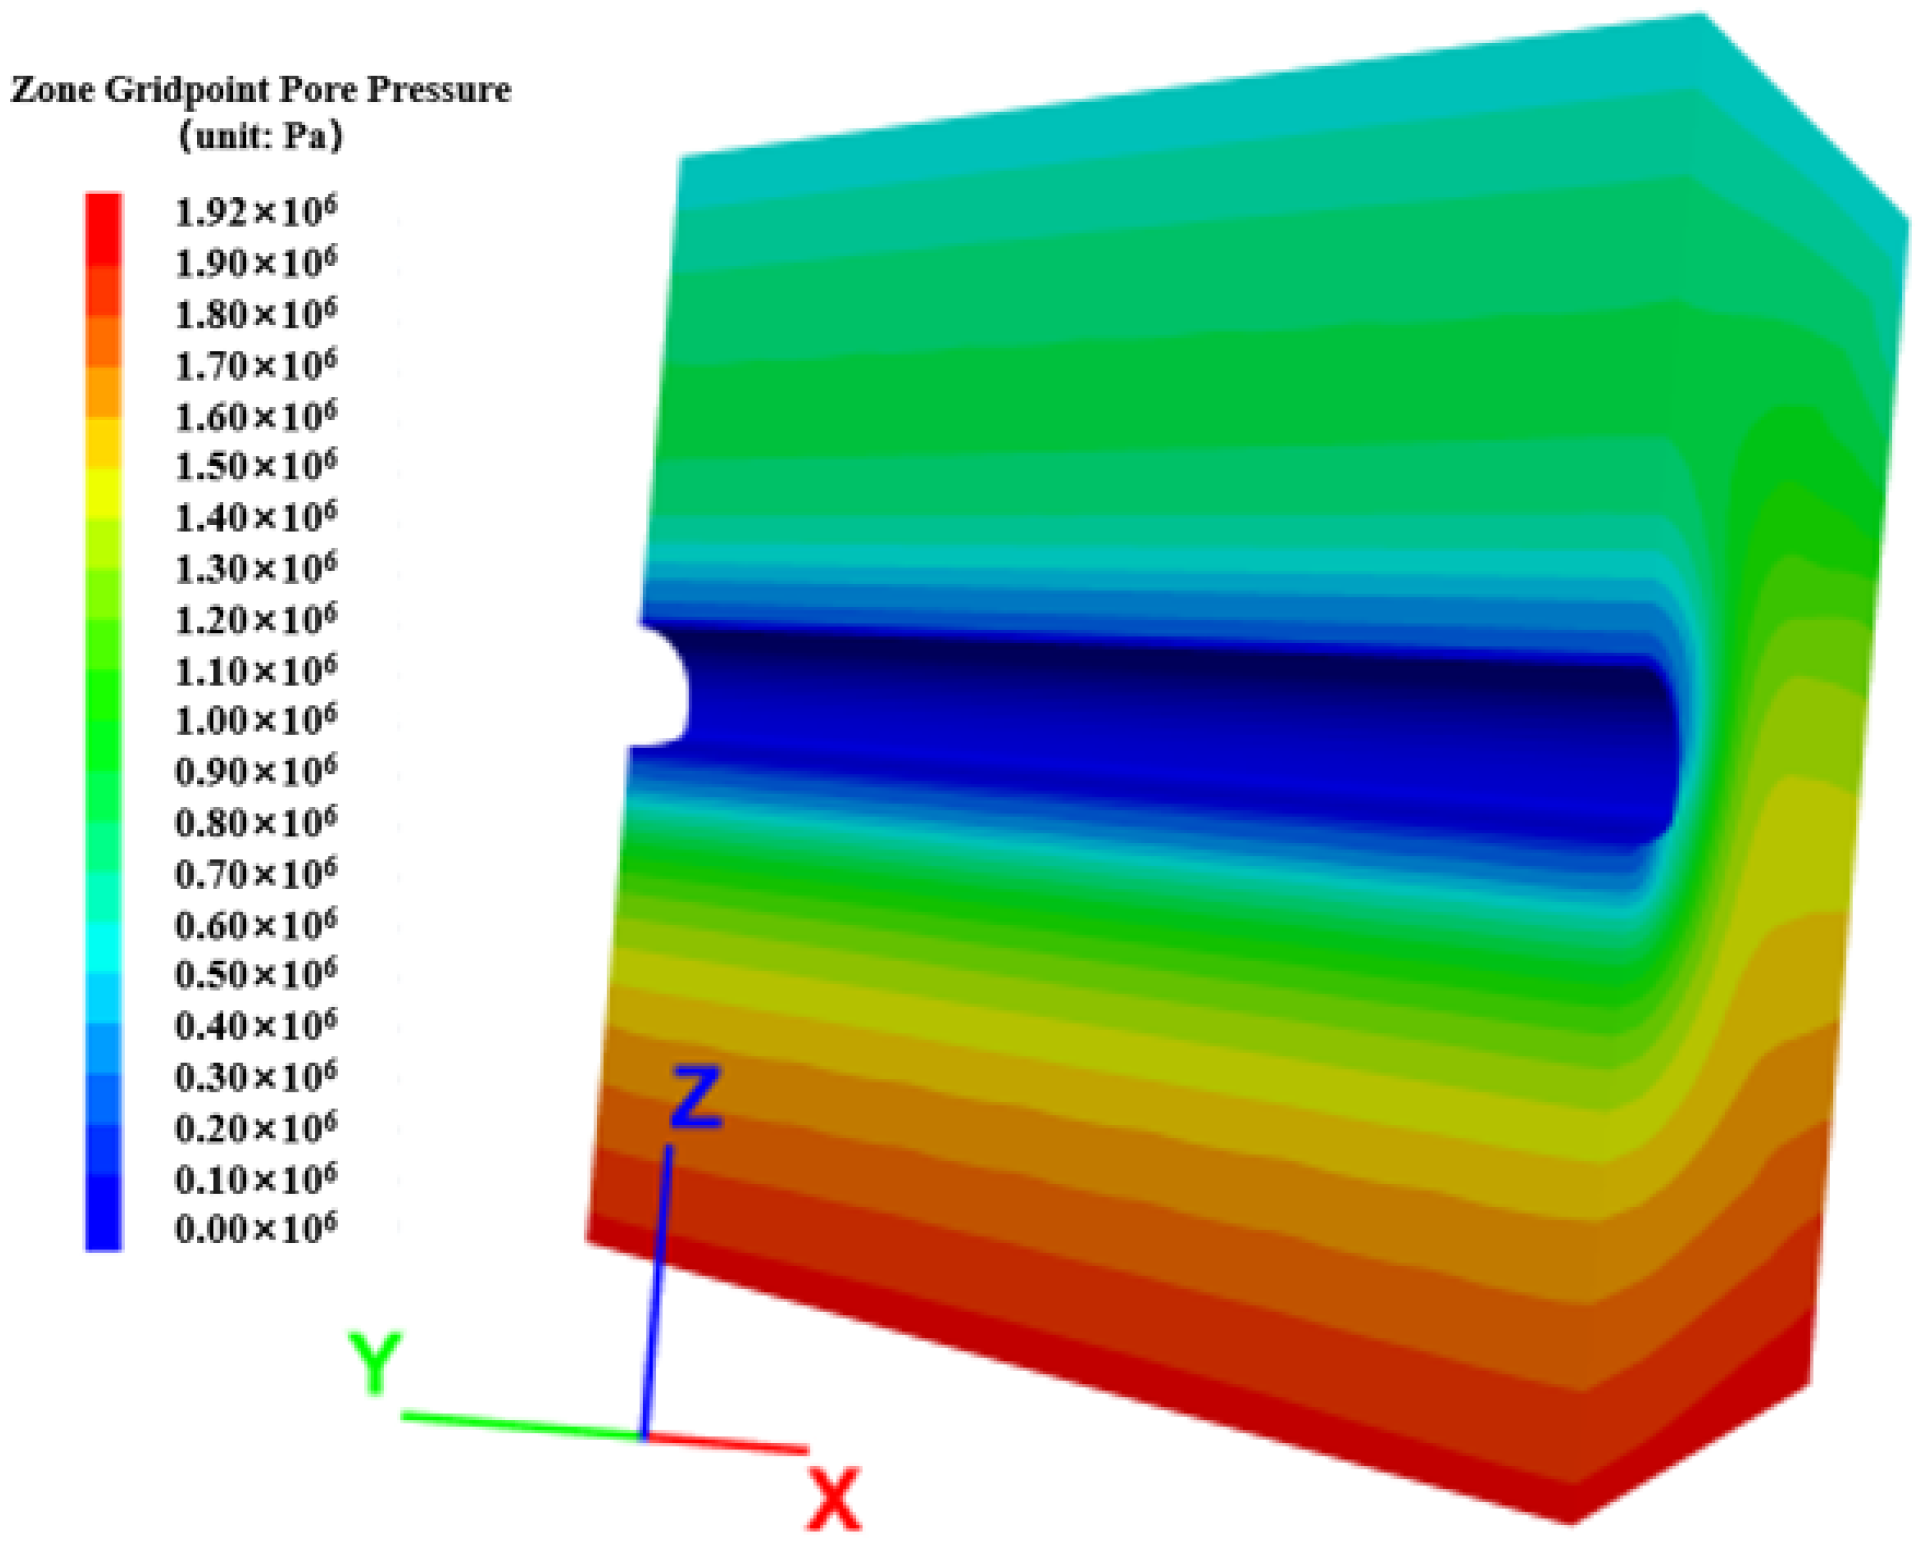
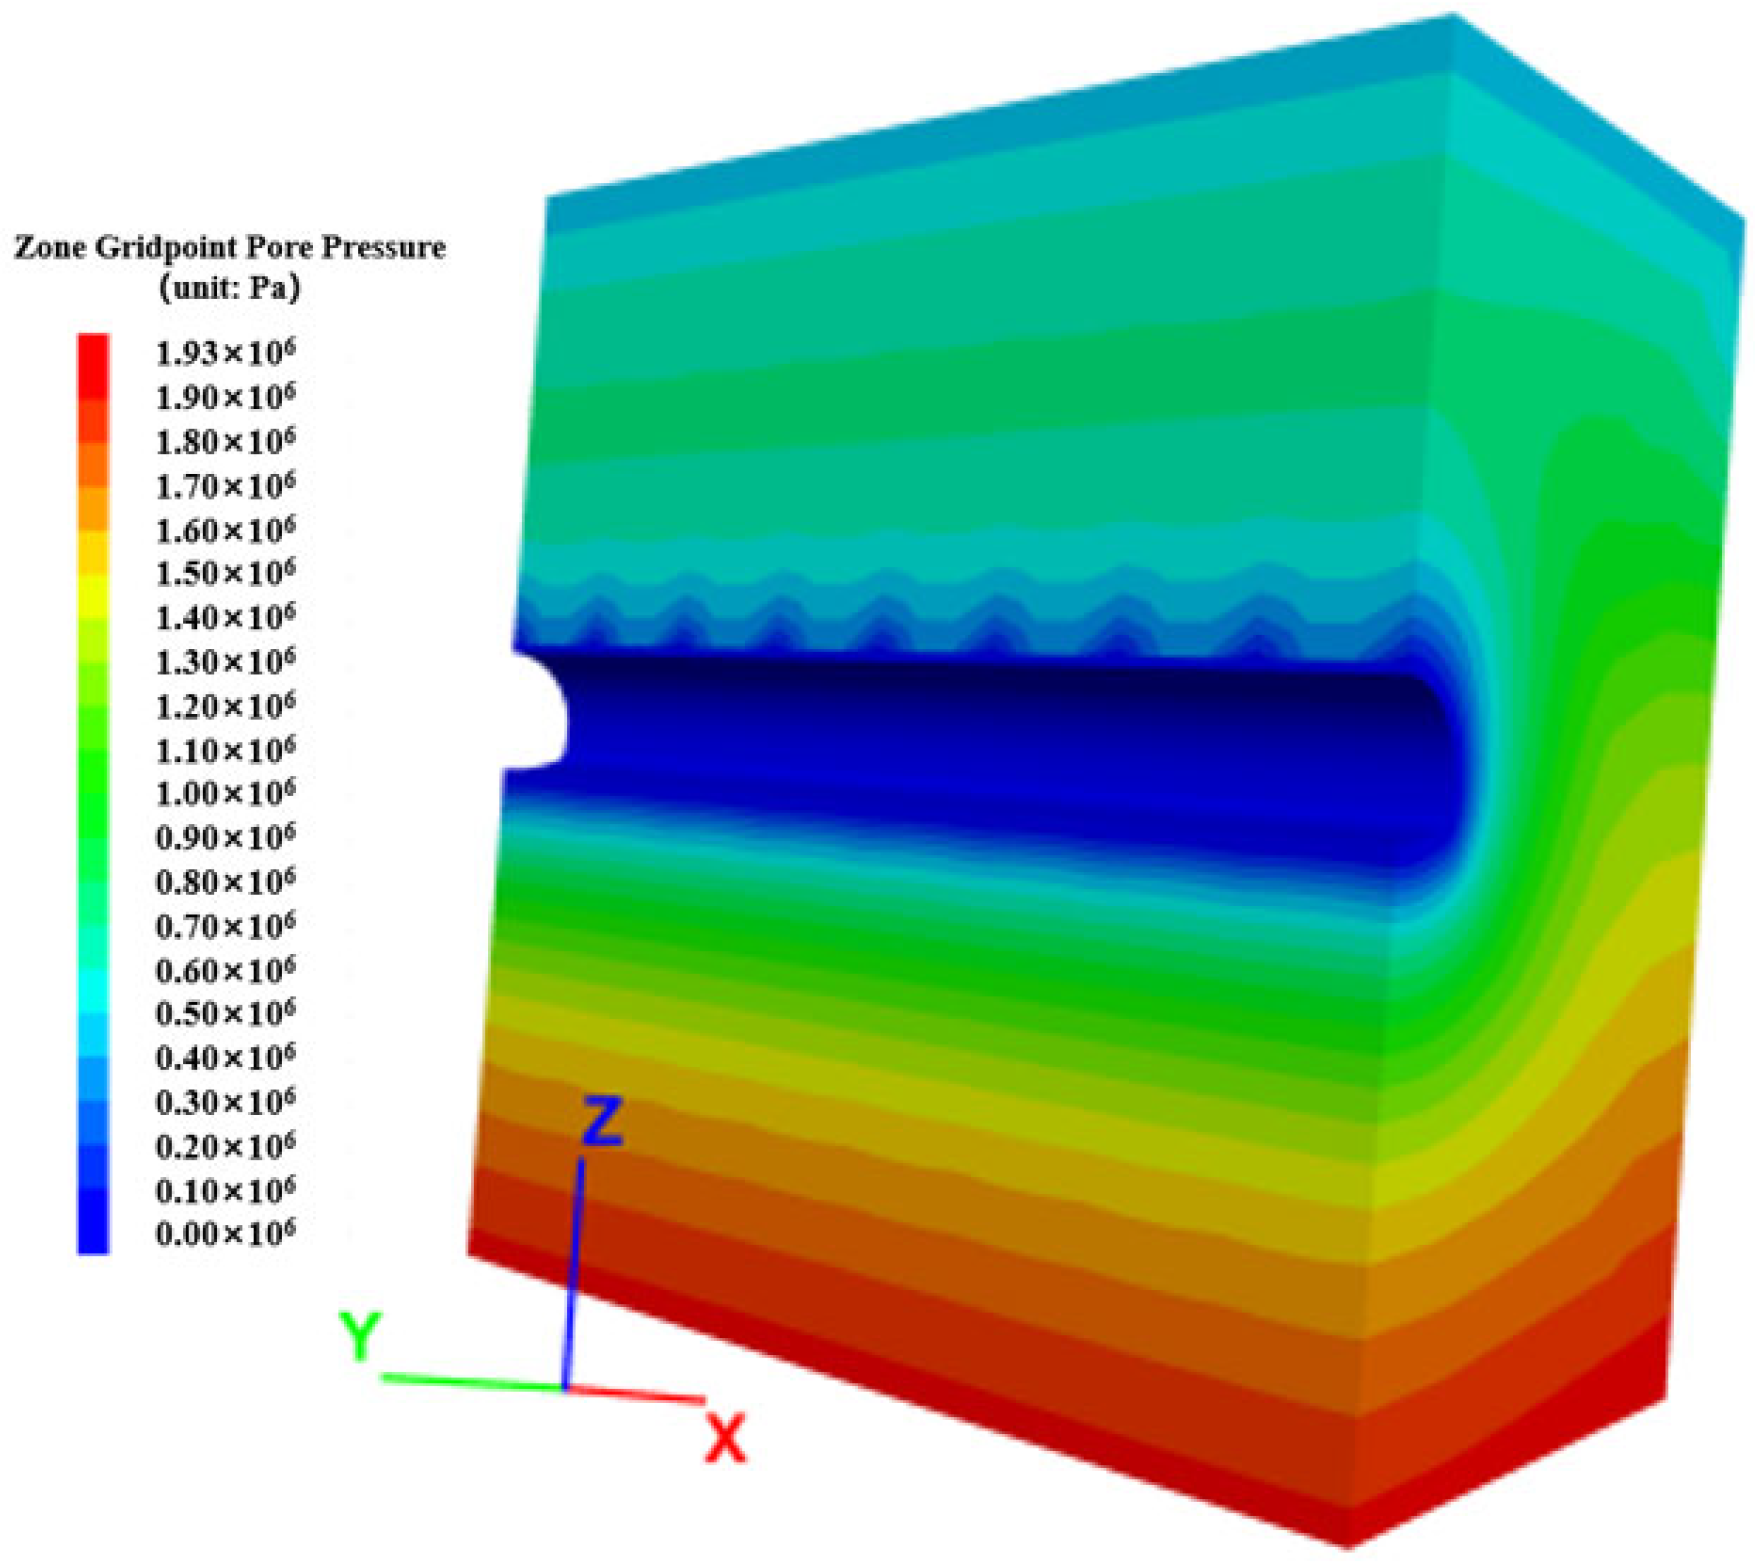
From
Figure 3, the setting of the tunnel drainage system effectively lowers the water pressure on the bake side of the tunnel lining. There is a maximum difference of 0.45 MPa in the arch foot position and a minimum difference of 0.1 MPa near the tunnel crown. Forty percent to eighty-two percent of the water pressure behind the lining can be released depending on how the tunnel drainage system is configured. The pore water pressure contour lines along the tunnel axis exist as mutually parallel straight lines when the tunnel drainage system is not configured (
Figure 4). However, when the tunnel drainage system is set and operating normally, the pore water pressure contour lines along the tunnel axis show a wave pattern with “peaks” and “valleys”, with the “peaks” appearing near the circular drainpipes and the “valleys” appearing between the two circular drainpipes. The pore water pressure at a given horizontal level is lower at the “peaks” than at the “valleys” (
Figure 5). The pore water pressure wave pattern around the tunnel drainage system is caused by the tunnel drainage system specifically releasing pore water pressure near the tunnel drainpipe. This ensures the stability and longevity of the tunnel construction by lowering the average pore water pressure in the area.
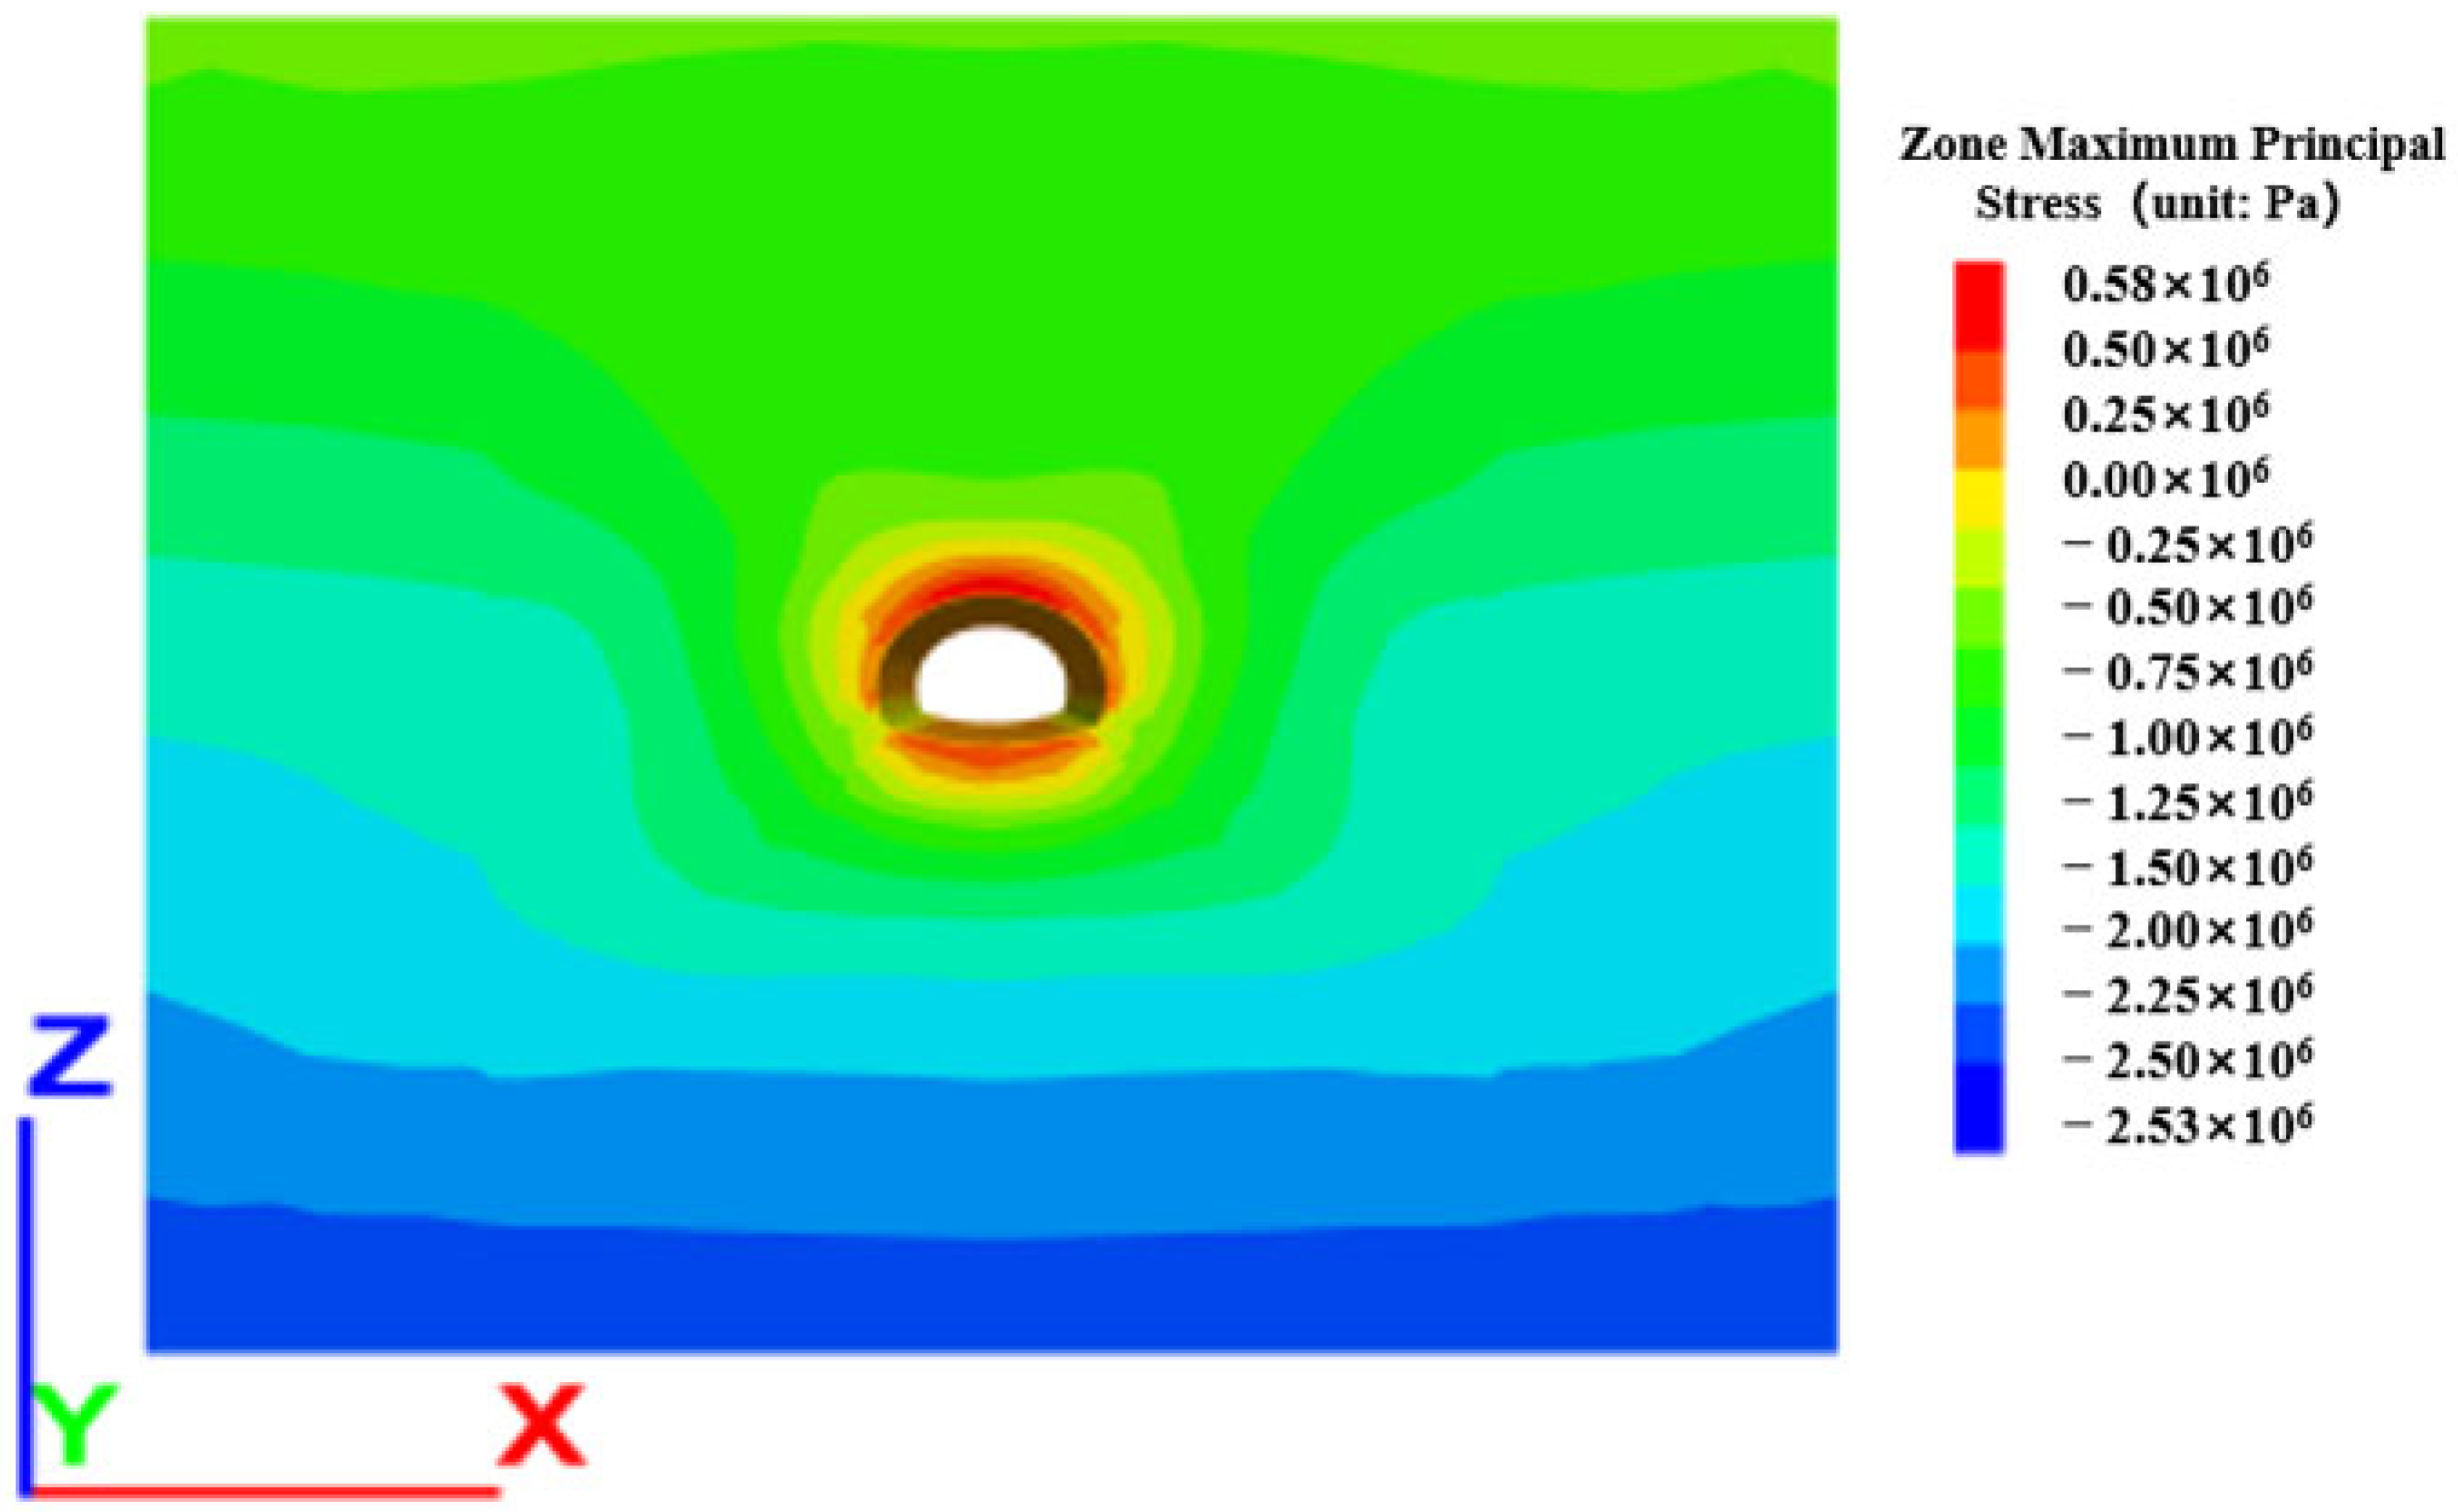
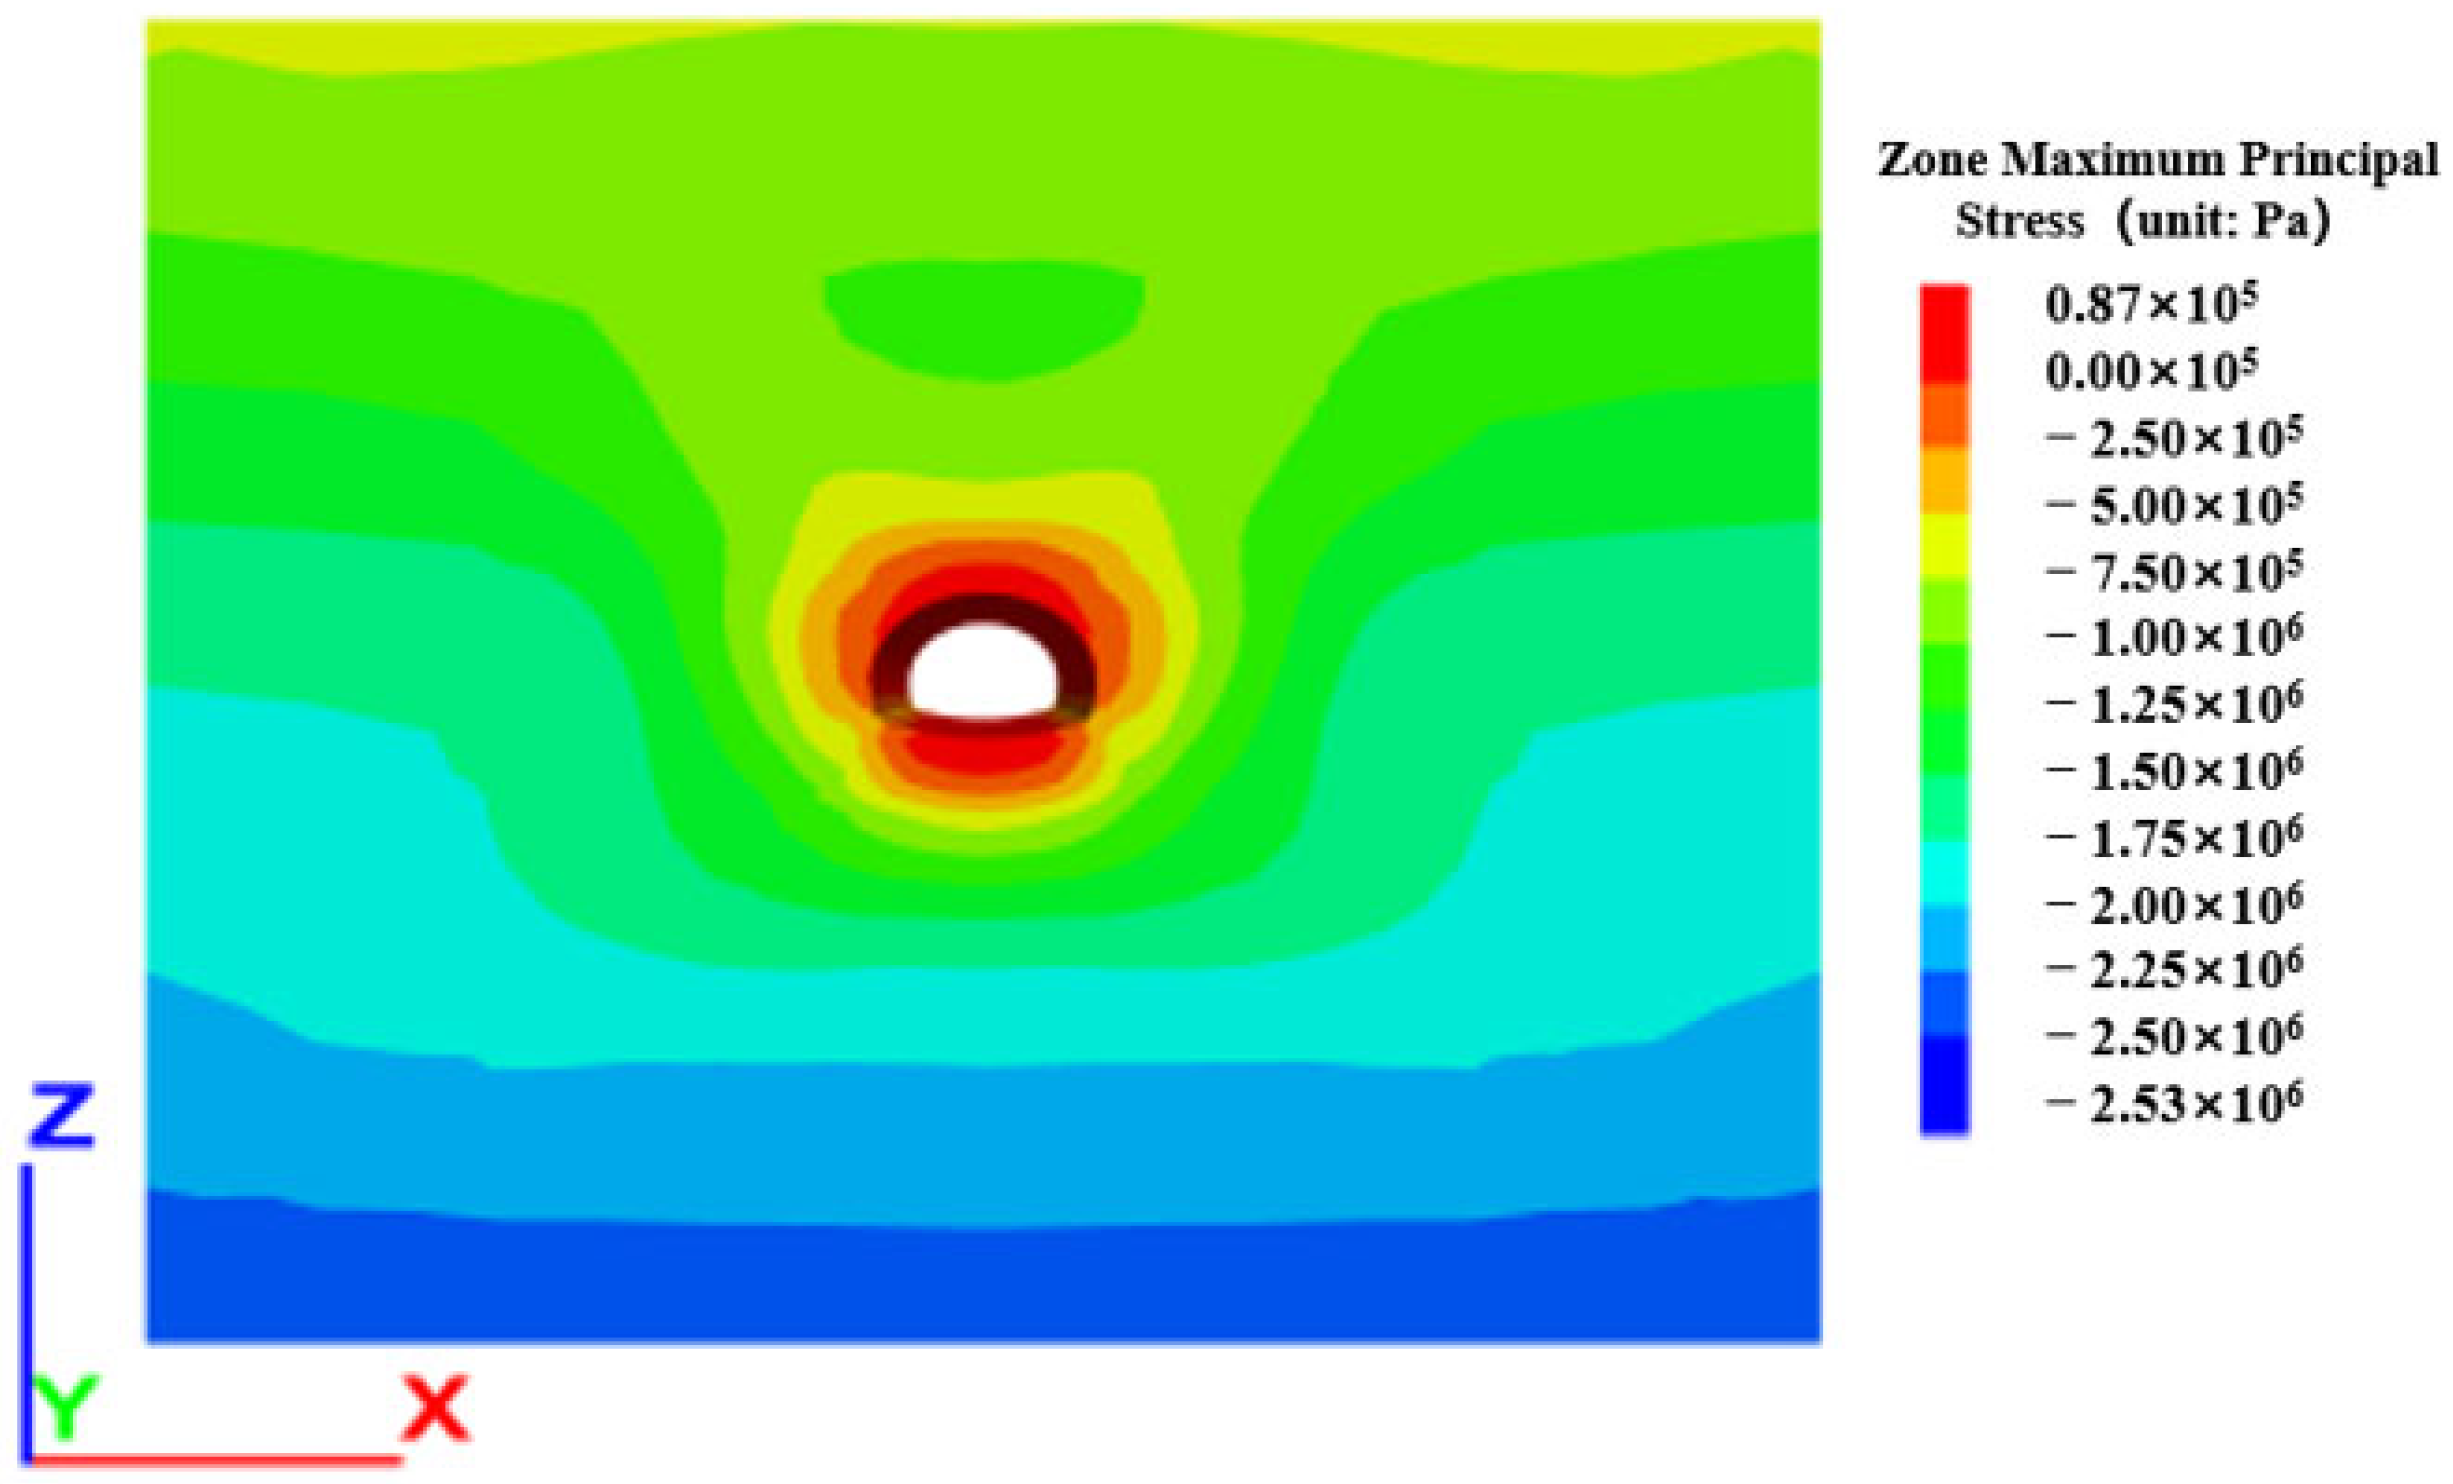
4.1.2. Stress Analysis
The installation of a drainage system in tunnels reduces the range and degree of stress disturbance on the surrounding rock mass compared to situations without drainage systems. The maximum main stress without drainage on the tunnel lining is 0.483 MPa higher than with normal drainage, and the maximum main stress reduction is 80% (see
Figure 6 and
Figure 7). As a result of the installation of the tunnel drainage system, the pore water pressure around the tunnel is reduced, which lowers the stress on the nearby rock due to the combined effect of the seepage field and stress field. The placements of the crown, inverted arch and arch foot place the maximum strain on the tunnel lining (as shown in
Figure 8). With a maximum stress of 0.61 MPa and a stress decrease of 50%, the stress is concentrated and varies the most at the arch foot position. Under the combined effects of the fluid–structure interaction, without a drainage system, the pore water pressure at the arch foot position suffers the biggest and most concentrated change, leading to a higher change in stress and stress value at the arch foot.
4.1.3. Displacement Analysis
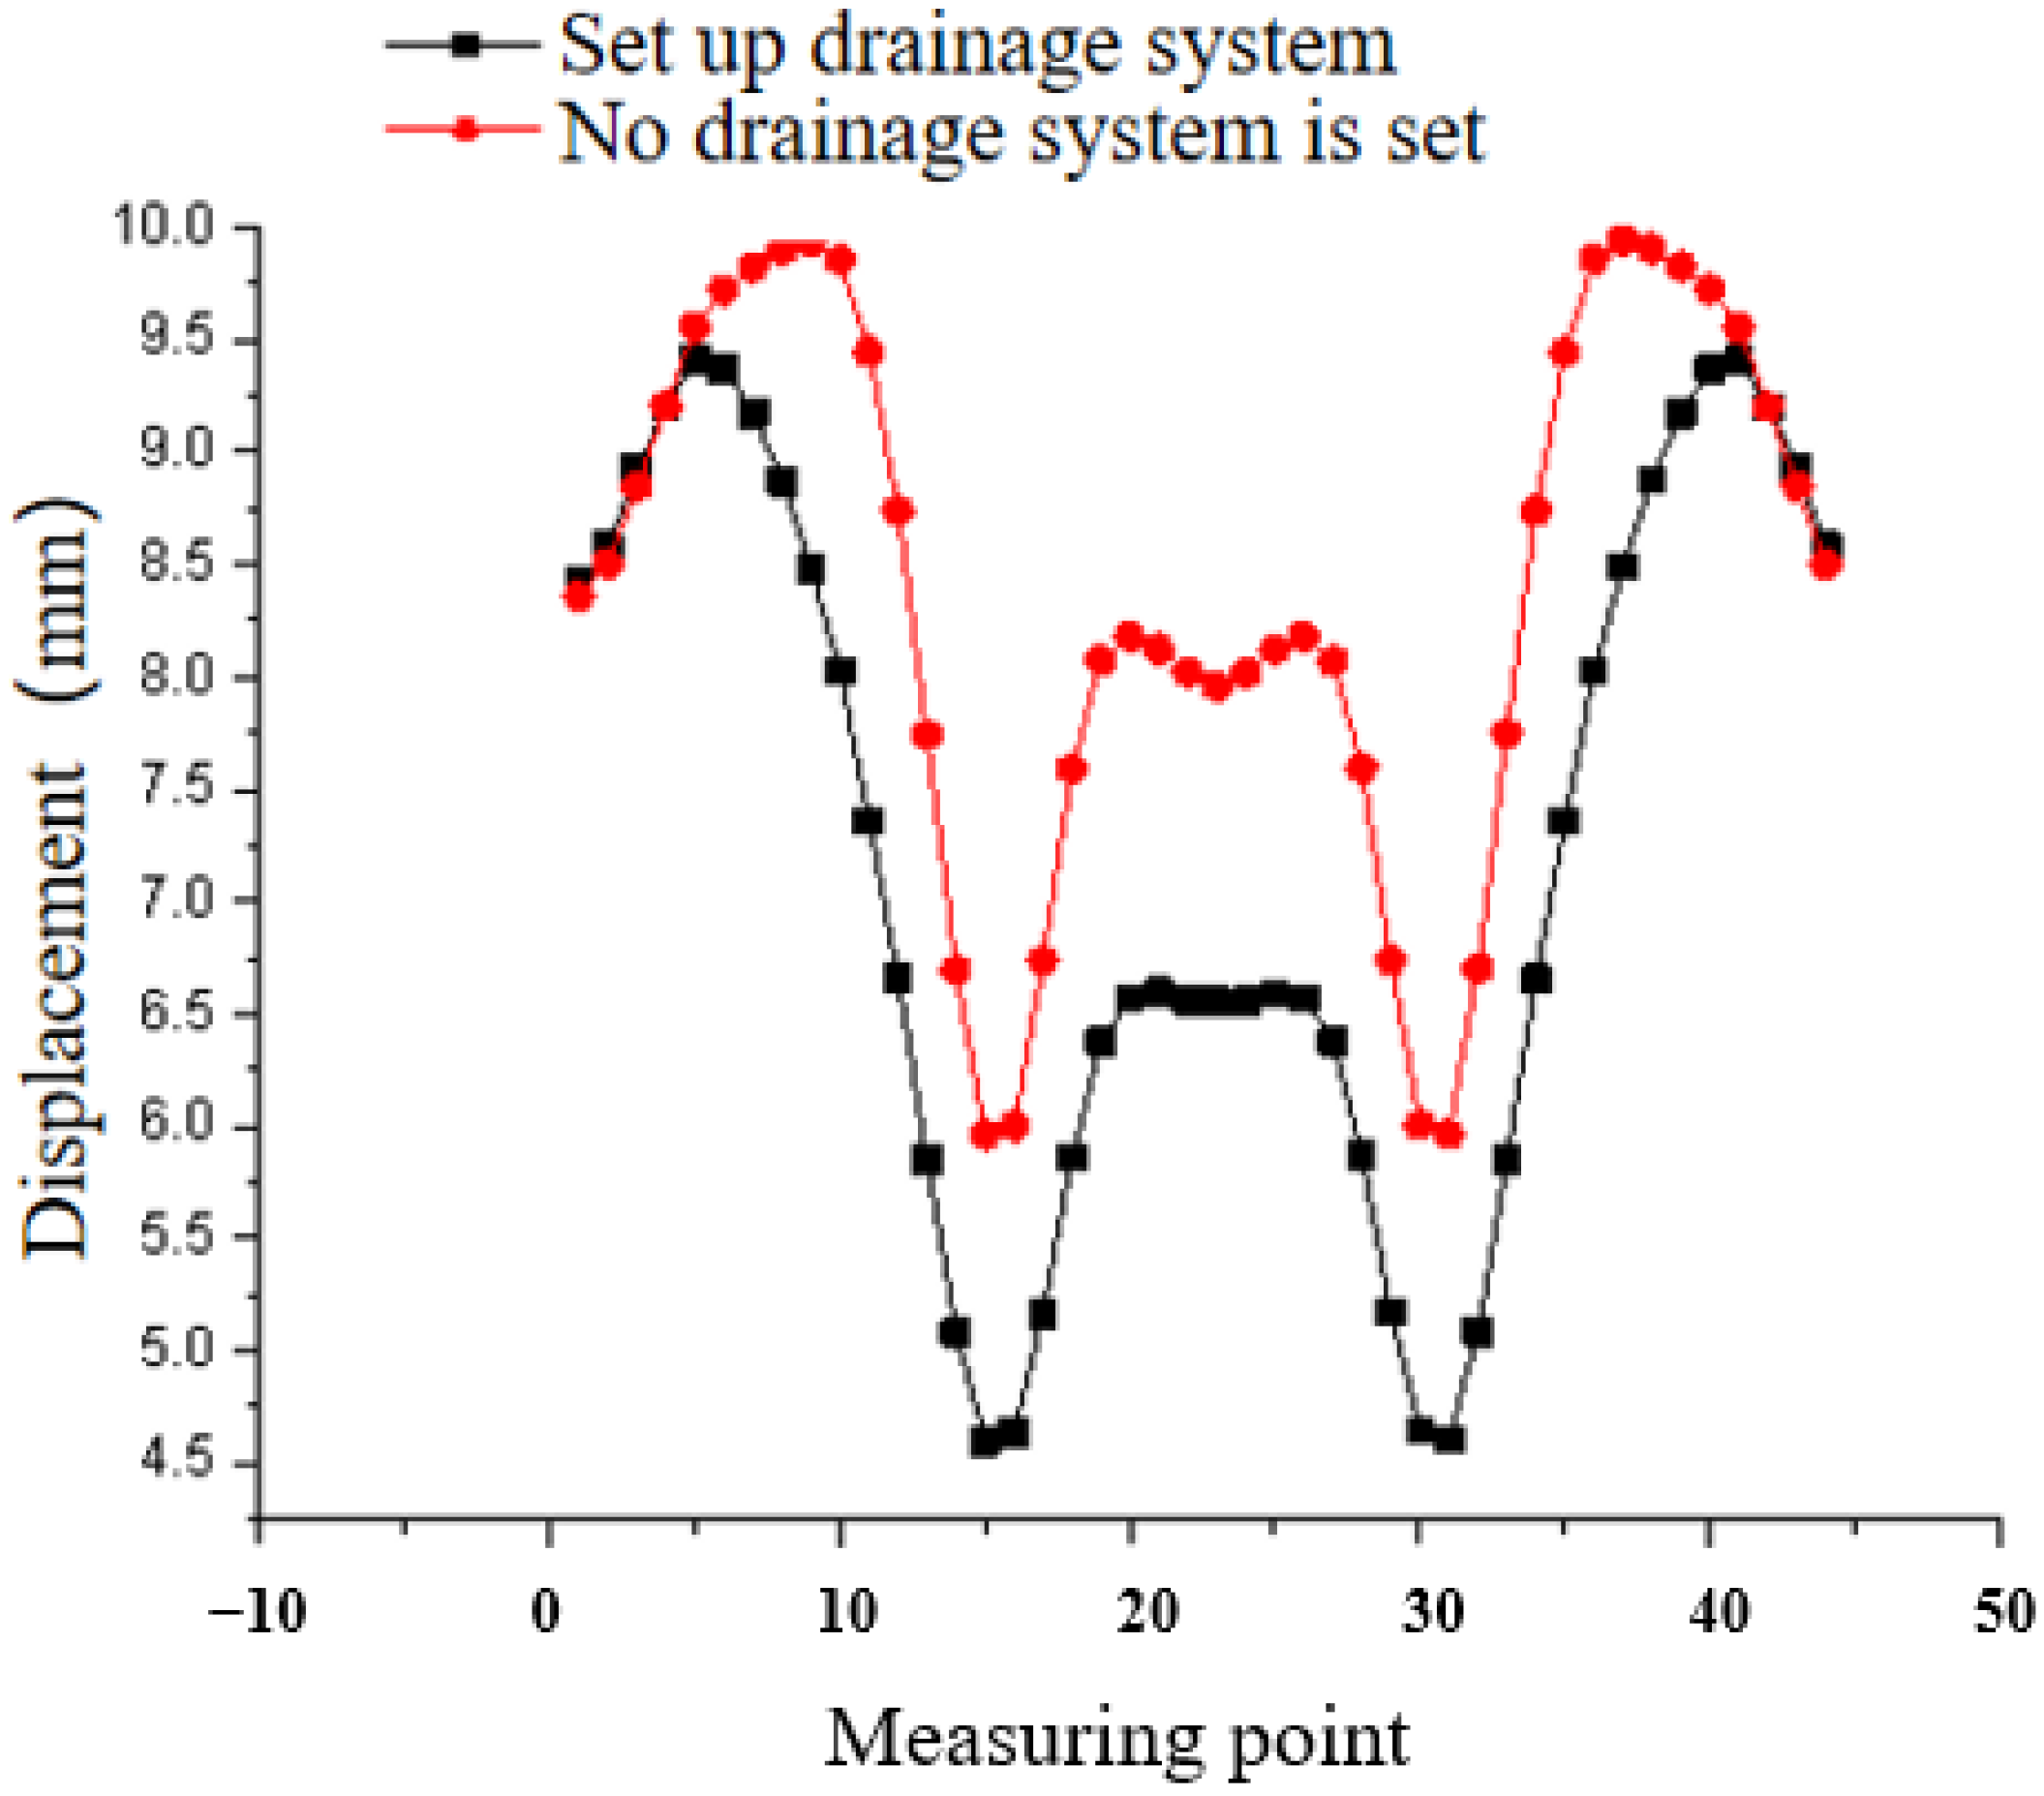
According to the displacement curve shown in
Figure 9, the range and degree of displacement of the entire system are less when the drainage system is installed and functioning normally than when there is no drainage system installed in the tunnel. This indicates that the installation of a tunnel drainage system helps to control the displacement of both the surrounding rock mass and the tunnel lining. The presence of a tunnel drainage system benefits the formation of the pressure arch effect in deeply buried tunnels by lowering the pore water pressure near the tunnel, raising the effective tension of the surrounding rock mass and decreasing the deformation of the tunnel.
4.2. Simulation Analysis of Circular Drain Blocking
4.2.1. Analysis of Pore Water Pressure
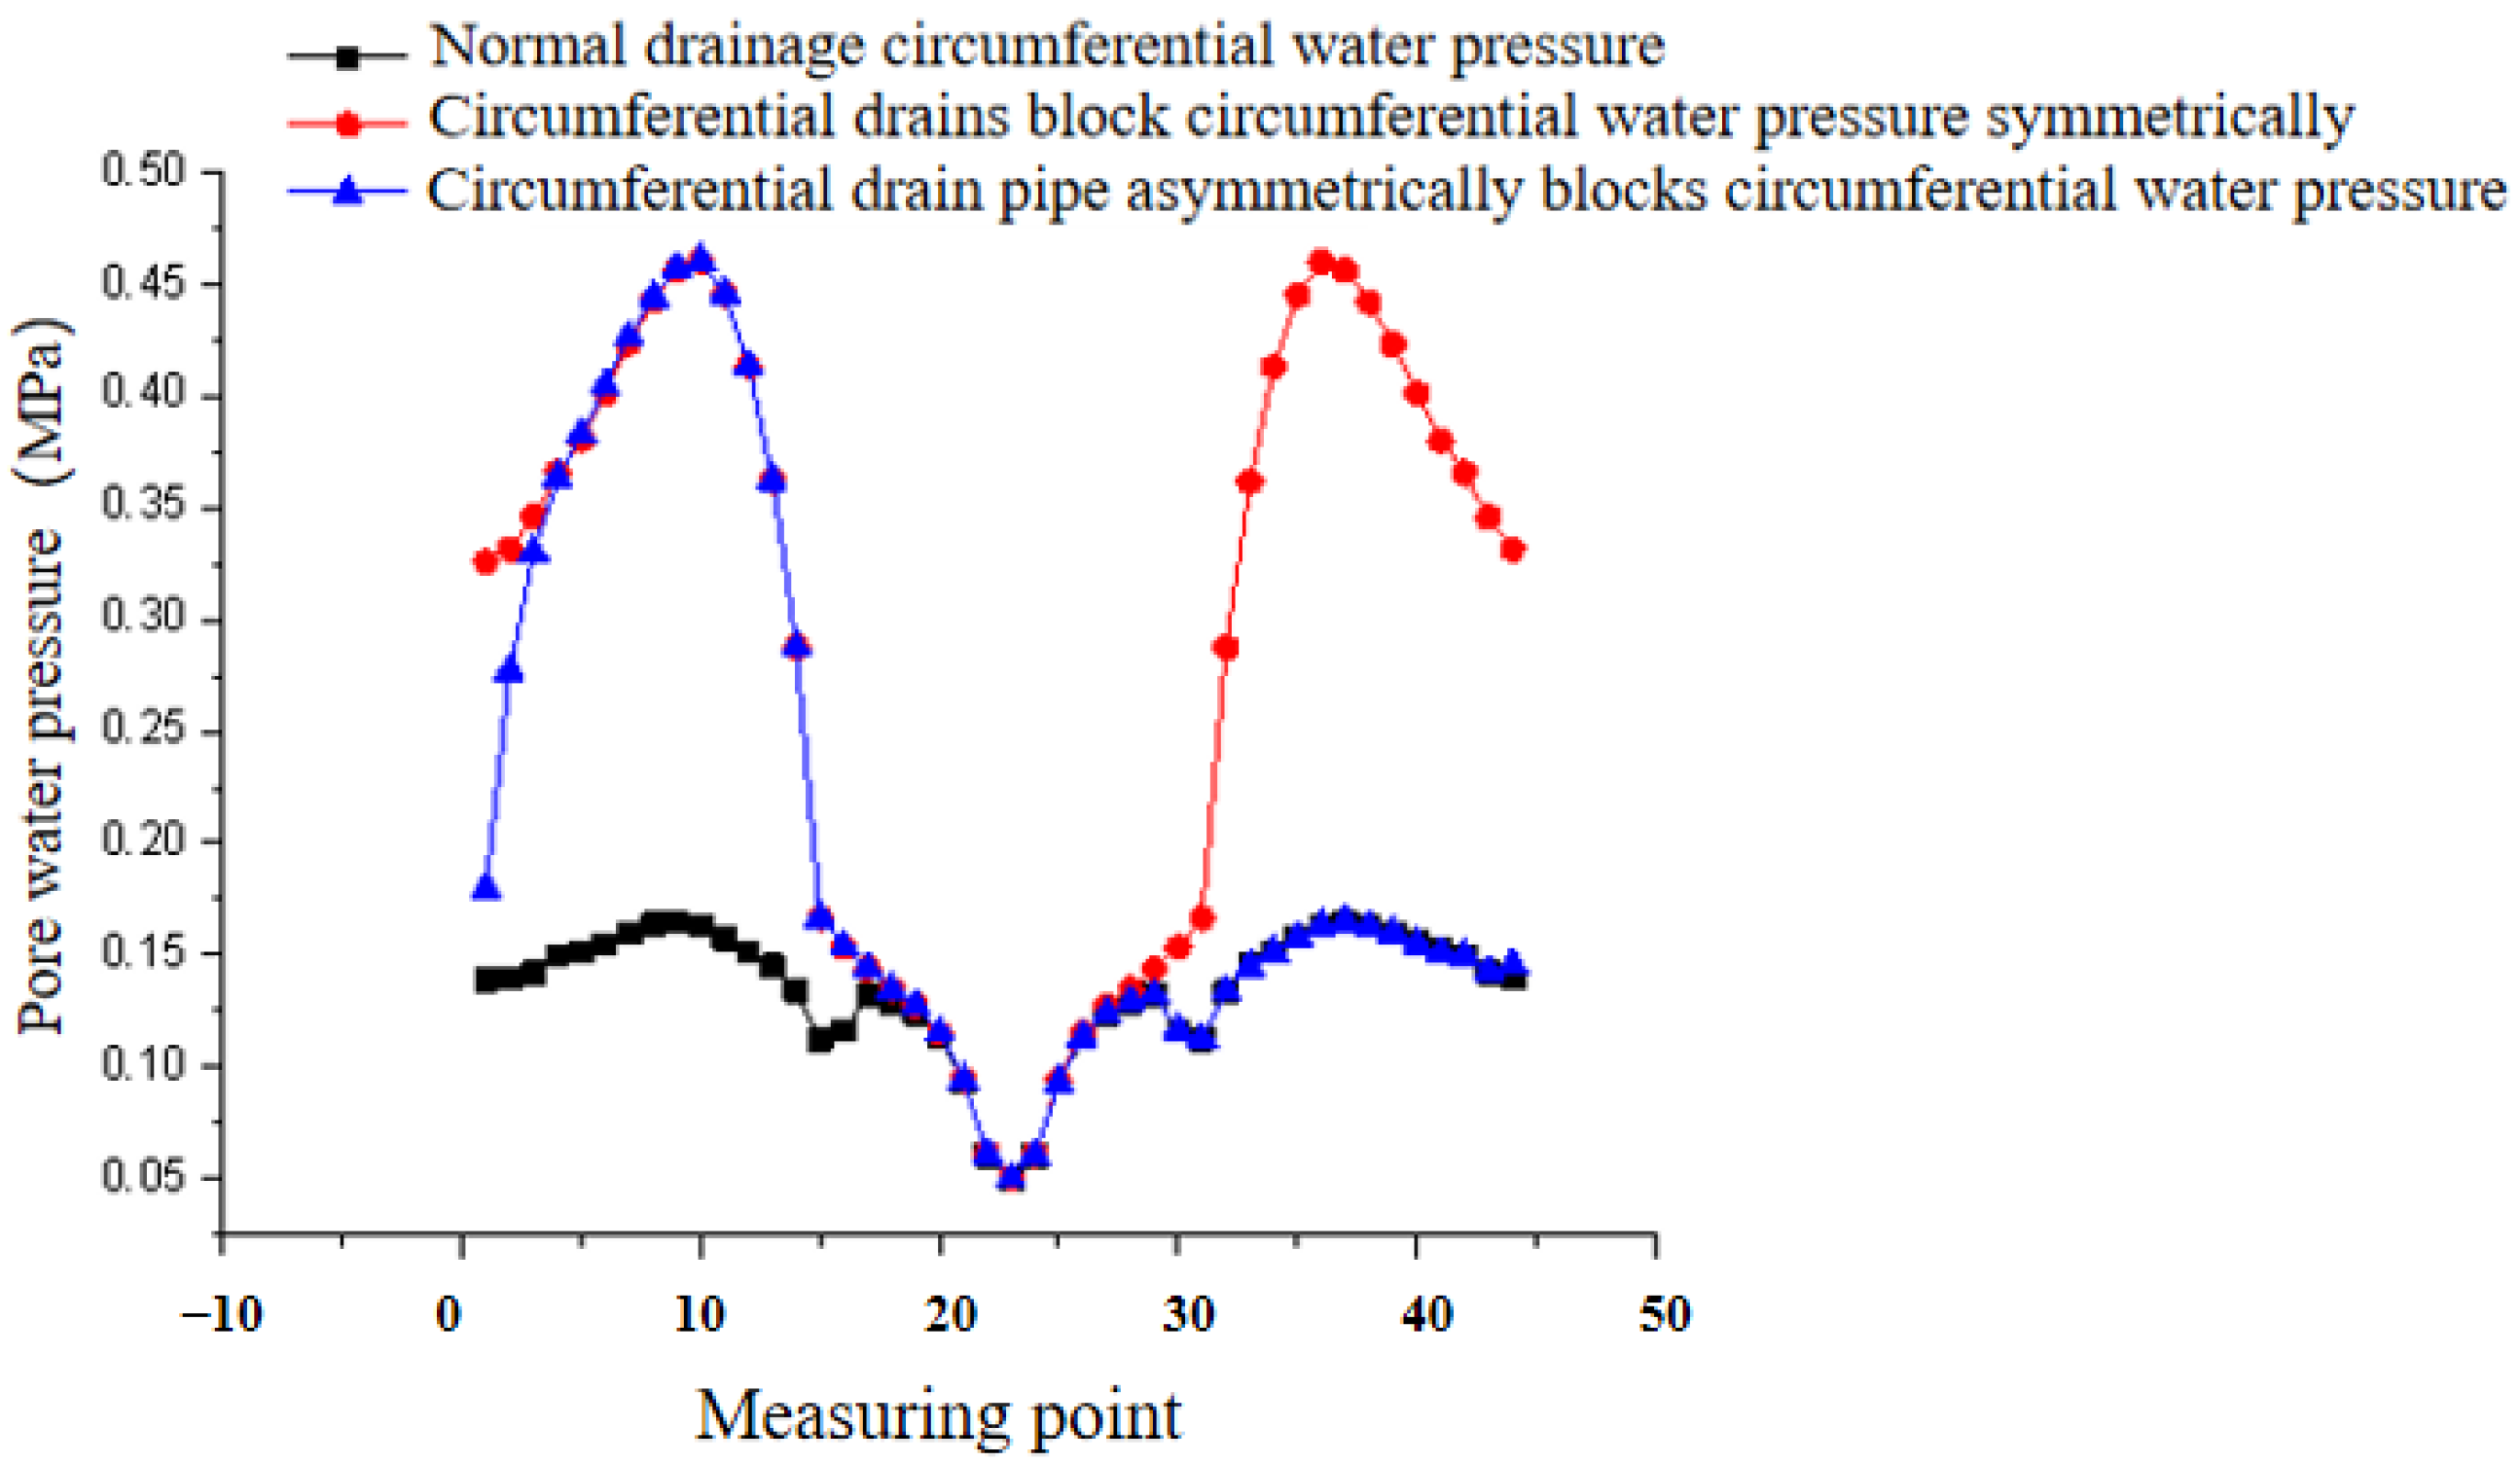
The pore water pressure at the back side of the tunnel lining on the crown and sidewalls increases if the circular drainpipes on both sides of a drainage section are simultaneously blocked, as shown in
Figure 10. The sidewall lining experiences a rise in pore water pressure of up to 0.3 MPa, or 200%, at the back side of the lining. When a circular drainpipe on one side is blocked, the pore water pressure at the back side of the lining on the blocked sidewall increases. At the crown of the tunnel, the maximum increase in pore water pressure at the back side of the lining is 0.025 MPa, a 17% increase compared to the normal drainage. The maximum increase in pore water pressure at the back side of the lining on the blocked sidewall reaches 0.3 MPa, an increase of 200%.
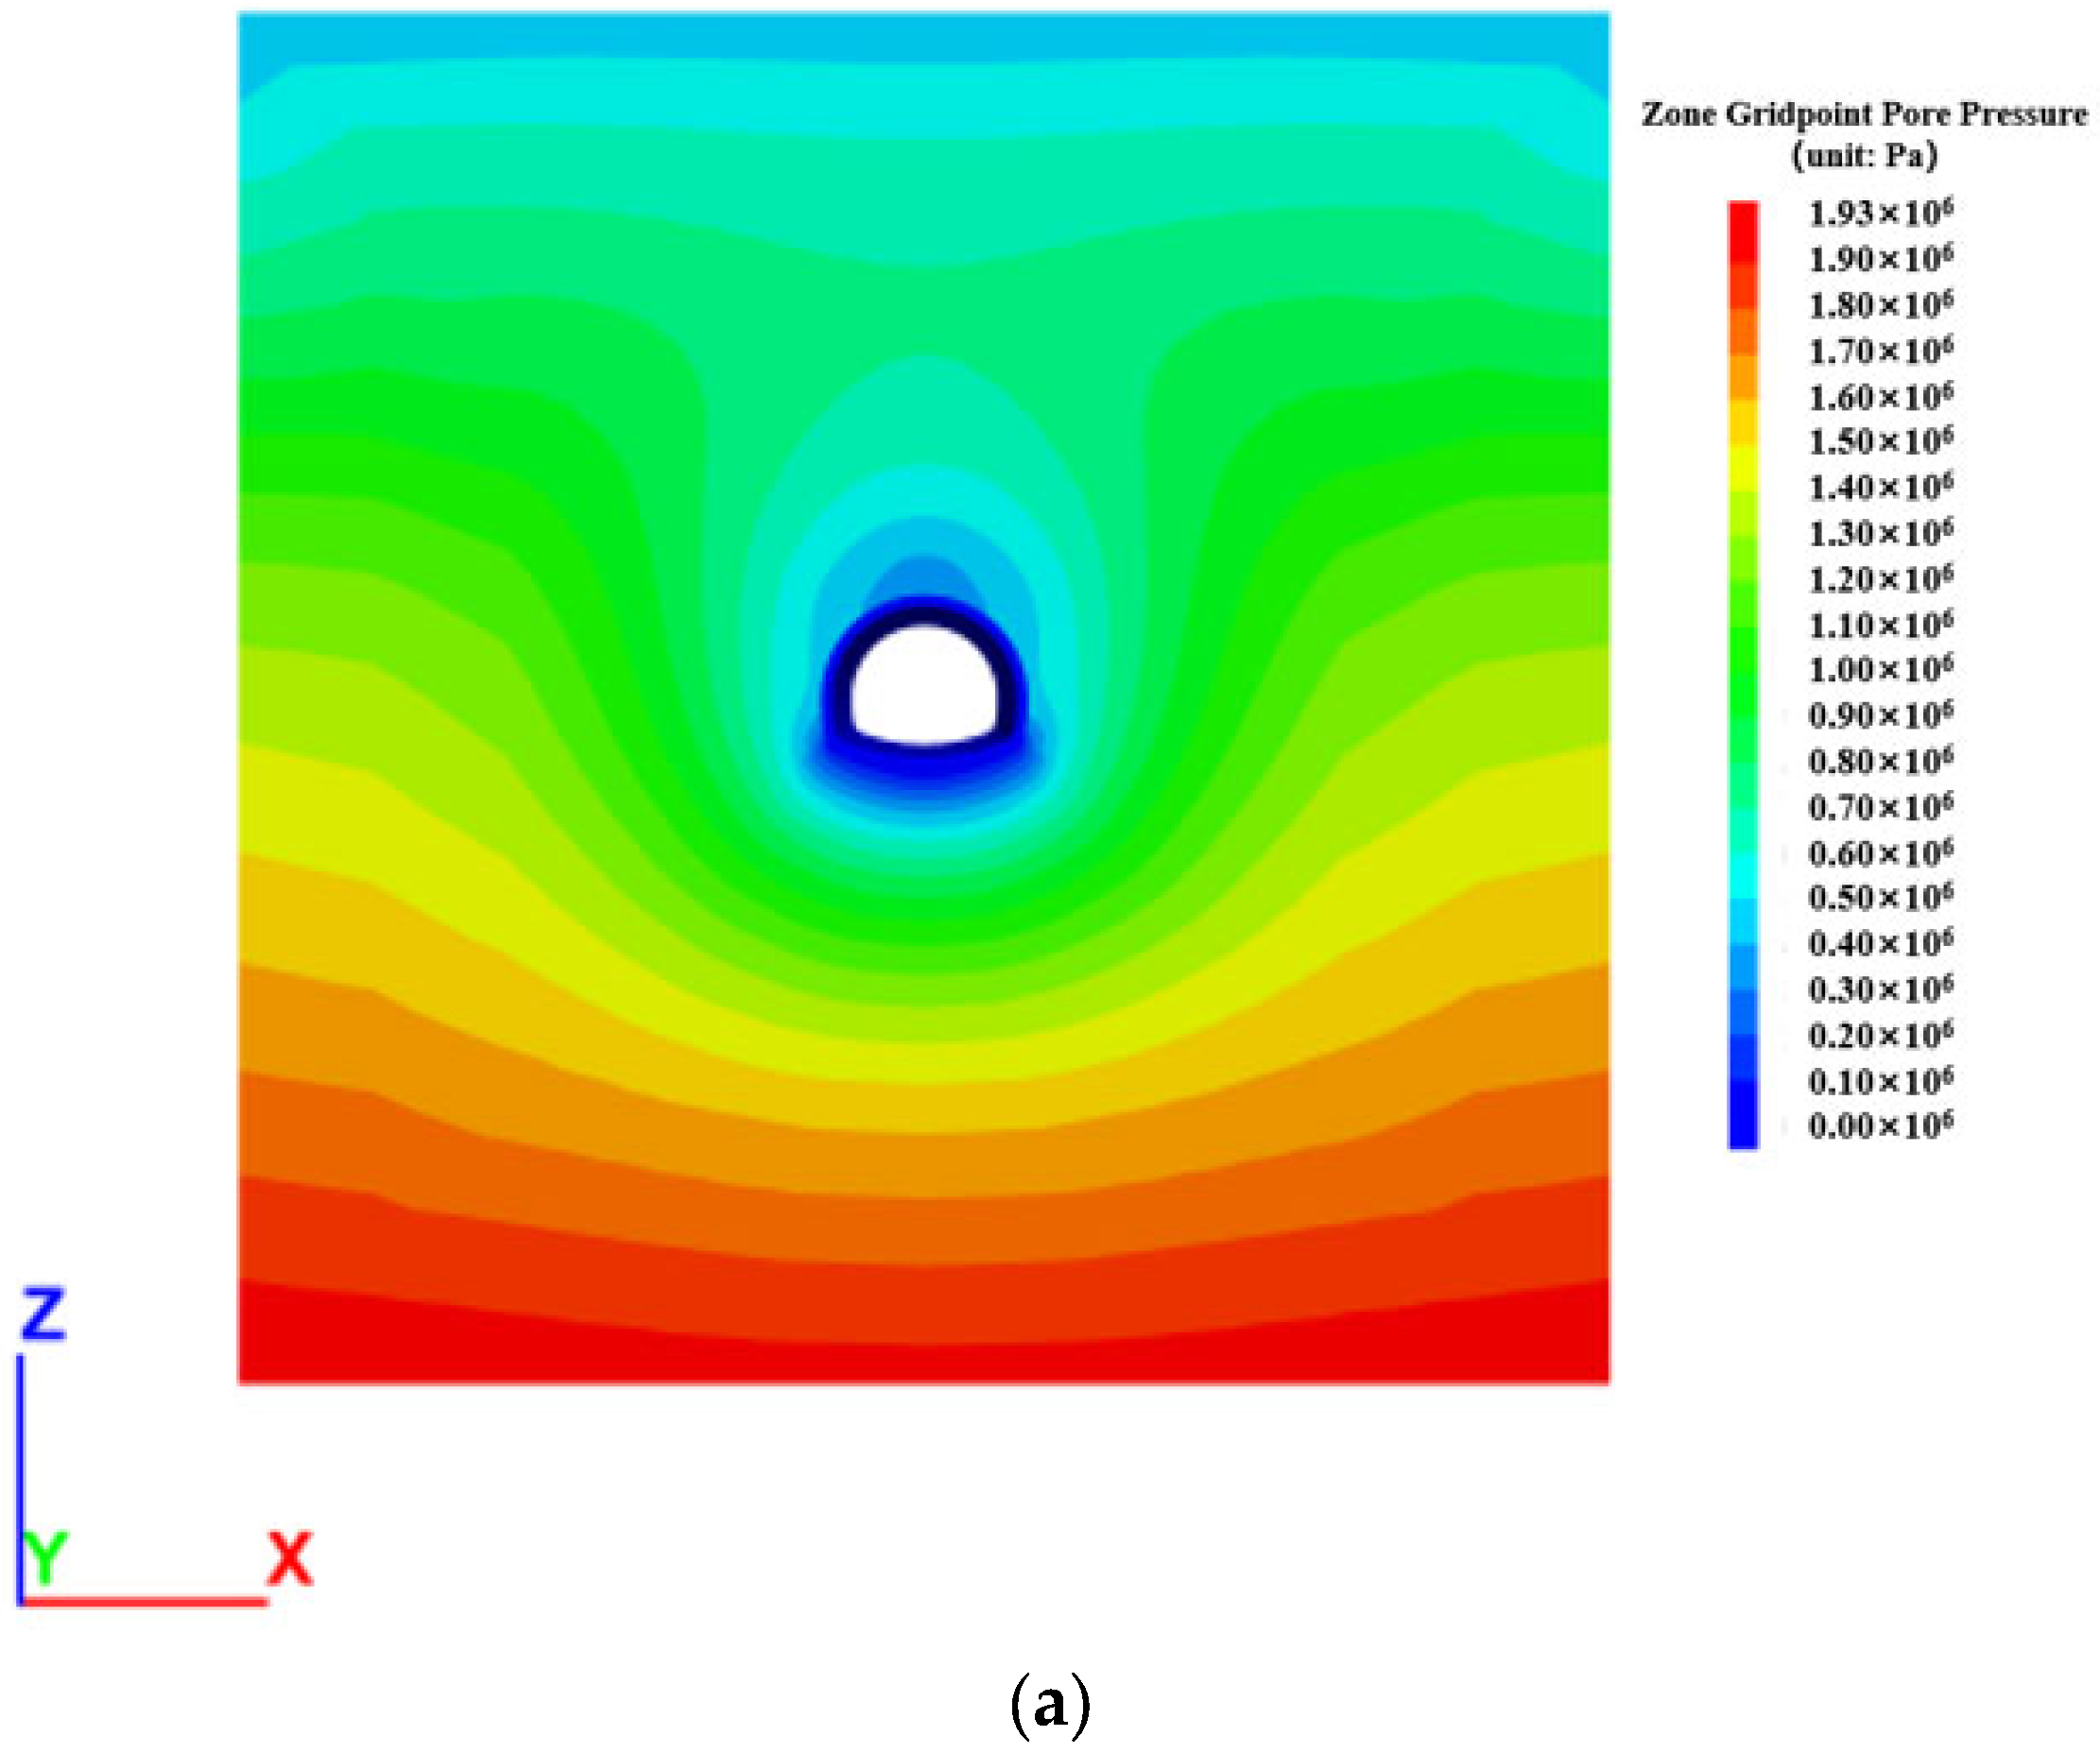
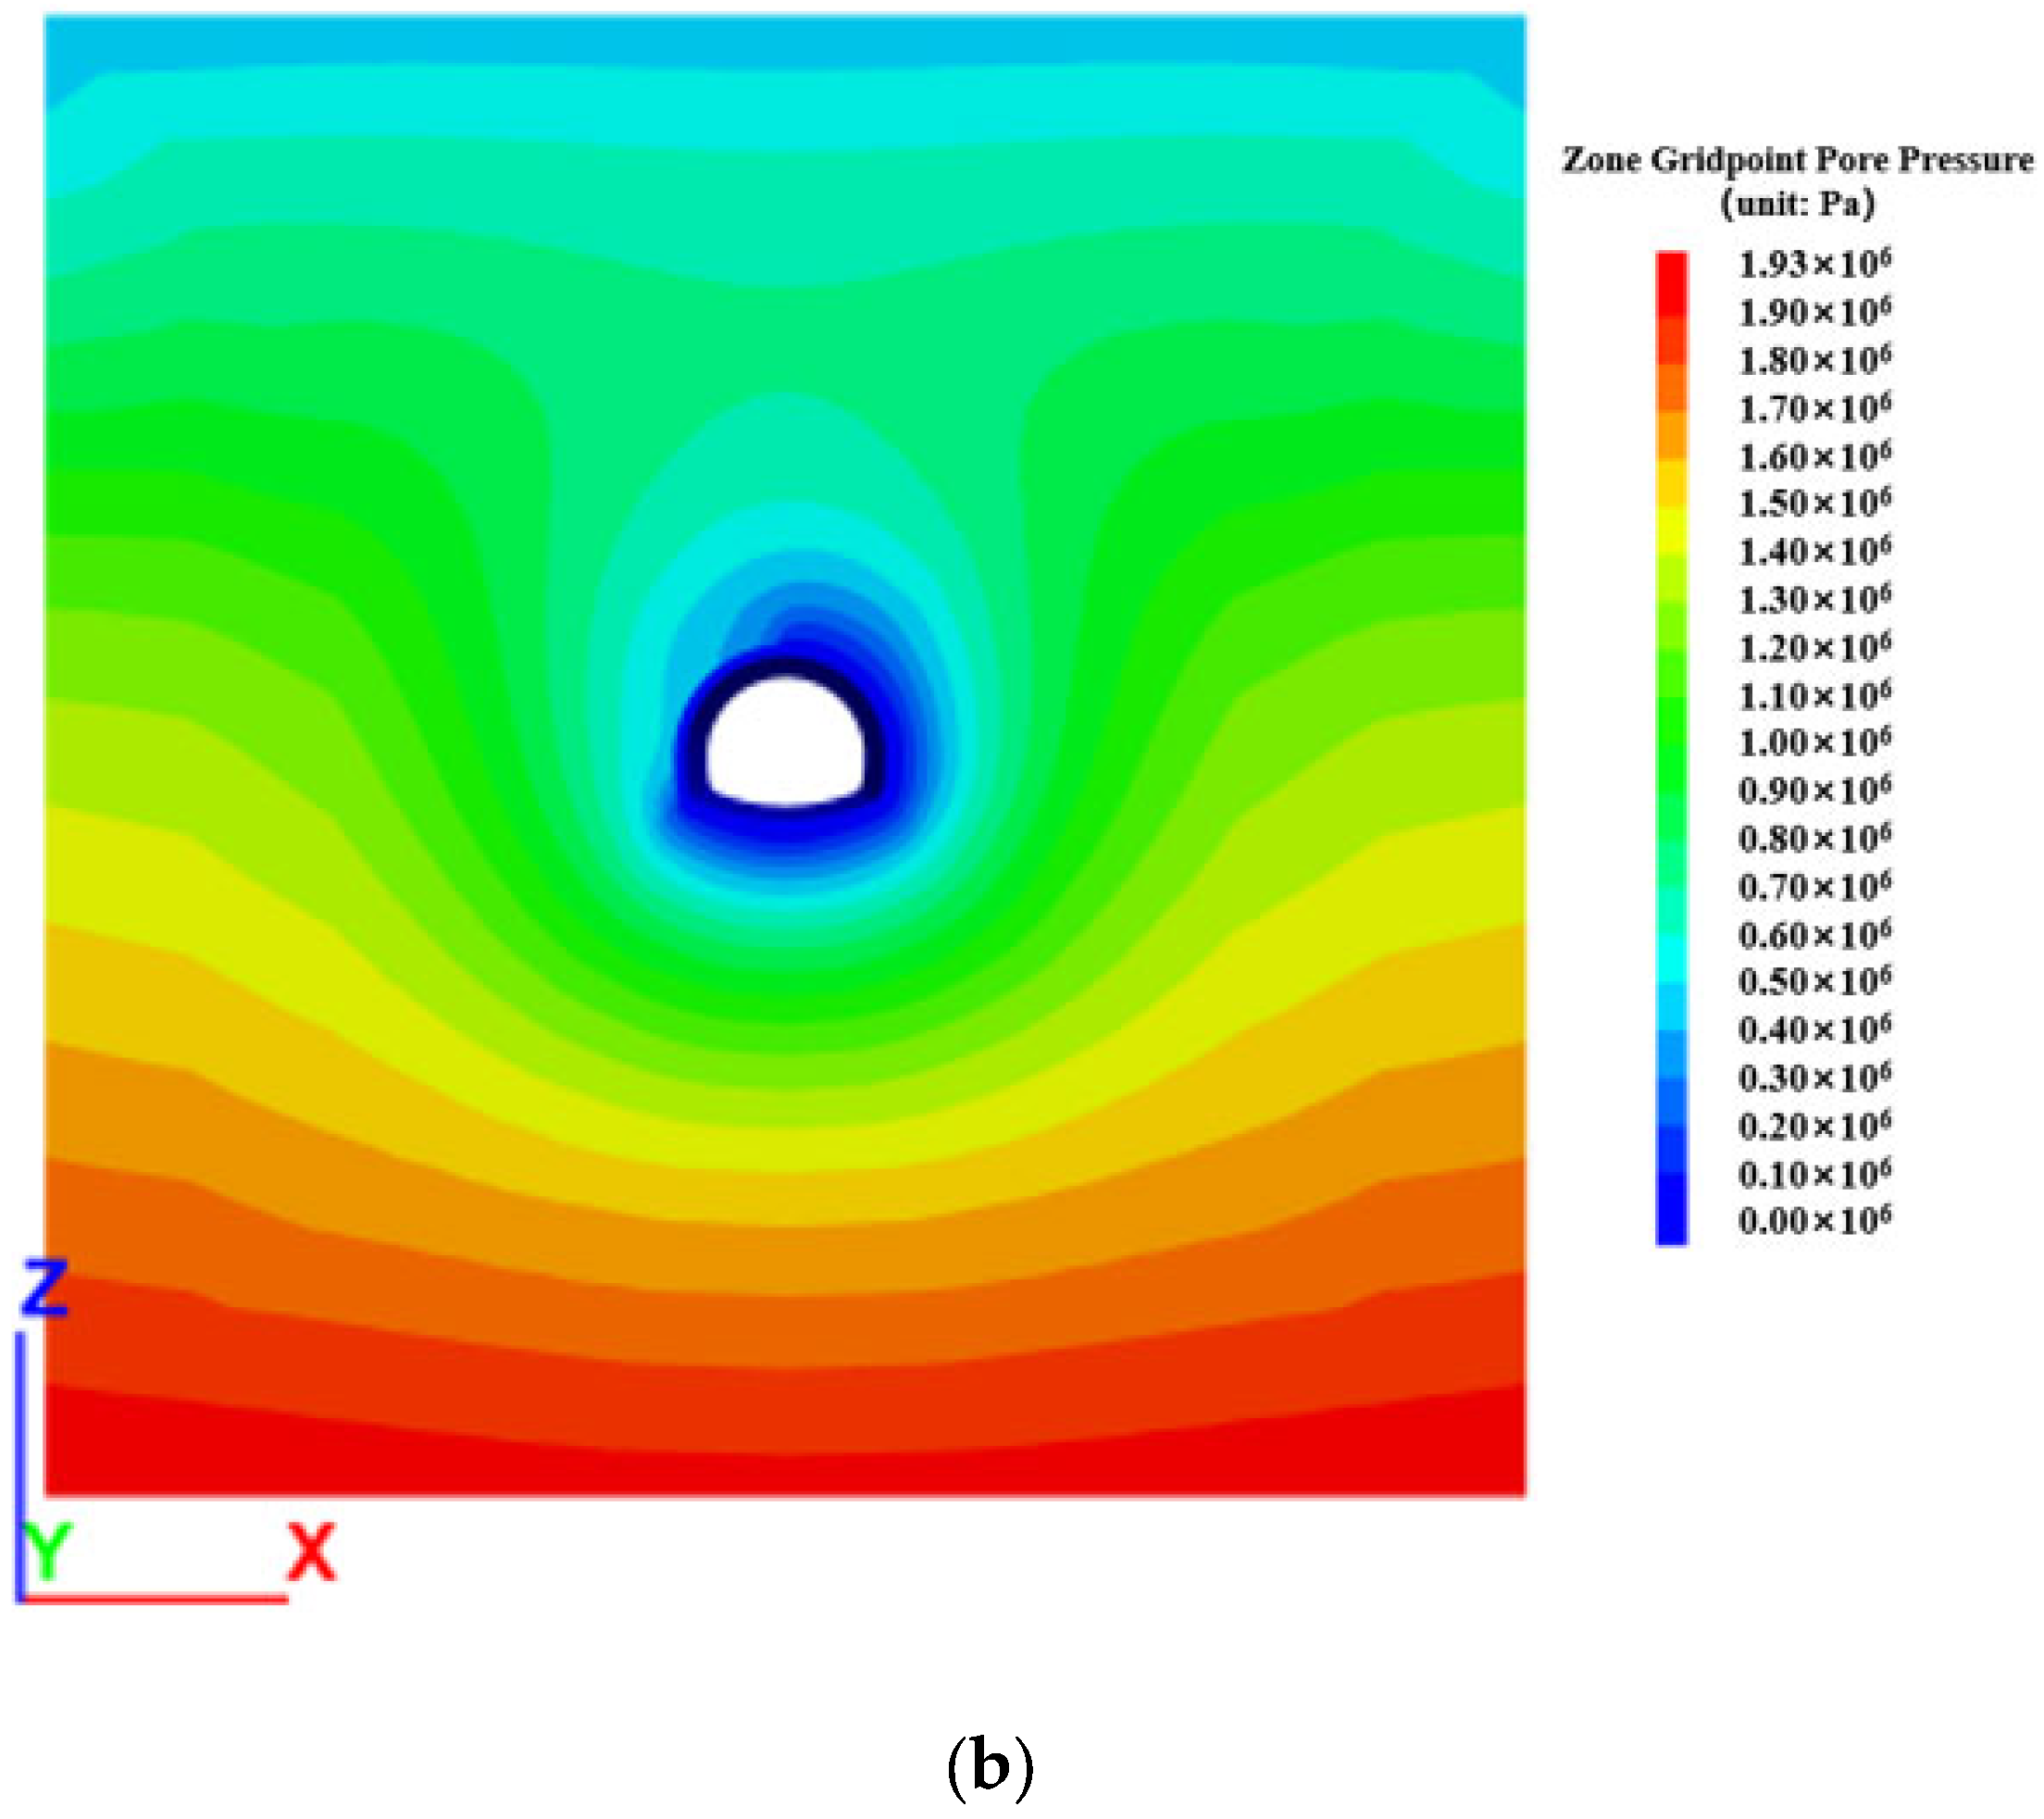
Figure 11 shows the pore water pressure nephogram of the circumferential drainage pipe under different blocking conditions.
4.2.2. Stress Analysis
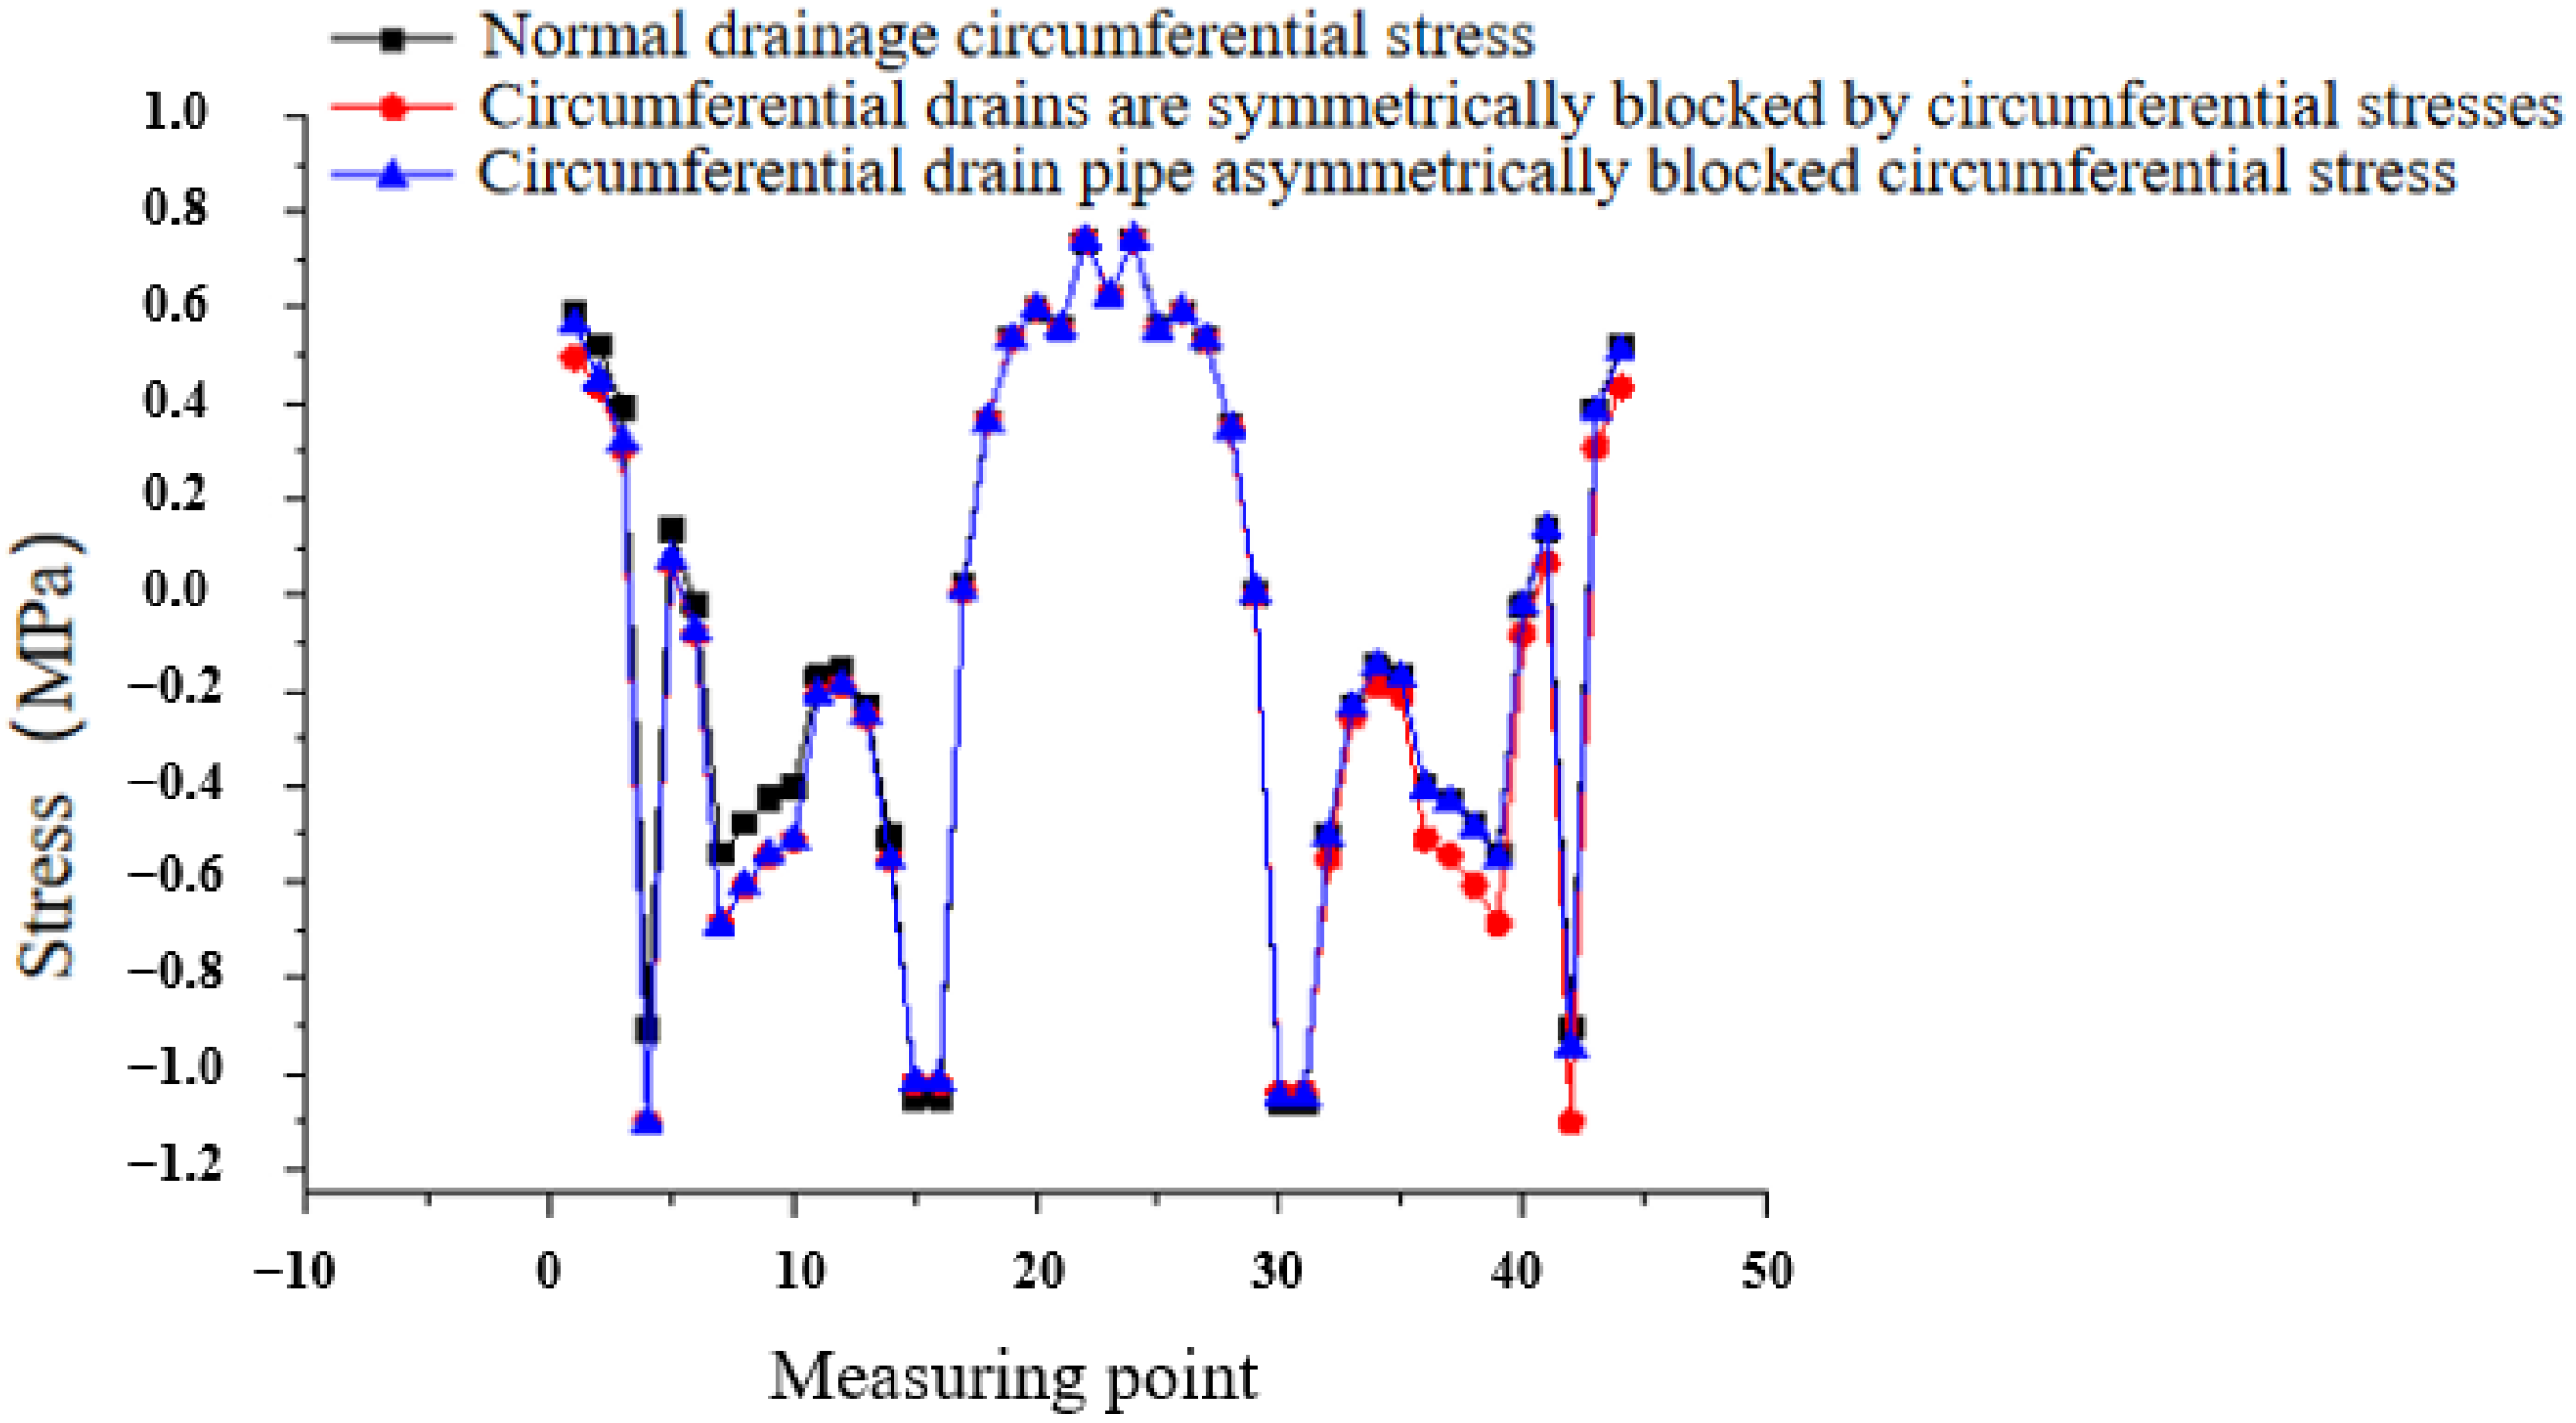
From
Figure 12, it can be seen that the load on the tunnel’s crown and sidewall lining increased if the circular drainpipes on both sides of a drainage section were simultaneously blocked. The maximum increase in lining stress is 0.2 MPa, which is a 22% increase and occurs on the sidewall lining. When a circular drainpipe on one side of the same drainage section is blocked, the stress on the lining of the blocked sidewall increases. At the crown of the tunnel, the maximum increase in lining stress is 0.025 MPa, a 5% increase compared to the normal drainage. The maximum increase in lining stress on the blocked sidewall is 0.1 MPa, a 17% increase.
4.2.3. Displacement Analysis
According to
Figure 13, simultaneous blockage of the circular drainpipes on both sides of the same drainage section will increase the displacement of the tunnel crown and sidewall lining in this section. The maximum displacement at the lining of the vault increases by 3.5 mm, with an increase of 41%. The displacement of the lining on one side of the tunnel section rises when a single circular drainpipe in the same drainage section becomes obstructed. The displacement at the vault location rises by 1 mm, with an increase of 12% compared to normal drainage conditions, and the maximum displacement of the sidewall lining increases by 3.5 mm, with an increase of 41%.
4.3. Analysis of Transverse Drainpipe Blockage
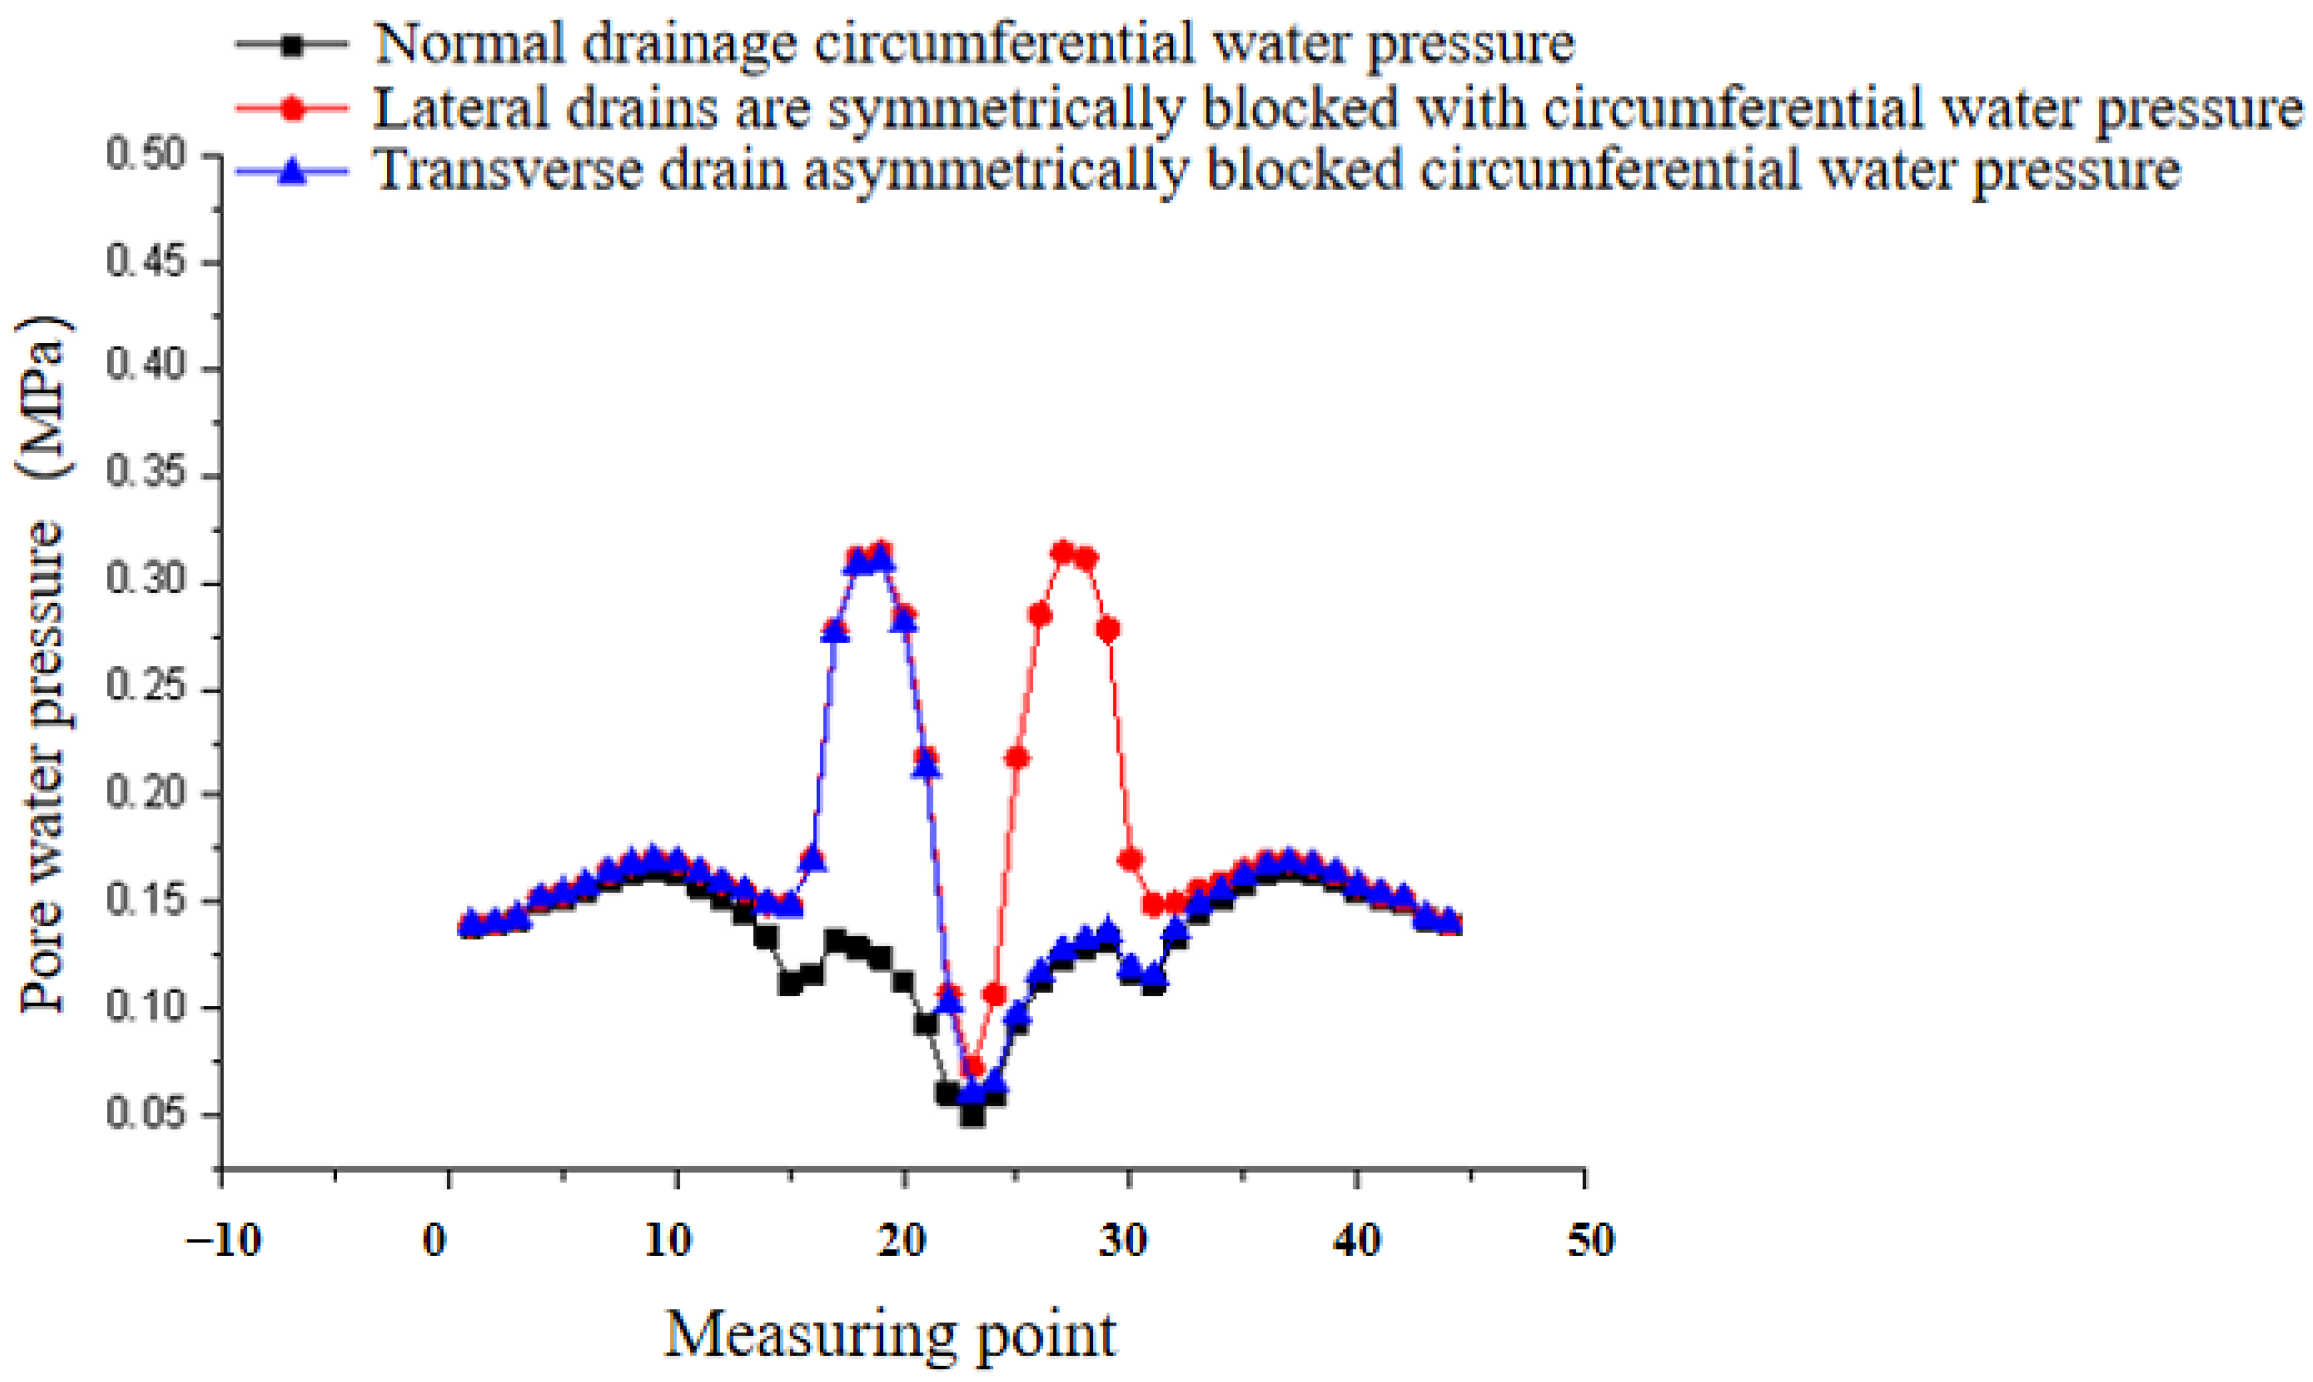
4.3.1. Pore Pressure Analysis
The pore water pressure on the rear side of the arch lining of this drainage section increases if the transverse drainpipes on both sides of the same drainage section are simultaneously blocked, as shown in
Figure 14. The maximum increase in pore water pressure on the back side of the lining is 0.19 MPa, with an increase of 146%, and this phenomenon occurs on both sides of the arch; when a transverse drainpipe on one side of the same drainage section is blocked, the pore water pressure on the back side of the arch lining of the unblocked side increases.
Figure 15 is a nephogram of pore water pressure at the back of the horizontal drainage pipe lining under different blocking conditions.
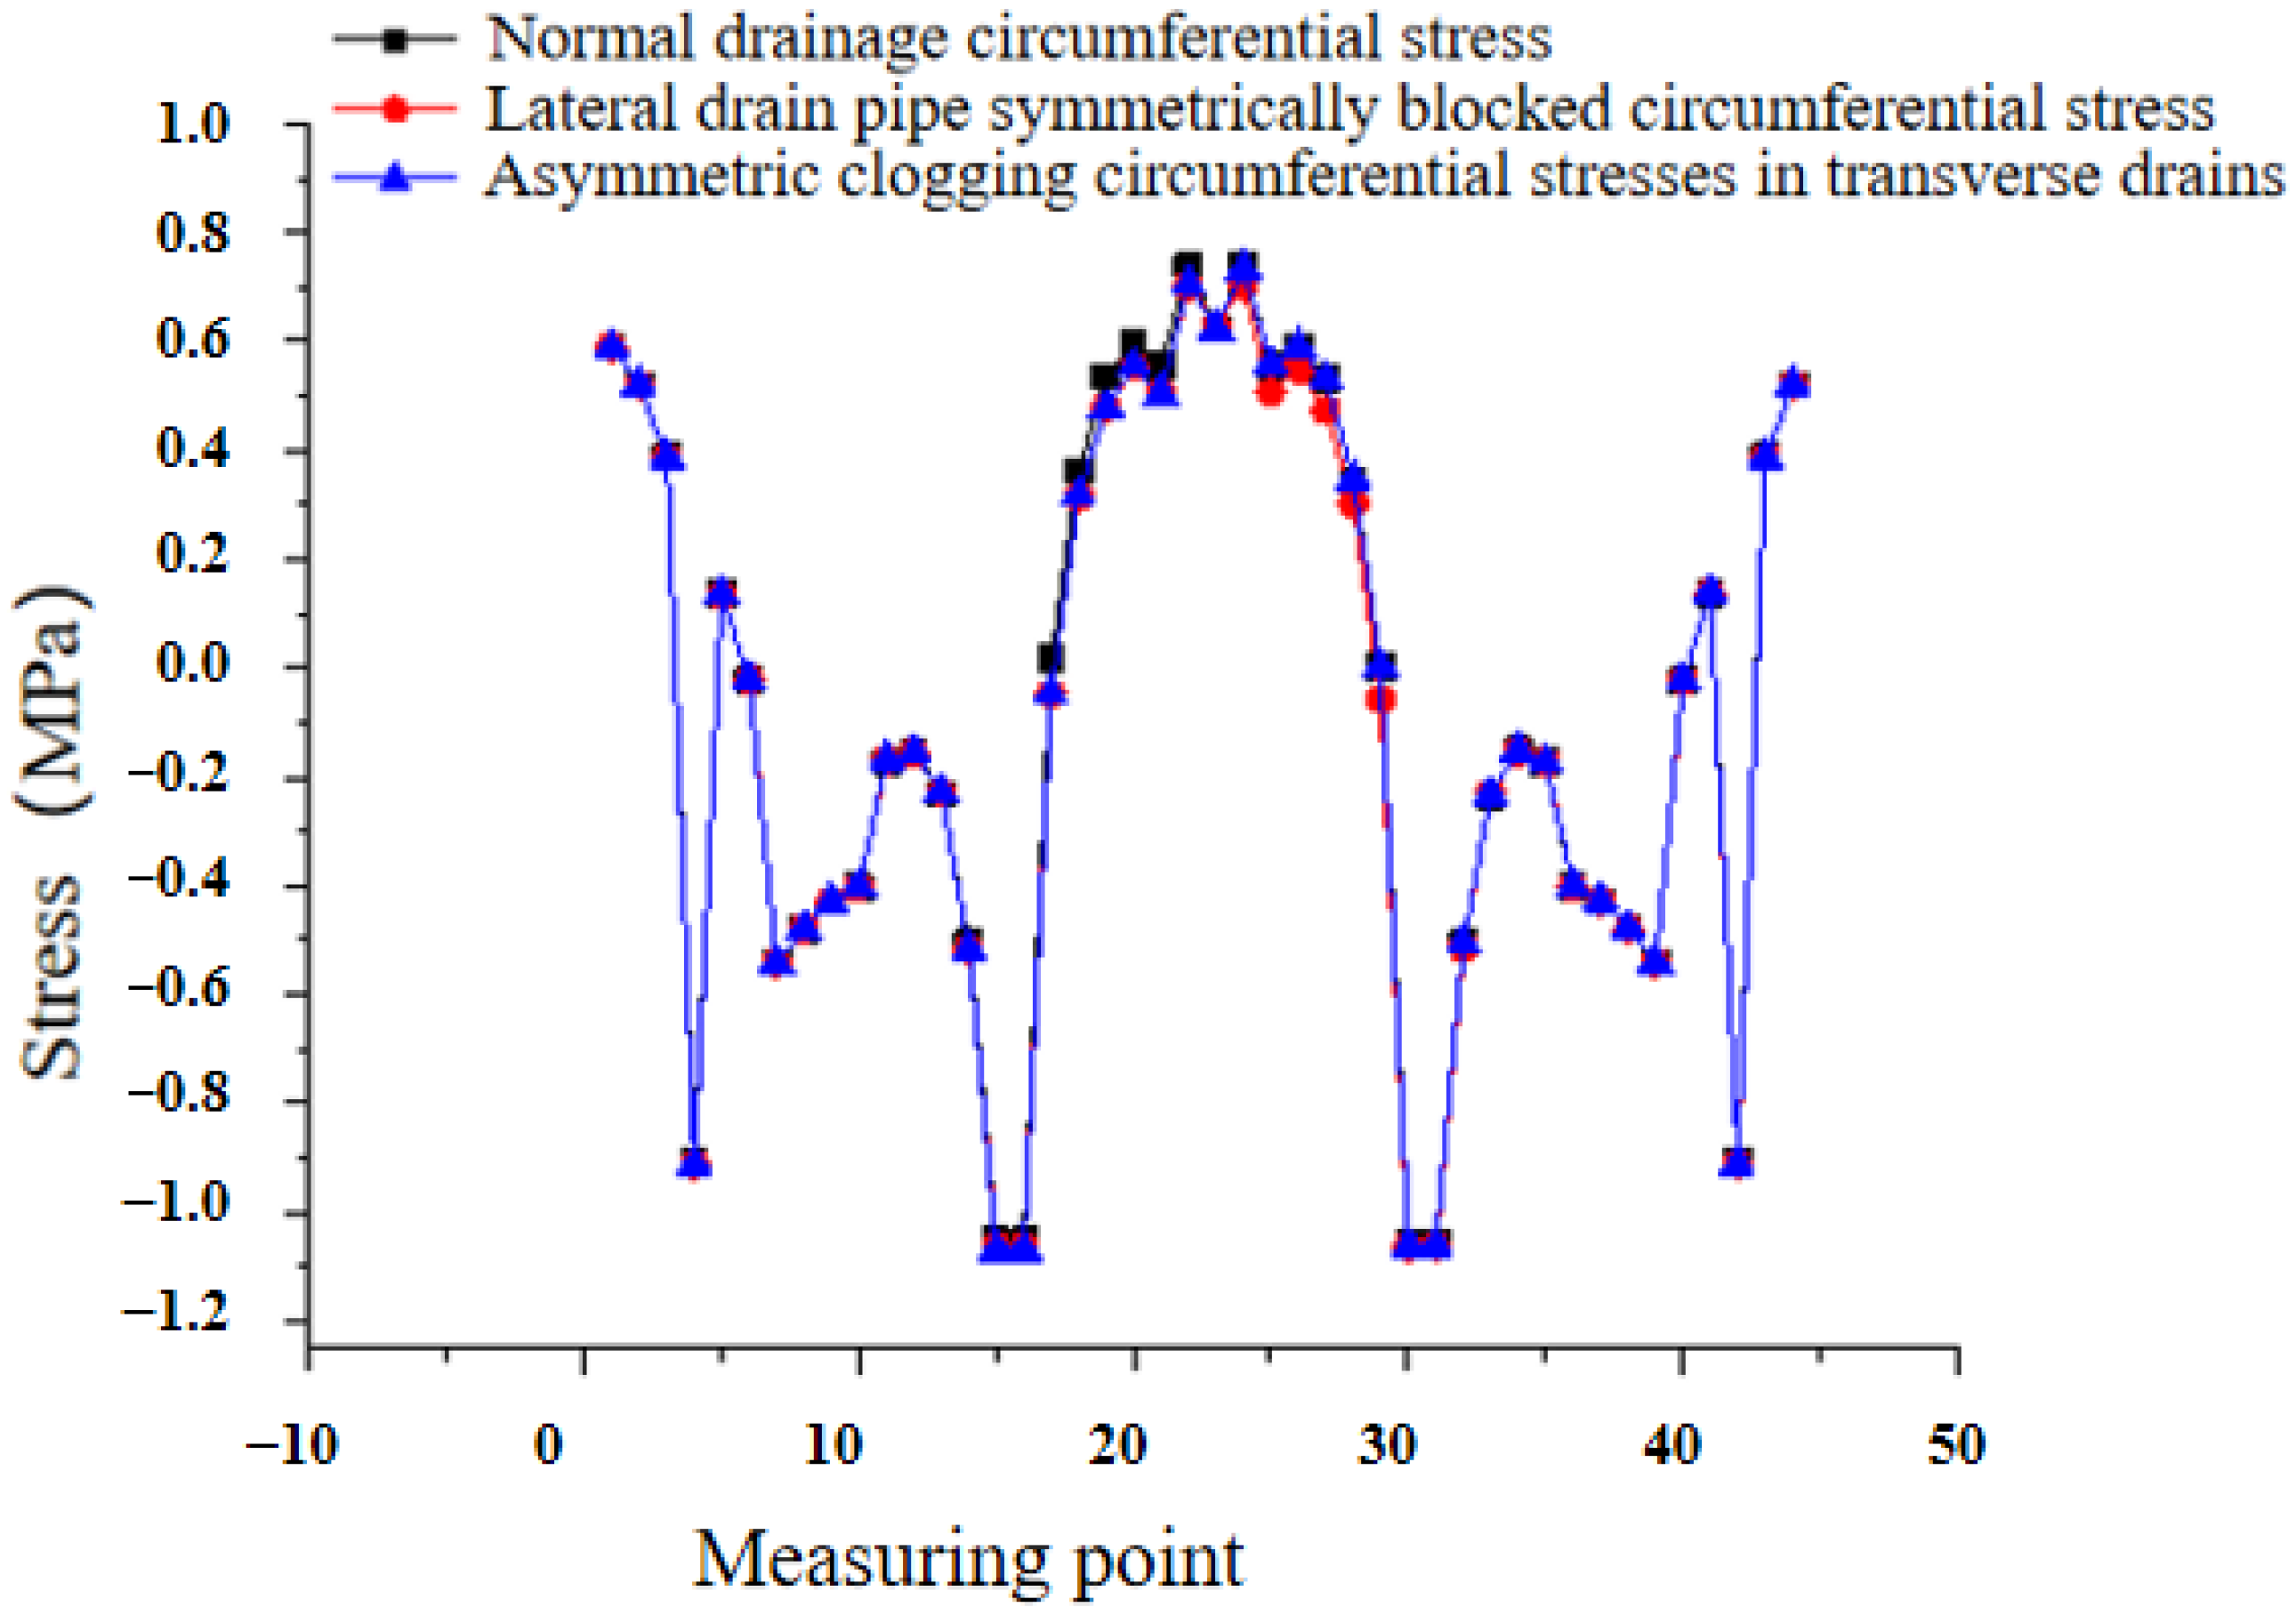
4.3.2. Stress Analysis
As it is shown in
Figure 16, simultaneous blockage of the transverse drainpipes on both sides of the same drainage section increases the stress on the arched lining of the tunnel. On both sides of the arch, the lining stress increases to a maximum of 0.02 MPa, or 4% more. The tension on the arched lining of the blocked side of the tunnel rises if the transverse drainpipe on that side of the drainage section is blocked. The maximum increase in lining stress is 0.02 MPa, a 4% increase.
4.3.3. Displacement Analysis
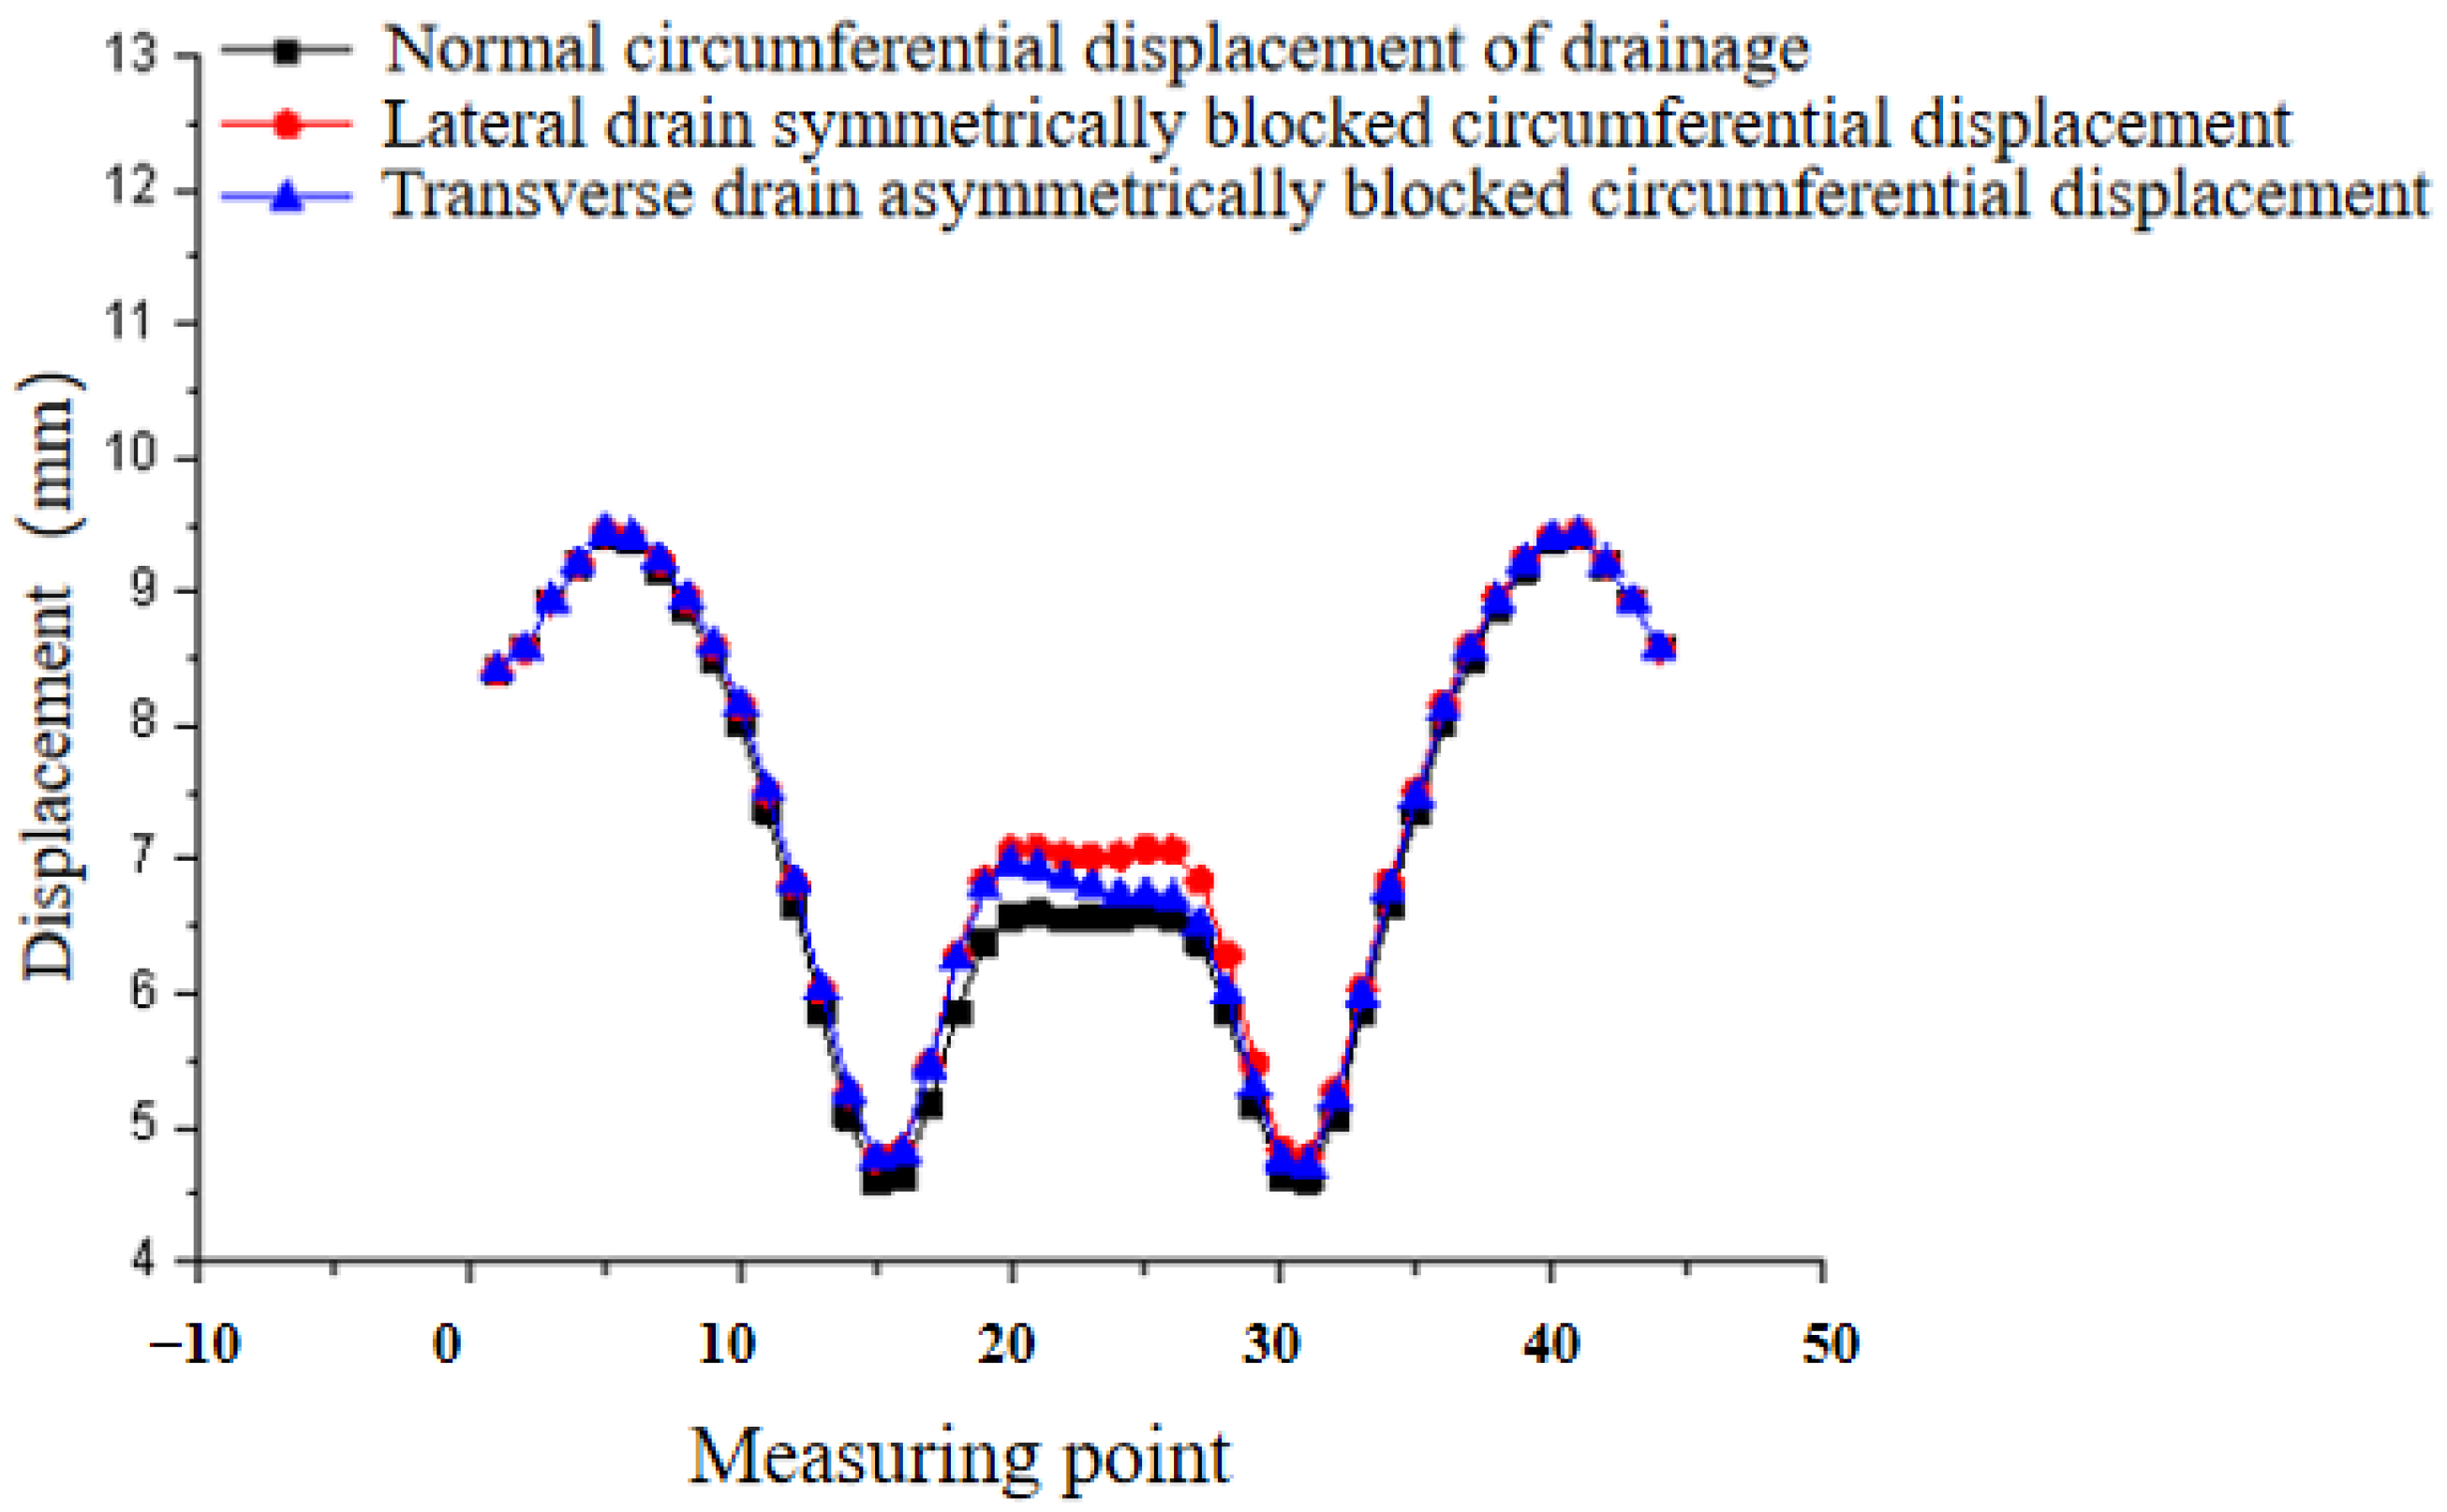
Simultaneous blockage of the transverse drainpipes of the same drainage section on both sides results in more displacement of the tunnel arch invert lining of that section. The arch experiences the largest rise in lining displacement, which is 0.5 mm and represents an 8% increase. The displacement of the arched lining on the blocked side of the tunnel will rise if the transverse drainpipe on one side of the same drainage section is blocked.
Figure 17 illustrates the maximum increase in liner displacement, an increase of 0.5 mm, or 8%.
4.4. Joint Blockage Analysis
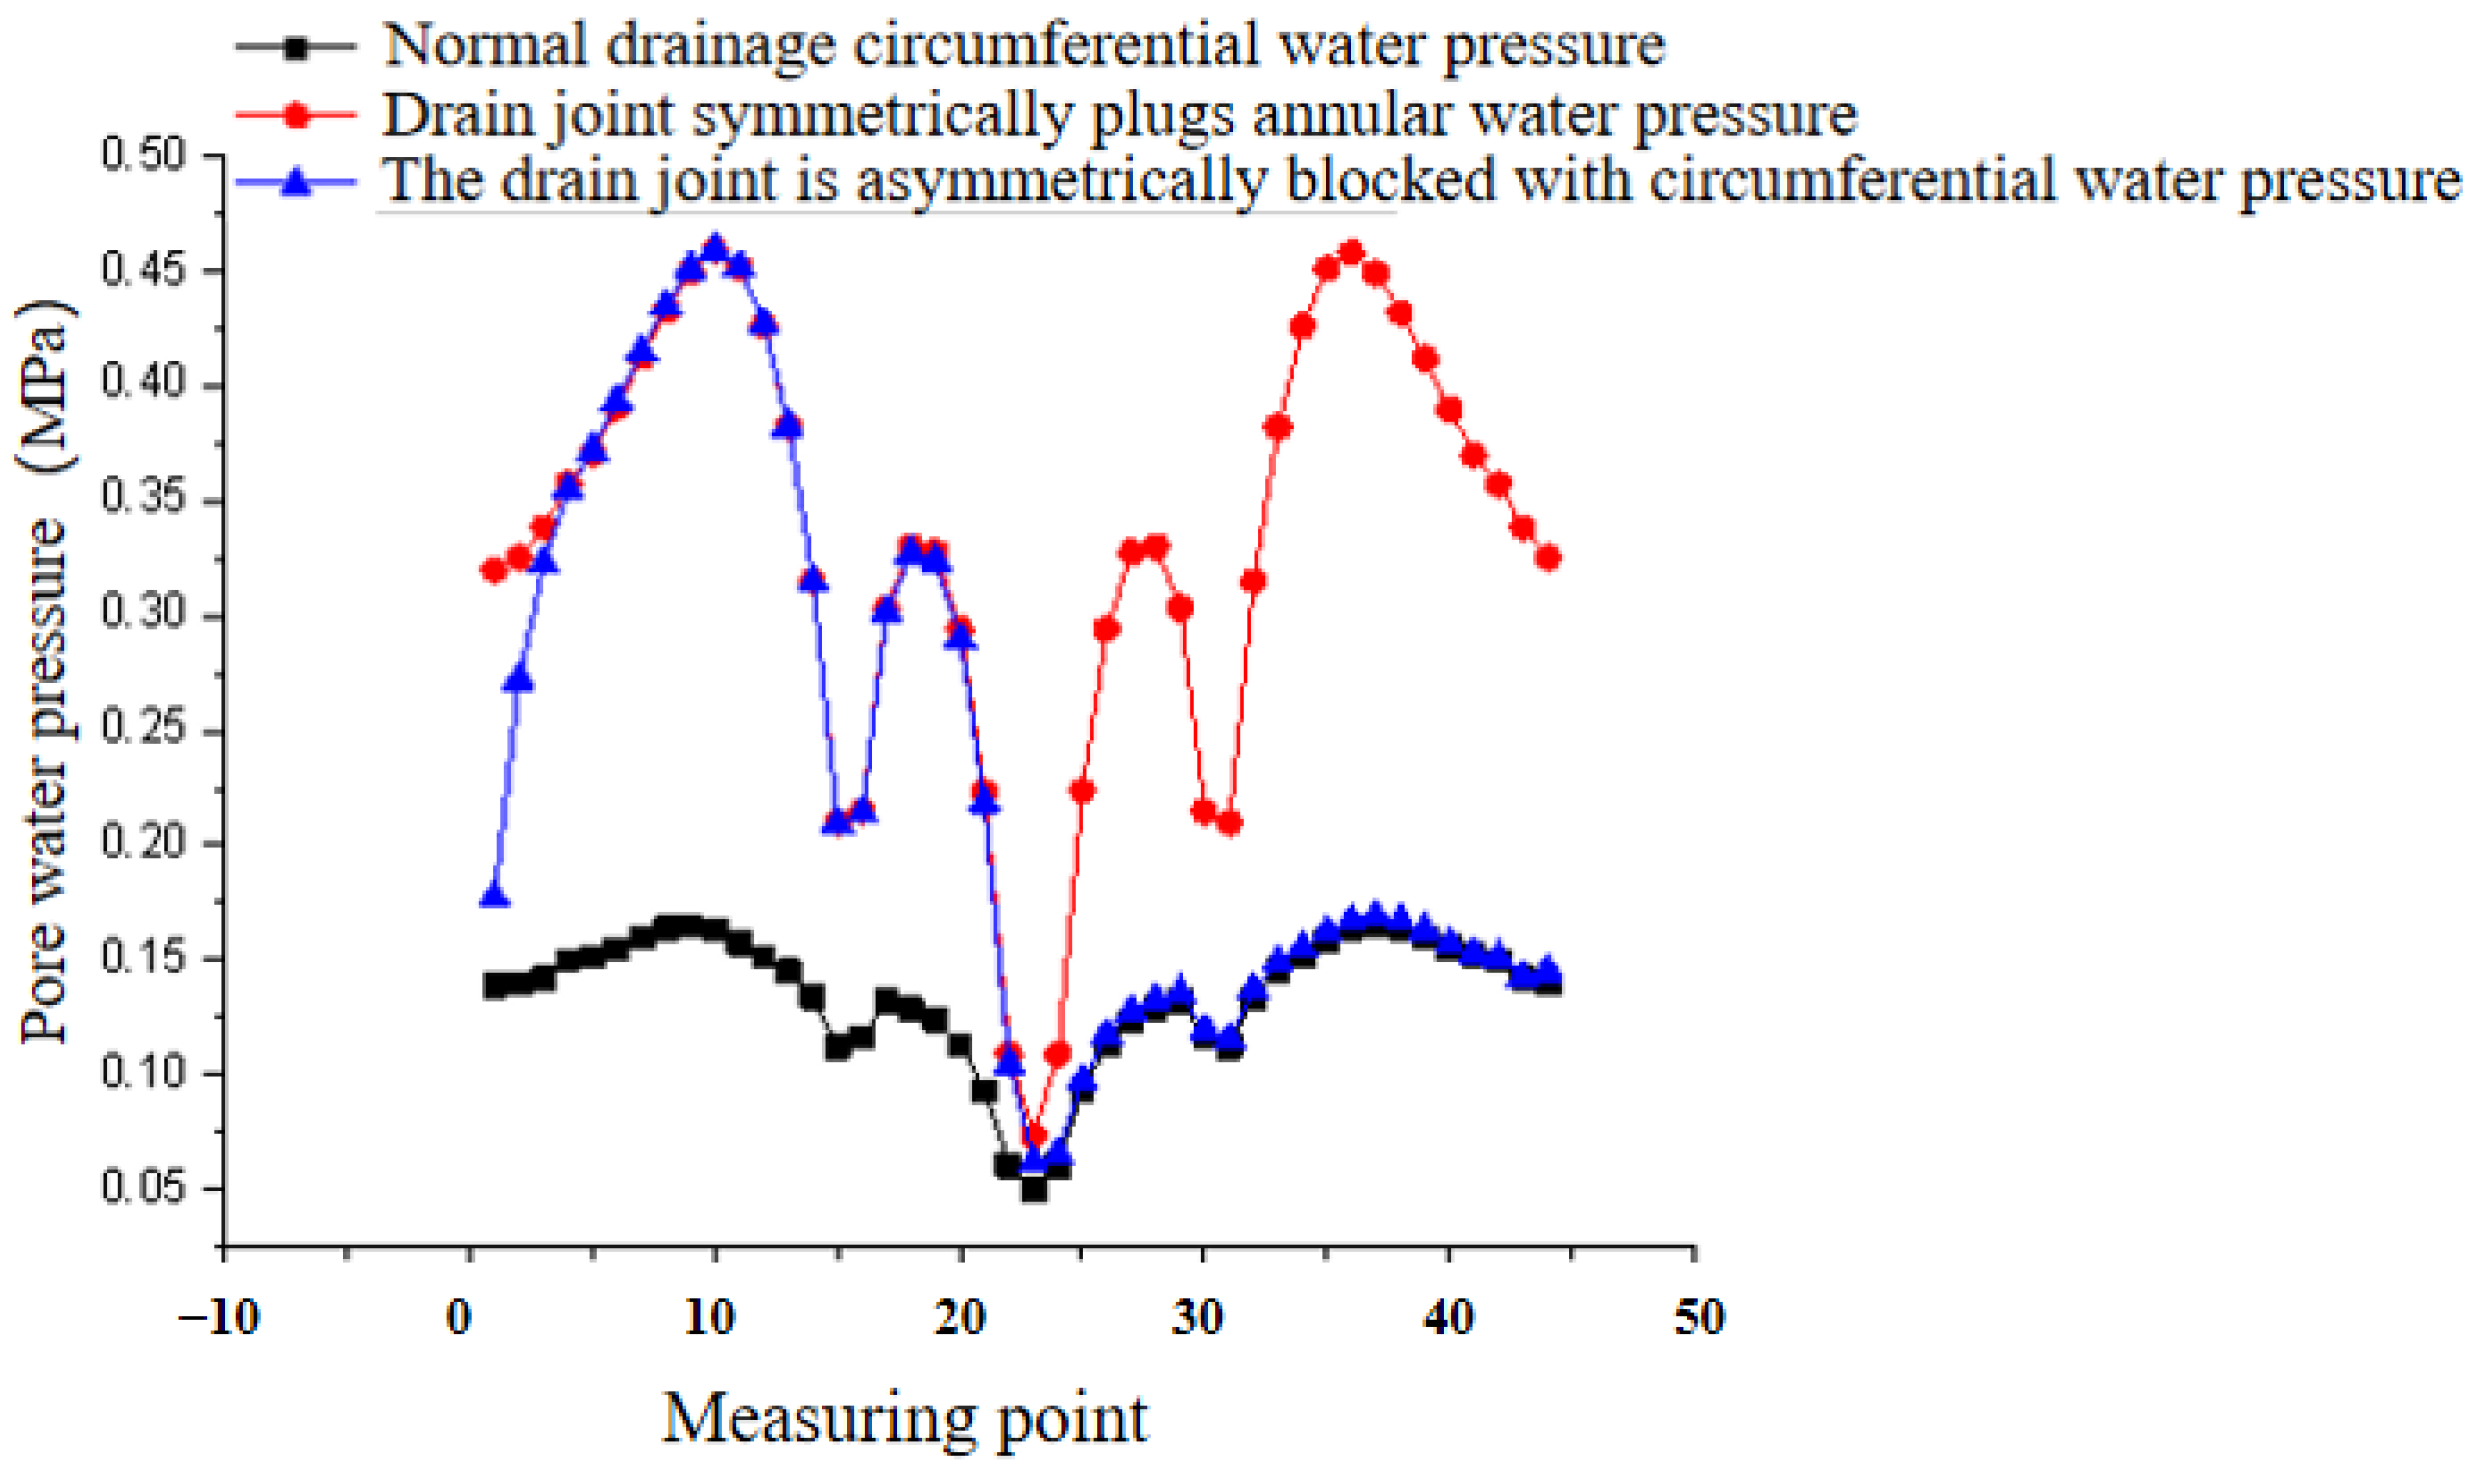
4.4.1. Pore Water Pressure Analysis
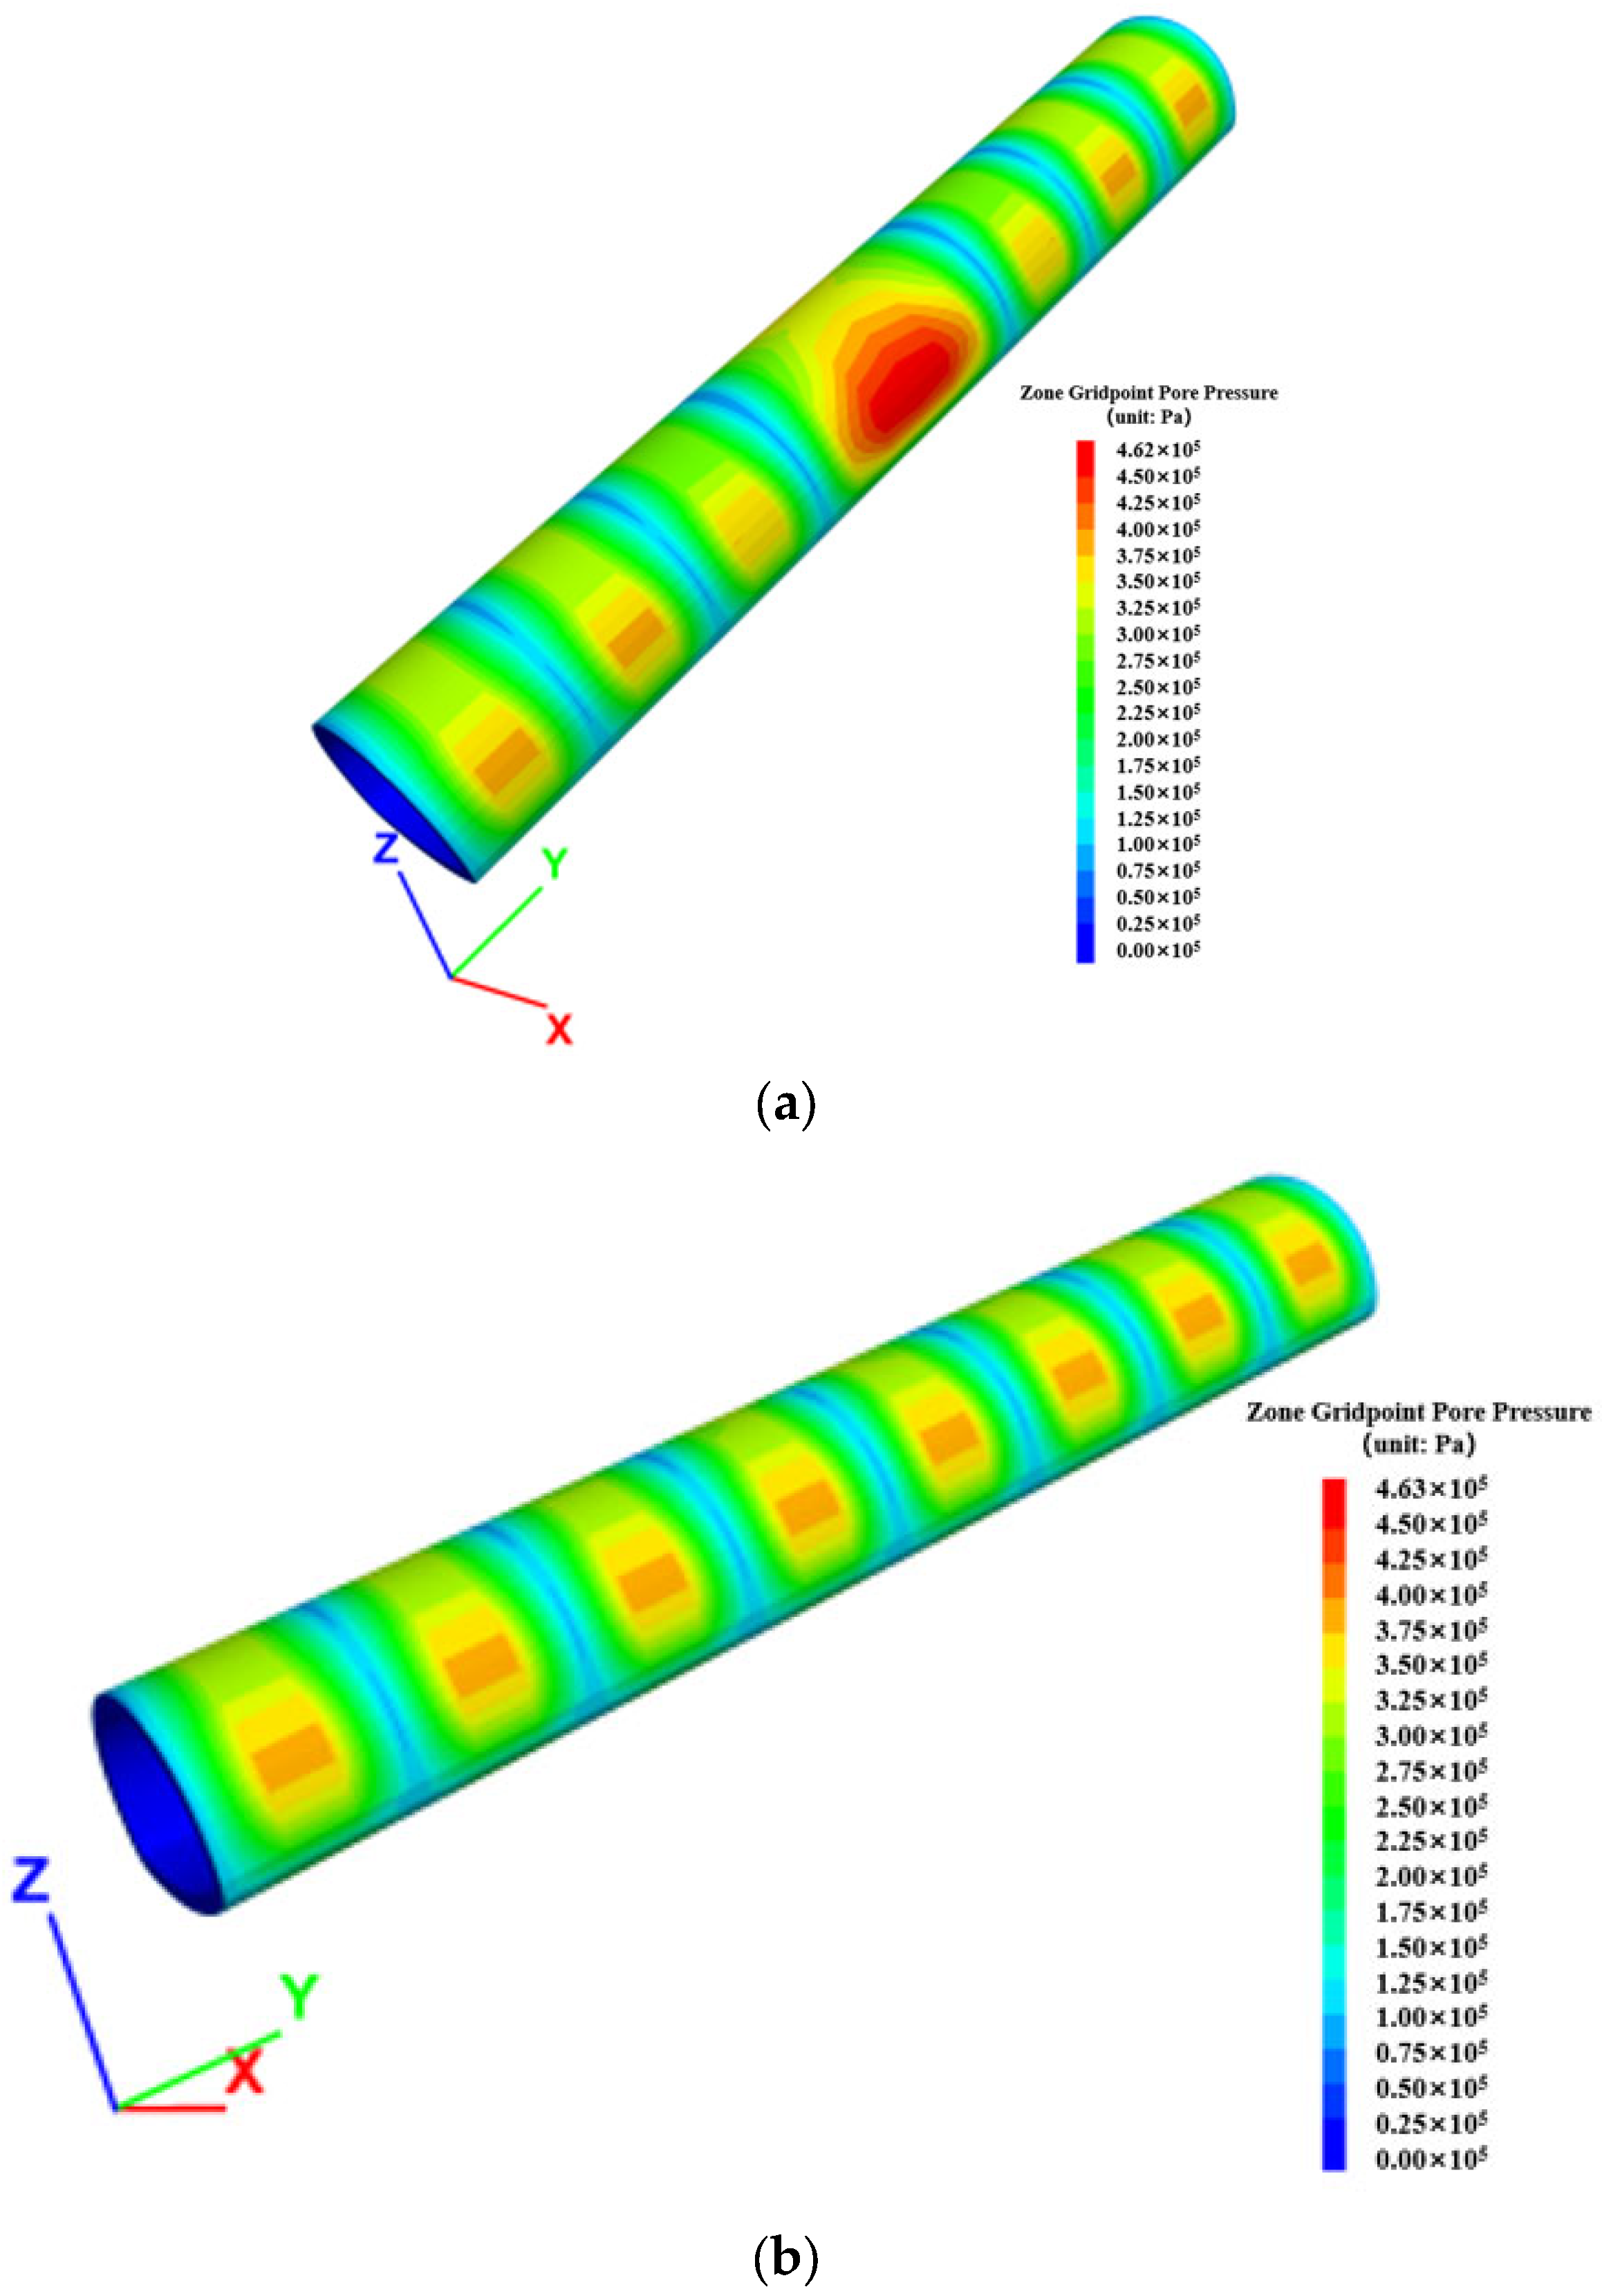
The drainage system of the tunnel section will fail completely if both sides of a drainage section are simultaneously blocked. As a result, the pore water pressure on the back side of the tunnel section’s lining will rise. The maximum increase in pore water pressure on the back of the lining reaches 0.3 MPa, with an increase of 200%, and it occurs on the side wall lining, and the pore water pressure in the surrounding rock near the entire tunnel also increases. The symmetrical blockage of the tunnel drainpipe interface causes the overall increase in pore water pressure on the back side of the lining of the tunnel section, which indicates that the failure of the blockage of the tunnel drainpipe joint affects the failure of the entire drainage system. When a single-side joint drainpipe in the same drainage section is blocked, it will cause the pore water pressure on the back side of the entire side lining of the blocked section of the tunnel to increase. The side wall lining experiences the largest rise in pore water pressure on the back side of the lining, which is an increase of 0.3 MPa and 200%, as illustrated in
Figure 18.
Figure 19 is a nephogram of pore water pressure at the back of the lining under different blocking conditions at the tunnel drainage pipe joint.
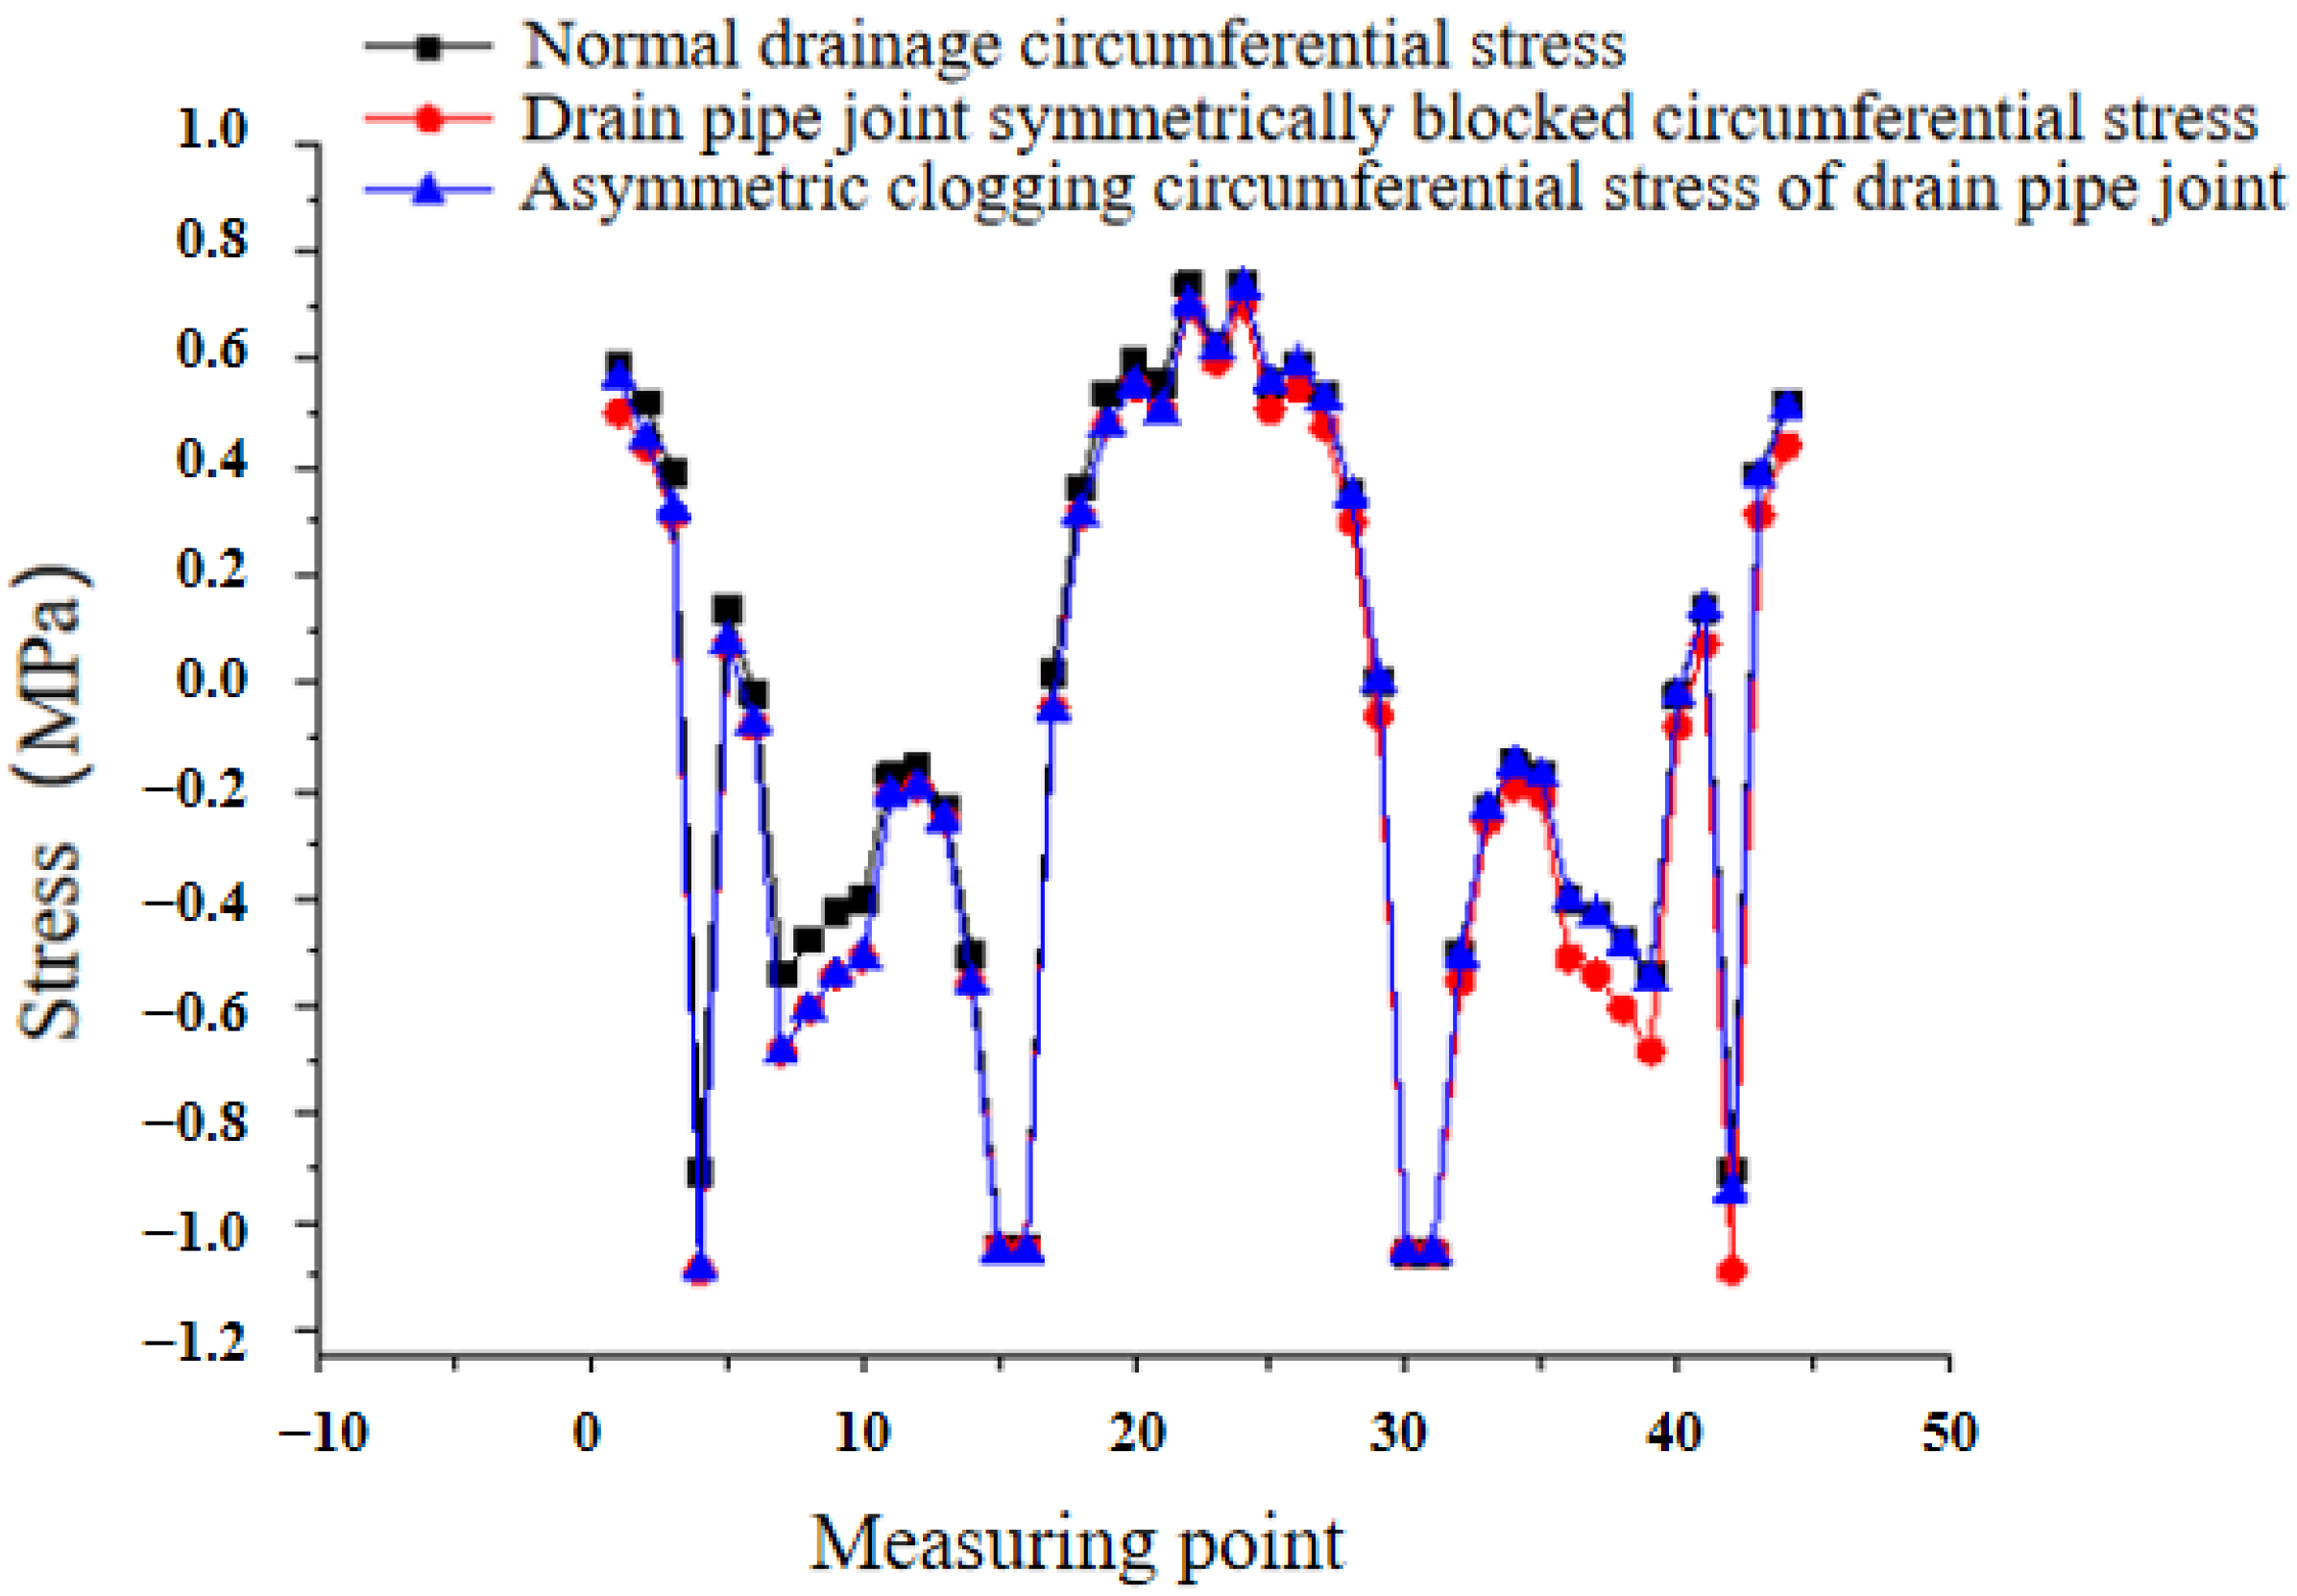
4.4.2. Stress Analysis
As shown in
Figure 20, simultaneous blockage at the joint of the same drainage section on both sides will cause the drainage system of this section of tunnel to fail completely and lead to an increase in lining stress. The side wall lining experiences the largest increase in lining stress, which is an increase of 0.2 MPa or 22%. At the same time, the stress in the surrounding rock near the entire tunnel also increases. The overall rise in lining stress in this section is due to the symmetric blockage of the tunnel drain joint, which suggests that the failure of the blockage of the tunnel drain joint influences the failure of the complete drainage system. When the drain joint on one side of the same drainage section is blocked, the stress on the entire lining on the blocked side of the tunnel will increase, and the maximum increase in lining stress is 0.2 MPa, which is a 22% increase, and it only occurs on the side wall lining. At the same time, the stress in the surrounding rock near the blockage location also increases. The stress distribution of the entire lining on the non-blocked side appears to function well because the stress distribution throughout the entire lining is consistent with that under normal drainage.
4.4.3. Displacement Analysis
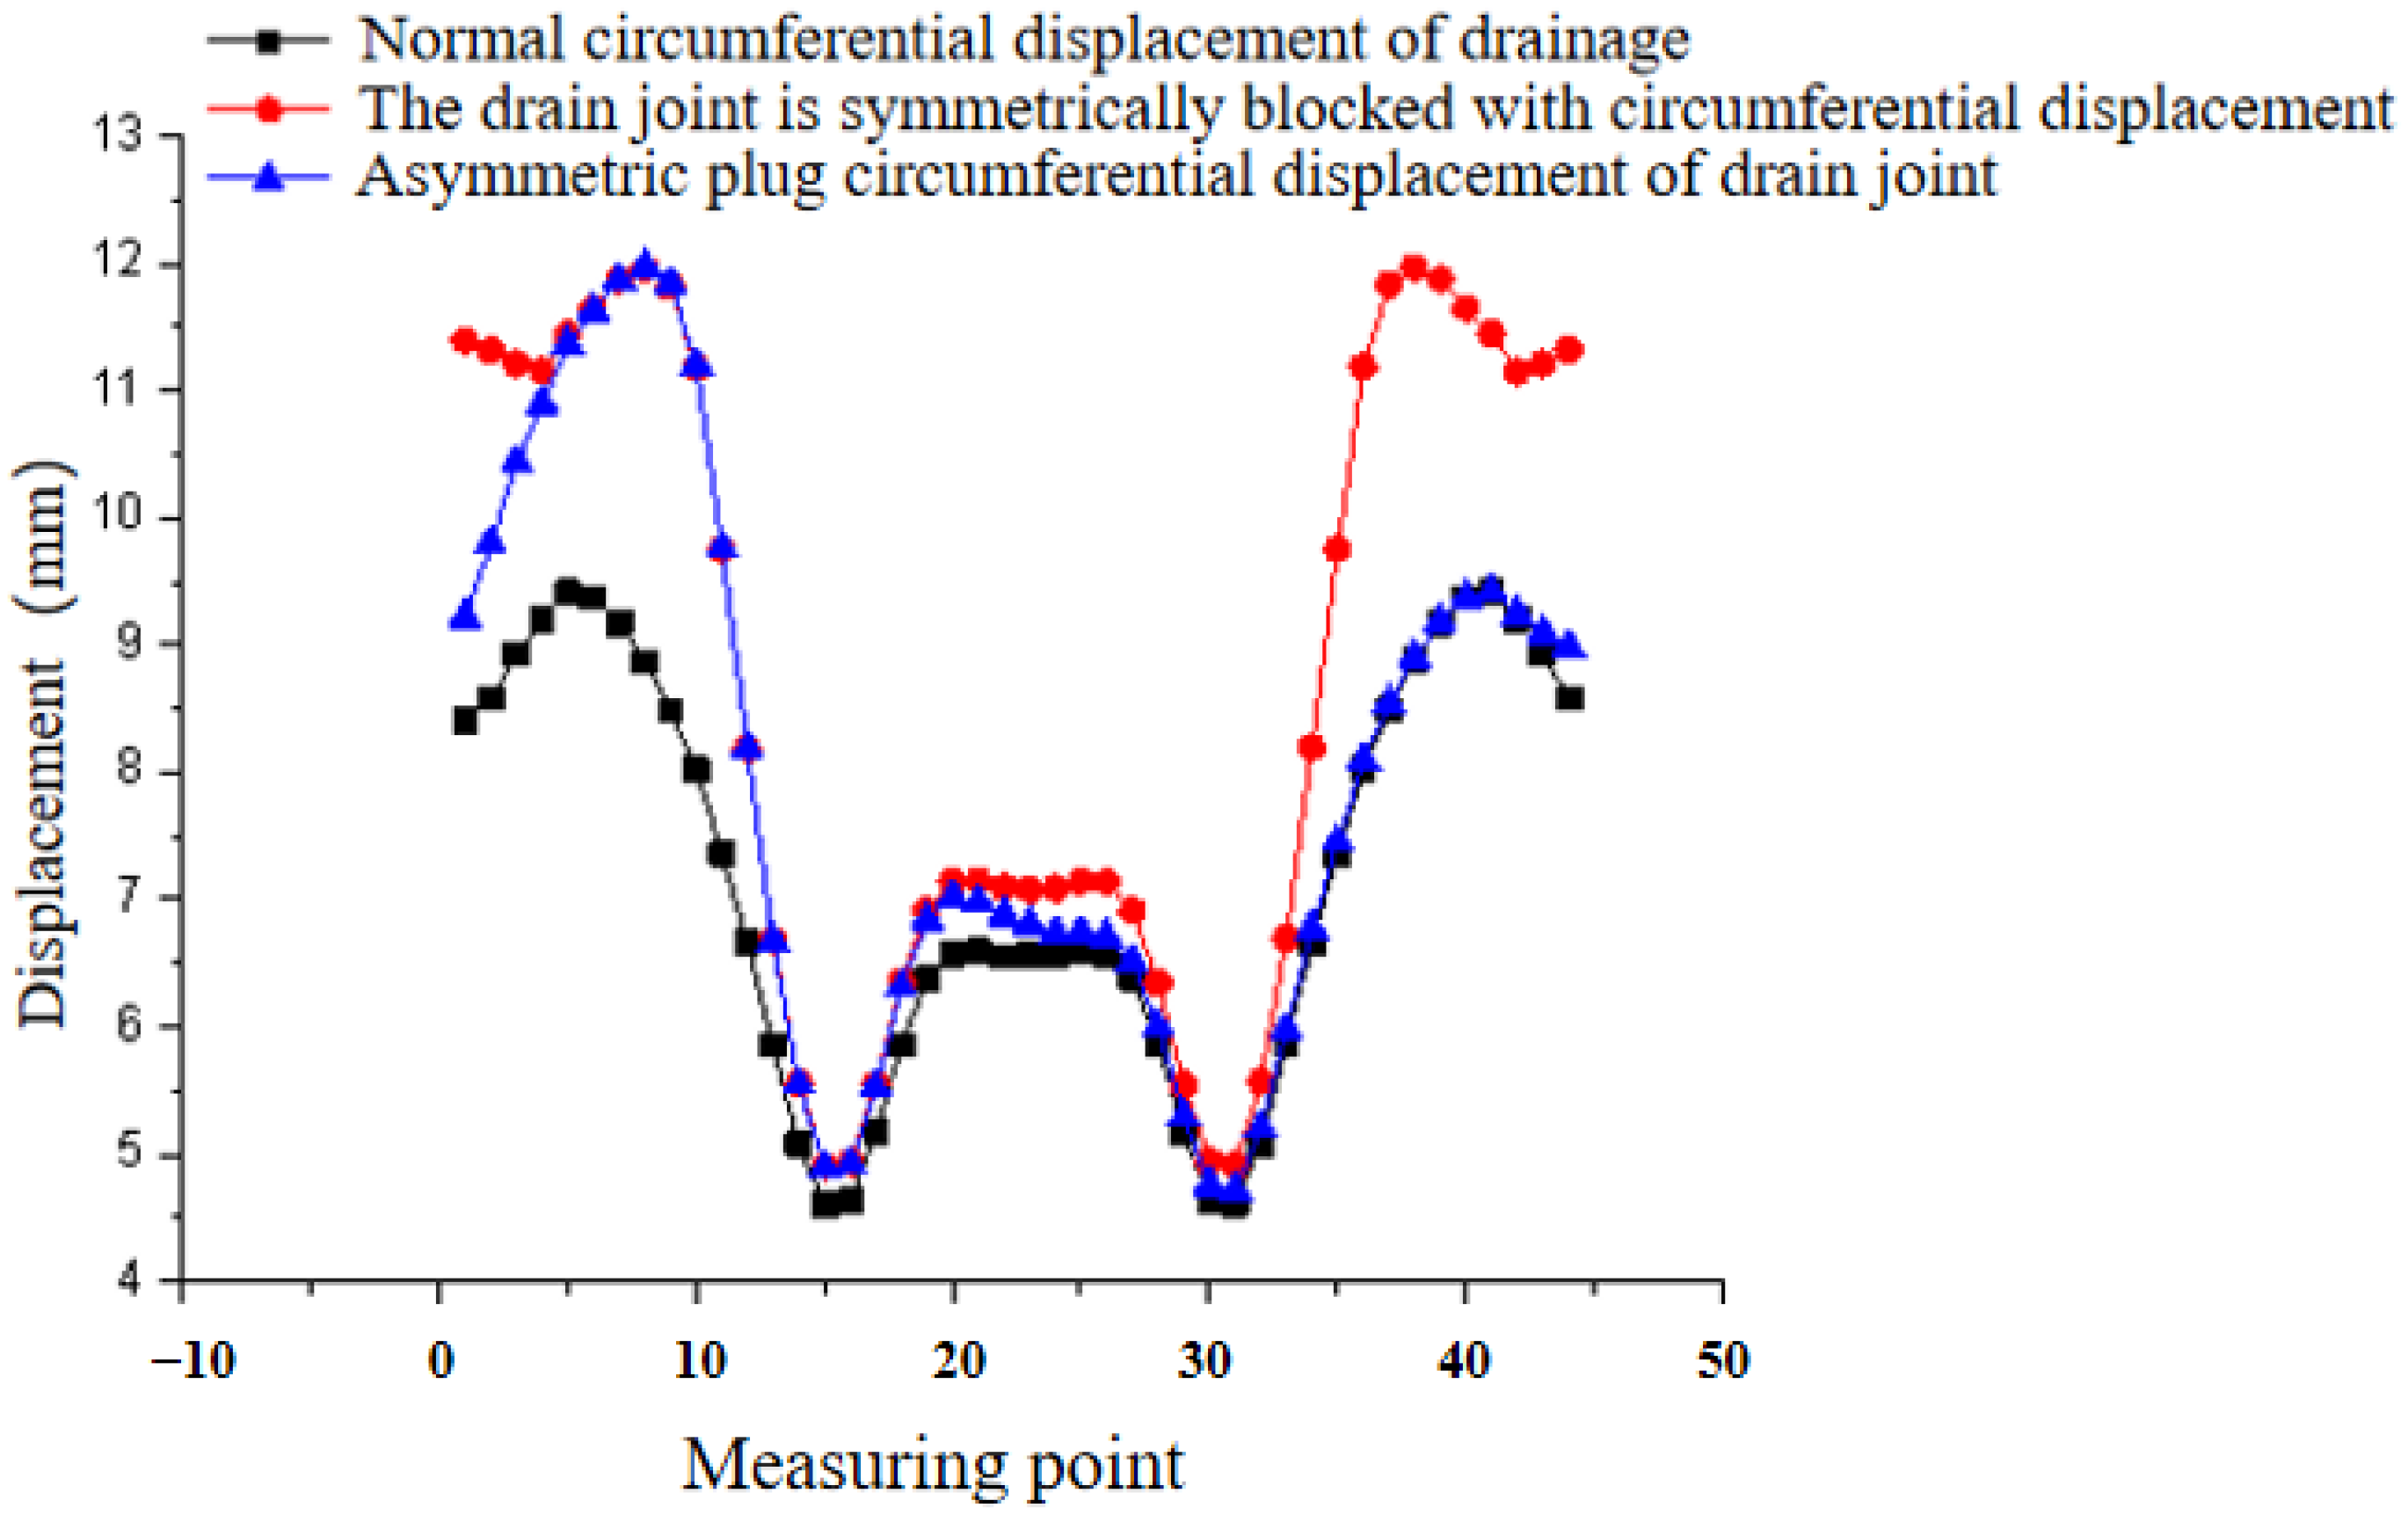
As shown in
Figure 21, simultaneous blockage at the joint of the same drainage section increases the displacement of the lining. The crown lining experiences the largest rise in lining displacement, an increase of 3.5 mm or 41%, and the displacement of the surrounding rock close to the entire tunnel also increases. The overall rise in lining displacement in this segment is caused by the symmetric blockage of the tunnel drain joint, indicating that the drainage system as a whole is affected by the blockage failure of the tunnel drain joint. The displacement of the lining of the blocked side of the tunnel grows when a single-side joint drain blockage occurs in the same drainage segment. As demonstrated in
Figure 21, the crown lining experiences a 41% or 3.5 mm increase in maximal lining displacement.
4.5. Comparative Analysis
Asymmetrical blockage at different positions results in similar changes in pore water pressure, stress and displacement on the blocked side as that of symmetrical blockage. The increase in pore water pressure caused by asymmetrical obstruction is higher in joint and circular drainpipe blockages (200%) compared to transverse drainpipe blockage (146%). The increment in stress is greater in joint blockage (22%) than circular drainpipe blockage (17%) and transverse drainpipe blockage (4%). The increment in displacement is greater in circular drainpipe blockage (41%) and joint blockage (41%) than transverse drainpipe blockage (8%). After symmetrical blockage, changes in pore water pressure, tension and displacement are identical to those on the blocked side following asymmetrical obstruction. Normal drainage under unblocked conditions results in increases in pore water pressure, stress and displacement that are consistent with symmetrical blockage. The increments in pore water pressure, stress and displacement under normal drainage on the unblocked side are consistent with those under symmetrical blockage.
The space between adjacent drainpipes is more affected by the blockage of the circular drainpipe, transverse drainpipe and junction than other sites. Blockages in circular and transverse drainpipes only result in more space in some places, whereas joint blockages result in overall increases in pore water pressure, stress and displacement. Thus, compared to blockages in circular and transverse drainpipes, the effect of joint blockage on tunnel stability is larger.
The setting of the drainage system is conducive to the timely drainage of underground water behind the tunnel lining. However, due to the blockage of the drainage system, the groundwater cannot be discharged in time or cannot be discharged at all, so the groundwater pressure behind the lining increases. Most of the linings of mountain tunnels in China are not water-resistant linings, so lining cracks occur easily under the action of groundwater pressure, further causing water leakage and other problems. The research results in this paper are of great significance for guiding the optimal design, operation and maintenance of drainage systems.
5. Conclusions and Discussion
In this paper, a numerical model was established to analyze seven working conditions, including normal drainage and three tunnel drainage system blockage positions under symmetrical and asymmetrical blockage conditions. The main conclusions are as follows:
- (1)
The blocked portion of the circular drainpipe is the only part of the drainpipe that is impacted by the blockage, whether it is symmetrical or asymmetrical. It causes an increase in the pore water pressure at the back side of the tunnel crown and side wall lining between two adjacent circular drainpipes, by 200% at maximum, and in the stress on the tunnel crown and side wall lining, at maximum by 22%. The lining displacement of the tunnel arch and sidewall increases by 41%. It also impacts the surrounding rock’s displacement, stress and pore water pressure changes at the same time, but its influence is very limited.
- (2)
The influence of the obstruction, whether symmetrical or asymmetrical, is restricted to the blocked transverse drainpipes, which will increase the pore water pressure at the back side of the vault lining between the two adjacent circular drainpipes by a maximum of 146%, the stress on the vault lining by a maximum of 4%, and the displacement of the vault lining by a maximum of 8%. This will change the pore water pressure, stress and displacement of the surrounding rocks.
- (3)
The blockage at the joint of the drainpipes can have serious consequences despite being a relatively minor part of the tunnel drainage system. The dual failure of the adjacent circular and transverse drainpipes can be caused by both symmetrical and asymmetrical blockages at the joint. This can increase the pore water pressure on the back side of the lining between two drainage sections by up to 200%, the stress, up to a maximum increase of 22%, and the overall displacement, up to a maximum increase of 41%. Moreover, it impacts the surrounding rock’s displacement, stress and changes in pore water pressure. Thus, the blockage of the drainage pipe joint can cause a relatively large impact area.
The blockage of the tunnel drainage system has a significant impact on the pore water pressure, stress and displacement of the tunnel, and the blockage of the joints severely affects the stability of the surrounding rock of the tunnel. This paper mainly studies the response of the tunnel lining and underground amidst seven working conditions. Other factors, such as the length and mode of blockage of the circular drainpipe and transverse drainpipe, have not been explored but need to be studied in the future.


