


A Mechanistic Model on Catalyst Deactivation by Coke Formation in a CSTR Reactor


 , and
, and
Abstract
:1. Introduction
- (i)
- Identifying the reaction steps;
- (ii)
- Assuming plausible mechanisms;
- (iii)
- Deriving the rate expressions.
- (i)
- Develop a mathematical model for hydrocarbon catalytic reaction incorporating catalyst deactivation by coke formation applied on isothermal a continuous stirred-tank reactor (CSTR) in order to capture the effect of the fast deactivation on the dynamic behavior of a CSTR;
- (ii)
- Explore plausible deactivation mechanisms by coke formation;
- (iii)
- Compare rival deactivation mechanisms;
- (iv)
- Carry out parametric study on the reaction system’s tendency to deactivation through coking.
2. Methodology
2.1. Basics of the Kinetics and Reaction Mechanism
2.1.1. Mechanism I: One Surface Species Coking, Irreversible Surface Reaction
2.1.2. Mechanism II: One Surface Species Coking, Reversible Surface Reaction
2.1.3. Mechanism III: Two Surface Species
2.1.4. Mechanism IV: Two Surface Species, Reversible Coking
2.2. CSTR Reactor Model
- The uniformity of the catalyst surface is assumed with intermediate interactions taking place on the catalyst surface and the effects of mass and heat transfer are considered negligible;
- Constant temperature and pressure operational conditions are assumed;
- CSTR is considered to be operating in regime of intrinsic kinetics with reaction mixture assumed to be well agitated.
2.3. Rate Expressions and Material Balance Derivation
2.3.1. Mechanism I
2.3.2. Mechanism II
2.3.3. Mechanism III
2.3.4. Mechanism IV
2.4. Kinetic Parameter Estimation Procedure
2.5. Numerical Method and Initial Conditions
2.6. Sensitivity Analysis
3. Results and Discussion
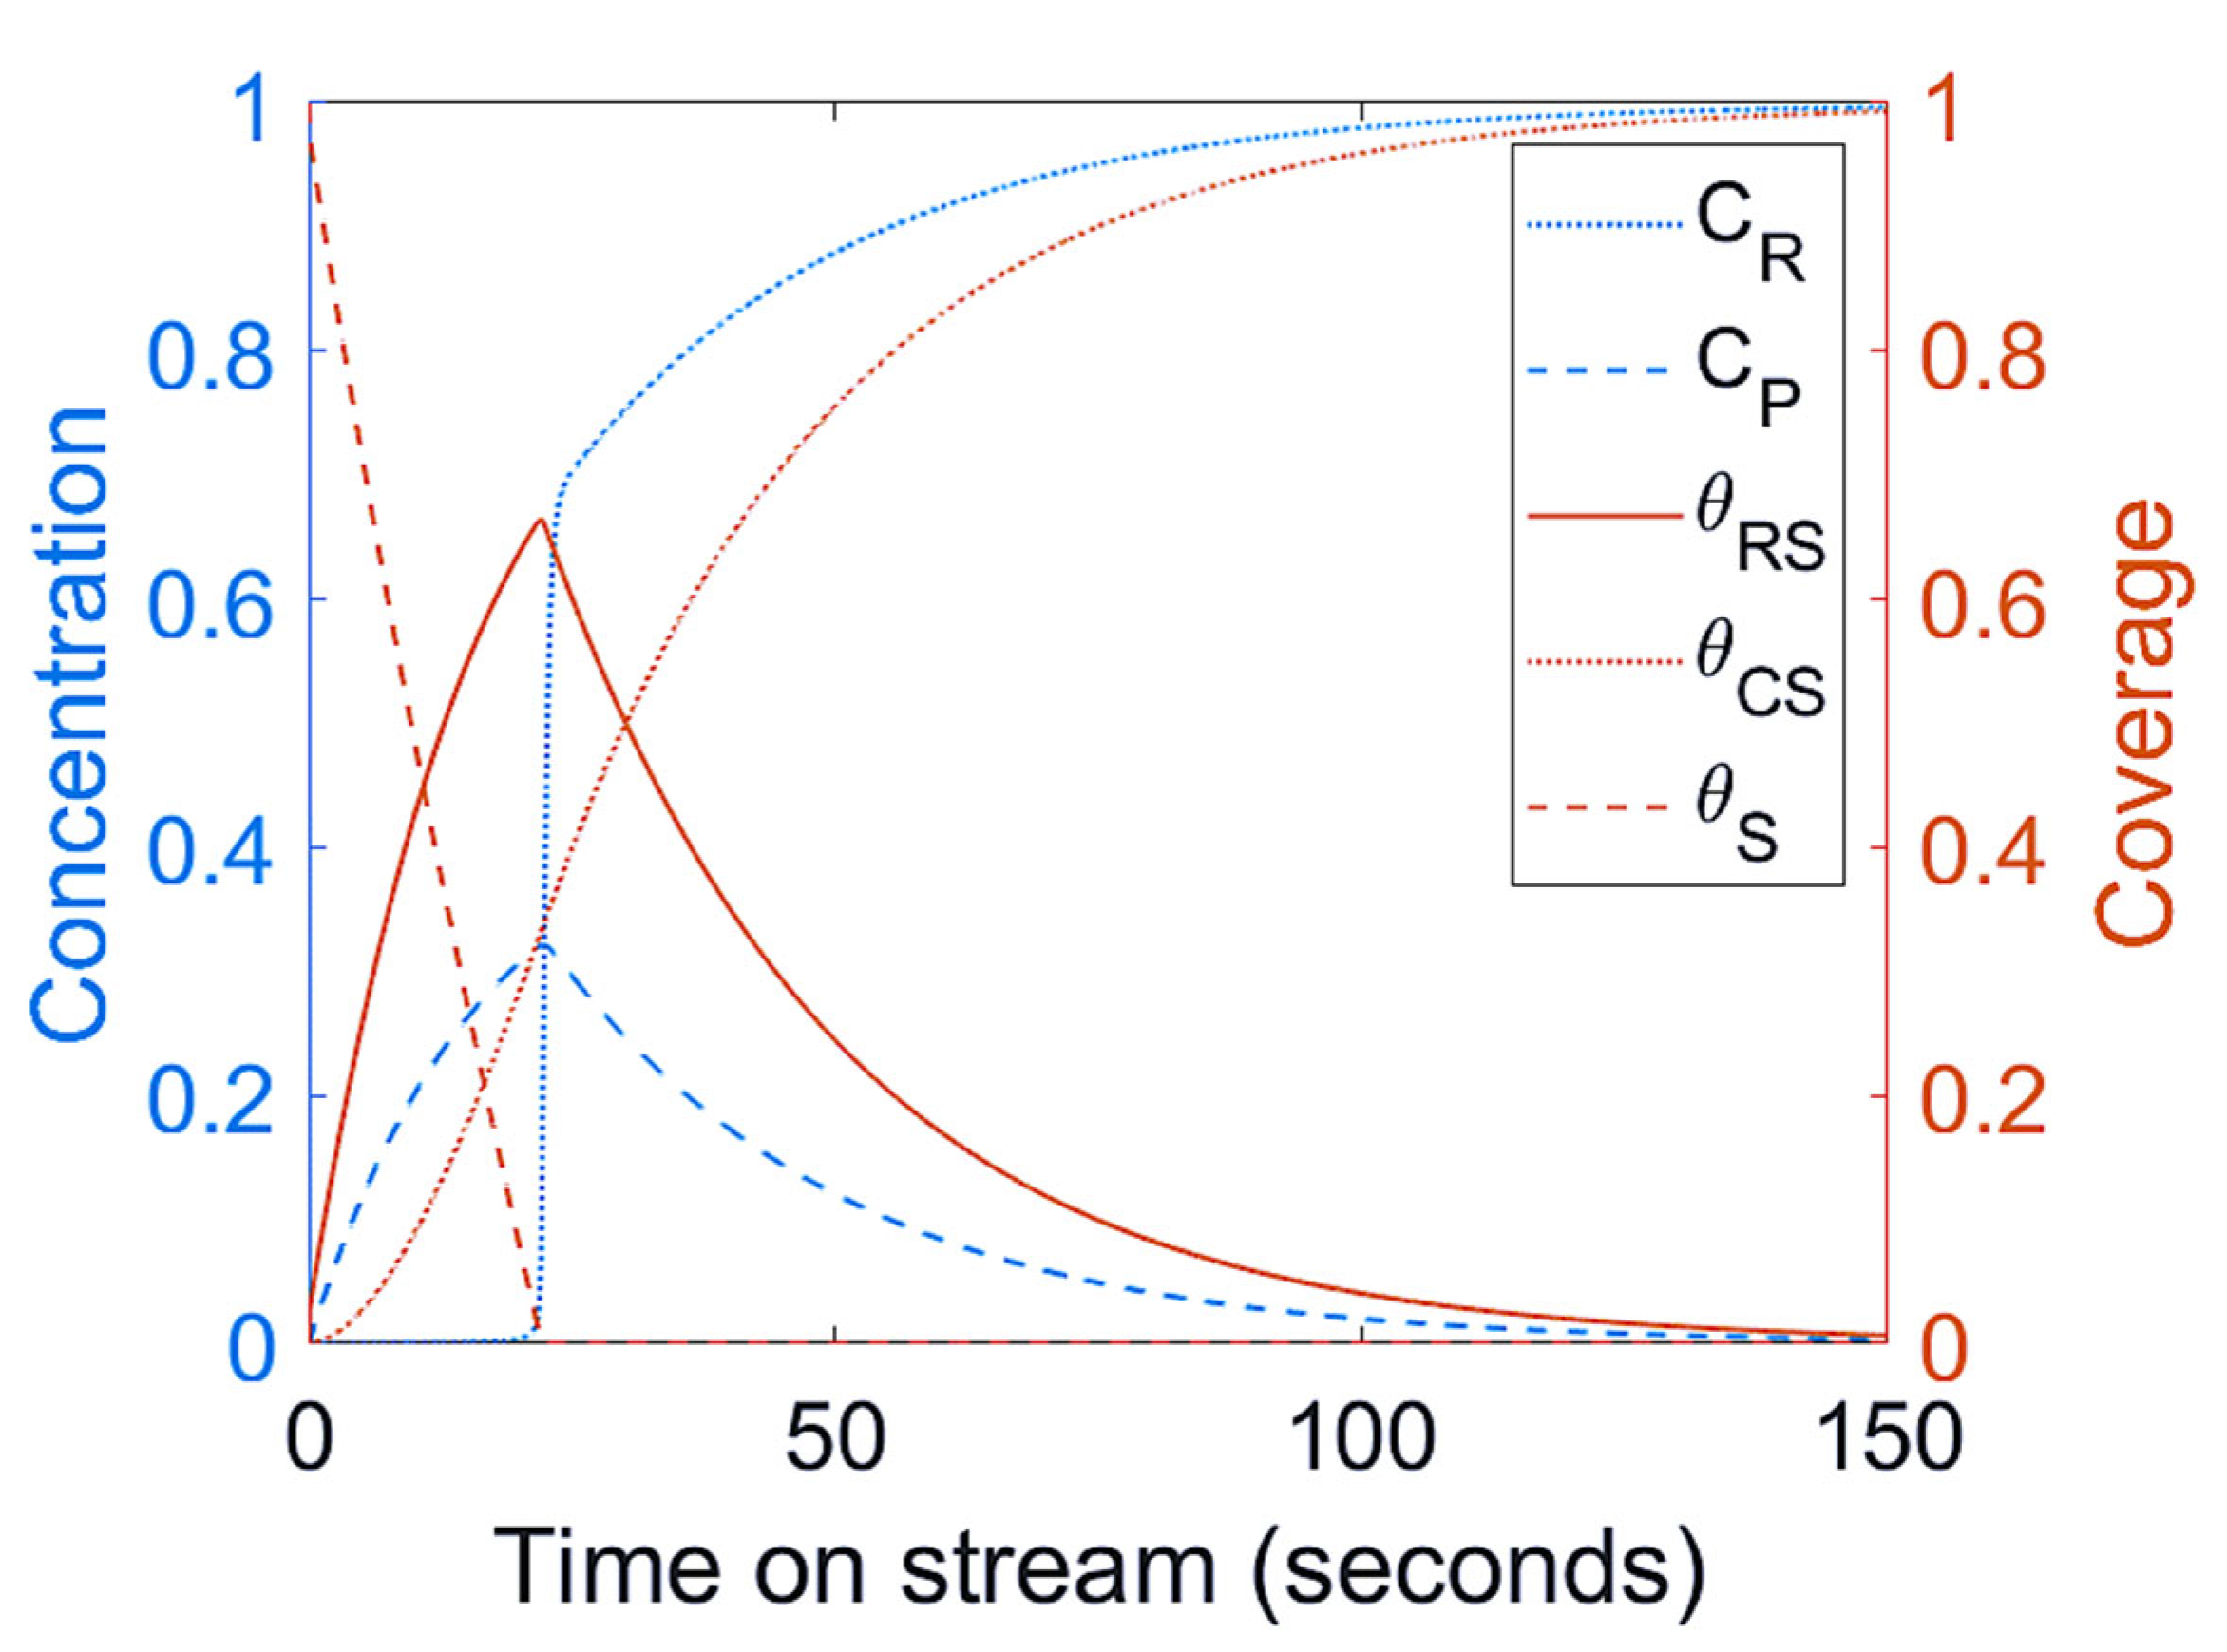
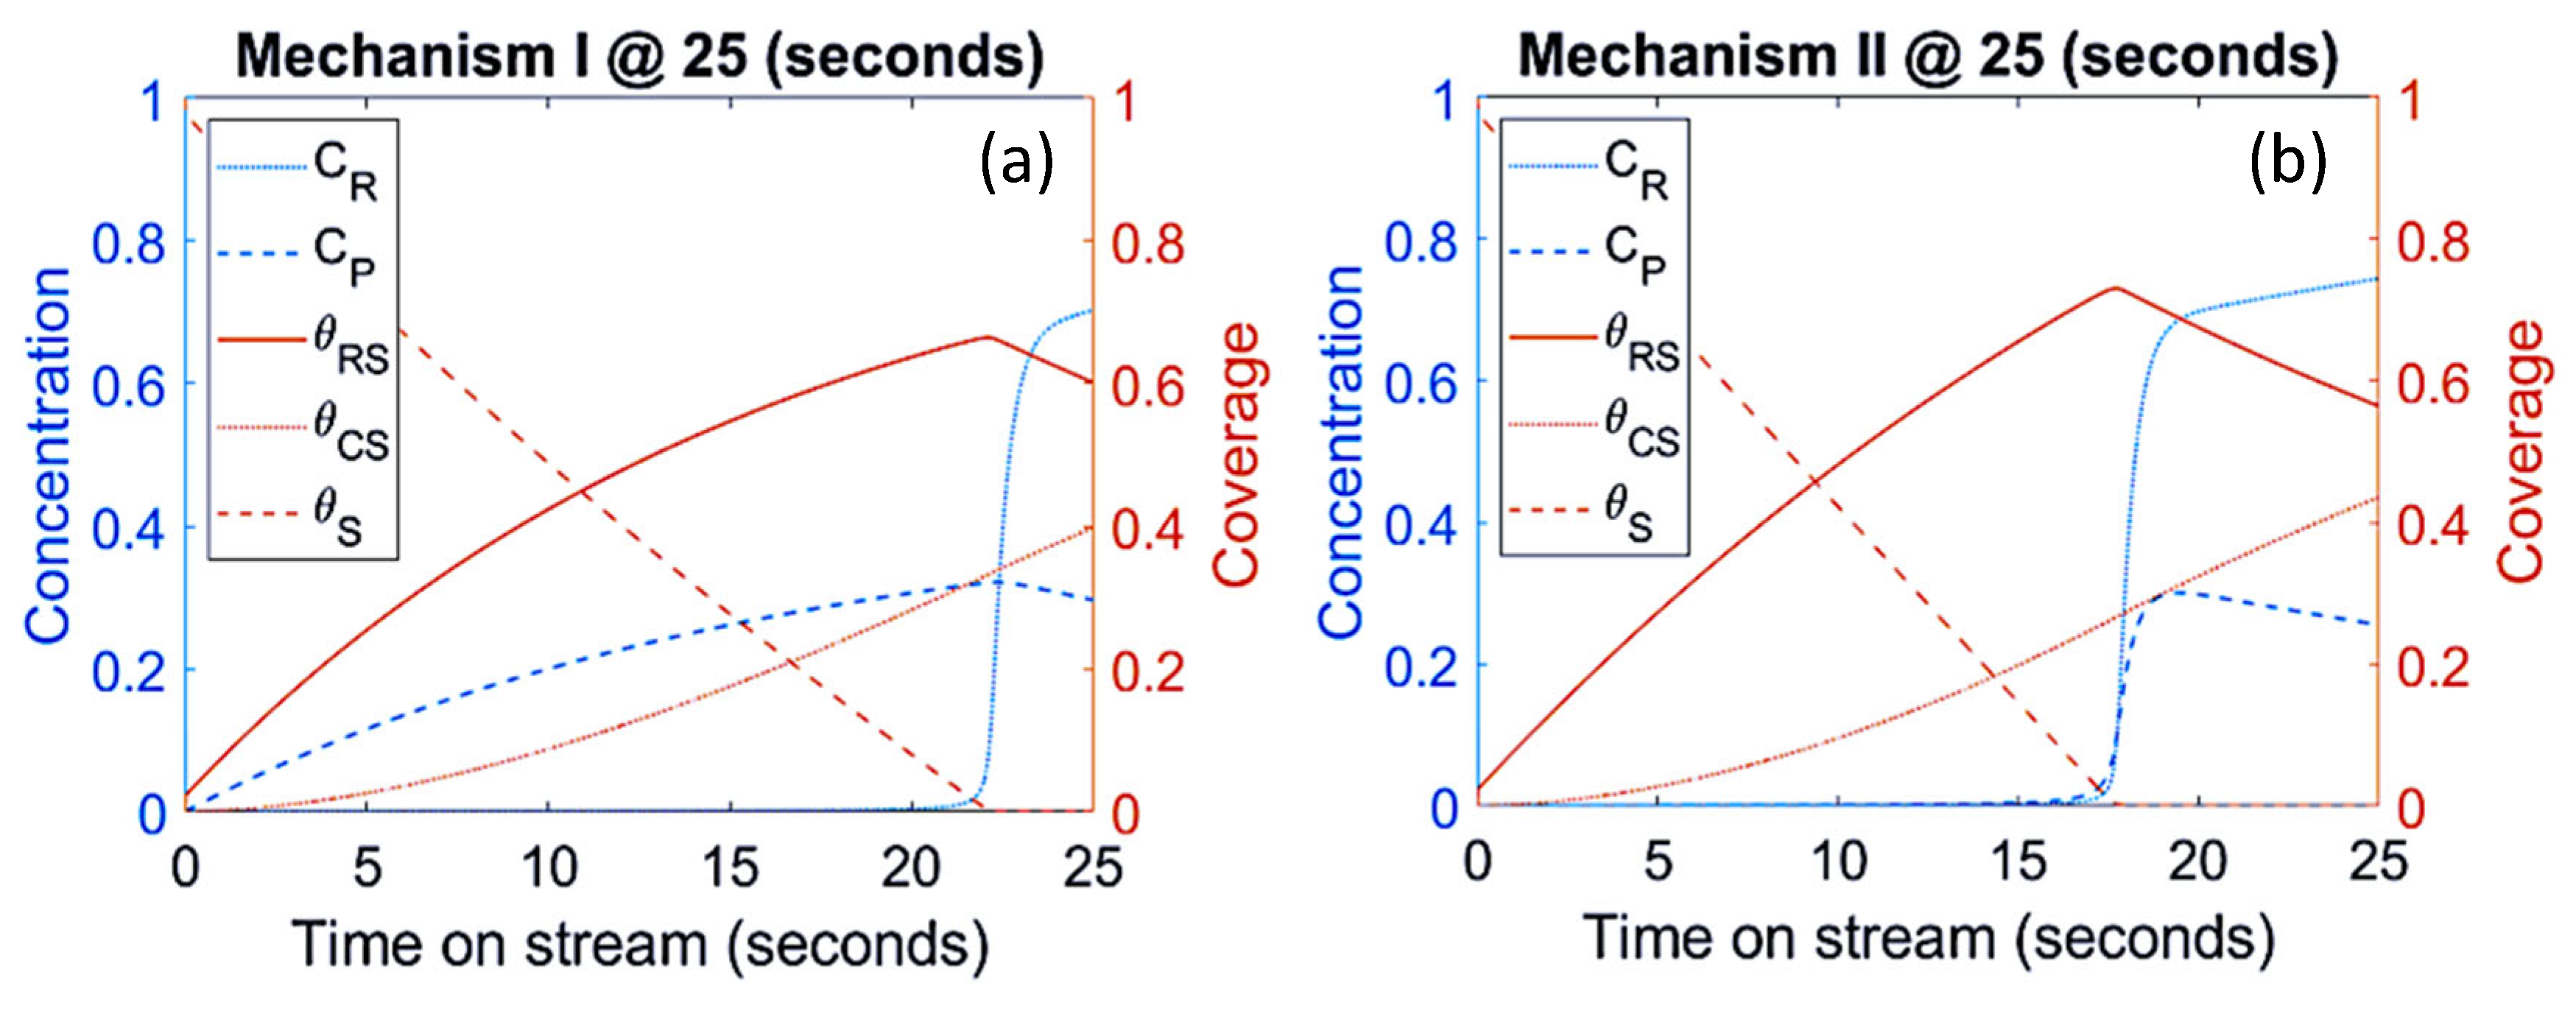
3.1. Mechanism I
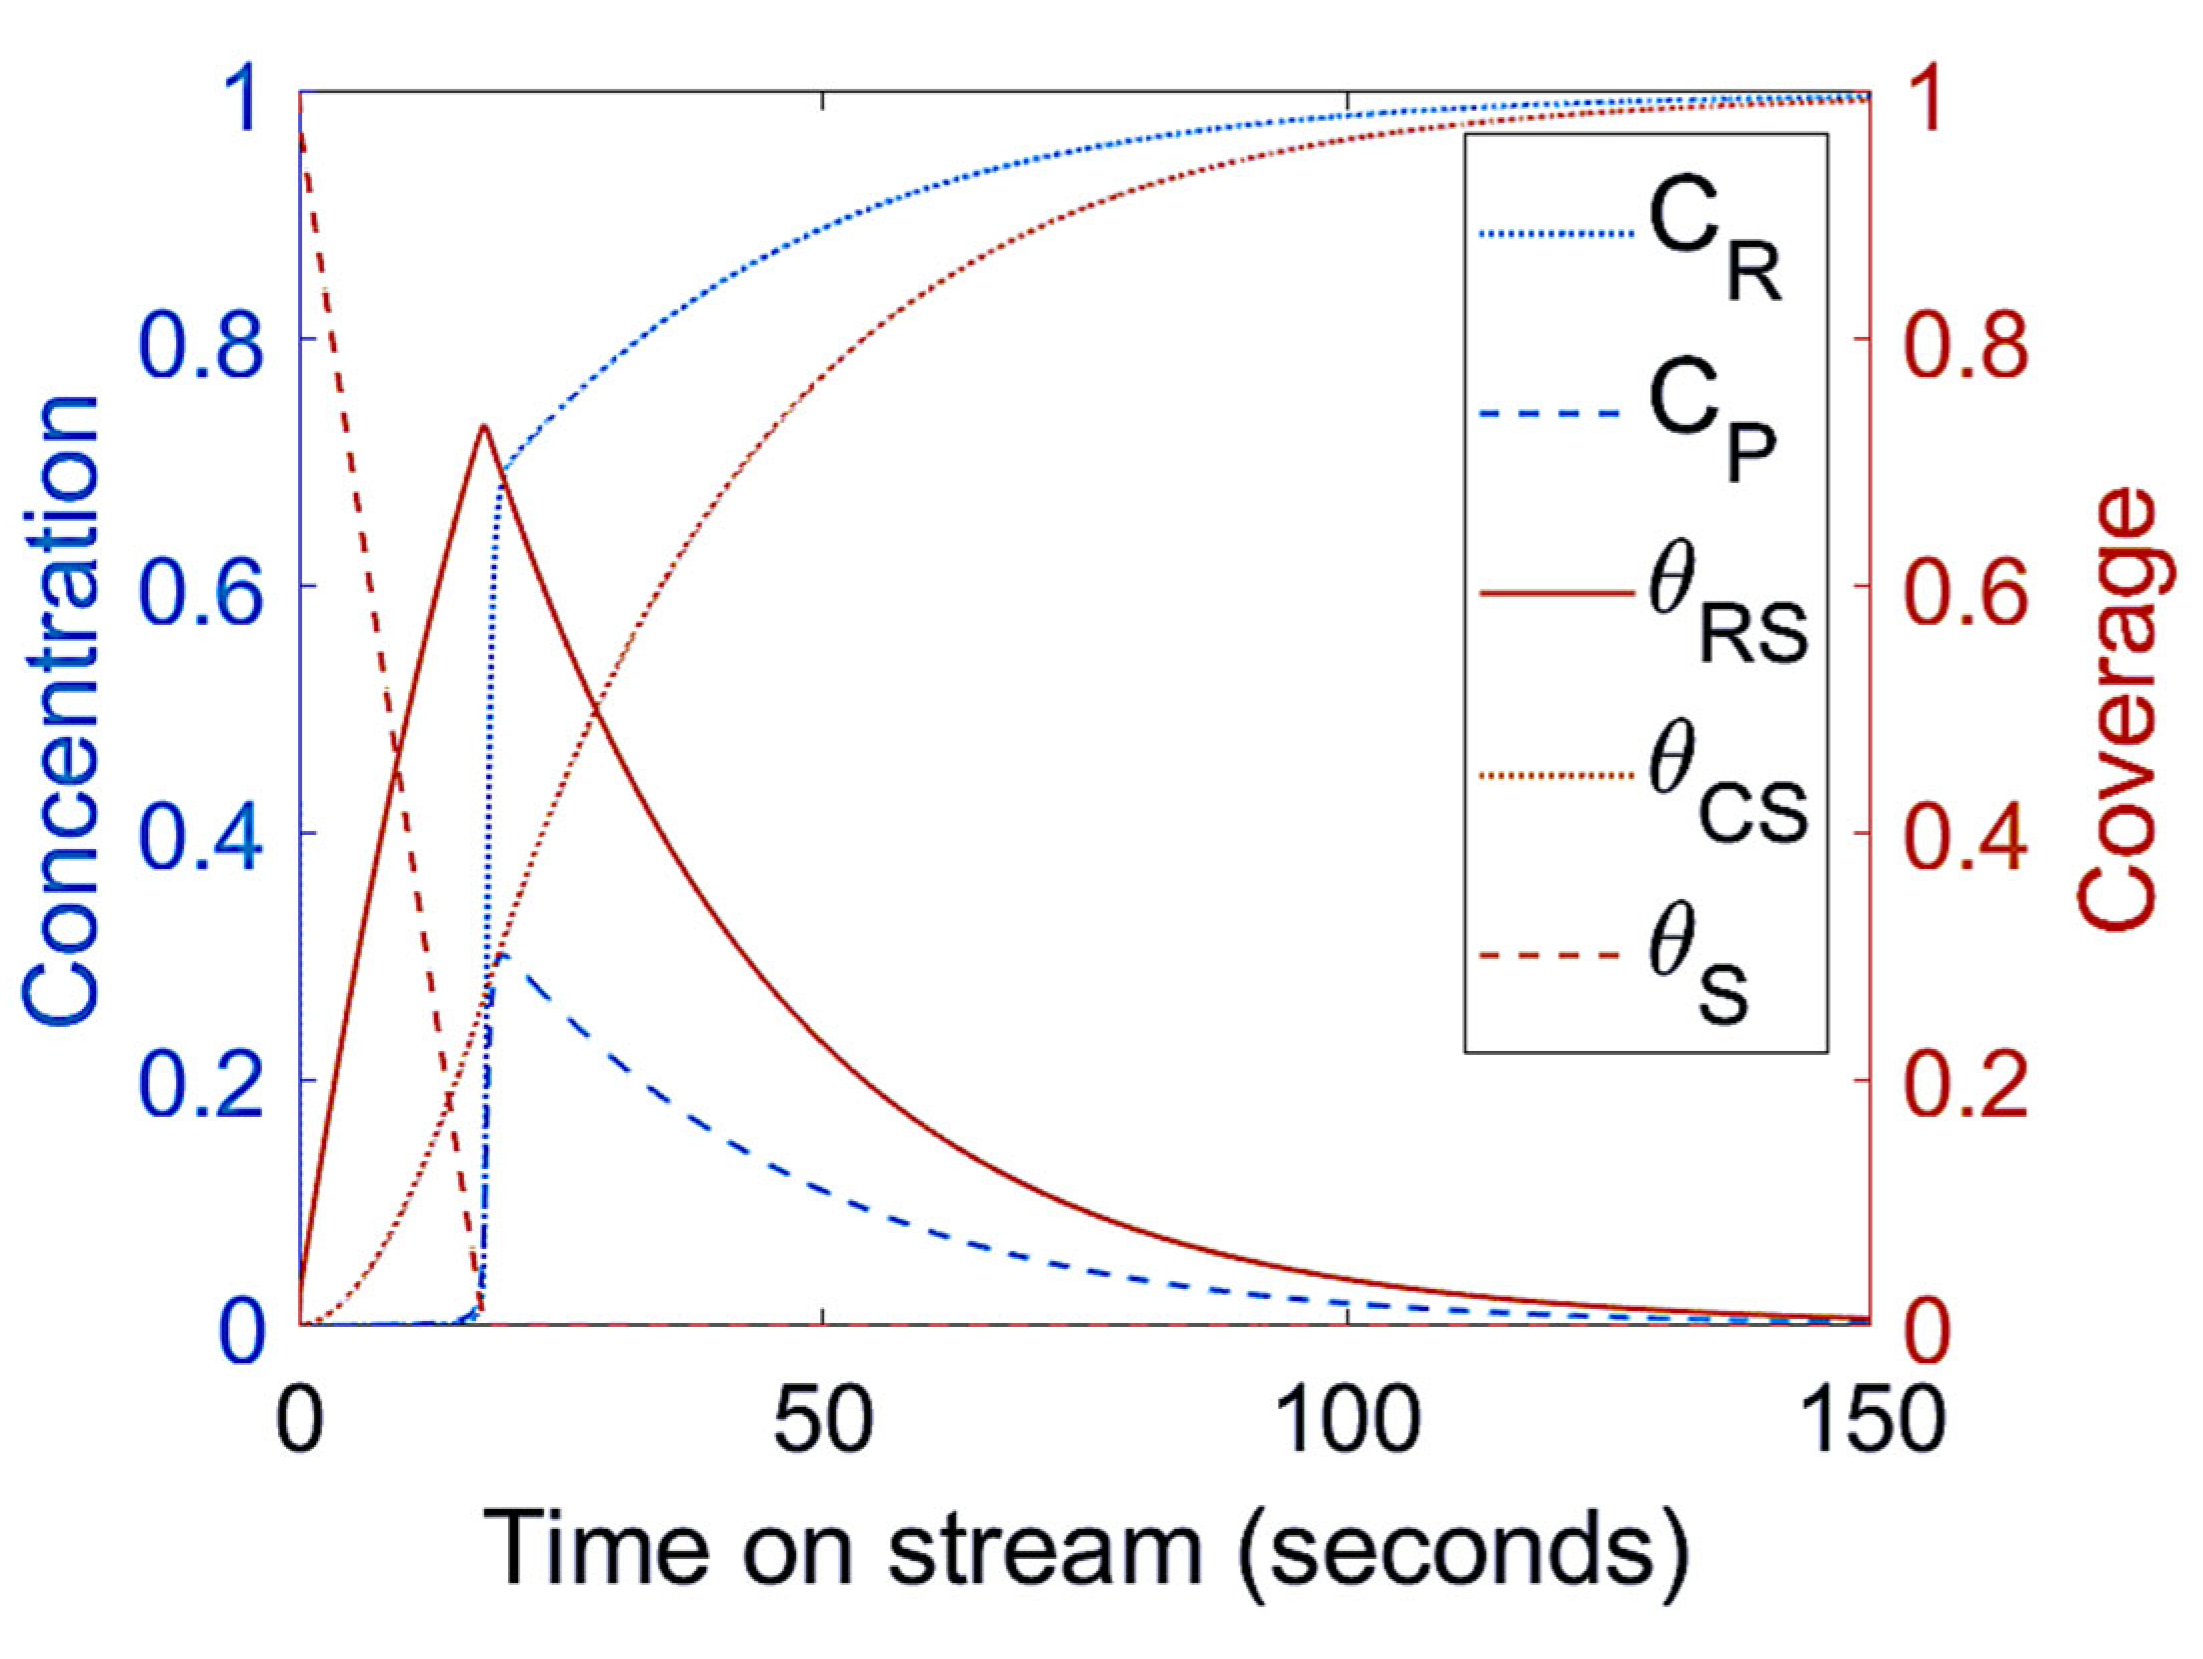
3.2. Mechanism II
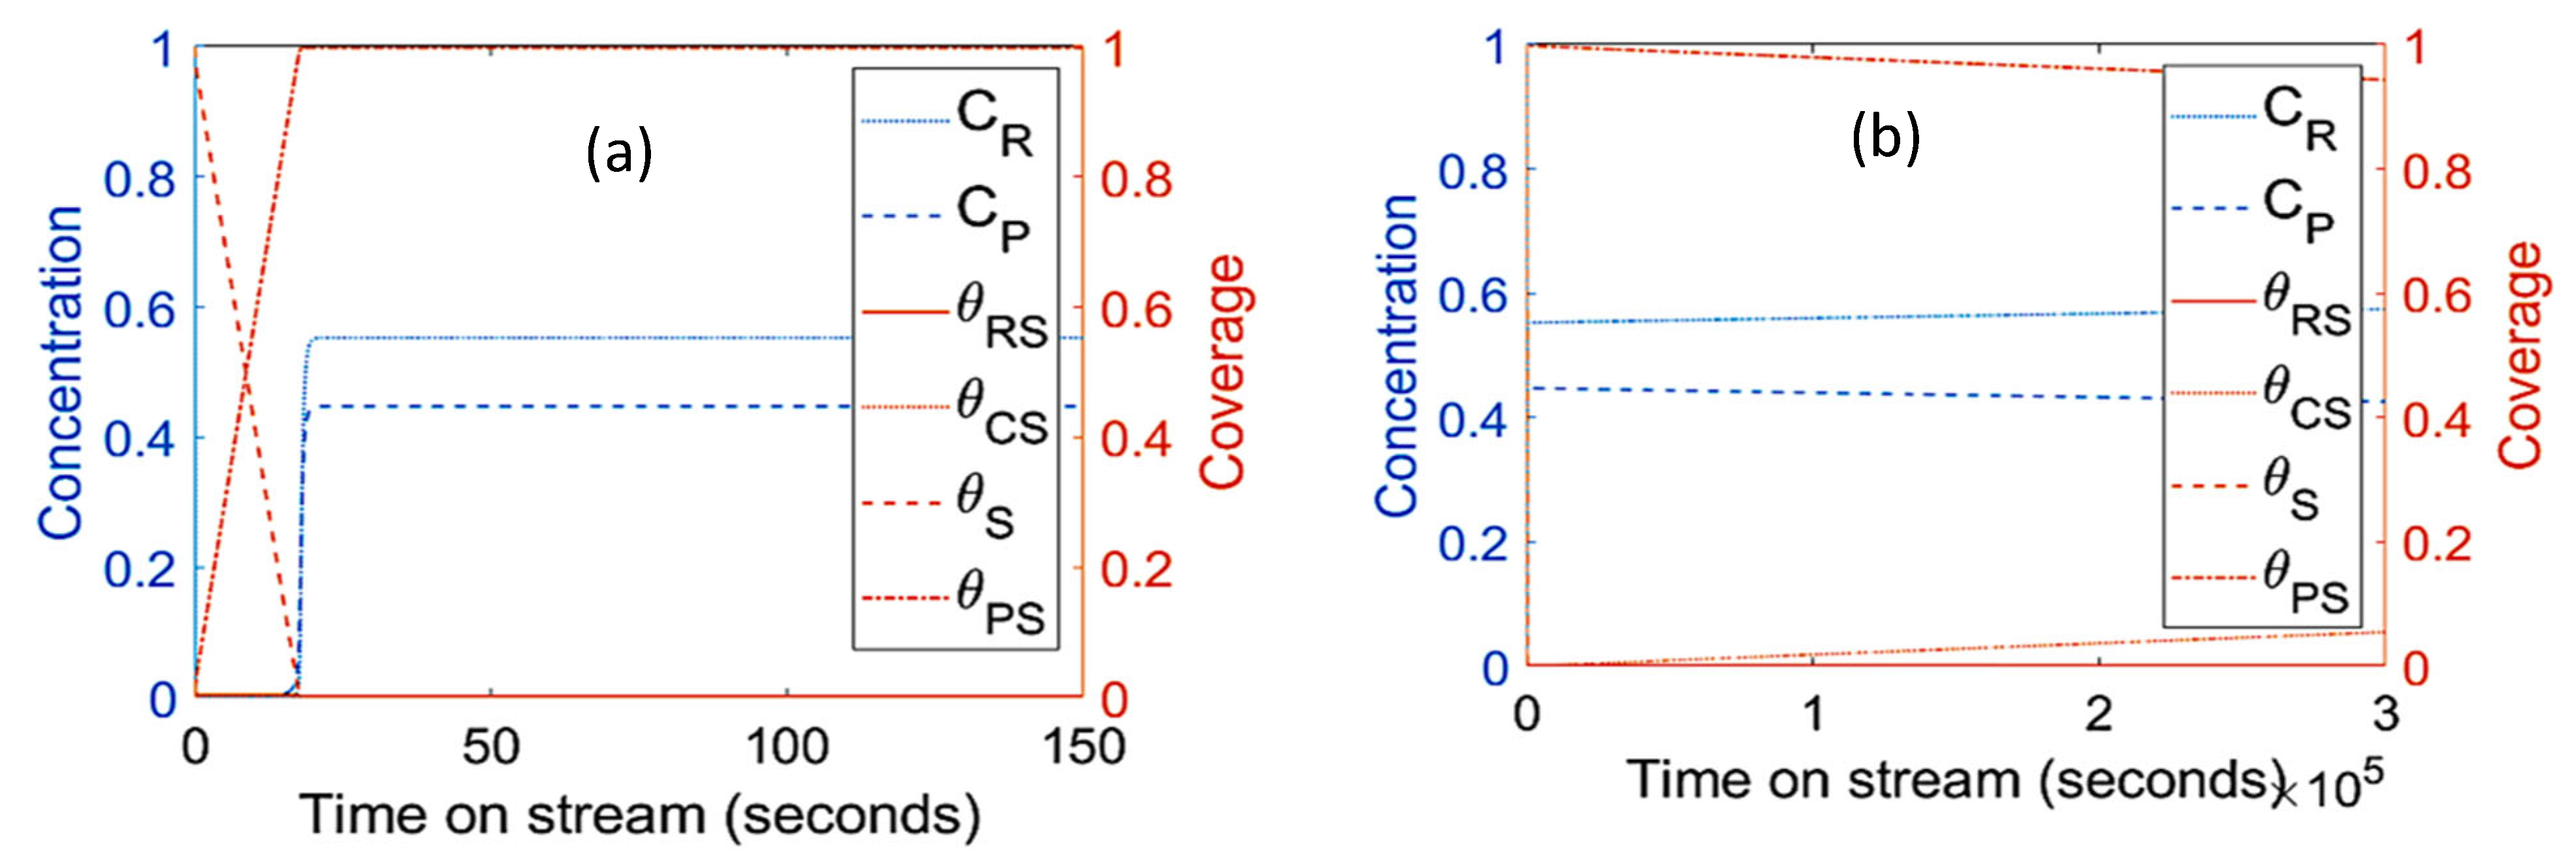
3.3. Mechanism III
3.4. Mechanism IV
3.5. Sensitivity Analysis
3.5.1. Mechanisms I and II: Sensitivity to , , , and
3.5.2. Mechanisms II: Sensitivity to , , and
3.5.3. Mechanisms III: Sensitivity to and
3.5.4. Mechanisms IV: Sensitivity to and
3.6. Model Verifications
- One of the major findings of this work is that increasing the inlet reactant concentration increases the coke formation in all mechanisms, as the adsorbed reactant concentration contributes to coke formation (as shown in separate simulations). This is supported by experimental results by Föttinger et al. [40]. They conducted skeletal isomerization of 1-pentene on BEA zeolite and on ferrierite (FER). From their findings with increasing partial pressure of 1-pentene the conversion decreases, and coke formation increase. This agrees with thermodynamic consideration, which suggested that higher alkene partial pressure could favor dimerization and hydride transfer reactions. Sandelin et al. [5,21] carried out dynamic Modelling of Catalyst Deactivation for the skeletal-isomerization of 1-Pentene on Ferrierite. They revealed that increasing of the feed olefin partial pressure increases the coke formation.
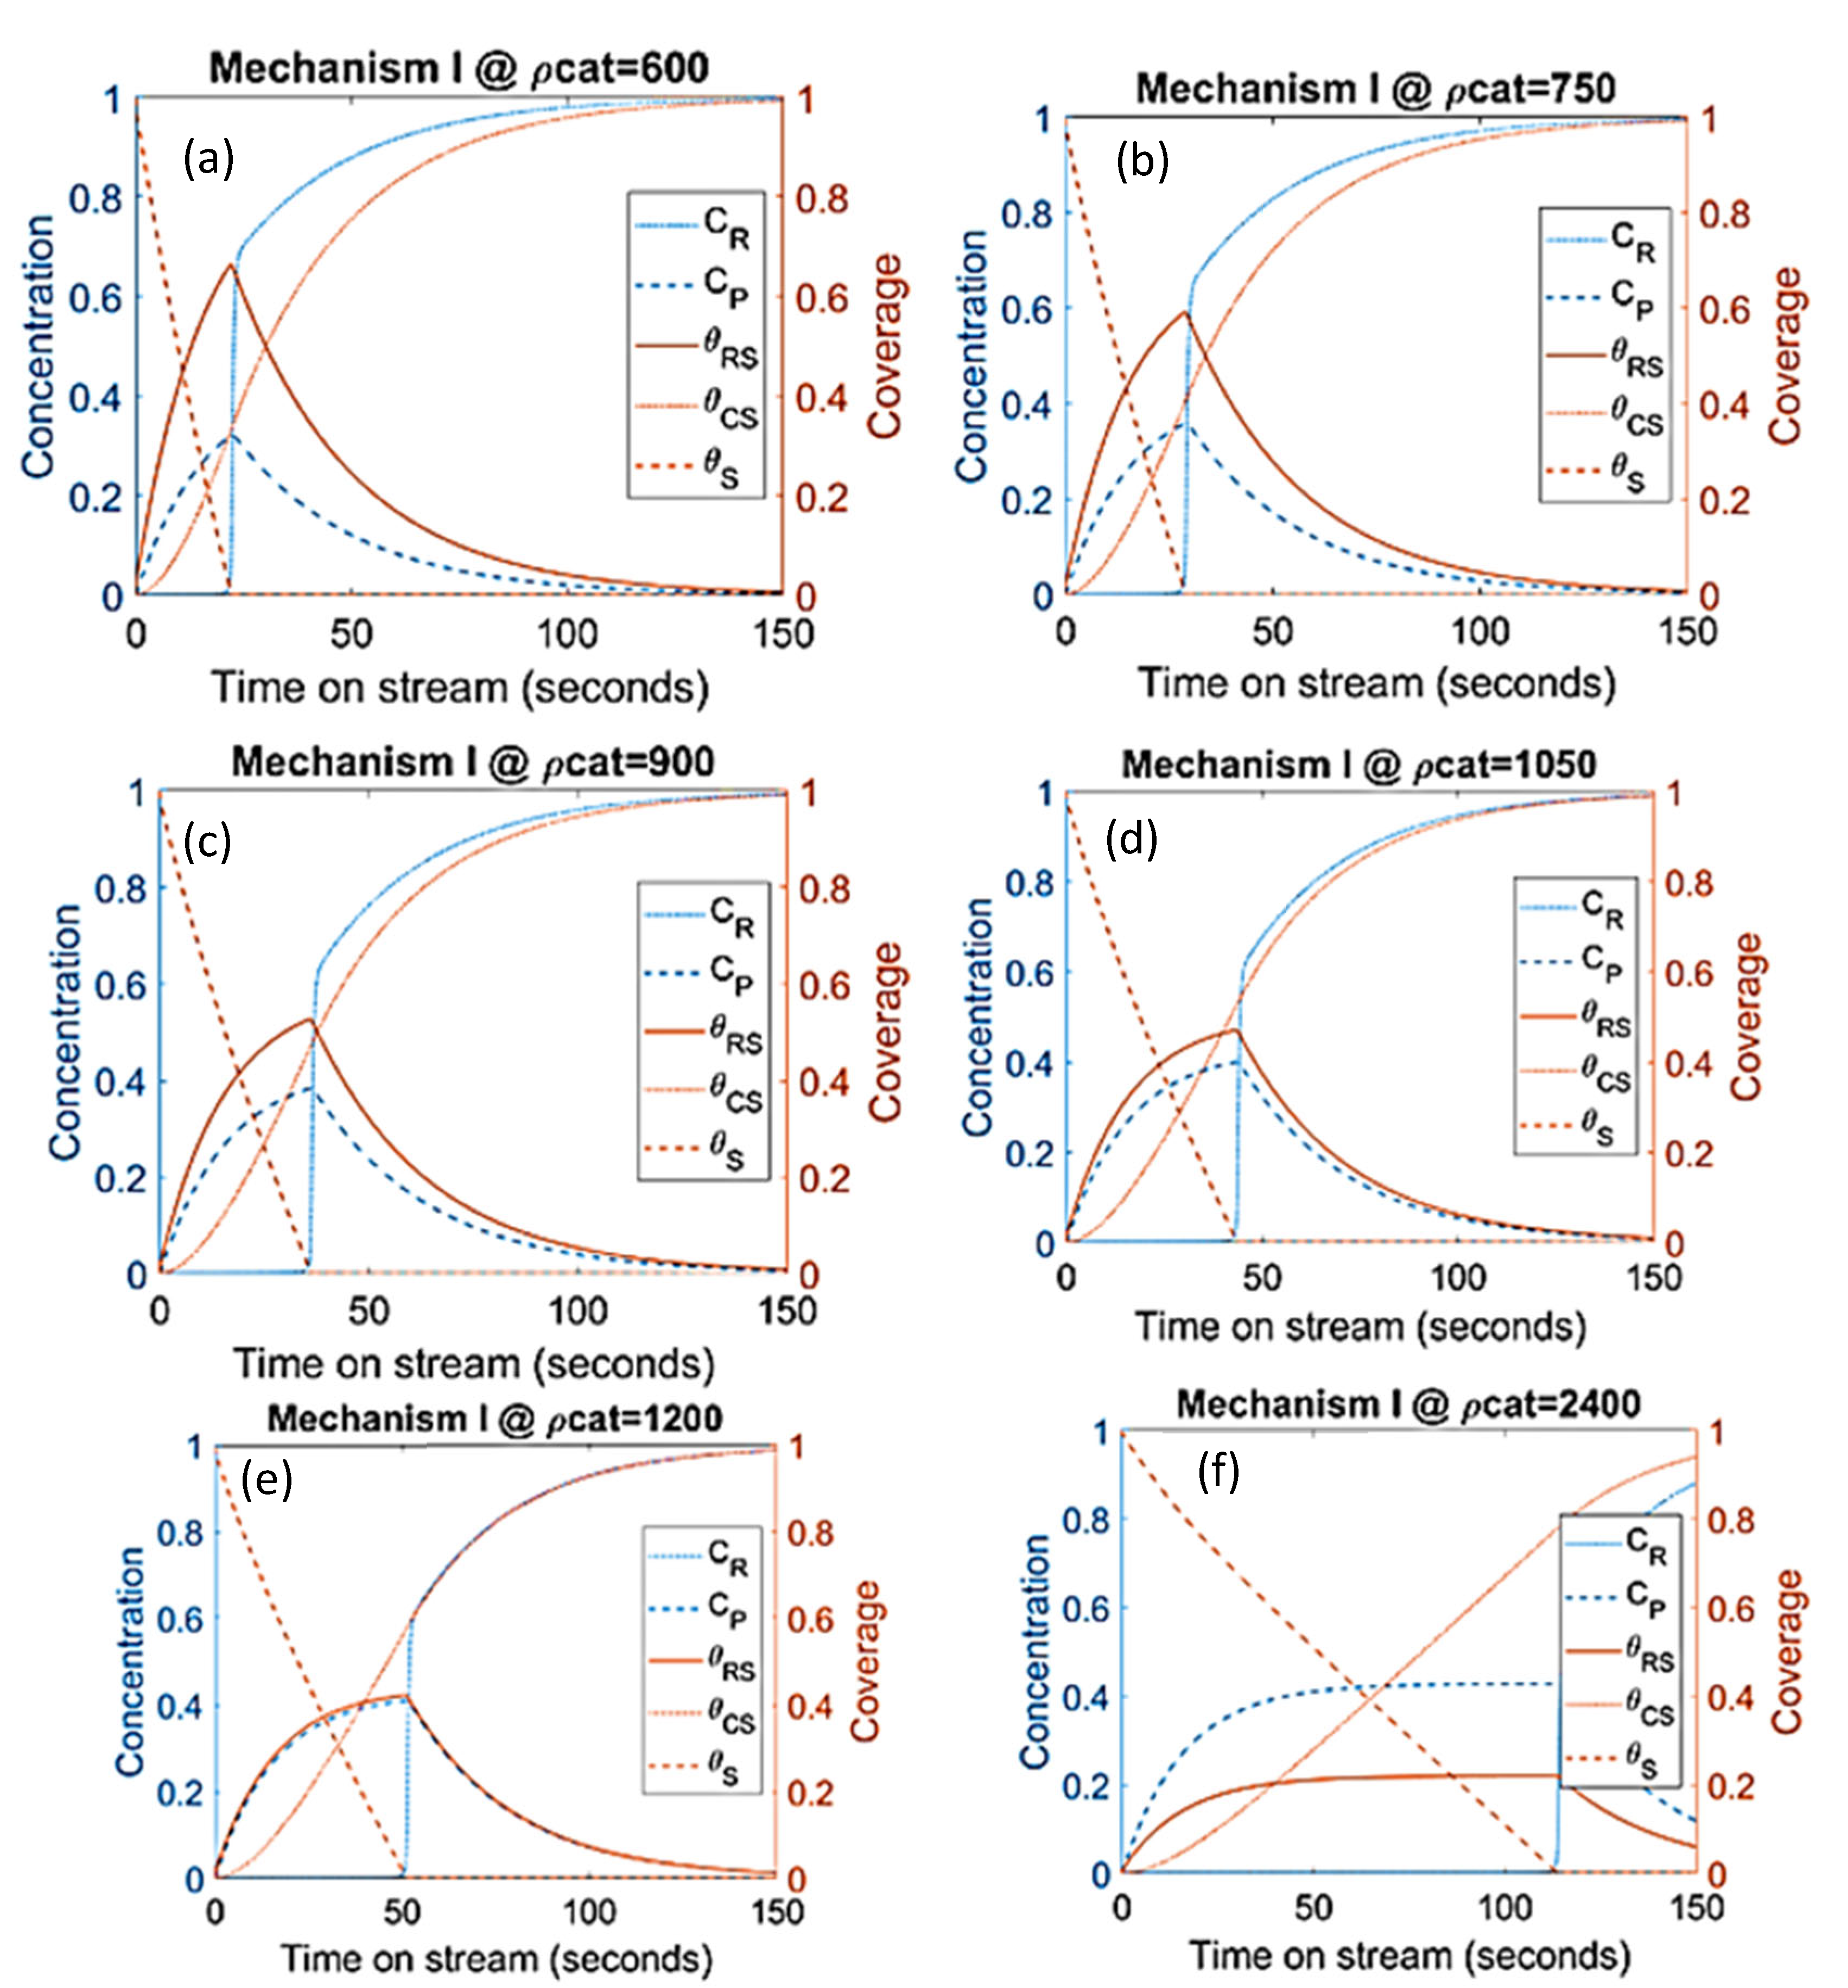
- Modelling work from Salmi et al. [41] showed that catalyst deactivation can be suppressed by adding more catalyst to the system. In agreement with the latter results, simulations from present work as shown in Figure 9 had similar behaviors where the increasing catalyst density suppresses the coke formation. The available active sites and product concentration increases with increasing catalyst density while the production of is suppressed. Even though the deactivation is delayed with increasing catalyst density, there is a limit at which further addition of catalyst does not accomplish higher conversion. Similar findings were reported by Manos et al. [42] and Gulab et al. [43] where, at low reaction temperatures, the addition of extra catalyst above polymer-to-catalyst mass ratios of 2 does not enhance conversion. As shown in Figure 9, increasing the catalyst density up to 75% has improved the conversion but at 100% increment and above, the conversion remained the same. Among the important feature here is the stabilization of the products at higher concentration of catalyst due to the low coke. As shown by separate simulations, increasing the catalyst density by 400% does not improve the conversion, but it has increased the stability of product production and further lowered coke formation.
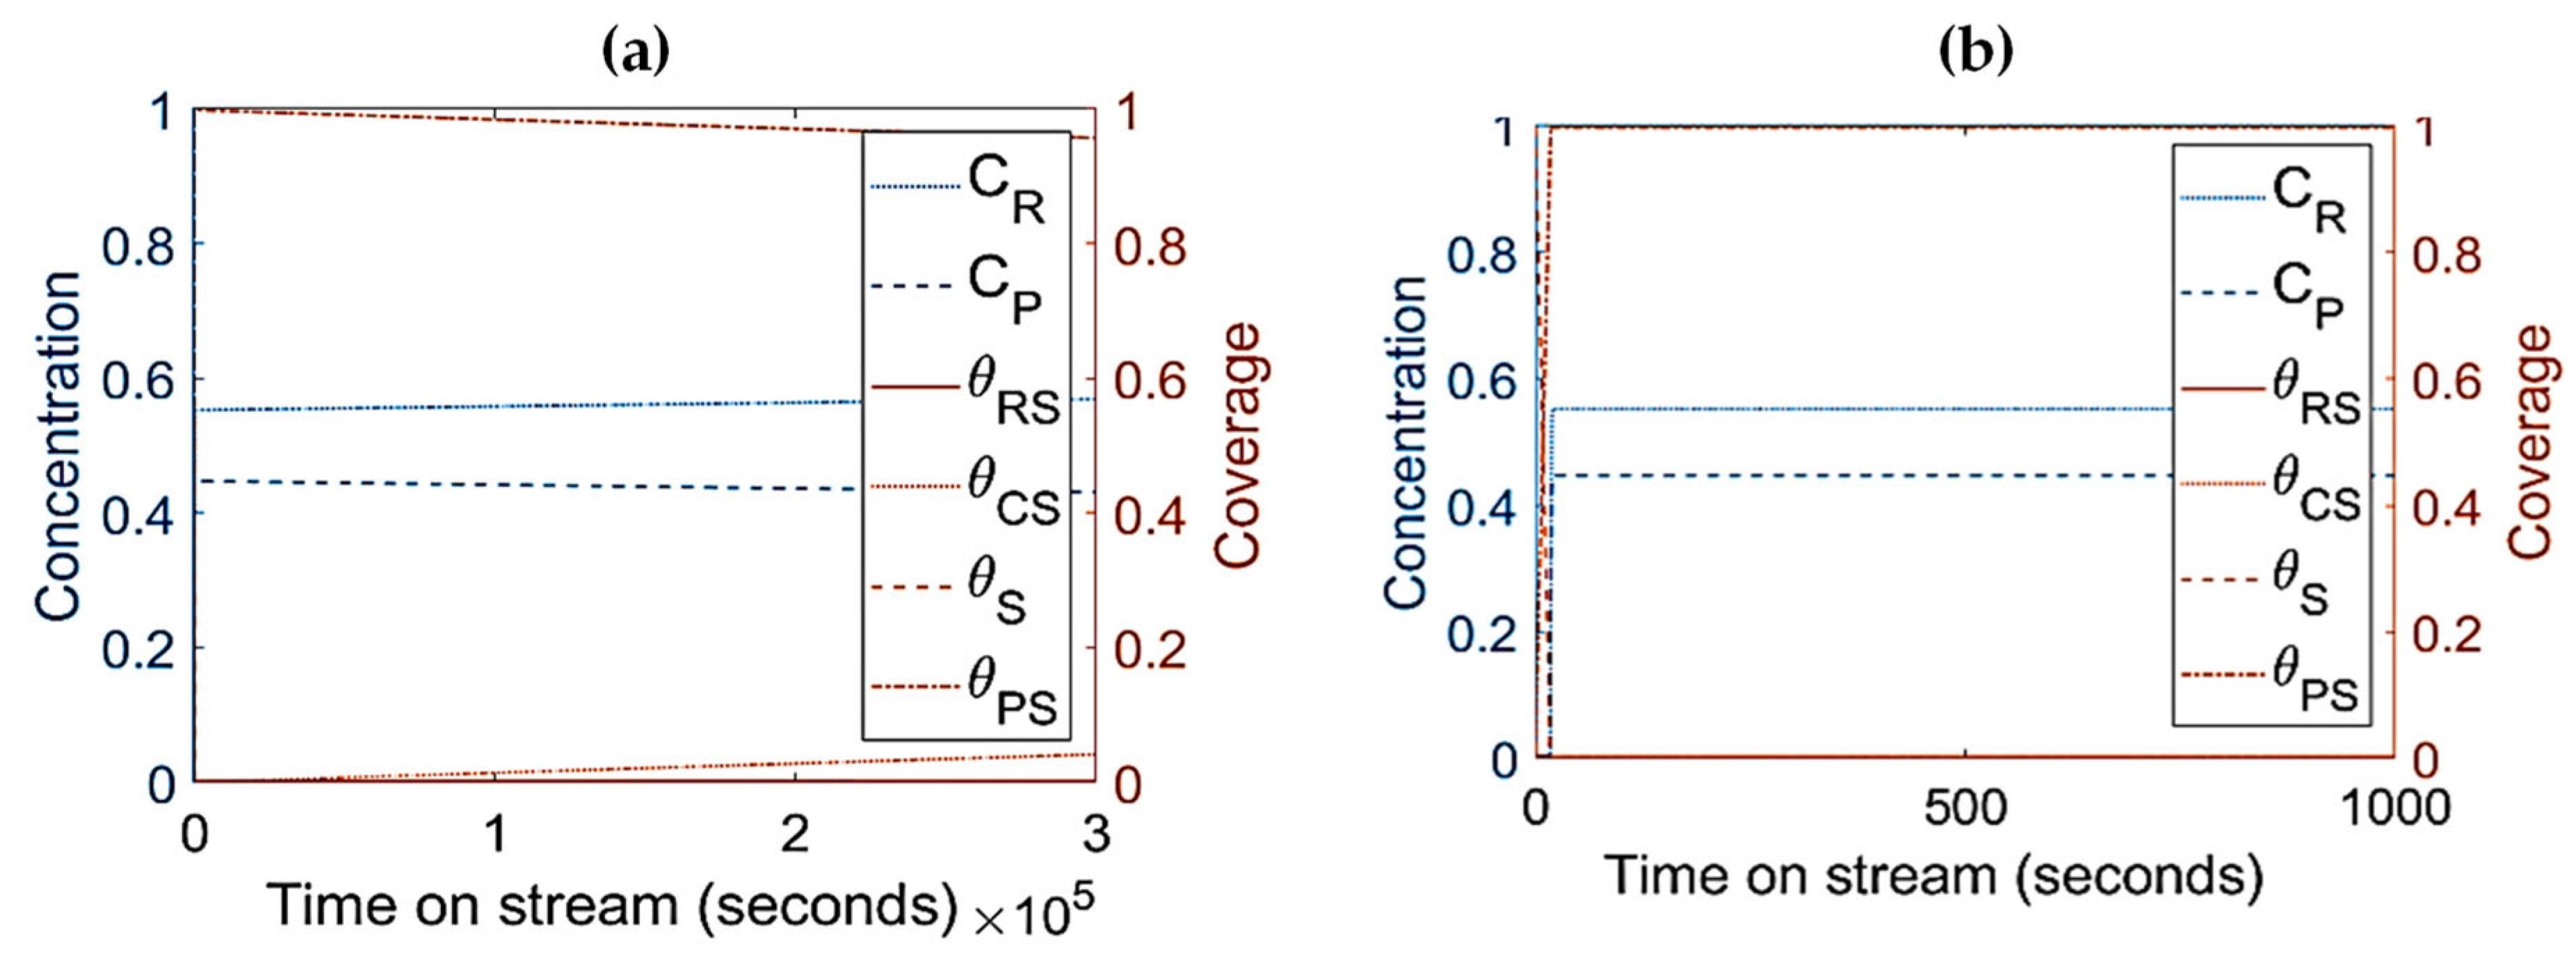
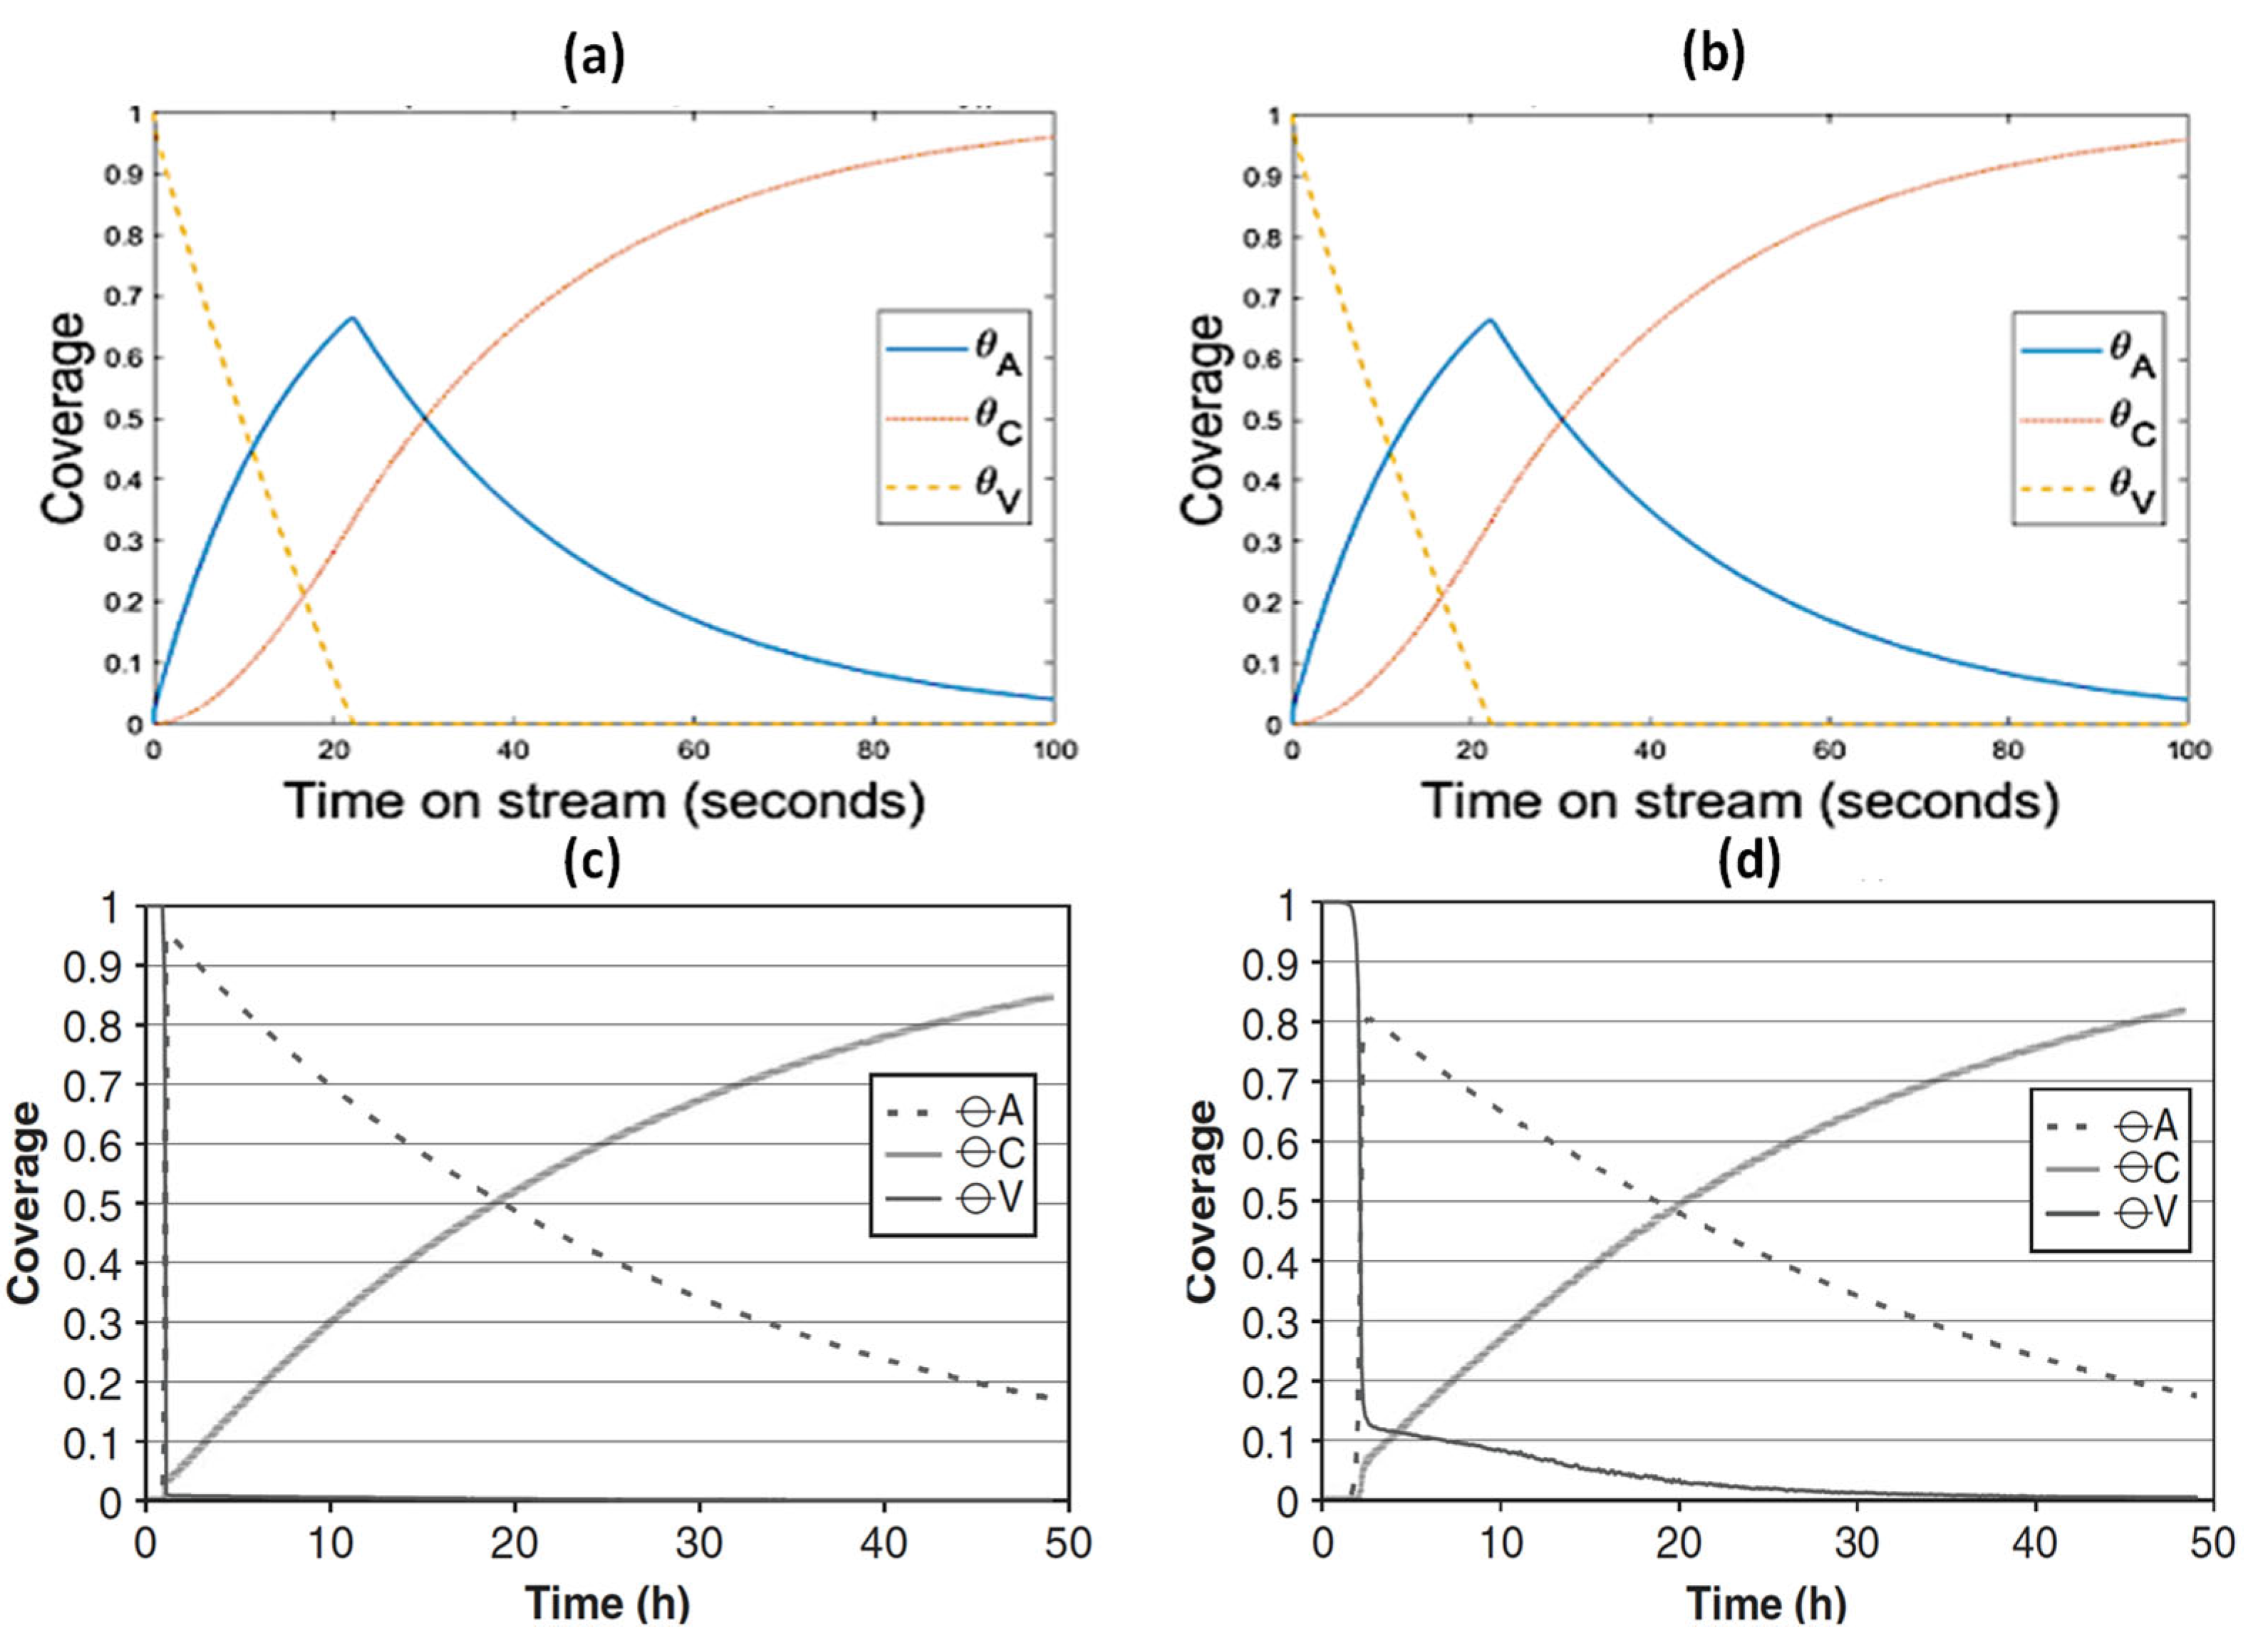
- The parameters/variables values used for this modelling work were generated from the work of Sandelin et al. [4]. Their work is basically based on plug flow reactor whereas the present modelling is based on CSTR. The same principal shapes and types of step responses can be observed in both reactor types, CSTR and a plug flow reactor (PFR) [44]. The qualitative behavior of CSTR was reported to be very similar to this of PFR [44,45]. Surface species coverages were compared between PFR (the literature) and CSTR (present study) as part of the modelling validation (Figure 10). The same parameters/variables values were used in both cases. As shown in Figure 10, the principal shapes and types of steps responses are the same in CSTR and PFR confirming the validity of the CSTR modelling. In the two reactors, the coverage of n-pentene (A) rises rapidly from zero to a maximum value, and then starts to decline as the coverage of coke (C) increases with increasing time on stream. If k1 is decreased and k−1 is increased, the free vacant sites increase, especially in the beginning of the experiment. This trend can easily be seen for PFR (Figure 10c,d). When small changes occur, the responses in CSTR (as shown in Figure 10a,b) are less pronounced due to back mixing effects [44]. However, if k1 decreases up to a higher value (as shown in Figure 5a), the step responses can be more noticeable, similar to those observed in PFR. The differences observed are expected and are reported in similar comparison studies.
4. Conclusions
Author Contributions
Funding
Data Availability Statement
Acknowledgments
Conflicts of Interest
References
- Chen, S.; Manos, G. Study of Coke and Coke Precursors during Catalytic Cracking of n-Hexane and 1-Hexene over Ultrastable Y Zeolite. Catal. Lett. 2004, 96, 195–200. [Google Scholar] [CrossRef]
- Chen, S.; Manos, G. In situ thermogravimetric study of coke formation during catalytic cracking of normal hexane and 1-hexene over ultrastable Y zeolite. J. Catal. 2004, 226, 343–350. [Google Scholar] [CrossRef]
- Froment, G.F. Modeling of catalyst deactivation. Appl. Catal. A Gen. 2001, 212, 117–128. [Google Scholar] [CrossRef]
- Nam, I.S.; Kitrell, J.R. Use of Catalyst Coke Content in Deactivation Modeling. Ind. Eng. Chem. Process Des. Dev. 1984, 23, 237–242. [Google Scholar] [CrossRef]
- Sandelin, F.; Salmi, T.; Murzin, D.Y. An integrated dynamic model for reaction kinetics and catalyst deactivation in fixed bed reactors: Skeletal isomerization of 1-pentene over ferrierite. Chem. Eng. Sci. 2006, 61, 1157–1166. [Google Scholar] [CrossRef]
- Sie, S.T. Consequences of catalyst deactivation for process design and operation. Appl. Catal. A 2001, 212, 129–151. [Google Scholar] [CrossRef]
- Szepe, S.; Levenspiel, O. Proceedings of the Fourth European Symposium on Chemical Reaction Engineering; Pergamon Press: Brussels, Belgium, 1971; p. 265. [Google Scholar]
- Quintana-Solórzano, R.; Thybaut, J.W.; Marin, G.B.; Lødeng, R.; Holmen, A. Single-Event Microkinetics for coke formation in catalytic cracking. Catal. Today 2005, 107–108, 619–629. [Google Scholar] [CrossRef]
- Reyniers, M.F.; Beirnaert, H.; Marin, G.B. Influence of coke formation on the conversion of hydrocarbons: I. Alkanes on a USY-zeolite. Appl. Catal. A 2000, 202, 49–63. [Google Scholar] [CrossRef]
- Chen, Z.; Zhang, X.; Yang, F.; Peng, H.; Zhang, X.; Zhu, S.; Che, L. Deactivation of a Y-zeolite based catalyst with coke evolution during the catalytic pyrolysis of polyethylene for fuel oil. Appl. Catal. A Gen. 2021, 609, 117873. [Google Scholar] [CrossRef]
- Chen, Z.; Zhang, X.; Che, L.; Peng, H.; Zhu, S.; Yang, F.; Zhang, X. Effect of volatile reactions on oil production and composition in thermal and catalytic pyrolysis of polyethylene. Fuel 2020, 271, 117308. [Google Scholar] [CrossRef]
- Seifert, M.; Jonscher, C.; Haufe, L.A.; Weigand, J.J. Deactivation kinetics of ZSM-5 by coke in Ethanol-to-Hydrocarbons process. Chem. Ing. Technol. 2021, 93, 747–753. [Google Scholar] [CrossRef]
- Nazarova, G.Y.; Ivashkina, E.N.; Ivanchina, E.D.; Vosmerikov, A.V.; Vosmerikova, L.N.; Antonov, A.V. A model of catalytic cracking: Product distribution and catalyst deactivation depending on saturates, aromatics and resins content in feed. Catalysts 2021, 11, 701. [Google Scholar] [CrossRef]
- Moustafa, T.M.; Corella, J.; Froment, G.F. Kinetic modeling of coke formation and deactivation in the catalytic cracking of vacuum gas oil. Ind. Eng. Chem. Res. 2003, 42, 14–25. [Google Scholar] [CrossRef]
- John, Y.M.; Patel, R.; Mujtaba, I.M. Maximization of propylene in an industrial FCC unit. Appl. Petrochem. Res. 2018, 8, 79–95. [Google Scholar] [CrossRef] [Green Version]
- Alonso-Ramírez, G.; Cuevas-García, R.; Sánchez-Minero, F.; Ramírez, J.; Moreno-Montiel, M.; Silva-Oliver, G.; Ancheyta, J. Catalytic hydrocracking of a Mexican heavy oil on a MoS2/al2o3catalyst: II. Study of the transformation of isolated aromatics fraction obtained from SARA analysis. Fuel 2021, 288, 119541. [Google Scholar] [CrossRef]
- Al-Khattaf, S.; Saeed, M.R.; Aitani, A.; Klein, M.T. Catalytic Cracking of Light Crude Oil to Light Olefins and Naphtha over E-Cat and MFI: Microactivity Test versus Advanced Cracking Evaluation and the Effect of High Reaction Temperature. Energy Fuels 2018, 32, 6189–6199. [Google Scholar] [CrossRef]
- Radu, S.; Ciuparu, D. Modelling and Simulation of an Industrial Fluid Catalytic Cracking. Rev. Chim.-Ducharest-Orig. 2014, 65, 113–119. [Google Scholar]
- Hinshelwood, C.N. The Kinetics of Chemical Change; Clarendon Press: Oxford, UK, 1940; Chapter 8. [Google Scholar]
- Hougen, O.A.; Watson, R.M. Chemical Process Principles; Part III; Wiley: New York, NY, USA, 1959; Chapter 19. [Google Scholar]
- Sandelin, F.; Salmi, T.; Murzin, D.Y. Dynamic Modeling of Catalyst Deactivation in Fixed-Bed Reactors: Skeletal Isomerization of 1-Pentene on Ferrierite. Ind. Eng. Chem. Res. 2006, 45, 558–566. [Google Scholar] [CrossRef]
- Jalid, F.; Haider, M.A.; Alam, M.I.; Khan, T.S. Mechanistic insights into the dominant reaction route and catalyst deactivation in biogas reforming using ab initio microkinetic modelling. Catal. Sci. Technol. 2021, 11, 2130–2143. [Google Scholar] [CrossRef]
- Shahrouzi, J.R.; Guillaume, D.; Rouchon, P.; Da Costa, P. Stochastic Simulation and Single Events Kinetic Modeling: Application to Olefin Oligomerization. Ind. Eng. Chem. Res. 2008, 47, 4308–4431. [Google Scholar] [CrossRef]
- Aittamaa, J.; Keskinen, K. Kinfit User’s Instruction Manual; Neste Engineering: Porvoo, Finland; HUT: Espoo, Finland, 2003. [Google Scholar]
- 7 Reasons Matlab Is the Easiest and Most Productive Environment for Engineers and Scientists. 2017. Available online: https://uk.mathworks.com/products/matlab/why-matlab.html (accessed on 15 March 2023).
- Ode45. 2017. Available online: https://uk.mathworks.com/help/matlab/ref/ode45.html (accessed on 15 March 2023).
- Saltelli, A.; Ratto, M.; Tarantola, S.; Campolongo, F. Sensitivity analysis for chemical models. Chem. Rev. 2005, 105, 2811–2828. [Google Scholar] [CrossRef] [PubMed]
- Lopez, C.M.; Ramirez, L.; Sazo, V.; Escobar, V. I-Pentene isomerization over SAPO-II, BEA and AIMCM-41 molecular sieves. Appl. Catal. A Gen. 2008, 340, 1–6. [Google Scholar] [CrossRef]
- Van Donk, S.; Bus, E.; Broersma, A.; Bitter, J.H.; de Jong, K.P. Butene skeletal isomerization over H-ferrierite: A TEOM and in situ IR study on the role of carbonaceous deposits and the location of Bronsted acid sites. Appl. Catal. A 2002, 237, 149–159. [Google Scholar] [CrossRef] [Green Version]
- Vahteristo, K.; Sahala, K.M.; Laari, A.; Solonen, A.; Haario, H. Skeletal isomerization kinetics of 1-pentene over an HZSM-22 catalyst. Chem. Eng. Sci. 2010, 65, 4640–4651. [Google Scholar] [CrossRef]
- Wang, B.; Manos, G. Acid Site Characterization of Coked USHY Zeolite Using Temperature Programmed Desorption with a Component-Nonspecific Detector. Ind. Eng. Chem. Res. 2007, 46, 7977–7983. [Google Scholar] [CrossRef]
- Wang, B.; Manos, G. Role of Strong Zeolitic Acid Sites on Hydrocarbon Reactions. Ind. Eng. Chem. Res. 2008, 47, 2948–2955. [Google Scholar] [CrossRef]
- Brillis, A.A.; Manos, G. Coke Formation during Catalytic Cracking Of C-8 Aliphatic Hydrocarbons Over Ultrastable Y Zeolite. Ind. Eng. Chem. Res. 2003, 42, 2292–2298. [Google Scholar] [CrossRef]
- Beeckman, J.W.; Froment, G.F. Catalyst deactivation by site coverage and pore blockage. Chem. Eng. Sci. 1980, 35, 805–815. [Google Scholar] [CrossRef]
- Serrano, D.P.; Aguado, J.; Escola, J.M.; Garagorri, E. Conversion of low density polyethylene into petrochemical feedstocks using a continuous screw kiln reactor. J. Anal. Appl. Pyrolysis 2001, 58–59, 789–801. [Google Scholar] [CrossRef]
- Brillis, A.A.; Manos, G. Deactivation studies during catalytic cracking of C8 aliphatic hydrocarbons over ultrastable Y-zeolite. Conversion and product yield profiles with time onstream. Catal. Lett. 2003, 91, 185–191. [Google Scholar] [CrossRef]
- Zhang, X.; Lei, H.; Yadavalli, G.; Zhu, L.; Wei, Y.; Liu, Y. Gasoline-range hydrocarbons produced from microwave-induced pyrolysis of low-density polyethylene over ZSM-5. Fuel 2015, 144, 33–42. [Google Scholar] [CrossRef]
- Onay, O.; Beis, S.H.; Koçkar, O.M. Fast pyrolysis of rape seed in a well-swept fixed-bed reactor. J. Anal. Appl. Pyrol. 2001, 58–59, 995–1007. [Google Scholar] [CrossRef]
- Wang, B.; Manos, G. A novel thermogravimetric method for coke precursor characterization. J. Catal. 2007, 250, 121–127. [Google Scholar] [CrossRef]
- Föttinger, K.; Kinger, G.; Vinek, H. 1-pentene isomerization over FER and BEA. Appl. Catal. A Gen. 2003, 249, 205–212. [Google Scholar] [CrossRef]
- Salmi, T.; Murzin, D.Y.; Wärnå, I.; Mäki-Arvela, P.; Martin, G. Integrated modelling of reaction and catalyst deactivation kinetics-Hydrogenation of sitosterol to sitostanol over a palladium catalyst. Chem. Eng. Sci. 2013, 104, 156–165. [Google Scholar] [CrossRef]
- Manos, G.; Garforth, A.; Dwyer, J. Catalytic Degradation of high density polyethylene on an ultrastable Y zeolite. nature of initial polymer reactions, pattern of formation of gas and liquid products, temperature effects. Ind. Eng. Chem. Res. 2000, 39, 1198–1203. [Google Scholar] [CrossRef]
- Gulab, H.; Jan, M.R.; Shah, J.; Manos, G. Plastic catalytic pyrolysis to fuels as tertiary polymer recycling method: Effect of process conditions. J. Environ. Sci. Health Part A 2010, 45, 908–915. [Google Scholar] [CrossRef] [PubMed]
- Salmi, T. Modelling and Simulation of Transient States of Ideal Heterogeneous Catalytic Reactors. Chem. Eng. Sci. 1988, 43, 503–551. [Google Scholar] [CrossRef]
- Sun, X.Y.; Mueller, S.; Liu, Y.; Shi, H.; Haller, G.L.; Sanchez-Sanchez, M.; Van Veen, A.C.; Lercher, J.A. Coke formation and deactivation pathways on H-ZSM-5 in the conversion of methanol to olefins. J. Catal. 2015, 325, 48–59. [Google Scholar] [CrossRef]


| k, m3s−1kgcat−1 | k1 | k−2 | k−3 | k−1 | k2 | k3 | kc | kc2 | k−c |
|---|---|---|---|---|---|---|---|---|---|
| Mechanism I | 13 | - | - | 0.036 | 0.027 | - | 0.036 | - | - |
| Mechanism II | 13 | 1.349 | - | 0.036 | 0.027 | - | 0.036 | - | - |
| Mechanism III | 13 | - | 1.349 | 0.036 | 14.5 | 0.027 | 8.3 × 10⁻⁵ | 4.6 × 10⁻⁸ | - |
| Mechanism IV | 13 | - | 1.349 | 0.036 | 14.5 | 0.027 | 8.3 × 10⁻⁵ | - | 4.6 × 10⁻⁸ |
| Variable | Value |
|---|---|
| Residence time, (s) | 1 |
| Inlet reactant concentration, ( | 20 |
| Catalyst density, | 600 |
| Bed voidage, | 0.4 |
Disclaimer/Publisher’s Note: The statements, opinions and data contained in all publications are solely those of the individual author(s) and contributor(s) and not of MDPI and/or the editor(s). MDPI and/or the editor(s) disclaim responsibility for any injury to people or property resulting from any ideas, methods, instructions or products referred to in the content. |
© 2023 by the authors. Licensee MDPI, Basel, Switzerland. This article is an open access article distributed under the terms and conditions of the Creative Commons Attribution (CC BY) license (https://creativecommons.org/licenses/by/4.0/).
Share and Cite
Muhammad, I.; Makwashi, N.; Ahmed, T.G.; Manos, G.; Zhao, D. A Mechanistic Model on Catalyst Deactivation by Coke Formation in a CSTR Reactor. Processes 2023, 11, 944. https://doi.org/10.3390/pr11030944
Muhammad I, Makwashi N, Ahmed TG, Manos G, Zhao D. A Mechanistic Model on Catalyst Deactivation by Coke Formation in a CSTR Reactor. Processes. 2023; 11(3):944. https://doi.org/10.3390/pr11030944
Chicago/Turabian StyleMuhammad, Ishaka, Nura Makwashi, Tariq Galadanchi Ahmed, George Manos, and Donglin Zhao. 2023. "A Mechanistic Model on Catalyst Deactivation by Coke Formation in a CSTR Reactor" Processes 11, no. 3: 944. https://doi.org/10.3390/pr11030944