

Experimental and Numerical Investigation on Slamming Mechanism of a Mooring Column-Stabilised Semi-Submersible
by
 , ,
, ,
Zhi Yao
1,
Fali Huo
2,
Yuanyao Zhu
1,
Chenxuan Tang
1,
Kunqiao Jia
3,
Dong Li
4 and
Yong Ma
1,5,* 1
School of Ocean Engineering and Technology, Sun Yat-sen University, Zhuhai 519082, China
2
School of Naval Architecture and Ocean Engineering, Jiangsu University of Science and Technology, Zhenjiang 212028, China
3
College of Information Science and Engineering, Shanxi Agricultural University, Taiyuan 030801, China
4
Engineering Center, CIMC Raffles Offshore Ltd., Yantai 264000, China
5
Southern Marine Science and Engineering Guangdong Laboratory (Zhuhai), Zhuhai 519082, China
*
Author to whom correspondence should be addressed.
Processes 2023, 11(3), 725; https://doi.org/10.3390/pr11030725
Submission received: 31 January 2023
/
Revised: 26 February 2023
/
Accepted: 27 February 2023
/
Published: 28 February 2023
(This article belongs to the Topic Latest Developments in Fluid Mechanics and Energy)
Abstract
:Semi-submersible offshore platforms play a vital role in deep-sea energy exploitation. However, the vast waves threaten the platform’s operation, usually leading to severe consequences. It is essential to study the wave-slamming mechanism of offshore platforms under extreme wave conditions. Existing research usually simplifies the offshore platform slamming problem. This paper establishes a model of a semi-submersible platform and a flexible mooring system in a numerical pool by means of the computational fluid dynamics (CFD) method. The distribution and the sensitivity of the slamming load on columns and deck in waves were investigated, and the model was verified through the basin test. Firstly, based on the Reynolds-averaged Navier–Stokes model, this study considers the volume-of-fluid method to track the free liquid level. After the column and floating body grid are locally refined, the slamming load under extreme regular wave impact is measured by measuring points on the column and deck. Then, the slamming experiment of the semi-submersible was carried out in the basin. The experiment model with a scale ratio of 1:100 was established to investigate the platform’s motion and slamming loads under extreme regular and irregular waves. The findings indicate that the slamming load at the junction of the column and deck significantly increased, exhibiting a ‘double-peak’ phenomenon at the middle of the column. The maximum pressure of slamming at the top of the column demonstrated an inverted U-shaped distribution, with negative pressure occurring after the peak value, indicating a pronounced oscillation effect.
1. Introduction
For the past few years, the development of deep-sea oil and gas resources has led to stringent technical requirements for ‘marine floating equipment’, particularly in the case of floating platforms for deep-water drilling. Researchers have conducted extensive studies on the vibration impact problems of offshore platforms by applying experimental and numerical methods. However, there are still limited engineering applications that require accurate prediction of the magnitude and distribution of deck wave loads and the resulting motion response of floating structures.
Many early essential research articles on wave slamming on offshore decks focused mainly on studies of simplified deck boxes or plates. Wang [1] combined the theoretical and experimental studies and proposed a simple formula for the lift pressure under the flat plate in different wave sea conditions. Elghamry [2] concluded that the peak pressure of the slam pressure under the bridge deck plate showed a Gaussian distribution, and the peak lift showed a Rayleigh distribution. Greco [3] combined numerical values with experiments to study the process and load of waves on deck. The study showed that the two-dimensional potential-flow model was sufficient to effectively estimate the load of green water, and the air cushion effect was also taken into account. Greco [4] studied the bottom-slamming phenomenon of very large floating structures and solved it with two-dimensional potential-flow theory. High-stress levels would affect the local integrity of the structure. Faltinsen [5,6] pointed out that the study of slamming should be combined with structural mechanics to find the time scale of the physical effects associated with the impact. When the percussion time is very short and close to the natural period of the structure, the details of the hydromechanical effects are less important. In addition, Yan [7,8] carried out numerical and experimental studies of fluid–structure interaction (FSI) in the water entry process of flat plate and wedge structure and discussed the uncertainty of pressure and strain in detail. Tavakoli [9] proposed a strongly coupled FSI model to study the water entry process of elastic hard-chine sections. These FSI studies lay a foundation for the further study of FSI of floating offshore structures.
The theoretical analysis of wave slamming on the deck of an offshore floating platform was compared with the measurements of Kaplan et al. [10] and concluded to agree.
However, for large-scale three-dimensional structures, the complexity of their design and motion can lead to structures below the deck, such as columns and floats, affecting the magnitude of the forces on the upper deck structure and their distribution. For example, for analyzing a multi-column platform represented by a conventional tension-leg platform, wave diffraction and radiation effects due to hydrodynamic interactions between columns and floats can increase wave elevation and affect the lower deck locally. Scharnke and Hennig [11] investigated the impact of column structure on the wave loads applied to the box deck by adding a box deck structure to square columns. It was found that the columns had a significant effect on the magnitude of the overall vertical force and local pressure, mainly in the form of a substantial increase in load intensity. In the case of columns, the peak wave force on the deck increased to more than twice the maximum load without columns. Abdussamie et al. [12,13,14] conducted a series of model tests on a simplified tension-leg platform deck model. The analysis of the overall platform forces and the local forces concluded that reducing the height of the hydrostatic air gap of the platform significantly increases the overall platform deck forces. However, for the local forces, only some pressure monitoring points on the platform deck have an increased load.
Researchers have conducted several studies on air gaps and slamming loads on offshore platforms. Stansberg et al. [15] simulated the wave height and air-gap response near the columns of a semi-submersible platform based on the WAMIT potential-flow software. Kazemi and Incecik [16] utilized the direct boundary element method and weighted-residual method to analyze the air gap of a semi-submersible platform and investigated the effects of structural motion and wave steepness on the air gap. Iwanowski et al. [17] compared theoretical studies with experimental results using ComFLOW software to analyze the air-gap variation of an offshore platform. Li et al. [18] examined the air-gap values under severe environmental conditions of a semi-submersible platform comprising twin floating vessels and multiple columns by investigating the relative distance between the deck and wave surface. Matsumoto et al. [19] proposed a completely nonlinear method for calculating the air-gap response and distribution for a semi-submersible with a large water plane. Liang [20] predicted the air gap of a mooring/positioning platform with DeepC commercial software integrated with the volume-of-fluid (VOF) method. Sweetman et al. [21] forecast the air gap of an offshore platform by considering the second-order nonlinearity of waves using WAMIT software, which is a more accurate approach than the linear theoretical results, mainly when the wave height is considerable. According to the potential-flow theory method, the air-gap distribution of a floating platform can be quickly obtained by calculating the heave gap between the wave surface and the deck, which can effectively predict the platform air gap and calculate the slamming loads on the platform.
All above studies should be noted that the potential-flow theory is based on the assumption that the waves are frictionless and irrotational, does not take into account the effects of wave radiation and diffraction, and fails to capture nonlinear phenomena such as wave roll and splash that occur when the waves interact with the platform. The computational fluid dynamics (CFD) method has been frequently applied to wave-slamming problems with the development of computer technology. Kapensberg [22] summarizes a two-stage approach to solving the global response of a ship to a wave slamming, including CFD methods for a single impulse force and approximate methods for long-term simulations, but also taking into account changes in other factors during the ship’s actual voyage. Wang et al. [23] conducted numerical simulations of the three-dimensional effects of slamming loads using Reynolds-averaged Navier–Stokes (RANS) equations and VOF methods in OpenFOAM and observed that the maximum slamming-force coefficient of the three-dimensional model was lower in comparison to the two-dimensional slamming model. Luo et al. [24] applied a hybrid two-step method utilizing potential-flow theory and CFD to forecast the bow-slamming pressure during the ballast operation of a significantly large tanker sailing against waves to explore the relative-motion velocity between the bow and the waves and the distribution patterns of the slamming pressure over time. Finally, a basin test was conducted to verify the reasonableness and feasibility of the hybrid two-step method.
Combining the potential-flow theory with CFD methods and validating numerical calculations with basin-model tests is a viable approach for studying wave slamming. However, most current numerical studies have simplified the numerical model by reducing it to the interaction of a flat plate and a wave or by fixing the platform in a numerical pool with six degrees of freedom, which constrains the fully coupled numerical simulation for semi-submersible platforms comprising mooring systems.
In addition, the basin test with the physical model is a reliable method for studying wave–structure interactions. Smith et al. [25] derived an equation for the impact-force coefficient from a flat plate impact with a wave. Still, they ignored the compressibility of air, the compressibility of water, and surface tension. Furthermore, in the experiments, it was observed that the high-velocity jets generated by the impact had a fine droplet structure caused by the shock wave in the water. Kisacik et al. [26] studied the load distribution on a vertical structure suspended from a horizontal cantilever plate under severe wave impact. The slamming forces showed irreducibility even when the wave conditions were identical. Moreover, the presence of horizontal structural elements exposed the vertical structure to more intense wave impacts. Mai et al. [27] designed a test on a square plate impacting a pure aerated-water surface, which showed a significant pressure reduction in the first phase of the pressure. Santo et al. [28] conducted two sets of deck wave load tests and showed that for wave-slamming loads on the deck, a single pressure peak was characterized by a structural vibration. Ha et al. [29] conducted an experimental study on the bow slam-load characteristics of a floating production storage and offloading unit, in which the slam induced the motion of the model, and the position of larger slam loads varied with the change in wave incidence angle. In the tests, single- and double-peak loads resulting from the slamming were observed and related to the model’s heading. Wei et al. [30] conducted an experimental study of the spatiotemporal distribution of slamming loads in shallow water conditions and found that the air entrained during the liquid collision acted as a cushion between the free surface and the elastic wall surface. The presence of an air cushion reduced the maximum impact load on the structure but increased the impact duration. The physical model of the basin tests allowed the wave impact on the flat plate to be directly observed; however, the distribution characteristics of the slamming pressure on the column of the semi-submersible remain to be investigated.
This study proposes an experimental program to investigate the motion response and wave slamming of an elastically moored semi-submersible platform in rough wave conditions. Accordingly, the model of the semi-submersible and its mooring system was developed using STAR-CCM+ software based on a non-constant RANS solver. The free surface was captured with the VOF method, and the slamming loads were measured by monitoring points established on the front column. Slamming-load characteristics were investigated and compared with the experimental results. The distribution of the slamming pressure on the column was demonstrated by comparing a moored platform to a fixed one. Furthermore, experimental and numerical calculations have been used to reveal the distribution characteristics of the slamming loads and their variation in wave conditions.
2. Simulation Method
The control equations for numerical simulation are expressed as the continuity equation (mass conservation equation) and the N–S equation (momentum conservation equation), as shown in the following equations.
This is Example 1 of an equation:
is the velocity component along the direction of the coordinate, represents the pressure, represents the fluid density, and means the mass force.
The Reynolds-averaged method was used to solve the Navier–Stokes equations by splitting the turbulent flow into an average-flow term and instantaneous-flow term and decomposing the transient variables in the equations into two parts—time-averaged and pulsation—as shown in the following equation.
represents the time-averaged quantity, and represents the transient quantity.
Thus, (1) and (2) can be expressed as Equations (4) and (5), respectively, after time-averaging.
The Reynolds stress is represented by , and the term is used as an unknown quantity.
The controlled return of the flow field is discretized using the finite volume method. The convection and diffusion terms are discretized through the second-order upwind scheme, and the conservation equation is expressed as Equation (6).
Based on the Gaussian dispersion formula, Equation (6) is transformed as follows:
The physical meaning represented by the four terms in Equation (7) can be expressed in the following form:
The Reynolds stress equation in the RANS equation is not closed. The time–homogenization process results in the loss of partial flow details. Therefore, the turbulence model must be added to close the RANS equation. In this paper, the SST k–ω model that combines the features of the mode and k–ω model was selected as the turbulence model for numerical simulations. The SST model has the advantages [31] of the k–ε model for far-field turbulence simulation and the k–ω model for near-wall turbulence simulation, and we refer to the turbulence model used in the literature [32] to study the wave impact of a floating wind turbine, we finally choose to use the SST k–ω model. The definition of its turbulent viscosity is shown in Equation (9):
Equations (10) and (11) are the transport equations corresponding to and :
where , , , , and .
Finally, by coupling pressure (P) and velocity (V), the Semi-Implicit Method for Pressure-Linked Equations (SIMPLE) algorithm is used to modify the pressure and velocity fields. The core of the SIMPLE algorithm is the continuous guesswork correction of the calculation history with the help of the base grid, which ultimately solves the momentum equation.
The mesh-tracing method simulated the free liquid surface during the numerical simulation. The free surface tracking method uses a dynamic mesh technique to form the mesh into the desired free surface shape to satisfy the free surface’s equations of motion and dynamics.
The kinematic conditions are shown in Equation (12).
ζ represents the wave height.
For the kinematic conditions, the free liquid surface deformation is considered minor, and the free liquid surface tension is zero. Then, the mathematical equations for pressure and tangential velocity are given by Equations (13) and (14).
Obtaining a stable and effective free surface shape is a unique advantage of the VOF method, which is more suitable for wave surfaces with a significant degree of nonlinearity, such as wave breaking. In addition, the grid is also stable, making it easy to control the quality of the grid.
The primary step of the VOF method is to calculate the grid volume of the target fluid. Let the volume fraction of the qth fluid in the grid cell be . The following three scenarios are included: Firstly, the grid cell contains no fluid of term q; Secondly, the grid cell contains the qth fluid and the other fluids; Thirdly, the grid cell contains only the qth fluid.
Additionally, the volume fraction of each fluid should satisfy the following equation.
The partition interface between each fluid is determined by solving the continuity equation for the volume fraction; the continuity equation for the qth fluid is Equation (16).
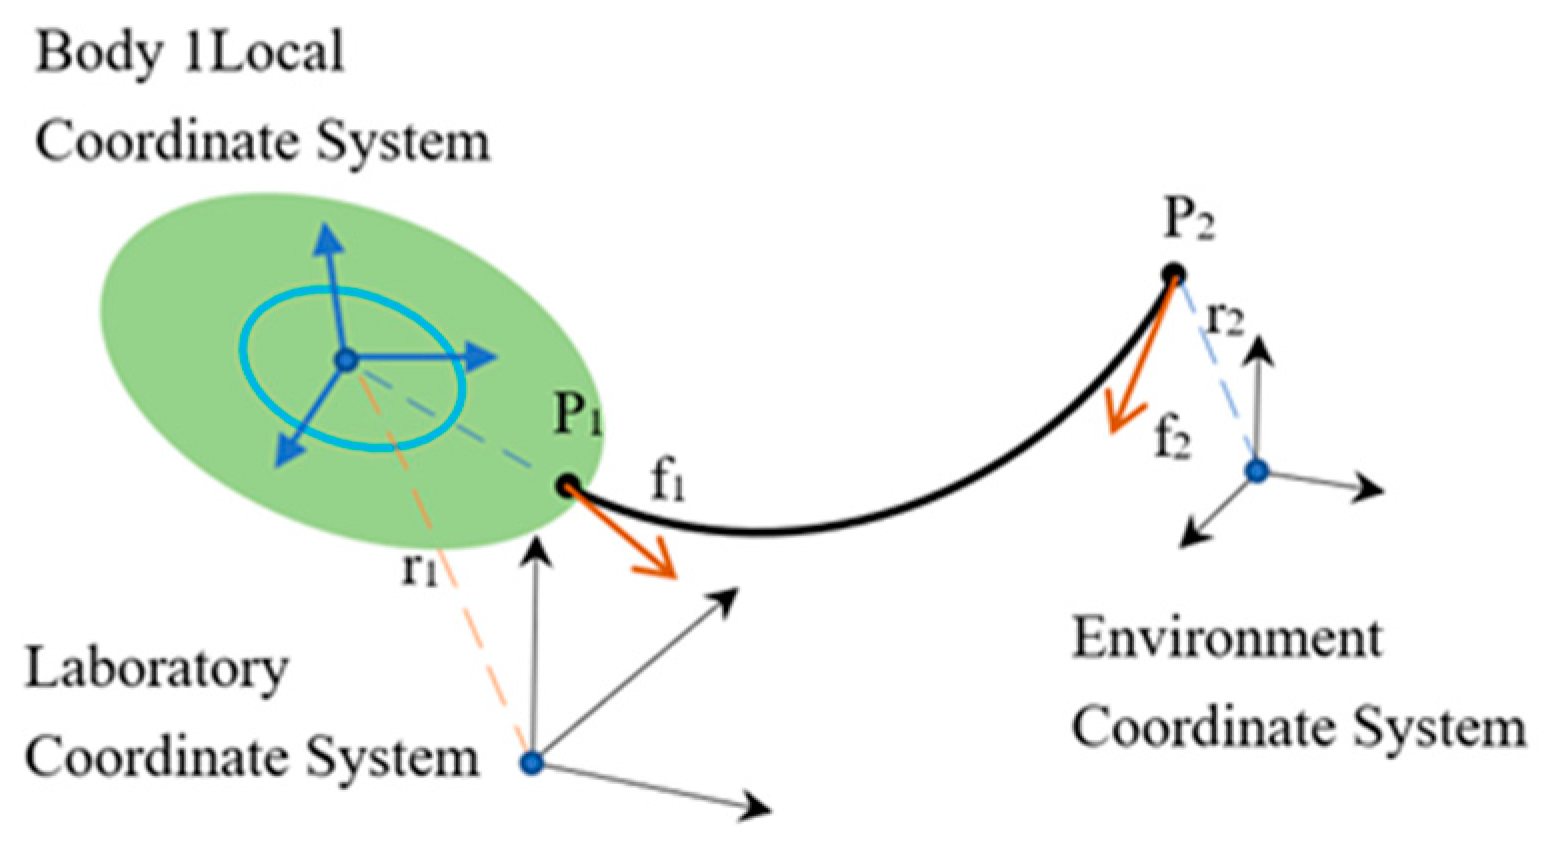
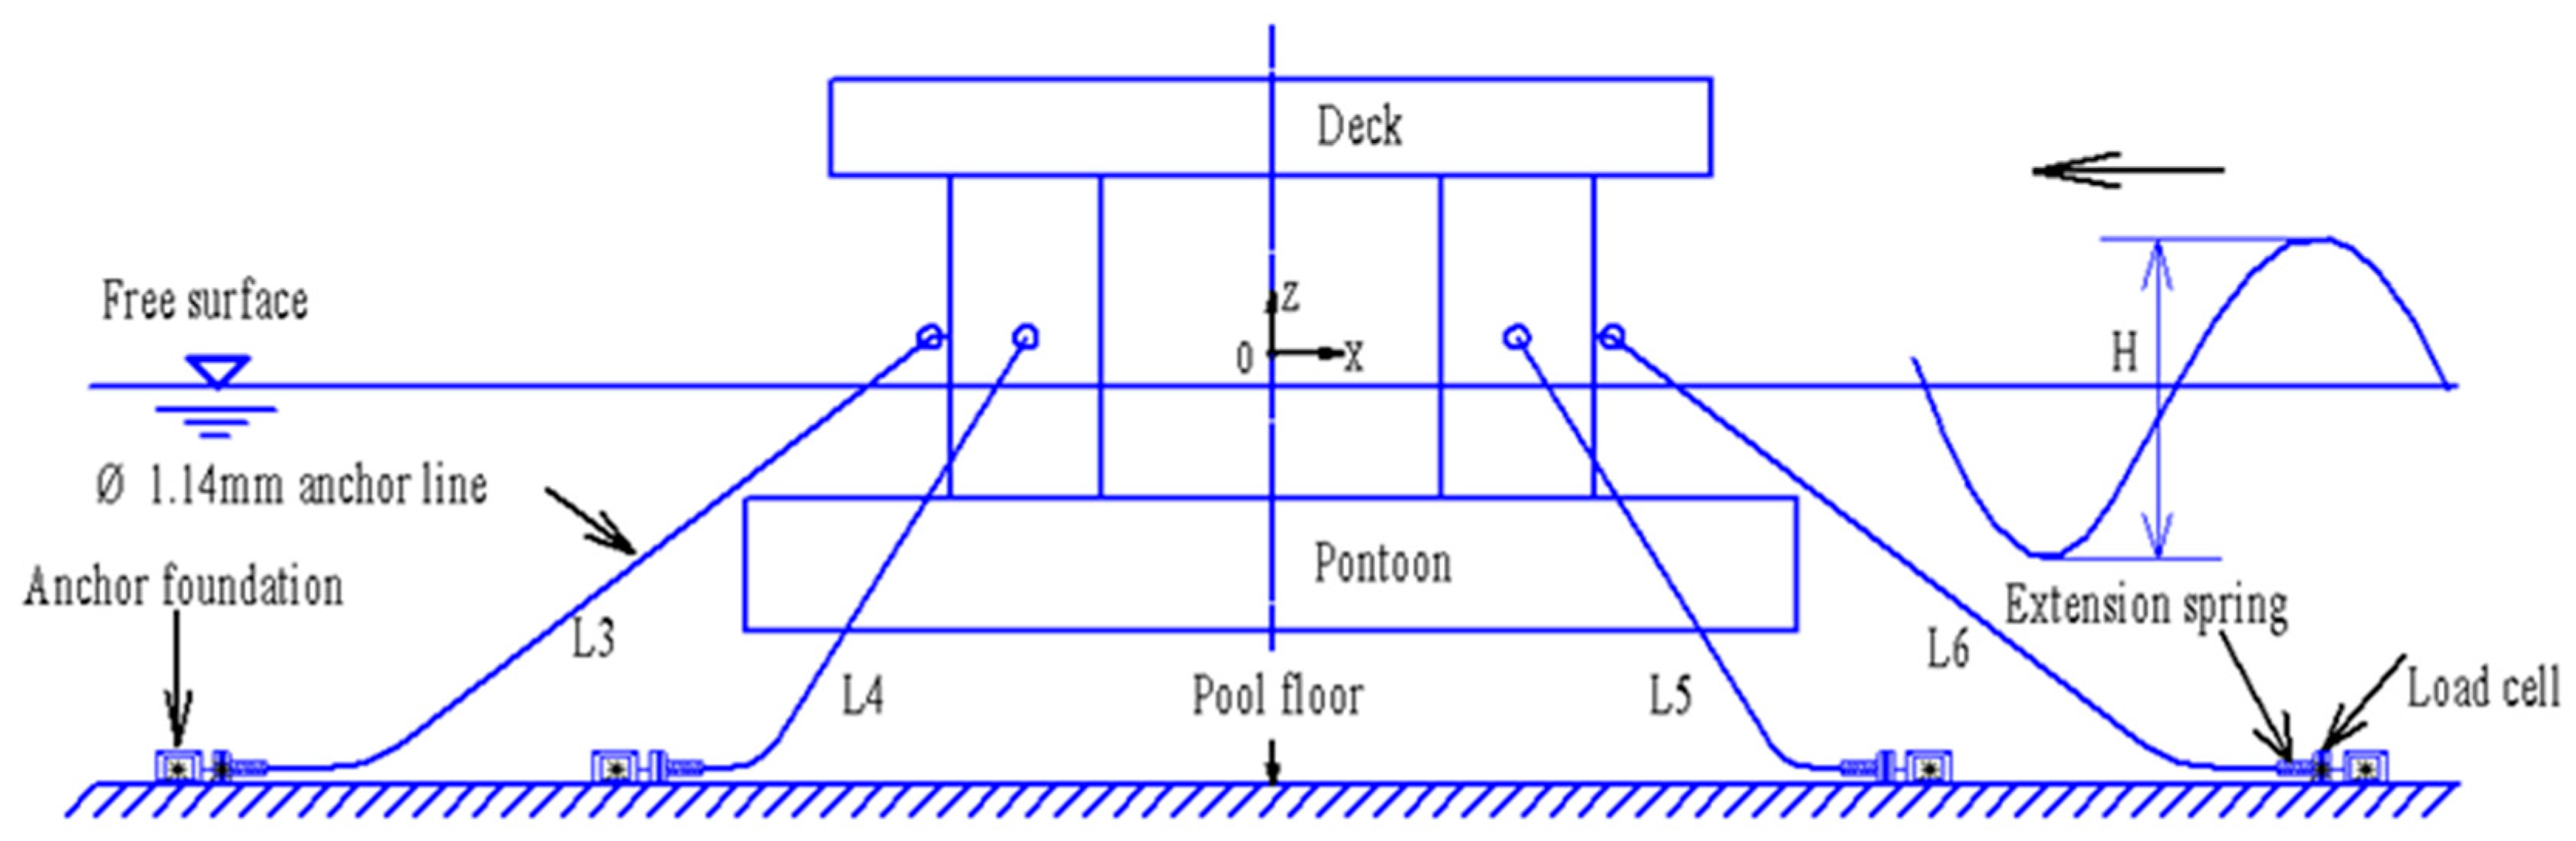
The catenary coupling element, as shown in Figure 1, can direct the force of the suspended mooring line to the semi-submersible platform in the time domain. Its coupling unit can be coupled between two floating bodies or between a floating body and the seabed.
where g is the gravitational acceleration, is the mass per unit length, is the stretchable length of the catenary under free conditions, is the stiffness of the catenary, and α and β are integration constants.
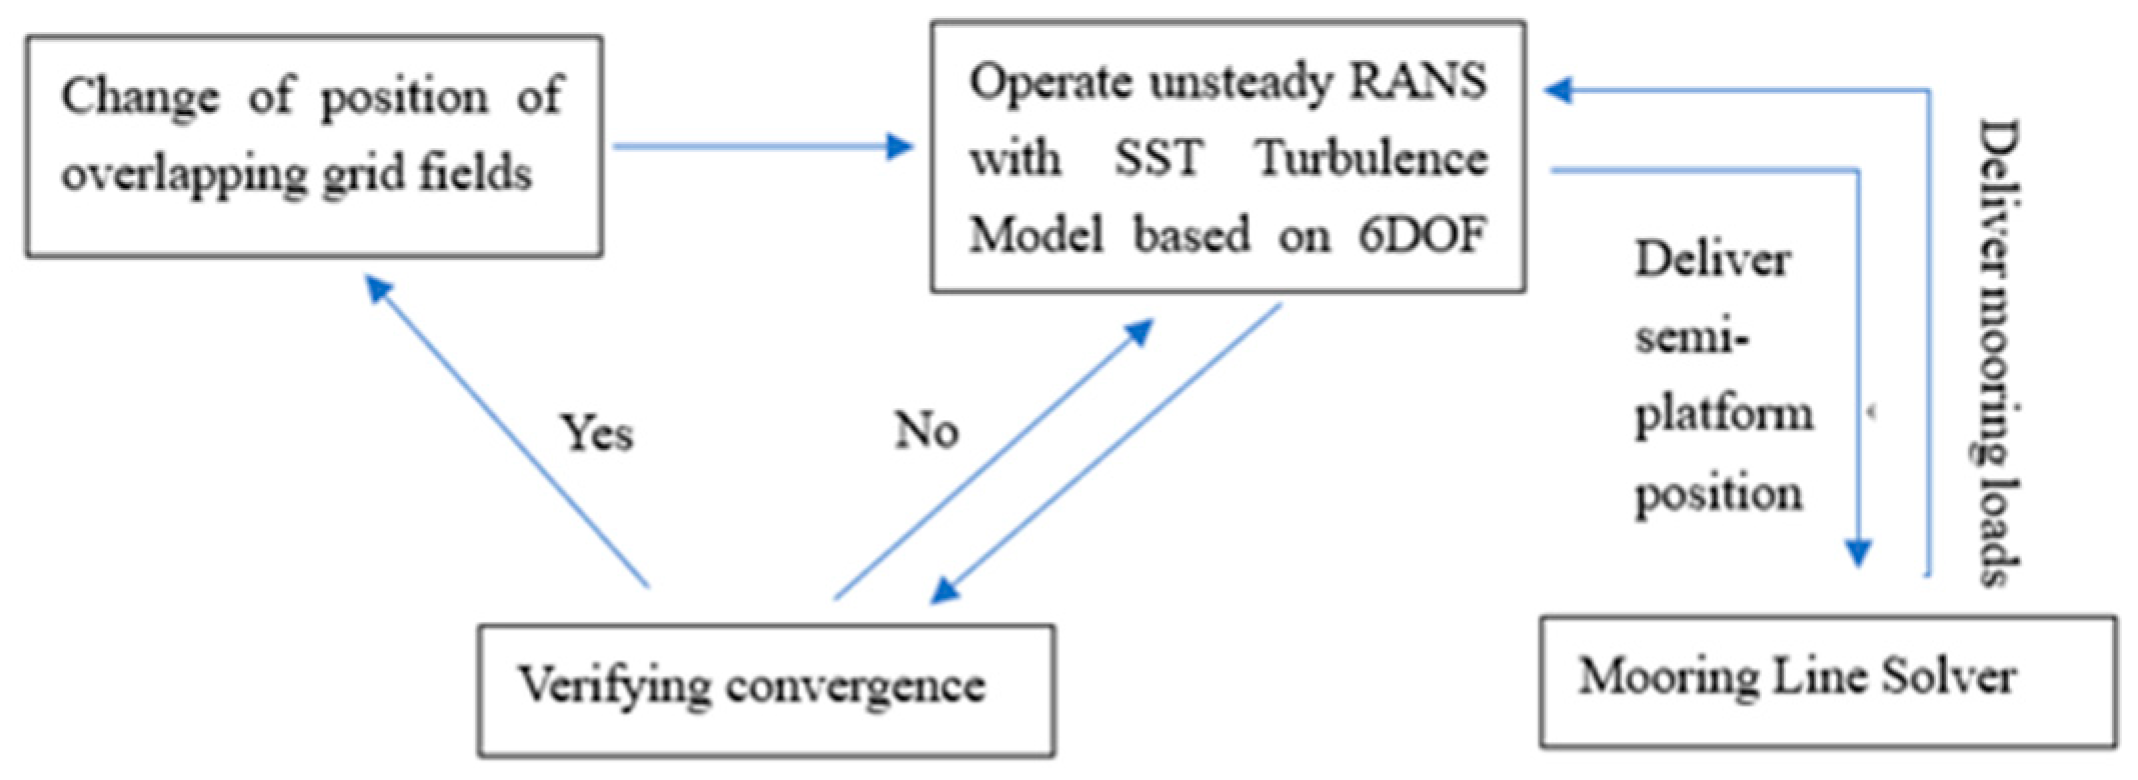
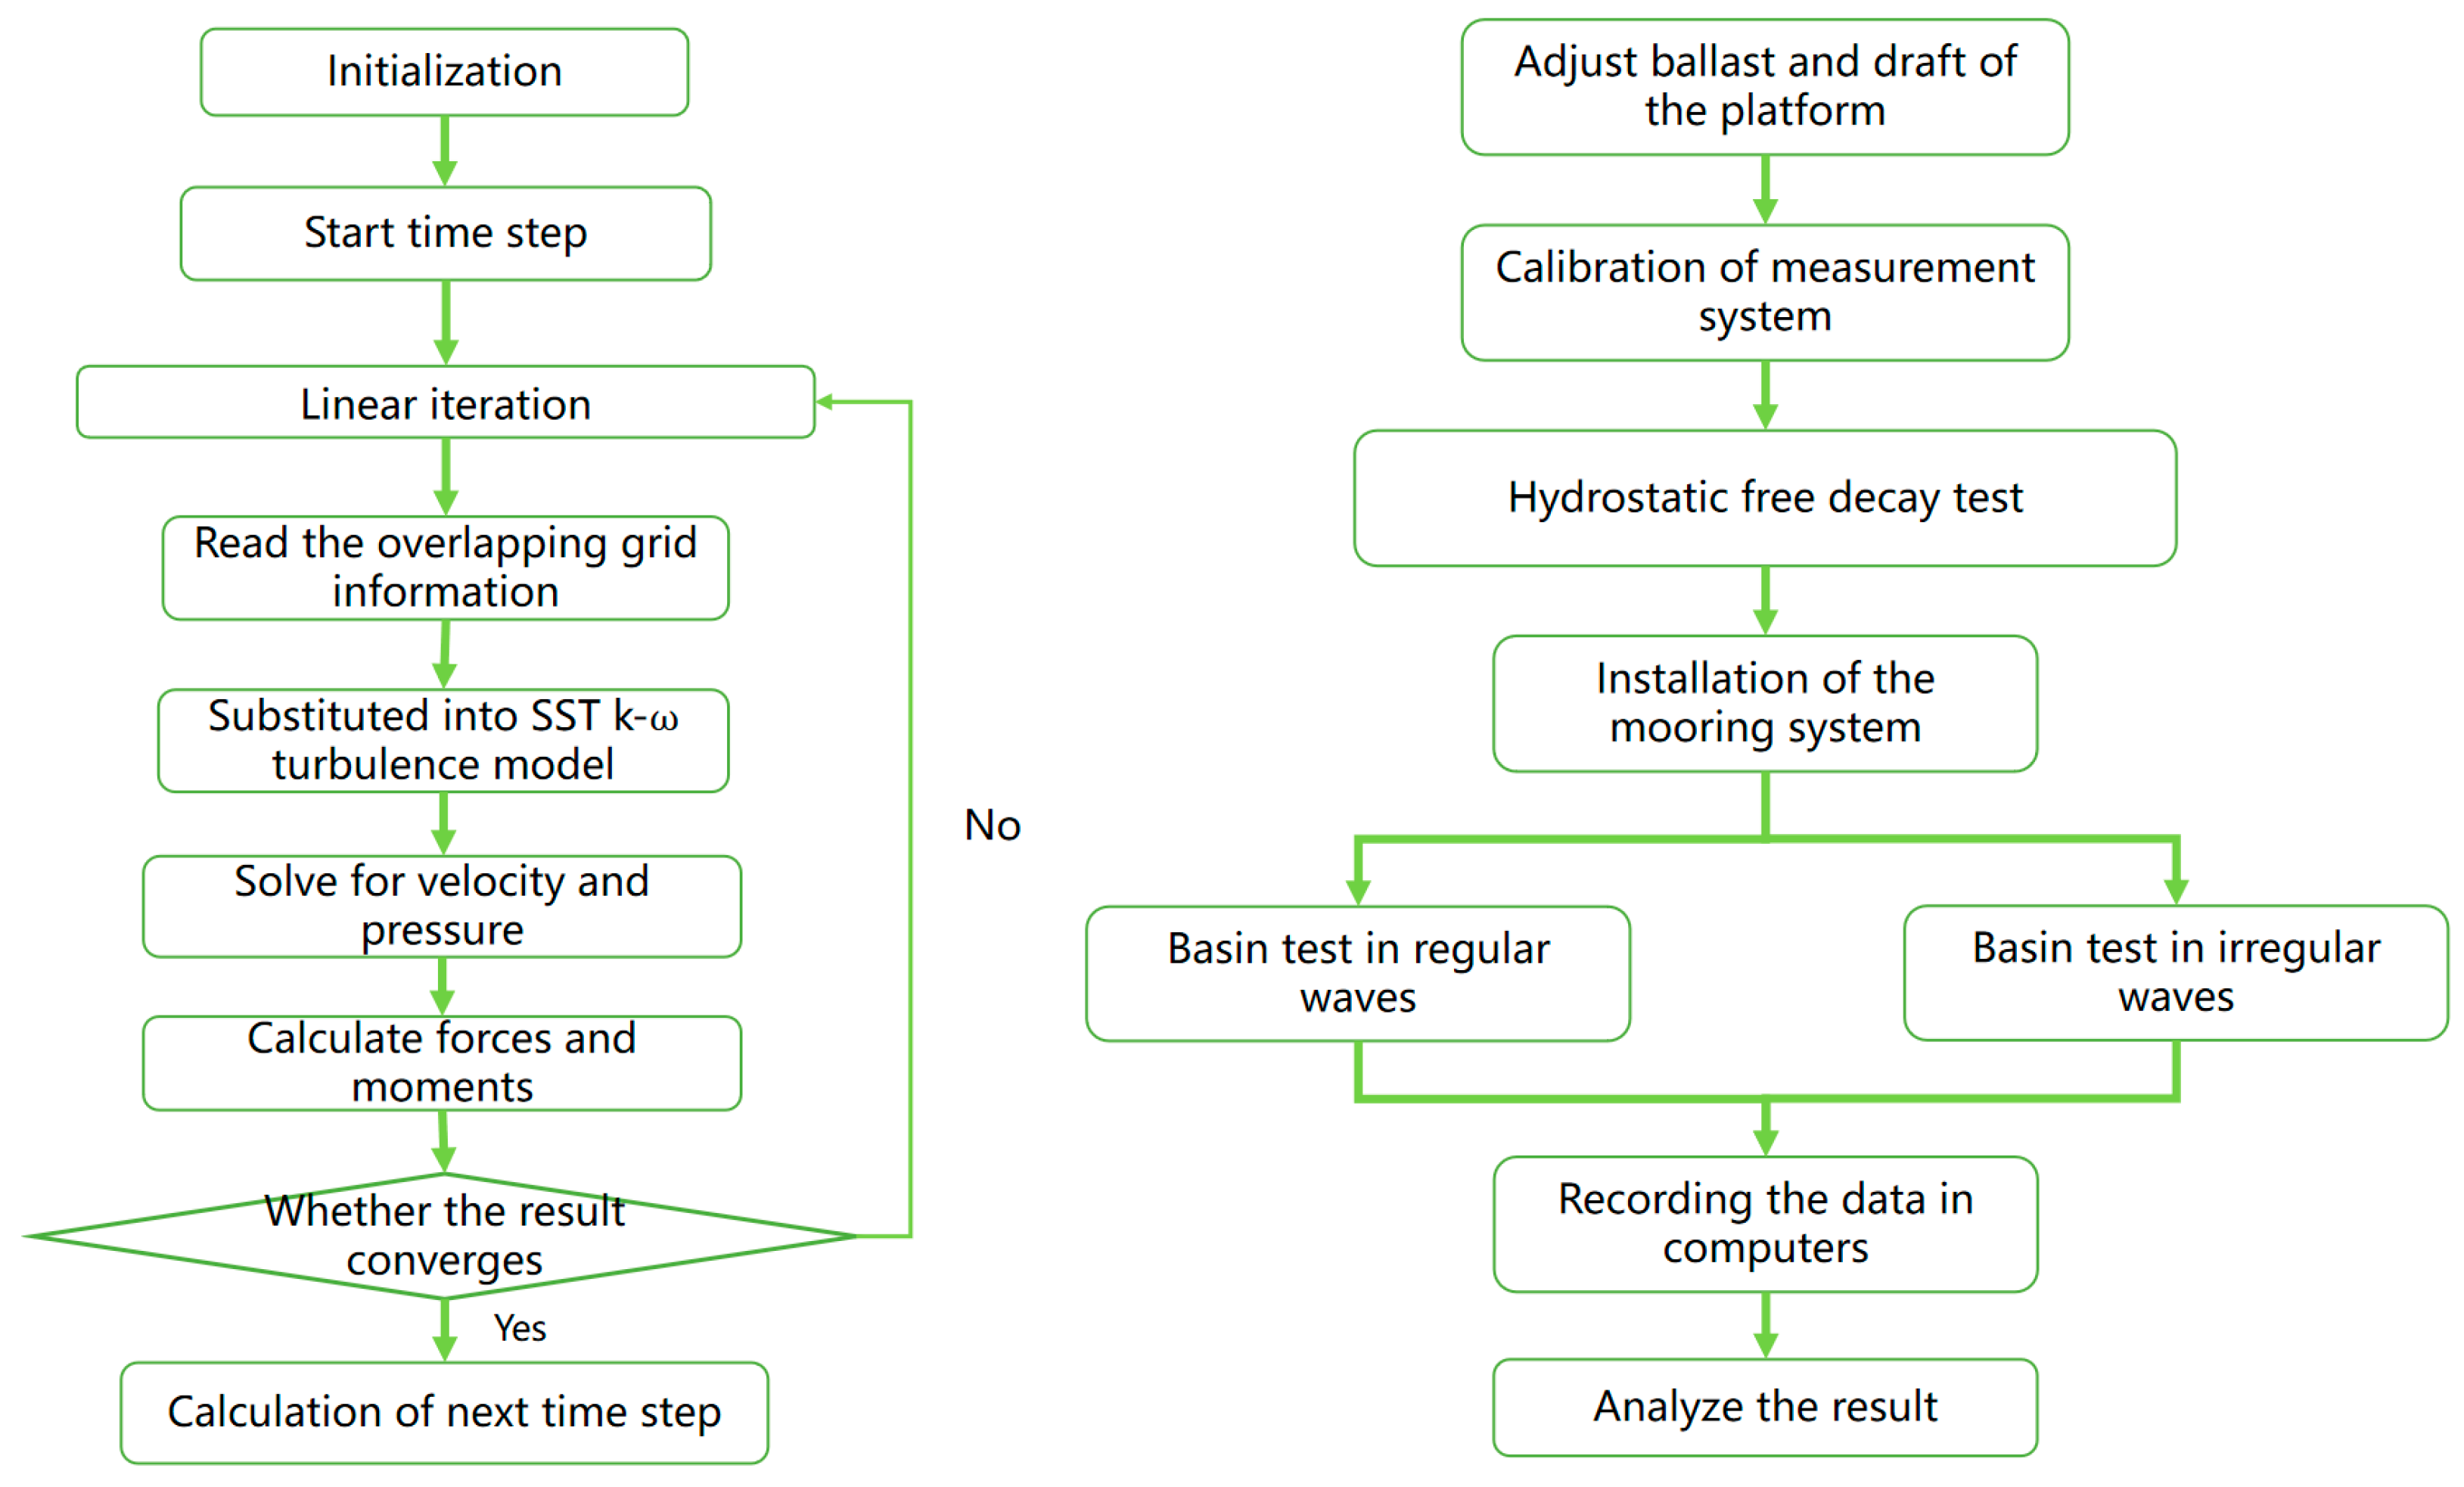
The 6-DOFs VOF solver (CD-adapco, 2014) is applied to obtain the new positions of the platform and the joystick using the tension of the fluid and the dynamic load on the floating platform. As a result, the new positions of the platform and the cable guide are obtained. Mooring inertia and damping are not considered in this study. The operational procedure is shown in Figure 2.
3. Experimental Program
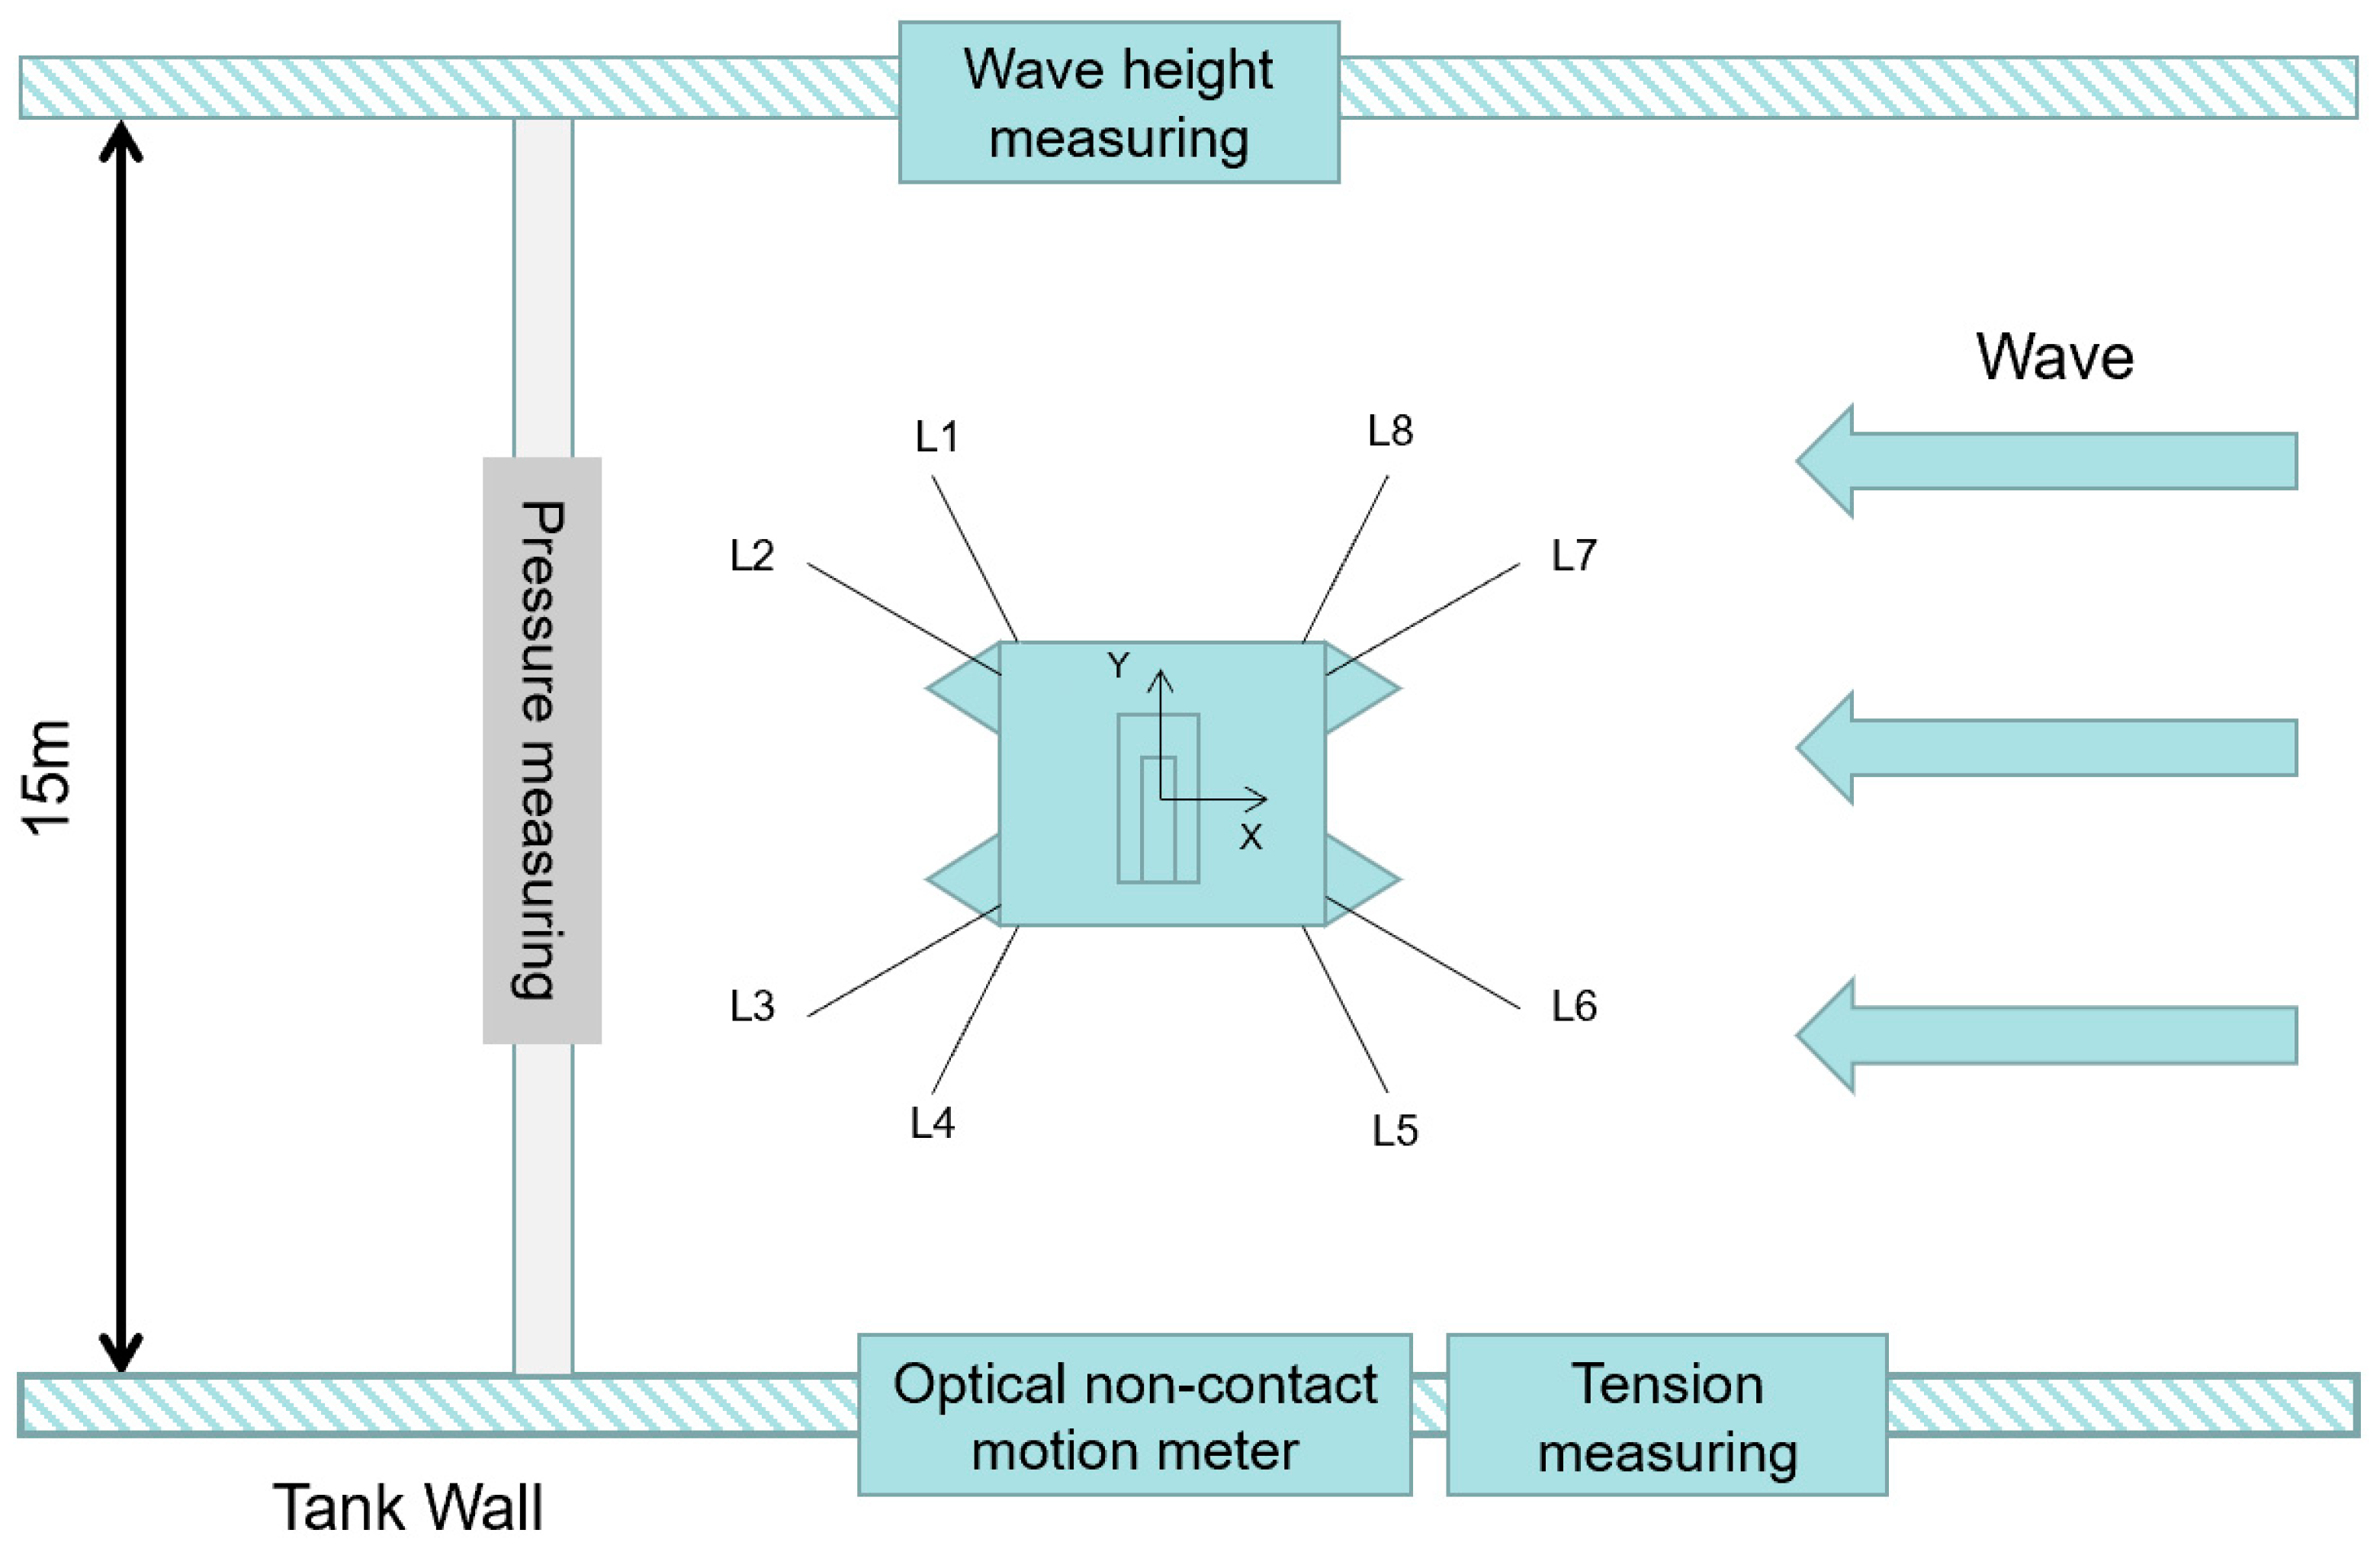
The model tests were conducted at the Jiangsu University of Science and Technology integrated wind and wave current pool, which is 38 m long, 15 m wide, and 1 m deep. The integrated pool is equipped with a piston wave maker for generating regular and irregular waves of different wave spectral properties. In addition, the downstream end of the integrated pool is installed with a wave-absorbing beach, constructed of wave-absorbing materials, to eliminate reflected waves effectively. To study the degree of interaction between the response of the platform and the wave characteristics, wind, and currents are not tested in the working conditions.
3.1. Model and Parameters
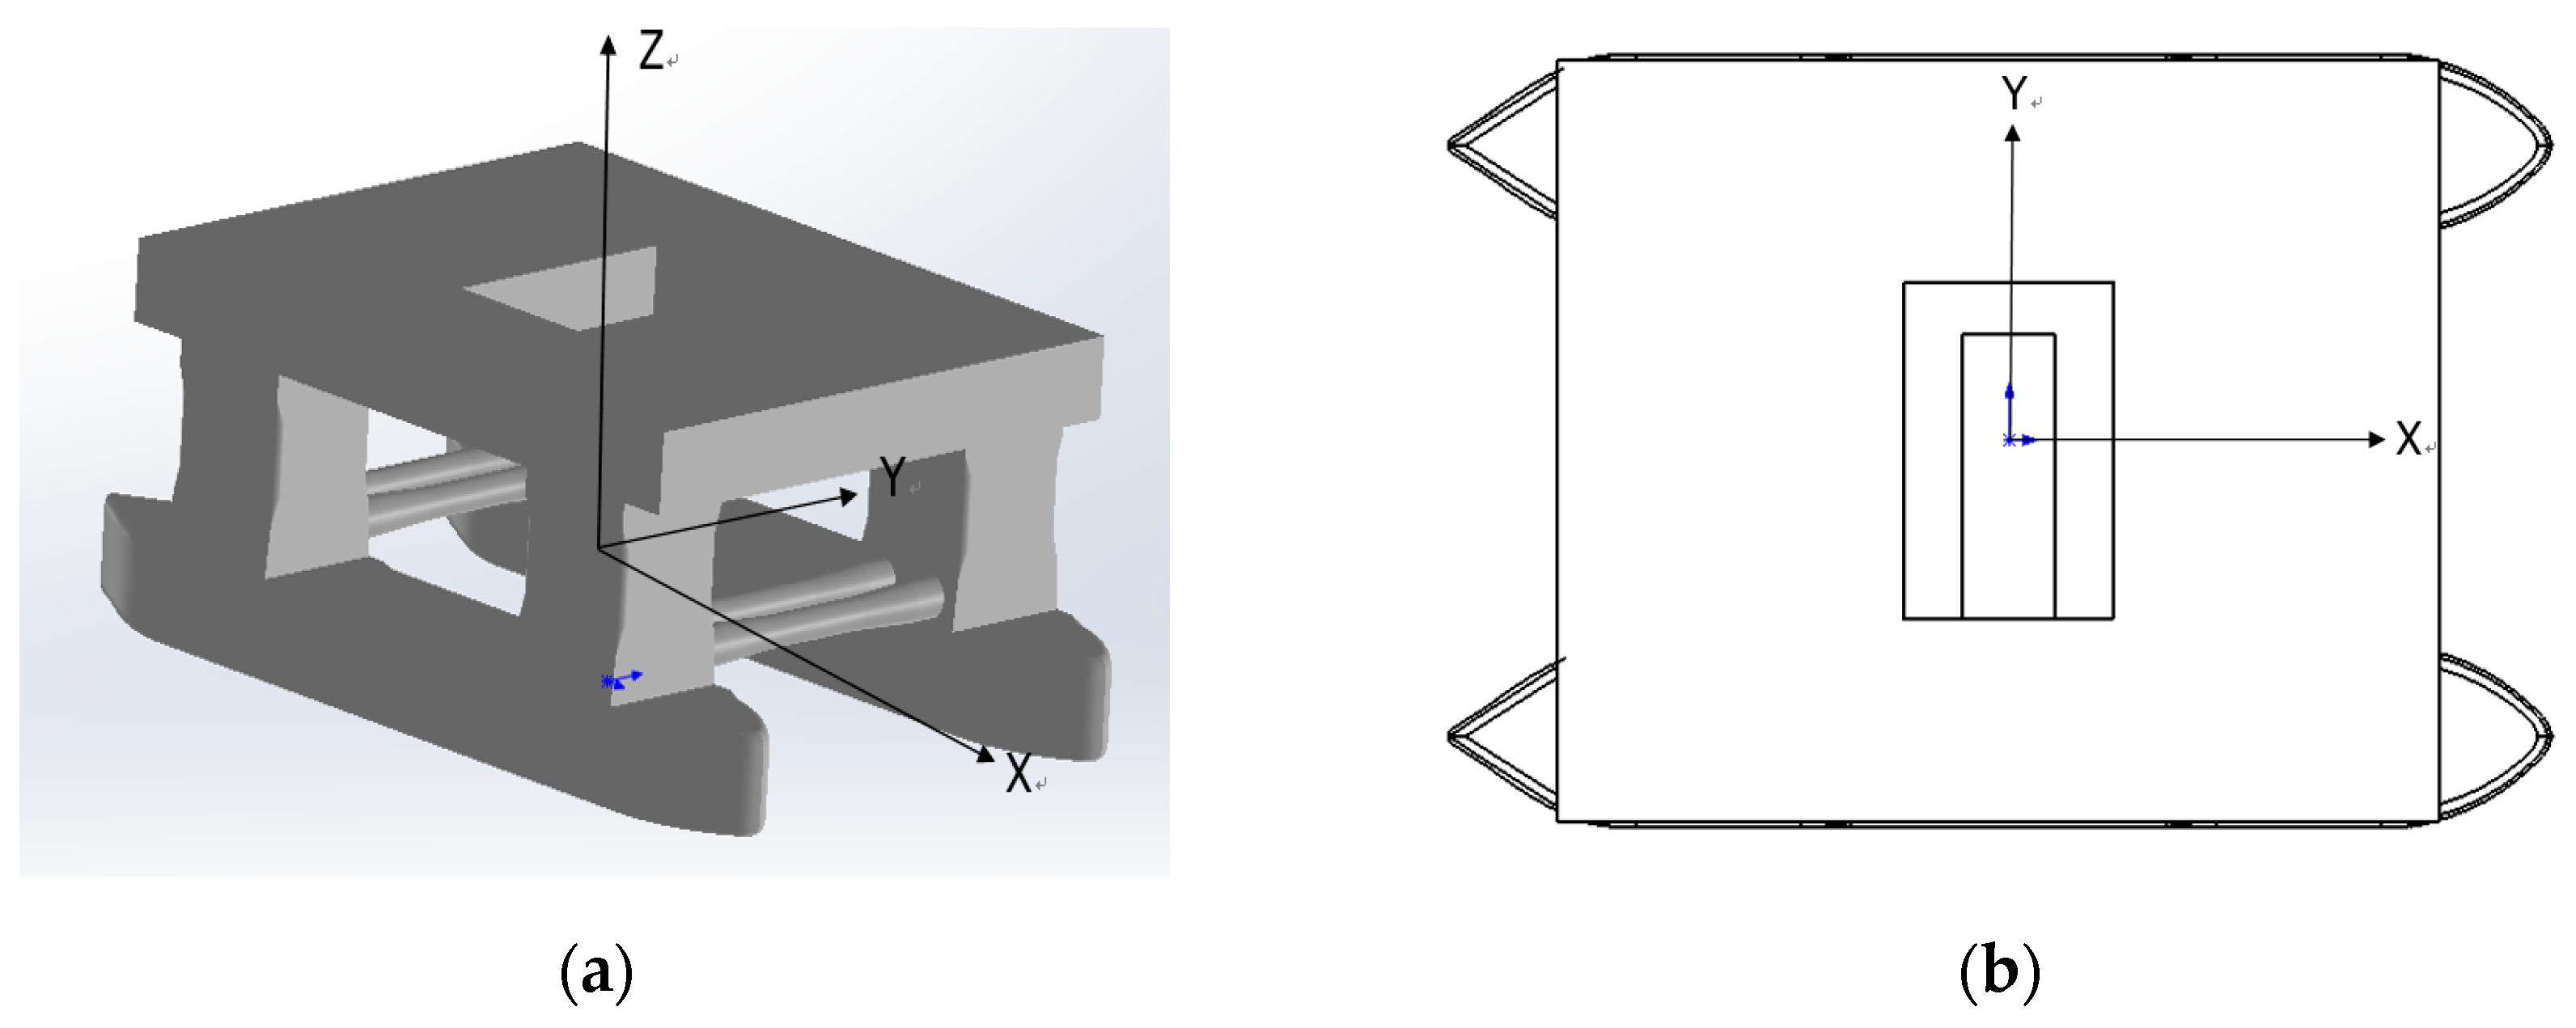
The 1:100 scaled semi-submersible platform model was determined by combining the prototype scale, test facility and environment, and the Froude number. The main parameters of the model at full scale and model scale are given in Table 1. The semi-submersible platform is a typical twin floating body with four columns with a small water plane under survival conditions, making it more sensitive to heave response. The model is made of fiber-reinforced plastic, which has the advantage of lower density and deformability while simultaneously being more robust and easier to drill for installing pressure sensors. Figure 3 shows the coordinates and top view of the model.
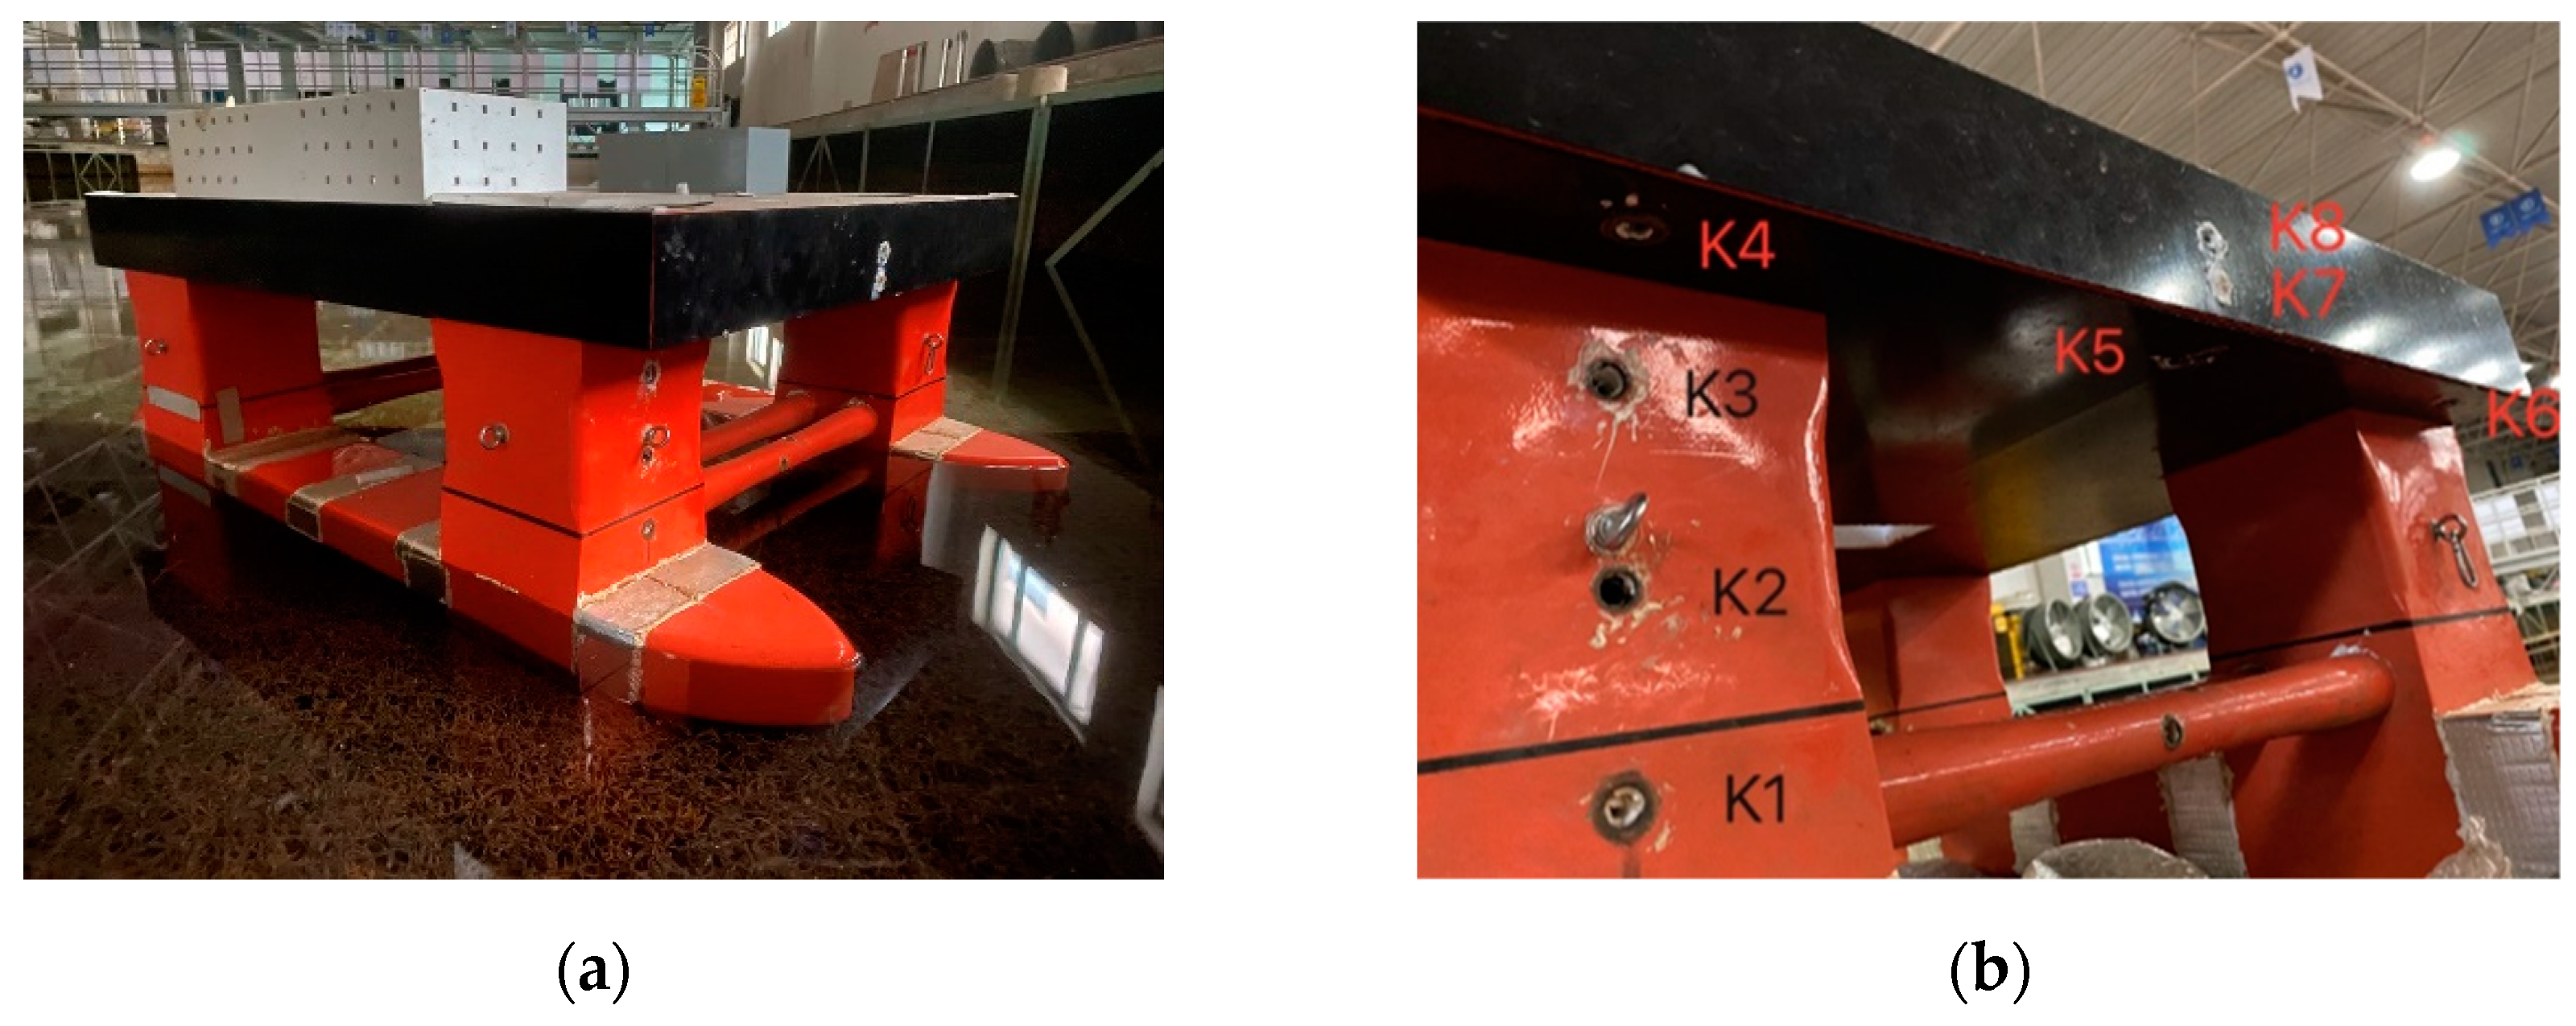
In the test, we used pressure sensors to measure the slamming load. The sampling frequency of the CY200 series digital pressure sensor was 1000 Hz. In order to avoid interference when waves slam the model, only the head of the pressure sensor contacted the liquid, and the other parts were hidden in the holes drilled on the column and deck, which were the pressure measuring points, as shown in Figure 4b. At the same time, in order to maintain the waterproof performance of the model, the measuring point is sealed with adhesive. On one side of the basin, the movement of the model in different directions was recorded in real-time using a Qualisys Oqus six-degree-of-freedom measuring instrument with a sampling frequency of 180 Hz. The change process of motion, pressure, and other curves with time was recorded in the computer software. Table 2 and Table 3 show the working conditions in the test.
3.2. Mooring Systems
This study designed a flexible mooring system for a semi-submersible platform by symmetrically arranging eight high-density polyethylene mooring cables. In a realistic marine environment, the mooring cables inevitably rub against the platform’s structure and seabed due to the large movements of the platform. Therefore, a short section of the mooring chain was used at the platform guide hole and underwater anchor point contact locations to simulate this three-section design in the test altogether. Two anchor chains are installed on each column with an angle of 30° for each anchor chain. As shown in Figure 4 and Figure 5, connecting devices are installed on each column, distributed in the front and side of the column of the semi-submersible model platform. In addition, the anchor points of each anchor chain are fixed to the bottom of the tank. Finally, a tension transducer was installed between the mooring line and guide hole to measure the change in tension of the mooring system.
The mooring system parameters are shown in Table 4. In the model tests, it was challenging to ensure that the stiffness and other characteristics of the polyethylene cable used were scaled precisely according to the scale ratio used for the platform structure; therefore, we assumed an infinite cable stiffness at a scale ratio of 1:100 and simulated the stiffness of the overall mooring system by adding a spring section at the end of the cable. The anchor radius of the platform was 200 m, and the working depth of water was 100 m, corresponding to an anchor radius of 2 m and an operational depth of water of 1 m in the model test. The platform rotates 45 and 90 degrees clockwise to simulate the change in wave direction. Top-view diagram of the test model are shown in Figure 6 and Figure 7 presents thhe numerical and experimental flow chart.
4. Numerical Model
To improve the computational efficiency, control the computational accuracy, and reduce the scale effect, the scaling ratio of the semi-submersible platform model in the numerical simulation was moderately selected as 20. Numerical simulations and experiments take different proportions because a reasonably smaller computational model in numerical simulations can lead to finer meshing. Therefore, the capture of the free liquid surface is also more sensitive to the complete simulation of the nonlinear characteristics of the wave, which in turn can better simulate the slamming of the platform. The main dimensions are shown in Table 5.
This study simulates the semi-platform with 6-DOF motions such as surge, sway, heave, roll, pitch, and yaw. An efficient VOF method was used for the wave surface of the wave slam simulation of the model, and a non-stationary CFD method with a 6-DOFs solver was used for the motion part. Figure 5 shows the initial free wave surface of the semi-submersible platform and the anchor chain arrangement when it is underwater. This numerical analysis model of the semi-submersible platform includes the total mass of the floating platform and its mass moment of inertia. Therefore, the z-coordinate of this model’s center of gravity (COG) position is approximately 2 m below the wave surface.
4.1. Computational Domains and Boundary Conditions
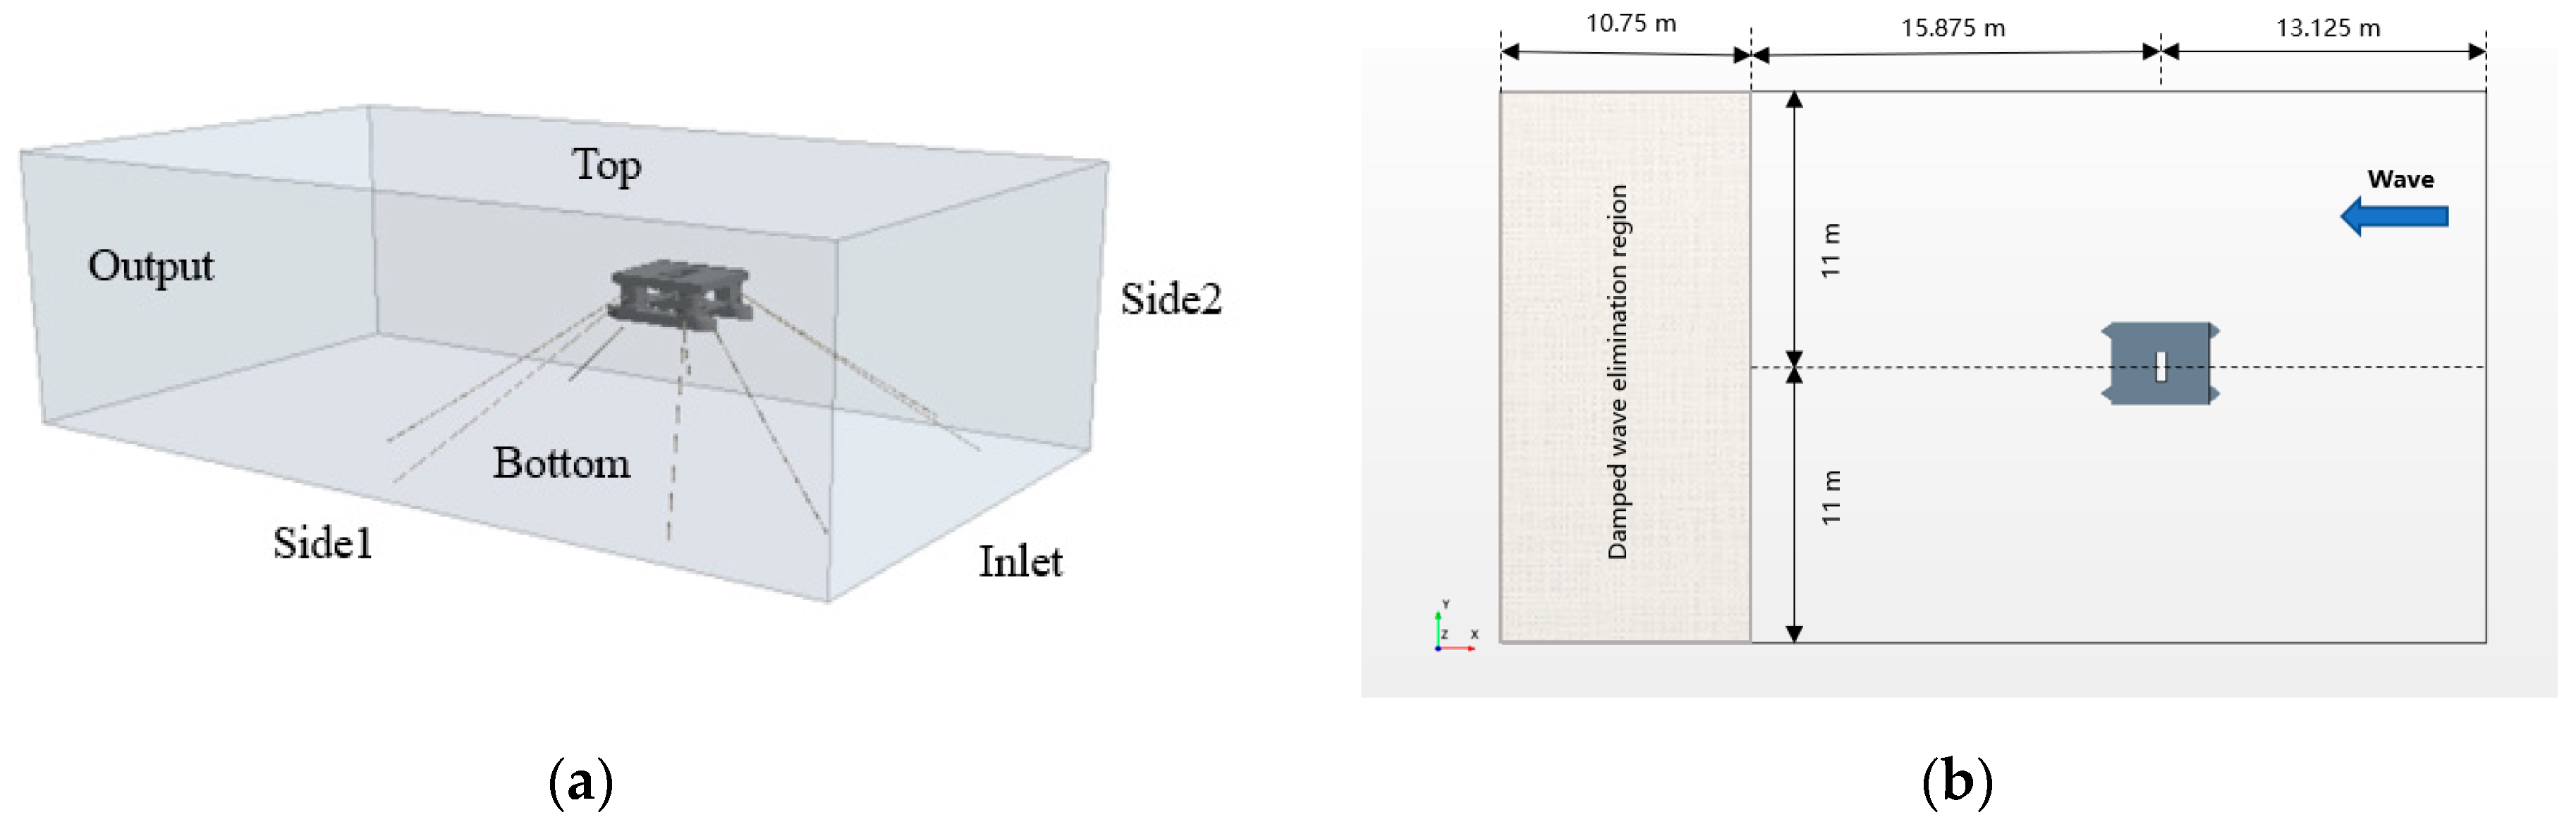
A defined boundary conditions rectangular calculation domain of 39.75 × 22.00 × 12.00 m, as shown in Figure 8, was used in the numerical calculations in this study. Set the basin wave inlet as velocity inlet and the outlet as pressure outlet.
In order to ensure the stability of the generated waves, the wave-making entrance is selected at 13.125 m in front of the platform’s center of mass, and there is a wave propagation distance of 15.875 m behind the platform. In front of the exit of the calculation domain, there is a damped wave-elimination area with a length of 10.75 m, so as to minimize the influence of reflected waves. The left and right sides of the platform are set at 11 m to eliminate the wall effect.
The free liquid surface divides the domain into two parts according to the VOF parameters, the upper part is air with a density of 1.18415 kg/m3, and the lower part is water with a density of 997.561 kg/m3. This area is a damping layer to reduce the reflection of waves at the pressure boundary.
4.2. Grid Settings
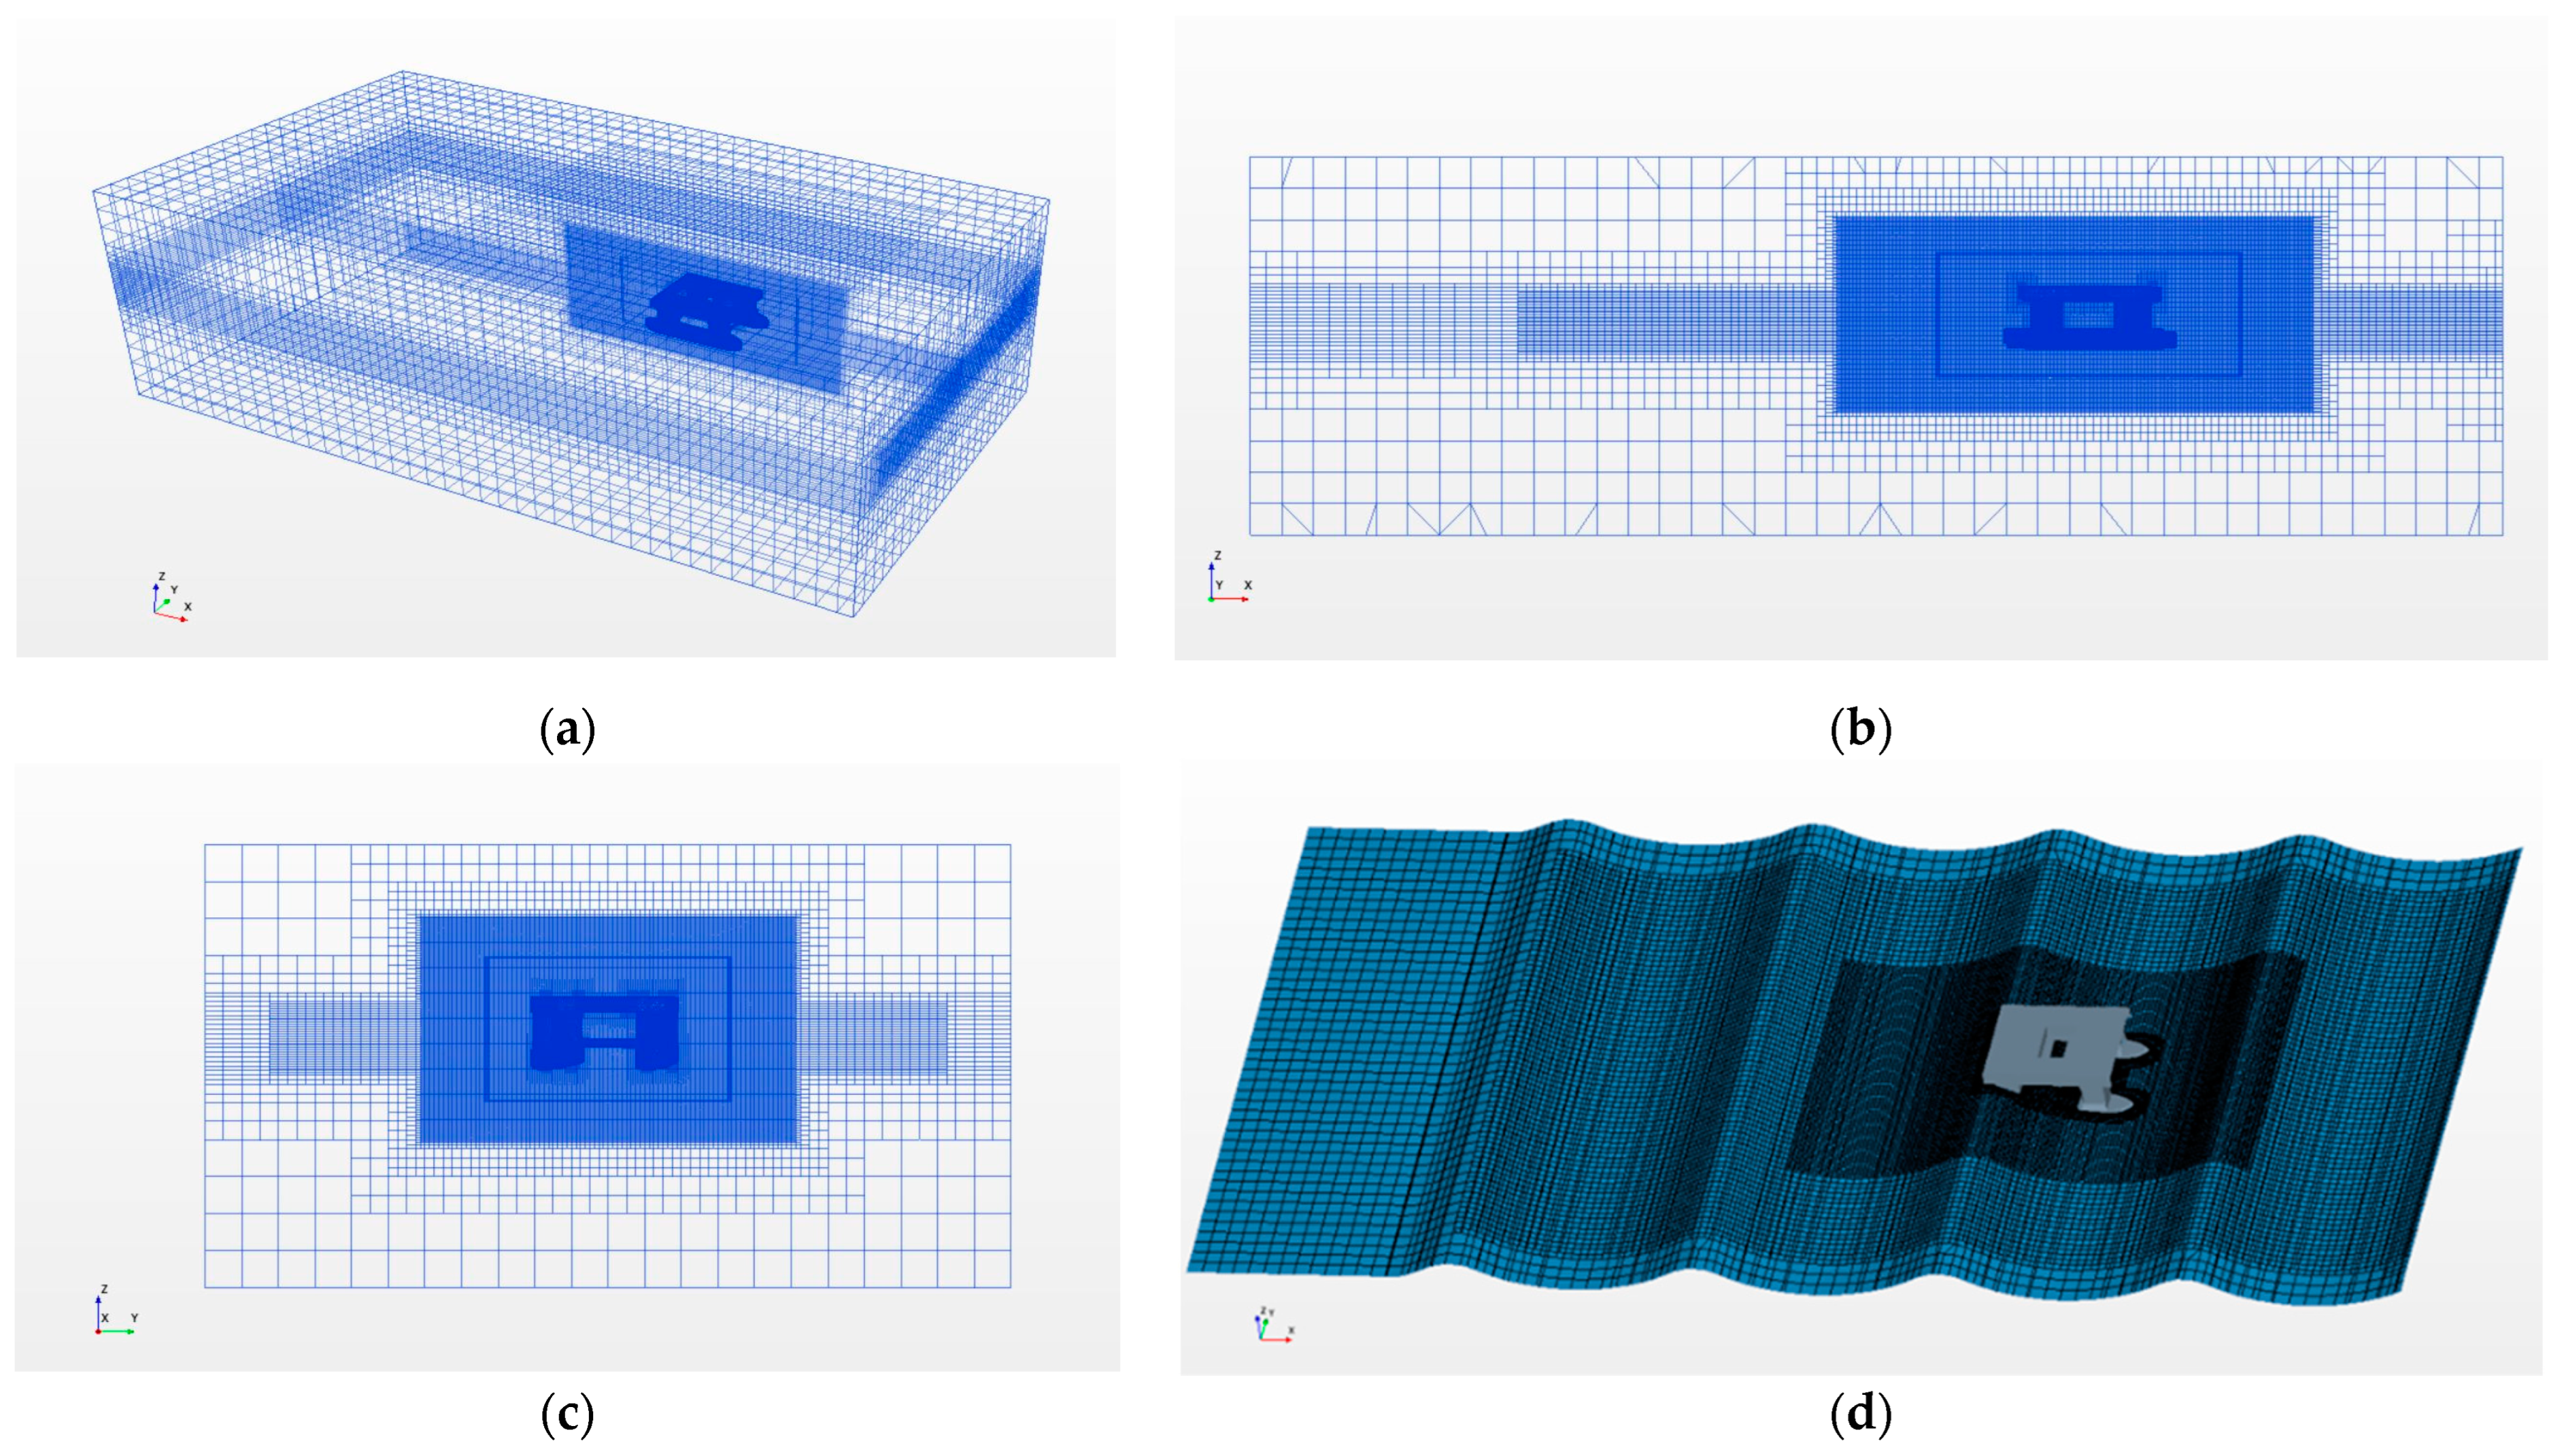
The semi-submersible platform was meshed using the overlapping mesh method in STARCCM+. Because the density and size of the grid in the wavelength direction of the free liquid surface affect the wave-transfer attenuation and the grid in the vertical direction affects the vertical motion of the wave, a prismatic layer grid was used for the free liquid surface part, and a cut body grid was used for the rest. The dense region was divided into the following features:
Firstly, Free liquid surface part: Because the most extensive wave disturbance and variation are at the free liquid surface, the pressure gradient and velocity gradient vary significantly. Therefore, it was refined in two layers—the first layer was located above and below the free liquid surface when the platform was in hydrostatic equilibrium, with 15 grids in one wave height direction and 80–100 grids in one wavelength direction for a refinement height of three times the wave height. The second layer is refined to a size of 4–5 times the wave height with three times the number of grids as the first layer.Secondly, structural region of interest: The platform surface, spar, and floating tank surfaces and the nearby flow field were encrypted to reflect the wave–structure interactions and liquid surface changes accurately. Thirdly, to capture the overall platform motion, the possible range of platform motion must be encrypted.
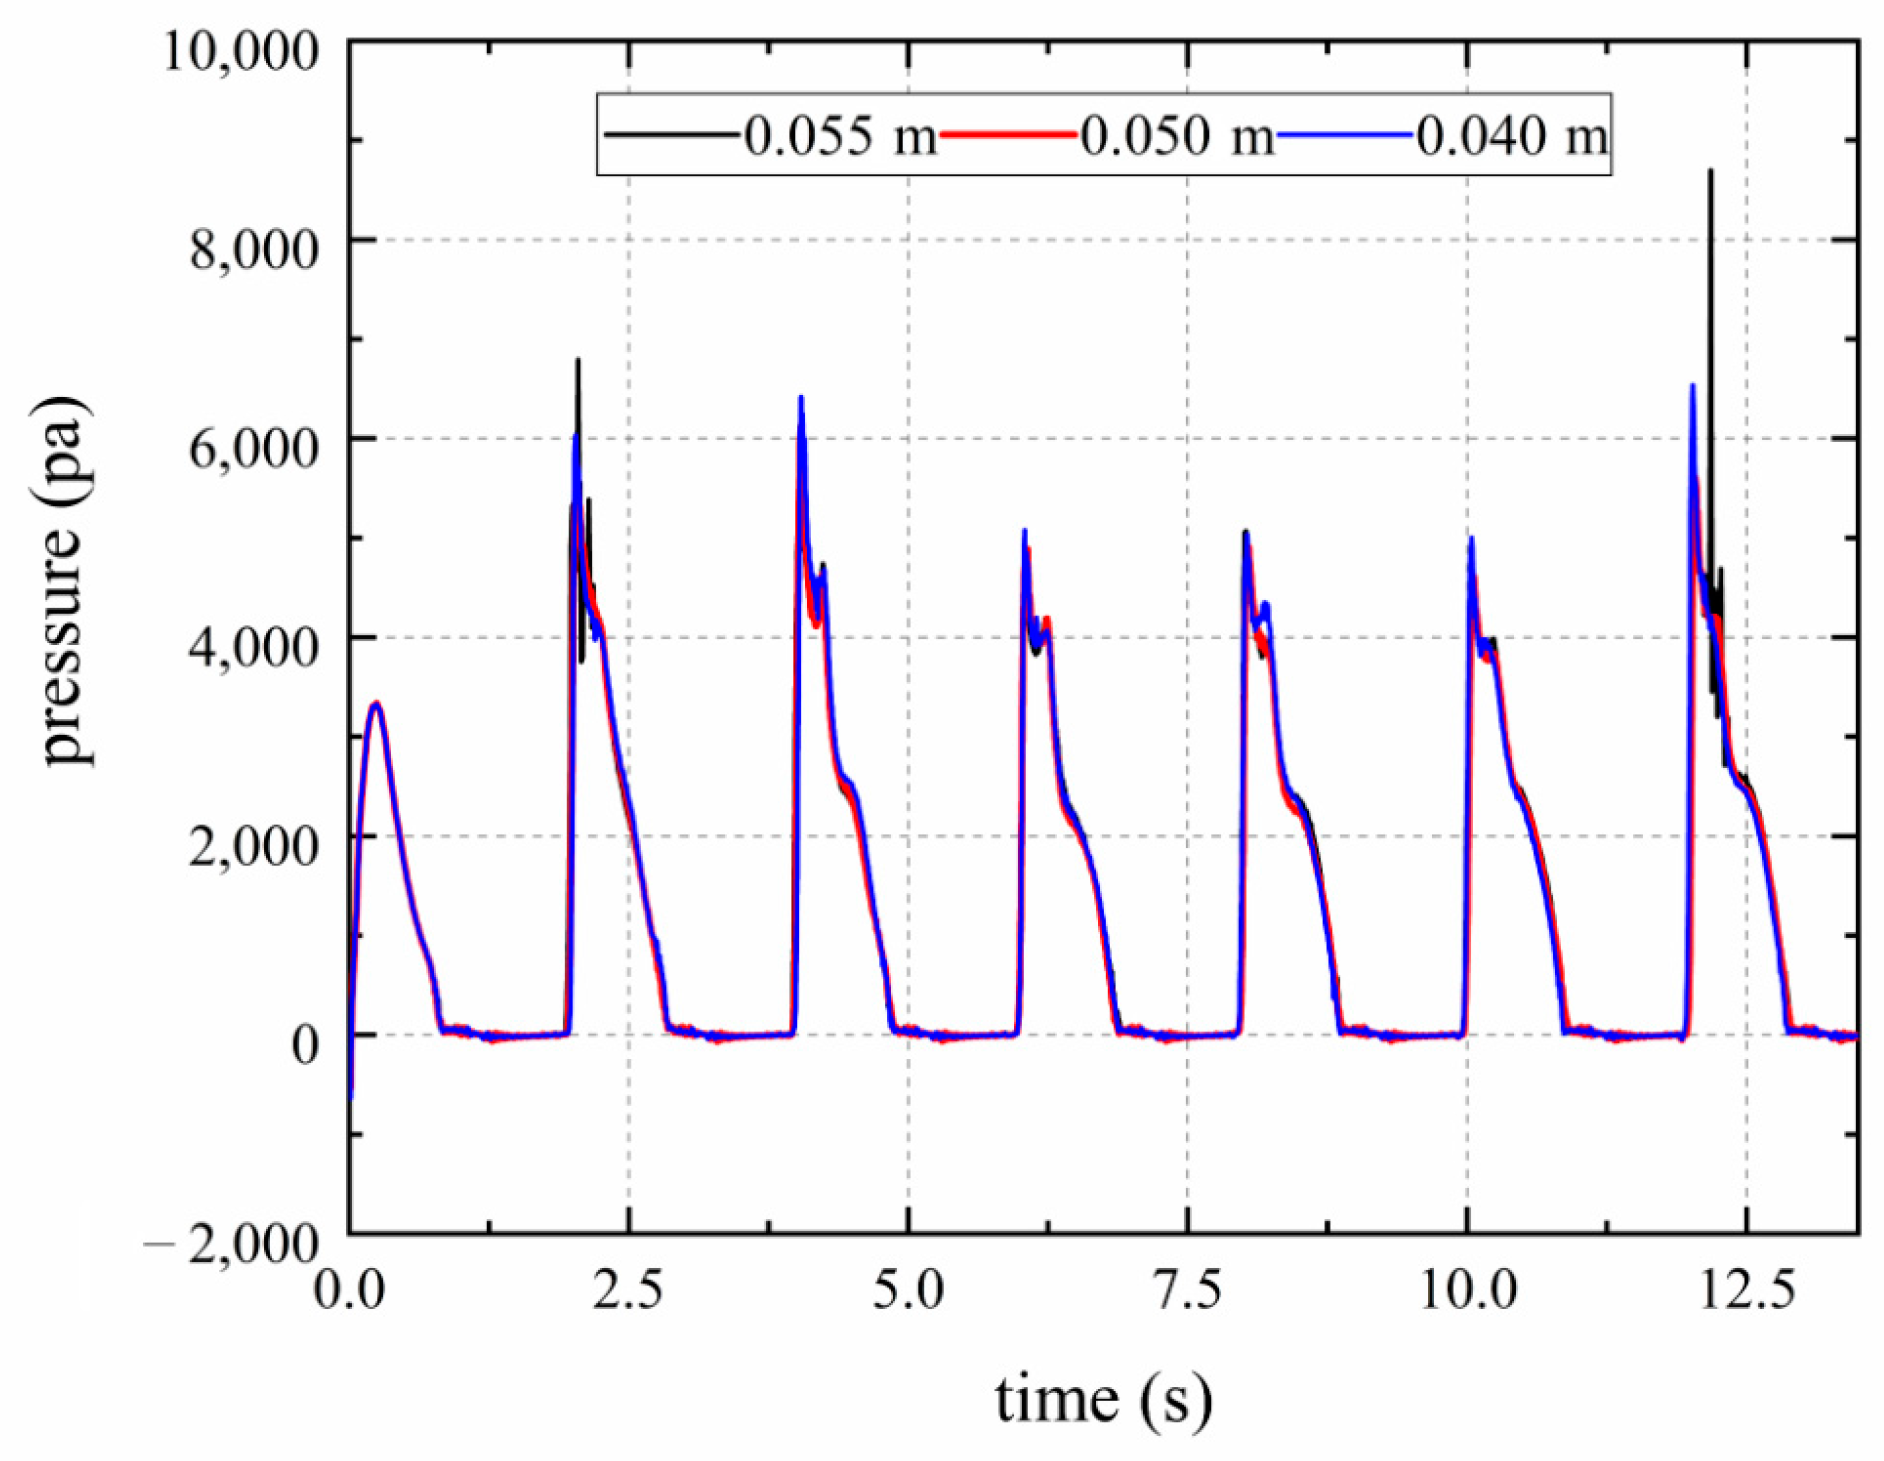
When calculating the pressure curves of K2 at the mesh size of 0.04 m, 0.05 m, and 0.055 m, as shown in Figure 9. The pressure curves basically maintained a good consistency, but with the increase in the mesh size, the crest of the base mesh size of 0.055 m showed a sudden change. By considering the accuracy of wave simulation and computational speed, a more stable mesh size setting with a foundation size of 0.05 m is used.
In this study, the dynamic fluid body interaction (DFBI) function of STARCCM+ was used to define the mooring cable, i.e., the dynamic fluid–solid interaction, to simulate the coupled motion of the mooring cable and platform. A local mesh refinement of the column and deck areas is shown in Figure 10.
4.3. Monitoring Points and Working Conditions
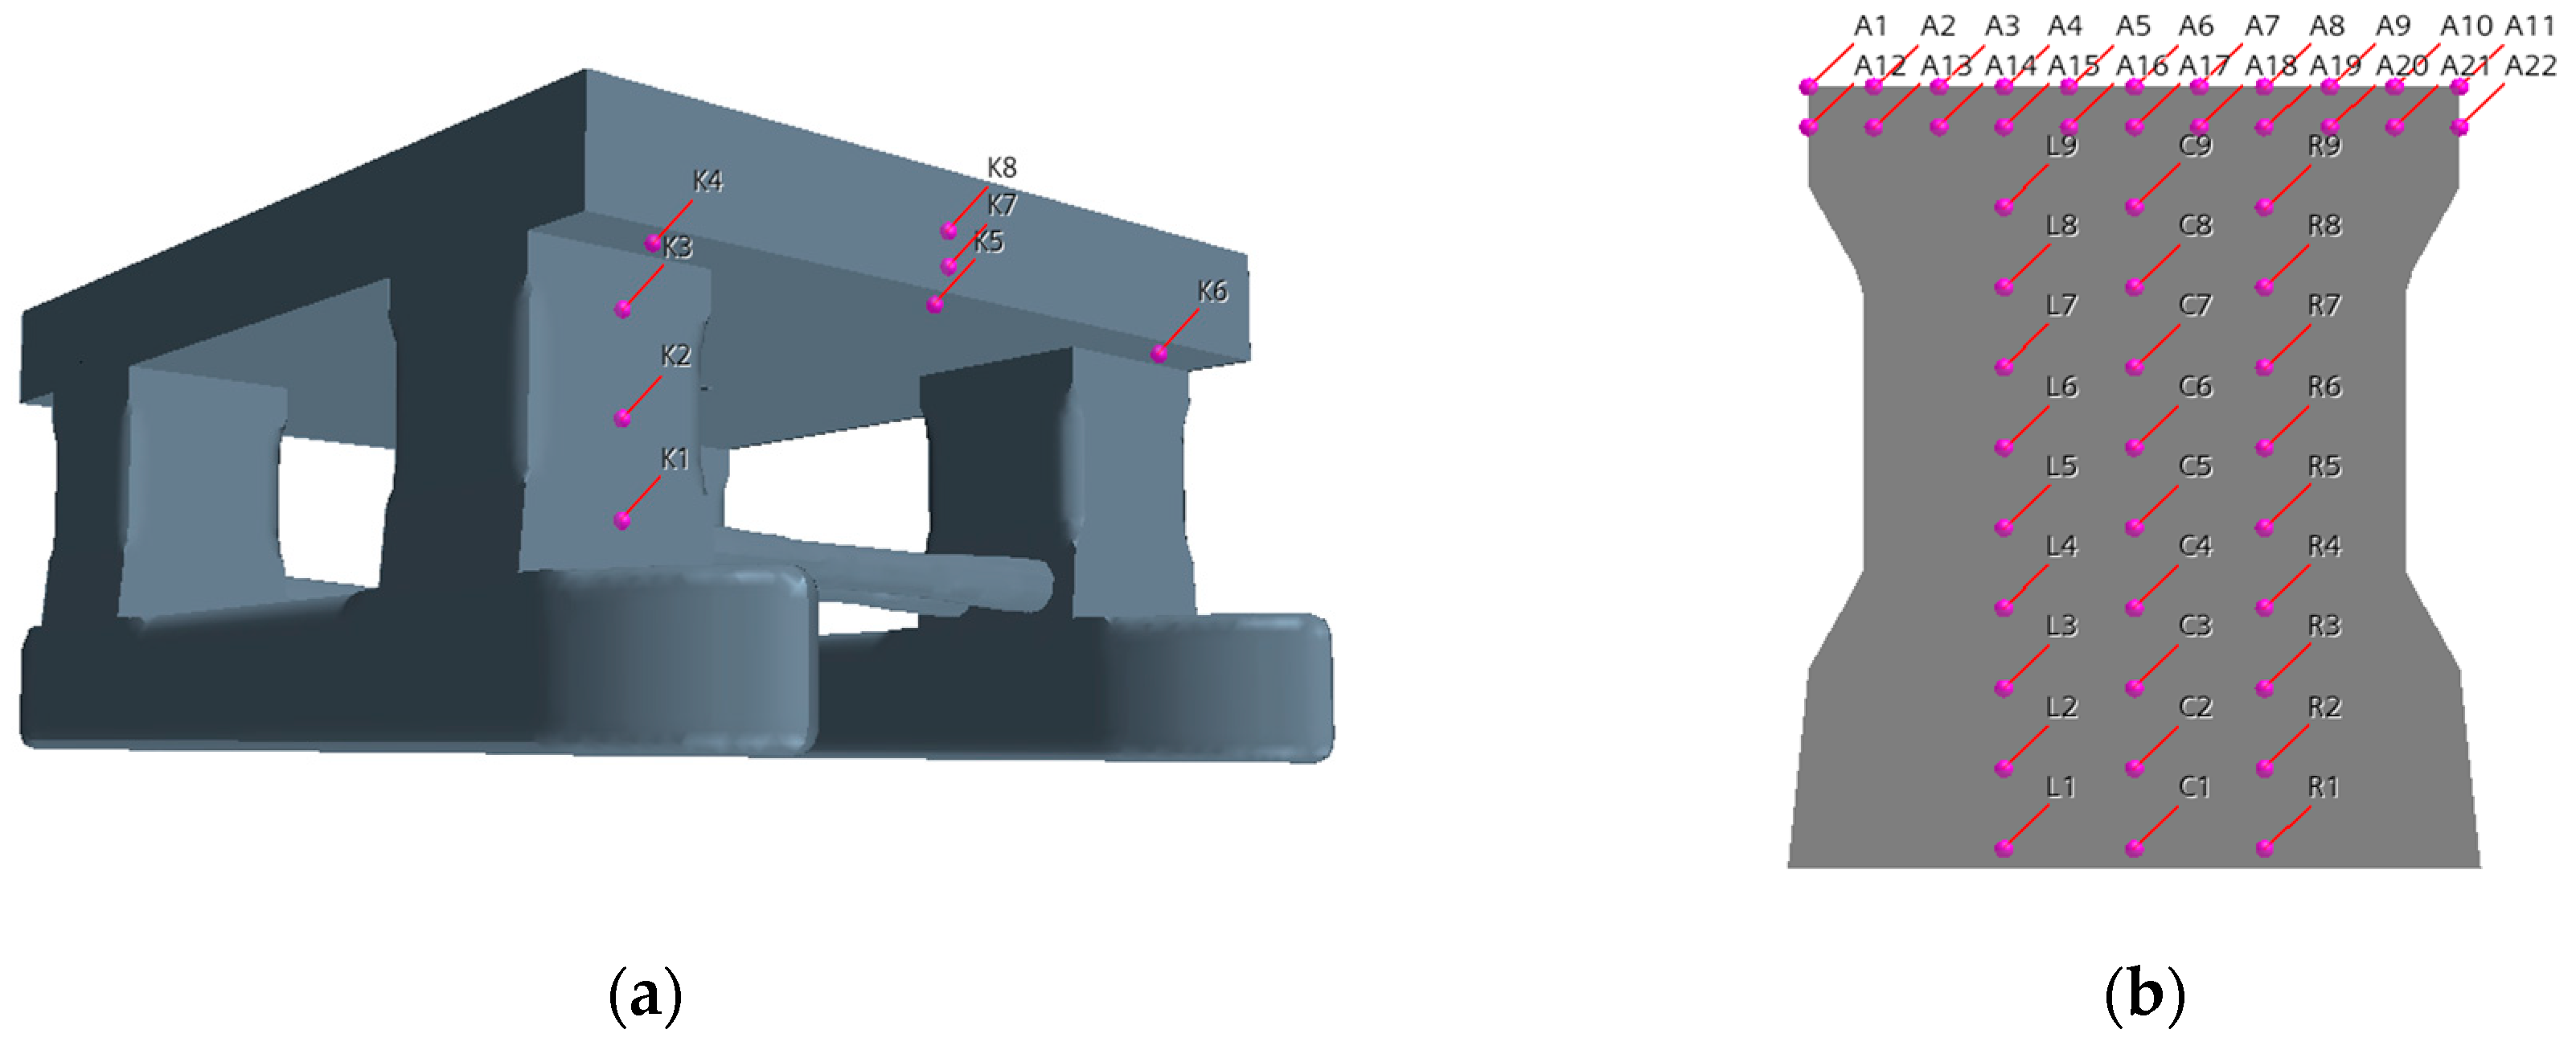
The actual wave height, period, and draft were 15 m, 9 s, and 15.5 m, respectively; the wave parameters input to the software after scaling ratio calculation were as follows: wave height = 0.75 m and period = 2.01 s. Figure 11 shows the slam-pressure monitoring points with columns L, C, and R arranged vertically at an interval of 0.1 m. Points A1 to A22 are arranged in two rows at the top of the column with a horizontal interval of 0.0775 m; Points P1 to P20 are evenly distributed from the wave-ward side of the front column to the wave-ward side of the rear column; Points D1 to D7 are located from the wave-ward side of the front column to the centerline of the deck; and Points LZ1 to LZ7 are situated from the wave-ward side of the rear column to the centerline of the deck.
5. Results and Discussion
5.1. Comparison and Validation
During the analysis of the results, all wave parameters and pressure values were converted to their actual size. When the platform is floating and stationary, a particular moment is applied through an external force, which is then released for free oscillation. After measuring the platform’s surge, sway, and heave oscillation motion through a measuring instrument with six degrees of freedom, it can be derived from parameters such as the inherent period of the model under this draft condition.
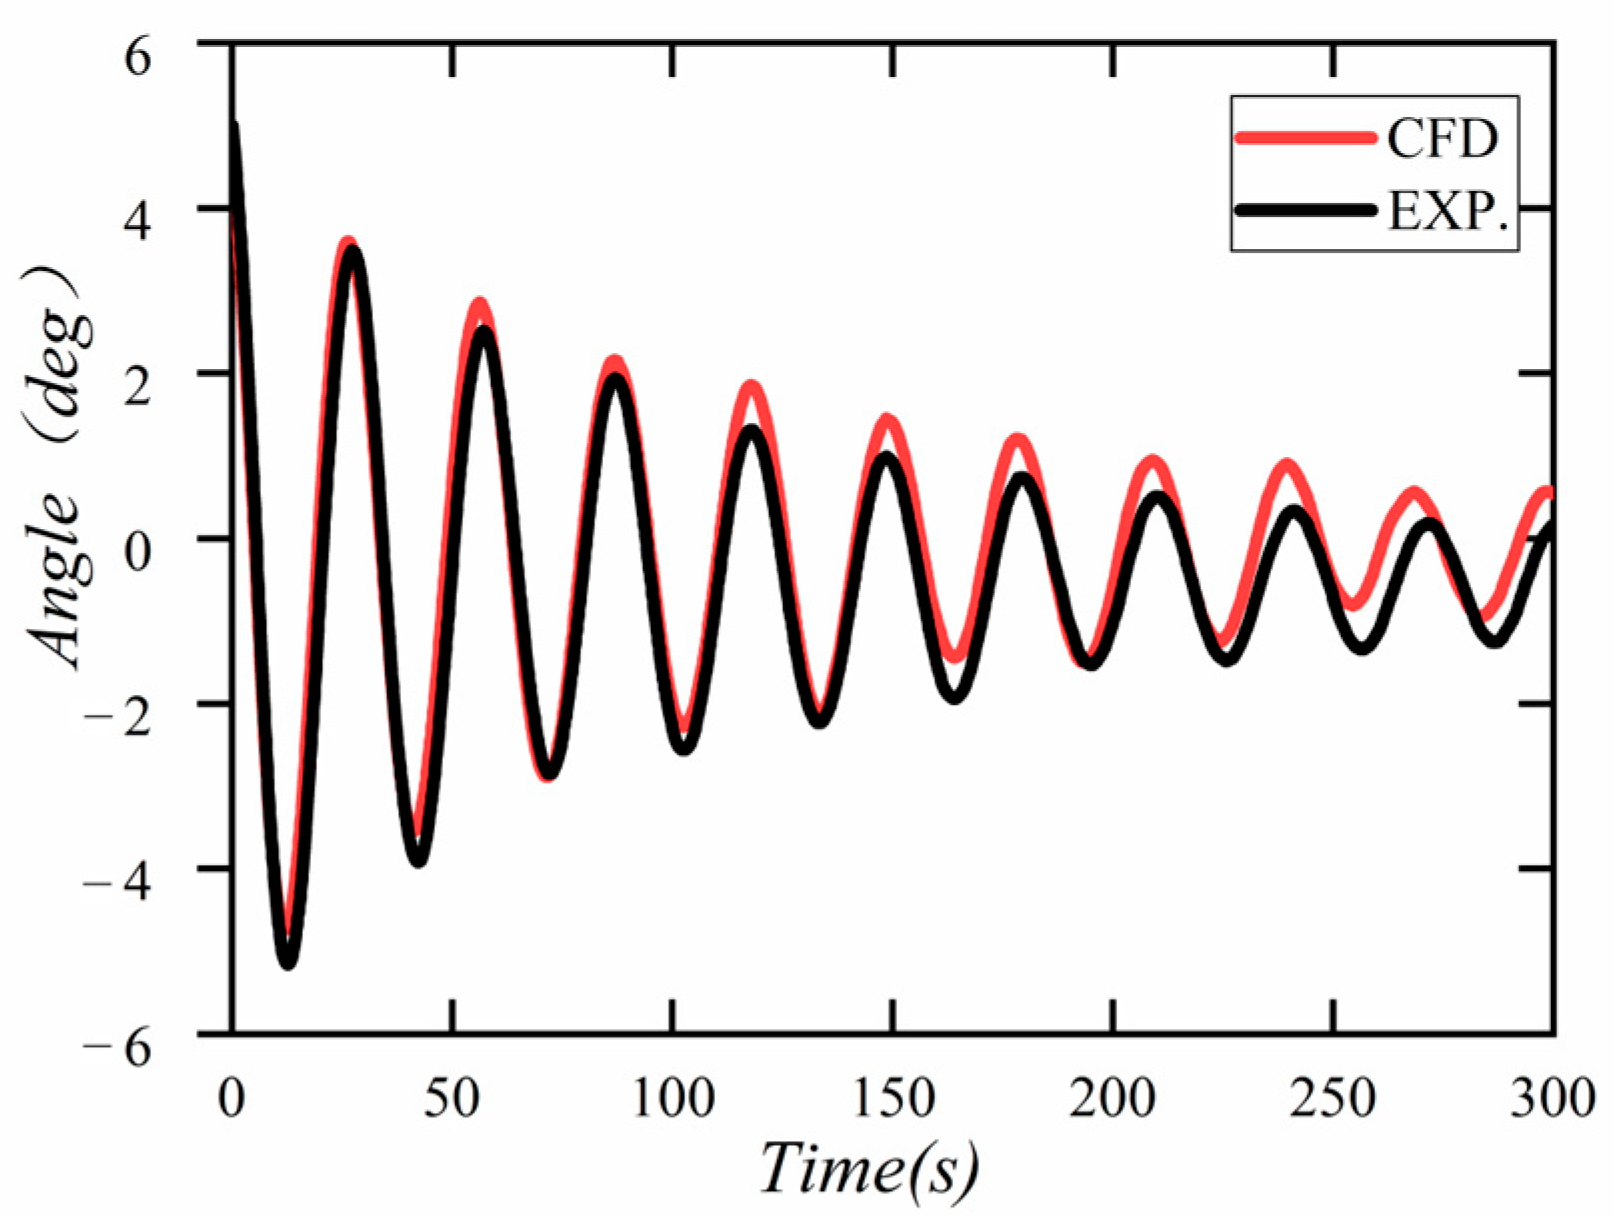
In the free decay test, the initial tilt angle applied to the platform is 5°, and five measurements are taken for each degree of freedom to improve the experimental accuracy. Figure 12 shows the comparison of the pitch responses of the semi-platform between numerical solutions and experimental results. It can be observed that the experimental natural period correlated well with the numerical simulation results, and the difference is within 5%, which validates the accuracy of the mesh size and calculation method in the numerical simulation. On the other hand, it can be observed that the numerical model can simulate characteristics of the natural fluid at the semi-platform.
We measured and simulated the slamming pressure at K1 of different wave parameters. Figure 13 and Table 6 present the variation of the wave-slamming pressure with wavelength λ for different wave periods T.
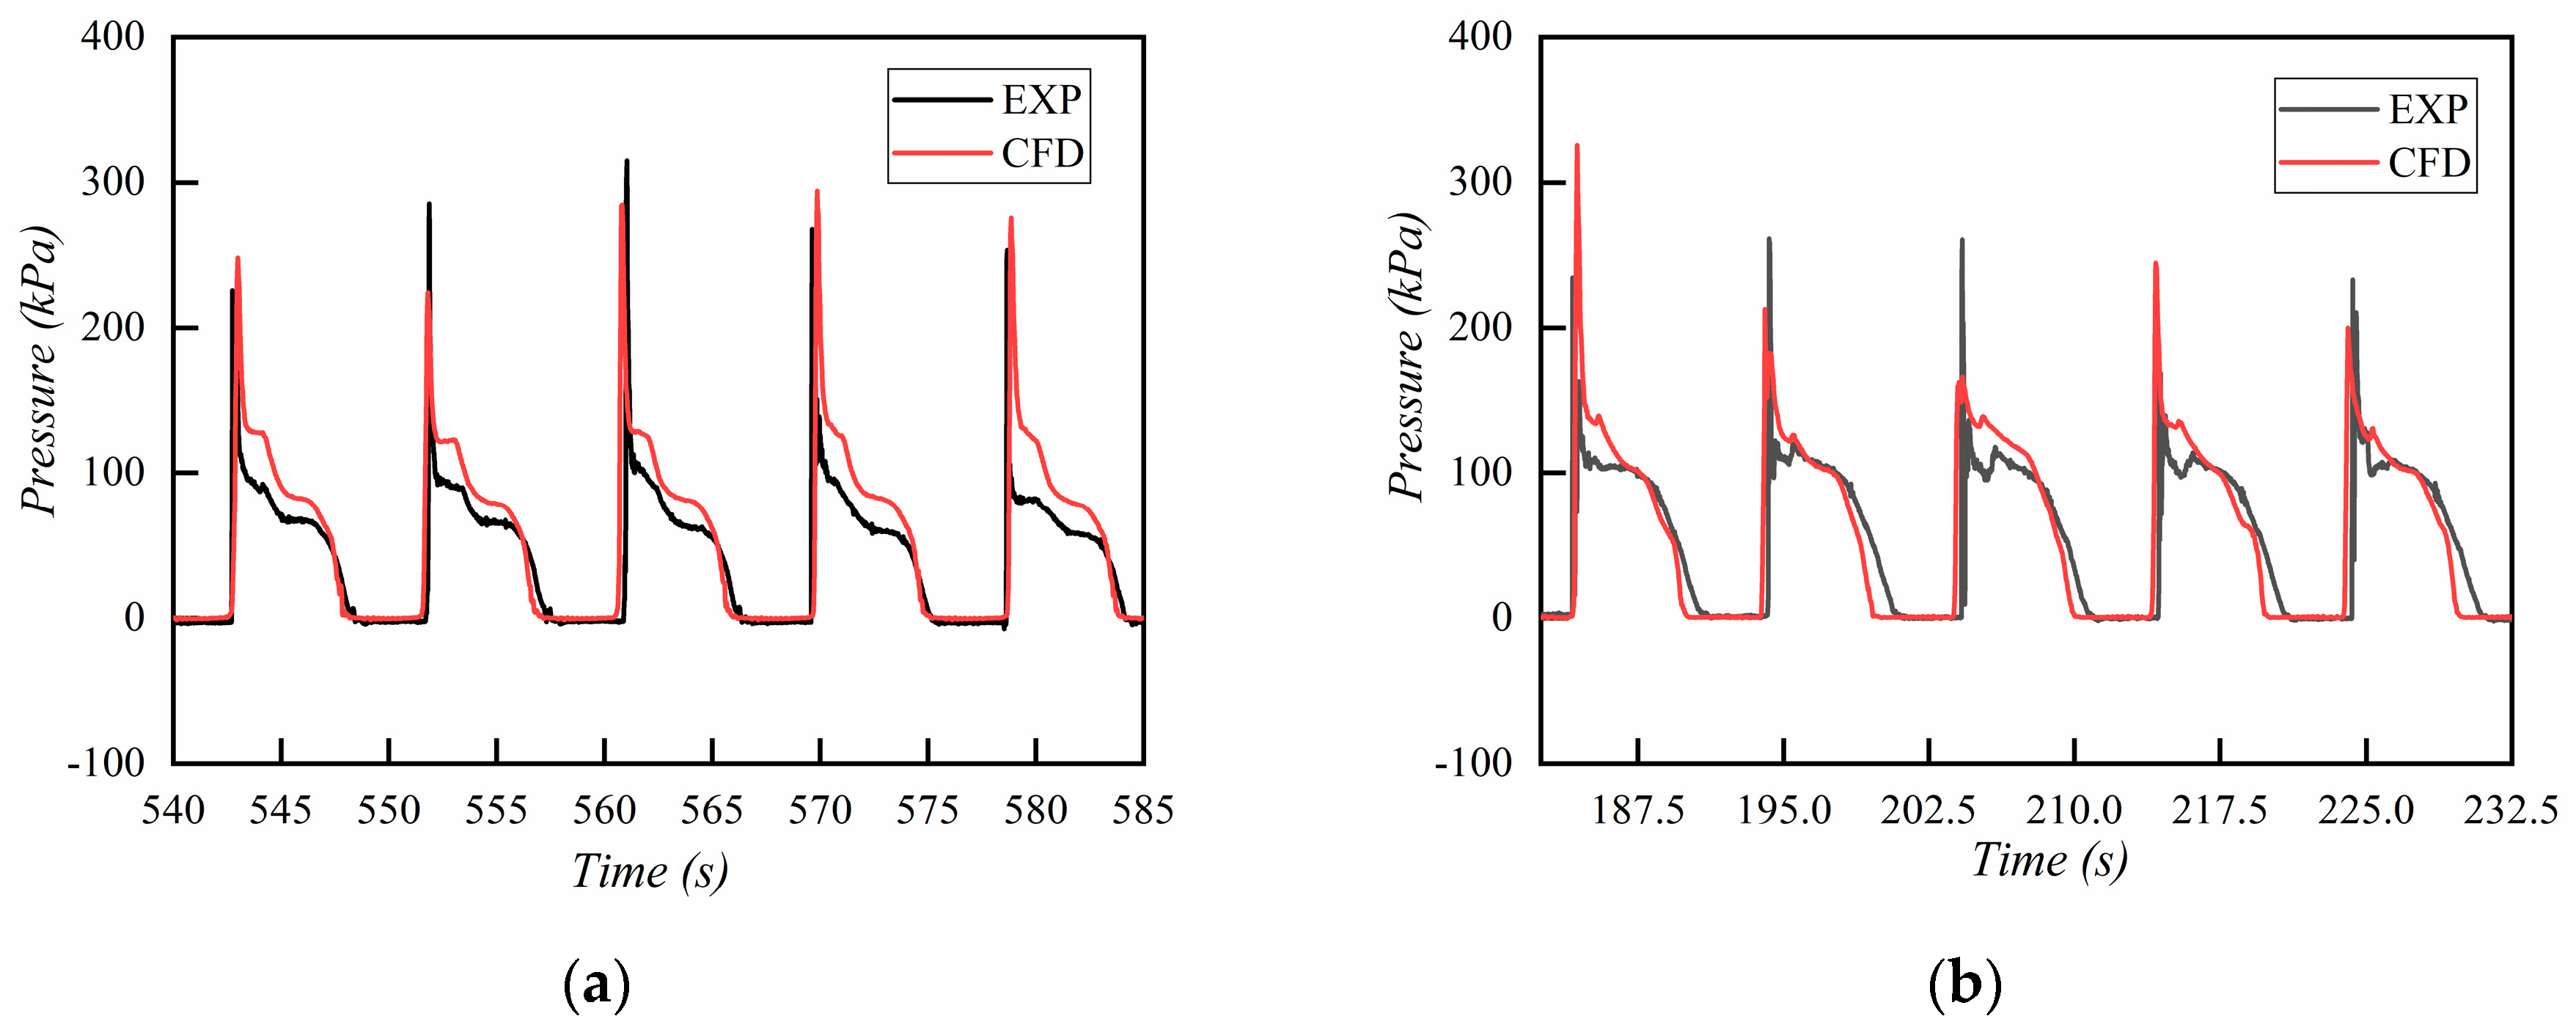
Comparing the results of the experimental measurements and numerical simulation for point K1 with a wave of H = 15 m, T = 9 s, and β = 180°, it can be seen from the relatively stable five periods that:
Firstly, the numerical results matched reasonably well with the experimental results for the periods in which slamming occurred, both at 9 s and 10 s, and were close to the wave period.
Secondly, slam pressure at point K1 increased sharply and rapidly to a maximum value, followed by a slight drop; subsequently, a second peak occurred with a relatively slow increase and decrease. This is because the velocity and height of the waves reached a maximum at the first wave slamming. During the platform advance, the waves did not dissipate quickly after the slamming and rapidly stacked and piled up at the K1 point, constructing a second wave peak for the second slamming pressure.
Thirdly, in the case of all five slamming loads, the pressure peaks reflect strong randomness, and the average values of the peaks are taken for comparison. The maximum values of 262.92 kPa and 229.93 kPa from the CFD calculations and the maximum values of 269.24 kPa and 231.32 kPa from the experimental measurements differ by approximately 2.4% and 0.6%, respectively, which is a tiny error.
In all cases, the pressure period, peak, and trends given by the presented numerical model correlate well with the experimental values. This is an excellent value that the numerical simulation grid setup and the choice of solver and turbulence model can accurately simulate the wave-slamming phenomenon on the semi-submersible ocean platform.
5.2. Motion in the Basin Test
Figure 14a presents the relationship between motion responses and wave period for the semi-platform models when the wave height is 15 m. A tendency can be seen that the amplitudes of the surge, heave, roll, heave, and sway all increase with the wave period. In contrast, the amplitude values of yaw are slightly reduced. From wave period 9–13 s, the rise of the wave period is 44%, while the increase in longitudinal rocking and sinking motion is about three times the initial period. The heave and pitch of the platform are sensitive to changes in the wave period, which can be explained by the fact that this semi-submersible platform model has a small water plane at a draft of 15.5 m when the projected area of the water plane is the cross-sectional area of the four columns, a fixed change in displacement results in a higher heave amplitude. Furthermore, as the wave period increases, the time interval available for the platform to move between crests and troughs increases, thus producing a more excellent pitch and heave motion. This indicates that the change of wave period is susceptible to the pitch and heave motion of the platform.
Figure 14b reveals the varies in motion response against the wave height for the four models as the wave period is 12 s, respectively. The final results indicate that the surge, pitch, and heave demonstrate a relatively linear increase as the wave height increases, while the roll, sway, and yaw remain at a lower level with small amplitude oscillations. The surge and heave increase rapidly and reach their maximum value at a wave height of 25 m, while the motions are 12.55° and 13.838 m. The pitch has a slightly lower amplitude but still maintains an increasing trend; therefore, it is evident that greater wave heights lead to an increase in motion response and that the platform’s heave, pitch, and surge motion are sensitive to changes in wave height.
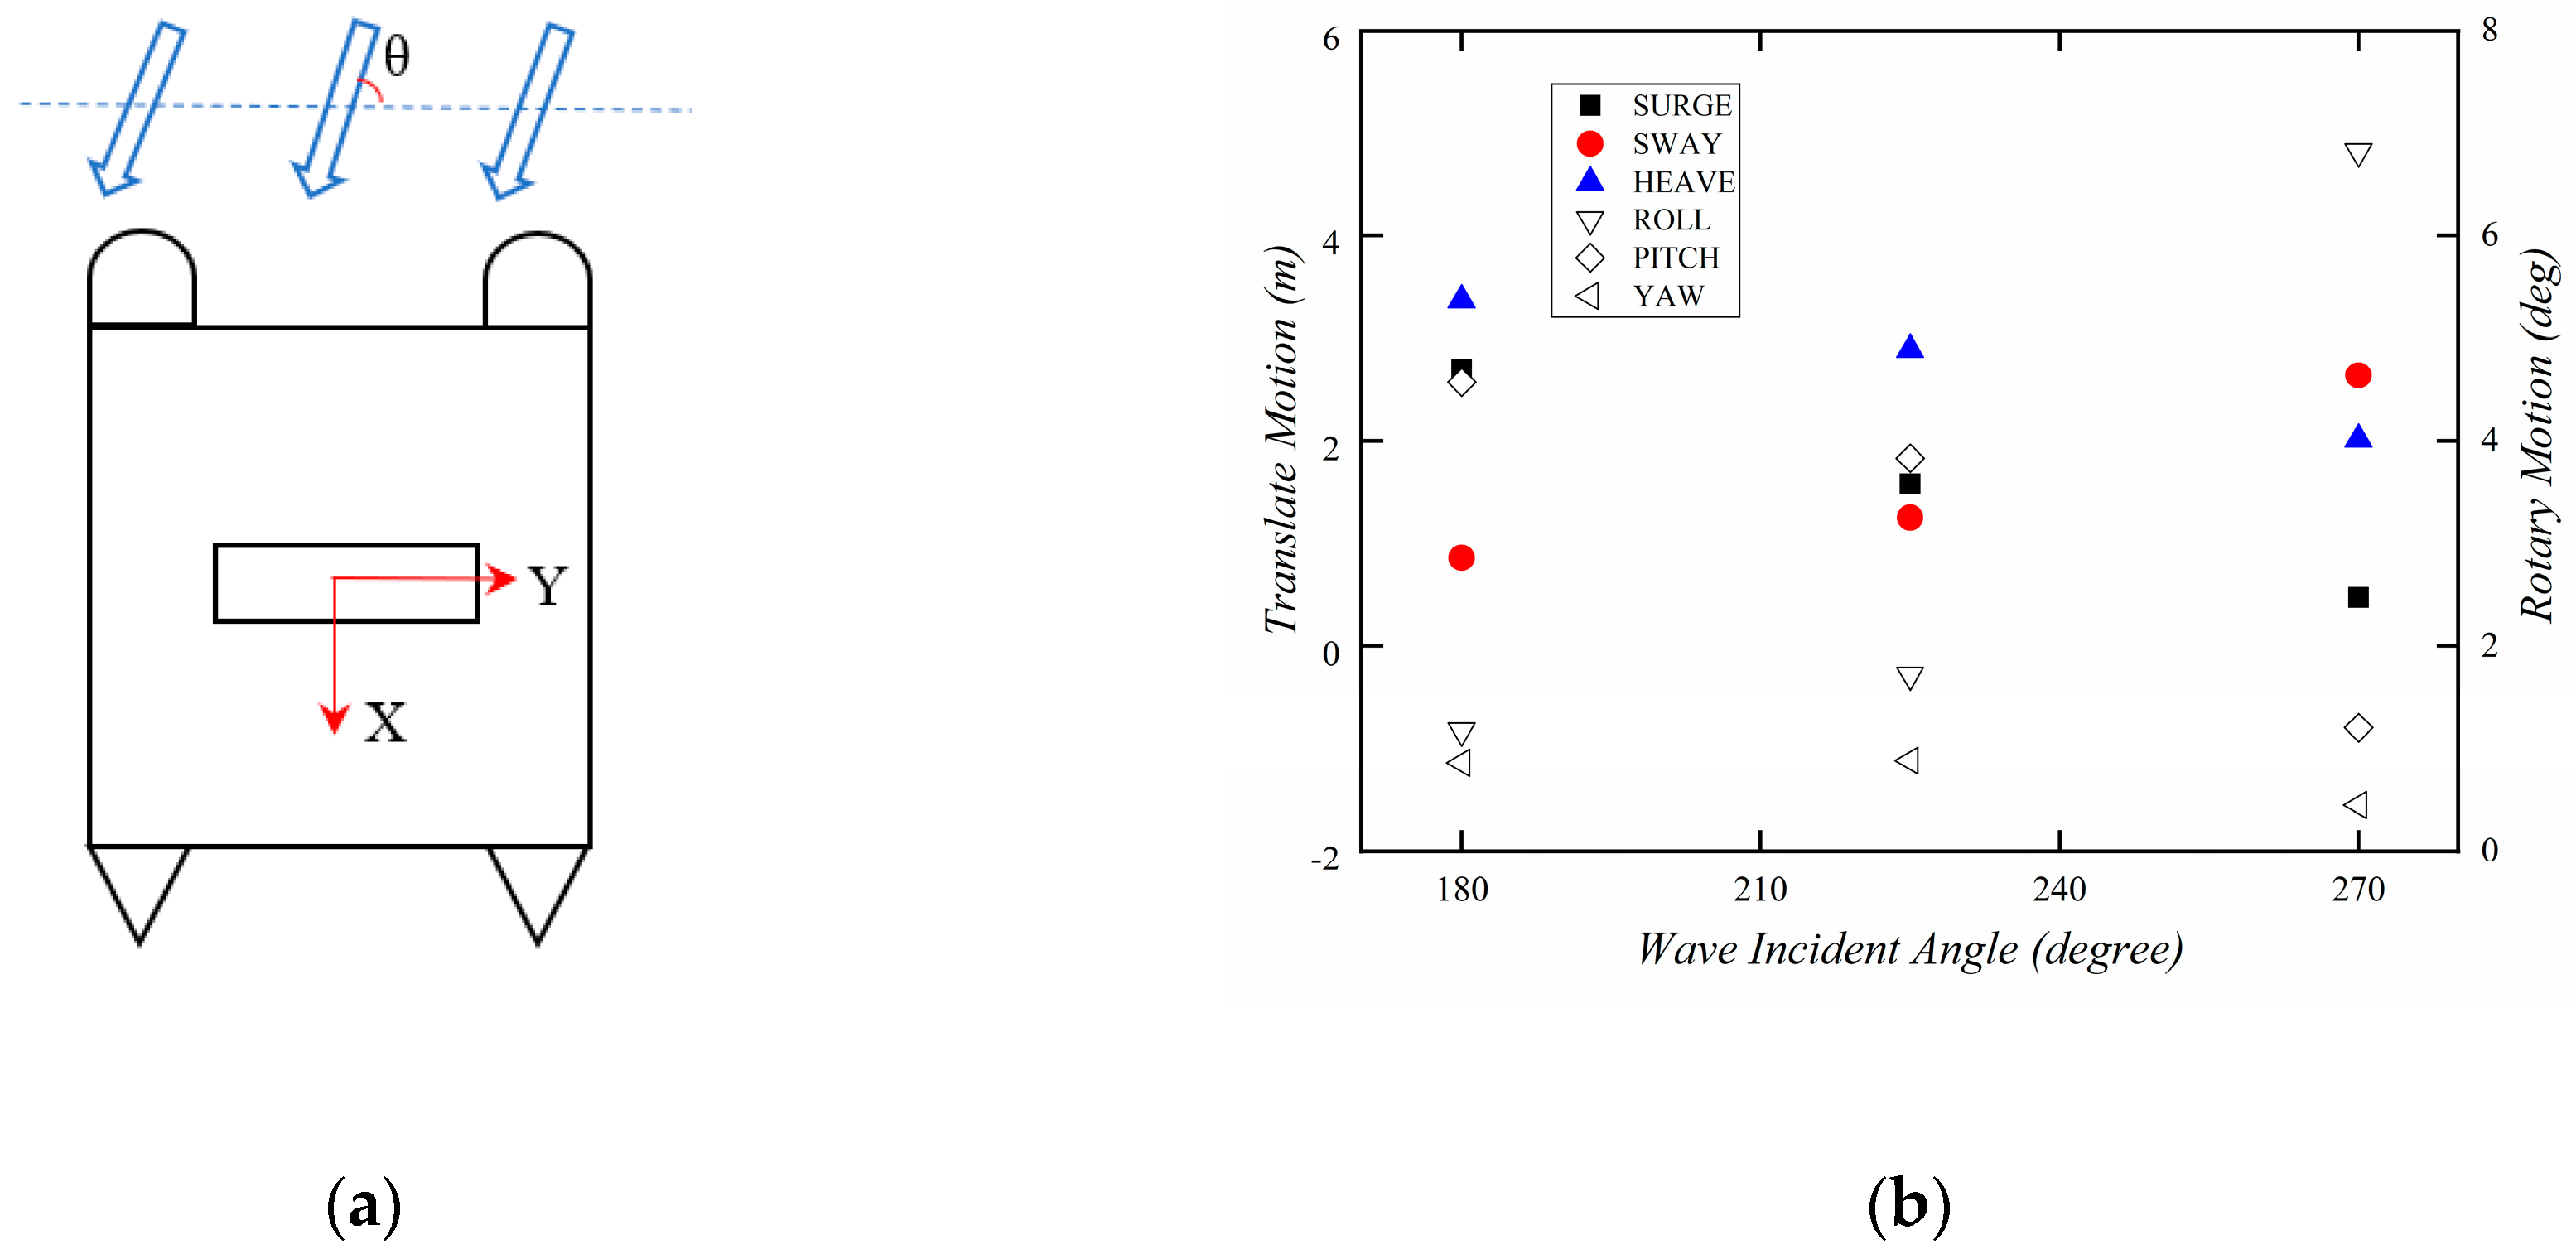
Figure 15a shows the angle between the incident wave and the semi-submersible platform. As can be observed in Figure 15b, there is no doubt that the sway motion of the platform increases significantly as the incident wave angle widens. The amplitudes of the surge, heave, and pitch all decrease with the incident wave angle, with a reduction of 40–60%. Among them, the degree of change of pitch motion is the most obvious. This is mainly because the front end of the lower floating body of the semi-submersible platform has a more rounded shape and a larger contact area with the waves, which can produce a more significant recovery moment. In contrast, the rear end is sharper and creates a smaller recovery distance than the front end. Therefore, when the waves slam the front and rear ends of the floating body asymmetrically, the recovery force distance will change significantly, resulting in a sharp change from positive to negative values of the longitudinal rocking motion angle.
5.3. Slamming Pressure on the Column
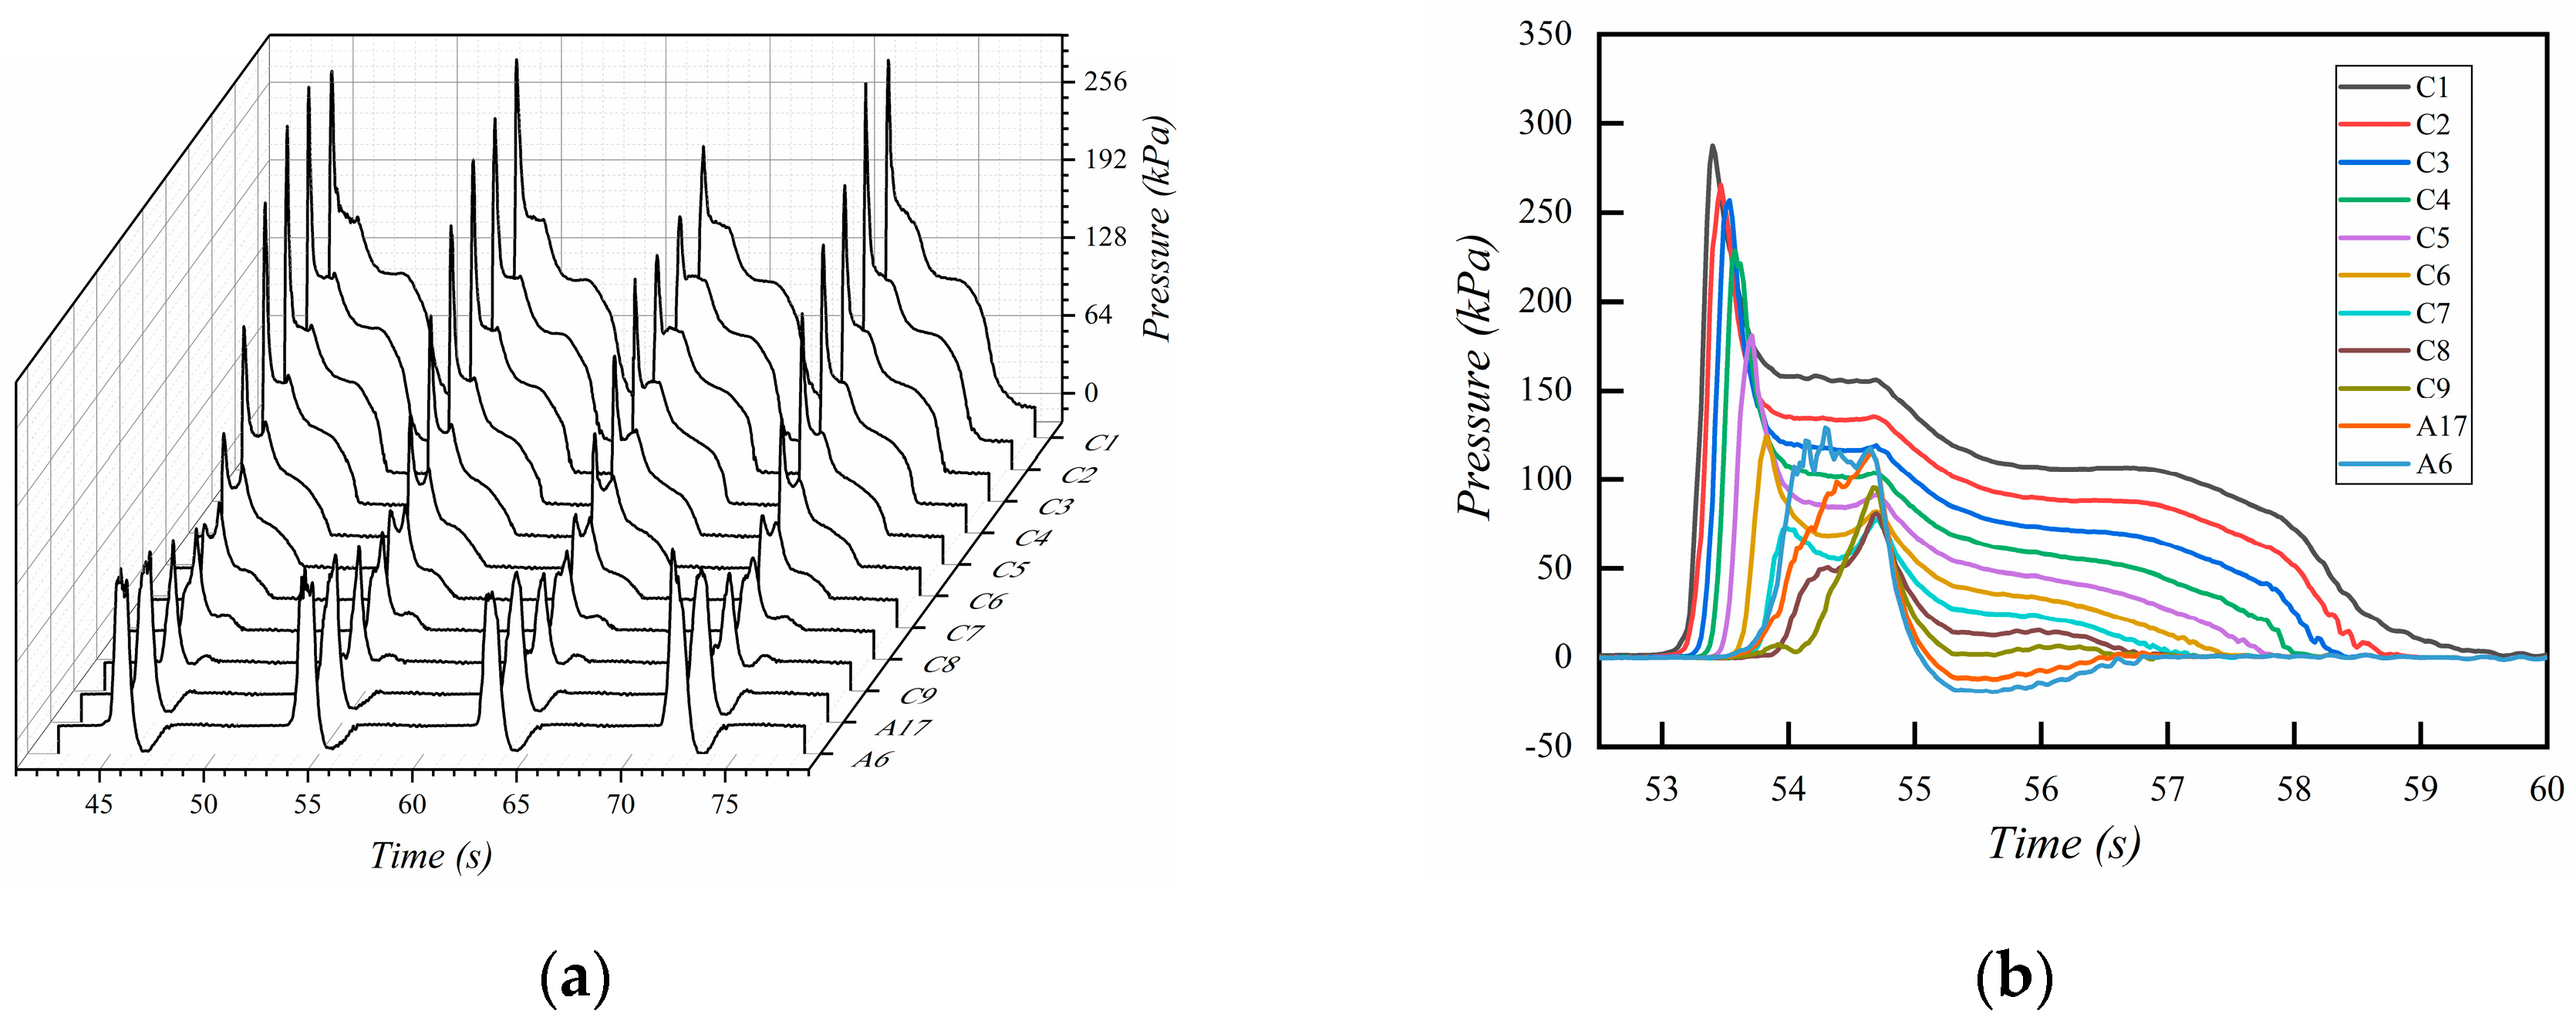
The regular wave directly impacts the front column of the semi-submersible platform. As shown in Figure 16, the wave interacts with the surface of the column producing a pressure change that coincides with the wave period T = 9 s. This pressure change can be divided into two stages: first, the pressure increases rapidly from 0 kPa to over 250 kPa within 0.5 s with a strong nonlinearity; then, the pressure value decreases slowly over a few seconds while there are pressure oscillations, similar to the expression documented by Santo et al. [28] that refers to wave-slamming characterized by a single pressure peak followed by a structural vibration. After the first peak, the pressure decreases; however, the duration of the load action increases, which can be attributed to the air cushion between the liquid and the wall, thus increasing the duration of the pressure.
Figure 16b shows the time history of slamming pressure at C1–C9 and A6 and A17. The ‘double-peak’ phenomenon can be observed distinctly at the middle of the column (C6–C7), and two pressure peaks at approximately 100 kPa. At the top of the column (C8–A6), the pressure oscillation becomes more prominent, and a maximum negative pressure of 21 kPa is observed. This is because the top of the column is higher than the sea surface, and the water quality point drops rapidly after the wave slams at Point A6. The air is not replenished in time, resulting in a momentary vacuum in the area, which leads to the negative pressure phenomenon. By averaging the pressure peaks over the four periods, it can be observed from Figure 15b that the peak of slam pressure tends to decrease as the height rises. Still, there is an inflection point at point C8, where the pressure increases significantly. Finally, the top-of-column slamming pressure at Point A6 is 128.4 kPa, 76.3% higher than the slamming pressure at point C8.
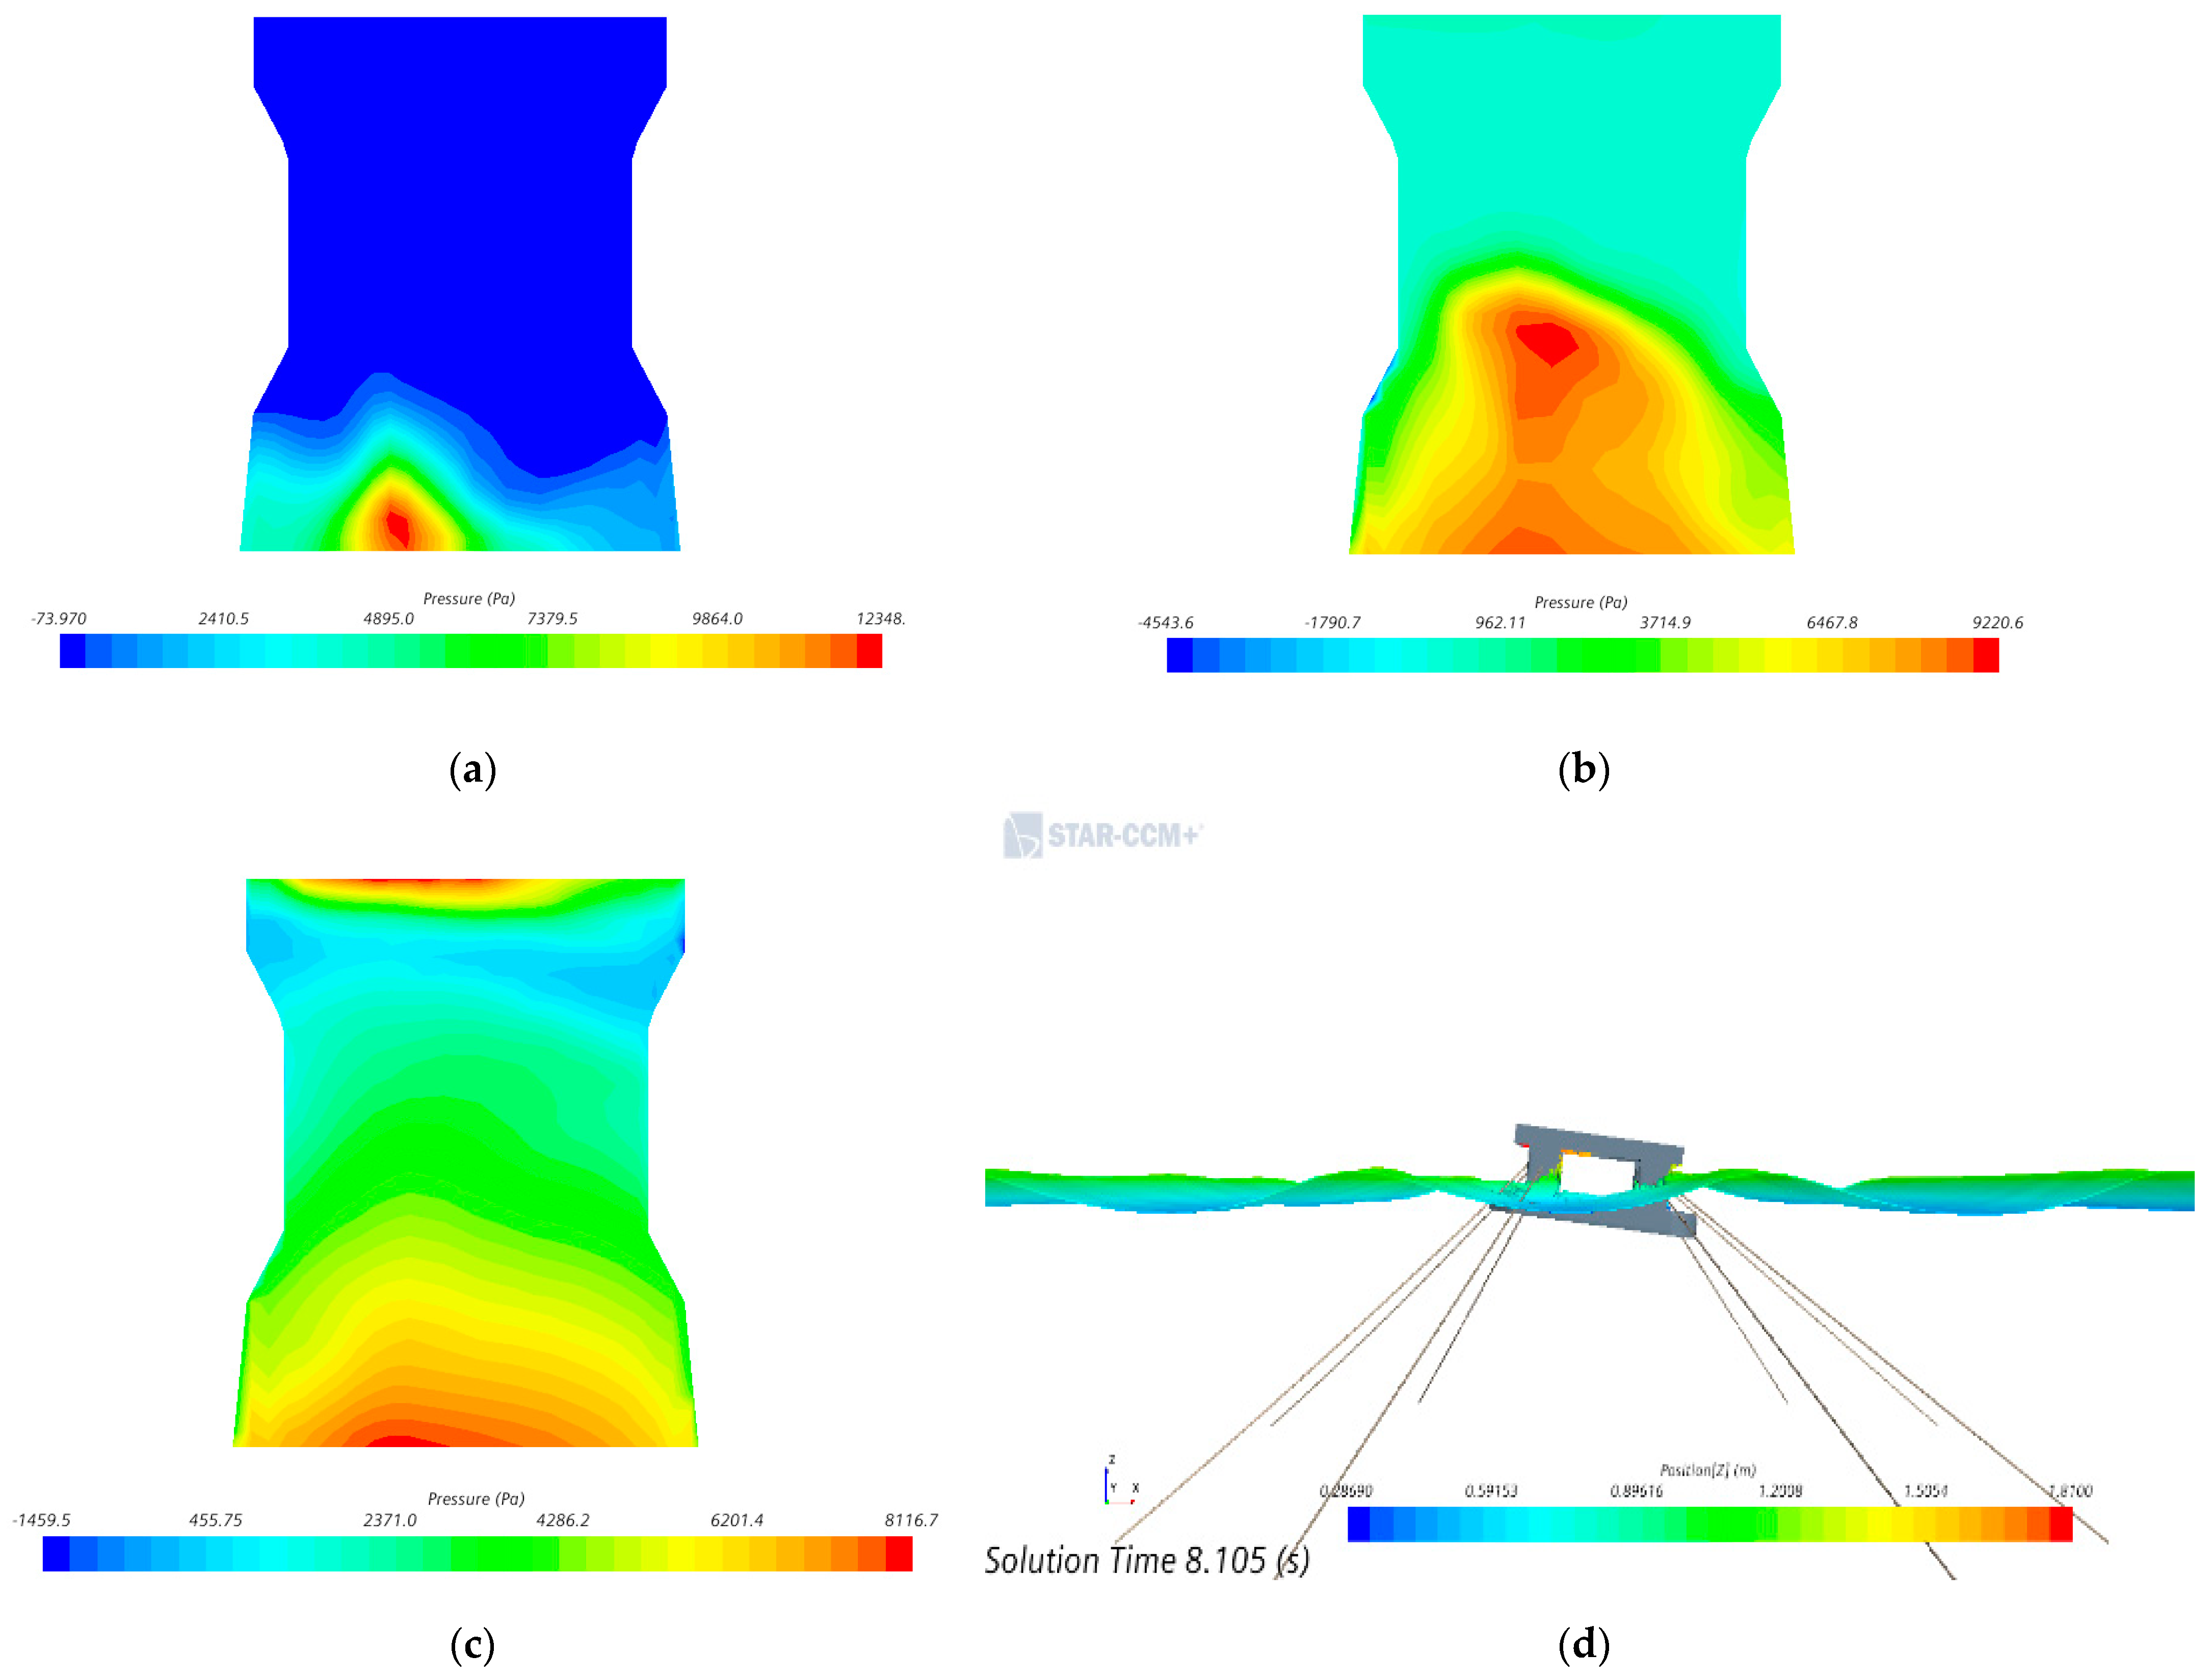
To verify the abnormal increase in slamming pressure on the top of the column. Figure 17 shows the distribution of slamming pressure on the surface of the column (a–c) and the platform motion (d). During the initial movement phase, the wave slams the column and creates a region of higher pressure under the column. As the wave crest continued to move forward, the waves stacked rapidly at the front of the column and crashed into the platform column a second time as a surge. As a result, this region moves upward and expands in size. Finally, at T = 8.105 s, the free liquid surface slams the top of the column (the junction of the column and the bottom of the deck): the pitch angle increases the strength of the wave slamming. As a result, the pressure at the top of the column is higher. Figure 18 shows the movement of the platform in the test, which is mutually verified with the numerical results.
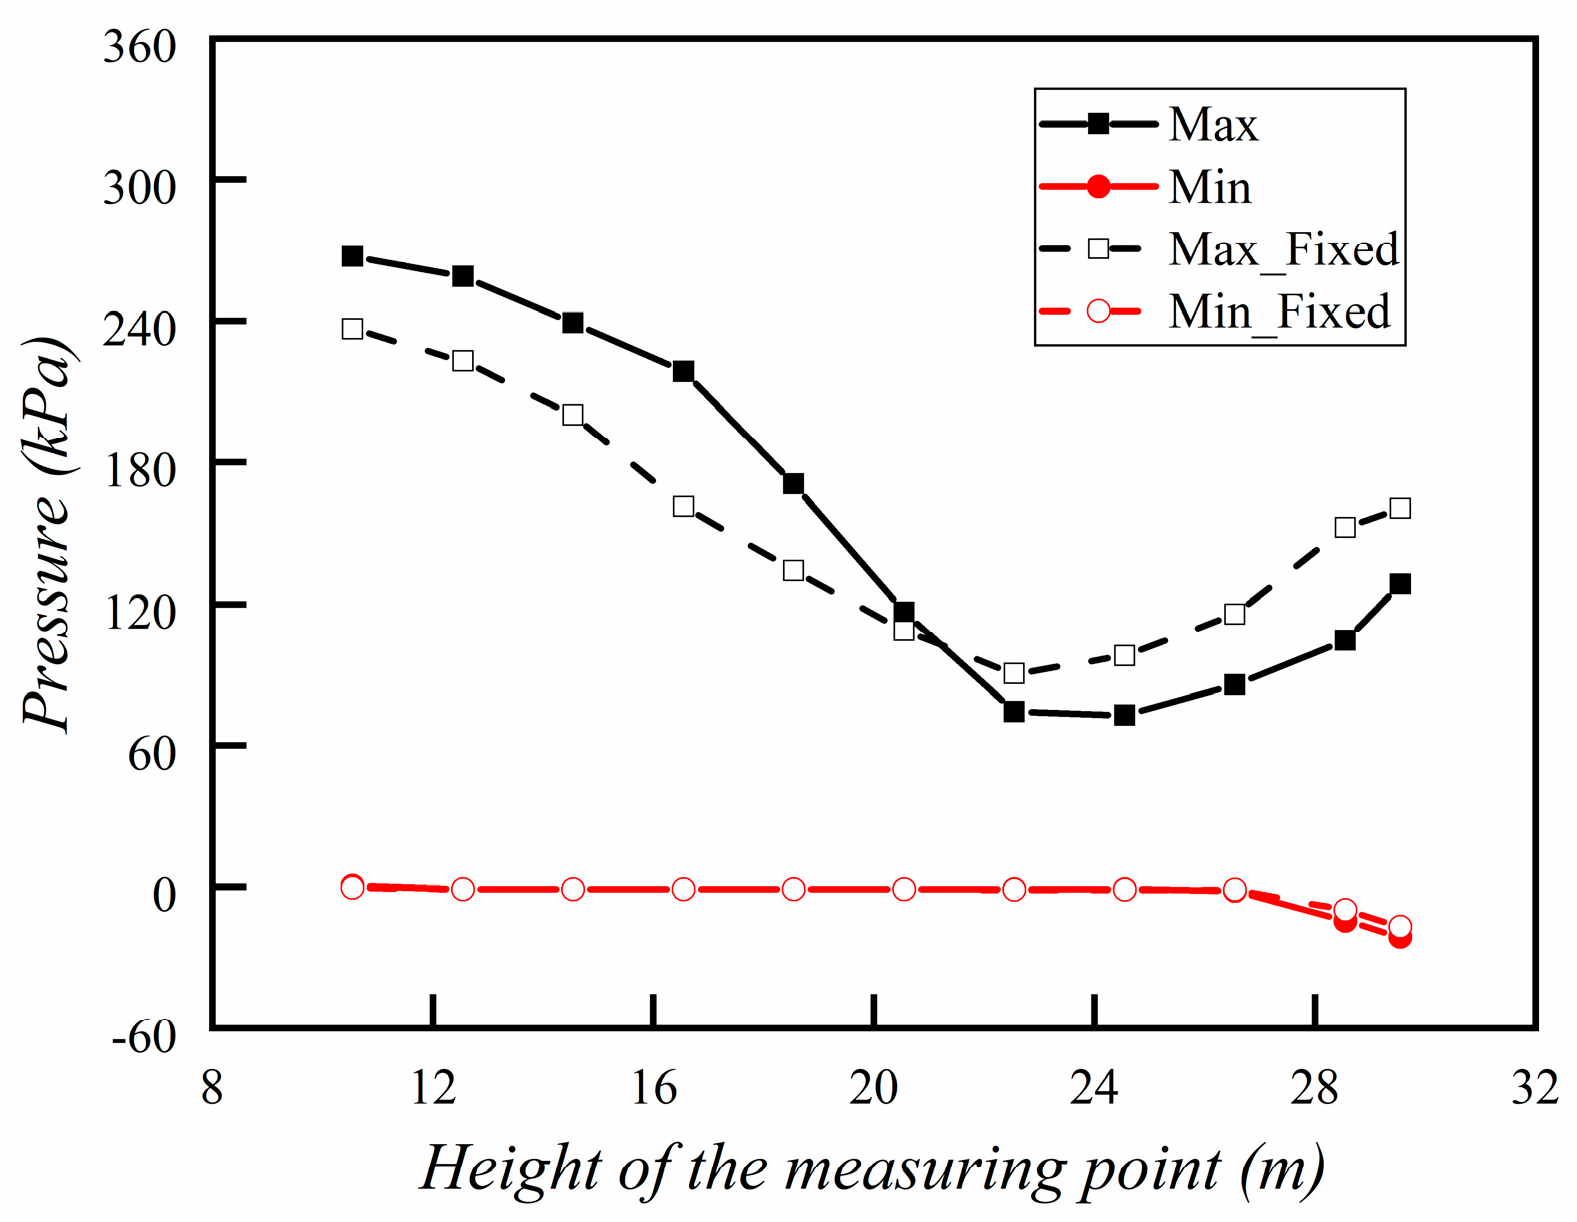
The wave slam pressure distribution on the surface measurement points at different height positions with the column in six degrees of freedom of movement and fixation are shown in Figure 19. The platform was fixed in a numerical pool to investigate the effect of platform motion on the column slam pressure. The maximum value of the slam pressure at the lowest end of the platform is significantly higher than that of the fixed platform, with a difference of 30 KPA at the maximum value when the platform can be fully moved. This is caused by the six degrees of freedom motion of the platform. However, as the height increases, the peak slam pressure at the upper part of the fixed platform column starts to increase and exceeds the peak slam pressure of the six-degree-of-freedom moving platform, with a maximum difference of 65 KPA. Therefore, the peak slam pressure of the upper part of the column of the six-degree-of-freedom moving platform is more significant than that of the fixed platform. This suggests that the movement of the platform on wave slamming must be addressed. Therefore, slamming loads must be considered more comprehensively when the platform is working (anchored) or the movement is restricted (towed).
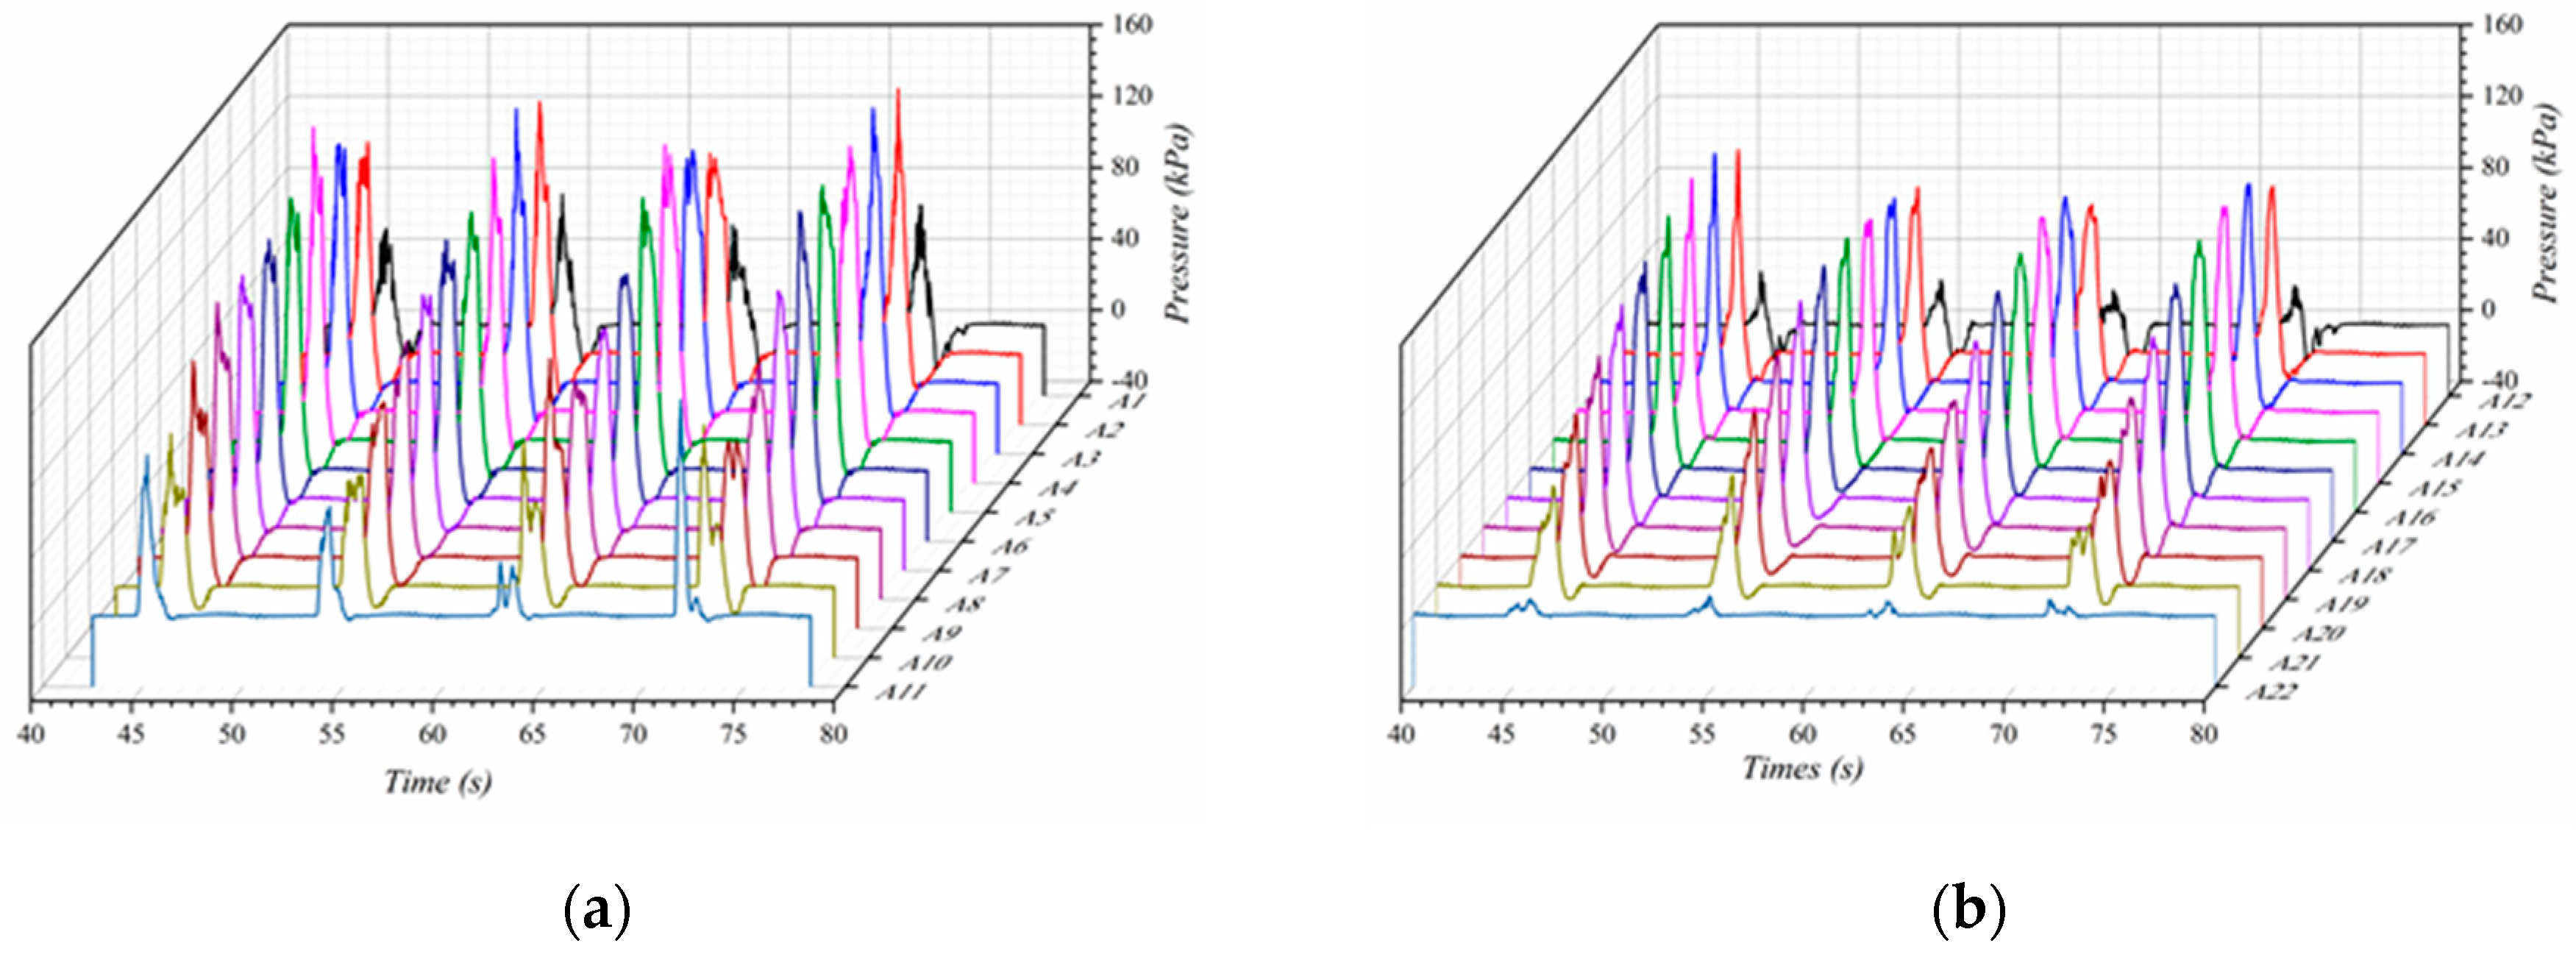
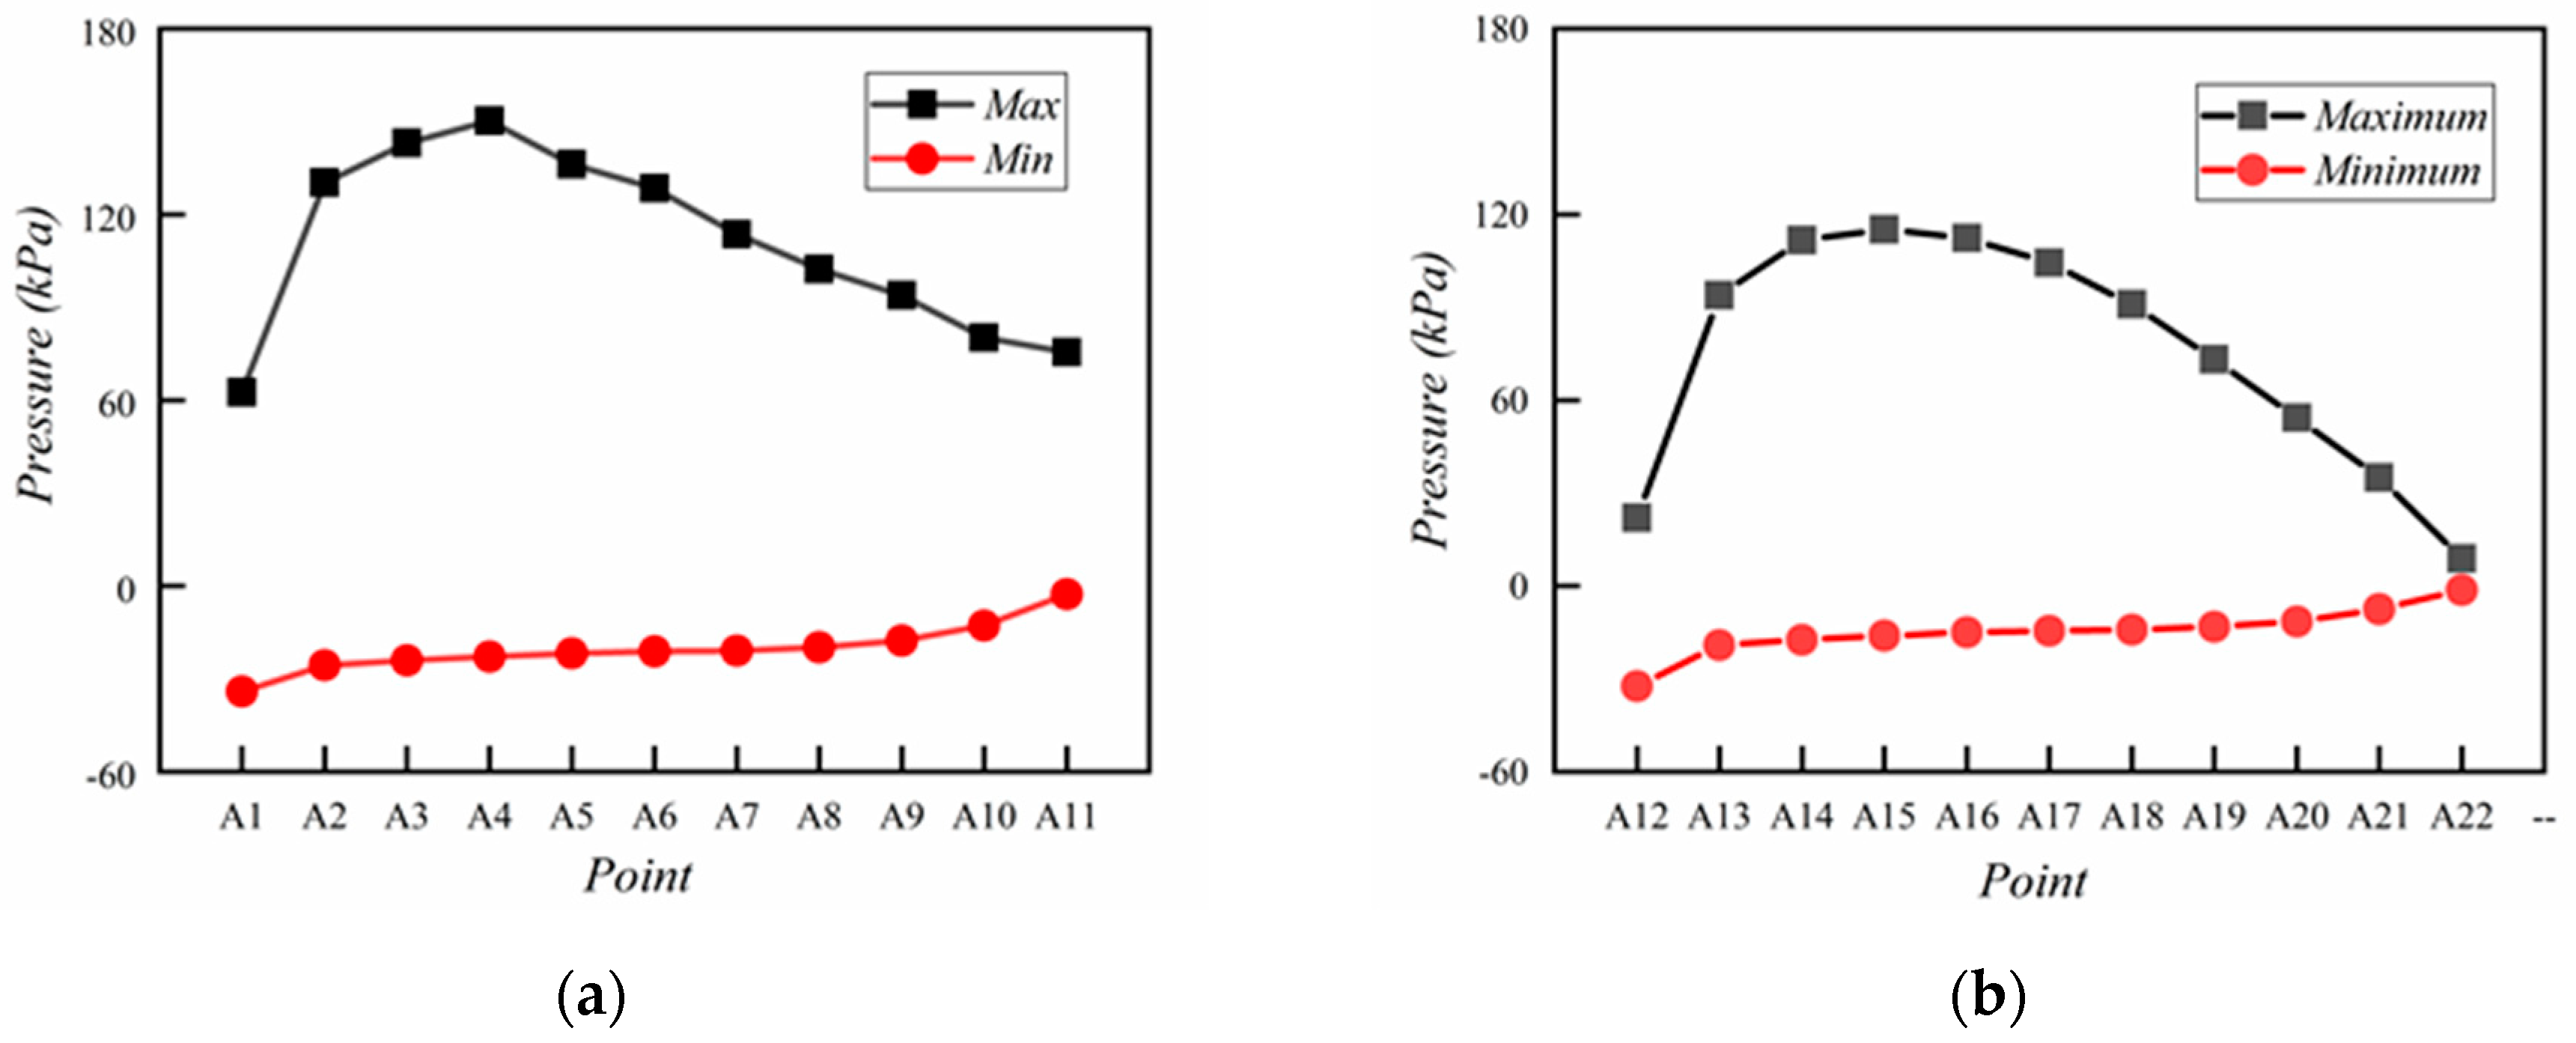
Because of the non-negligible wave slamming at the top of the column, 22 measurement points, i.e., A1–A22, were placed at the top of the column, as shown in Figure 20 and Figure 21. In the horizontal direction, the peak pressure exhibits an inverted U-shaped distribution with a maximum value of 150.3 kPa at Point A5. It presents a similar inverted-U-shaped distribution, from A12 to A22, 1 m below the top edge of the column, with a slightly lower peak pressure than that in A1–A11.
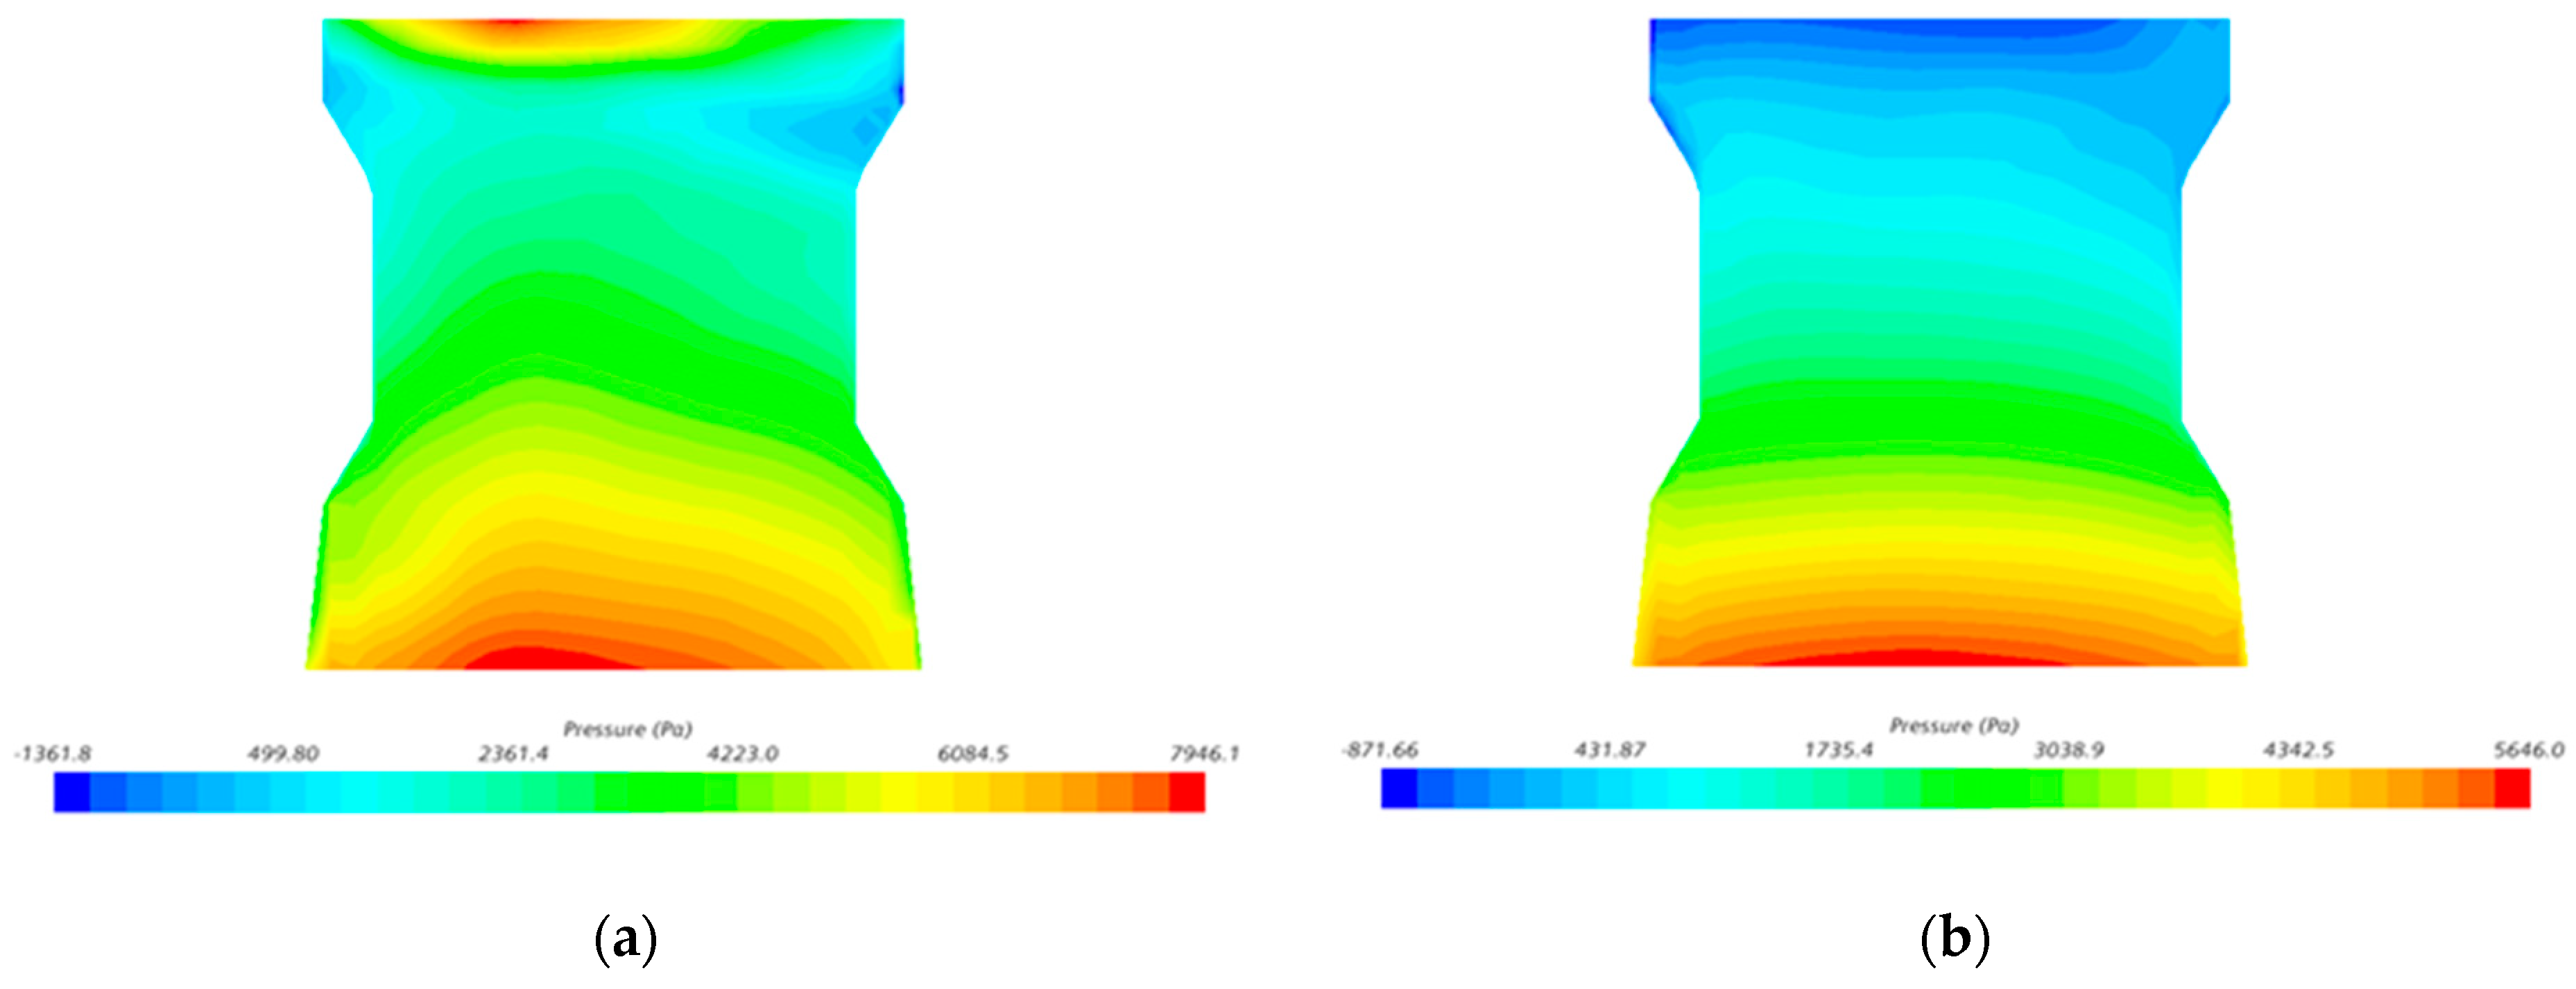
The troughs are all negative, which is even greater near the platform’s center of gravity, and the trough is −34.15 kPa at Point A1. This is because the liquid gets mixed with gas, and the column is impacted; the cavity acts as a buffer during the impact and generates a negative pressure when the liquid is detached from the structure’s surface. Figure 22 shows the Horizontal distribution and stress cloud diagram of the peak value of slamming pressure at the top of the column.
In DNV-RP-C205, the slamming pressure can be calculated as follows:
is the slamming pressure coefficient, which is usually determined according to experience or test. For this model, . is the relative velocity of the structure surface to the water quality point. According to the average value of velocity in five wave periods calculated when T = 10 s and H = 15 m, the maximum value of percussion load is calculated to be 247.31 kPa. Compared with 229.93 kPa calculated by CFD, the error is about 7.03%, which is within the acceptable range.
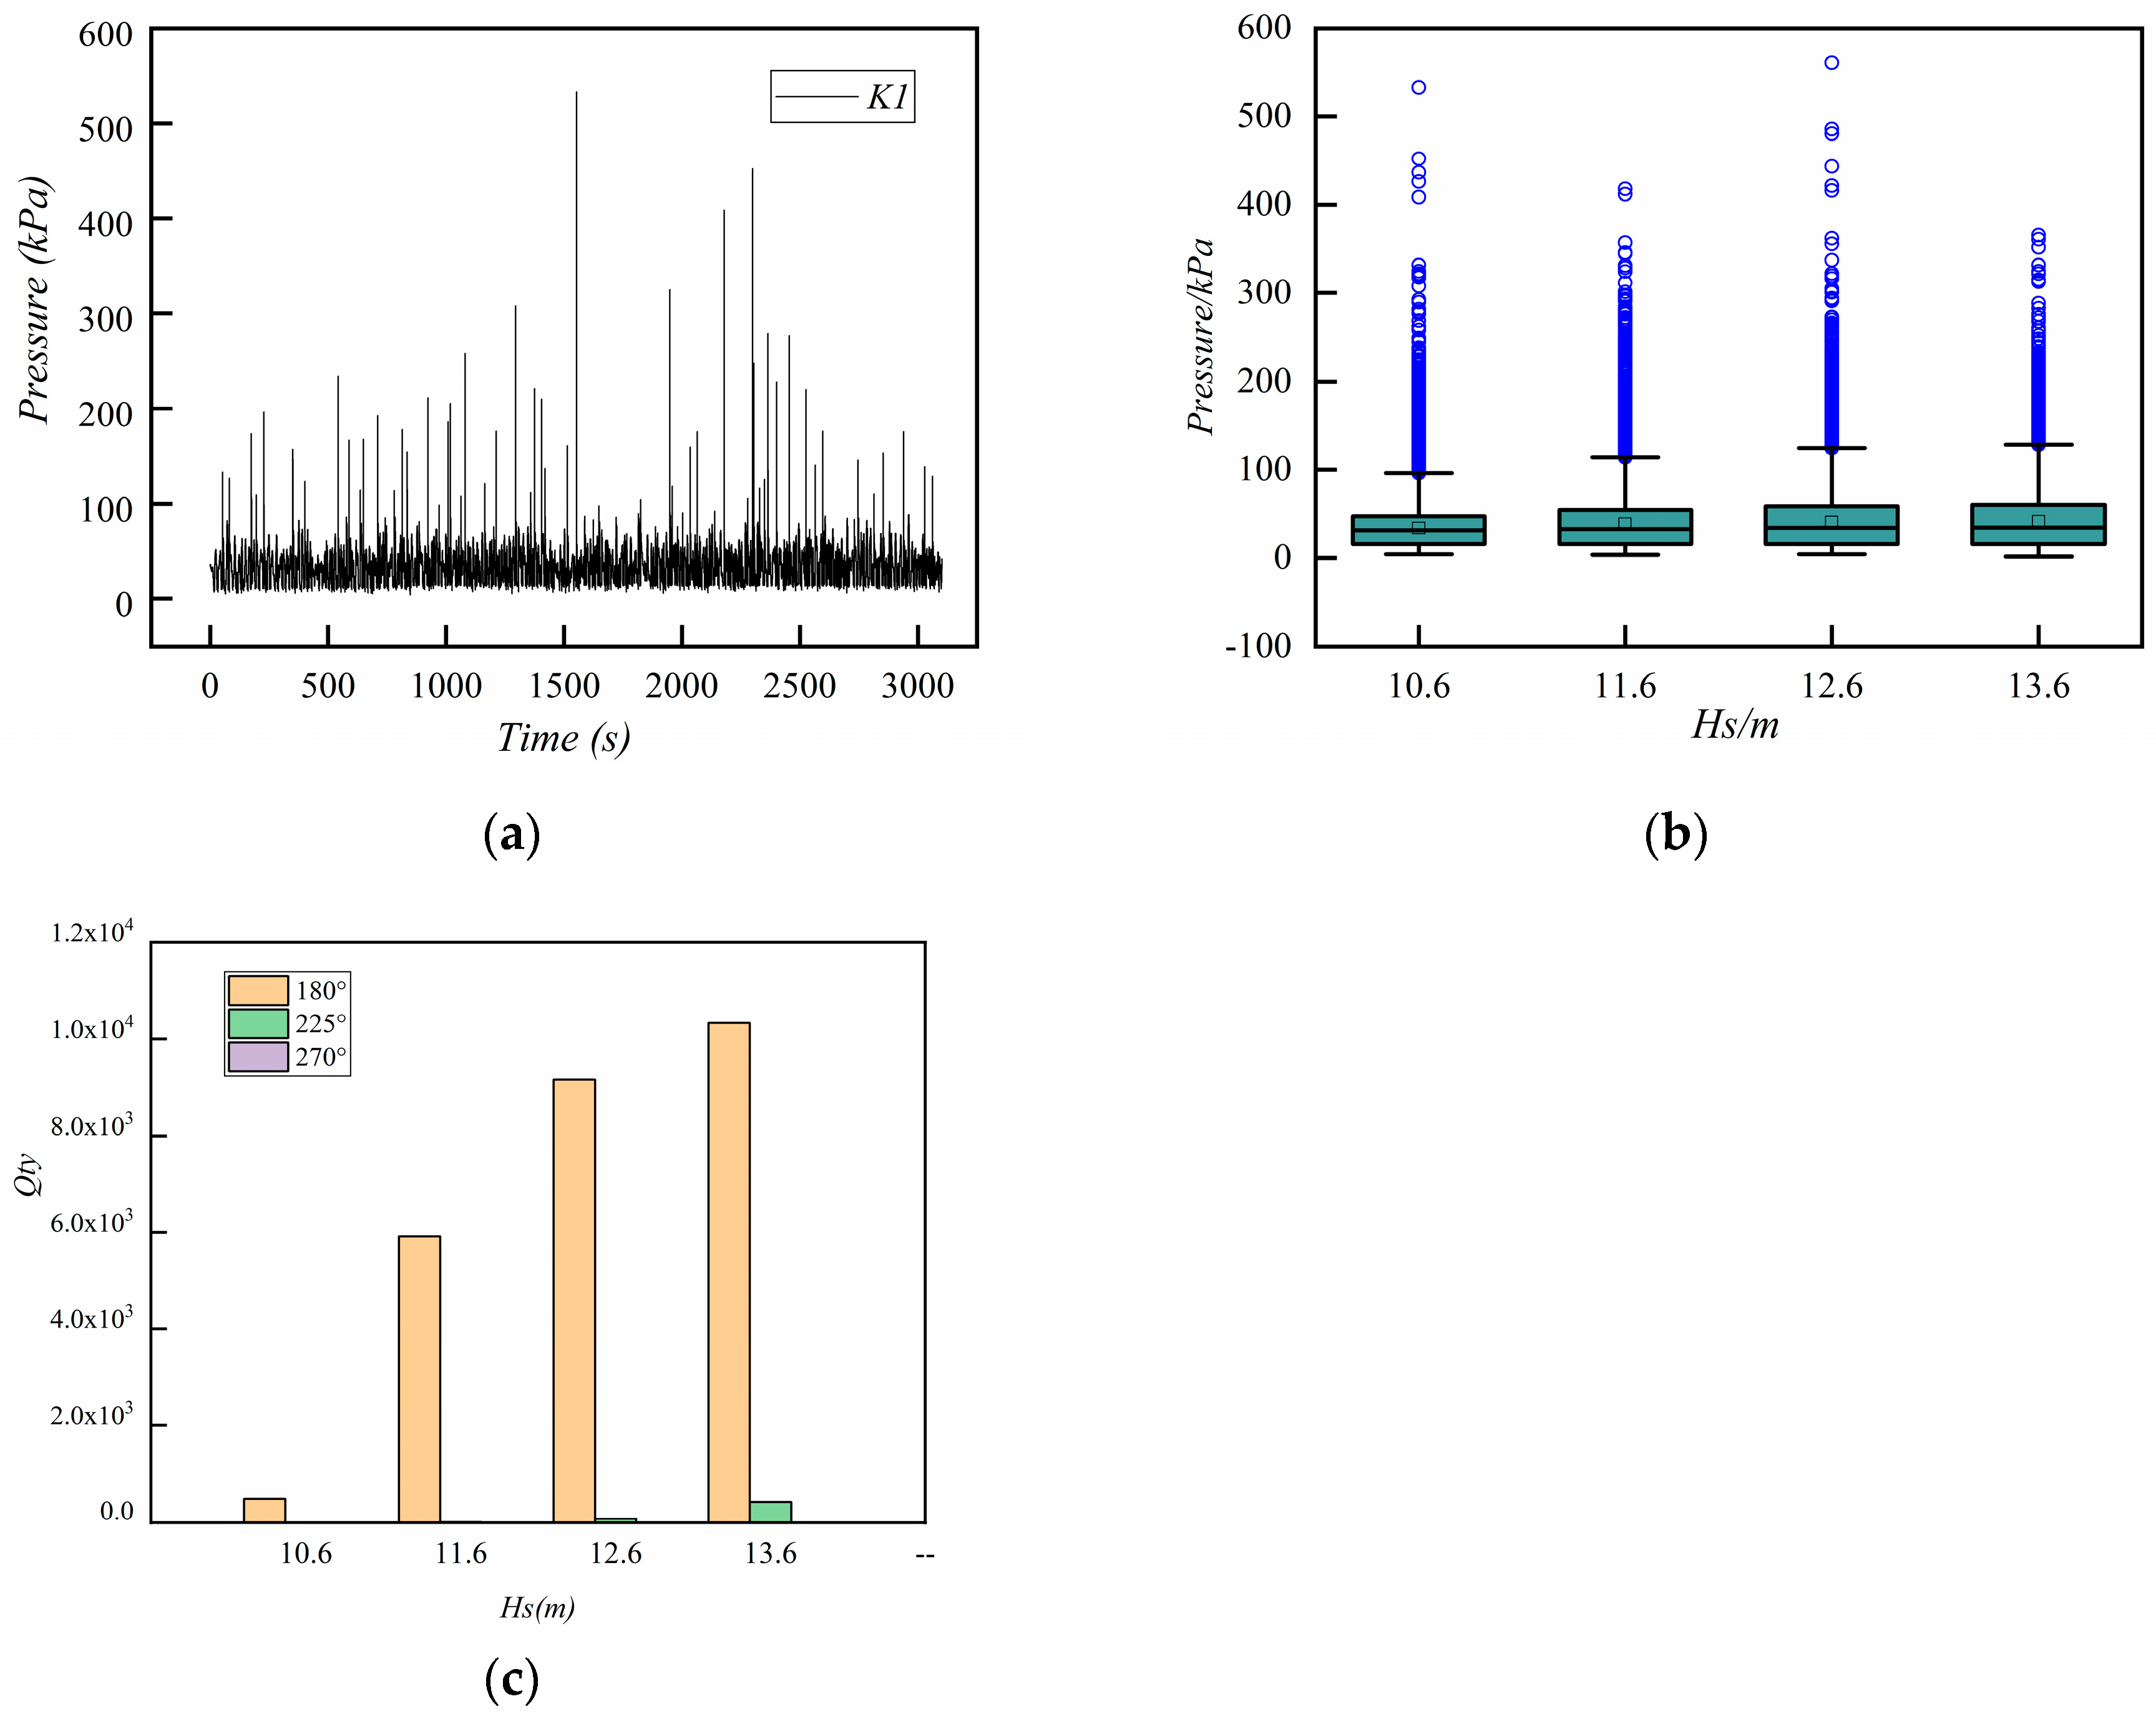
In the process of irregular wave slamming the platform, most of the slam-pressure readings are clustered between 0 and 100 kPa within 3000 s, but there are several steep increases in peak pressure up to 533.14 kPa, which is similar to the pulsating characteristics of the pressure in the case of a regular wave. In the box line diagram of Figure 21b, with Hs = 10.6 m, the whisker line above the box is the 99th percentile value, and 99% of the pressure values are within 80.1 kPa, which means that 1% of the pressure distribution is between 80.1 and 533.14 kPa. This indicates that the slamming pressure has strong randomness, divergence, and nonlinearity.
Corresponding to a significant wave height of 10.6 m, 11.6 m, 12.6 m, and 13.6 m, the 99th percentile values were 80.11, 108.86, 109.79, and 115.16 kPa, exhibiting a slightly increasing trend corresponding to the increase in the significant wave height. However, the peaks did not increase with the wave height, and the peak slam pressures of 533.14 and 560.48 kPa were generated at Hs = 10.6 and 12.6 m, respectively. Because most of the measured slam pressures were clustered within 100 kPa, the loads above 100 kPa were defined as effective slam loads.
The number of influential slamming events was counted for 3000 s, and it was found that most of them occurred at β = 180°, as evident from Figure 23c, which indicates that the slamming load is sensitive to change in the wave direction. Congruently, it was also observed that the change in wave height significantly influences the number of influential slamming events when β = 180°. Over 10,000 effective slamming events were generated at Hs = 13.6 m, whereas at Hs = 10.6 m, only a few hundred influential slamming events were developed: an exponential reduction. This means that slamming events can also be significantly reduced when column-stabilized semi-submersible platforms are in operation, as long as the wave height can be decreased slightly or the platform can adjust its angle regarding the wave direction.
The uncertainty in this test includes the uncertainty of the instrument and the uncertainty of the reproduction of environmental conditions. Type A uncertainty analysis was carried out on the percussion load measured at point K1. The pressure output results in the test with an average peak value of 5749 Pa were selected when T = 0.9 s and H = 0.15 m. The Bessel method was used to evaluate the Type A uncertainty.
Type B uncertainty mainly comes from the pressure sensor. The error range of the C200 series pressure sensor is ±0.25%. The result of Class B uncertainty is
Then the resultant uncertainty result is
Therefore, the uncertainty of the measured pressure is 3.3‰ ± 2 Pa of the measured value, which meets the test requirements.
6. Conclusions
This study established a model of a semi-submersible platform and mooring system using the CFD method. The sensitivity of platform motion response and slamming pressure on the column to waves was systematically investigated. The distribution of slamming pressure on the column surface was obtained, and the influence of platform motion on column slamming was discussed. The numerical model accuracy was verified through basin tests. Specific results are as follows:
- Pitch and heave of the platform appear to be very sensitive to changes in wave period and height, with the pitch improving at an incidence angle of 270°.
- The column’s upper, middle, and lower parts are subjected to different slam loads. The slam load at the bottom of the column has a sharp rising section and a slowly fluctuating falling section; the middle of the column has a prominent ‘double-peak’ effect; the upper end of the column has a more obvious pressure oscillation effect, and a negative pressure is generated after the peak pressure. On the surface of the column, as the heave height rises, the slamming load shows an inverted-U shape that first decreases and then increases.
- Compared to the fixed platforms, the columns of the anchored platforms show a tendency to have higher slamming loads at the bottom and lower slamming loads at the top.
- At the top of the column, the maximum slam load occurs closer to the platform’s center of gravity, while at the edge of the column, it decreases sharply.
- There is a robust nonlinear characteristic of the slamming load where the 99th percentile value increases with the wave height; however, there is no clear link between the peak and significant wave height.
- The influential slamming events occur almost exclusively at β = 180°, i.e., when the wave direction is perpendicular to the column, indicating that the angle of the incident wave has a significant effect on the slam-load amplitude.
Overall, this study introduces a novel approach for investigating the motion response of semi-submersibles in waves and the mechanism of wave slamming, and verified by the basin test. The findings offer valuable references for the structural design of deep-sea floating platforms. In the next step, we can focus on the platform structure deformation caused by slamming pressure and subsequent FSI works.
Author Contributions
Conceptualization, Z.Y. and Y.M.; methodology, Z.Y. and F.H.; software, Z.Y.; validation, Y.Z., C.T. and K.J.; data curation, Y.Z., C.T. and K.J.; writing—original draft preparation, Z.Y.; writing—review and editing, Z.Y., Y.M. and D.L.; project administration, F.H. and Y.M.; funding acquisition, F.H. and Y.M. All authors have read and agreed to the published version of the manuscript.
Funding
The research was funded by the National Natural Science Foundation of China (No. 51779062, 52071348, 52071161), the General Project of Guangdong Province Department of Natural Resources to Promote High-Quality Economic Development (No. GDOE [2022]30), and the Innovation Group Project of Southern Marine Science and Engineering Guangdong Laboratory (Zhuhai) (No. 311021014).
Institutional Review Board Statement
Not applicable.
Informed Consent Statement
Not applicable.
Data Availability Statement
Not applicable.
Conflicts of Interest
The authors declare no conflict of interest.
References
- Wang, H. Water Wave Pressure on Horizontal Plate. Am. Soc. Civ. Eng. 1970, 96, 1997–2017. [Google Scholar] [CrossRef]
- Elghamry, O.A. Uplift Forces on Platform Decks. In Proceedings of the Offshore Technology Conference, Houston, TX, USA, 18–20 April 1971. [Google Scholar]
- Greco, M.; Landrini, M.; Faltinsen, O.M. Impact flows and loads on ship-deck structures. J. Fluids Struct. 2004, 19, 251–275. [Google Scholar] [CrossRef]
- Greco, M.; Colicchio, G.; Faltinsen, O.M. Bottom slamming for a Very Large Floating Structure: Coupled global and slamming analyses. J. Fluids Struct. 2009, 25, 420–430. [Google Scholar] [CrossRef]
- Faltinsen, O.M.; Landrini, M.; Greco, M. Slamming in marine applications. J. Eng. Math. 2004, 48, 187–217. [Google Scholar] [CrossRef]
- Faltinsen, O.M. Hydrodynamics of marine and offshore structures. J. Hydrodyn. 2014, 26, 835–847. [Google Scholar] [CrossRef]
- Yan, D.; Mikkola, T.; Kujala, P.; Hirdaris, S. Hydroelastic analysis of slamming induced impact on stiff and flexible structures by two-way CFD-FEA coupling. Ships Offshore Struct. 2022, 1–13. [Google Scholar] [CrossRef]
- Yan, D.; Mikkola, T.; Lakshmynarayanana, A.; Tödter, S.; Schellin, T.E.; Neugebauer, J.; el Moctar, O.; Hirdaris, S. A study into the FSI modelling of flat plate water entry and related uncertainties. Mar. Struct. 2022, 86, 103296. [Google Scholar] [CrossRef]
- Tavakoli, S.; Babanin, A.V.; Hirdaris, S. Hydroelastic Analysis of Hard Chine Sections Entering Water—Observations for Use in Preliminary Design Stage. J. Offshore Mech. Arct. Eng. 2023, 145, 051901. [Google Scholar] [CrossRef]
- Kaplan, P. Theoretical analysis of wave impact forces on platform deck structures. In Proceedings of the 14th International Conference on Offshore Mechanics and Arctic Engineering, Copenhagen, Denmark, 18–22 June 1995. [Google Scholar]
- Scharnke, J.; Hennig, J. Vertical Wave Impact Loading on a Fixed Platform Deck. In Proceedings of the ASME 2015 34th International Conference on Ocean, Offshore and Arctic Engineering, St. John’s, NL, Canada, 31 May–5 June 2015; p. V003T002A046. [Google Scholar]
- Abdussamie, N.; Ojeda, R.; Amin, W.; Thomas, G.; Drobyshevski, Y. Prediction of Wave-in-Deck Loads on Offshore Structures Using CFD. In Proceedings of the 19th Australasian Fluid Mechanics Conference, Melbourne, Australia, 8–11 December 2014. [Google Scholar]
- Abdussamie, N. Towards Reliable Prediction of Wave-in-Deck Loads and Response of Offshore Structures. Ph.D. Thesis, Australian Maritime College, Newnham, Australia, 2016. [Google Scholar]
- Abdussamie, N.; Ojeda, R.; Thomas, G.; Amin, W. Measurements of global and local effects of wave impact on a fixed platform deck. Proc. Inst. Mech. Eng. Part M J. Eng. Marit. Environ. 2017, 231, 212–233. [Google Scholar] [CrossRef]
- Stansberg, C.T.; Baarholm, R.; Kristiansen, T.; Hansen, E.; Rortveit, G. Extreme Wave Amplification and Impact Loads On Offshore Structures. In Proceedings of the Annual Offshore Technology Conference, Huston, TX, USA, 2–5 May 2005; pp. 1450–1459. [Google Scholar]
- Kazemi, S.; Incecik, A. Numerical Prediction of Air Gap Response of Floating Offshore Structures Using Direct Boundary Element Method. In Proceedings of the ASME 2005 24th International Conference on Offshore Mechanics and Arctic Engineering, Halkidiki, Greece, 12–17 June 2005. [Google Scholar]
- Iwanowski, B.; Lefranc, M.; Wemmenhove, R. CFD Simulation of Wave Run-Up on a Semi-Submersible and Comparison with Experiment. In Proceedings of the 28th International Conference on Ocean, Offshore and Arctic Engineering, Honolulu, HI, USA, 31 May–5 June 2009; pp. 19–29. [Google Scholar]
- Li, J.; Huang, Z.; Tan, S. Extreme Air-gap Response Below Deck of Floating Structures. Int. J. Ocean Clim. Syst. 2010, 1, 15–26. [Google Scholar] [CrossRef]
- Matsumoto, F.T.; Watai, R.; Simos, A.N.; Ferreira, M. Wave Run-Up and Air Gap Prediction for a Large-Volume Semi-Submersible Platform. J. Offshore Mech. Arct. Eng. 2013, 135, 011302. [Google Scholar] [CrossRef]
- Liang, X.; Yang, J.; Xiao, L.; Xin, L.; Li, J. Numerical Study of Air Gap Response and Wave Impact Load on a Moored Semi-Submersible Platform in Predetermined Irregular Wave Train. In Proceedings of the ASME 2010 29th International Conference on Ocean, Offshore and Arctic Engineering, Shanghai, China, 6–11 June 2010. [Google Scholar]
- Sweetman, B.; Winterstein, S.; Stokka, T.; Statoil, M.; Stavanger, N.; Jorn, B.; Det, N.; Veritas, H. Airgap Prediction Use of Second-Order Diffraction and Multi-Column Models. In Proceedings of the Eleventh International Offshore and Polar Engineering Conference, Stavanger, Norway, 17–22 June 2001. [Google Scholar]
- Kapsenberg, G.K. Slamming of ships: Where are we now? Philos. Trans. R. Soc. Lond. Ser. A 2011, 369, 2892–2919. [Google Scholar] [CrossRef]
- Wang, S.; Xiang, G.; Soares, C.G. Assessment of three-dimensional effects on slamming load predictions using OpenFoam. Appl. Ocean Res. 2021, 112, 102646. [Google Scholar] [CrossRef]
- Luo, H.B.; Gao, Y.; Hong-Ye, J.I.; Jia-Jun, H.U.; Geng, Y.C. Efficient Simulation of the Slamming Loads Using the Hybrid Two-Step Solution. J. Ship Mech. 2018, 22, 353–364. [Google Scholar]
- Smith, N.; Stansby, P.; Wright, J. The slam force on a flat plate in free flight due to impact on a wave crest. J. Fluids Struct. 1998, 12, 183–196. [Google Scholar] [CrossRef]
- Kisacik, D.; Troch, P.; Van Bogaert, P. Description of loading conditions due to violent wave impacts on a vertical structure with an overhanging horizontal cantilever slab. Coast. Eng. 2012, 60, 201–226. [Google Scholar] [CrossRef]
- Mai, T.; Mai, C.; Raby, A.; Greaves, D. Aeration effects on water-structure impacts: Part 1. drop plate impacts. Ocean Eng. 2019, 193, 106600. [Google Scholar] [CrossRef]
- Santo, H.; Taylor, P.H.; Dai, S.S.; Day, A.H.; Chan, E.S. Wave-in-deck experiments with focussed waves into a solid deck. J. Fluids Struct. 2020, 98, 103139. [Google Scholar] [CrossRef]
- Ha, Y.J.; Kim, K.H.; Bo, W.N.; Hong, S.Y.; Kim, H. Experimental study for characteristics of slamming loads on bow of a ship-type FPSO under breaking and irregular wave conditions. Ocean Eng. 2021, 224, 108738. [Google Scholar] [CrossRef]
- Wei, Z.; Shen, L.; Wu, C.; Sun, K.; Zhai, G. Experimental investigation of the entrapped air on the hydroelasticity induced by liquid slamming under shallow-water condition. Ocean Eng. 2021, 227, 108867. [Google Scholar] [CrossRef]
- Menter, F.R. Two-equation eddy-viscosity turbulence models for engineering applications. AIAA J. 1994, 32, 1598–1605. [Google Scholar] [CrossRef]
- Huo, F.; Zhao, Y.; Zhang, J.; Zhang, M.; Yuan, Z.-M. Study on wave slamming characteristics of a typical floating wind turbine under freak waves. Ocean Eng. 2023, 269, 113464. [Google Scholar] [CrossRef]
Figure 1.
The catenary coupling element.

Figure 2.
The operational procedure of the numerical model.

Figure 3.
The three-dimensional schematic of the model and coordinates of the reference system are shown in (a), with the origin of the coordinates located at the center of gravity of the overall structure. The model’s weight is required to be similar to that of the prototype to meet the Froude number during the test: the draft and discharge of the model are regulated by ballast after the model is completed. Top view of the model was indicated in (b).

Figure 4.
(a) The overall appearance of the test model. (b) The location of the monitoring points.

Figure 5.
Side-view diagram of the test model after installation.

Figure 6.
Top-view diagram of the test model after installation.

Figure 7.
The numerical and experimental flow chart.

Figure 8.
(a) Computational domain and boundary conditions; (b) The dimensions of the computational domain.
Figure 8.
(a) Computational domain and boundary conditions; (b) The dimensions of the computational domain.

Figure 9.
The pressure of K2 point with three foundation mesh sizes.

Figure 10.
(a) A 3D view of the grid; (b) Grid view of x–z cross-section; (c) Grid view of y–z cross-section; (d) Grid division of the free surface.
Figure 10.
(a) A 3D view of the grid; (b) Grid view of x–z cross-section; (c) Grid view of y–z cross-section; (d) Grid division of the free surface.

Figure 11.
(a) Location of the slam-pressure monitoring points K1 to K8. (b) Location of the slam-pressure monitoring points A1 to A22, L1 to L9, C1 to C9 and R1 to R9.
Figure 11.
(a) Location of the slam-pressure monitoring points K1 to K8. (b) Location of the slam-pressure monitoring points A1 to A22, L1 to L9, C1 to C9 and R1 to R9.

Figure 12.
Pitch of the experimental and numerical model at a platform inclination of 5°.

Figure 13.
Comparison of slamming pressure at K1 between experimental data and numerical results. Test conditions are: (a) H = 15 m, T = 9 s; (b) H = 15 m, T = 10 s.
Figure 13.
Comparison of slamming pressure at K1 between experimental data and numerical results. Test conditions are: (a) H = 15 m, T = 9 s; (b) H = 15 m, T = 10 s.

Figure 14.
The maximum amplitude of the six-degree-of-freedom motion of the platform in the basin test under regular wave conditions. (a) β = 180°, T = 9–13 s, and H = 15 m; (b) β = 180°, T = 12 s, and H = 10~25 m.
Figure 14.
The maximum amplitude of the six-degree-of-freedom motion of the platform in the basin test under regular wave conditions. (a) β = 180°, T = 9–13 s, and H = 15 m; (b) β = 180°, T = 12 s, and H = 10~25 m.

Figure 15.
(a) Top view of platform affected by waves. (b) The maximum amplitude of the six-degree-of-freedom motion of the platform in the basin test under regular wave conditions, β = 180°, 225° and 270°, T = 9 s, and H = 15 m.
Figure 15.
(a) Top view of platform affected by waves. (b) The maximum amplitude of the six-degree-of-freedom motion of the platform in the basin test under regular wave conditions, β = 180°, 225° and 270°, T = 9 s, and H = 15 m.

Figure 16.
(a) Time history of slamming pressure at C1–C9 and A6 and A17 in four periods. (b) Time history of slamming pressure at C1–C9 and A6 and A17 in one periods.
Figure 16.
(a) Time history of slamming pressure at C1–C9 and A6 and A17 in four periods. (b) Time history of slamming pressure at C1–C9 and A6 and A17 in one periods.

Figure 17.
(a–c) Distribution of slamming pressure on the surface of the column during a wave period. (d) Side view of the platform moving in the waves.
Figure 17.
(a–c) Distribution of slamming pressure on the surface of the column during a wave period. (d) Side view of the platform moving in the waves.

Figure 18.
Experiment measurement of front and rear end column wave slamming column. (a) the wave slammed the front column. (b) the wave slammed the rear end column.
Figure 18.
Experiment measurement of front and rear end column wave slamming column. (a) the wave slammed the front column. (b) the wave slammed the rear end column.

Figure 19.
Wave slam pressure distribution on the surface measurement points at different height positions with the column in six degrees of freedom of movement and fixation.
Figure 19.
Wave slam pressure distribution on the surface measurement points at different height positions with the column in six degrees of freedom of movement and fixation.

Figure 20.
(a) Time history of slamming pressure at A1–A11 (b) Time history of slamming pressure at A12–A22.
Figure 20.
(a) Time history of slamming pressure at A1–A11 (b) Time history of slamming pressure at A12–A22.

Figure 21.
(a) The spatial distribution of pressure peaks and valleys at Points A1–A11. (b) The spatial distribution of pressure peaks and valleys at Points A12–A22.
Figure 21.
(a) The spatial distribution of pressure peaks and valleys at Points A1–A11. (b) The spatial distribution of pressure peaks and valleys at Points A12–A22.

Figure 22.
Horizontal distribution (a) and stress cloud diagram of the peak value of slamming pressure (b) at the top of the column.
Figure 22.
Horizontal distribution (a) and stress cloud diagram of the peak value of slamming pressure (b) at the top of the column.

Figure 23.
(a) β = 180°, Hs = 10.6 m, and Tp = 13.5 s, (b) β = 180°, Hs = 10.6~13.6 m, and Tp = 13.5 s (c) Number of pressures above 100 kPa recorded at point K1 on the front column at β = 180°, 225°, and 270°. Figure 23a shows the variation of slamming pressure at K1 with time for β = 180°, Hs = 10.6 m, and Tp = 13.5 s. Figure 23b shows the variation of slamming pressure with significant wave height for β = 180° and Tp = 13.5 s. Figure 23c shows the variation of slamming number with wave height and incidence angle.


Table 1.
Prototype and model values of platform parameters.
| Name | Real Scale | Reduced Scale | Unit |
|---|---|---|---|
| Length | 104.50 | 1.0450 | m |
| Width | 70.50 | 0.7050 | m |
| Height of main deck | 37.55 | 0.3755 | m |
| Height of pontoon | 10.05 | 0.1005 | m |
| Cross-sectional area of the column | 238.00 | 0.0238 | m2 |
| Center spacing of Pontoon | 37.50 | 0.3750 | m |
| Longitudinal column spacing | 55.00 | 0.5500 | m |
| Working draft | 15.50 | 0.1550 | m |
| Displacement | 38,400 | 0.0384 | m3 |
Table 2.
Working conditions of the regular wave.
| Case | Wave Height (m) | Period (s) | Direction of Incidence (°) |
|---|---|---|---|
| H1 | 0.15 | 0.9 | 180 |
| H2 | 0.15 | 1.0 | 180 |
| H3 | 0.15 | 1.1 | 180 |
| H4 | 0.15 | 1.2 | 180 |
| H5 | 0.15 | 1.3 | 180 |
| L1 | 0.15 | 1.2 | 180 |
| L2 | 0.15 | 1.2 | 180 |
| L3 | 0.15 | 1.2 | 180 |
| L4 | 0.15 | 1.2 | 180 |
| M1 | 0.15 | 0.9 | 180 |
| M2 | 0.15 | 0.9 | 225 |
| M3 | 0.15 | 0.9 | 270 |
Table 3.
Working conditions of the irregular wave (JONSWAP spectrum).
| Case | Hs (m) | Tp (s) | Direction of Incidence (°) |
|---|---|---|---|
| J1 | 1.06 | 0.9 | 180 |
| J2 | 1.16 | 1.0 | 180 |
| J3 | 1.26 | 1.1 | 180 |
| J4 | 1.36 | 1.2 | 180 |
Table 4.
Tensioned mooring line parameters.
| Type | Diameter mm | Wet Weight kg/m | Dry Weight kg/m | Axial Stiffness N | Breaking Strength N | Length of Polyethylene m | Length of Anchor Chain m |
|---|---|---|---|---|---|---|---|
| Prototype | 114 | 7 | 0.3 | 2.57 × 10⁸ | 7.35 × 10⁶ | 200 | 2 × 13 |
| Model | 1.14 | 6.83 × 10⁻⁴ | 2.93 × 10⁻⁴ | 250.7 | 7.17 | 2 | 2 × 0.13 |
Table 5.
Main dimensions of the platform.
| Structure | Actual Size | Model Dimensions | Unit |
|---|---|---|---|
| Length | 104.50 | 5.225 | m |
| Width | 70.50 | 3.525 | m |
| Height of Main Deck | 37.55 | 1.8775 | m |
| Height of Pontoon | 10.05 | 0.5025 | m |
| Center Spacing of Pontoon | 37.5 | 1.8750 | m |
| Center Spacing of Longitudinal Column | 55.0 | 2.7515 | m |
| Working Draft | 15.5 | 0.775 | m |
| Displacement | 38400 | 4.8 | m3 |
Table 6.
The results are observed over five wave periods.
| Case | Type | 1st Crest (kPa) | 2nd Crest (kPa) | 3rd Crest (kPa) | 4th Crest (kPa) | 5th Crest (kPa) | Average (kPa) |
|---|---|---|---|---|---|---|---|
| H1 | CFD | 254.62 | 236.13 | 278.88 | 286.34 | 258.63 | 262.92 |
| EXP | 242.06 | 290.61 | 318.56 | 248.68 | 246.29 | 269.24 | |
| H2 | CFD | 308.54 | 205.36 | 190.36 | 246.75 | 198.64 | 229.93 |
| EXP | 224.08 | 253.02 | 258.74 | 193.15 | 227.61 | 231.32 |
Disclaimer/Publisher’s Note: The statements, opinions and data contained in all publications are solely those of the individual author(s) and contributor(s) and not of MDPI and/or the editor(s). MDPI and/or the editor(s) disclaim responsibility for any injury to people or property resulting from any ideas, methods, instructions or products referred to in the content. |
© 2023 by the authors. Licensee MDPI, Basel, Switzerland. This article is an open access article distributed under the terms and conditions of the Creative Commons Attribution (CC BY) license (https://creativecommons.org/licenses/by/4.0/).
Share and Cite
MDPI and ACS Style
Yao, Z.; Huo, F.; Zhu, Y.; Tang, C.; Jia, K.; Li, D.; Ma, Y. Experimental and Numerical Investigation on Slamming Mechanism of a Mooring Column-Stabilised Semi-Submersible. Processes 2023, 11, 725. https://doi.org/10.3390/pr11030725
AMA Style
Yao Z, Huo F, Zhu Y, Tang C, Jia K, Li D, Ma Y. Experimental and Numerical Investigation on Slamming Mechanism of a Mooring Column-Stabilised Semi-Submersible. Processes. 2023; 11(3):725. https://doi.org/10.3390/pr11030725
Chicago/Turabian StyleYao, Zhi, Fali Huo, Yuanyao Zhu, Chenxuan Tang, Kunqiao Jia, Dong Li, and Yong Ma. 2023. "Experimental and Numerical Investigation on Slamming Mechanism of a Mooring Column-Stabilised Semi-Submersible" Processes 11, no. 3: 725. https://doi.org/10.3390/pr11030725
Note that from the first issue of 2016, this journal uses article numbers instead of page numbers. See further details here.