Article

Genesis Types and Migration of Middle and Lower Assemblages of Natural Gas in the Eastern Belt around the Penyijingxi Sag of the Junggar Basin, NW China

1
School of Geosciences, China University of Petroleum (East China), Qingdao 266580, China
2
Research Institute of Exploration and Development, PetroChina Xinjiang Oilfield Company, Karamay 834000, China
3
Baikouquan Oil Production Plant, PetroChina Xinjiang Oilfield Company, Karamay 834000, China
*
Author to whom correspondence should be addressed.
Processes 2023, 11(3), 689; https://doi.org/10.3390/pr11030689
Submission received: 3 February 2023 / Revised: 20 February 2023 / Accepted: 22 February 2023 / Published: 24 February 2023
(This article belongs to the Special Issue Physical, Chemical and Biological Processes in Energy Geoscience)

Abstract

:
This study analyzes the geochemical characteristics of natural gas composition, carbon isotope, and light hydrocarbon in the eastern belt around the Penyijingxi sag of the Junggar Basin. The result shows the that natural gas content is dominated by alkane gas, with low contents of heavy hydrocarbon and non-hydrocarbon components. The overall carbon isotopic composition of the alkanes shows a trend as δ13methane (C1) < δ13ethane (C2) < δ13propane (C3) < δ13butane (C4), and all δ13C1 values are <−30‰, which are typical of gases of organic origin. The natural gas is mainly coal-derived gas from the Lower Urho formation, mixed with a small amount of oil-associated gas from the Fengcheng formation. The vertical migration of natural gas resulted in the mixing of oil-associated gas and coal-derived gas and the mixing of alkane gas at different stages of the same origin, which should be the origin of carbon isotope inversion. The diffusion migration of carboniferous oil and gas reservoirs has led to differences in gas geochemical characteristics among gas wells. These migration characteristics of natural gas may indicate that the shallow layers are a favorable stratum for the next step of oil and gas exploration in the eastern belt around the Penyijingxi sag.

1. Introduction

There are two types of natural gas in sedimentary basins, inorganic and organic [1], and organic gas is further divided into oil-associated and coal-derived gas [2,3,4]. Inorganic gas is potentially associated with magmatic and deep-sea hydrothermal activity [5,6], with methane isotopes (δ13C1) within the range of −50‰ (generally −30‰) to 10‰ [7,8], while organic gas is derived from the pyrolysis of kerogen in sedimentary rocks and the secondary cracking gas of crude oil, with methane isotopes in the range of −75‰ to −30‰ [7]. The inorganic alkane gas polymerized step-by-step to form long-chain alkanes through C-C bonding and the lower bond energy of 12C-12C caused 12C to join the polymerization reaction first, showing a negative carbon isotope series of δ13methane (C1) > δ13ethane (C2) > δ13propane (C3) > δ13butane (C4) [9]. When alkane gas was generated from the degradation of kerogen, 12C-12C with lower bond energy broke preferentially than 13C-13C, leading to the gradual enrichment of δ13C in organic alkane gas with the increase of the carbon atom number, thus forming a positive carbon isotope series of δ13C1 < δ13C2 < δ13C3 < δ13C4 [10]. In cases of mixing alkane gases of different genesis or sources and oxidation by microorganisms (propane bacteria), the arrangement of δ13C may be confused [10,11,12]. The sedimentary environment controls the original carbon isotope composition of kerogen, and the carbon isotope of humic kerogen is greater than that of sapropelic kerogen [13]. Ethane has well inherited the difference of the original parent material, so that δ13C2 is used as an important indicator to identify the genetic type of natural gas [14,15]. The δ13C2 of alkane gas generated from sapropelic kerogen is generally lower than −29‰, and δ13C2 of alkane gas generated by humic kerogen is generally higher than −28‰ [11].
Compared with crude oil, natural gas has greater molecular activity, and its migration process and migration phase state are more complex and changeable [16,17]. Natural gas can migrate not only laterally along sand bodies and nonconforming surfaces, but also vertically through faults, fractures, and pores [16,18,19]. Under formation conditions, natural gas may successively appear in one or more phases: the water-soluble phase, the oil-soluble phase, the free phase, and the diffusion phase [19,20,21]. Geochemical parameters, such as CH4 content, C1/C2 value, stable carbon isotope, iC4/nC4 value, nitrogen-containing compounds and isotopes, and noble gas isotopes, are widely used in the research of natural gas migration [22,23,24]. During the migration of natural gas, the heavier hydrocarbon components like methane and isoalkanes will migrate preferentially over normal alkanes. Therefore, with the increase in migration distance, natural gas will have the trend of “methanation” and “isomerization” [20,25]. At the same time, isotope fractionation will also occur due to the “mass fractionation effect” and the “dissolution fractionation effect” [26].
Natural gas exploration in the Junggar Basin began in the early 1980s and made no significant breakthroughs until the discovery of the Mahe and Kelameili gas fields in the 21st century. The Basin’s total proven reserve has reached 2000 × 108 m3 [27]. According to China’s 4th fourth assessment of oil and gas resources, the proportion of proven gas reserves in the lower and middle assemblages of the Junggar Basin is about 12% and 5.1% [28], respectively, which is significantly lower than other petroliferous basins [29]. In the past few years, the carbon isotopic composition and source of alkane gas in the Junggar Basin have been studied [27,30]. However, there are some problems: (i) analyzing the genesis and source of natural gas from the perspective of the whole basin will lead to some work that is not deep enough; for instance, determining from which source rocks the natural gas comes. (ii) Regional research is mainly concentrated in the basin’s eastern, northwestern, and southern margins, with little research on the basin’s central portion. The early proven small gas reservoirs in the eastern belt around the Penyijingxi sag of the Junggar Basin, such as the Pen 5, Mobei 2, and Mobei 5 gas reservoirs, are all secondary hydrocarbon reservoirs formed by the re-accumulation of primary oil and gas reservoirs after damage and adjustment [31,32]. The phenomenon of damage and adjustment of such primary oil and gas reservoirs also occurs in the Tarim Basin, the Sichuan Basin, the Georgina Basin, the Lower Indus Basin, and other structurally active basins [33,34,35,36].
Therefore, by analyzing the geochemical characteristics of natural gas in the eastern ring of the Penyijingxi sag, we hope to explain the genesis and source of natural gas as well as clarify the migration characteristics of natural gas after reservoir formation. This study can not only provide some important information for hydrocarbon exploration in the central part of the Junggar Basin, but also provide some ideas for natural gas research in other similar basins.

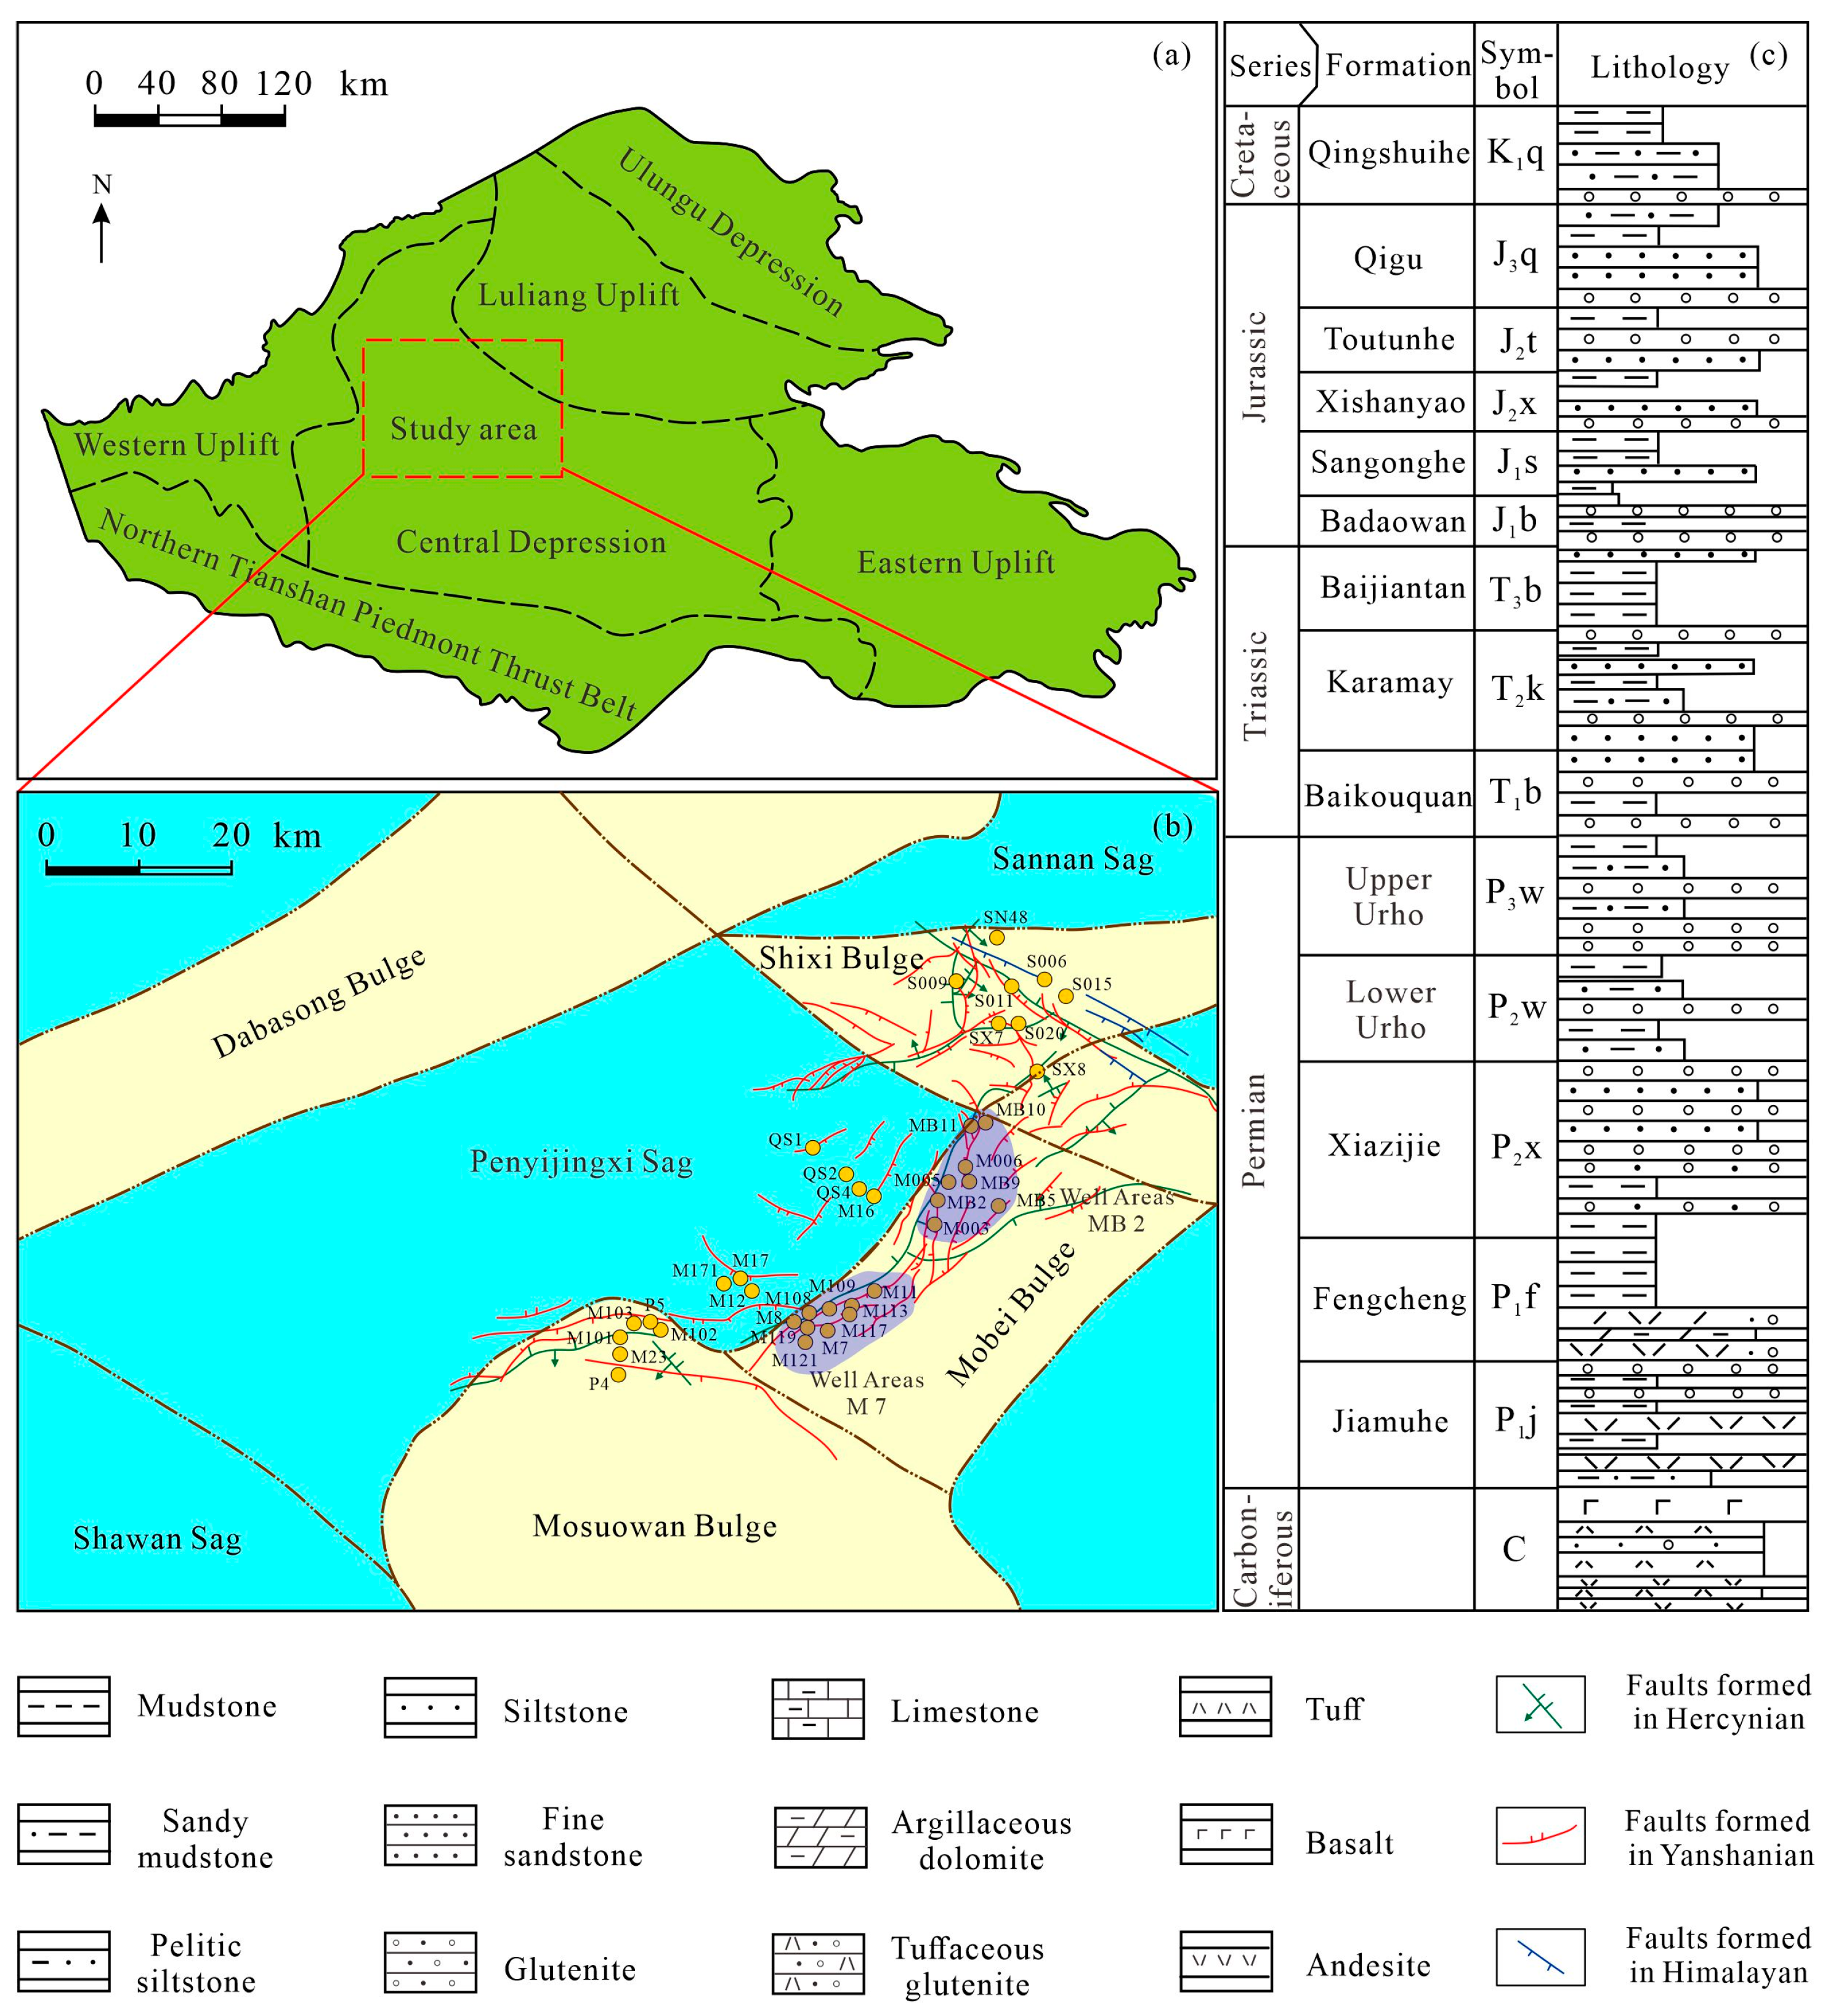
2. Geological Setting

Located between the Siberian plate, the Kazakhstan plate, and the Tarim plate, the Junggar Basin is an important part of the Central Asian orogenic belt [37]. The Junggar Basin has experienced multiple tectonic movements, such as Hercynian, Indosinian, Yanshan, and Himalayan, and has formed the current tectonic framework [38]. It can be divided into six primary tectonic units: two depressions (Ulungu and Central Depressions), three uplifts (Luliang, Western, and Eastern Uplifts), and one piedmont thrust belt (Northern Tianshan Piedmont Thrust Belt) (Figure 1a). These six primary tectonic units can be further divided into 44 secondary tectonic units. In the basin, there are three reservoir-caprock assemblages (upper, middle, and lower ones), bounded by two regional mudstone caprocks in the Lower Cretaceous Tugulu Group (including the Qingshuihe formation, Hutubihe formation, Shengjinkou formation, and Lianqinmu formation) and the Upper Triassic Baijiantan formation [39]. Specifically, the lower assemblage mainly consists of the Permian and Carboniferous and the middle assemblage mainly consists of the Jurassic strata. In this study, the eastern belt around the Penyijingxi sag consists of the southern part of the Shixi bulge, the Mobei bulge, the western member of the Mosuowan bulge, and the eastern part of the Penyijingxi sag (Mobei Slope) (Figure 1b). The sedimentary sequence of the study area is Carboniferous, Permian, Triassic, Jurassic, Cretaceous, Paleogene, Neogene, and Quaternary (Figure 1c, the shallow stratum of the Qingshuihe formation, is not listed). The Carboniferous, Jiamuhe formation, Fengcheng formation, Lower Urho formation, Badaowan formation, and Xishanyao formation source rocks are deposited (Figure 1c) [40]. In the past few years, many commercial gas wells have been found in the study area (Figure 1b). Affected by the drilling depth, the proved natural gas in the north of the study area is mainly distributed in the Carboniferous and Jurassic; the proved natural gas in the south is mainly distributed in the Jurassic.

3. Analytical Methods

In this study, 54 gas samples were collected from 36 wells in the eastern belt around the Penyijingxi sag for analysis of natural gas components and carbon isotopes of alkanes and light hydrocarbons (Table 1). The gas phase samples were directly collected from the wellhead using stainless steel cylinders with a diameter of 25 cm, and the gas pressure was about 2~3 MPa. After sample collection, the cylinders were placed in water to check the airtightness. The analysis and testing of the samples were completed by the Experimental Testing Research Institute of PetroChina’s Xinjiang Oilfield Branch.

3.1. Components of the Natural Gas

The composition (methane-pentane) of natural gas was analyzed by an Agilent 7890A gas chromatograph. The sample pretreatment and test process refer to the standard of natural gas composition analysis of the People’s Republic of China (GB/T 13610-2020). Before each experiment, we carried out two or more consecutive standard gas injection checks to control the difference between the response values of each component within 1%. Therefore, the experimental results are reliable. The instrument was equipped with two thermal conductivity detectors and one flame ionization detector. In the experiment, a constant-temperature heating furnace was used to keep the sample temperature around 75 °C and make the sample composition uniform. High-purity (99.999%) helium was used as the carrier gas, with a flow rate of 2 mL/min. The outlet pressure of the cylinder was controlled at 0.2 MPa and the air flow rate at 80 mL/min. The split ratio was controlled at 150:1. DB-1 chromatographic columns were used in the experiment. The initial temperature of the chromatographic column box was 40 °C (for 2 min), and then the temperature rose to 90 °C at a rate of 10 °C/min, and then to 200 °C at a rate of 5 °C/min (for 5 min). Finally, the composition of the test sample was determined by the retention time of the standard gas.

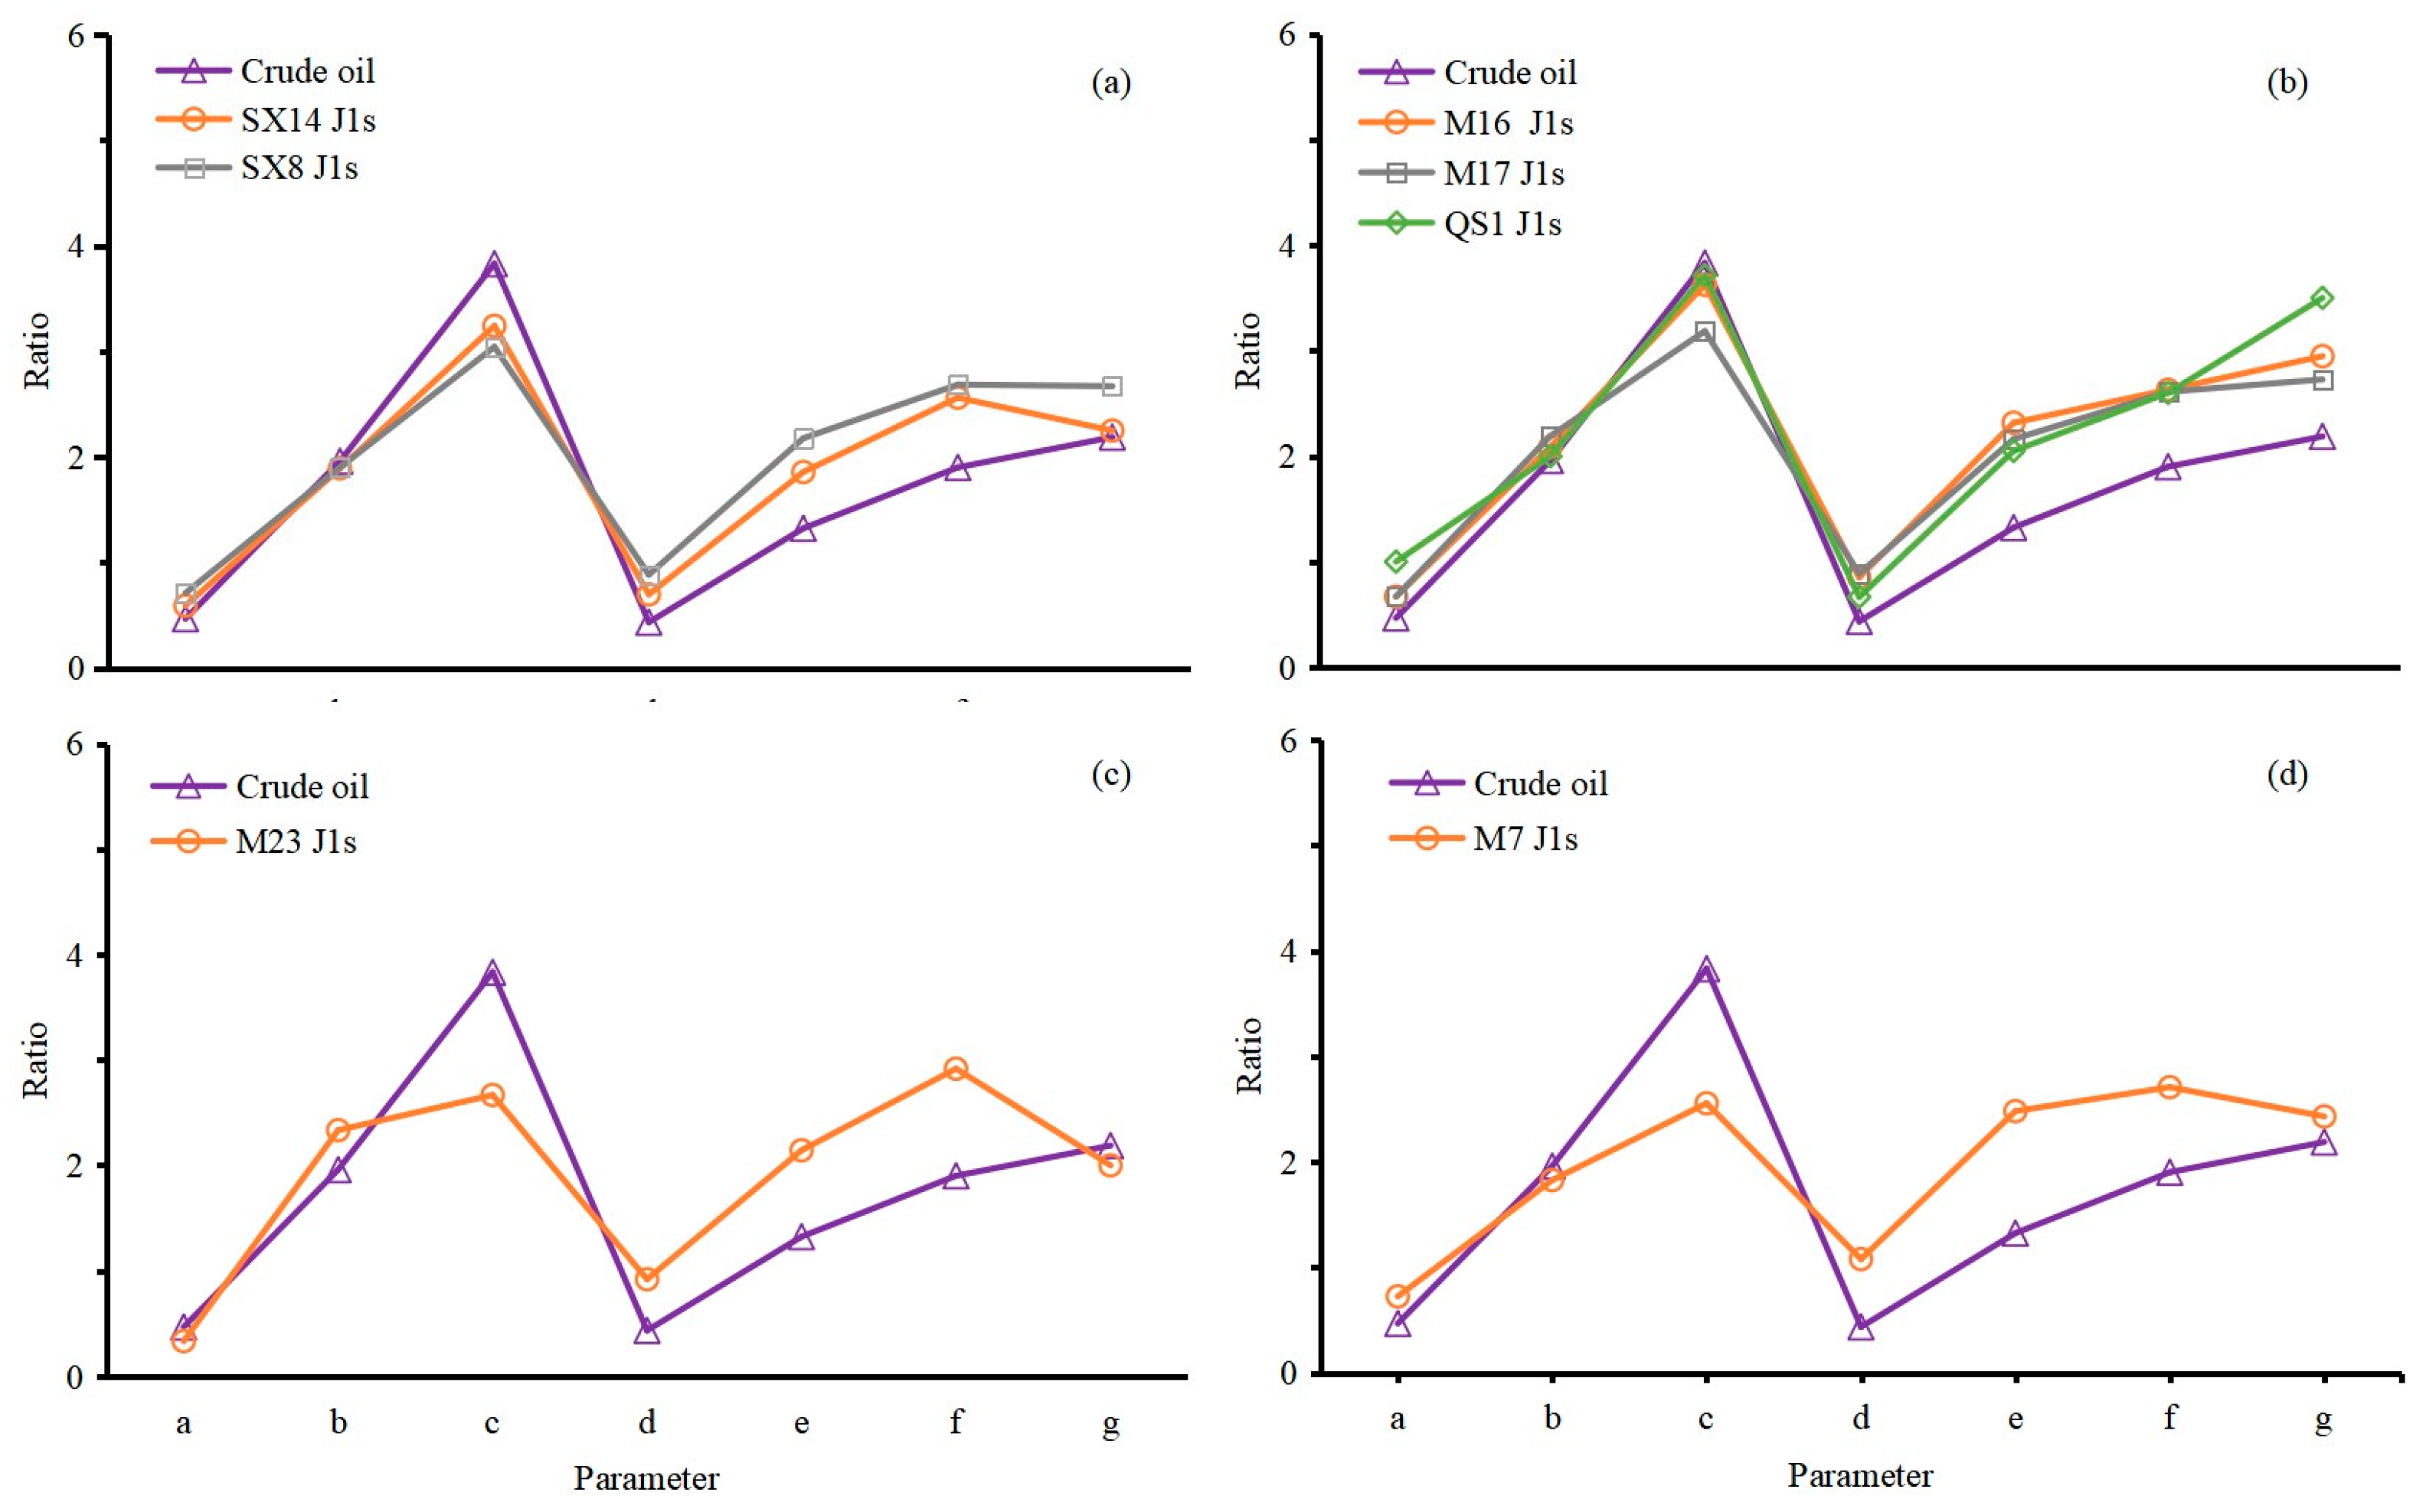
3.2. Natural Gas Light Hydrocarbon

The Agilent 6890B gas chromatograph was used for light hydrocarbon (pentane-octane) analysis of natural gas. The sample pretreatment and experimental process refer to the oil and natural gas industry standard of the People’s Republic of China for stable light component analysis (SY/T 0542-2008). The instrument was also equipped with a thermal conductivity detector and a flame ionization detector. The constant temperature furnace was also used to heat the sample in the experiment. High-purity (99.999%) helium was used as the carrier gas with a flow rate of 1 mL/min. The outlet pressure of the cylinder was controlled at 0.2 MPa and the air flow rate at 80 mL/min. The split ratio was controlled at 150:1. Pona chromatographic columns were used in the experiment. The initial temperature of the chromatographic column box was 30 °C (for 15 min), and then the temperature was raised to 70 °C at a rate of 3 °C/min, and then to 300 °C (for 10 min) at a rate of 3 °C/min. As in Section 3.1, the composition of the test sample was determined by the retention time of the standard gas. Each sample was measured repeatedly to ensure that the difference between the two measurement results was not greater than the precision specified in the standard. Then, the arithmetic mean of the two measurement results was used as the analysis result. Therefore, the experimental results are reliable.

3.3. Carbon Isotopic Composition of the Natural Gas

The carbon isotope analysis of natural gas was completed on the Delta V Advantage isotope mass spectrometer connected with the Agilent 7890A gas chromatograph. The sample pretreatment and experimental process refer to the organic geochemical analysis standard of geological samples of the People’s Republic of China (GB/T 18340.2-2010). First, the components of natural gas were separated using an Agilent 7890A gas chromatograph (the experiment used an HP-5MS column). Then, the hydrocarbon gas was sent into the isotope mass spectrometry oxidation furnace to be converted into CO2. Finally, CO2 was introduced into the Delta V Advantage isotope mass spectrometer to determine the carbon isotope composition. The initial temperature of the chromatographic column box was 40 °C (for 5 min), and then it rose to 200 °C (for 18 min) at 10 °C/min. The experiment used high-purity (99.999%) helium as the carrier gas at a flow rate of 2 mL/min. The split ratio of the methane carbon isotope analysis was 50:1 and the split ratio of the ethane-pentane isotope analysis was 10:1. The standard samples for experimental analysis were obtained from the national standard material sharing platform of China. The experimental results are based on the VPDB standard. The precision of the carbon isotope determination meets the requirements that the repeatability value (r) is lower than 0.4 and the reproducibility value (R) is lower than 0.5, which can be considered reliable.

4. Results

4.1. Components of the Natural Gas

The natural gas in the eastern belt around the Penyijingxi sag is absolutely dominated by alkane gases. The volume fraction of methane varies from 71.36% to 93.34%, with an average of 87.94% (Table 2). Natural gas has a dryness coefficient ranging from 0.76 to 0.95, averaging 0.91, and is dominated by wet gas. The wide range of its dryness coefficient indicates that the natural gas may be generated by source rocks at different stages of thermal evolution. The non-hydrocarbons in natural gas are mainly N2 (volume fraction: 0.69–11.95%, with an average of 2.56%) and CO2 (volume fraction: 0–1.49%, with an average of 0.45%). The gas composition varies among the zones: the gas in the Shixi bulge has a relatively low content of CH4, with an average of less than 80%, and a relatively high content of N2, averaging 6.75%. The gas in the Mobei bulge, Mobei Slope, and Mosuowan bulge has a relatively high content of CH4, with an average greater than 87.58%, and a relatively low content of N2, averaging less than 3.0% (Table 2).

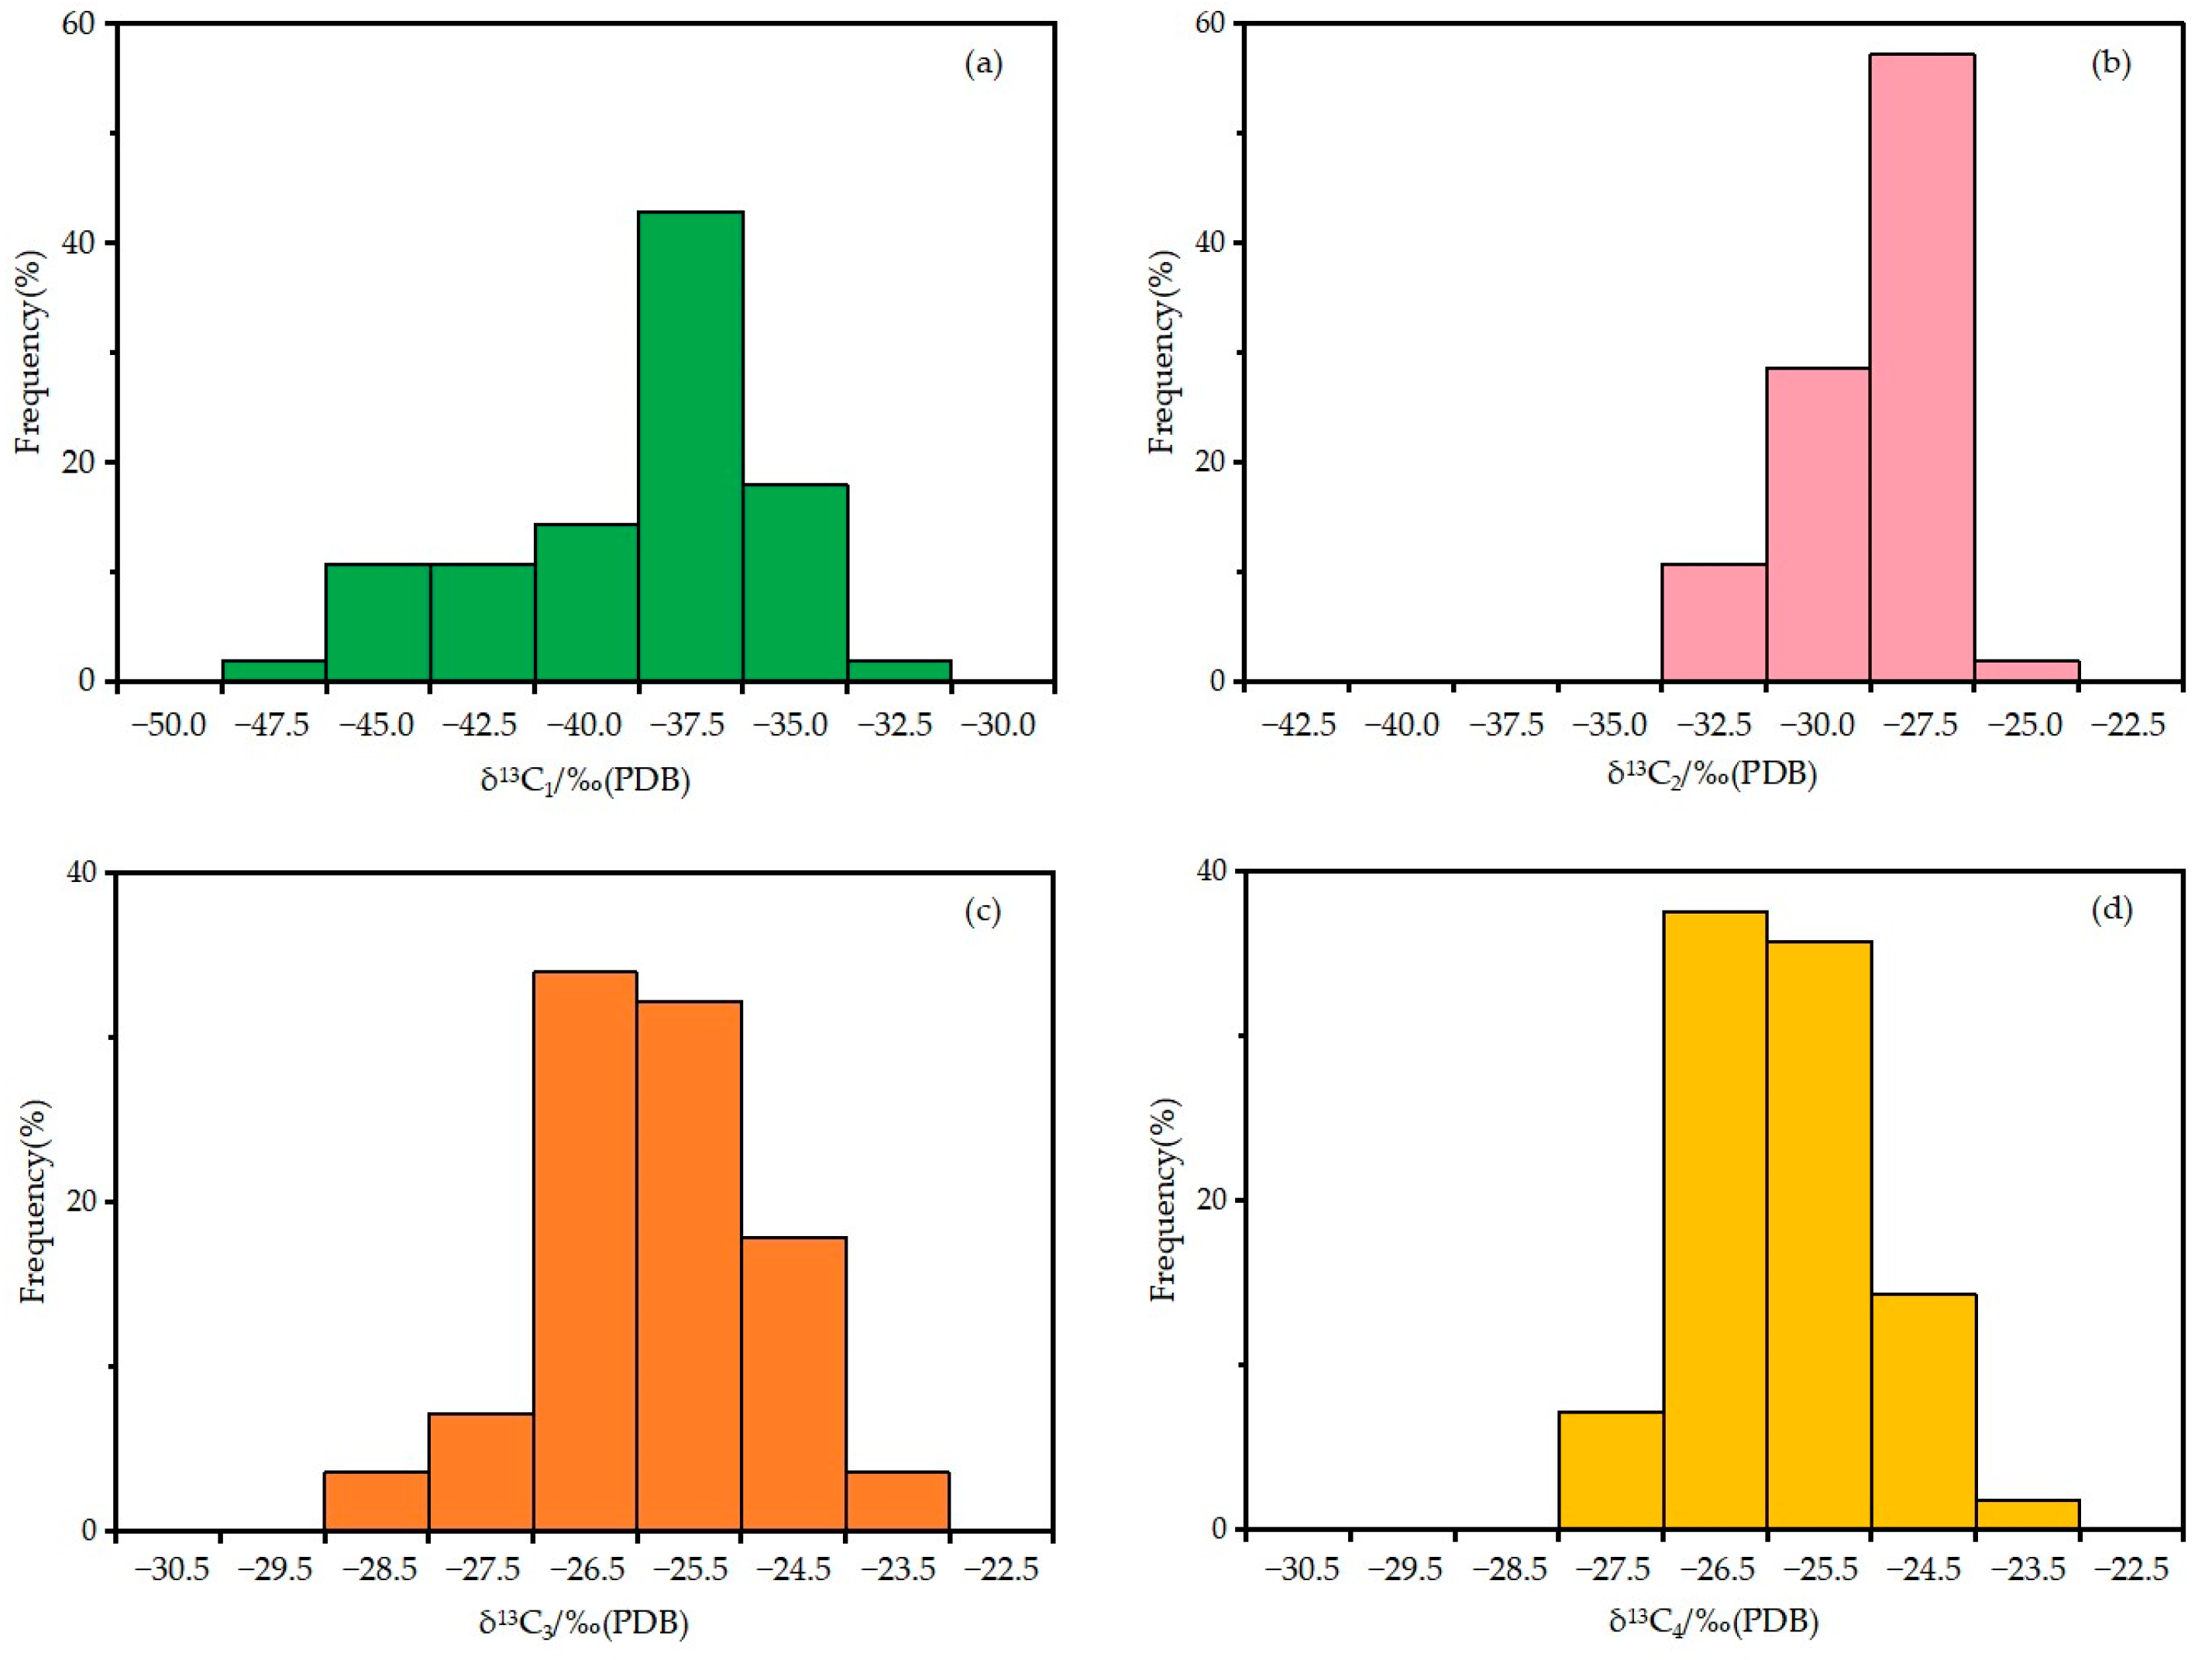
4.2. Carbon Isotopic Composition of the Natural Gas

The carbon isotopic compositions of the components of the natural gas in the eastern belt around the Penyijingxi sag were analyzed. The carbon isotope ratio of methane (δ13C1) ranges from −45.57‰ to −31.19‰, with an average of −37.48‰, showing a single peak mainly within the range from −42.5‰ to −35.0‰ (Figure 2a). The carbon isotope ratio of ethane (δ13C2) ranges from −31.69‰ to −24.66‰, with an average of −27.62‰. Similar to δ13C1, it shows a single peak mainly within the interval from −35.0‰ to −27.5‰ (Figure 2b). The carbon isotope ratio of methane (δ13C3) ranges from −28.76‰ to −23.56‰, with an average of −26.27‰, showing a single peak mainly within the range from −27.5‰ to −24.5‰ (Figure 2c). The carbon isotope ratio of methane (δ13C4) ranges from −27.96‰ to −23.64‰, with an average of −26.41‰, showing a single peak mainly within the range from −26.5‰ to −24.5‰ (Figure 2d).
Due to their reversed isotope kinetic fractionation pattern, the δ13C of the natural gas of organic origin increases gradually with the carbon number, forming a positive carbon isotopic series, while the δ13C of the natural gas of inorganic origin forms a negative carbon isotopic series [9,10]. Gas samples with positive carbon isotopic series account for 41.38% of all the samples collected from the studied area. The remaining samples are all slightly and partially isotopically reversed, with the carbon isotopic series as δ13C1 < δ13C2 < δ13C3 < δ13C4 (Figure 3). The causes for carbon isotopic reversal include: (i) mixing of organic and inorganic alkane gases, (ii) mixing of coal- and oil-associated gases, (iii) microbial oxidation, and (iv) mixing of same-type alkane gases of different sources or same-source alkane gases of different periods [11,41]. In the studied area, natural gas reservoirs are generally located 3500 m below the surface or deeper. According to a geothermal gradient of 25°C/km [42], the reservoir temperature should be higher than 87.5°C, making it impossible for propane oxidizing bacteria to survive [43]. Therefore, we can exclude microbial oxidation from the causes. Other possible causes for carbon isotopic reversal are discussed below.

5. Discussion

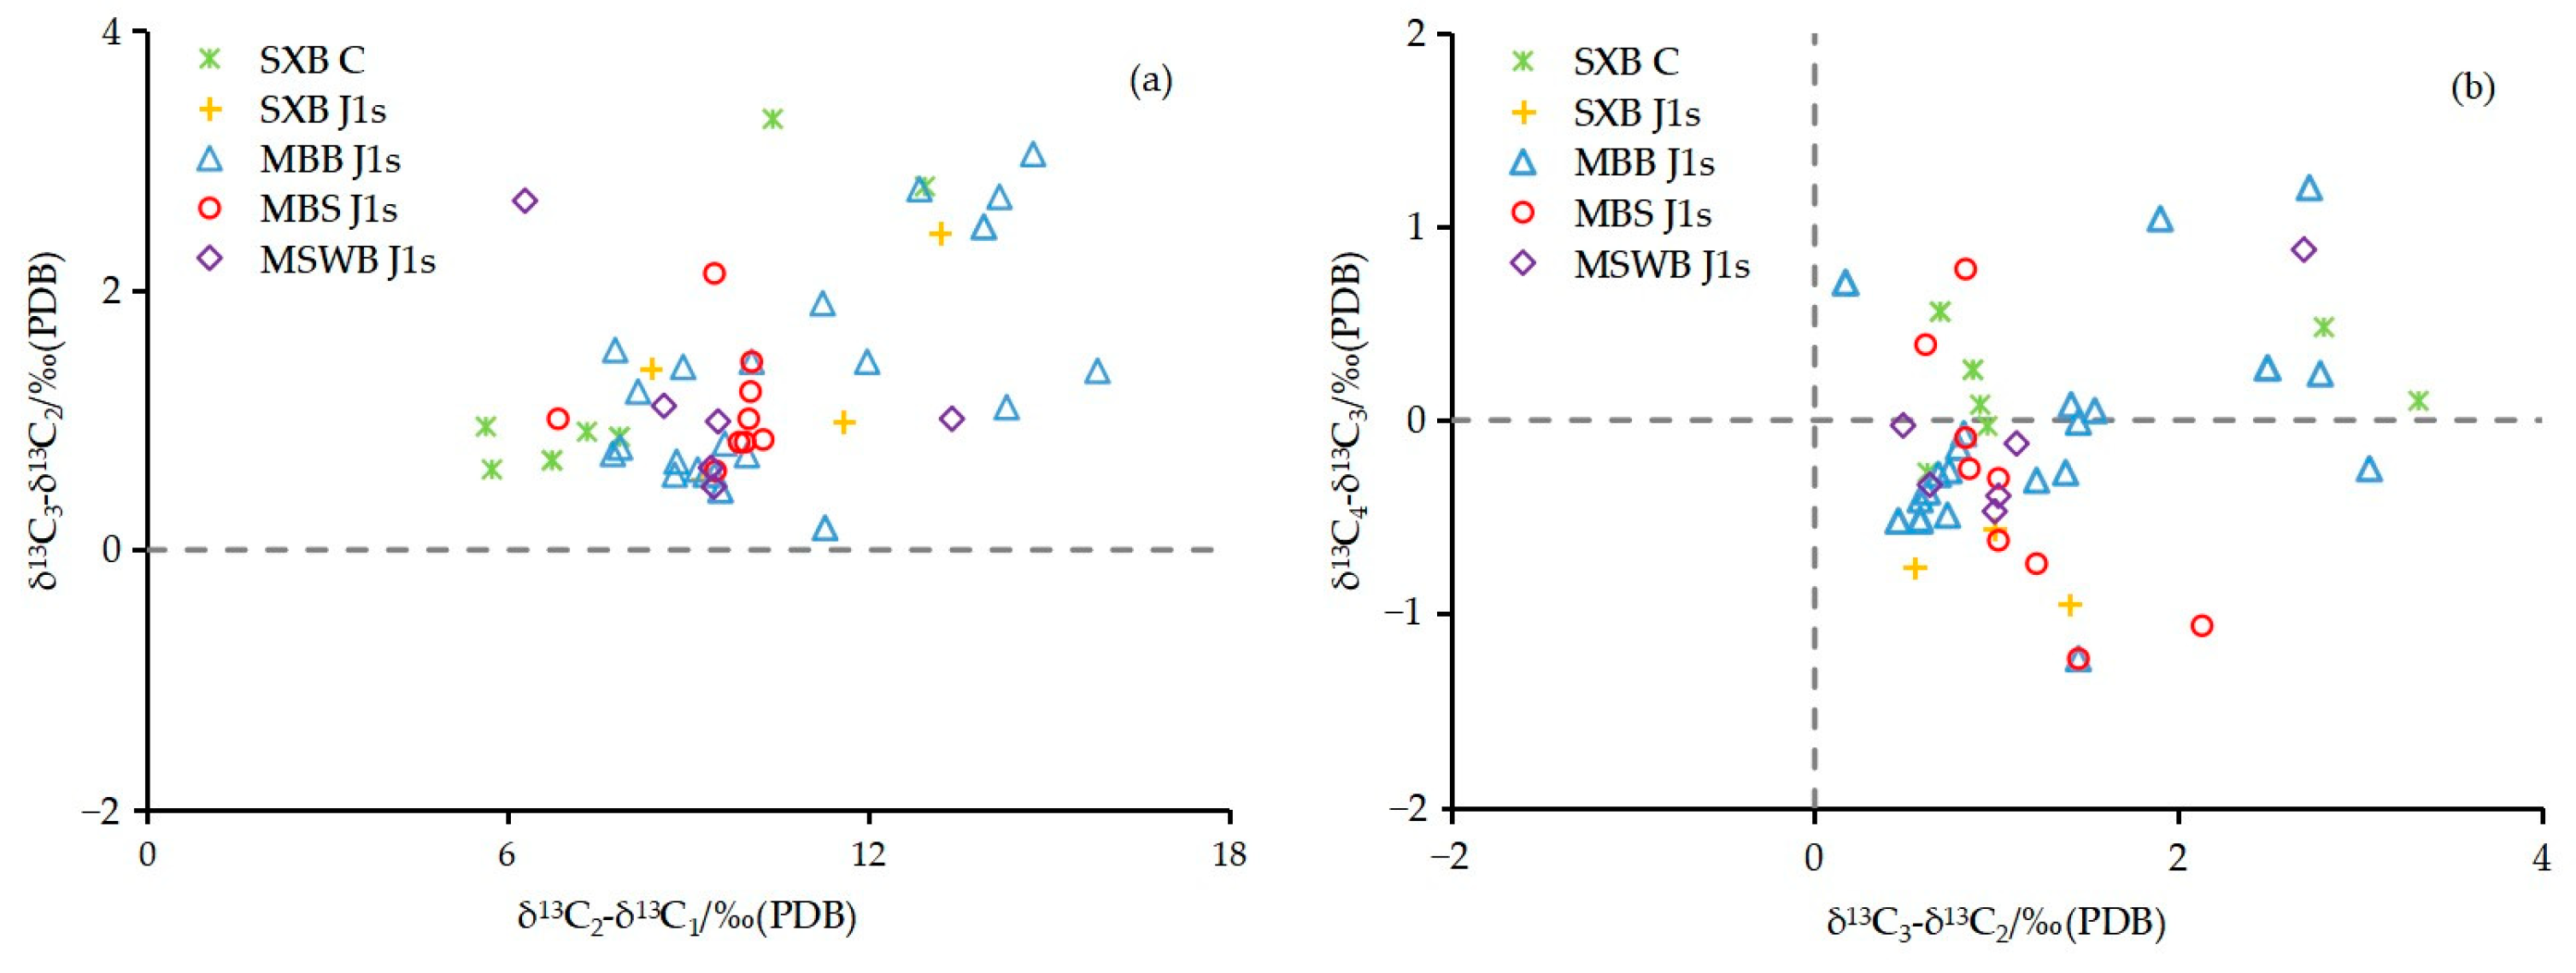
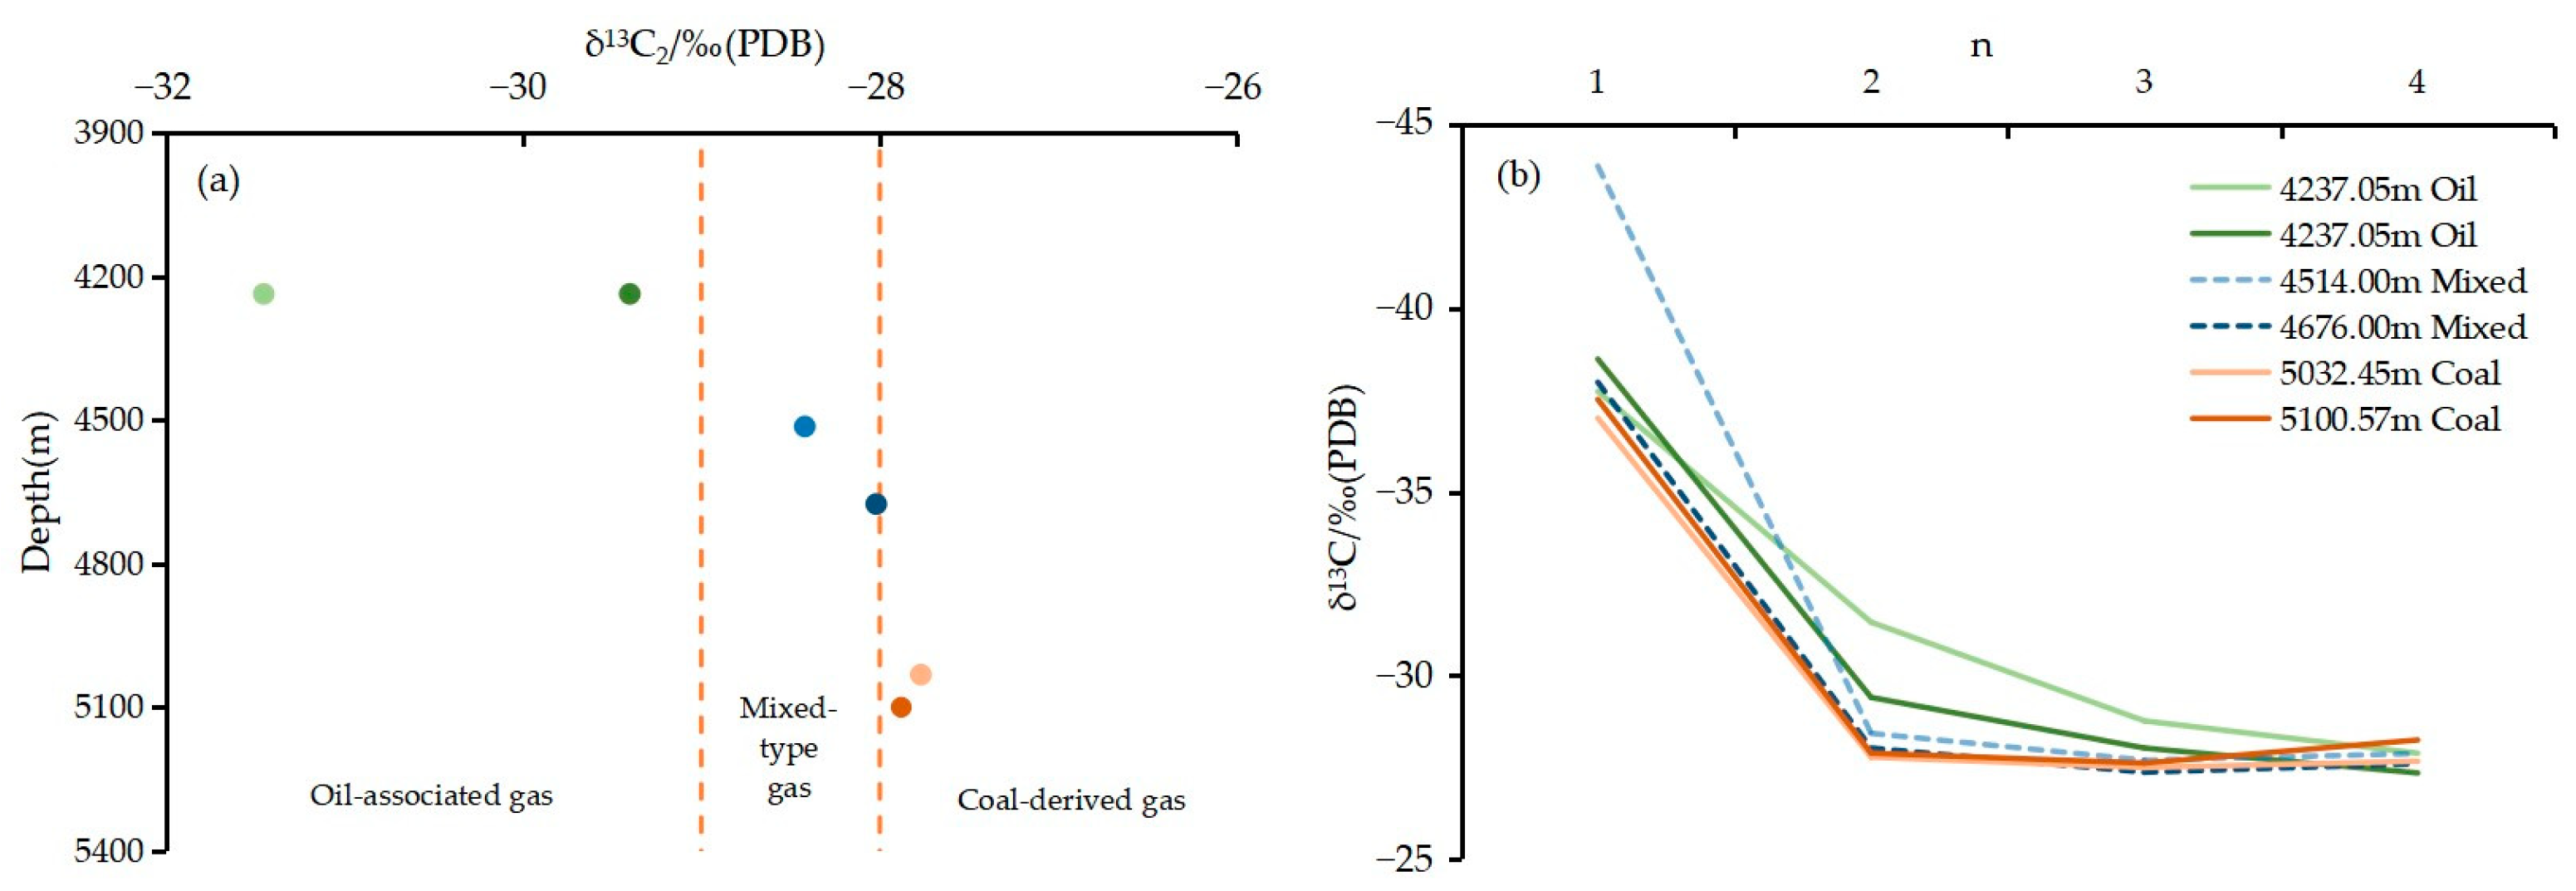
5.1. Genesis Types of the Natural Gas

The carbon isotopic compositions of methane and ethane and the carbon isotopic series of their homologues are important indicators to identify whether the alkane gases are of inorganic or organic origin, and are commonly used to determine the genesis of natural gas [7]. The alkane gases in the natural gases from the Shixi, Mobei, and Mosuowan bulges and the Mobei slope have a positive carbon isotopic series (δ13C1 < δ13C2 < δ13C3) that is reversed for butane (Figure 3). This partial reversal may be due to the mixing of natural gases of different genesis, migration, or secondary changes [11,12]. Primary alkane gases should have a positive carbon isotopic series (δ13C1 < δC132 < δ13C3 < δ13C4). In addition, while the isotopic composition of methane of inorganic origin is generally greater than −30‰, this value of the gases in the studied area is less than −30‰ (Figure 4). Therefore, it can be concluded that the natural gases in the eastern belt around the Penyijingxi sag are of organic origin, and that the reversed isotopic series of alkane gases should not be caused by the mixing of organic and inorganic alkane gases.
The δ13C2 value of alkane gases is a feature basically inherited from the parent material and is less influenced by the maturity of the source rocks. It is usually used as an important indicator for gas genesis identification [14,15]. In this paper, we identify gases with δ13C2 > −28‰ as coal-derived gas, gases with δ13C2 < −29‰ as oil-associated gas, and gases with δ13C2 between −28‰ to −29‰ as mixed-type gas (Figure 4) [11]. The samples from the Shixi, Mobei, and Mosuowan bulges are distributed in all three intervals (Figure 4) but are mainly coal-derived gases. Only a few samples are oil-associated or mixed-type gas, which are the thermal degradation products of sapropelic-type and humic-type kerogens. The samples from the Mobei slope all fall in the coal-derived gas interval, which is generated by humic kerogen. Obviously, different from those in the Shixi, Mobei, and Mosuowan bulges, the Jurassic reservoir of the Mobei Slope only produces coal-derived gas. As revealed by the period analysis of the faults in the studied area, both the Hercynian and Yanshanian faults developed in the bulge zone, while only the Yanshanian faults developed in the slope zone [32]. This difference in vertical migration channels may result in the different gas types in bulge and slope zones.
Light hydrocarbons are important components of both natural gas and crude oil. Their variety becomes much wider as the number of carbon atoms increases, and their boiling points do not exceed 200°C in general. In natural gas genesis identification, indicators related to liquid and light C5~C8 hydrocarbons are commonly used for comparing the natural gases’ type, maturity, and source [44]. The indicators for identifying organic matter type include the relative content of dimethyl cyclopentane (ΣDMCH) of various structures, n-heptane (nC7), methylcyclohexane (MCH) in C7 light hydrocarbons as well as the relative content of cycloalkanes, n-alkanes, and isomeric alkanes in C5~7 hydrocarbons [45]. MCH, mainly from higher plants’ lignin, cellulose, sugar, etc., has relatively stable thermodynamic properties and is a good parameter to indicate the type of terrestrial parent material. Its abundance is an important characteristic of light hydrocarbons in coal-derived gas. ΣDMCH, mainly from the lipid compounds of aquatic organisms, is affected by maturity. The high content of ΣDMCH indicates oil-associated gas. nC7, mainly from algae and bacteria, is a good maturity indicator [46]. In the C7 light hydrocarbons from the gases in the studied area, the relative content of MCH ranges from 29.38% to 53.35%, with an average of 41.98% (Figure 5). The relative content of ΣDMCH ranges between 4.63% and 45.79%, with an average of 14.30%. The high relative content of MCH and low relative content of ΣDMCH indicate that the natural gases in the studied area are mainly from type III (humic) kerogen and are dominated by coal-derived gas. This conclusion is consistent with the results of the alkane carbon isotopic analysis above.

5.2. Sources of Natural Gas

In the studied area, adjacent to the hydrocarbon-rich Penyijingxi sag in the Central Depression of the Junggar Basin, multiple sets of potential Carboniferous, Permian, and Jurassic source rocks have been developed (Table 3). According to the geochemical evaluation method of terrigenous source rocks (SY/T 5735-1995), the Carboniferous source rocks are of medium-poor quality, primarily composed of type III kerogen, and are mainly gas-producing. The Jiamuhe formation, Lower Urho formation, and Jurassic source rocks are of medium-good quality, composed of type III kerogen, and are mainly gas-producing. The Fengcheng formation source rocks are of good quality, composed of type II kerogen, and are mainly oil-producing. According to the 4th resource evaluation of the Junggar Basin, the total gas generation intensity of the source rocks in the Penyijingxi sag is 8000 × 106~13,000 × 106 m3/km3 [28], which indicates that the above-mentioned source rocks have generated a large amount of natural gas and can provide sufficient gas to fill the eastern belt around the sag.
The Jurassic coal-bearing source rocks have high organic matter abundance and great hydrocarbon generation potential, but the vitrinite reflectance (Ro) is as low as 0.5% to 0.7% [40]. These source rocks enter their early gas generation stage only when their Ro is greater than 0.8% [49]. Therefore, the Jurassic source rocks are not the main hydrocarbon source for natural gases in the studied area. The Permian Fengcheng formation (P1f) is a residual sea-lagoon deposit of a sea–land transition environment with type II kerogen (Table 3). It is in the mature-highly mature stage [48]. Given the results of the ethane carbon isotopic analysis above, it should be the source of oil-associated gas in the middle and lower assemblages of the eastern belt around the Penyijingxi sag. The Carboniferous, Jiamuhe, and Lower Urho formations contain abundant organic matter, have an average TOC value greater than 1.5% (Table 3), and are dominated by type III kerogen. Meanwhile, they are in the mature-highly mature stage [40]. According to the relationship between the hydrocarbon generation stage and the Ro value of source rocks [47], these three sets of gas-prone source rocks are at the peak of gas generation, and all of them could be the potential gas sources for the coal-derived gases in the studied area.
Mango has proposed the theory of light hydrocarbon generation based on the light hydrocarbon data of more than 2000 different types of crude oil and the steady-state catalytic kinetic model of heptane genesis [44,50]. According to his theory, all light hydrocarbons generated from the same source rocks have similar K1 values (Equation (1)) and K2 values (Equation (2)), which are related to their parent material, but not to the maturity.
K 1 = A 1 / A 2
where A1 = 2-MH + 2,3-DMP and A2 = 3-MH + 2,4-DMP. 2-MH means 2-methylhexane, 2,3-DMP means 2,3-dimethylpentane, 3-MH means 3-methylhexane, and 2,4-DMP means 2,4-dimethylpentane.
K 2 = P 3 / ( P 2 + N 2 )
where P2 = 2-MH + 3-MH, P3 = 2,2-DMP + 2,4-DMP + 2,3-DMP + 3,3-DMP + 3-EP, and N2 = cis-1,3-DMCP + trans-1,3-DMCP + 1,1-DMCP. 2,2-DMP means 2,2-dimethylpentane, 3,3-DMP means 3,3-dimethylpentane, 3-EP means 3-ethylpentane, cis-1,3-DMCP means cis-1,3-dimethylcyclopentane, and trans-1,3-DMC means trans-1,3-dimethylcyclopentane.
The K1 values of the light hydrocarbons associated with the natural gas in the studied area are distributed along two different trend lines (Figure 6a) and are well correlated. The average K1 values of the black trend line and the orange trend line (0.63 vs. 1.29) are significantly different, indicating two different sources of natural gas in the studied area. In the cross-plot of the K1 vs. K2 values, natural gas from different sources will be distributed in different regions [50]. The gas samples collected from the studied area are distributed in two areas: the oil-associated gas area on the left, represented by Well Mobei 2 (with δ13C2 as −29.38‰) and the coal-derived gas area on the right, represented by Well Qianshao 1 (with δ13C2 as −27.55‰) (Figure 6b). This pattern further indicates that the gas in the studied area should come from one set of sapropelic source rocks and one set of humic source rocks separately. To further determine the source of the coal-derived gas, the geochemical characteristics of light hydrocarbons from the natural gas in the studied area and from crude oil were compared.
By comparing biomarker compounds, Wu (2012) identified that the Cretaceous crude oil produced from the well Shixi 10 located in the Shixi bulge is from the Lower Urho formation [51]. In addition, he selected seven light hydrocarbons, such as trans-1,3-DMP/trans-1,2-DMP, from crude oil and determined their fingerprint features (Figure 7). By comparing the light hydrocarbons associated with natural gas in the studied area with the light hydrocarbons associated with crude oil from the Lower Urho formation source rocks, we find that the fingerprint features of the light hydrocarbons associated with natural gas in the Shixi bulge, Mobei bulge, Mobei slope, and Mosuowan bulge are highly similar to those of the above-mentioned crude oil-associated light hydrocarbons (Figure 7). Therefore, it can be inferred that the Lower Urho formation of the Penyijingxi sag should be the main source rock for the coal-derived gas in the studied area.
The good linear relationship between the alkane gases’ δ13C1 and the Ro value of their source rocks, with carbon isotopes becoming heavier with thermal evolution, is useful for gas source comparison [14]. Many researchers have fitted the δ13C-Ro regression equations for coal-derived and oil-associated gases [52,53]. Considering the regional geochemical characteristics, we used the empirical regression Equations (3) and (4) proposed by Chen et al. (2021) to calculate the maturity degree of the source rocks of the natural gas. The results show (Table 4) that the Ro value of the oil-associated gas is between 0.75% to 1.55%, and the Ro value of the coal-derived gas is between 0.61% to 1.36%. As a result, it is assumed that oil-associated gas and coal-derived gas originate in the mature to highly mature stage from the source rocks of the Fengcheng formation and Lower Urho formation, respectively. This conclusion is consistent with the measured Ro values of the source rocks of the Fengcheng and Lower Urho formations [40,49]. The ratio of the methane carbon isotope in the alkane gases varies widely from −45.57‰ to −31.19‰ (Figure 4), indicating that natural gases are products of source rocks at different stages of thermal evolution. This conclusion is consistent with the results based on the dryness coefficient.
Coal - derived   gas :   δ 13 C 1 = 25 lg R o 37.5
Oil - associated   gas :   δ 13 C 1 = 25 lg R o 42.5

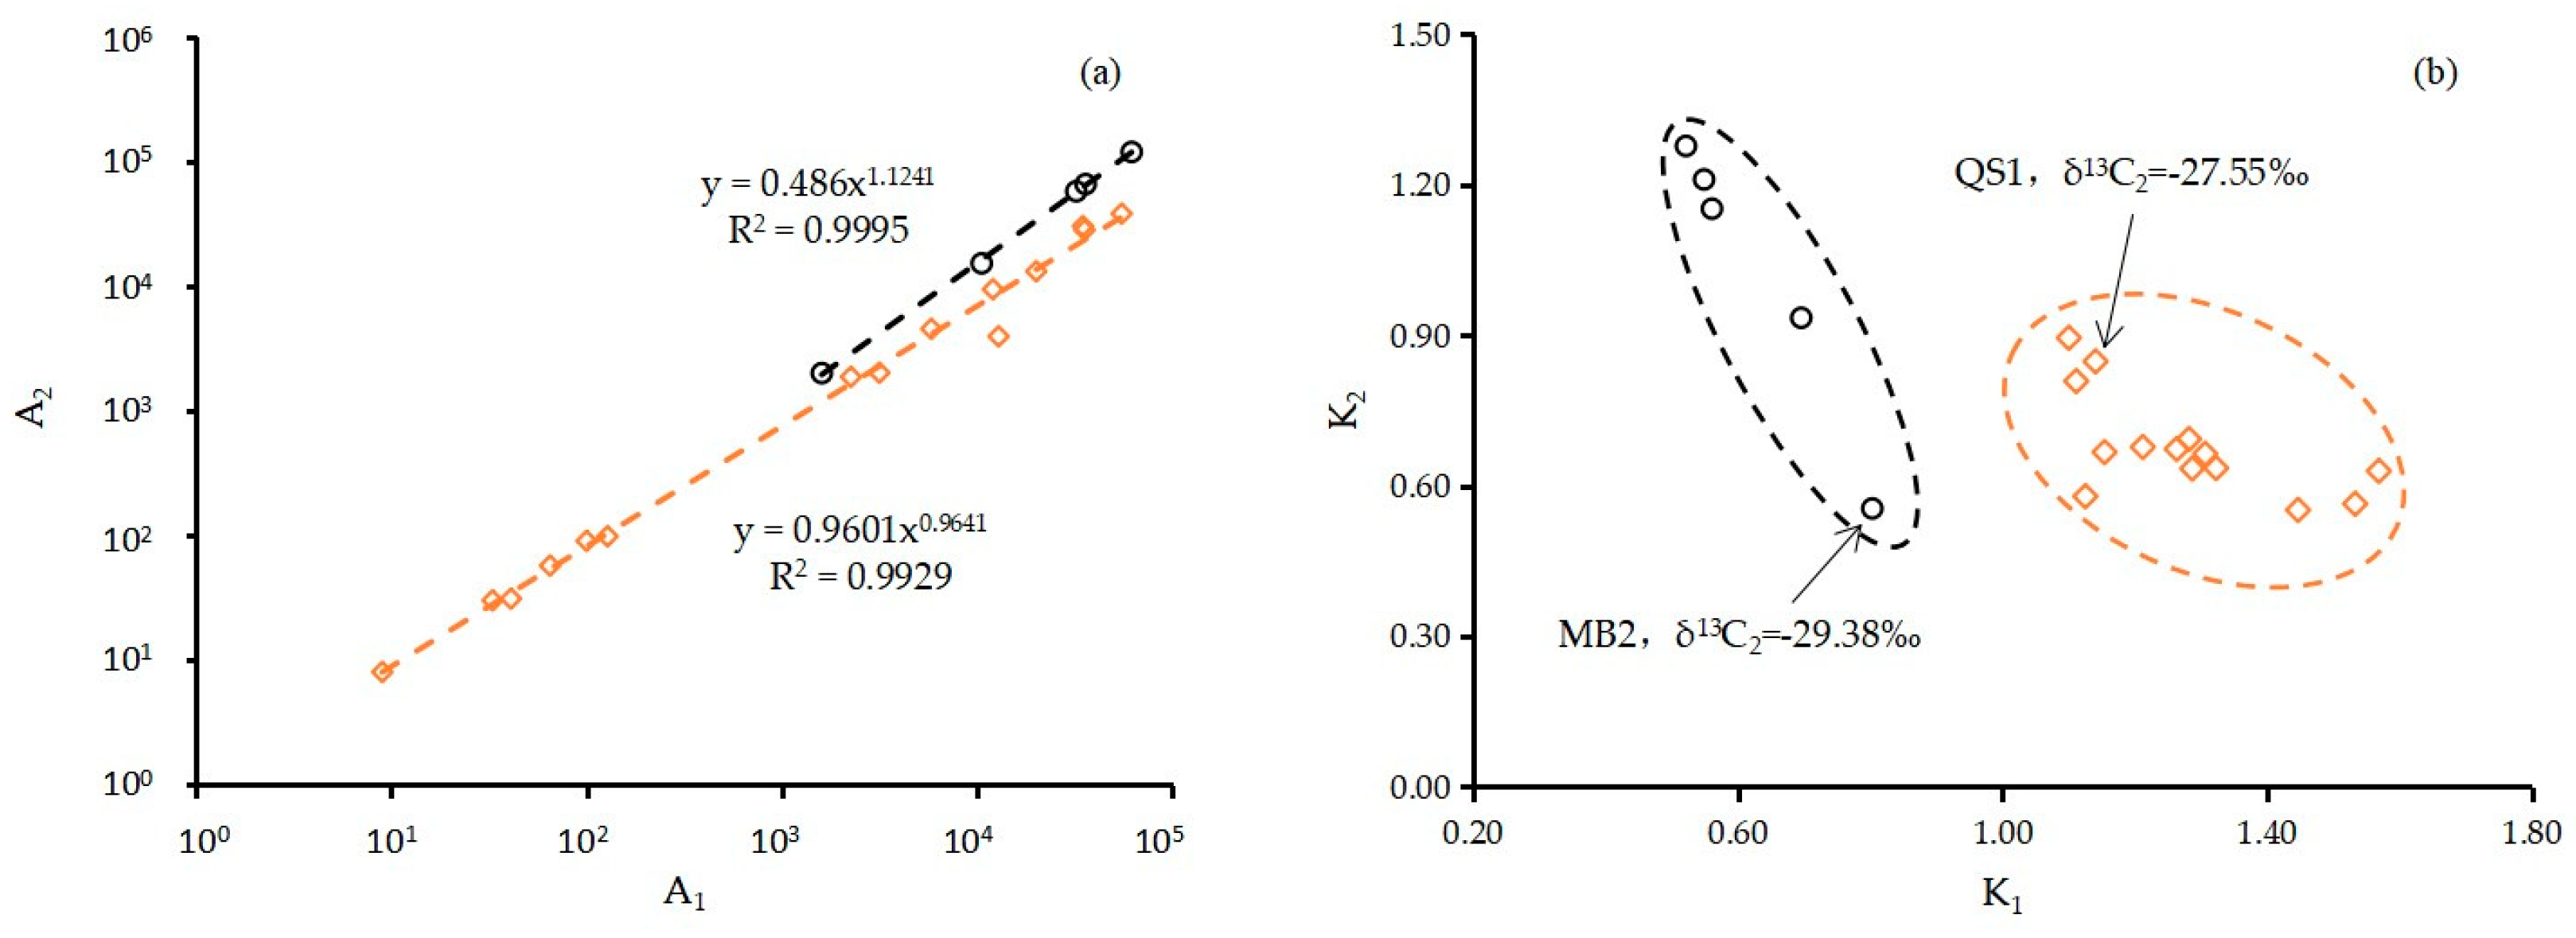
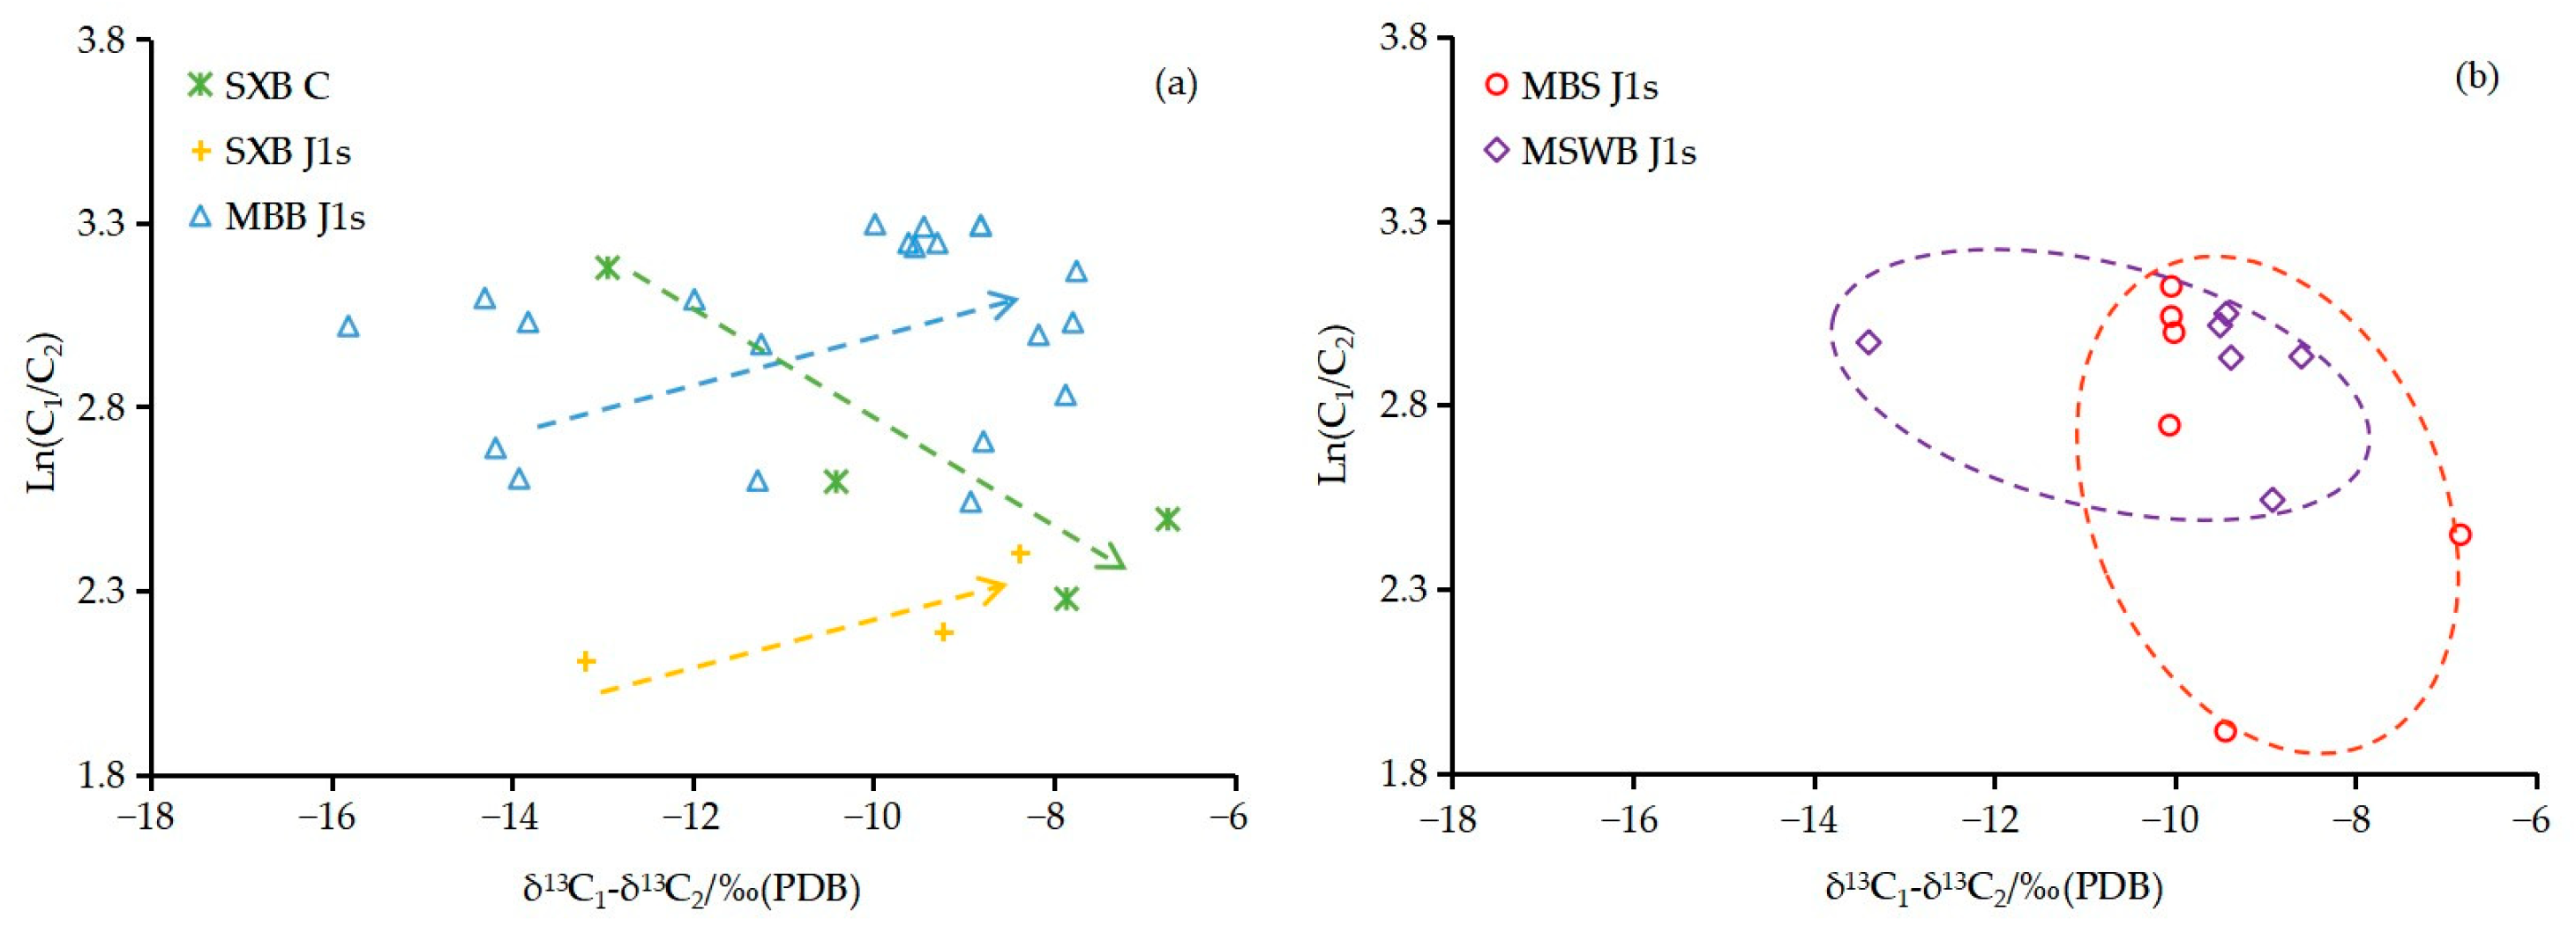
5.3. Gas Migration and Accumulation

With longer migration distances, the alkane gas’ δ13C1 value will decrease and the C1/C2 ratio will increase. Therefore, they are highly sensitive geochemical parameters representing the migration characteristics of natural gas [25]. Furthermore, when the gas has undergone no or only weak secondary alteration processes, the differences in its components and carbon isotope compositions are mainly influenced by the maturity of the source rocks, with both δ13C113C2 and Ln(C1/C2) increasing with the maturity of the source rocks. On the contrary, when the gas has been subject to diffusion, migration, and dispersion, its δ13C113C2 will gradually increase and its Ln(C1/C2) will decrease [54]. During the Neogene-Quaternary period, the southern margin of the Junggar Basin tilted extensively, not only causing the disappearance of the Chepaizi-Mosuowan Paleo-uplift, but also making the central Junggar Basin a southward-tilted monocline [55]. As a result, hydrocarbons migrated and adjusted inevitably. Was there a large-scale lateral gas migration from south to north in the middle and lower assemblages in the eastern belt around the Penyijingxi sag during this period? We collected gas samples from adjacent wells of the same members within the Mobei Bulge for a comparative study.
At present, the proven gas reserves of both well areas M 7 (Mo 7) and MB 2 (Mobei 2) in the Mobei Bulge are concentrated in the Jurassic Sangonghe formation (Figure 1b). Although close to each other, the two well areas have significantly different gas components and carbon isotopic compositions. The average δ13C1 and δ13C2 of the gas in well area M 7 are −35.85‰ and −26.11‰, respectively, while the average of δ13 C1 and δ13C2 of the gas in well area MB 2 are −40.05‰ and −28.39‰, respectively. These data indicate that the source rocks for the gas in well area M 7 are more mature than those for the gas in well area MB 2. Eight typical wells were selected in the well areas M 7 and MB 2 to compare gas migration parameters (Figure 8). It was found that the δ13C1 of the alkane gas and especially the single hydrocarbon component C1/C2 ratio tend to decrease from south to north in the Mobei bulge. If the lightening of alkane gas δ13C1 is caused by the long-distance lateral migration of gas, then the C1/C2 ratio should be increasing rather than decreasing. Taking into account the maturity analysis of the gases in the well areas M 7 and MB 2 above, the difference in the gas components and carbon isotopic compositions between adjacent well areas in the eastern belt around the Penyijingxi sag should be caused by the varied maturity of the source rocks rather than the lateral migration of gas. In other words, there was no significant lateral gas migration due to tilting.
Did large-scale gas migration occur between the superimposed gas-bearing formations in the eastern belt around the Penyijingxi sag? We explored this problem by conducting a case study of the typical well pen 4 (P 4) in the Mosuowan bulge (Figure 1b). From deep to shallow strata, coal-derived, mixed-type, and oil-associated gases appear successively in well pen 4, with the carbon isotopic series changing from reversed ones to positive ones (Figure 9). The maturity of the natural gas source rocks is obtained using regression Equations (3) and (4): the oil-associated gases with Ro values ranging from 1.42% to 1.55% and the coal-derived gases with Ro values ranging from 0.95% to 1.05%. The alkane gases from reservoirs at depths of 4676.00 m and 4514.00 m in well pen 4 are mixed-type gases (Figure 9a) with reversed carbon isotopic series (Figure 9b), and should be a mixture of late filled low-maturity (at a depth of 4514.00 m, with alkane gas δ13C1 as −43.88‰) to mature (at a depth of 4676.00 m, with alkane gas δ13C1 as −37.99‰) coal-derived gas and early filled highly matured oil-associated gas. The alkane gases from reservoirs at depths of 5032.45 m and 5100.57 m in well pen 4 are coal-derived gases (Figure 10a), but they also have a reversed carbon isotopic series. The results of the gas source and maturity analyses indicate it is caused by the mixing of the gases of the same genetic type formed at different stages. This conclusion is consistent with the view proposed by Zou et al. (2005) that hydrocarbons are continuously filling the Jurassic system of the central Junggar Basin [33]. The analysis above shows that gases from the upper and lower gas reservoirs of well pen 4 are mixed. Further, it is reasonable to infer that there is vertical gas migration in the studied area, and that the reversed carbon isotopic series of the mixed-type and coal-derived gases are caused by the mixing of coal-derived and oil-associated gases and the mixing of alkane gases of the same genetic type that formed at different stages, respectively.
The δ13C113C2 and Ln(C1/C2) of the gases from the Sangonghe formation of the Shixi Bulge and the Sangonghe formation of the Mobei Bulge in the studied area increase synchronously, reflecting the change of gas parameters with maturity (Figure 10a). The data about the gases from the Sangonghe formation of the Mobei Slope and Mosuowan Bulge show no regular pattern (Figure 10b), preventing us from determining the main controlling factors for the differences in their components and carbon isotopic compositions. The carboniferous gases in the Shixi Bulge have gradually increasing δ13C113C2 and gradually decreasing Ln(C1/C2), showing obvious characteristics of residual gases after diffusion migration (Figure 10a). In addition, the gas–oil ratio of the reservoir decreases from 4794.59 m3/t to 204.86 m3/t along the direction indicated by the green arrow in Figure 10, further confirming the previous diffusion migration of Carboniferous gases, as the gas–oil ratio only decreases due to the loss of lighter components after oil and gas accumulation [57]. Diffusion migration is an important method of forming gas pools in sedimentary basins [25], therefore we speculated that there may be gas pools formed by diffusion migration of carboniferous natural gas in the shallow layers. Through a comprehensive analysis of natural gas composition, carbon isotope, and light hydrocarbon fingerprint parameters, this study explains the genesis and source of natural gas, as well as clarifies the migration characteristics of natural gas after reservoir formation. We can conclude that the gases in the middle and lower assemblages of the eastern belt around the Penyijingxi sag were mainly produced in the processes where hydrocarbons were generated by the source rocks of the Lower Urho and Fengcheng formations and then migrated along faults under greater pressure to fill the near (Carboniferous) or distant (Jurassic Sangonghe formation) reservoirs. The Yanshanian faults only cut through the Triassic–Jurassic systems, resulting in only coal-derived gas production in the slope zone. The Hercynian faults cut through the Carboniferous–Triassic systems and “relay” gases with the Yanshanian faults, enabling the bulge areas to produce coal-derived, oil-associated, and mixed-type gases. The tilting during Himalayan movements did not cause significant lateral migration of the gases in the Sangonghe formation, while diffusion migration of the Carboniferous gases occurred after reservoir formation. We believe that: (i) the shallow layer (e.g., the Cretaceous) can be considered one of the key strata series for searching for secondary hydrocarbon reservoirs in the next stage of hydrocarbon exploration and (ii) the geochemical parameters and analysis process used in this paper have certain reference values for studying the origin of natural gas in similar petroliferous basins (e.g., the Tarim Basin and the Georgina Basin).

6. Conclusions

The natural gases in the middle and lower assemblages of the eastern belt around the Penyijingxi sag, Junggar Basin consist of a high percentage of methane (71.36–93.34%) with the dryness coefficient ranging from 0.76 to 0.95, averaging 0.91. There are also varying amounts of non-hydrocarbons, such as CO2 (<1.49%) and N2 (0.69–11.95%). The carbon isotopic composition of methane (δ13C1) ranges widely from −45.57‰ to −31.19‰, indicating that the natural gases may be products of source rocks at different stages of thermal maturity.
The contained alkanes show an overall carbon isotopic composition trend as δ13C1 < δ13C2 < δ13C3 < δ13C4 and have δ13C1 values < −30‰, indicating that the natural gases are of organic origin. The methane and ethane isotopic compositions and the characteristics of light hydrocarbons show that the natural gases in the studied area are dominated by coal-derived gas and contain a small amount of oil-associated and mixed-type gas. According to the gas source comparison results, it is basically confirmed that the coal-derived gas is from the mature to highly mature source rocks of the Lower Urho formation, and the oil-associated gas is from the mature to highly mature source rocks of the Fengcheng formation.
Gas once migrated vertically in the gas-bearing formations, leading to the mixing of oil-associated and coal-derived gases, as well as the mixing of alkane gases of the same genetic type formed at different stages and possibly causing a reversed carbon isotopic series. While the components and carbon isotopic composition of the natural gases in the Jurassic Sangonghe formation vary with the maturity of the source rocks, these features of the Carboniferous gases are mainly affected by the gas diffusion migration after reservoir formation. Natural gas migration characteristics indicate the shallow layer (e.g., the Cretaceous) in the eastern belt around the Penyijingxi sag may be a favorable area for future oil and gas exploration, which is suitable for searching for secondary hydrocarbon reservoirs.

Author Contributions

Methodology, J.Q. and X.D.; Validation, M.Z. (Minghui Zhou) and T.G.; Investigation, K.L.; Resources, H.L.; Writing–original draft, K.L.; Writing–review & editing, K.L.; Supervision, M.Z. (Ming Zhao) and X.D.; Project administration, M.Z. (Ming Zhao); Funding acquisition, H.L. All authors have read and agreed to the published version of the manuscript.

Funding

This work was supported by major projects of PetroChina Science and Technology (2021DJ0206).

Data Availability Statement

Restrictions apply to the availability of these data. With the permission of Xinjiang Oilfield, it can be obtained from the authors.

Conflicts of Interest

The authors declare no conflict of interest.

Appendix A

Table A1. Natural gas compositions in the eastern belt around the Penyijingxi Sag, Junggar Basin.
LocationWellFormationDepth/mChemical Composition/%Carbon Isotopic Composition/‰ (PDB)
N2CO2CH4C2H6C3H8C4H10C5H12δ13C1δ13C2δ13C3δ13C4
MBBM121J1s4222.00 1.68 0.02 93.34 3.10 0.93 0.57 0.21 ndndndnd
MBBM121J1s4254.50 1.60 0.15 91.58 4.02 1.37 0.81 0.28 ndndndnd
MBBM109J1s4158.00 0.69 0.67 93.30 3.42 0.98 0.59 0.21 ndndndnd
MBBM113J1s4205.00 1.07 0.14 92.70 3.51 1.19 0.84 0.35 ndndndnd
MBBM115J1s4204.00 1.43 0.20 88.16 5.39 2.23 1.70 0.63 ndndndnd
MBBM116J1s4195.00 2.68 0.23 91.11 3.40 1.19 0.80 0.32 ndndndnd
MBBM117J1s4237.50 1.89 0.30 90.63 3.98 1.48 1.04 0.42 ndndndnd
MBBM119J1s4258.25 2.04 0.18 90.88 3.98 1.41 0.87 0.31 ndndndnd
MBBM119J1s4236.00 1.69 0.19 92.17 3.55 1.23 0.75 0.25 ndndndnd
MBBM003J1s3915.00 1.08 0.59 92.40 3.61 1.20 0.74 0.24 −41.07−29.26−27.76−26.95
MBBM003J1s3975.00 2.86 0.29 88.77 4.29 1.65 ndnd−35.25 −27.46 −25.92 −25.87
MBBMB2J1s3921.00 2.68 0.41 92.98 2.52 0.77 ndnd−42.89 −30.04 −27.26 −27.02
MBBMB2J1s3921.00 2.72 0.51 91.22 3.29 1.09 ndnd−44.12 −29.38 −26.33 −26.58
MBBMB5J1s3726.20 2.71 0.00 88.16 5.19 1.73 ndnd−34.80 −26.93 −26.14 −26.28
MBBMB10J1s3666.00 3.27 0.41 88.24 4.26 1.69 ndnd−41.72 −27.90 −26.59 −26.62
MBSM16J1s4047.25 1.60 0.40 89.90 4.30 1.47 1.05 0.53 −37.56 −27.52 −26.73 −26.76
MBSQS1J1s3944.50 1.35 0.70 89.90 4.34 1.53 1.10 0.52 −37.40 −27.55 −26.72 −25.94
MBSQS1J1s3944.75 1.65 0.46 90.66 4.33 1.48 0.92 0.27 −35.60 −26.14 −25.53 −25.14
MBSQS2J1s3981.00 1.09 0.45 91.18 4.31 1.47 0.94 0.33 −37.49 −27.54 −26.71 −26.80
MBSQS4J1s4014.25 1.56 0.31 90.79 4.39 1.48 0.91 0.33 −37.82 −27.57 −26.72 −26.97
MSWBM101J1s4204.00 2.95 0.62 89.51 4.25 1.47 0.84 0.24 −36.64 −27.21 −26.72 −26.75
SXBS006J1s3577.00 0.92 0.68 91.12 4.38 1.47 0.90 0.33 ndndndnd
SXBS006C4373.00 4.350.2188.823.701.071.080.54−41.62−28.68−25.88−25.40
SXBS007C4408.50 11.950.0971.365.324.364.551.78−40.58−30.17−26.85−26.75
SXBSX1C4438.00 5.21078.976.523.963.951.39−33.43−26.69−26.00−25.44
SXBSX1C4473.00 5.490.3777.257.923.733.701.55−35.36−27.50−26.63−26.37
SXBS015J1snd4.681.0775.109.114.044.041.49−42.5−29.31−26.87−26.47
SXBSX8J1snd1.250.6384.047.612.981.970.77−34.44−26.06−24.66−25.61
SXBSX14J1snd3.630.8275.418.454.723.451.40−36.98−27.75−27.20−27.96
MBBMB11J1s3710.75 1.310.8284.986.693.011.930.75−37.11−28.19−26.78−26.7
MBBMB2J1s3907.00 2.810.0791.563.401.130.640.23−35.65−26.84−26.16−26.44
MBBM003J1s3971.50 3.390.6089.314.581.310.640.18−37.82−26.58−24.68−23.64
MBBMB9J1s3761.25 1.820.3590.574.421.370.970.50−42.92−27.11−25.73−26.00
MBBMB9J1s3778.00 1.711.2984.565.752.671.900.93−45.57−31.39−28.67−27.47
MBBM005J1s3890.25 2.360.4286.766.412.381.590.08−44.08−30.16−27.67−27.4
MBBM006J1s3759.25 2.010.4585.846.382.711.950.66−39.46−28.18−28.01−27.3
MBBMB5J1s3726.20 3.960.2289.214.461.120.810.23−35.58−27.41−26.19−26.5
MBBM108J1s4179.00 2.740.3089.663.531.100.750.37−35.28−25.74−25.28−25.8
MBBM109J1s4185.00 1.810.2291.974.161.100.500.12−38.96−24.66−23.56nd
MBBM11J1s4139.00 3.601.4988.583.301.010.680.32−35.15−25.71−25.13−25.64
MBBM11J1s4177.00 1.650.2791.823.861.330.770.22−34.84−27.09−26.35−26.61
MBBM7J1s4227.50 2.400.4790.923.541.190.800.36−35.72−26.43−25.85−26.37
MBBM7J1s4260.00 3.650.5089.993.331.150.710.31−37.88−27.90−27.17−27.66
MBBM8J1s4233.00 1.470.5191.433.561.070.700.36−35.82−26.21−25.39−25.46
MBBM8J1s4265.50 1.090.4287.705.862.231.530.62−34.69−25.91−25.33−25.74
MBSM16J1s4041.00 2.690.6287.445.621.770.900.32−36.54−26.48−25.03−26.26
MBSM171J1s4472.85 1.450.4090.454.521.580.980.37−36.59−26.58−25.57−26.19
MBSM17J1s4161.50 1.860.5791.204.021.070.600.24−36.9−26.86−25.64−26.38
MBSM12J1s4235.00 3.250.6680.446.964.142.720.95−34.14−27.30−26.29−26.59
MBSM17J1s4192.00 1.550.6673.8810.905.964.381.57−35.93−26.49−24.36−25.42
MSWBM101J1s4209.00 3.010.4188.764.351.561.070.48−36.81−27.31−26.32−26.79
MSWBM102J1s4251.00 2.710.5288.134.701.921.210.48−36.11−27.51−26.40−26.52
MSWBM103J1s4250.50 2.590.5887.654.691.981.430.62−36.66−27.28−26.647−26.98
MSWBP5J1s4250.00 3.250.5787.494.491.861.200.45−41.43−28.04−27.03−27.42
Note: nd means no data, C means Carboniferous, J1s means Jurassic Sangonghe Formation, MBB means Mobei bulge, MSWB maens Mosuowan bulge, SXB means Shixi bulge, MBS means Mobei slope.

References

  1. Glasby, G.P. Abiogenic origin of hydrocarbons: An historical overview. Resour. Geol. 2006, 56, 83–96. [Google Scholar] [CrossRef]
  2. Dai, J.; Gong, D.; Ni, Y.; Huang, S.; Wu, W. Stable carbon isotopes of coal-derived gases sourced from the Mesozoic coal measures in China. Org. Geochem. 2014, 74, 123–142. [Google Scholar] [CrossRef]
  3. Song, Y.; Xu, Y.C. Origin and identification of natural gases. Pet. Explor. Dev. 2005, 32, 24–29. [Google Scholar]
  4. Milkov, A.V. Methanogenic biodegradation of petroleum in the West Siberian Basin (Russia): Significance for formation of giant Cenomanian gas pools. AAPG Bull. 2010, 94, 1485–1541. [Google Scholar] [CrossRef]
  5. Hutcheon, I.; Krouse, H.R.; Abercrombie, H.J. Controls on the origin and distribution of elemental sulfur, H2S, and CO2 in Paleozoic hydrocarbon reservoirs in Western Canada. ACS Symp. Ser. 1995, 612, 426–438. [Google Scholar]
  6. Arrouvel, C.; Prinzhofer, A. Genesis of natural hydrogen: New insights from thermodynamic simulations. Int. J. Hydrogen Energy 2021, 46, 18780–18794. [Google Scholar] [CrossRef]
  7. Milkov, A.V.; Giuseppe, E. Revised genetic diagrams for natural gases based on a global dataset of >20,000 samples. Org. Geochem. 2018, 125, 109–120. [Google Scholar] [CrossRef]
  8. Dai, J.X.; Huang, S.P. Discussion on the carbon isotopic reversal of alkane gases from the Huanglong Formation in the Sichuan Basin, China. Acta Pet. Sin. 2010, 31, 710–717. [Google Scholar]
  9. Des Marais, D.J.; Donchin, J.H.; Nehring, N.L.; Truesdell, A.H. Molecular carbon isotopic evidence for the origin of geothermal hydrocarbons. Nature 1981, 292, 826–828. [Google Scholar] [CrossRef]
  10. Tilley, B.; Muehlenbachs, K. Isotope reversals and universal stages and trends of gas maturation in sealed, self-contained petroleum systems. Chem. Geol. 2013, 339, 194–204. [Google Scholar] [CrossRef]
  11. Dai, J.; Xia, X.; Qin, S.; Zhao, J. Origins of partally reversed alkane δ13C values for biogenic gases in China. Org. Geochem. 2004, 35, 405–411. [Google Scholar] [CrossRef]
  12. Hosgormez, H.; Etiope, G.; Yalin, M.N. New evidence for a mixed inorganic and organic origin of the Olympic Chimaera fire (Turkey): A large onshore seepage of abiogenic gas. Geofluids 2008, 8, 263–273. [Google Scholar] [CrossRef]
  13. Ogbesejana, A.B.; Bello, O.M.; Ali, T. Origin and depositional environments of source rocks and crude oils from Niger Delta Basin: Carbon isotopic evidence. China Geol. 2020, 3, 602–610. [Google Scholar] [CrossRef]
  14. Schoell, M. The hydrogen and carbon isotopic composition of methane from natural gases of various origins. Geochim. Cosmochim. Acta 1980, 44, 649–661. [Google Scholar] [CrossRef]
  15. Kotarba, M. Isotopic geochemistry and habitat of the natural gases from the Upper Carboniferous Žacleř coal-bearing formation in the Nowa Ruda coal district (Lower Silesia, Poland). Org. Geochem. 1990, 16, 549–560. [Google Scholar] [CrossRef]
  16. Battani, A.; Sarda, P.; Prinzhofer, A. Basin scale natural gas source, migration and trapping traced by noblegases and major elements: The Pakistan Indus basin. Earth Planet. Sci. Lett. 2000, 181, 229–249. [Google Scholar] [CrossRef]
  17. Prinzhofer, A.; Mello, M.R.; Freitas, L.; Takaki, T. New geochemical characterization of natural gas and its use in oil and gas evaluation. AAPG Mem. 2000, 73, 107–119. [Google Scholar]
  18. Allan, U.S. Model for hydrocarbon migration and entrapment within faulted structures. AAPG Bull. 1989, 73, 803–811. [Google Scholar]
  19. Hillman, J.I.; Cook, A.E.; Daigle, H.; Nole, M.; Malinverno, A.; Meazell, K.; Flemings, P.B. Gas hydrate reservoirs and gas migration mechanisms in the Terrebonne Basin, Gulf of Mexico. Mar. Pet. Geol. 2017, 86, 1357–1373. [Google Scholar] [CrossRef]
  20. Wanner, P.; Hunkeler, D. Isotope fractionation due to aqueous phase diffusion–What do diffusion models and experiments tell?–A review. Chemosphere 2019, 219, 1032–1043. [Google Scholar] [CrossRef]
  21. Losh, S.; Walter, L.; Meulbroek, P.; Martini, A.; Whelan, J. Reservoir Fluids and Their Migration into the South Eugene Island Block 330 Reservoirs, Offshore Louisiana. AAPG Bull. 2002, 86, 1463–1488. [Google Scholar]
  22. Prinzhofer, A.; Battani, A. Gas isotopes tracing: An important tool for hydrocarbons exploration. Oil Gas Sci. Technol. 2003, 58, 299–311. [Google Scholar] [CrossRef] [Green Version]
  23. Schloemer, S.; Krooss, B.M. Molecular transport of methane, ethane and nitrogen and the influence of diffusion on the chemical and isotopic composition of natural gas accumulations. Geofluids 2010, 4, 81–108. [Google Scholar] [CrossRef]
  24. Prinzhofer, A.; Neto, E.; Battani, A. Coupled use of carbon isotopes and noble gas isotopes in the Potiguar basin (Brazil): Fluids migration and mantle influence. Mar. Pet. Geol. 2010, 27, 1273–1284. [Google Scholar] [CrossRef]
  25. Prinzhofer, A.; Mello, M.R.; Takaki, T. Geochemical Characterization of Natural Gas: A Physical Multivariable Approach and Its Applications in Maturity and Migration Estimates. AAPG Bull. 2000, 84, 1152–1172. [Google Scholar]
  26. Bourg, I.C.; Sposito, G. Isotopic fractionation of noble gases by diffusion in liquid water: Molecular dynamics simulations and hydrologic applications. Geochim. Cosmochim. Acta 2008, 72, 2237–2247. [Google Scholar] [CrossRef]
  27. Sun, P.; Wang, Y.; Leng, K.; Li, H.; Ma, W.; Cao, J. Geochemistry and origin of natural gas in the eastern Junggar Basin, NW China. Mar. Pet. Geol. 2016, 75, 240–251. [Google Scholar] [CrossRef]
  28. Yang, H.B.; He, W.J.; Jia, X.Y. The Fourth Evaluation of Oil and Gas Resources in Junggar Basin; Internal Report of Exploration and Development Research Institute of Xinjiang Oilfield Company: Karamay, China, 2016. [Google Scholar]
  29. IEA. Offshore Energy Outlook; IEA: Paris, France, 2018. [Google Scholar]
  30. Tao, K.; Cao, J.; Wang, Y.; Ma, W.; Xiang, B.; Ren, J.; Zhou, N. Geochemistry and origin of natural gas in the petroliferous Mahu sag, northwestern Junggar Basin, NW China: Carboniferous marine and Permian lacustrine gas systems. Org. Geochem. 2016, 100, 62–79. [Google Scholar] [CrossRef]
  31. Huayao, Z.; Fang, H.; Bin, Z.B.C. History of hydrocarbon-filling and remigrating in hinterland of the Junggar Basin. Chin. J. Geol. 2005, 40, 499–509. [Google Scholar]
  32. Ma, W.; Wei, Y.; Li, X.; Tao, S.; Li, Y.; Zhao, Z. Accumulation process and control factors of Jurassic-Cretaceous distant-source and secondary-filled reservoirs in the hinterland of Junggur Basin. Acta Sci. Nat. Univ. Pekin. 2018, 54, 1195–1204. [Google Scholar]
  33. Zhu, G.; Su, J.; Yang, H.; Wang, Y.; Fei, A.; Liu, K.; Zhu, Y.; Hu, J.; Zhang, B. Formation mechanisms of secondary hydrocarbon pools in the Triassic reservoirs in the northern Tarim Basin. Mar. Pet. Geol. 2013, 46, 51–66. [Google Scholar] [CrossRef]
  34. Lei, J.; Worden, R.H.; Cai, C.F. Thermochemical sulfate reduction and fluid evolution of the Lower Triassic Feixianguan Formation sour gas reservoirs, northeast Sichuan Basin, China. AAPG Bull. 2014, 98, 947–973. [Google Scholar]
  35. Volk, H.; George, S.C.; Kempton, R.H.; Liu, K.; Ahmed, M.; Ambrose, G.J. Petroleum migration in the Georgina Basin: Evidence from the geochemistry of oil inclusions and bitumens. In Proceedings of the Central Australian Basins Symposium (CABS). Northern Territory Geological Survey, Alice Springs, Northern Territory, Australia, 16–18 August 2007; pp. 282–303. [Google Scholar]
  36. Ali, A.; Younas, M.; Ullah, M.; Hussain, M.; Toqeer, M.; Bhatti, A.S.; Khan, A. Characterization of secondary reservoir potential via seismic inversion and attribute analysis: A case study. J. Pet. Sci. Eng. 2019, 178, 272–293. [Google Scholar] [CrossRef]
  37. Jahn, B.M.; Wu, F.; Chen, B. Massive granitoid generation in Central Asia: Nd isotope evidence and implication for continental growth in the Phanerozoic. Episodes 2000, 23, 82–92. [Google Scholar] [CrossRef] [PubMed] [Green Version]
  38. Windley, B.F.; Alexeiev, D.; Xiao, W.; Kröner, A.; Badarch, G. Tectonic models for accretion of the Central Asian Orogenic Belt. J. Geol. Soc. 2007, 164, 31–47. [Google Scholar] [CrossRef] [Green Version]
  39. Liu, H.L.; Yin, H.; Imin, A.; Ding, X. Origin and preservation of deep natural gas in the lower assemblage of the western Junggar Basin. J. China Univ. Min. Technol. 2022, 51, 148–159. [Google Scholar]
  40. Chen, J.P.; Wang, X.L.; Deng, C.P.; Liang, D.G.; Zhang, Y.Q.; Zhao, Z.; Wang, Y.T. Geochemical features of source rocks and crude oil in the Junggar Basin, northwestem China. Acta Geol. Sin. 2016, 90, 37–67. [Google Scholar]
  41. Saadati, H.; Al-Iessa, H.J.; Alizadeh, B.; Tarhandeh, E.; Jazayeri, M.H.; Bahrami, H.; Rashidi, M. Geochemical characteristics and isotopic reversal of natural gases in eastern Kopeh-Dagh, NE Iran. Mar. Pet. Geol. 2016, 78, 76–87. [Google Scholar] [CrossRef]
  42. Qiu, N.S.; Yang, H.B.; Wang, X.L. Tectonic-thermal evolution in the Junggar Basin. Chin. J. Geol. 2002, 37, 423–429. [Google Scholar]
  43. Milkov, A.V. Worldwide distribution and significance of secondary microbial methane formed during petroleum biodegradation in conventional reservoirs. Org. Geochem. 2011, 42, 184–207. [Google Scholar] [CrossRef]
  44. Mango, F.D. The light hydrocarbons in petroleum: A critical review. Org. Geochem. 1997, 26, 417–440. [Google Scholar] [CrossRef]
  45. Hu, T.L.; Ge, B.X.; Zhang, Y.G.; Liu, B. Development and application of fingerprint parameters of source rock adsorbed hydrocarbon and natural gas light hydrocarbon. Pet. Geol. Exp. 1990, 12, 375–394,450. [Google Scholar]
  46. Leythaeuser, D.; Schaefer, R.; Cornford, C.; Weiner, B. Generation and migration of light hydrocarbons (C2–C7) in sedimentary basins. Org. Geochem. 1979, 1, 191–204. [Google Scholar] [CrossRef]
  47. Qian, H.T.; Su, D.X.; Ablimit, I.; Wang, X.Y.; Li, Z.H.; Wang, G.D. Petroleum geological characteristics and exploration potential in slope area of Well Pen-1 Western Depression in Junggar Basin. Nat. Gas Geosci. 2021, 32, 551–561. [Google Scholar]
  48. Chen, J.P.; Sun, Y.G.; Zhong, N.N.; Huang, Z.K.; Deng, C.P. Lacustrine facies hydrocarbon expulsion efficiency of hydrocarbon source rock and hydrocarbon expulsion model. In Proceedings of the Fourteenth China Mineral Rock Geochemistry Academic Annual Conference, Nanjing, China, 21 April 2013. [Google Scholar]
  49. Harry, D.J. Three common source rock evaluation errors made by geologists during prospect or play appraisals. AAPG Bull. 2009, 93, 341–356. [Google Scholar]
  50. Mango, F.D. The origin of light hydrocarbons in petroleum: A kinetic test of the steady-state catalytic hypothesis. Geochim. Cosmochim. Acta 1990, 54, 1315–1323. [Google Scholar] [CrossRef]
  51. Wu, M. Geochemical Study on Hydrocarbon Accumulation in Deep Strata of the Central Junggar Basin, Northwest China; Nanjing University: Nanjing, China, 2012. [Google Scholar]
  52. Schoell, M. Genetic characterization of natural gases. AAPG Bull. 1983, 67, 2225–2238. [Google Scholar]
  53. Chen, J.; Wang, X.; Chen, J.; Ni, Y.; Xiang, B.; Liao, F.; He, W.; Yao, L.; Li, E. New equation to decipher the relationship between carbon isotopic composition of methane and maturity of gas source rocks. Sci. China Earth Sci. 2021, 64, 470–493. [Google Scholar] [CrossRef]
  54. Prinzhofer, A.; Pernaton, R. Isotopically light methane in natural gas: Bacterial imprint or diffusive fractionation? Chem. Geol. 1997, 142, 193–200. [Google Scholar] [CrossRef]
  55. Hou, L.; Wang, J.; Kuang, L.; Zhang, G.; Liu, L.; Kuang, J. Provenance Sediments and Its Exploration Significance-A Case from Member 1 of Qingshuihe Formation of Lower Cretaceous in Junggar Basin. Earth Sci. Front. 2009, 16, 337–348. [Google Scholar] [CrossRef]
  56. Kou, C.H. Origins and Accumulation Model of Hydrocarbon in Deep Strata of the Central Junggar Basin, Northwestern China; Nanjing University: Nanjing, China, 2017. [Google Scholar]
  57. Cheshmeh Sefidi, A.; Ajorkaran, F. A novel MLP-ANN approach to predict solution gas-oil ratio. Pet. Sci. Technol. 2019, 37, 2302–2308. [Google Scholar] [CrossRef]
Figure 1. Geological overview of the eastern belt around the Penyijingxi sag in the Junggar Basin, NW China (modified from refs. [32,37]). (a) Division of tectonic units in the Junggar Basin, (b) geological overview of the eastern belt around Penyijingxi sag, and (c) stratigraphic column of the Penyijingxi sag.
Processes 11 00689 g001
Figure 2. Histogram of δ13C1 (a), δ13C2 (b), δ13C3 (c), and δ13C4 (d) of the natural gas in the eastern belt around the Penyijingxi sag, Junggar Basin.
Processes 11 00689 g002
Figure 3. Cross-plots of δ13C213C1 vs. δ13C313C2 (a) and δ13C313C2 vs. δ13C413C3 (b) of the natural gas in the eastern belt around the Penyijingxi sag, Junggar Basin. SXB C means the Carboniferous system of Shixi bulge, SXB J1s means Jurassic Sangonghe formation of Shixi bulge, MBB J1s means Jurassic Sangonghe formation of Mobei bulge, MBS J1s means Jurassic Sangonghe formation of Mobei slope, MSWB J1s means Jurassic Sangonghe formation of Mosuowan bulge.
Processes 11 00689 g003
Figure 4. Genetic types identification chart for natural gases in the eastern belt around the Penyijingxi sag, Junggar Basin based on δ13C2 & δ13C1 (plate from ref. [11]).
Processes 11 00689 g004
Figure 5. Characteristics of C7 light hydrocarbons from natural gases in the eastern belt around the Penyijingxi sag, Junggar Basin.
Processes 11 00689 g005
Figure 6. Cross-plots of A1 vs. A2 (a) and K1 vs. K2 (b) for the light hydrocarbons associated with the natural gas in the Eastern belt around the Penyijingxi sag, Junggar Basin (Plate from ref. [50]).
Processes 11 00689 g006
Figure 7. Fingerprint characteristics of light hydrocarbons associated with the natural gas in the eastern belt around the Penyijingxi sag, Junggar Basin and the crude oil (crude oil data from ref. [51]). a. trans-1,3-DMP/trans-1,2-DMP, b. CH/MCH, c. MCH/∑DMCH, d. n-heptane/(ECH + MCH), e. n-hexane/CH, f. 3-MP/3-MP, and g. 3-MH/2,3-DMP. (a) Shixi bulge, (b) Mobei Slope, (c) Mosuowan bulge, and (d) Mobei bulge. trans-1,3-DMP means 1-trans 3-dimethylpentane, trans-1,2-DMP means 1 trans 2-dimethylpentane, CH means cyclohexan, MCH means methylcyclohexane, ΣDMCH means Σdimethyl cyclohexane, ECH means ethylcyclohexane, 2-MP means 2-methylpentane, 3-MP means 3-methylpentane, 3-MH means 3-methylhexane, 2,3-DMP means 2,3-dimethylpentane.
Processes 11 00689 g007
Figure 8. Geochemical parameters of the Mobei bulge in the eastern belt around the Penyijingxi sag, Junggar Basin.
Processes 11 00689 g008
Figure 9. Relationship of δ13C2 vs. depth (a) and carbon isotopic compositions of alkanes (b) of the natural gases from well pen 4 in the Mosuowan Bulge, Junggar Basin (data from ref. [56]).
Processes 11 00689 g009
Figure 10. Relationship of δ13C113C2 vs. Ln(C1/C2) in the eastern belt around the Penyijingxi sag, Junggar Basin (Plate from ref. [54]).
Processes 11 00689 g010
Table 1. Depth and source of natural gas samples.
No.WellFormationDepth/mNo.WellFormationDepth/mNo.WellFormationDepth/m
1M121J1s422219QS2J1s398137MB5J1s3726
2M121J1s425520QS4J1s401438M108J1s4179
3M109J1s415821M101J1s420439M109J1s4185
4M113J1s420522S006J1s357740M11J1s4139
5M115J1s420423S006C437341M11J1s4177
6M116J1s419524S007C440942M7J1s4228
7M117J1s423825SX1C443843M7J1s4260
8M119J1s425826SX1C447344M8J1s4233
9M119J1s423627S015J1snd45M8J1s4266
10M003J1s391528SX8J1snd46M16J1s4041
11M003J1s397529SX14J1snd47M171J1s4473
12MB2J1s392130MB11J1s371148M17J1s4162
13MB2J1s392131MB2J1s390749M12J1s4235
14MB5J1s372632M003J1s397250M17J1s4192
15MB10J1s366633MB9J1s376151M101J1s4209
16M16J1s404734MB9J1s377852M102J1s4251
17QS1J1s394535M005J1s389053M103J1s4251
18QS1J1s394536M006J1s375954P5J1s4250
Notes: J1s means Jurassic Sangonghe formation, C means Carboniferous, nd means no data, M means Mo, MB means Mobei, QS means Qianshao, SX means Shixi, P means Pen.
Table 2. Natural gas compositions by zone in the eastern belt around the Penyijingxi sag, Junggar Basin.
CategoryCarboniferousJurassic Sangonghe Formation
Shixi BulgeShixi BulgeMobei BulgeMobei SlopeMosuowan Bulge
CH4/%71.36~88.8275.10~91.1284.56~93.3473.88~91.2087.49~89.51
79.1081.4289.9787.5888.31
C2H6/%3.70~7.924.38~9.113.10~6.694.02~10.904.25~4.70
5.877.394.255.374.5
C3H8/%1.07~4.361.47~4.720.93~3.011.07~5.961.47~1.98
3.283.301.502.201.76
C4H10/%1.08~4.550.90~4.040.50~1.950.60~4.380.84~1.43
3.322.590.981.451.15
C5H12/%0.54~1.780.33~1.490.08~0.930.24~1.570.24~0.62
1.321.000.360.540.45
CO2/%0.00~0.370.63~1.070~1.490.31~0.700.41~0.62
0.170.800.400.520.54
C1/C1-50.82~0.930.80~0.930.87~0.950.76~0.940.91~0.93
0.850.80.930.900.92
Note : 71.36 ~ 88.82 79.10 ( 4 ) = Min ~ Max Ave , see Appendix A for all data.
Table 3. Geochemical characteristics of the main source rocks in the Penyijingxi sag, Junggar Basin [47,48].
StratumTOC/%(S1 + S2)/(mg/g)Chloroform Bitume “A”/%Hydrogen Index/(mg/g.TOC)Kerogen Type
J2x0.40~5.870.05~17.700.016~0.918/
1.422.030.267/
J1b0.42~5.860.08~29.670.025~4.916/
1.683.030.555/
P2w0.18~14.030.01~37.520.0007~0.80241.20~950.00
1.692.060.069274.16
P1f0.03~4.430.1~59.840.0004~1.89333.33~1872.37
0.934.660.2507306.54
P1j0.1~14.040.01~17.600.0025~0.45391.64~507.89
2.381.810.05255.85
C0.03~19.80.01~37.520.001~0.35151.63~365.06
1.630.840.03152.45
Note : 0.40 ~ 5.87 1.42 = Min ~ Max Ave .
Table 4. Maturity degrees of natural gases in the eastern belt around the Penyijingxi sag, Junggar Basin.
CategoryCarboniferousJurassic Sangonghe Formation
Shixi BulgeShixi BulgeMobei BulgeMobei SlopeMosuowan Bulge
Oil-associatedδ13C113C2/‰−10.41−13.19−14.72~−12.85/−13.19
Ro/%1.191.000.75~0.96/1.55
Coal-derivedδ13C113C2/‰−7.86~−5.64−11.59~−8.38−15.81~−7.75−10.25~−6.84−10.2~−8.15
Ro/%1.22~1.790.93~1.330.61~1.300.97~1.361.01~1.21
Disclaimer/Publisher’s Note: The statements, opinions and data contained in all publications are solely those of the individual author(s) and contributor(s) and not of MDPI and/or the editor(s). MDPI and/or the editor(s) disclaim responsibility for any injury to people or property resulting from any ideas, methods, instructions or products referred to in the content.

