
Numerical Study of the Purge Flow’s Effect on the Loss Mechanism of the Blocking and Shear Effects
1
School of Power and Energy, Northwestern Polytechnical University, Xi′an 710072, China
2
School of Aircraft Engineering, Xi′an Aeronautical Institute, Xi′an 710077, China
3
High Speed Aerodynamics Institute, China Aerodynamics Research and Development Center, Mianyang 621000, China
*
Author to whom correspondence should be addressed.
Processes 2023, 11(1), 50; https://doi.org/10.3390/pr11010050
Submission received: 22 November 2022
/
Revised: 12 December 2022
/
Accepted: 13 December 2022
/
Published: 26 December 2022
(This article belongs to the Special Issue CFD Applications in Energy Engineering Research and Simulation)
Abstract
:The loss mechanism of shear and upstream blockage caused by the interaction of the purged flow and ingested gas needs to be systematically studied to optimize the flow near the rim. In order to study the causes and influence factors of blocking and shearing effects and quantify their losses reasonably, the three-dimensional unsteady numerical method validated by the experiment data was adopted to study the turbine with three kinds of sealing structures. The block and shear loss are quantified by integrating the dissipation coefficient in the volume where the specific aerodynamic loss occurs. The result indicated that there was a larger radial velocity and smaller tangential velocity of the purged flow relative to the main flow caused the blocking effect. Therefore, its loss is affected by the seal flow and seal structure. The shear effect is mainly affected by the tangential velocity gradient and the axial velocity gradient near the cavity exit. The contribution of the tangential velocity gradient to shear loss is increased with the enlarged sealing efficiency. Through research, it is clear that increasing the purge flow’s tangential velocity is beneficial to reducing the shear loss and has a positive significance for weakening the blocking effect in the main flow channel. Furthermore, the influence of sealing structure on blocking and shear effect must be particularly considered since both are related to sealing efficiency.
1. Introduction
Introducing sealing air to the turbine cavity is an effective way to cool the high-temperature wall of the turbine cavity and prevent gas ingestion. However, the interaction between the purge flow and the mainstream leads to additional losses for the turbine’s main annular, thus lowering the aerodynamic efficiency. Total-to-total efficiency would decrease by 0.6% when the sealing air rate IR is enlarged from −0.14% to 0.9% according to the research of Schuepbach et al. [1]. Reid et al. [2] pointed out that the turbine efficiency decreases by 0.56% with the purge flow rate of 1.0%.
Zlatinov et al. [3] quantified the loss of each part of the sealed air on the main flow through theoretical analysis and numerical calculation. It is pointed out that the loss caused by the sealed air can be attributed to three aspects: (1) the shear loss caused by the tangential velocity difference between the sealed air and the main flow; (2) the loss caused by the interaction between the sealing flow and the main secondary flow; (3) the loss induced by the blocking of the sealed flow to the main flow channel. They also pointed out that the blocking effect is independent of the swirl ratio and only affected by the sealing flow. The numerical studies by Jia Wei et al. [4] divide the losses associated with the purge flow into four types, emphasizing that they are not independent of each other.
Many studies have been carried out on the influence of purge flow on the secondary flow, and the significance of its influence has been confirmed [5,6,7]. The research in a 1.5-stage high-pressure turbine carried out by Schuepbach et al. [8] showed that the secondary flow in the hub would significantly develop in the radial direction with the purge flow. Ong et al. [9] pointed out that the negative angle of attack at the rotor inlet caused by the sealing air is the main reason for the enhancement and radial expansion of the rotor passage vortex. Regina et al. [10] focused on the influence mechanism of the sealing air on the rotor channel vortex. They believe the reason for changing the secondary flow intensity of the rotor is the increase of the flow coefficient at the hub rather than the increase of the negative angle of attack of the rotor. McLean et al. [11,12] found that the purge air not only significantly affects the secondary flow structure, but also causes apparent unsteady fluctuation of the main flow pressure and affects the development of the boundary layer at the hub. Schreiner and Mesny et al. [13,14] tracked the evolution mechanism of the interference of sealing air on the mainstream vortex structure through more advanced testing methods, making the research in this field more refined.
Compared to the influence on the interference of secondary flow, the research on shear and blocking loss has not been systematic. However, it also accounts for a large proportion of the interference loss. Reid et al. [2] found that severe mixing of the sealing air with the mainstream and its interference with the channel vortex are the leading causes of the losses. The losses caused by the two are equivalent. The experimental measurement also illustrated that the pre-swirl of the purge air would weaken the main flow aerodynamic loss caused by the increase of the sealing flow rate. Jenny et al. [15] obtained a similar conclusion. They also believed that the result of the reduction of turbine power capacity is that the turbine rotor works on the sealed air by accelerating the tangential direction and dissipating it through the hub vortex core region. Subsequently, Schrew et al. [16] focused on the mechanism of loss generation by analyzing the change law of sealing efficiency, inlet and outlet section Mach number, blade surface pressure coefficient, and hub pressure coefficient with sealing flow through the measured pressure on a two-stage low-pressure turbine. Yangfan [17,18,19] found that each part of the loss proposed by Zlatinov and Schrew et al. has prominent regional distribution characteristics. Based on this characteristic, the loss of each part is quantified. Similar to most previous studies, the conclusion is that shear loss is dominant in all kinds of losses. Therefore, the shear loss characteristics are further studied. It is found that the circumferential velocity gradient in the radial direction, the axial velocity gradient in the radial direction, and the tangential velocity gradient in the axial direction are the main factors causing viscous shear loss. They believe that the sealing flow and pre-swirl parameters at the inlet of the sealing flow significantly influence the shear loss. In contrast, other parameters, such as the sealing structure’s angle and the sealing gap’s position and width, can be ignored. Dario Barsi [20] quantified the loss caused by the interference of purged flow and main flow downstream of the vane and upstream of the rotor. The loss distributions indicated that the loss at the exit of the vane blade increased significantly; compared to the system without a cavity, the loss increased by 50%, below 50% of the blade span. Huang et al. [21] emphasized that the blocking caused by the sealed air reduces the loss of the upstream stator. Compared to the Chute sealing structure, the blocking of the radial sealing structure is more substantial. Hunter [22] concluded that the primary source of loss related to the sealing flow is the mixing loss caused by the difference in tangential momentum between the sealing air and the main flow. Zhang et al. [23] found that the Kelvin–Helmholtz instability near the turbine rim reduces the tangential velocity gradient of the main flow and the purge flow, thereby reducing the aerodynamic loss.
It is generally believed that the losses caused by the mixing shear due to the purge flow account for a relatively large proportion of all kinds of losses. In a typical front cavity structure, the loss associated with the purge air in the upstream stator region includes not only mixing shear but also blocking effect. Their influence mechanism has not been unified yet because of the complicated interference mechanism between ingested gas and purge air at the rim seal of the wheel space. In addition, the model assumptions are adopted in most quantitative studies on losses, which are not conducive to accurately assessing losses.
In this paper, the front cavity sealing structure was taken as the research object. The influence of sealing air on the upstream stator blocking and shear effect was analyzed in detail on account of the interaction between ingested gas and sealing air in the rim gap. In addition, the influence mechanism of sealing flow rate and sealing structure on blocking effect and shear effect was fully considered.
2. Numerical Method
2.1. Computational Models
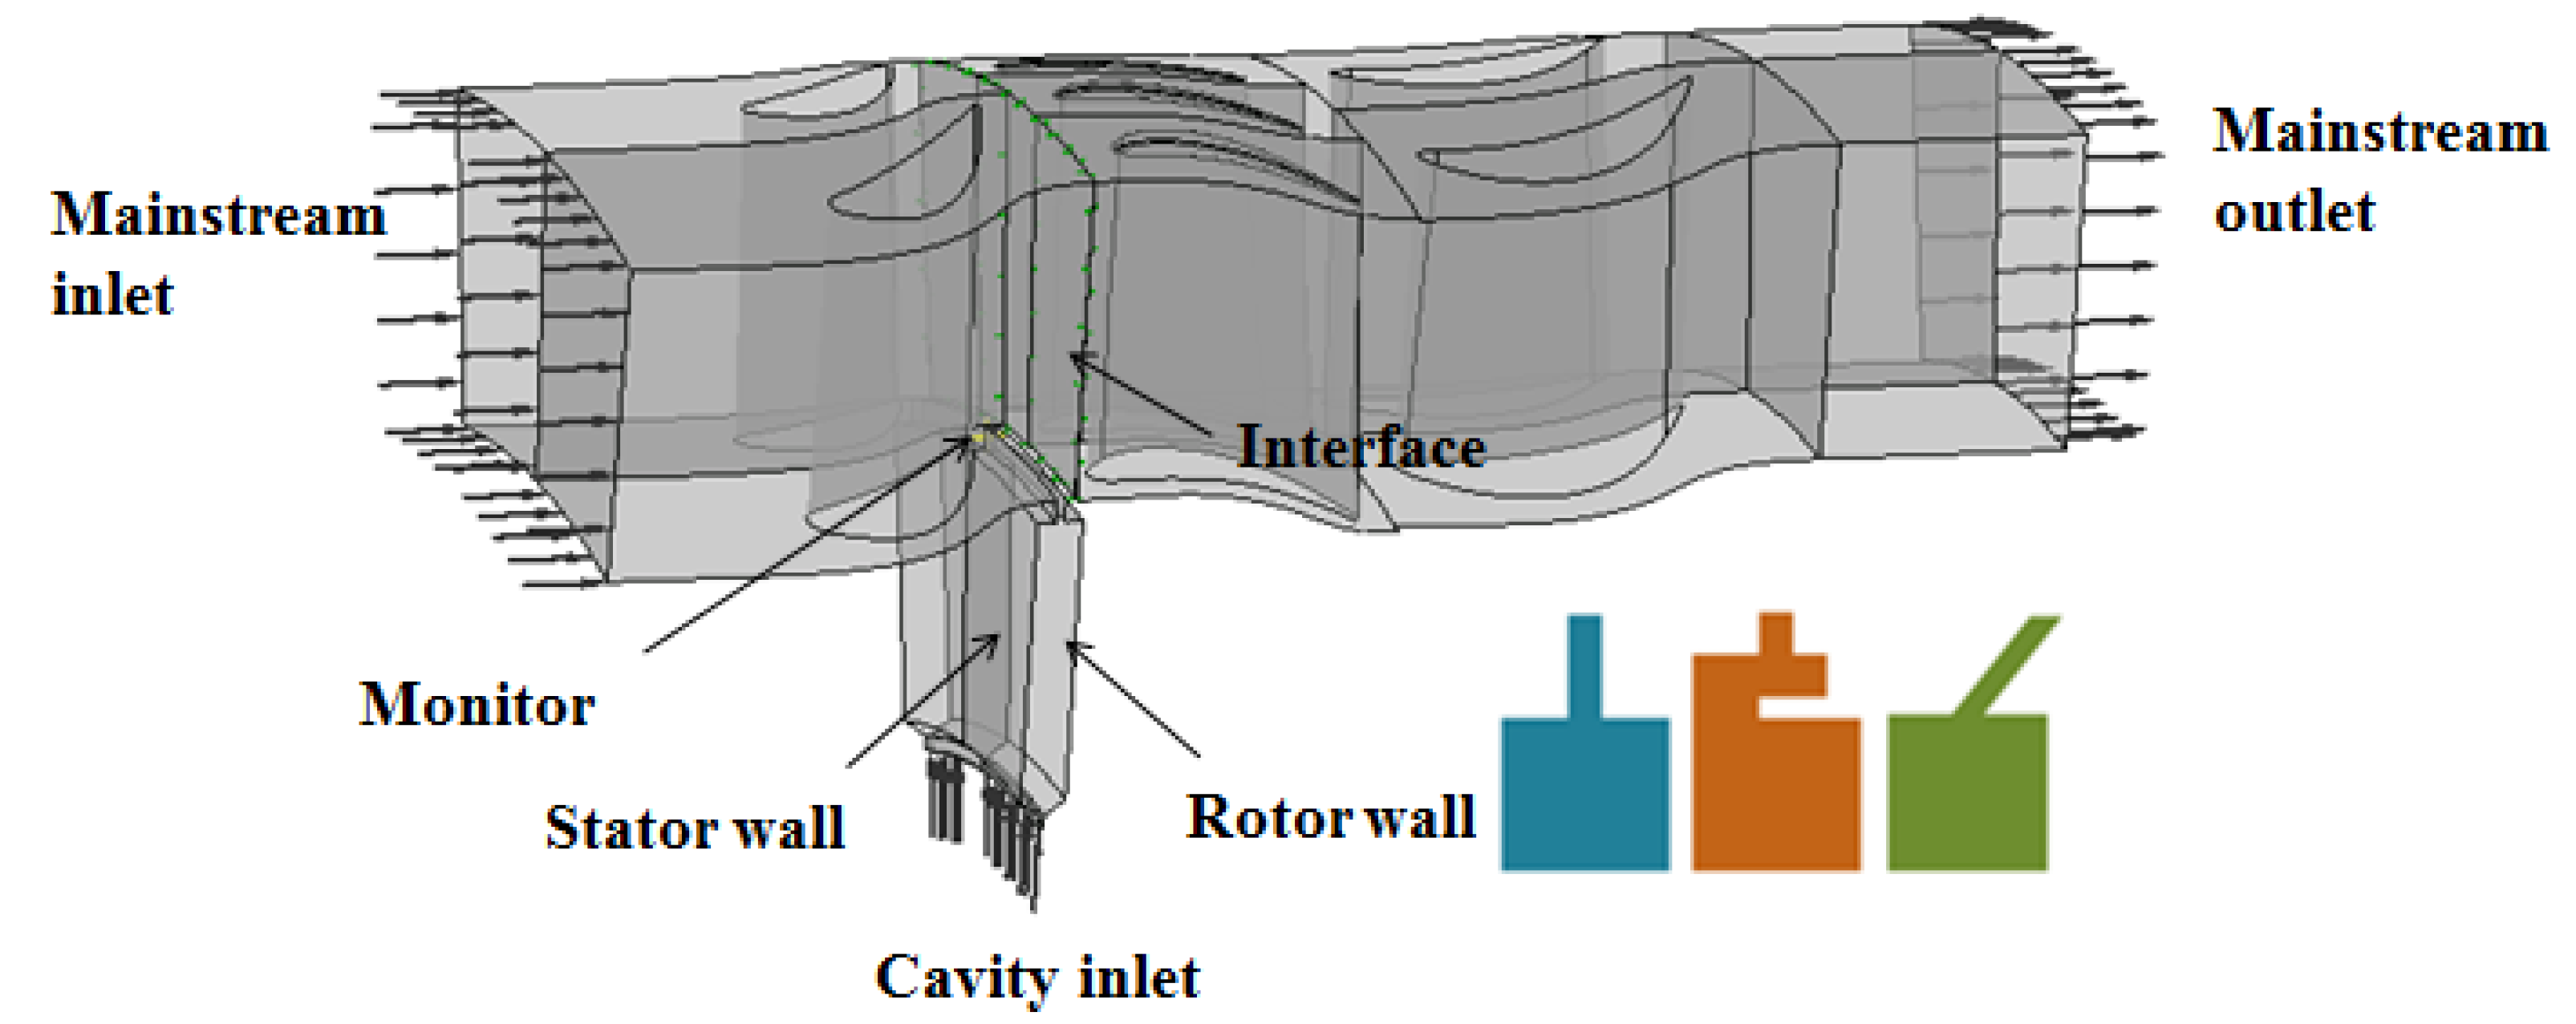
A 1.5-stage Lisa turbine with a front cavity was adapted to investigate. The seal structures in this paper are axial, radial, and chute, with the angles of 30, 45, and 60. The turbine devices with five sealing structures were described as Axial, Radial, Chute_60, Chute_45, and Chute_30. The inclination angle is between the seal structure and the axial direction. The outlet of Chute_30 is closest to the axial direction; that is, the inclination is the largest. The model used in the paper is the same as that in the literature [24]. The Computational Model is shown in Figure 1. The r blade profile parameters are shown in Table 1. In addition, the turbine without cavity was also calculated as a comparative case, described as “No_purge” below.
2.2. Numerical Approach and Mesh
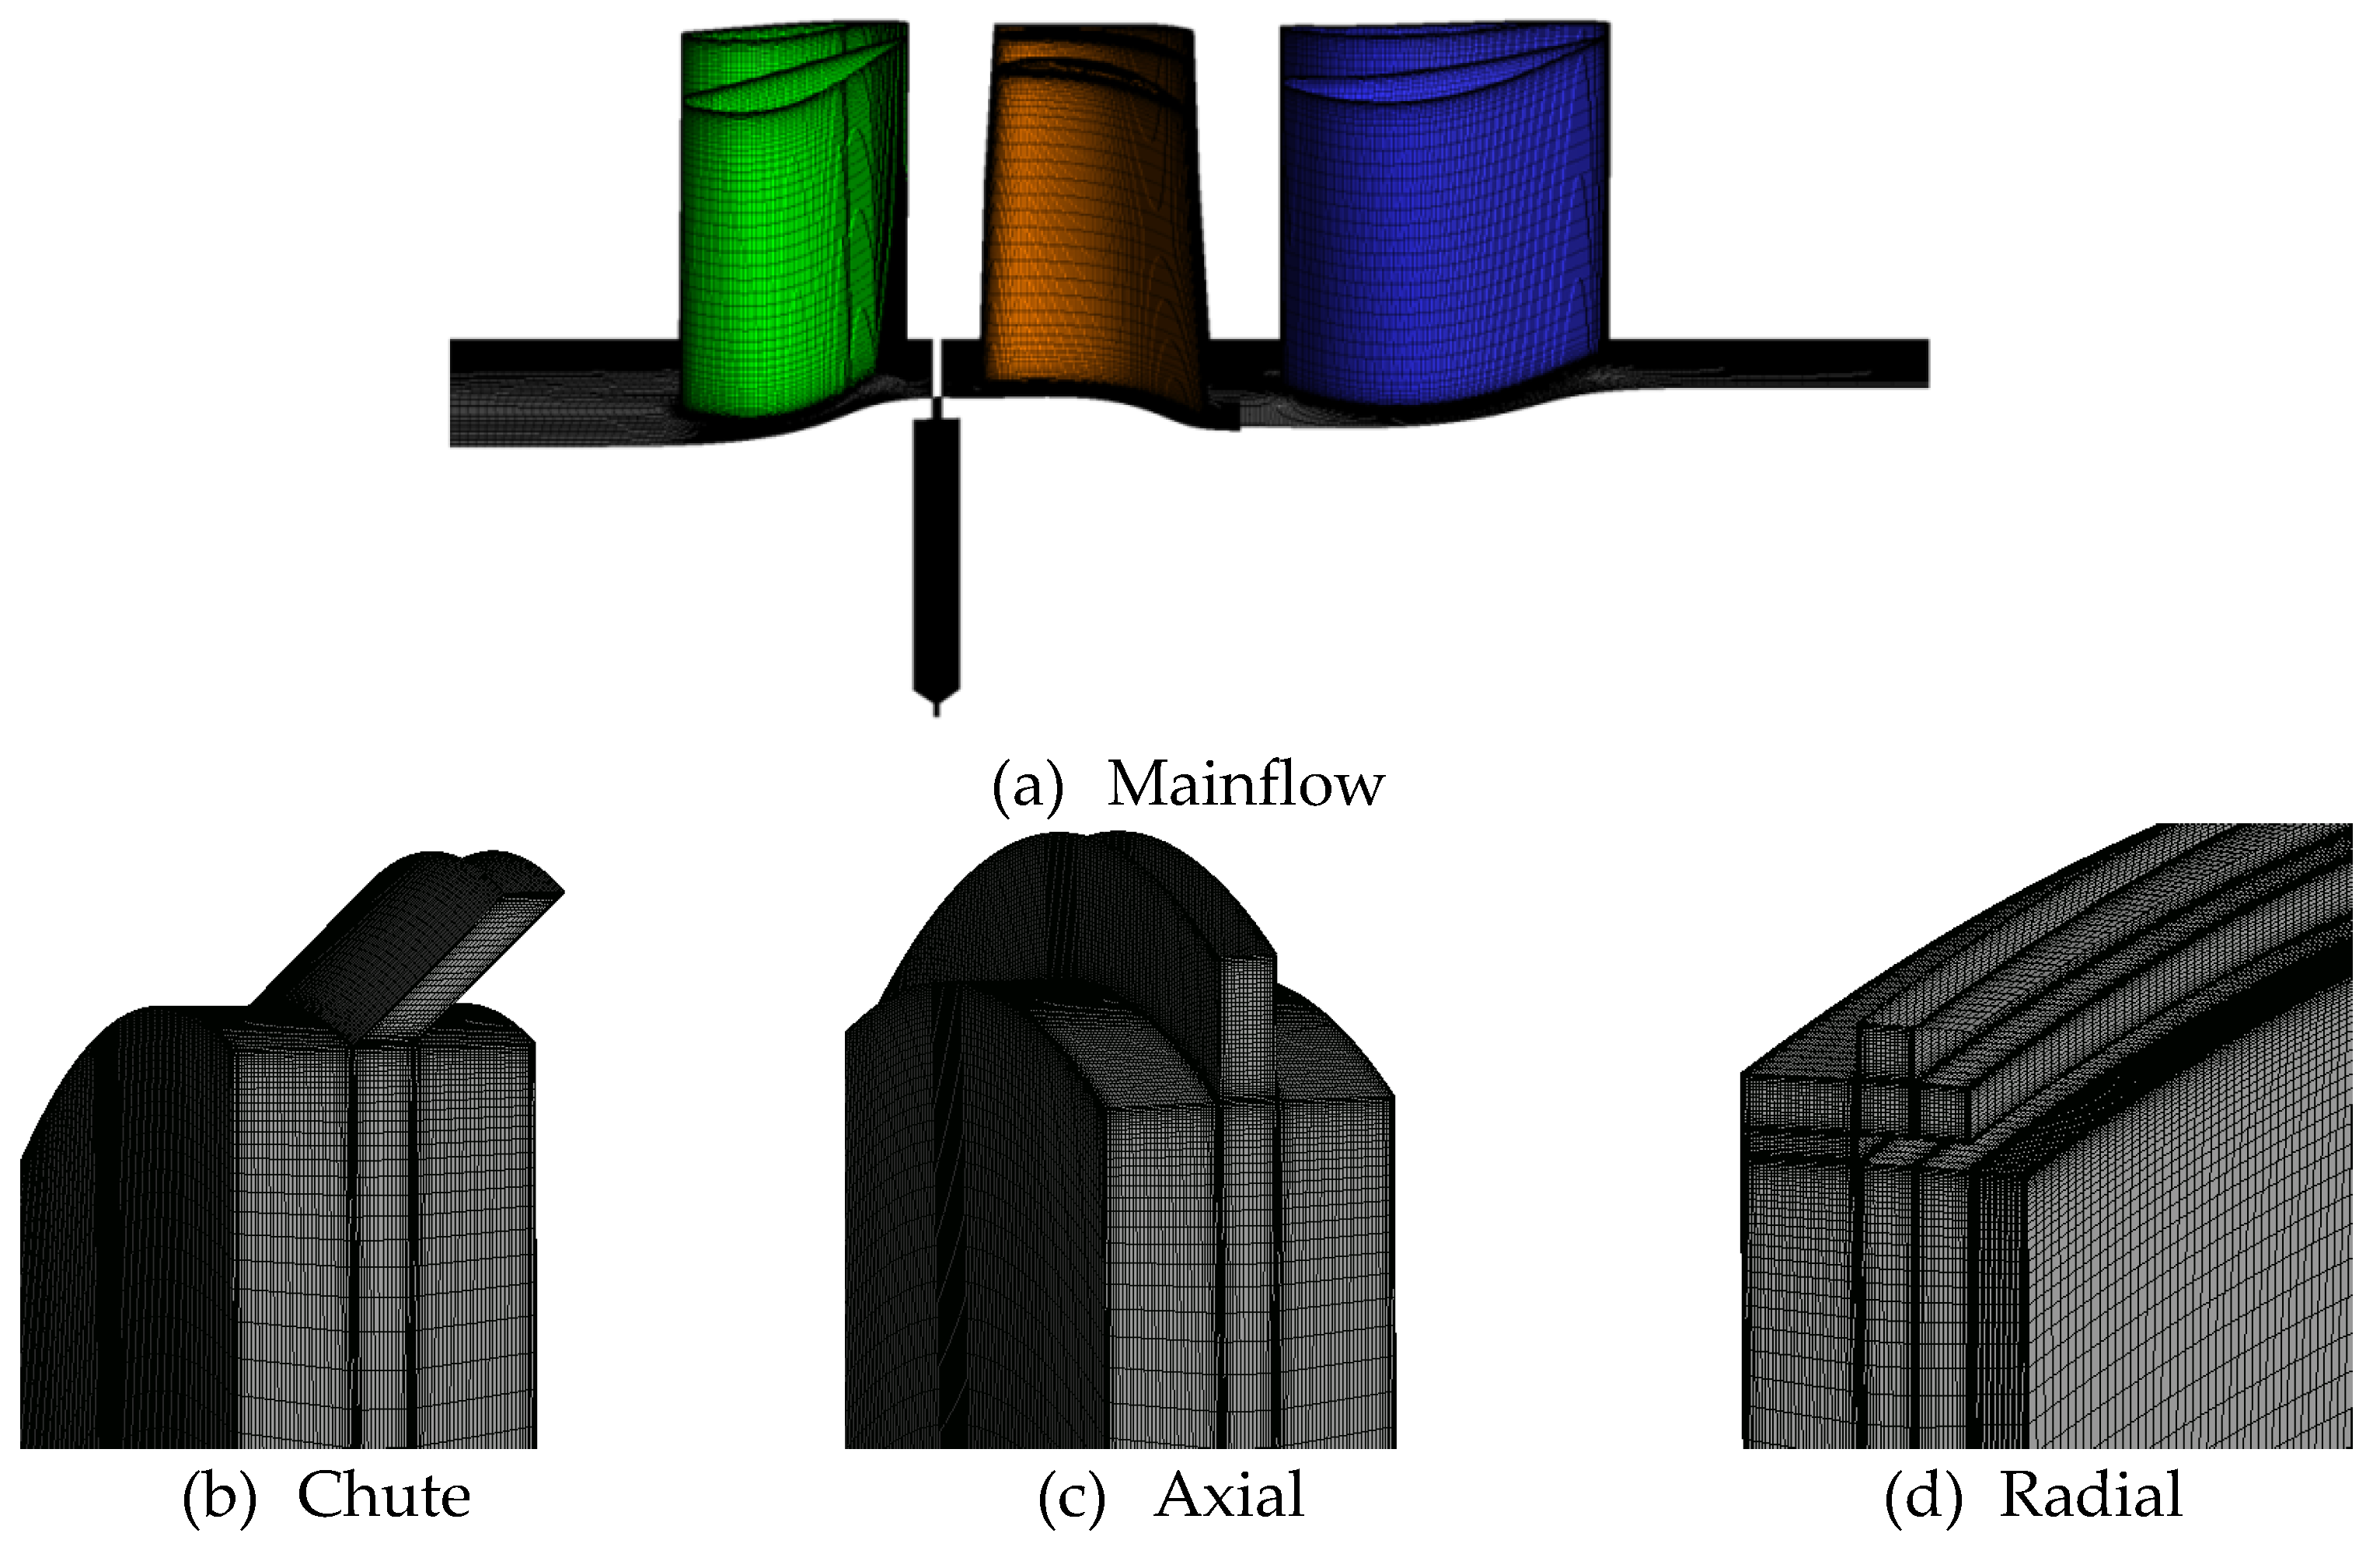
ANSYS CFX software(2020R2) was used to solve the Reynolds-averaged N–S equation, and the SST turbulence model was selected to solve the unsteady three-dimensional flow. To minimize the interpolation error, a matching grid interface should be defined. Thus, the mesh of the stator with the cavity was carried out in the ICEM software(2020R2), while the rotor and the second stator were undertaken using NUMECA AutoGrid5 software(8.2). The hexahedral structured grid is shown in Figure 2. The grids near the wall surface and the cavity gap were also densified. The y+ value of most areas near the wall surface was close to 1, and the maximum value was about 2. The total number of nodes was 8.0 million, and the detailed information referenced [24].
2.3. Boundary Conditions
The boundary condition is shown in Table 2. The working medium is a mixture of CO2 and ideal gas to distinguish the purge flow from the mainstream. The IR is defined as the ratio of sealing airflow to mainstream flow. The physical time step was 0.00978 us, which was obtained by dividing the blade into 42 steps when it passed through a rotor channel. After the convergence of unsteady calculation, which could be identified by the unsteady change of pressure in Figure 3, the data of 9 cycles was taken for the statistical average [24].
2.4. Validation of Numerical Method
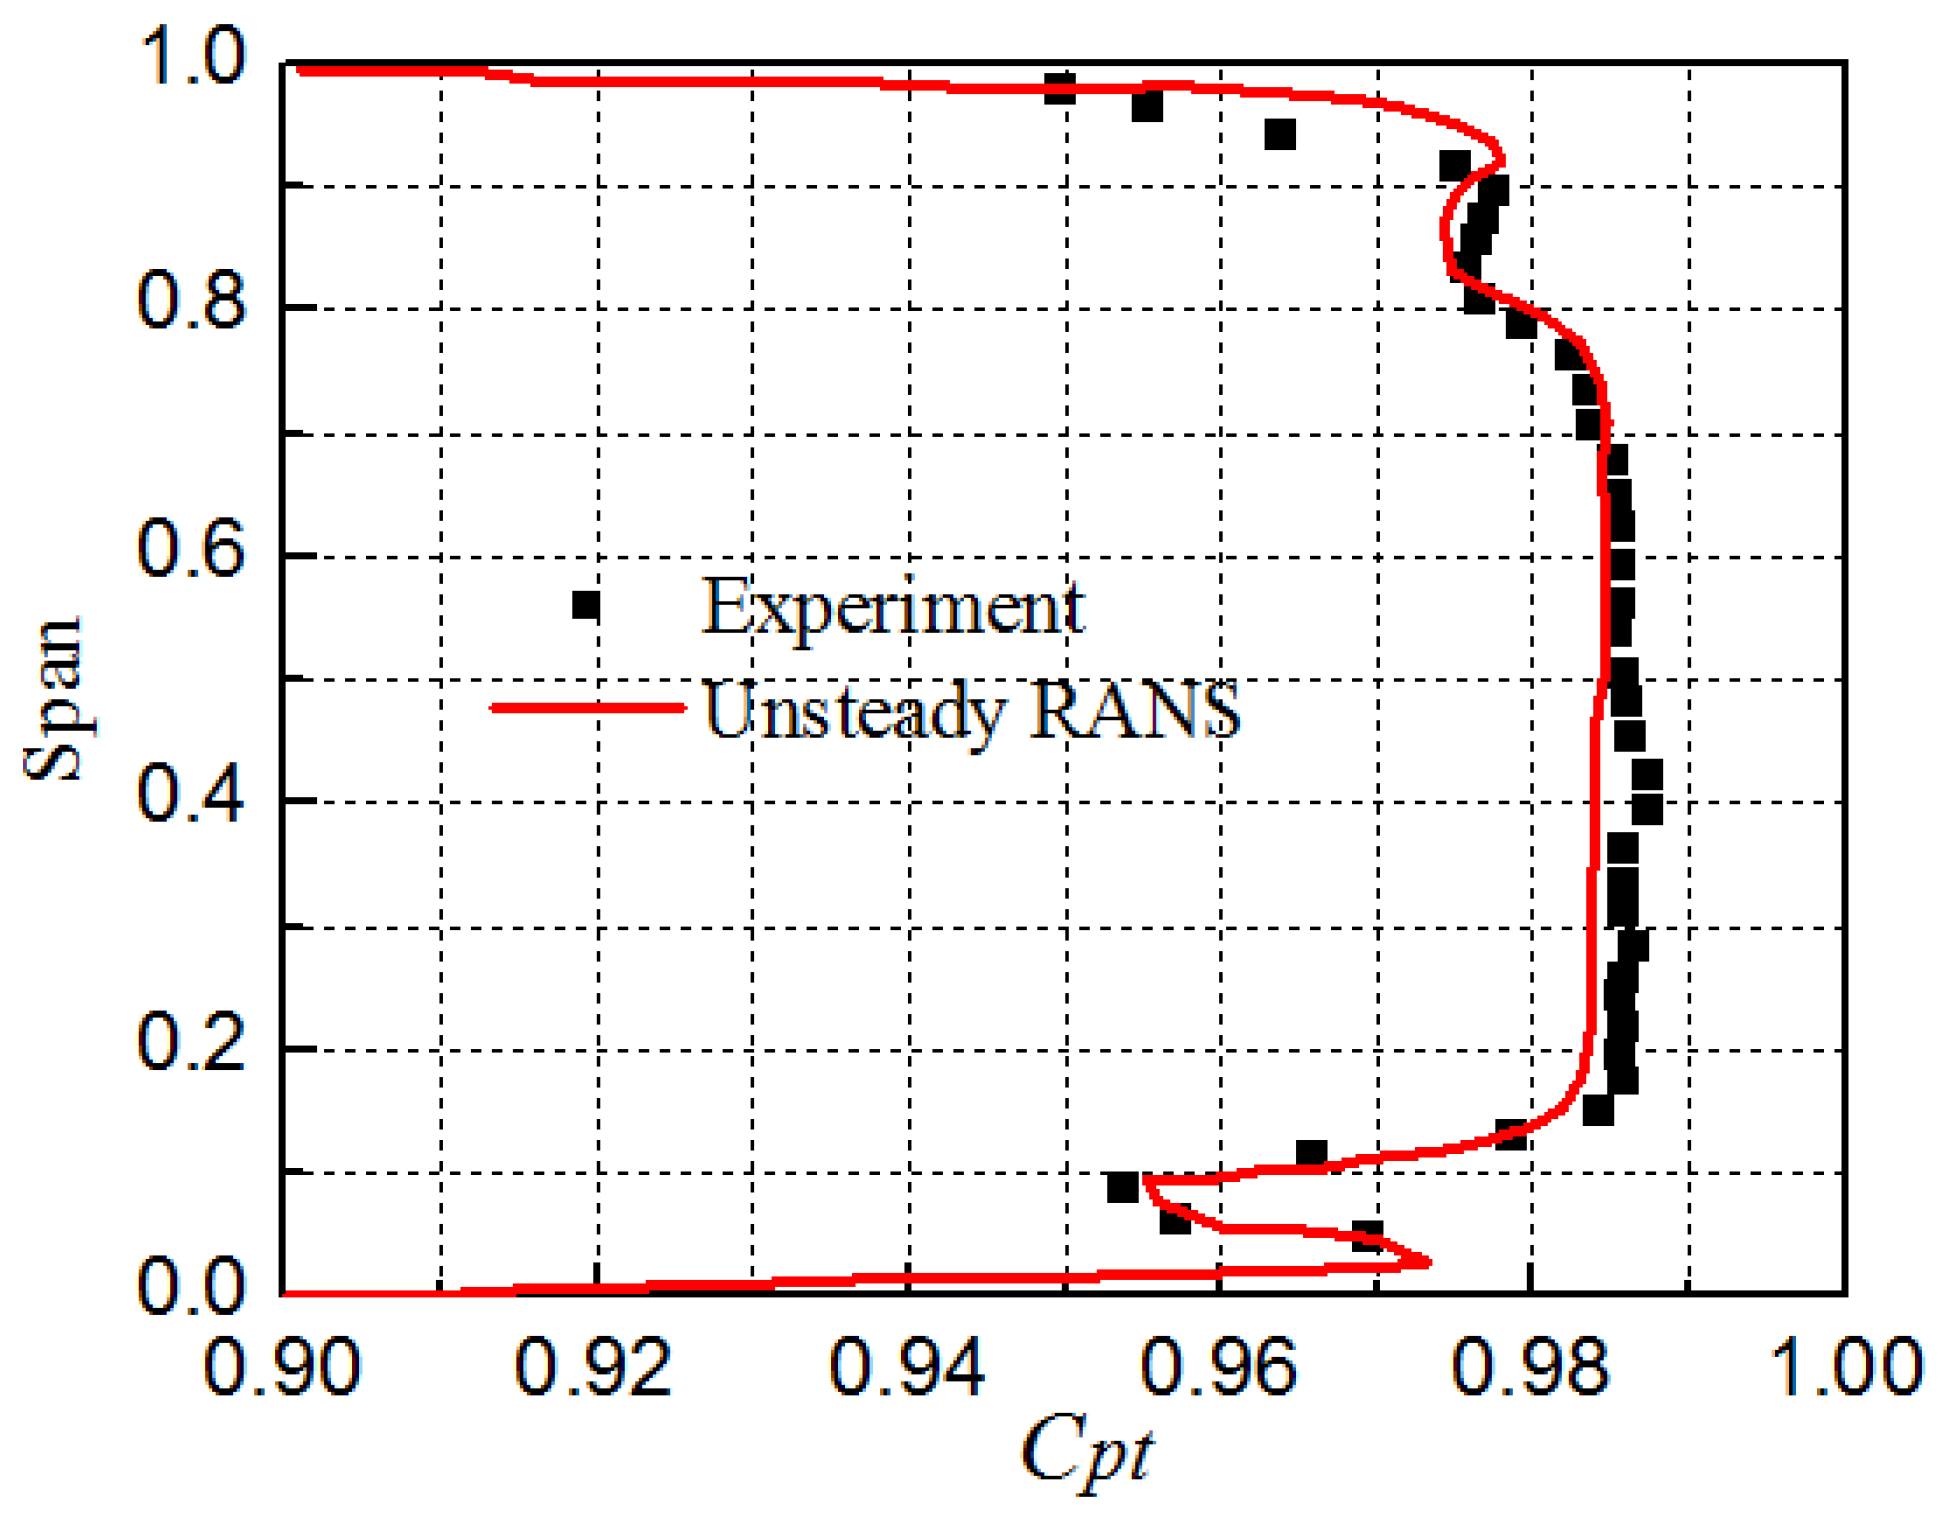
The calculated total pressure coefficient and flow angle at the stator exit are compared with the experimental data to verify the numerical simulation method since the shear effect and blocking effect considered in this study occur in the stator domain. The total pressure coefficient in Figure 4 is defined as Equation (1), and the specific parameters in the equation are referenced [24]. The flow angle in Figure 5 is the angle between the flow and the axial direction.
It can be concluded that the position of the vortex at the end wall of the stator exit captured by the numerical method was consistent with the experimental results. The corresponding under-rotation and over-rotation position of airflow is also relatively consistent. The blocking and shear effects studied in this paper are related to the flow field near the stator hub. Figure 5 shows that the numerical results near the hub are in good agreement with the experimental results. Therefore, the selected numerical method is reasonable based on the research purpose of this paper.
3. Results and Discussion
3.1. Definition of Loss Parameters and Variation of Turbine Loss along Flow Direction
To evaluate the aerodynamic loss of turbine mainstream along the flow direction with or without the cavity, the entropy increase was introduced in this paper. The mainstream entropy increase of the turbine without a cavity is defined as Equation (2):
where , are the total temperature and total pressure at the mainstream inlet, respectively, and , represent local static temperature and pressure, respectively.
Since there are two streams for the turbine with a cavity, the total pressure in the above formula is replaced by the work-averaged total pressure, defined as Equation (3), which is based on the work-average of the purge flow and the mainstream, referred to in [26], while the total temperature is based on the mass average of the two streams.
The entropy increase of the turbine with a cavity obtained by using the work-averaged total pressure and the mass-averaged total temperature is defined as Equation (4):
Therefore, the loss caused by the purge flow can be expressed as Equation (5):
The change of entropy increase along the flow direction can reflect the loss characteristics, thus helping to determine the key location in the streamwise direction. Figure 6a shows the distribution of entropy increase along the axial direction of the 1.5-stage turbine due to the interference between the purge air and the main flow for IR = 1.5%. It can be seen that the purge flow increases the losses of the upstream stator, the downstream rotor, and the second-stage stator. The interference loss in the first-stage stator domain accounts for about 30% of the total loss of the 1.5-stage turbine.
The entropy increase along the streamwise direction for the first stator is shown in Figure 6b, and the cavity location is marked with a blue line (from 0.96 to 0.98). It can be seen that the loss slightly decreases from the stator inlet to the axial direction position of 0.90, but sharply decreases in the range of 0.9–0.93. Yangfan et al. [17] illustrated that the loss change was caused by the blocking of the sealed air on the upstream stator. It is called the blocking effect, and the corresponding loss reduction is called blocking loss in this paper. The loss significantly increases from the position of 0.93 to the interface of the rotor–stator, which is caused by the shear mixing of sealing air and main flow. It is called the shear effect, and the corresponding loss increase is called shear loss.
Based on the above analysis, it can be determined that the blocking effect mainly occurs upstream of the cavity, i.e., before the flow direction position of 0.93. The shear mixing mainly occurs from 0.93 to the stator–rotor interface. Therefore, the loss distribution spatial region in the stator channel can be represented by Figure 7 schematically. The volume where blocking and shearing take place is defined as . It should be noted that only the influence of sealing air on the main flow loss was considered in this paper, and variation loss caused by the interaction of main flow and secondary flow in the inner cavity was neglected.
It is suitable to establish the regions where blocking and mixing occur using the entropy increase. However, there would be a relatively large error in quantifying the loss as the total inlet pressure and temperature in Equation (4) while adopting the model assumption when processing. Furthermore, the entropy increase is an integral quantity. Therefore, it seems inconvenient to quantitatively describe the local loss. This paper introduces the dissipation coefficient to characterize local loss and quantify the regional loss [3]. The dissipation coefficient is dimensionless by the stator inlet parameter, and its definition is Equation (6):
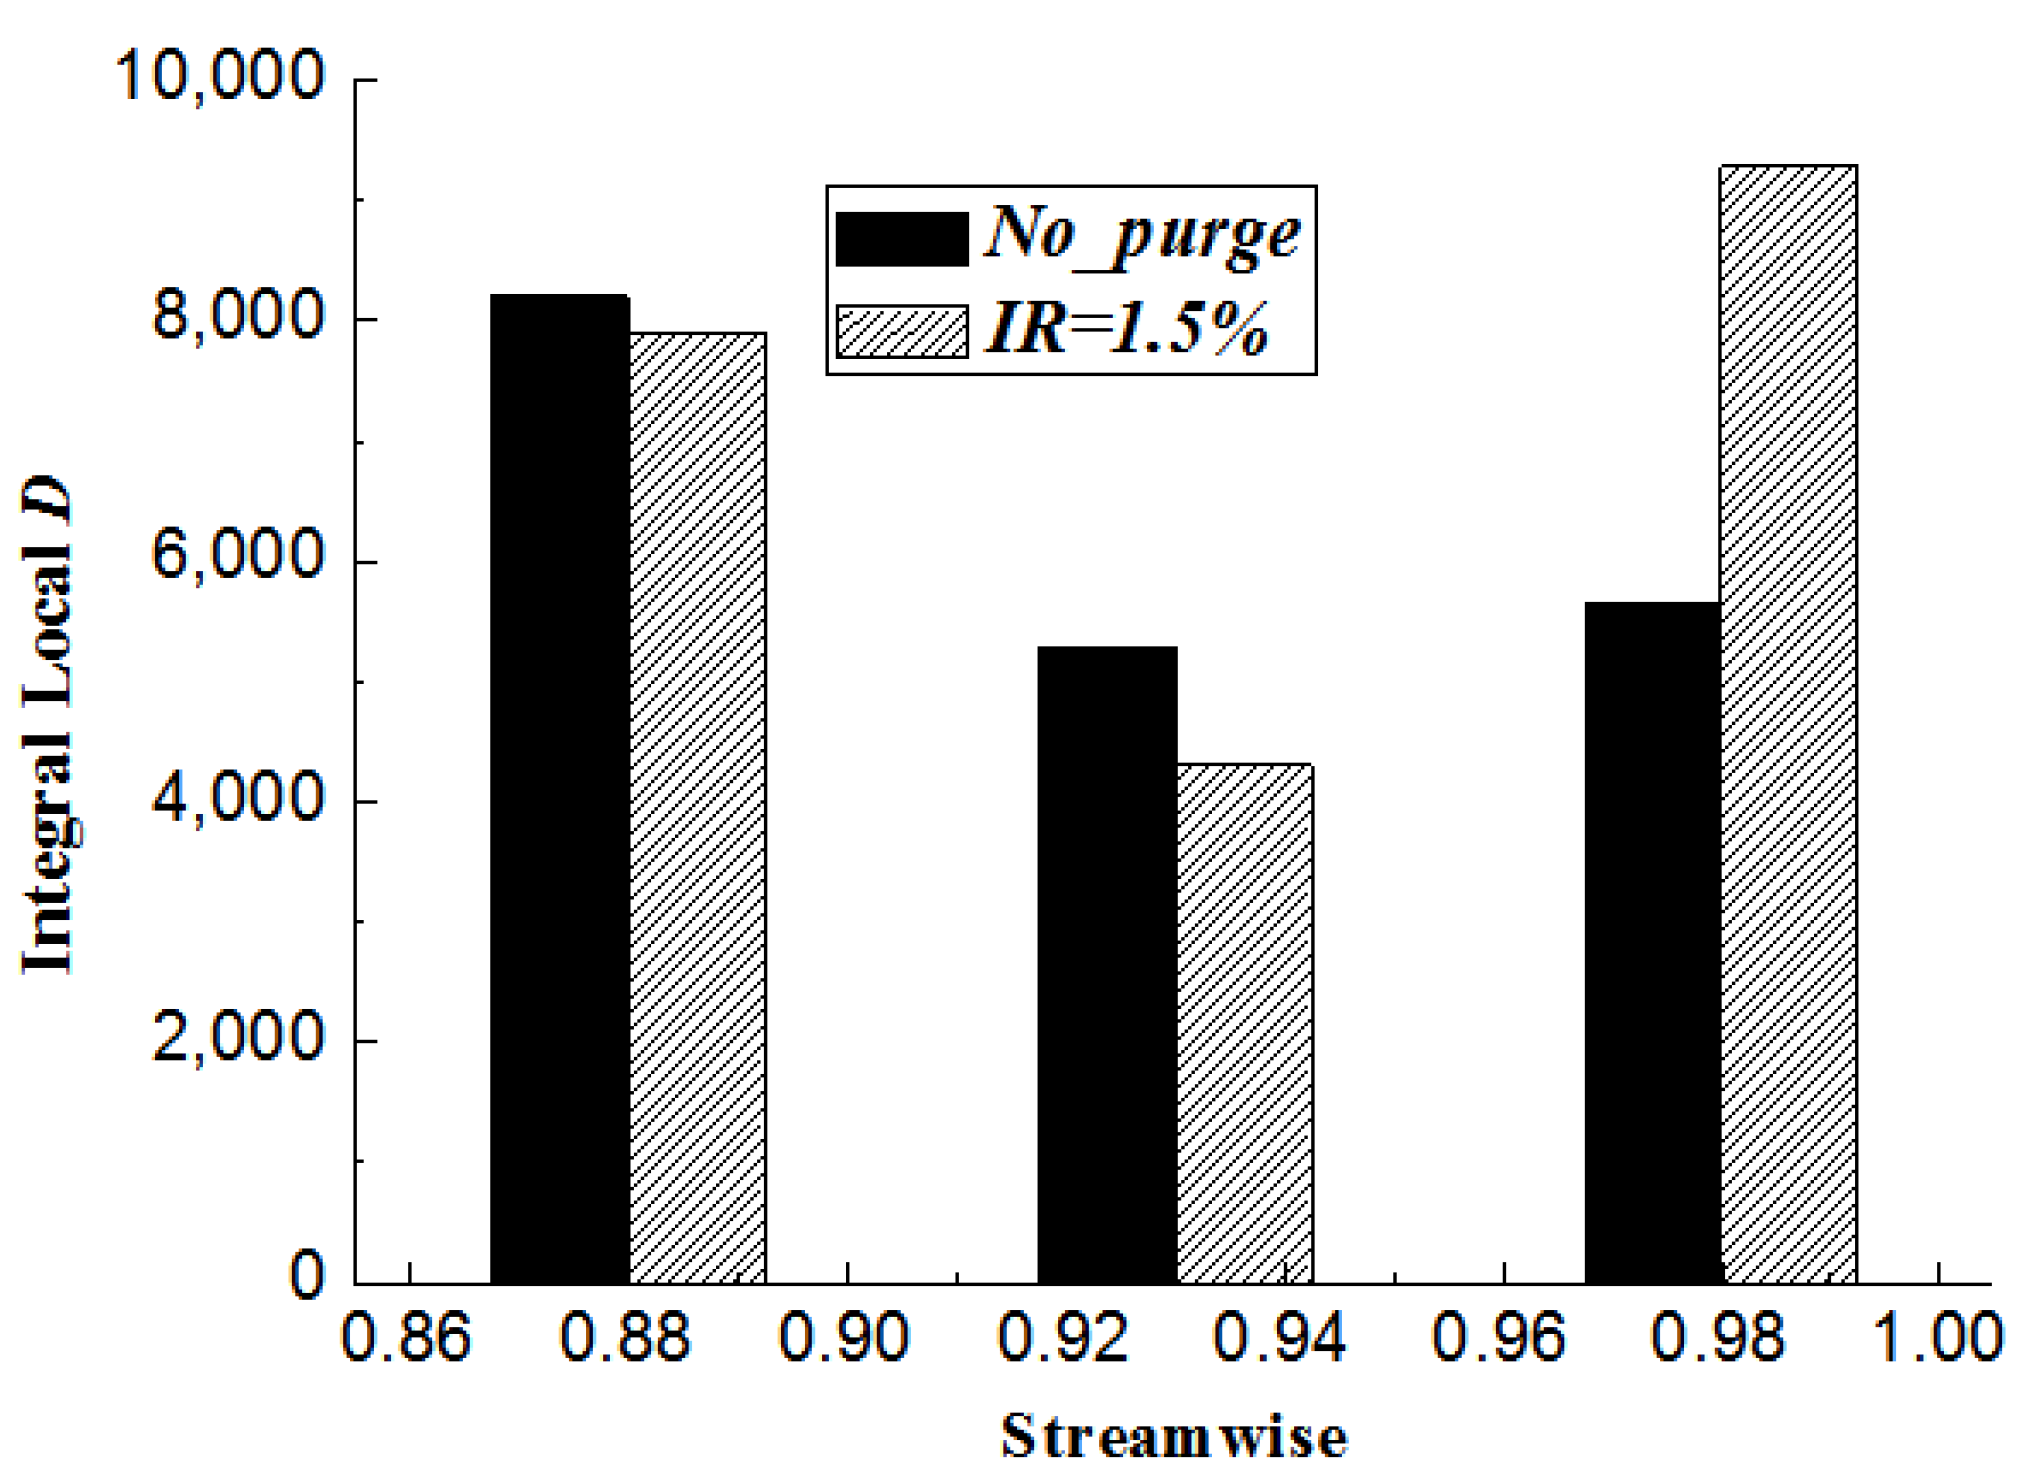
What needs to be further verified is that the dissipation coefficient and the entropic increase are consistent in describing the law of loss variation. Figure 8 shows the flow-based integral parameters of three axial sections (the streamwise position was 0.88, 0.93, and 0.98, respectively) with or without a cavity. The difference between the two represents the loss caused by sealing air at this axial position. It can be seen that the variation trend of the integral difference of dissipation coefficient along the flow direction is consistent with Figure 6b.
3.2. Blocking Effect
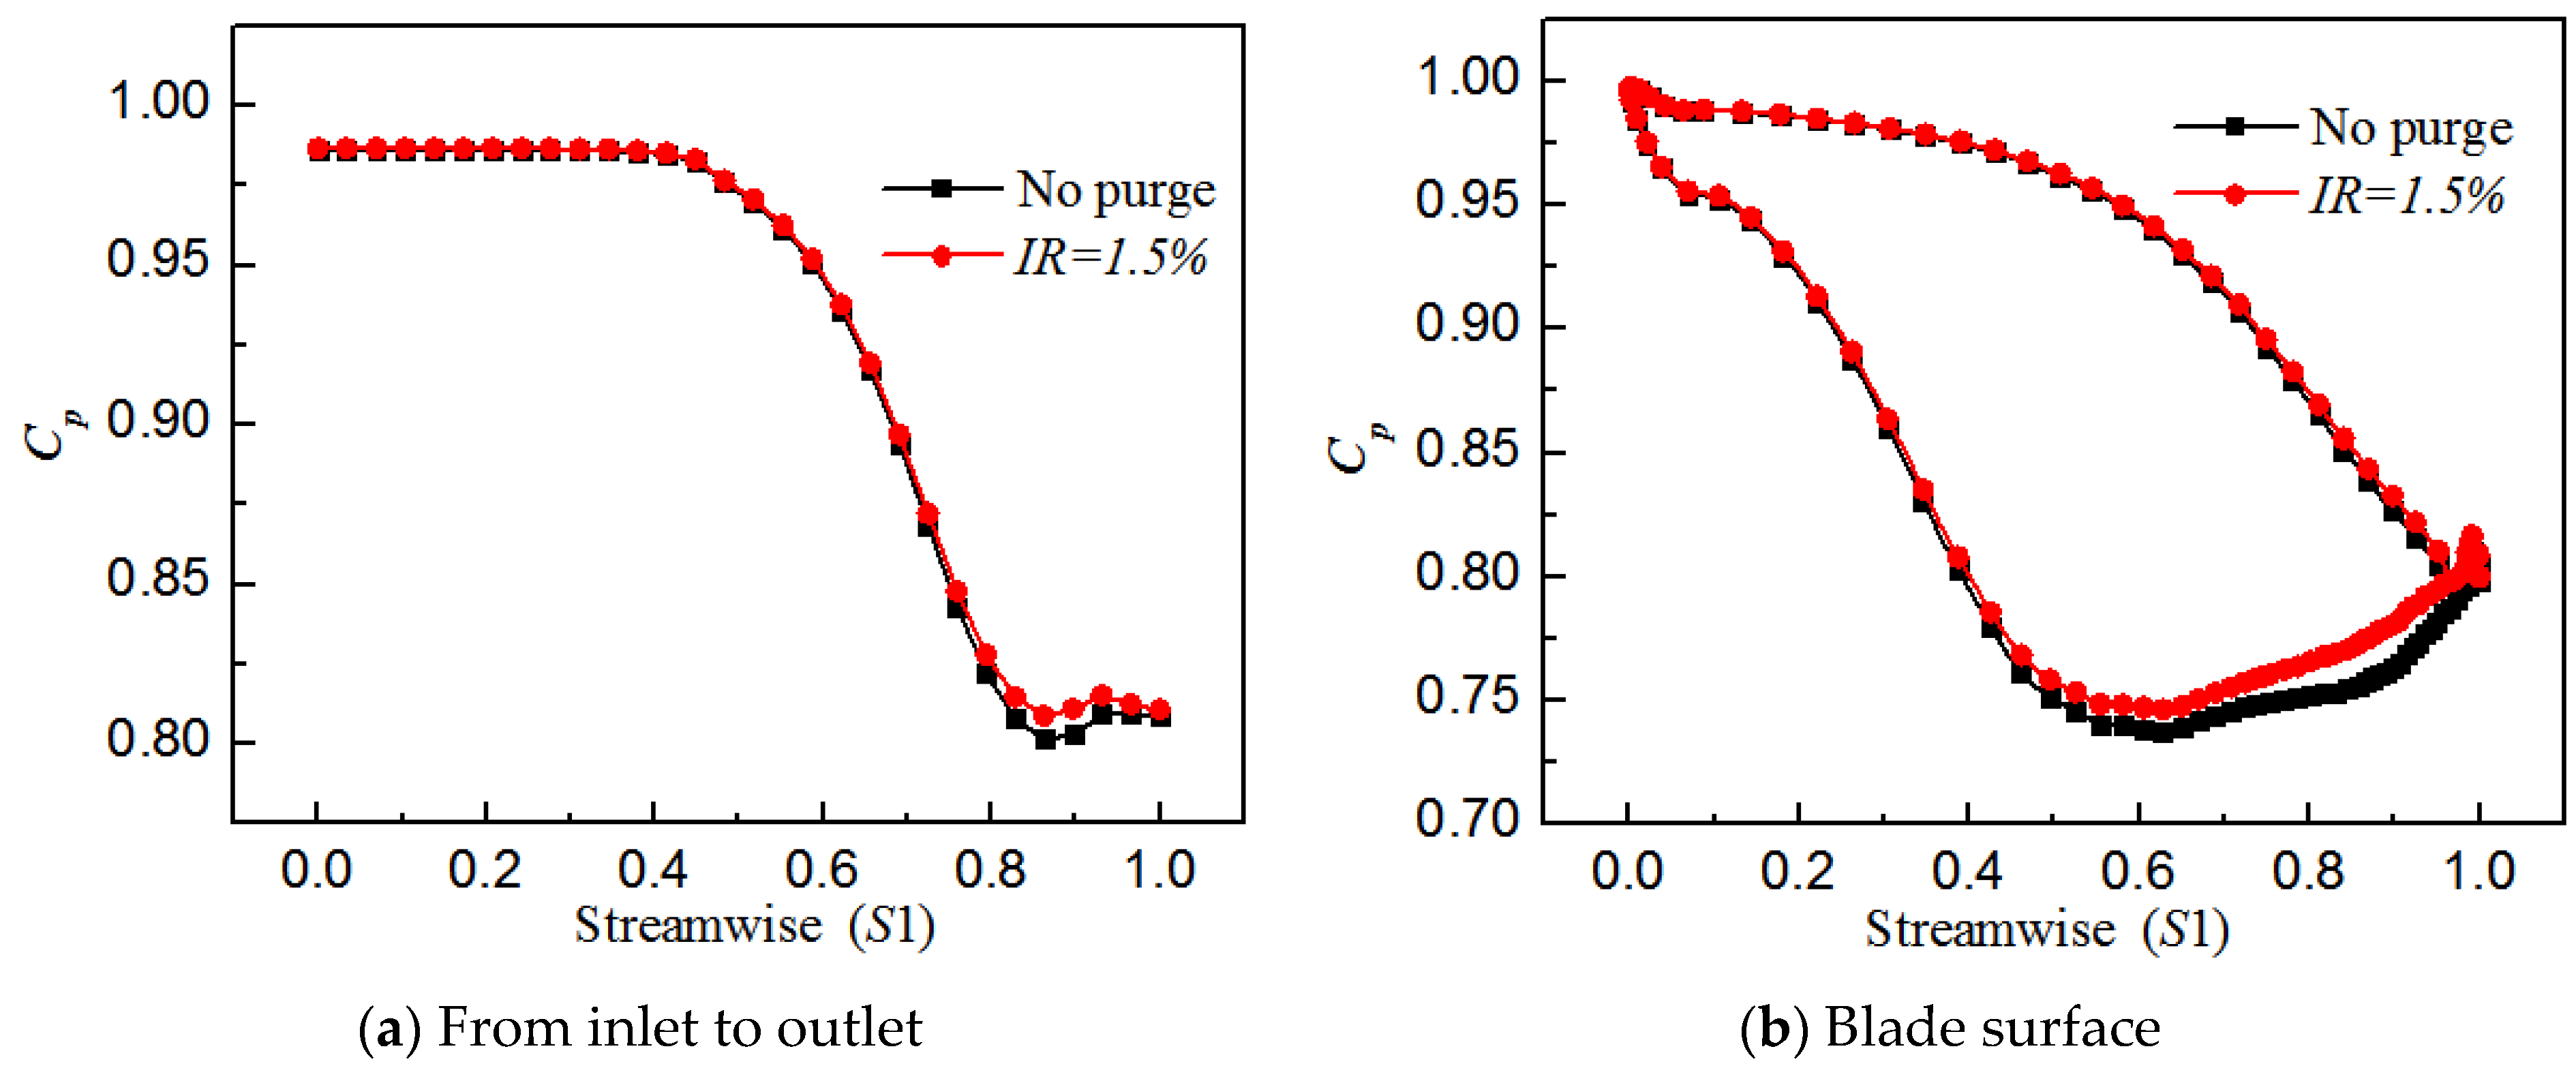
Figure 9a shows the pressure coefficient distribution from the inlet to the outlet of the stator region. The pressure coefficient distribution on the blade surface is also shown in Figure 9b. The pressure coefficient is defined as Equation (7):
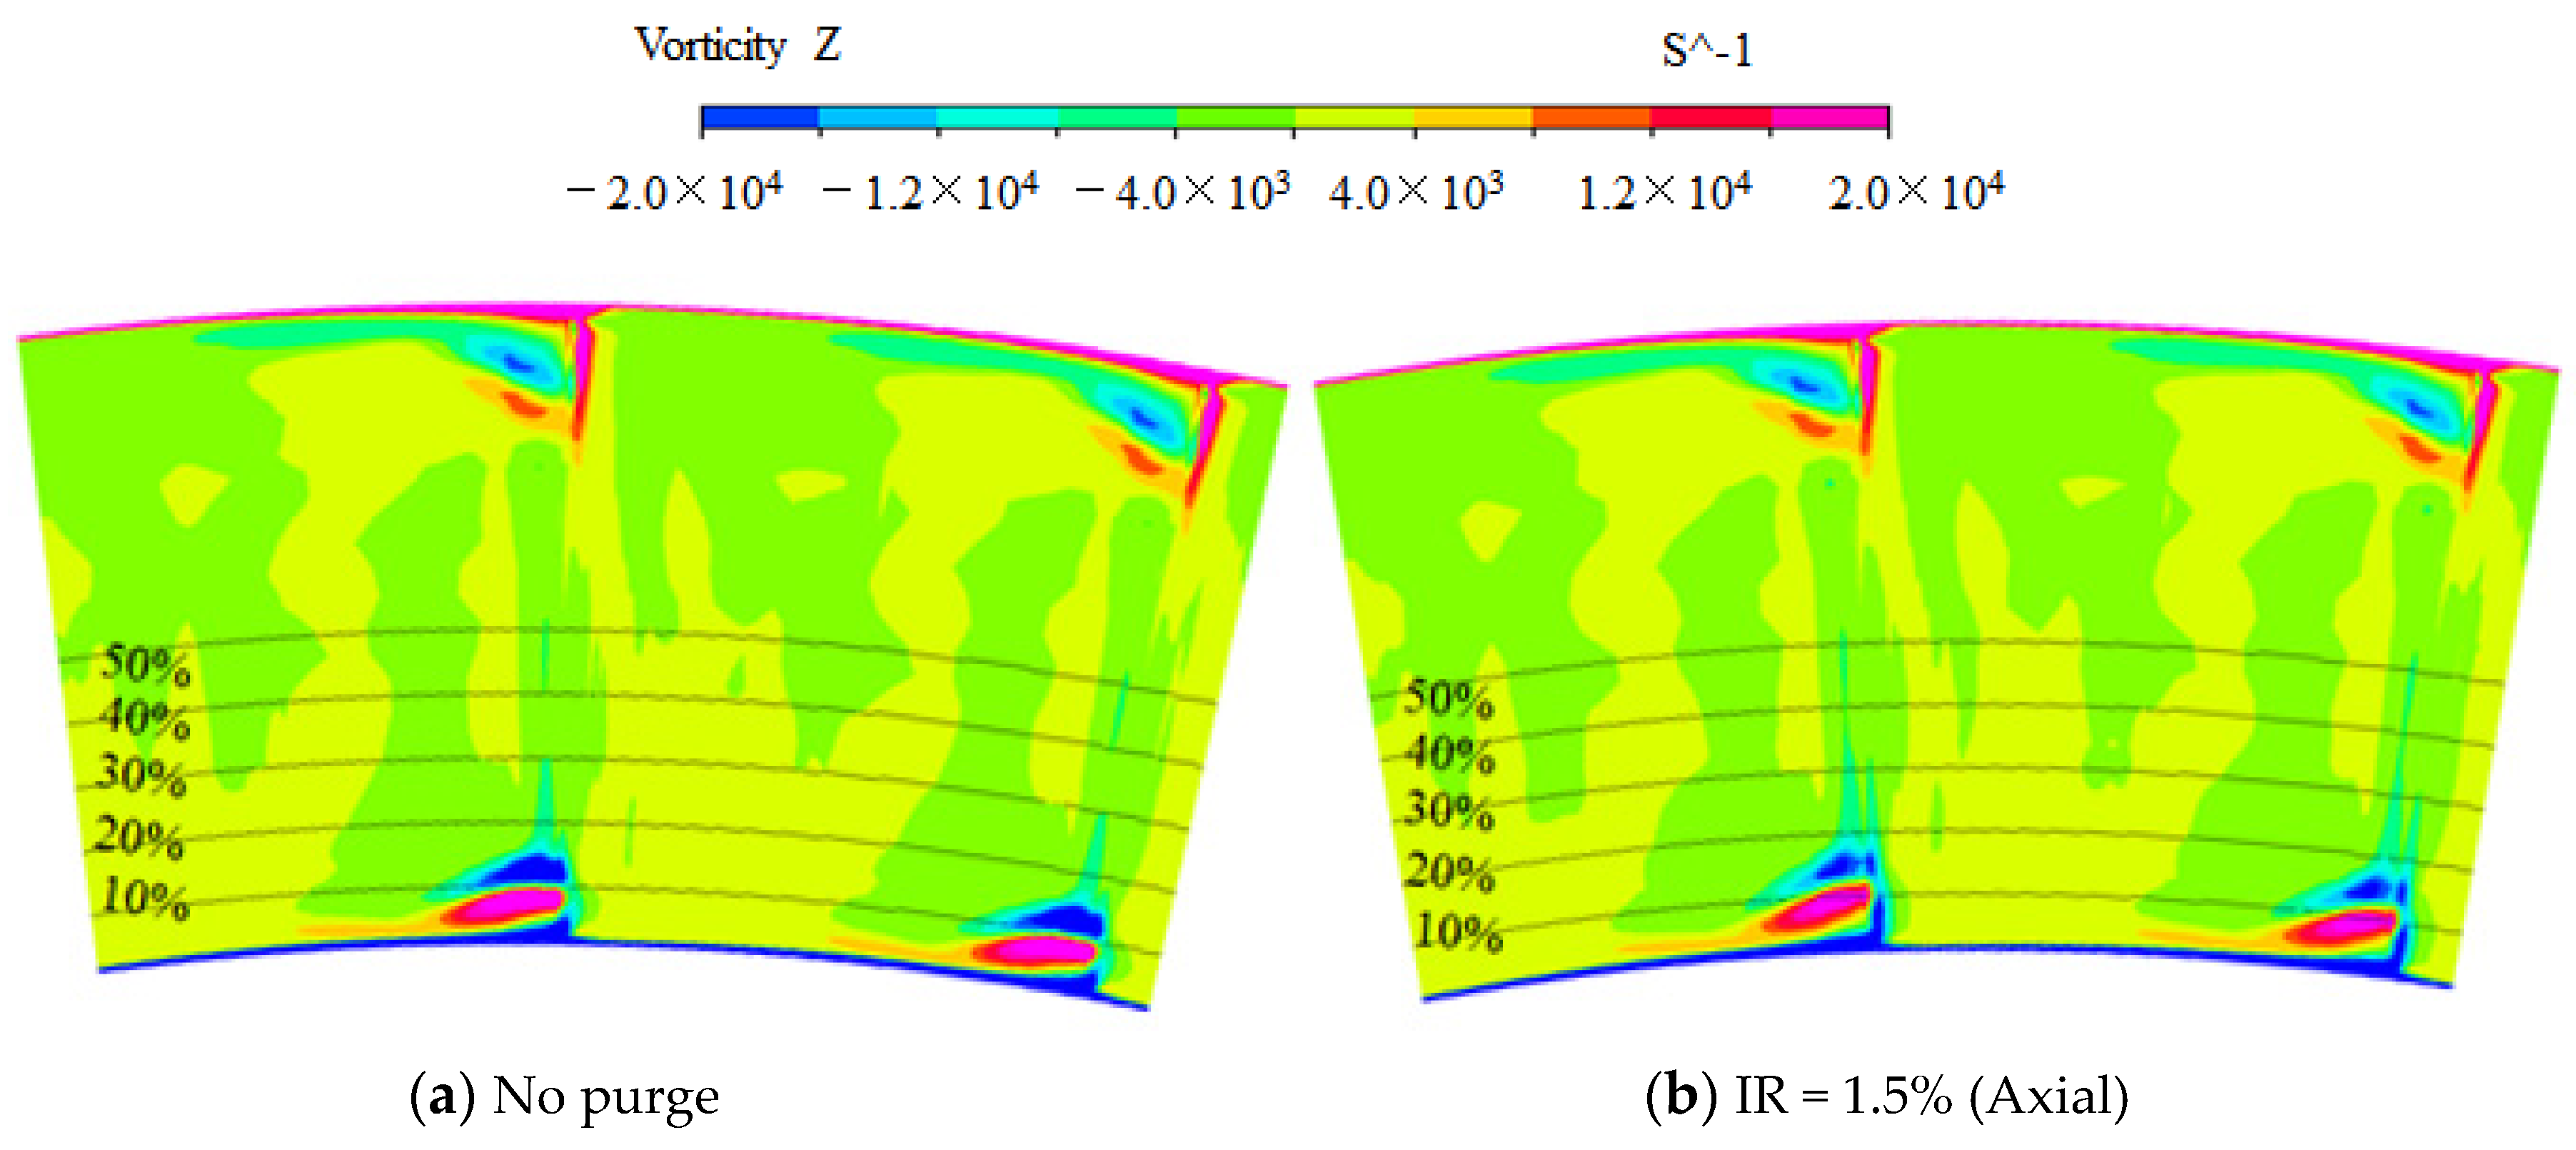
The blocking effect induced by the purge flow on the stator passage increases the pressure in the axial direction, especially upstream of the outlet of the cavity. The suction surface pressure coefficient increases remarkably after the maximum curvature of the suction surface of the blade, while the pressure surface side is almost unchanged. The change of the pressure gradient along the flow direction and tangential direction in the stator region will weaken the channel vortex and reshape the hub boundary layer. As a result, the position of the shedding vortex and the channel vortex lifted in the radial direction, and their size both reduced compared to the no purge flow situation, which is displayed in Figure 10. It should be responsible for the altered loss caused by the blocking effect. The cause and influence mechanism of the blocking effect this paper focuses on will be described in detail below.
Blocking loss, expressed as , should be a negative value from the weakened vortex in Figure 10 with the existence of the purge flow. The volume integral of the dissipation coefficient in the blocking area of the turbine stator with or without cavity is carried out separately, and the difference between the volume integral of the dissipation coefficient is defined as the blocking loss, defined as Equation (8):
Blocking losses under different sealing flow rates and sealing structures are shown in Table 3. The blocking effect increases and blocking loss decreases significantly with the increase in sealing flow rate. The blocking effect of the chute seal structure is more evident than that of other seal structures. Yangfan et al. believe that the radial velocity of purge flow is the main reason for blocking, but it seems unreasonable to explain the effect of seal structure on the blocking effect.
To further analyze the key parameters causing the blocking effect, the sealing efficiency is listed in Table 4, and the tangential velocity coefficient () distribution in the cavity is displayed in Figure 11.
The sealing efficiency is defined as Equation (9), where is the local tracer gas (CO2) concentration, is the mainstream inlet tracer gas concentration, and is the tracer gas concentration of the purge flow in the cavity inlet.
The tangential velocity coefficient is the ratio of tangential velocity to rotational speed of the rotor hub.
The radial velocity at the outlet of the cavity increases with the enlarged seal flow rate for the axial seal structure according to the flow conservation, which forms a blocking effect on the upstream flow field. Therefore, the blocking effect becomes significant with the increase in flow rate. The radial velocity is indeed one of the factors causing the blocking effect from this point of view. It should be noted that the radial velocity for the Chute structure should be reduced based on the above theory. Thus, the blocking effect weakens. However, the blocking effect becomes more remarkable with the inclination increase, illustrated by the lowered blocking loss in Table 3.
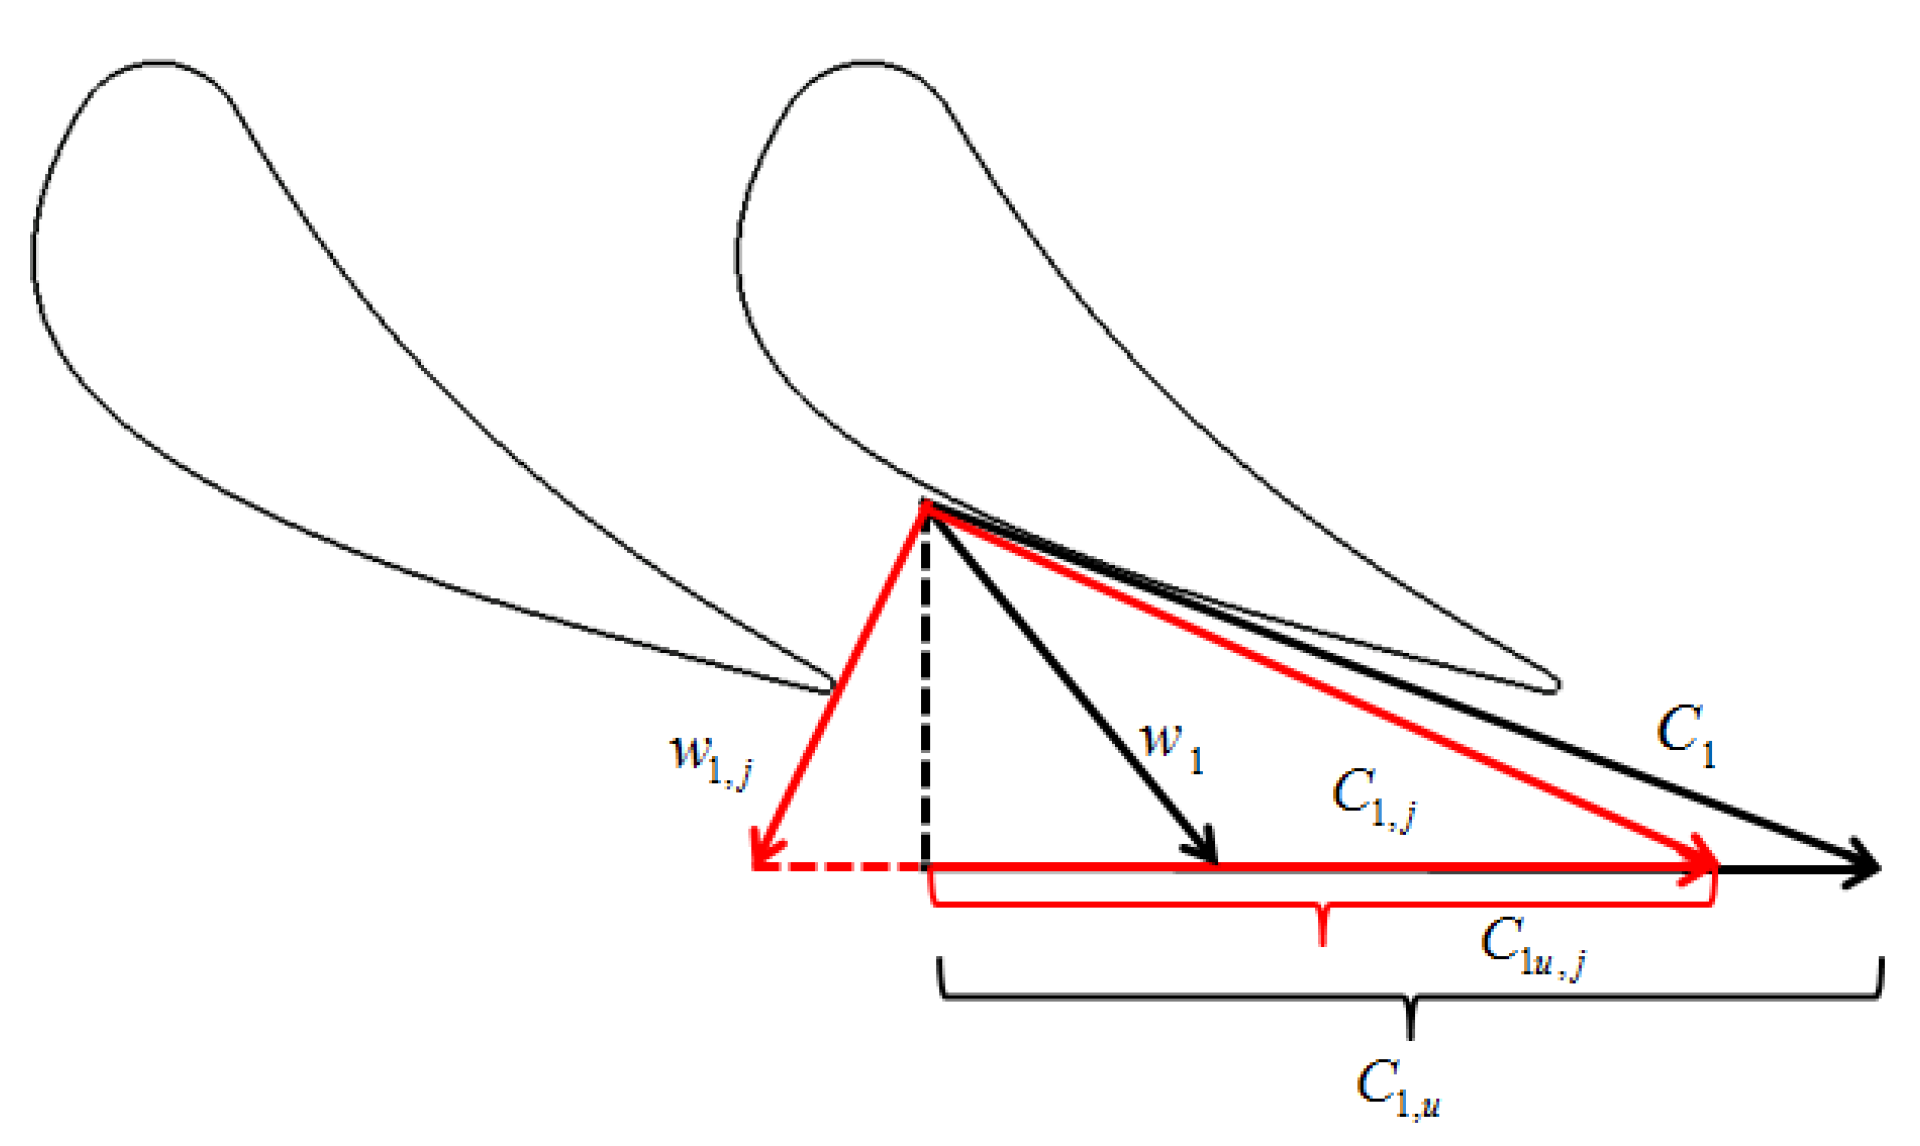
For exploring other factors affecting the blocking effect, the velocity triangle near the stator hub and downstream of the cavity is shown in Figure 12. Chilla et al. [27] pointed out that the tangential velocity difference between the main flow and the sealed flow at the cavity gap can reach 1.25 times the rim speed. That means the lower tangential velocity in the exit of the cavity promotes the decrease of the mainstream tangential velocity from C1u to C1u,j in the velocity triangle. As a result, the effective flow area of the airflow decreases with the reduced turning angle of the airflow, thus helping to create a blocking effect on the stator passage. In other words, tangential velocity also affects the blocking effect. Next, the influencing factors of tangential velocity need to be found to reveal the blocking mechanism.
As shown in Figure 11a, tangential velocity enlarged with the reduced sealing flow. Yang Fan et al. [18] believe that this is due to the increasing acceleration time of the rotating disc to the fluid in the cavity for the lower purge flow. What needs more attention is that the gas ingested from the mainstream will accelerate the tangential velocity of the sealed air, which can be verified by the variety in the tangential velocity of different seal structures. The tangential velocity should increase as the acceleration time increases for Chue_30 compared to Axial or Chute_60 at the same seal flow rate. However, the tangential velocity decreases from Figure 11b. Consequently, the main factor influencing the change of tangential velocity for the different seal strucuture is gas ingestion rather than disk acceleration time.
The blocking effect for chute seal structure is more vital than axial seal and becomes remarkable with the increased inclination. The lower tangential velocity caused by the weakened gas intrusion is responsible for the above situation. Compared to the axial sealing structure, the radial sealing structure has relatively higher sealing efficiency due to the damping effect of internal teeth on gas intrusion. Its blocking effect is between Axial and Chute_60. In addition, the gas ingested is also weakened with the increase of sealing flow, thus sealing efficiency increases and tangential velocity is reduced, which is another reason for the increasing blocking effect besides the higher radial velocity. In conclusion, blocking effect is negatively related to sealing efficiency.
The existing research and the velocity triangle in Figure 12 in this paper show that the blocking effect will not only affect the stator loss but also cause a negative angle of attack at the inlet of the downstream rotor, which leads to a significant secondary loss. Therefore, alleviating the upstream blocking effect has a positive effect in general.
3.3. Viscous Shear Effect
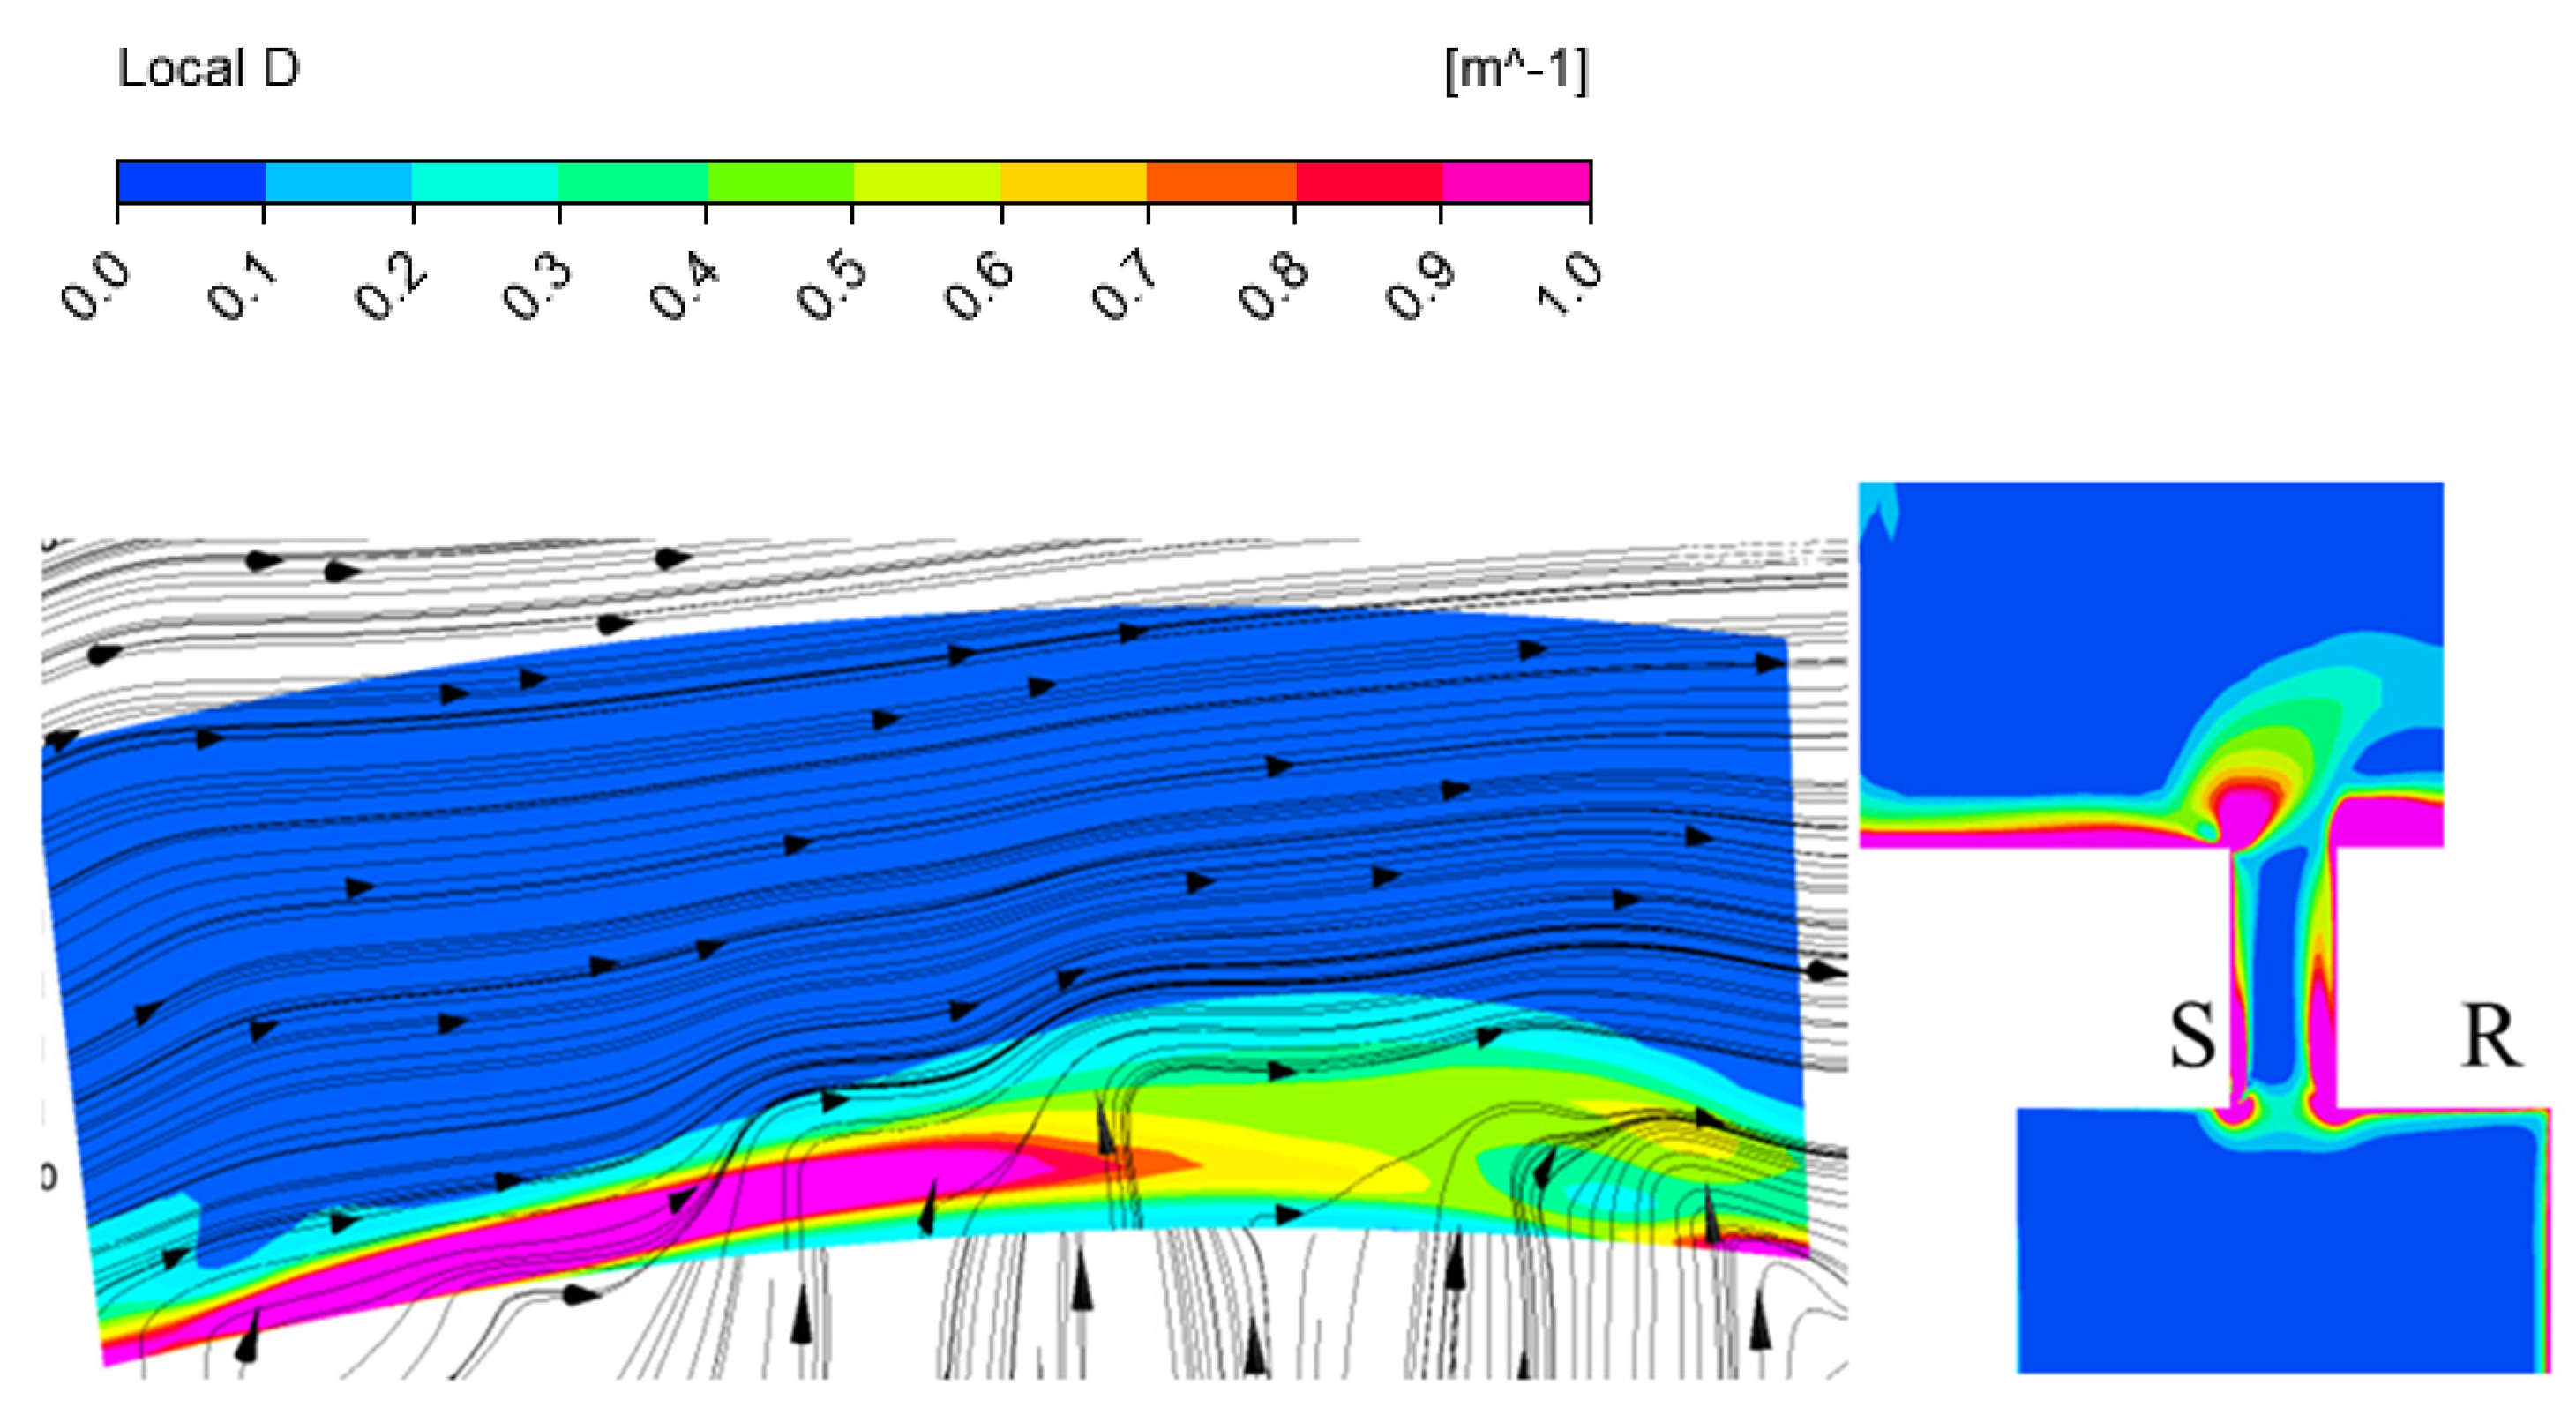
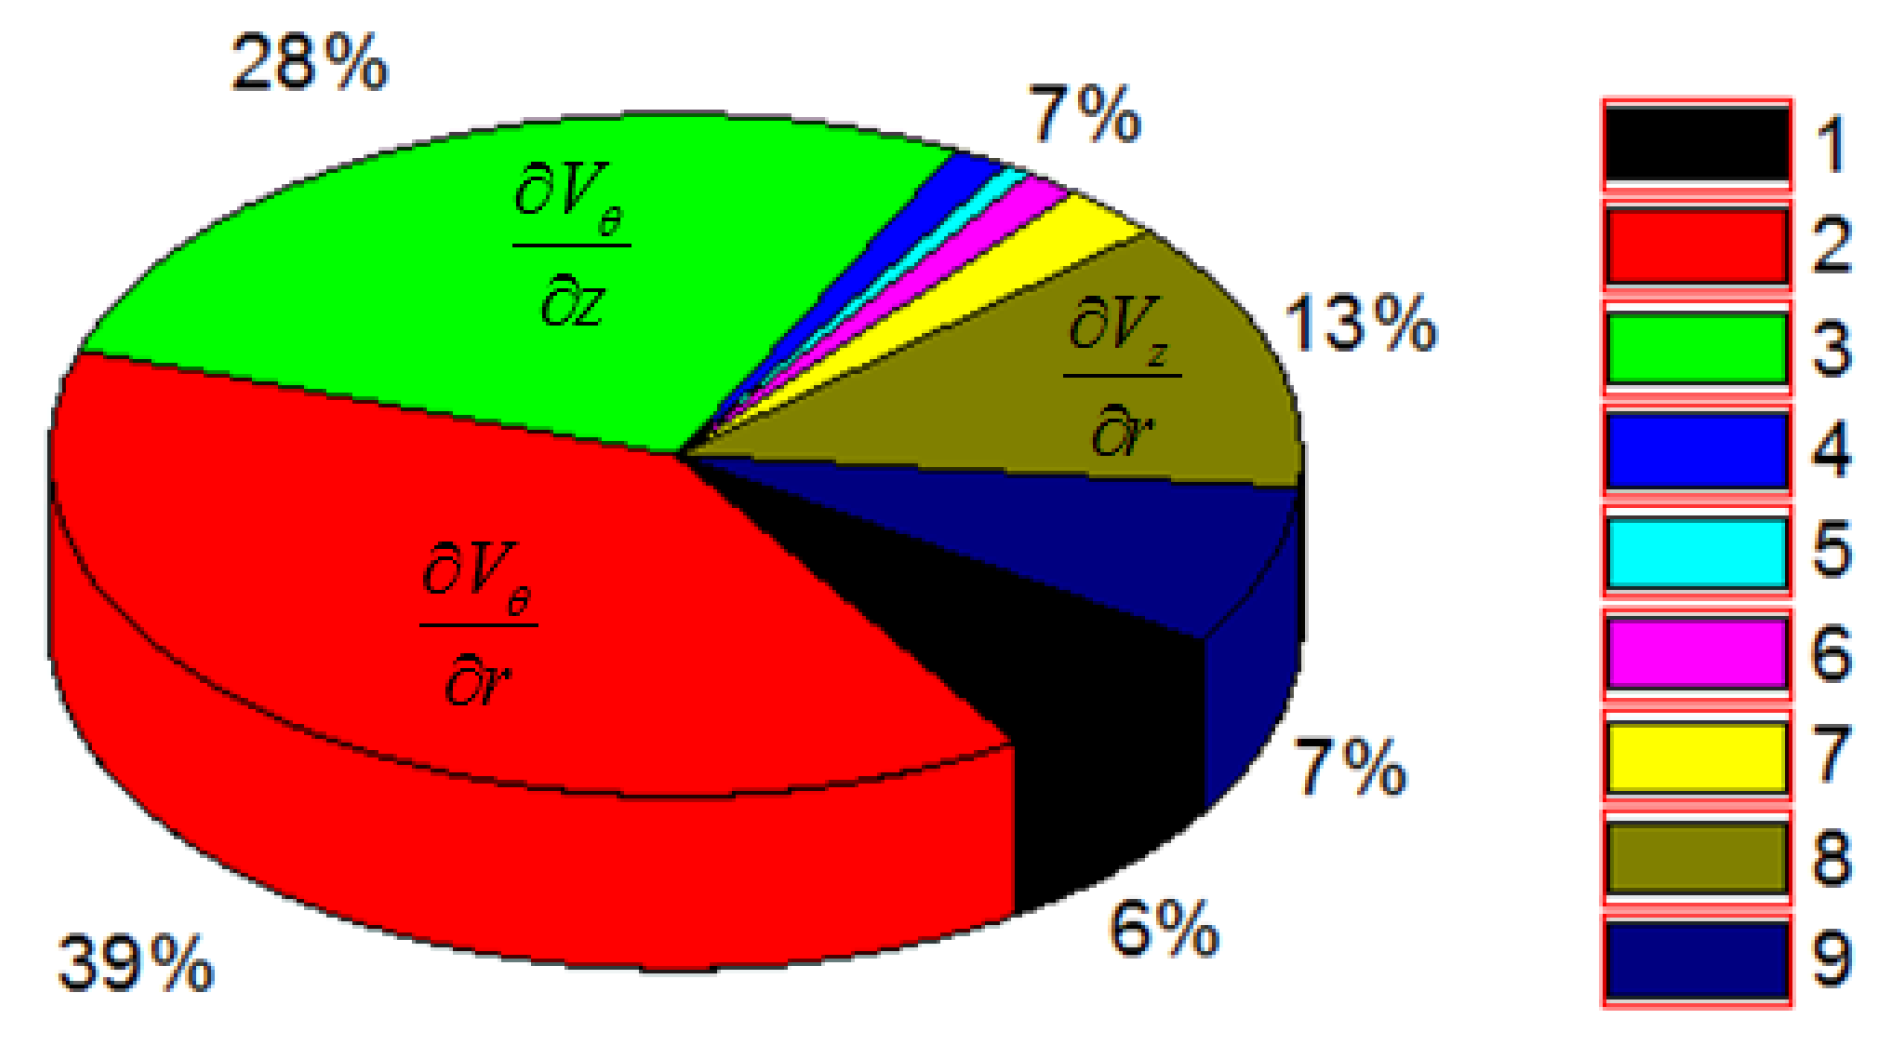
The time average dissipation coefficient and streamline diagram of the outlet section of the cavity for IR = 1.5% are displayed in Figure 13. A large shear region is formed near the hub due to the viscous shear of the main flow and the sealing flow. The dissipation coefficient is prominent in the shear region, and the local loss is enormous. According to the viscous shear theory, the velocity gradient is responsible for the viscous shear. To clarify the main velocity gradients affecting the viscous shear of the main flow and the sealed air, the velocity gradients of the above outlet sections are integrated based on the mass flow. The proportion of each velocity gradient is shown in Figure 14.The tangential velocity gradient along the radial direction , the tangential velocity gradient along the axial direction , and the axial velocity gradient along the radial direction account for 80% of the total. These three velocity gradients are the leading causes of viscous shear loss, which is consistent with the conclusion of Yang Fan et al. [18]
It is still necessary to quantify the shear loss, similar to the blocking effect above. Yang Fan et al. [18] used the control volume to quantify the shear loss. This method needs to select the inlet section of the secondary flow and the main flow. Actually, the location of the inlet section will significantly impact the results because the complex interaction between purge flow and main flow makes the parameters in the gap more sensitive to the location, especially at the lower sealing flow rate. In addition, the model is mainly based on three main velocity gradients when quantifying the loss. In this paper, the difference between the volume integral of the dissipation coefficient of the turbine with or without a cavity in the mixing region (), as shown in Figure 7, is the shear mixing loss, which is defined as Equation (10):
Table 5 shows the viscous shear loss under different sealing flows and sealing structures. The shear loss increases sharply with the enlarged sealing flow. The chute sealing structure is greater than that of the axial sealing structure, and the radial sealing structure is between the two for the constant sealing flow.
To further reveal the mechanism of viscous shear loss, the velocity gradient is carefully analyzed from the interaction of sealing air and the gas in the annular. The integral of each velocity gradient with different flow rates are shown in Table 6.
The proportion of the main three gradients in the total gradient increases, from 70% to nearly 80%, with the increase of the IR from 0% to 1.5%. That is to say, it is much more accurate to use the model proposed by Wilcolx et al. [28] to evaluate the loss based on the control volume considering the main velocity difference for the high sealing flow.
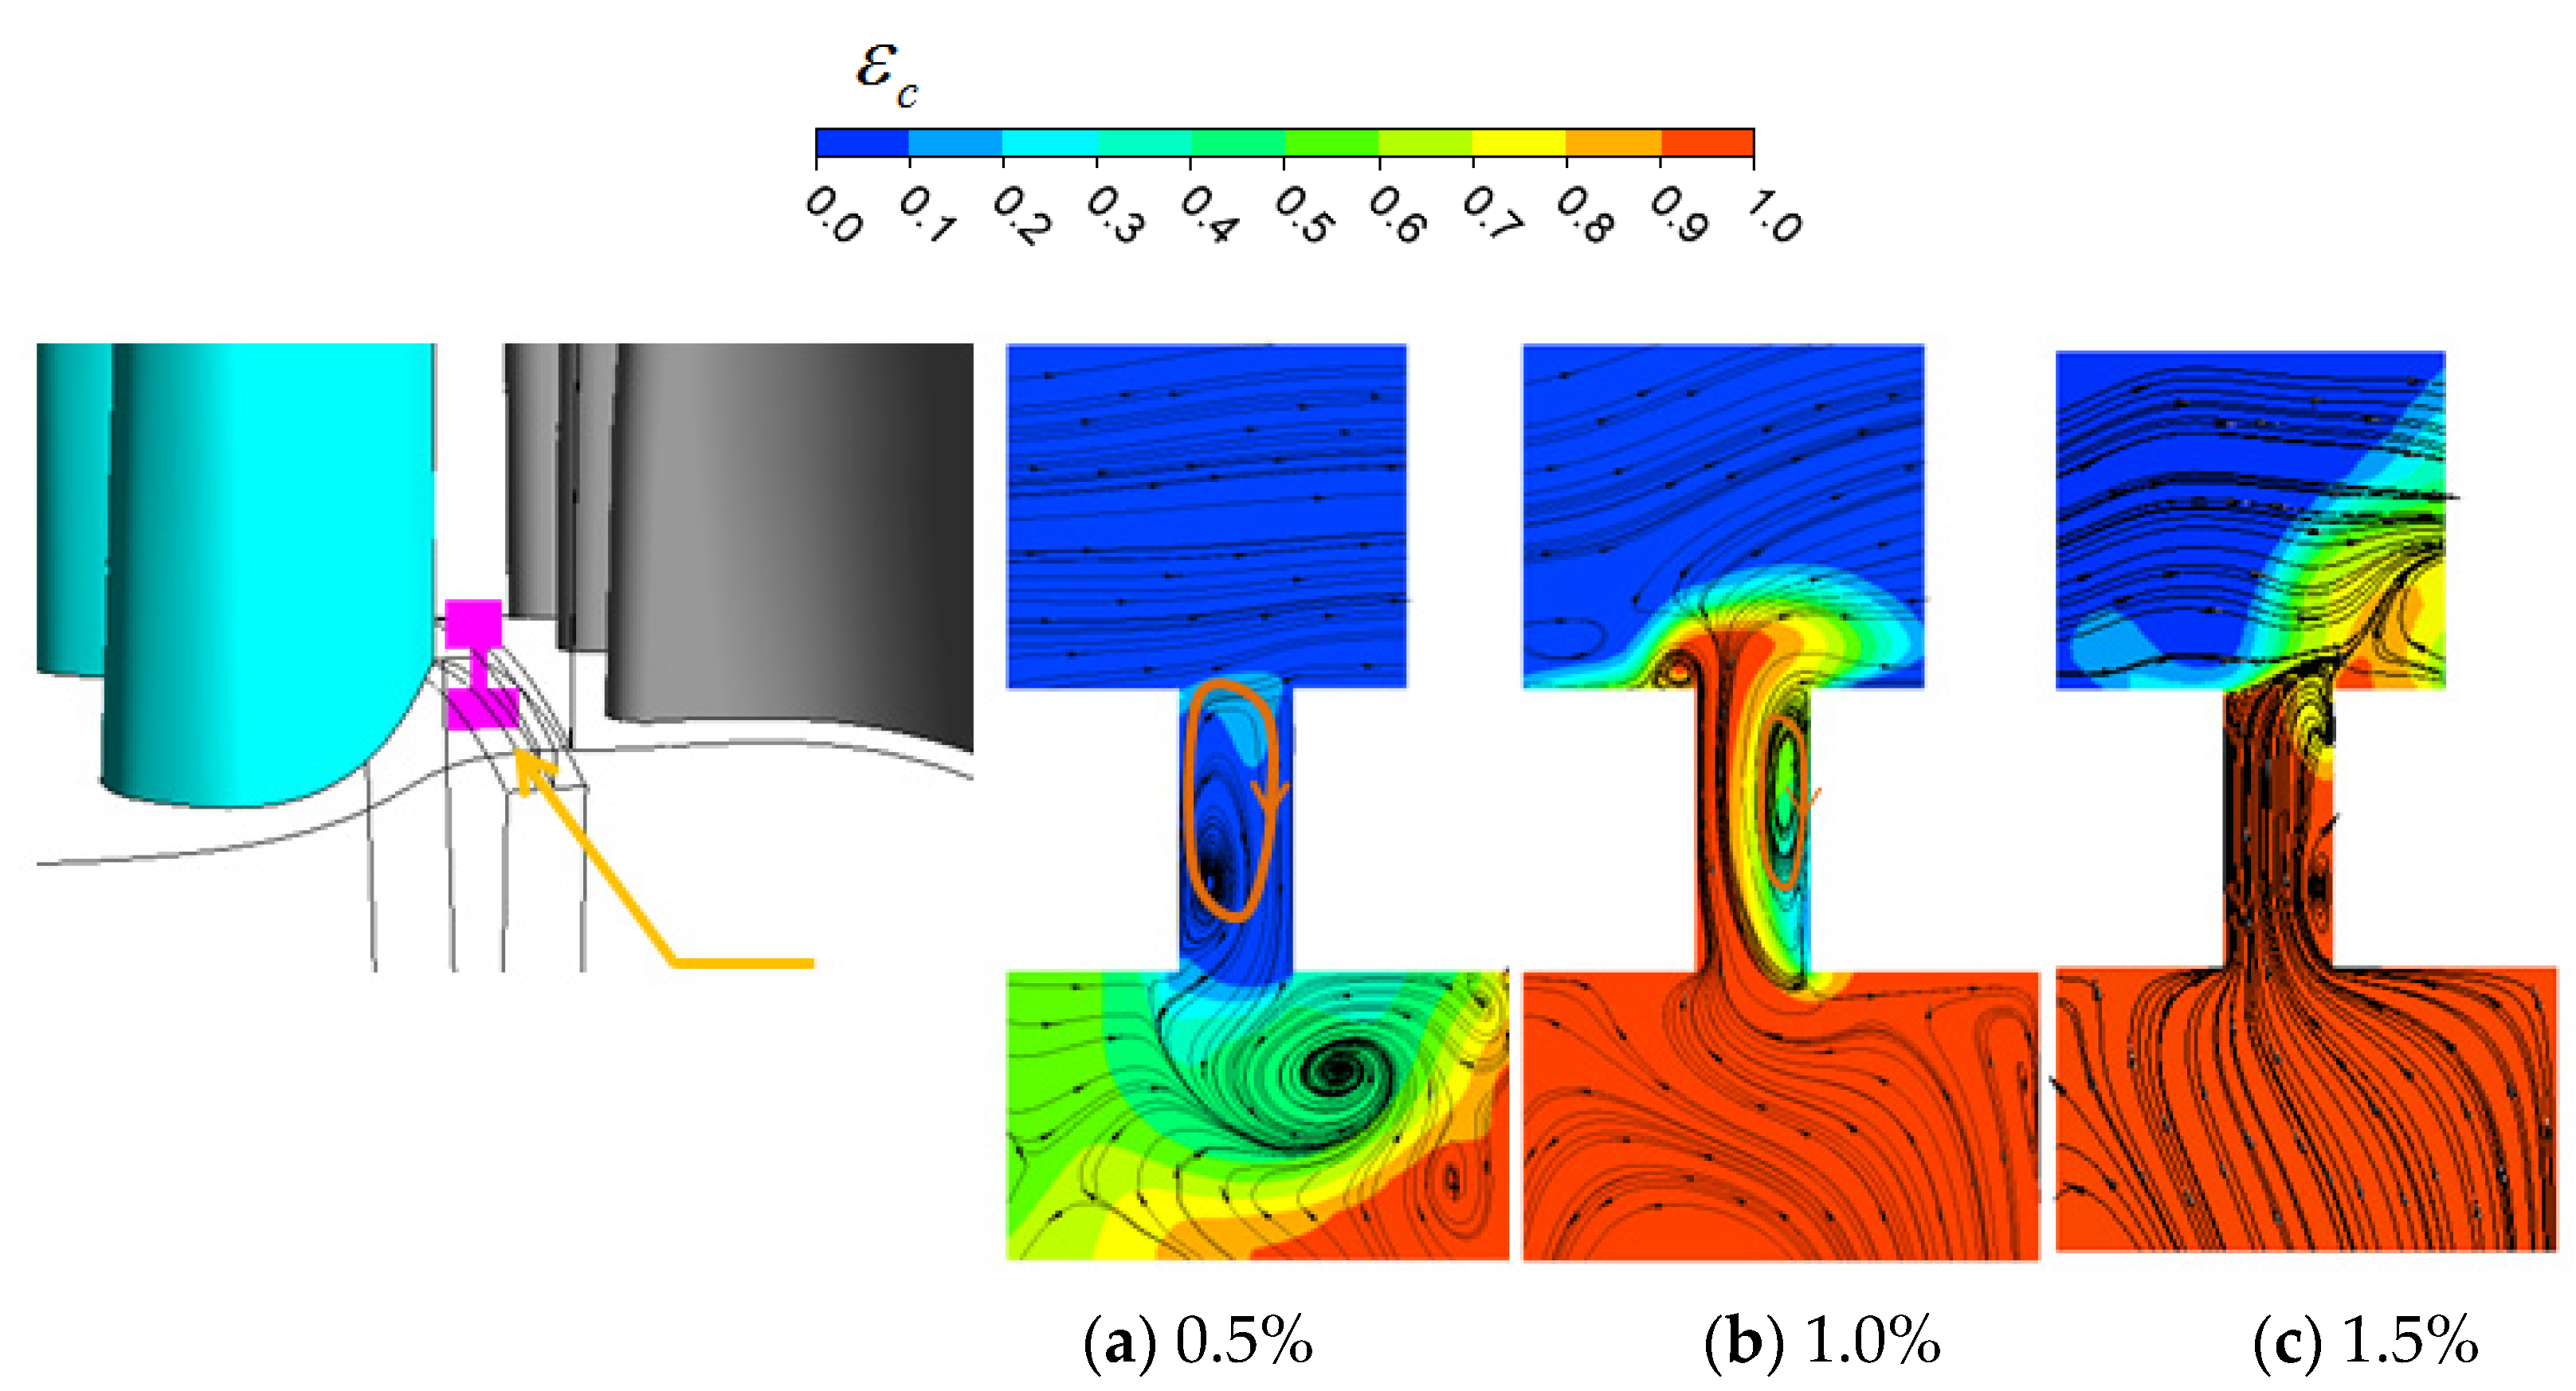
The tangential velocity gradients and increased, and the proportion of the two enlarged from 39.1% to 66.5%, with the sealing flow increasing from 0% to 1.5%.To explain this phenomenon, the sealing efficiency contour and streamline are given in Figure 15. Based on the previous research work on gas ingestion, a rim seal vortex would form because of the interaction of the ingested gas from the rotating side of the cavity and the purge flow, and rotation direction was shown by a red arrow. The vortex area increases as the sealing flow rate decreases. The tangential acceleration effect on the purge flow becomes stronger with severe gas ingestion when the sealing rate is lower, such as IR = 0.5%. This is the reason for the decreased value as the sealing flow rate is reduced. Meanwhile, the rotating action of the rim seal vortex structure with high strength at low sealing flow rate speeds up the migration of the gas from the rotor wall side to the stationary side of the cavity, which will help to reduce the .
In addition, the axial flow, which is opposite to the main flow, would form at the upper section of the gap as the rim seal vortex made the ingested gas flow from the rotor side to the stationary side in the upper rim clearance. It is the reason for the enlarged gradient with the lower sealing flow.
In conclusion, the interaction between gas and sealing flow near the outlet of the cavity is the main reason for the change in velocity gradient. The interference between gas and sealing air near the gap outlet diminishes with the increasing sealing efficiency, and the proportion of tangential velocity gradient gradually dominates. That is to say, the tangential velocity gradient plays a leading role in the viscous shear loss in the higher sealing efficiency situation.
The sum of the three gradients is almost the same as in Table 7, under the same sealing flow rate even with the different sealing structures. However, the chute sealing structure has a large tangential velocity gradient, especially for Chute_30; the tangential velocity gradient ratio reached 69.5%, while the axial and radial sealing structures were 65% and 59.9%, respectively. This is related to the higher sealing efficiency; of course, this weakens gas ingestion for the chute sealing structure at this flow rate. Combined with the sealing efficiency in Table 4, it can be concluded that the tangential velocity gradient is positively correlated with the sealing efficiency; therefore, the shear loss is related to sealing flow and sealing structure. According to the above research, it can be concluded that increasing the tangential velocity is of great significance for alleviating the upstream blocking effect and reducing the shear loss.
4. Conclusions
In this paper, the blocking and shear loss of different sealing structures are quantified based on the dissipation coefficient integral. The generation mechanism and influence factors of the loss are revealed from the gas ingestion and its interaction with sealing air. The main conclusions are as follows:
- (1)
- The blocking effect of the purge flow on the upstream and the shear effect between the purge flow and the mainstream are responsible for the change of the stator loss. Both are sensitive to the sealing flow rate and sealing structure.
- (2)
- The blocking effect is mainly affected by the radial and the tangential velocity at the exit of the cavity. The blocking effect is positively correlated with sealing efficiency. Thus, it is most apparent for the Chute_30 structure with a sealing efficiency of 99.9%. The tangential velocity, which is affected by gas ingestion, is the main factor in determining the blocking effect under the same sealing flow rate.
- (3)
- The shear mixing loss is mainly affected by the tangential velocity gradient along the radial and the axial direction, and the axial velocity gradient along the radial. The rim shear vortex formed by the gas intrusion at the rim gap reduces the tangential velocity gradient and increases the axial velocity gradient for the gas transport from the rotor side to the stator side. With the increase in sealing efficiency, the proportion of tangential velocity gradient increases obviously, which accounts for 66.5% of the axial sealing structure with IR = 1.5, and 69.5% for the Chute_30 sealing structure with IR = 1.0%. The tangential velocity gradient becomes the dominant factor of shear loss for the higher sealing efficiency situation. Thus, using the mixing shear model Sharon and Wilcox et al. proposed may be more accurate to evaluate the shear loss for the high sealing efficiency situation. In addition, the influence of the axial velocity gradient on the shear loss needs to be considered when the sealing efficiency is relatively low.
- (4)
- Increasing the tangential velocity is an effective way to reduce the upstream blocking effect and shear loss. Although the blocking effect reduces the upstream stator loss, it is still significant to alleviate the blockage effect from the perspective of the turbine as a whole because the blockage will affect the upstream and downstream flow fields simultaneously.
Author Contributions
Conceptualization, Writing—Original Draft, Writing—Review and Editing, Data Curation, Methodology T.B.; Software, Supervision Q.Y.; Validation, Visualization, J.L. All authors have read and agreed to the published version of the manuscript.
Funding
This research received no external funding.
Data Availability Statement
Not applicable.
Conflicts of Interest
The authors declare no conflict of interest.
References
- Schuepbach, P.; Abhari, R.S.; Rose, M.G.; Germain, T.; Raab, I.; Gier, J. Effects of suction and injection purge-flow on the secondary flow structures of a high-work turbine. J. Turbomach 2010, 132, 021021. [Google Scholar] [CrossRef]
- Reid, K.; Denton, J.; Pullan, G.; Curtis, E.; Longley, J. The Effect of Stator-Rotor Hub Sealing Flow on the Mainstream Aerodynamics of a Turbine. In Proceedings of the ASME 51st Turbo Expo, Part A, Barcelona, Spain, 6–11 May 2006; Volume 6, pp. 789–798. [Google Scholar]
- Zlatinov, M.B.; Tan, V.S.; Montgomery, M.; Islam, T.; Harris, M. Turbine Hub and Shroud Sealing Flow Loss Mechanisms. J. Turbomach. 2012, 134, 061027. [Google Scholar] [CrossRef]
- Jia, W.; Liu, H. Numerical investigation of the interaction between upstream purge flow and mainstream in a highly-loaded turbine. In Proceedings of the ASME Turbo Expo 2014: Turbine Technical Conference and Exposition GT2014, Düsseldorf, Germany, 16–20 June 2014. ASME Paper GT2014-25501:1-15. [Google Scholar]
- Gallier, K.D.; Lawless, P.B.; Fletter, S. Development of the unsteady flow on a turbine rotor platform downstream of a rim seal. In Proceedings of the ASME Turbo Expo 2004,Power for Land, Sea, and Air, Vienna, Austria, 14–17 June 2004; ASME Paper GT2004-53899. 2004. [Google Scholar]
- Paniagua, G.; Denos, R.; Almeida, S. Effect of the Hub Endwall Cavity Flow on the Flow Field of a Transonic High-Pressure Turbine. J. Turbomach. 2004, 126, 578–586. [Google Scholar] [CrossRef]
- Rehder, H.J.; Dannhauer, A. Experimental Investigation of Turbine Leakage Flows on the Three-Dimensional Flow Field and Endwall Heat Transfer. J. Turbomach. 2007, 129, 608–618. [Google Scholar] [CrossRef]
- Schuepbach, P.; Abhari, R.S.; Rose, M.G.; Gier, J. Influence of Rim Seal Purge Flow on the Performance of an Endwall-Profiled Axial Turbine. ASME J. Turbomach. 2011, 133, 021011. [Google Scholar] [CrossRef]
- Ong, J.H.P.; Miller, R.J.; Uchida, S. The Effect of Coolant Injection on the Endwall Flow of a High Pressure Turbine. ASME J. Turbomach. 2012, 134, 051003. [Google Scholar] [CrossRef]
- Regina, K.; Kalfas, A.L.; Abhari, R.S. Experiment investigation of purge flow effects on a high pressure turbine stage. J. Turbomach. 2015, 137, 041006. [Google Scholar] [CrossRef]
- McLean, C.; Camci, C.; Glezer, B. Mainstream Aerodynamic Effects Due to Wheelspace Coolant Injection in a High Pressure Turbine Stage: Part I—Aerodynamic Measurements in the Stationary Frame. ASME J. Turbomach. 2001, 123, 697–703. [Google Scholar] [CrossRef]
- McLean, C.; Camci, C.; Glezer, B. Mainstream Aerodynamic Effects Due to Wheelspace Coolant Injection in a High Pressure Turbine Stage: Part II—Aerodynamic Measurements in the Rotational Frame. ASME J. Turbomach. 2001, 123, 687–696. [Google Scholar] [CrossRef]
- Carvalho Figueiredo, A.J.; Schreiner, B.D.J.; Mesny, A.W.; Pountney, O.J.; Scobie, J.A.; Li, Y.S.; Cleaver, D.J.; Sangan, C.M. Volumetric Velocimetry Measurement of Purge-Mainstream Interaction in a one-Stage Turbine. J. Turbomach. 2021, 143, 041011. [Google Scholar] [CrossRef]
- Mesny, A.W.; Glozier, M.A.; Pountney, O.J.; Scobie, J.A.; Li, Y.S.; Cleaver, D.J.; Sangan, C.M. Vortex Tracking of Purge-Mainstream Interactions in a Rotating Turbine Stage. J. Turbomach. 2022, 144, 041011. [Google Scholar] [CrossRef]
- Jenny, P.; Abhari, R.S.; Rose, M.G. Unsteady rotor hub passage vortex behavior in the presence of purge flow in an axial low pressure turbine. J. Turbomach. 2013, 135, 051022. [Google Scholar] [CrossRef]
- Schrewe, S.; Werschnik, H.; Schiffer, H.P. Experimental Analysis of the Interaction Between Rim Seal and Main Annulus Flow in a Low Pressure Two Stage Axial Turbine. J. Turbomach. 2013, 135, 051003. [Google Scholar] [CrossRef]
- Yang, F.; Zhou, L.; Wang, Z. Investigation on Interaction Loss Mechanism Between Rim Seal Flow and Mainstream. J. Propuls. Technol. 2020, 41, 285–293. [Google Scholar]
- Yang, F.; Zhou, L.; Wang, Z. Unsteady numerical investigation on viscous shear loss caused by rim seal purge flow. J. Power Energy 2019, 233. [Google Scholar] [CrossRef]
- Yang, F.; Zhou, L.; Wang, Z. Unsteady numerical investigation on vortex interaction between rim seal flow and mainstream. J. Propuls. Technol. 2019, 40, 315–323. [Google Scholar]
- Barisi, D.; Lengani, D.; Simoni, D.; Venturino, G.; Bertini, F.; Giovannini, M.; Rubechini, F. Analysis of the Loss Production Mechanism Due to Cavity-Main Flow Interaction in a Low-Pressure Turbine Stage. J. Turbomach. 2022, 144, 091004. [Google Scholar] [CrossRef]
- Huang, J.W.; Fu, W.L.; Ma, G.J.; Wang, G.J.; Gao, J. Interaction between 1.5-stage turbine rim seal purge flow and mainstream and flow interface between rim seals affected by rim seal structure. Acta Aeronaut. Astronaut. Sin. 2021, 42, 124549. [Google Scholar]
- Hunter, S.D.; Manwaring, S.R. Endwall Cavity Flow Effects on Gaspath Aerodynamics in an Axial Flow Turbine Part 1—Experimental and Numerical Investigation. In Proceedings of the ASME Turbo Expo 2000, Munich, Germany, 8–11 May 2000; ASME Paper 2000-GT-651. 2000. [Google Scholar]
- Zhang, Z.; Zhang, Y.; Dong, X.; Qu, X.; Lu, X.; Zhang, Y. Flow mechanism between purge flow andmainstream in different turbine rim seal configurations. Chin. J. Aeronaut. 2020, 33, 2162–2175. [Google Scholar] [CrossRef]
- Bai, T.; Yang, Q.; Liu, J.; Shi, Y.; Qiao, S. Numerical study of turbine rim seals performance with different sealing structures. Métodos Numéricos Para Cálculo Diseño Ing. Rev. Int. 2022, 38, 32. [Google Scholar] [CrossRef]
- Behr, T. Control of Rotor Tip Leakage and Secondary Flow by Casing Air Injection in Unshrouded Axial Turbines. Ph.D. Thesis, Dresden University of Technology, Dresden, Germany, 2007. [Google Scholar]
- Cumpsty, N.A.; Horlock, J.H. Averaging Nonuniform Flow for a Purpose. ASME J. Turbomach. 2006, 128, 120–129. [Google Scholar] [CrossRef]
- Chilla, M.; Hodson, H.; Newman, D. Unsteady interaction between annulus and turbine rim seal flows. J. Turbomach. 2013, 135, 051024. [Google Scholar] [CrossRef]
- Young, J.B.; Wilcock, R.C. Modeling the Air-Cooled Gas Turbine: Part 2-Coolant Flows and Losses. ASME J. Turbomach. 2002, 124, 214–221. [Google Scholar] [CrossRef]
Figure 1.
Computation model.

Figure 2.
Computation mesh of a 1.5-stage turbine.

Figure 3.
Pressure coefficient change at the monitoring point.

Figure 4.
Total pressure coefficient at stator outlet.

Figure 5.
Flow angle at stator outlet.

Figure 6.
Distribution of entropy increase () along the flow direction (IR = 1.5%).

Figure 7.
The loss area of turbine stator passage.

Figure 8.
Dissipation coefficient integral.

Figure 9.
Time-averaged pressure coefficient distribution.

Figure 10.
Time-averaged vorticity Z contour (streamwise 0.92).

Figure 11.
Time-averaged tangential velocity distribution.

Figure 12.
Velocity triangle distribution downstream of cavity exit.

Figure 13.
The dissipation coefficient distribution at the exit of disk cavity, IR = 1.5%. (Left: axial direction, right: circumferential direction).
Figure 13.
The dissipation coefficient distribution at the exit of disk cavity, IR = 1.5%. (Left: axial direction, right: circumferential direction).

Figure 14.
Proportion of velocity gradient based on mass flow integral, IR = 1.5%.

Figure 15.
The sealing efficiency and streamline (t = 0T).


Table 1.
Geometric and aerodynamic parameters of each blade row of a Lisa stage 1.5 turbine.
| Parameter | S1 | R1 | S2 |
|---|---|---|---|
| Blade numbers | 36 | 54 | 36 |
| Span/mm | 70 | 70 | 70 |
| Chord length/mm | 80.88 | 59.72 | 85.50 |
| Pitch/mm | 63.7 | 42.5 | 63.7 |
| Inlet angle/° | 0.0 | 52.4 | −35.4 |
| Exit angle/° | 72.0 | −66.6 | 66.0 |
| Exit Ma | 0.54 | 0.50 | 0.48 |
| Re/×105 | 7.1 | 3.8 | 5.1 |
Table 2.
Boundary condition [25].
Table 2.
Boundary condition [25].
| Boundary Condition | Value |
|---|---|
| Total pressure in the mainstream inlet (Kpa) | 140 |
| Total temperature in mainstream inlet (K) | 328 |
| Total temperature in the cavity inlet(K) | 308 |
| Rim seal flow IR in cavity inlet | 0%,0.5%,1.0%,1.5% |
| The concentration of CO2 in mainstream inlet | 0 |
| The concentration of CO2 in cavity inlet | 1 |
| The rotation speed of rotor wall(r/min) | 2700 |
Table 3.
Blocking loss (dm3).
| Axial | Radial | Chute_60 | Chute_45 | Chute_30 | |
|---|---|---|---|---|---|
| 0% | −0.003 | — | — | — | — |
| 0.5% | −0.009 | — | — | — | — |
| 1.0% | −0.018 | −0.020 | −0.021 | −0.026 | −0.028 |
| 1.5% | −0.026 | — | — | — | — |
Table 4.
Time-averaged sealing efficiency.
 | Axial | Radial | Chute_60 | Chute_45 | Chute_30 |
|---|---|---|---|---|---|
| 0% | 10.4% | — | — | — | — |
| 0.5% | 42.0% | — | — | — | — |
| 1.0% | 77.3% | 82.3% | 86.4% | 94.1% | 99.9% |
| 1.5% | 95.3% | — | — | — | — |
Table 5.
Viscous shear loss (dm3).
| Axial | Radial | Chute_60 | Chute_45 | Chute_30 | |
|---|---|---|---|---|---|
| 0% | 0.0467 | — | — | — | — |
| 0.5% | 0.0534 | — | — | — | — |
| 1.0% | 0.0670 | 0.0863 | 0.0734 | 0.0924 | 0.095 |
| 1.5% | 0.0855 | — | — | — | — |
Table 6.
Velocity gradient for variety IR.
| Mass Average | 0% | 0.5% | 1% | 1.5% |
|---|---|---|---|---|
| 121.0 (32.8%) | 226.7 (36.2%) | 319.7 (39.7%) | 448.4 (39.1%) | |
| 23.14 (6.3%) | 121.2 (19.4%) | 204.2 (25.3%) | 314.82 (27.4%) | |
| 117.0 (31.7%) | 133.5 (21.3%) | 119.7 (14.9%) | 148.62 (13%) | |
| Total proportion | 70.8% | 76.9% | 79.9% | 79.5% |
Table 7.
Velocity gradient for a variety of sealing structures.
| Mass Average | Axial | Radial | Chute_60 | Chute_45 | Chute_30 |
|---|---|---|---|---|---|
| 319.66 (39.7%) | 265.95 (33.1%) | 426.4 (46.3%) | 440.9 (48.4%) | 482.0 (51.7%) | |
| 204.214 (25.3%) | 215.362 (26.8%) | 183.2 (19.9%) | 171.76 (18.9%) | 165.4 (17.8%) | |
| 119.74 (14.9%) | 154.05 (19.2%) | 108.417 (11.8%) | 98.65 (10.8%) | 68.82 (7.4%) | |
| Total proportion | 79.9% | 79.1% | 78% | 78.1% | 76.9% |
Disclaimer/Publisher’s Note: The statements, opinions and data contained in all publications are solely those of the individual author(s) and contributor(s) and not of MDPI and/or the editor(s). MDPI and/or the editor(s) disclaim responsibility for any injury to people or property resulting from any ideas, methods, instructions or products referred to in the content. |
© 2022 by the authors. Licensee MDPI, Basel, Switzerland. This article is an open access article distributed under the terms and conditions of the Creative Commons Attribution (CC BY) license (https://creativecommons.org/licenses/by/4.0/).
Share and Cite
MDPI and ACS Style
Bai, T.; Yang, Q.; Liu, J. Numerical Study of the Purge Flow’s Effect on the Loss Mechanism of the Blocking and Shear Effects. Processes 2023, 11, 50. https://doi.org/10.3390/pr11010050
AMA Style
Bai T, Yang Q, Liu J. Numerical Study of the Purge Flow’s Effect on the Loss Mechanism of the Blocking and Shear Effects. Processes. 2023; 11(1):50. https://doi.org/10.3390/pr11010050
Chicago/Turabian StyleBai, Tao, Qingzhen Yang, and Jian Liu. 2023. "Numerical Study of the Purge Flow’s Effect on the Loss Mechanism of the Blocking and Shear Effects" Processes 11, no. 1: 50. https://doi.org/10.3390/pr11010050
Note that from the first issue of 2016, this journal uses article numbers instead of page numbers. See further details here.