Article

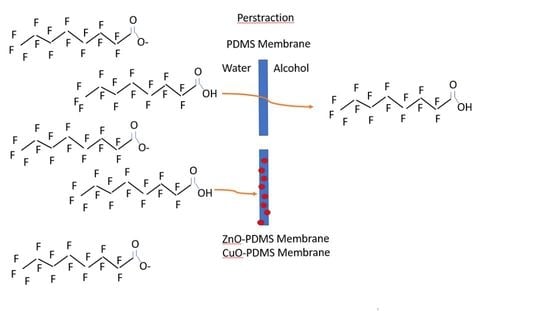
Perstraction: A Membrane-Assisted Liquid–Liquid Extraction of PFOA from Water

1
Department of Chemical, Paper, and Biomedical Engineering, Miami University, Oxford, OH 45056, USA
2
Department of Chemistry and Biochemistry, Miami University, Oxford, OH 45056, USA
*
Author to whom correspondence should be addressed.
Processes 2023, 11(1), 217; https://doi.org/10.3390/pr11010217
Submission received: 22 December 2022 / Revised: 3 January 2023 / Accepted: 6 January 2023 / Published: 10 January 2023
(This article belongs to the Section Separation Processes)

Abstract

:
This study represents a first time that perstraction was assessed as a process to remove perfluorooctanoic acid (PFOA) from water. In the perstraction process, PFOA permeates through a membrane from water to a solvent. The membrane used in this study was polydimethylsiloxane (PDMS). The experimental approach included the following: (1) measurement of partition coefficients for PFOA between water and selected solvents; (2) determination of solubility and diffusivity of the solvents in PDMS; (3) determination of the uptake of PFOA in PDMS; (4) determination of the effects of selected particles imbedded in the PDMS on PFOA uptake and solvent absorption; and (5) demonstration of the perstraction process to remove PFOA from water. PFOA preferentially partitioned to alcohols over water. In addition, ZnO and CuO particles in PDMS significantly enhanced the rate at which PFOA was absorbed in PDMS from deionized water due to ionic interactions. The perstraction of PFOA from deionized water into hexanol was demonstrated. However, perstraction was not successful at removing PFOA from tap water. While the application of perstraction to removing PFOA from water is limited, the idea was demonstrated and information contained within this manuscript is new.

Graphical Abstract

1. Introduction

The United States Environmental Protection Agency (US EPA) has identified an urgent, high-priority need for assessing the environmental risks posed by per- and poly-fluoroalkyl substances (PFAS), and to identify practical approaches to manage them [1]. PFAS are anthropogenic industrial compounds used in many applications, including surface coatings, surfactants, and flame retardants. They are, however, emerging contaminants [2,3,4,5] due to their recalcitrant nature; they are persistent and very stable in air, water, and soil environments [2,3,4,5,6,7,8,9,10,11]. As a result of their environmental stability, PFAS have been detected in water and soil samples all over the world, as well as in humans and in wildlife [6,7,8,9]. They have been reported as bioaccumulative, with detectable concentrations in humans and in both aquatic and terrestrial animals [6]. For reasons of their stability and bioaccumulative nature, and for their detrimental health effects on humans, perfluorooctanoic acid (PFOA) and perfluorooctane sulfonate (PFOS) have been added to Annex B of the Stockholm Convention on Persistent Organic Contaminants, which restricts their production and use worldwide [11].
In a review by Merino, et al. [12], methods that have been investigated to treat PFAS-contaminated water include adsorption, advanced oxidation processes, advanced reduction processes, thermal and non-thermal destruction, and microbial treatment. Adsorption has been found to be one of the more cost-effective solutions so far for removing PFAS from water at full-scale water treatment facilities [13]. The destruction of PFAS, however, still needs to be considered.
A motivation of this study is the ultimate destruction of PFAS. If PFAS can be transferred from water to a solvent, then the incineration of the PFAS may be facilitated, and the energy from the contaminated solvent could be reclaimed as energy. With this idea, a liquid–liquid extraction process for PFAS removal was investigated. While liquid–liquid extraction (LLE) has been used to prepare perfluoroalkyl substances (PFAS) for subsequent analysis [14], there is very little information that has been published on the solubility of PFAS in organic solvents. PFAS are considered to be hydro-oleophobic [15], which means that PFAS prefers neither water nor oils [15]. Meng et al. [15] investigated the partitioning of perfluorooctane sulfonate (PFOS) between water and hexane and between water and octanol. They found that PFOS partitioned into the octanol but not into hexane. In addition, several solvents were screened for PFOS solubility, and it was found that PFOS solubility generally increases with increasing polarity of the solvent [15].
Perfluorooctanoic acid (PFOA), one of the more environmentally-significant PFAS contaminants in the environment [16], is a surfactant, and so significant foaming will occur and an emulsion will form at the interface between a solvent and PFOA-contaminated water. This is shown in Figure 1, in which aqueous solutions containing PFOA were manually agitated with an equal volume of butanol and allowed to settle. The white layers in the vials pictured in Figure 1 are emulsion layers that did not settle with time. Notably, there is no emulsion in the sample with 0 mg/L PFOA in the initial aqueous phase, indicating that the PFOA in the water caused the emulsion to occur at the organic–water interface.
The tendencies of PFOA to foam and form emulsions are detrimental to liquid–liquid extraction processes. However, perstraction, a membrane-assisted liquid–liquid extraction process, may be possible if suitable solvents and membranes are found that promote the transfer of PFOA from water through the membrane to the solvent. The advantage of perstraction over liquid–liquid extraction is that the membrane inhibits foaming and the formation of emulsions. This process has been researched predominantly for extracting butanol from acetone–butanol–ethanol (ABE) fermentation processes to enhance the yields of alcohols [17,18,19,20,21,22,23,24,25,26]. It has also been researched as a method to remove organic compounds from water, including ethanol [27], phenolic compounds [28], and pharmaceuticals [29,30].
This study represents a first time that perstraction was assessed as a separation method to remove PFOA from water. The membrane used in this study is polydimethylsiloxane (PDMS), a silicone polymer that is flexible, hydrophobic, and non-toxic. The purpose of this study was to demonstrate the feasibility of perstraction as a method to remove PFOA from water.

2. Materials and Methods

2.1. Materials

Solvents (99.9% hexane, 99.5% cyclohexane, 99% benzene, 99.4% 1-butanol, 98% 1-hexanol, and 99% 1-octanol) were purchased from chemical supply companies and were used as received. PDMS membranes were synthesized using Sylgard™ 184 silicone elastomer kit. Metal oxides (zinc oxide (ZnO), copper oxide (CuO), iron oxide (Fe2O3), manganese oxide (MnO2), aluminum oxide (Al2O3), and titanium oxide (TiO2)), and activated carbon (Calgon BPL carbon) were purchased from chemical supply companies and were used as received.

2.2. Analytical Methods

Several analytical methods were used in this study to measure PFOA in water. The analytical methods included conductivity and UV–Vis spectrometry at 210 nm for PFOA in deionized (DI) water; total organic carbon (TOC) for PFOA in tap water; and nuclear magnetic resonance (NMR) for PFOA in water and in solvents. Gravimetric methods were also used in some cases for PFOA measurements. Finally, some samples were sent to an off-site laboratory for analyses by liquid chromatography with tandem mass spectrometry (LC/MS/MS). Calibration curves for various analytical methods can be found in Figures S1–S7 in the Supplementary Files.

2.3. Experimental Approach

The approach used in this study was as follows: (1) design and fabricate a perstraction test system; (2) measure the partition coefficients for PFOA in selected solvents; (3) determine the solubility and diffusivity of selected solvents in PDMS; (4) determine the uptake or absorption of PFOA in PDMS; (5) determine the effects of selected metal oxides and adsorbent particles imbedded in PDMS membranes on PFOA uptake and solvent solubility and diffusivity; and (6) demonstrate the perstraction process for removing PFOA from water. Each step in the experimental approach is described in more detail below.

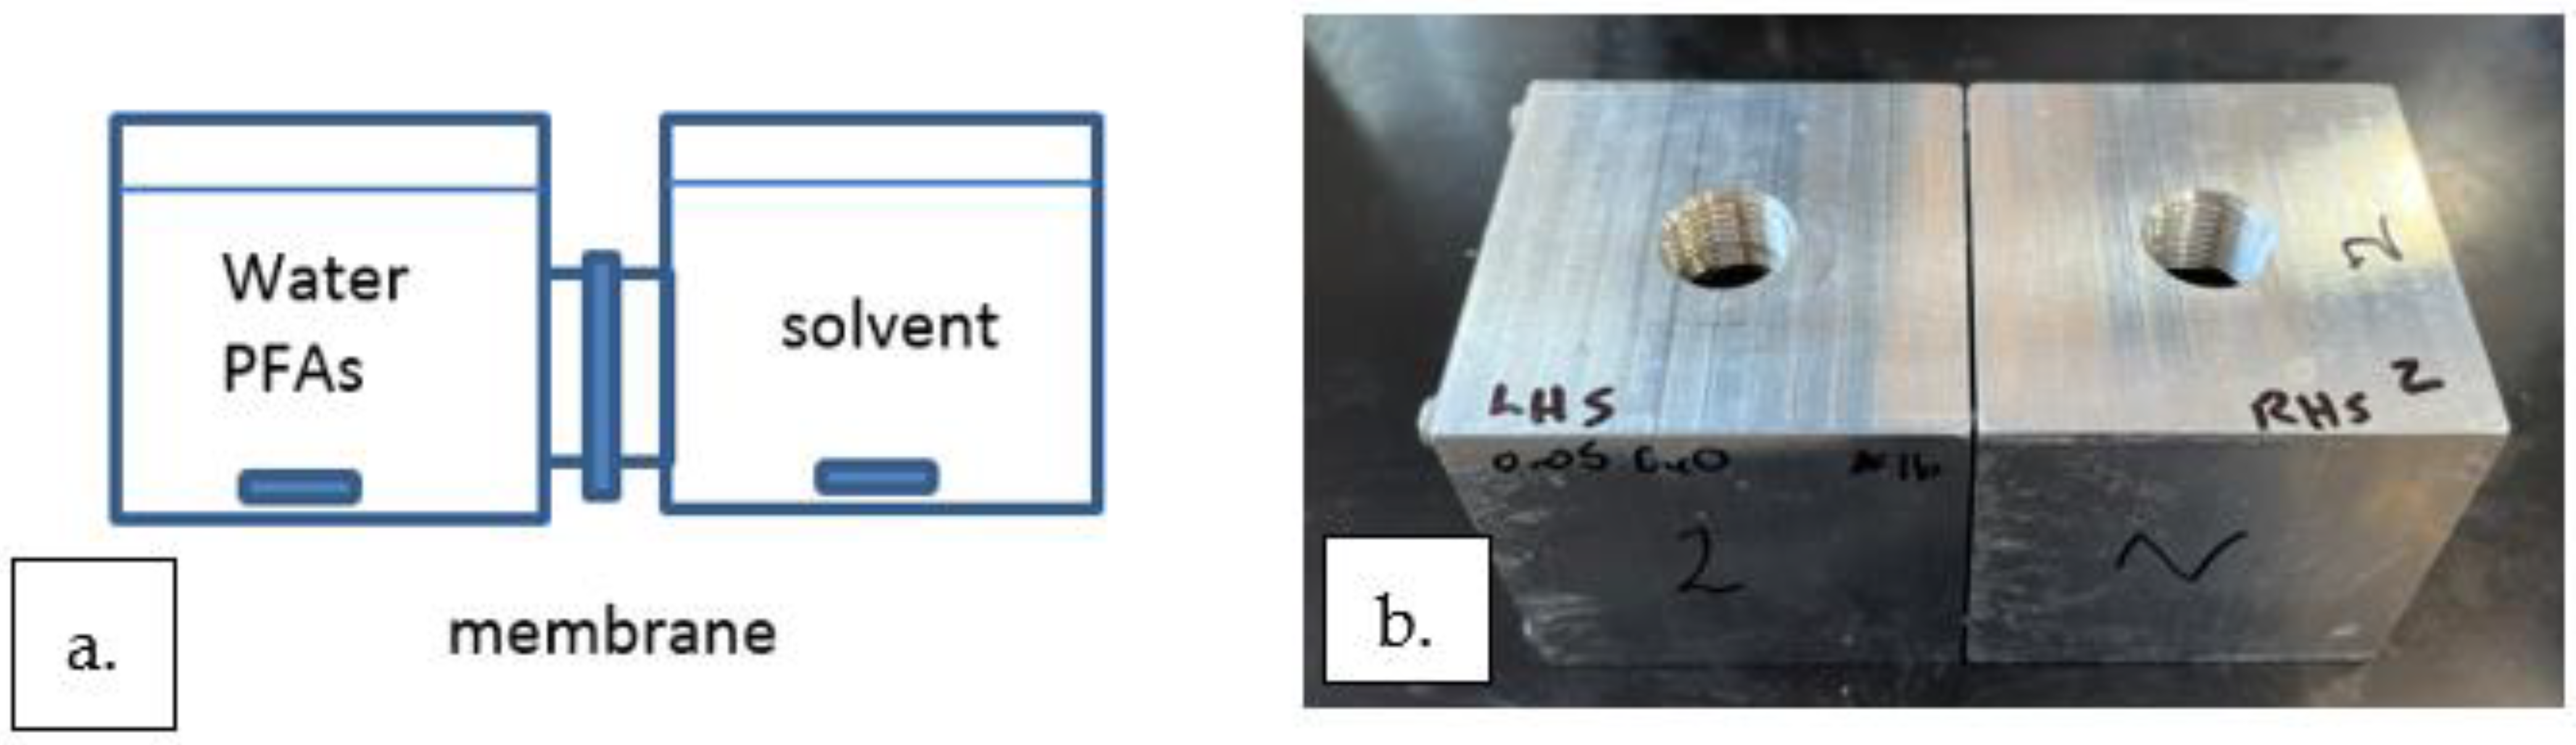
2.3.1. Perstraction Test System

Four identical perstraction test systems were designed and fabricated out of aluminum blocks (7.6 cm × 7.6 cm × 15.2 cm). For each test system, the aluminum block was cut in half, and identical 100 cm3 cavities were machined in each half. The diameter of the cavity between the two halves is 4.45 cm. A membrane was cut to approximately 3.5 g and had dimensions of 5 cm in diameter and 1 mm thick. The membrane was placed between the two halves of the test system, and it completely covered the open area between the two halves. The assembly is secured together by 4 long screws. A schematic and a photo of a perstraction test system are shown in Figure 2a,b, respectively.
Ports were drilled into the top of each half of the test system to facilitate loading and sampling the solutions on each side of the membrane. These openings were covered between sampling times during the experimental trials. The solutions in the vessels were stagnant, except when samples were obtained for subsequent analyses.
A Silgard 184 silicone elastomer kit was used to prepare the membranes, with and without imbedded particles. Per the kit instructions, the membranes were prepared with a mass ratio of 10:1 elastomer:cross-linker [31]. When particles were added, they were ground and sieved to be less than 250 µm. The mass loadings of particles in the membranes were calculated as mass particles per mass total polymer. The polymer and polymer-particle mixtures were manually mixed for several minutes. Then, the polymer mixtures were poured into 10 cm diameter aluminum pans to prepare the membranes. The pans were held flat between two weighted flat plates within a leveled vacuum oven so that the membrane thickness was relatively uniform within the pans. The polymer mixtures in the pans were de-aerated under vacuum to remove gas bubbles. Following deaeration, the membranes were heated to 60 °C for 20 h to complete the curing process. The thicknesses of the membranes used in this study were measured using a micrometer. The membranes used in this study were all approximately 1 mm thick.

2.3.2. Partition Coefficients for PFOA in Selected Solvents

Partition coefficients for PFOA between water and selected solvents were measured. Equal volumes of PFOA-contaminated water (1000 mg/L) and selected solvents were manually agitated. The vials were allowed to settle for at least 24 h. Aliquots of each phase were sampled, diluted with deionized water at a measured dilution ratio, and the diluted samples were analyzed at an off-site laboratory by LC/MS/MS. In addition, undiluted samples were dried and analyzed gravimetrically for comparison. The partition coefficients were calculated according to Equation (1).
K = [ P F O A ] s o l v e n t [ P F O A ] w a t e r
where K is the partition coefficient and [PFOA] is the concentration of PFOA in the solvent or aqueous phase.
Both deionized water and Oxford, Ohio’s tap water were used for this effort. The goal of using both types of water was to assess the effect of PFOA ionization on the partition coefficient. Deionized water has a conductivity of <10 µS, and the pH of the 1000 mg/L PFOA solution in deionized water was measured to be 2.76. According to Burns et al. (2008), the pKa for PFOA is 3.8 [32]. Therefore, in deionized water, PFOA would be present in a significant fraction in its neutral or protonated form, which could partition differently to PFOA anions in water. Ohio’s tap water is very hard (~350 mg/L as calcium carbonate) [33], and the pH of the 1000 mg/L PFOA solution in tap water was measured to be between 7.5 and 8.5. In tap water, PFOA would be predominantly present in its ionized form.

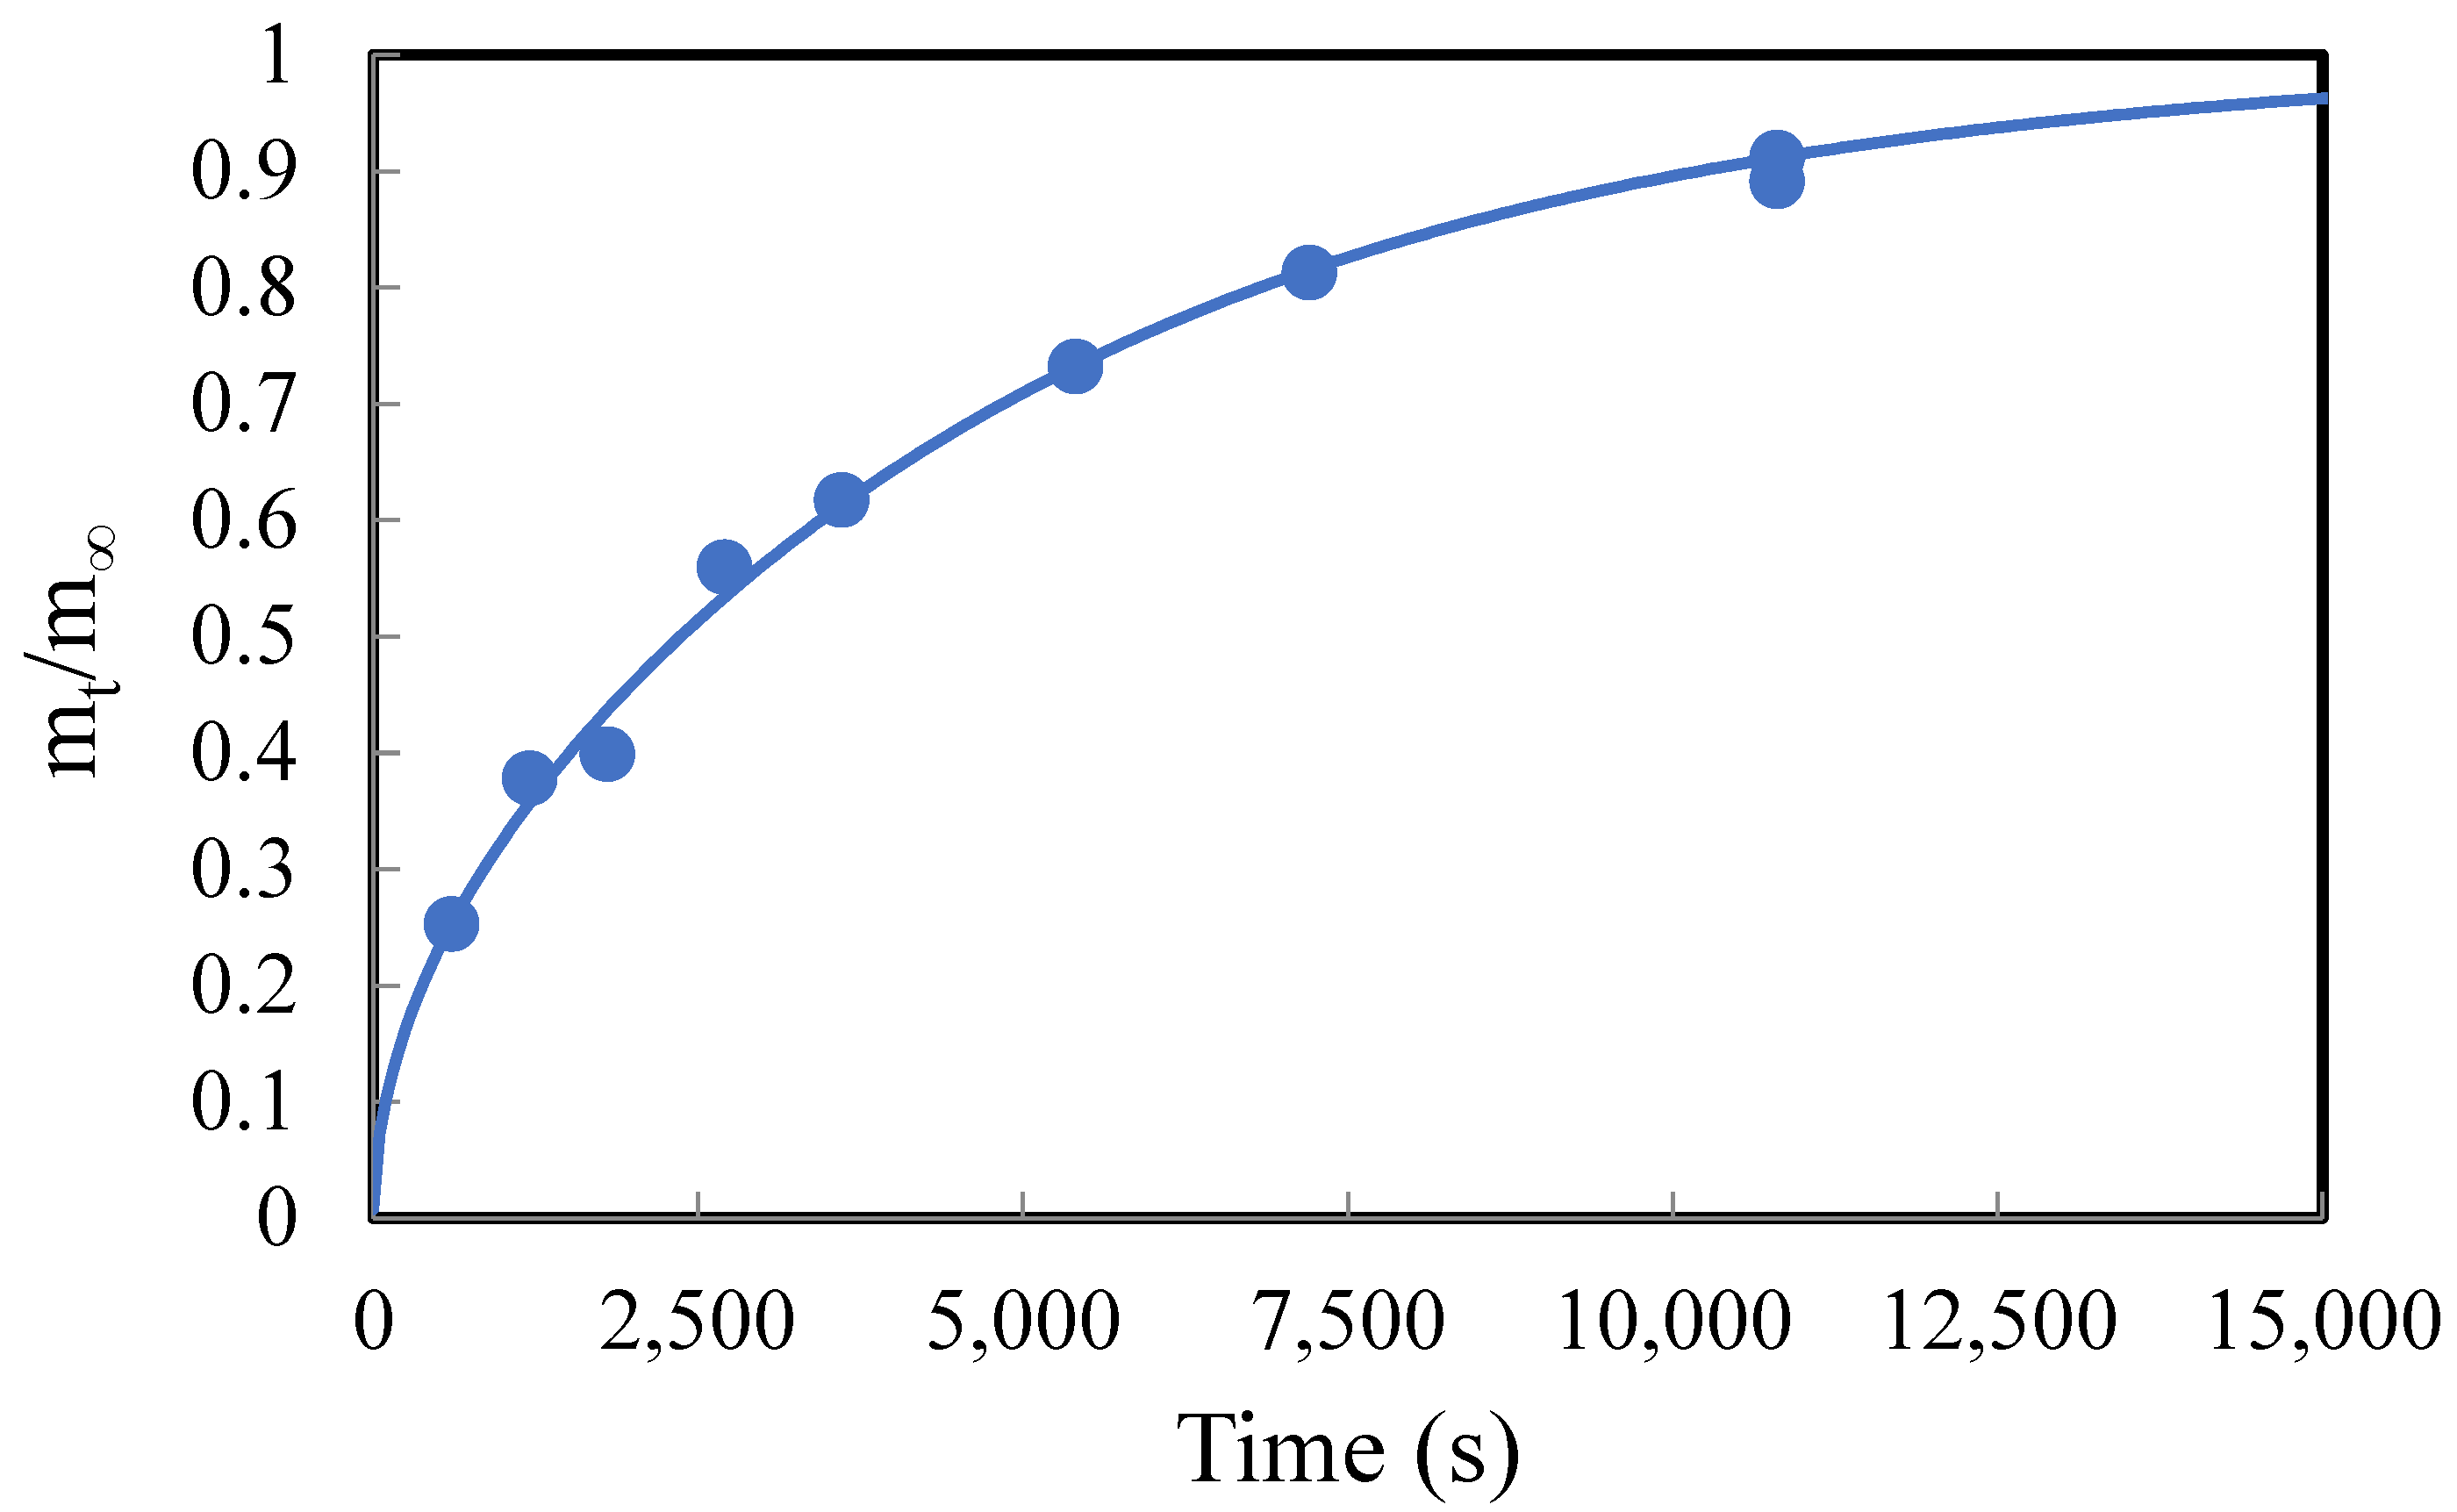
2.3.3. Determine the Solubility and Diffusivity of the Solvents in PDMS

Solvent absorption in the membrane was measured using methods described in literature [34]. In brief, pieces of membranes were cut to approximately 0.3 g and were weighed (mo). Then, the weighed pieces of prepared membranes were immersed in a solvent. The membrane pieces were removed as a function of time, patted dry to remove liquid solvent, and then quickly re-weighed to obtain the mass gained at various times, (mt), as shown in Equation (2).
m t = m a s s   a t   t i m e ,   t m o
The mass gained at 24 h was assumed to be the equilibrium mass of solvent gained in the PDMS material (m), as shown in Equation (3).
m = m a s s   a f t e r   24   h m o
The mass gained at 24 h was used to calculate the solubility, S (kg solvent/m3 polymer), of the solvent in PDMS, according to Equation (4). For this study, the PDMS was measured to have a density of approximately 1000 kg/m3. Therefore, the density of 1000 kg/m3 was used for PDMS for all calculations.
S = 1000   m m o
The experimental data (mt/m) were fit to a published model by Crank, 1956 [35], which is shown in Equation (5). For this effort, the diffusivity was used as the model parameter, and it was varied to best fit the model to the experimental data by the method of sum of least squares.
m t m = 1 n = 0 8 ( 2 n + 1 ) 2 π 2 e D ( 2 n + 1 ) 2 π 2 t / ( 4 l 2 )
In Equation (5), D is the diffusivity (m2/s) of the solvent in the polymer, l is the half-thickness of the membrane material (m), and t represents time (s).

2.3.4. Determine the Uptake of PFOA in PDMS

The absorption or uptake of PFOA from deionized water solutions to PDMS, both with and without imbedded particles, was measured with time for over 20 days. The experimental data were fit to a published second-order kinetics models for adsorption, shown in Equation (6) [36].
q t = q e 2 k 2 t 1 + q e k 2 t
In Equation (6), qt is the uptake of PFOA (mg PFOA/g PDMS) at time t, qe is the uptake of PFOA at equilibrium (mg PFOA/g PDMS), k2 is a kinetic constant and model parameter (g PDMS/mg PFOA/day, and t is time (days). The model parameters for this effort were qe and k2, which were varied to best fit the model to the experimental data.

2.3.5. Determine the Effects of Particles Imbedded in the PDMS Membrane on PFOA Uptake and Solvent Absorption

Particles imbedded in the PDMS can alter the properties of the membrane [37], and therefore, they alter how PFOA interacts with the membrane material. According to Wolf, et al. (2018), the addition of nano- and micro particles to PDMS can alter its hydrophobicity, elasticity, and electrical and thermal conductivity, among other properties [38].
In this study, several particles were imbedded in PDMS to investigate their impact on PFOA uptake and solvent interactions. The particles were imbedded in a 10 wt% ratio to screen the effects of particles in PDMS. The mass ratio is defined as mass of particles per mass of total polymer. The particles were sieved through a 60-mesh screen (openings of 250 µm) prior to use. Otherwise, the particles were used as received. The particles investigated in this study included ZnO, CuO, Fe2O3, Al2O3, MnO2, SiO2, TiO2, and activated carbon.

2.3.6. Demonstrate the Perstraction Process for Removing PFOA from Water

The perstraction process was demonstrated using the test systems described above (Figure 2). Three sets of trials were conducted with the 4 identical test systems. A summary of the tests conducted with the four identical test systems is provided in Table 1. Both sides of a membrane in the test systems were filled with respective fluids (the LHS contained PFOA-contaminated water, the RHS contained a selected solvent). The PFOA concentrations were tracked with time for up to 9 days.

3. Results

3.1. Partition Coefficients of PFOA in Selected Solvents

The partition coefficients obtained in this study for PFOA in various solvents are shown in Table 2. In all cases, the non-polar solvents had very low solubility for PFOA. In contrast, the alcohols all have partition coefficients >1, indicating that PFOA preferentially separates from water to the alcohol phase. This result is supported by the results reported by Meng, et al. (2017) [15], which also showed alcohols having higher affinity than non-polar solvents for PFOS. Based upon these results, 1-butanol, 1-hexanol, and 1-octanol were used as perstraction solvents for the rest of this study.
A comparison of partition coefficients in Table 2 was made between the aqueous phase consisting of DI water and that consisting of Oxford, Ohio’s tap water. The reason for this comparison is to provide evidence that the partitioning of PFOA is dependent upon its degree of ionization. PFOA solutions in tap water had measured pH values between 7.5 and 8.5, and so PFOA would be predominantly present in its ionized form. In contrast PFOA solutions in DI water had measured pH values < 3, and so a significant fraction of PFOA would be in its protonated or neutral form.
The partition coefficients for PFOA in alcohols are all similar when the aqueous phase is DI water. In contrast, the partition coefficients tend to decrease with increasing carbon chain length or decreasing polarity in the alcohol when tap water is used. It is likely that hydrophobic interactions between the solvent and the protonated form of PFOA were dominant in DI water, since PFOA would be present in its protonated form. However, the ionized form of PFOA would tend to prefer polar compounds and stay in the aqueous phase. In addition, tap water contains significant concentrations of minerals and ions, and so there would be significant competition for the ionic interactions of PFOA anions with other anions in the water with the polar head of the solvent.

3.2. Determine the Solubility and Diffusivity of the Solvents in PDMS with and without Imbedded Particles

The solubilities and diffusivities of 1-butanol, 1-hexanol, and 1-octanol were determined using a gravimetric method, as described above and by Liu, et al. (2013) [34]. The solubilities of the alcohols in PDMS were calculated using Equation (4). The diffusivities were calculated by fitting the experimental data to a published mass transport model by Crank (1956) [35], as shown in Equation (5). An example of this effort is shown in Figure 3, and a summary of the results is provided in Table 3. The experimental data and their fit to the model in Equation (5) for all three alcohols in PDMS membrane samples are provided in the excel file submitted in the Supplementary Files. Notably, the effects of ZnO and CuO loadings (0 wt%, 5 wt%, 10 wt%, and 15 wt%) in PDMS on solvent absorption were also investigated, and the results are also provided in Table 3.
The solubilities of the alcohols in PDMS appear to decrease as the carbon chain in the solvent increases (1-butanol > 1-hexanol > 1-octanol). This result is supported by Cochi et al. (2015) [38] who investigated the solubility and diffusivities of several solvents in PDMS. They found that the solubility of alcohols in PDMS decreases with increasing number of carbon atoms going from 1-butanol to 1-hexanol. With longer-chained alcohols, the solubility is driven by entropic effects, which favor the smaller molecules [38].
The diffusivities of 1-butanol (1.7 × 10⁻¹¹ m2/s) and 1-hexanol (1.4 × 10⁻¹¹ m2/s) in PDMS are similar, whereas the diffusivity of 1-octanol was estimated to be much higher (3.5 × 10⁻¹¹ m2/s). One reason for this result is that the model assumes constant diffusivity. It is likely, however, that diffusivity increases with increasing solvent concentration in PDMS. According to Cochi et al. (2015) [38], the diffusivity is a function of both kinetic and thermodynamic parameters. The diffusivity of 1-octanol may have been enhanced by its more favorable thermodynamic interaction with PDMS. PDMS is a nonpolar polymer. The longer nonpolar hydrocarbon chain in 1-octanol compared with 1-butanol and 1-hexanol enhanced its diffusion within the polymer.
The presence of imbedded particles in PDMS did not appear to significantly affect the observed solubilities or diffusivities of the alcohols in PDMS. This suggests that the interactions between the alcohols and PDMS dominate the rate of mass transfer of solvents in PDMS.

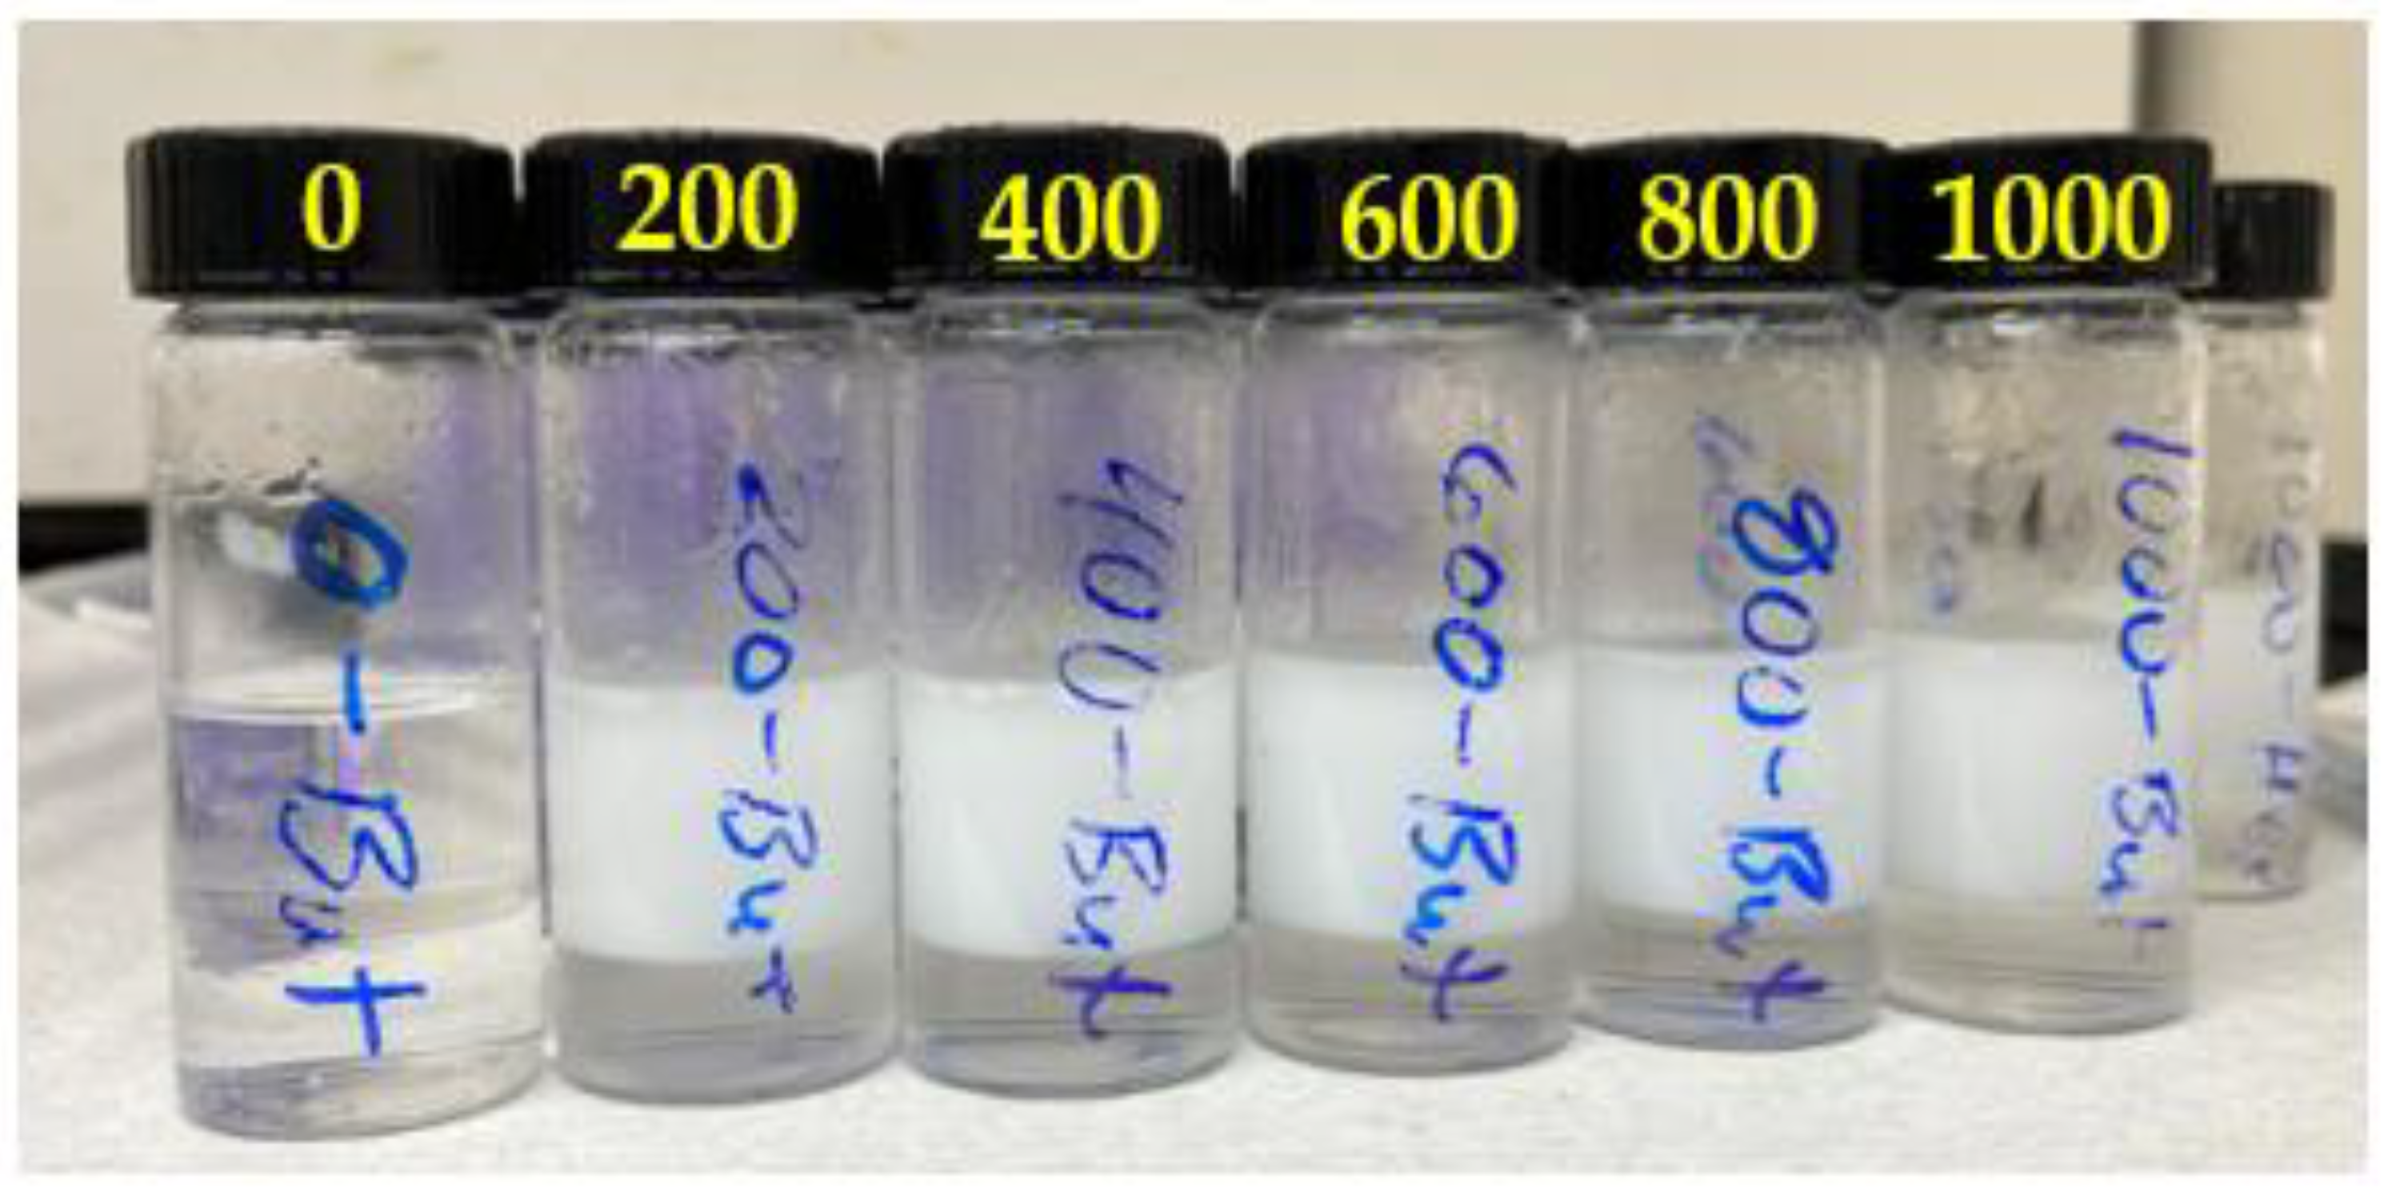
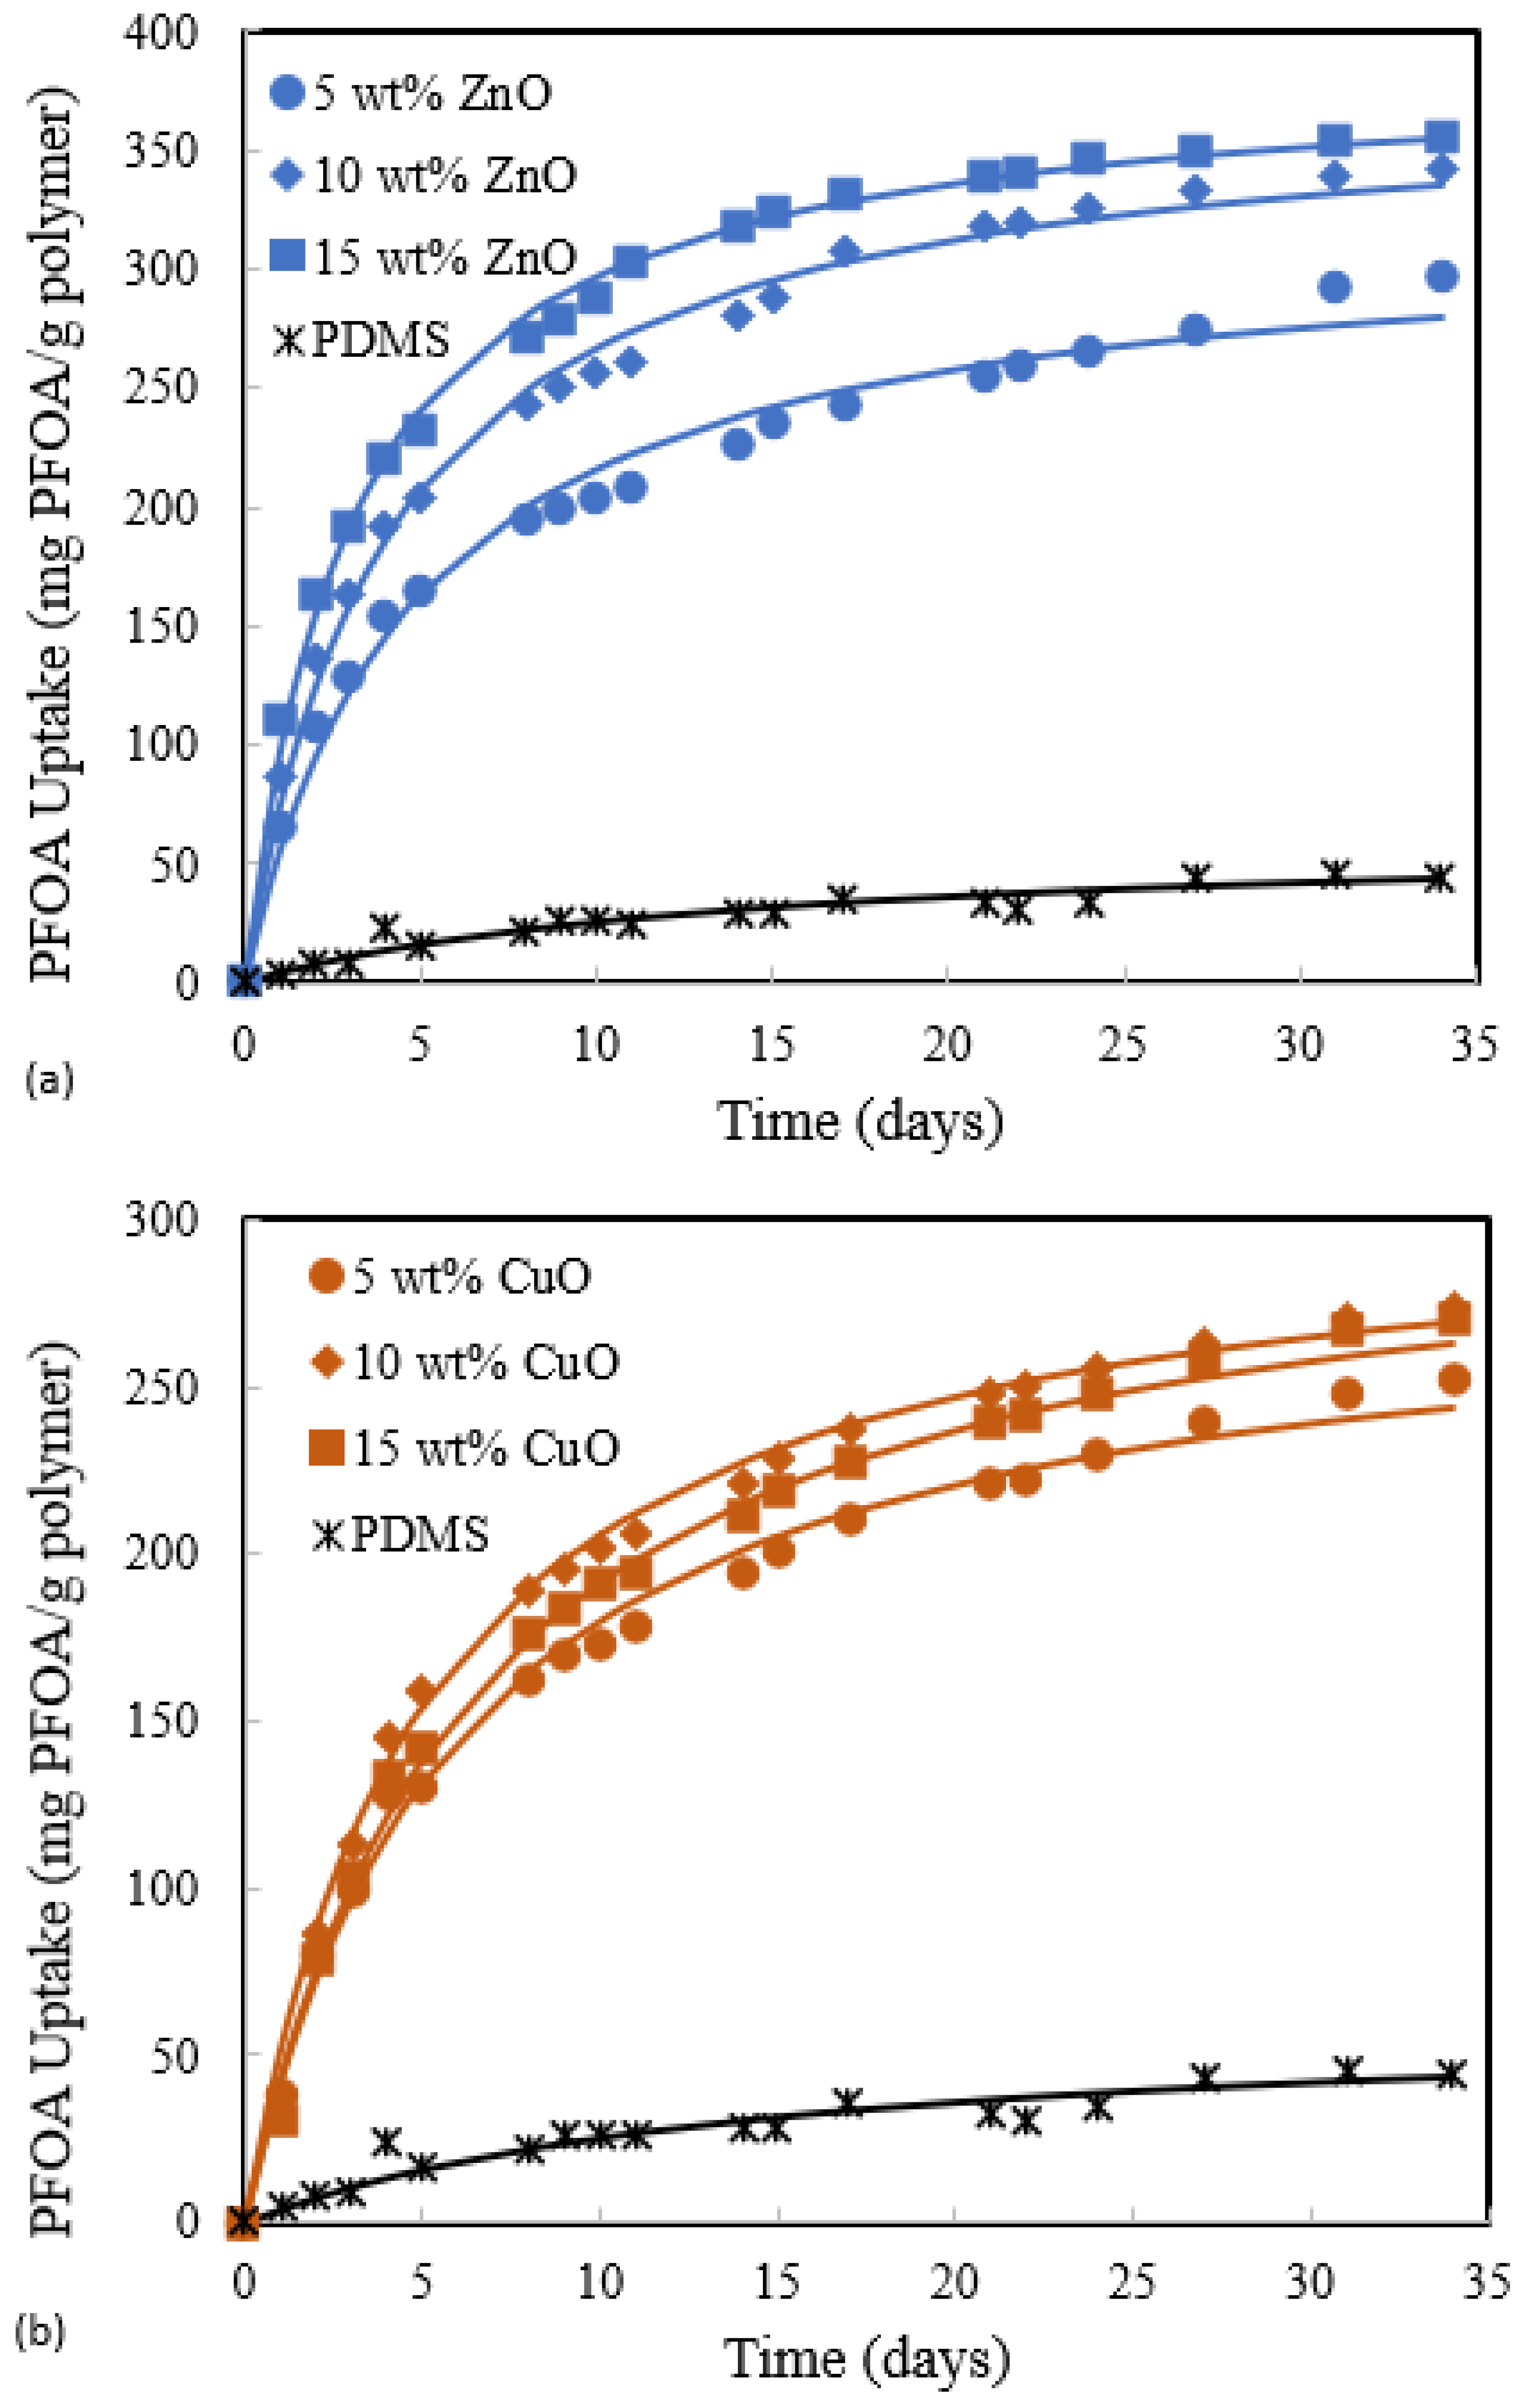
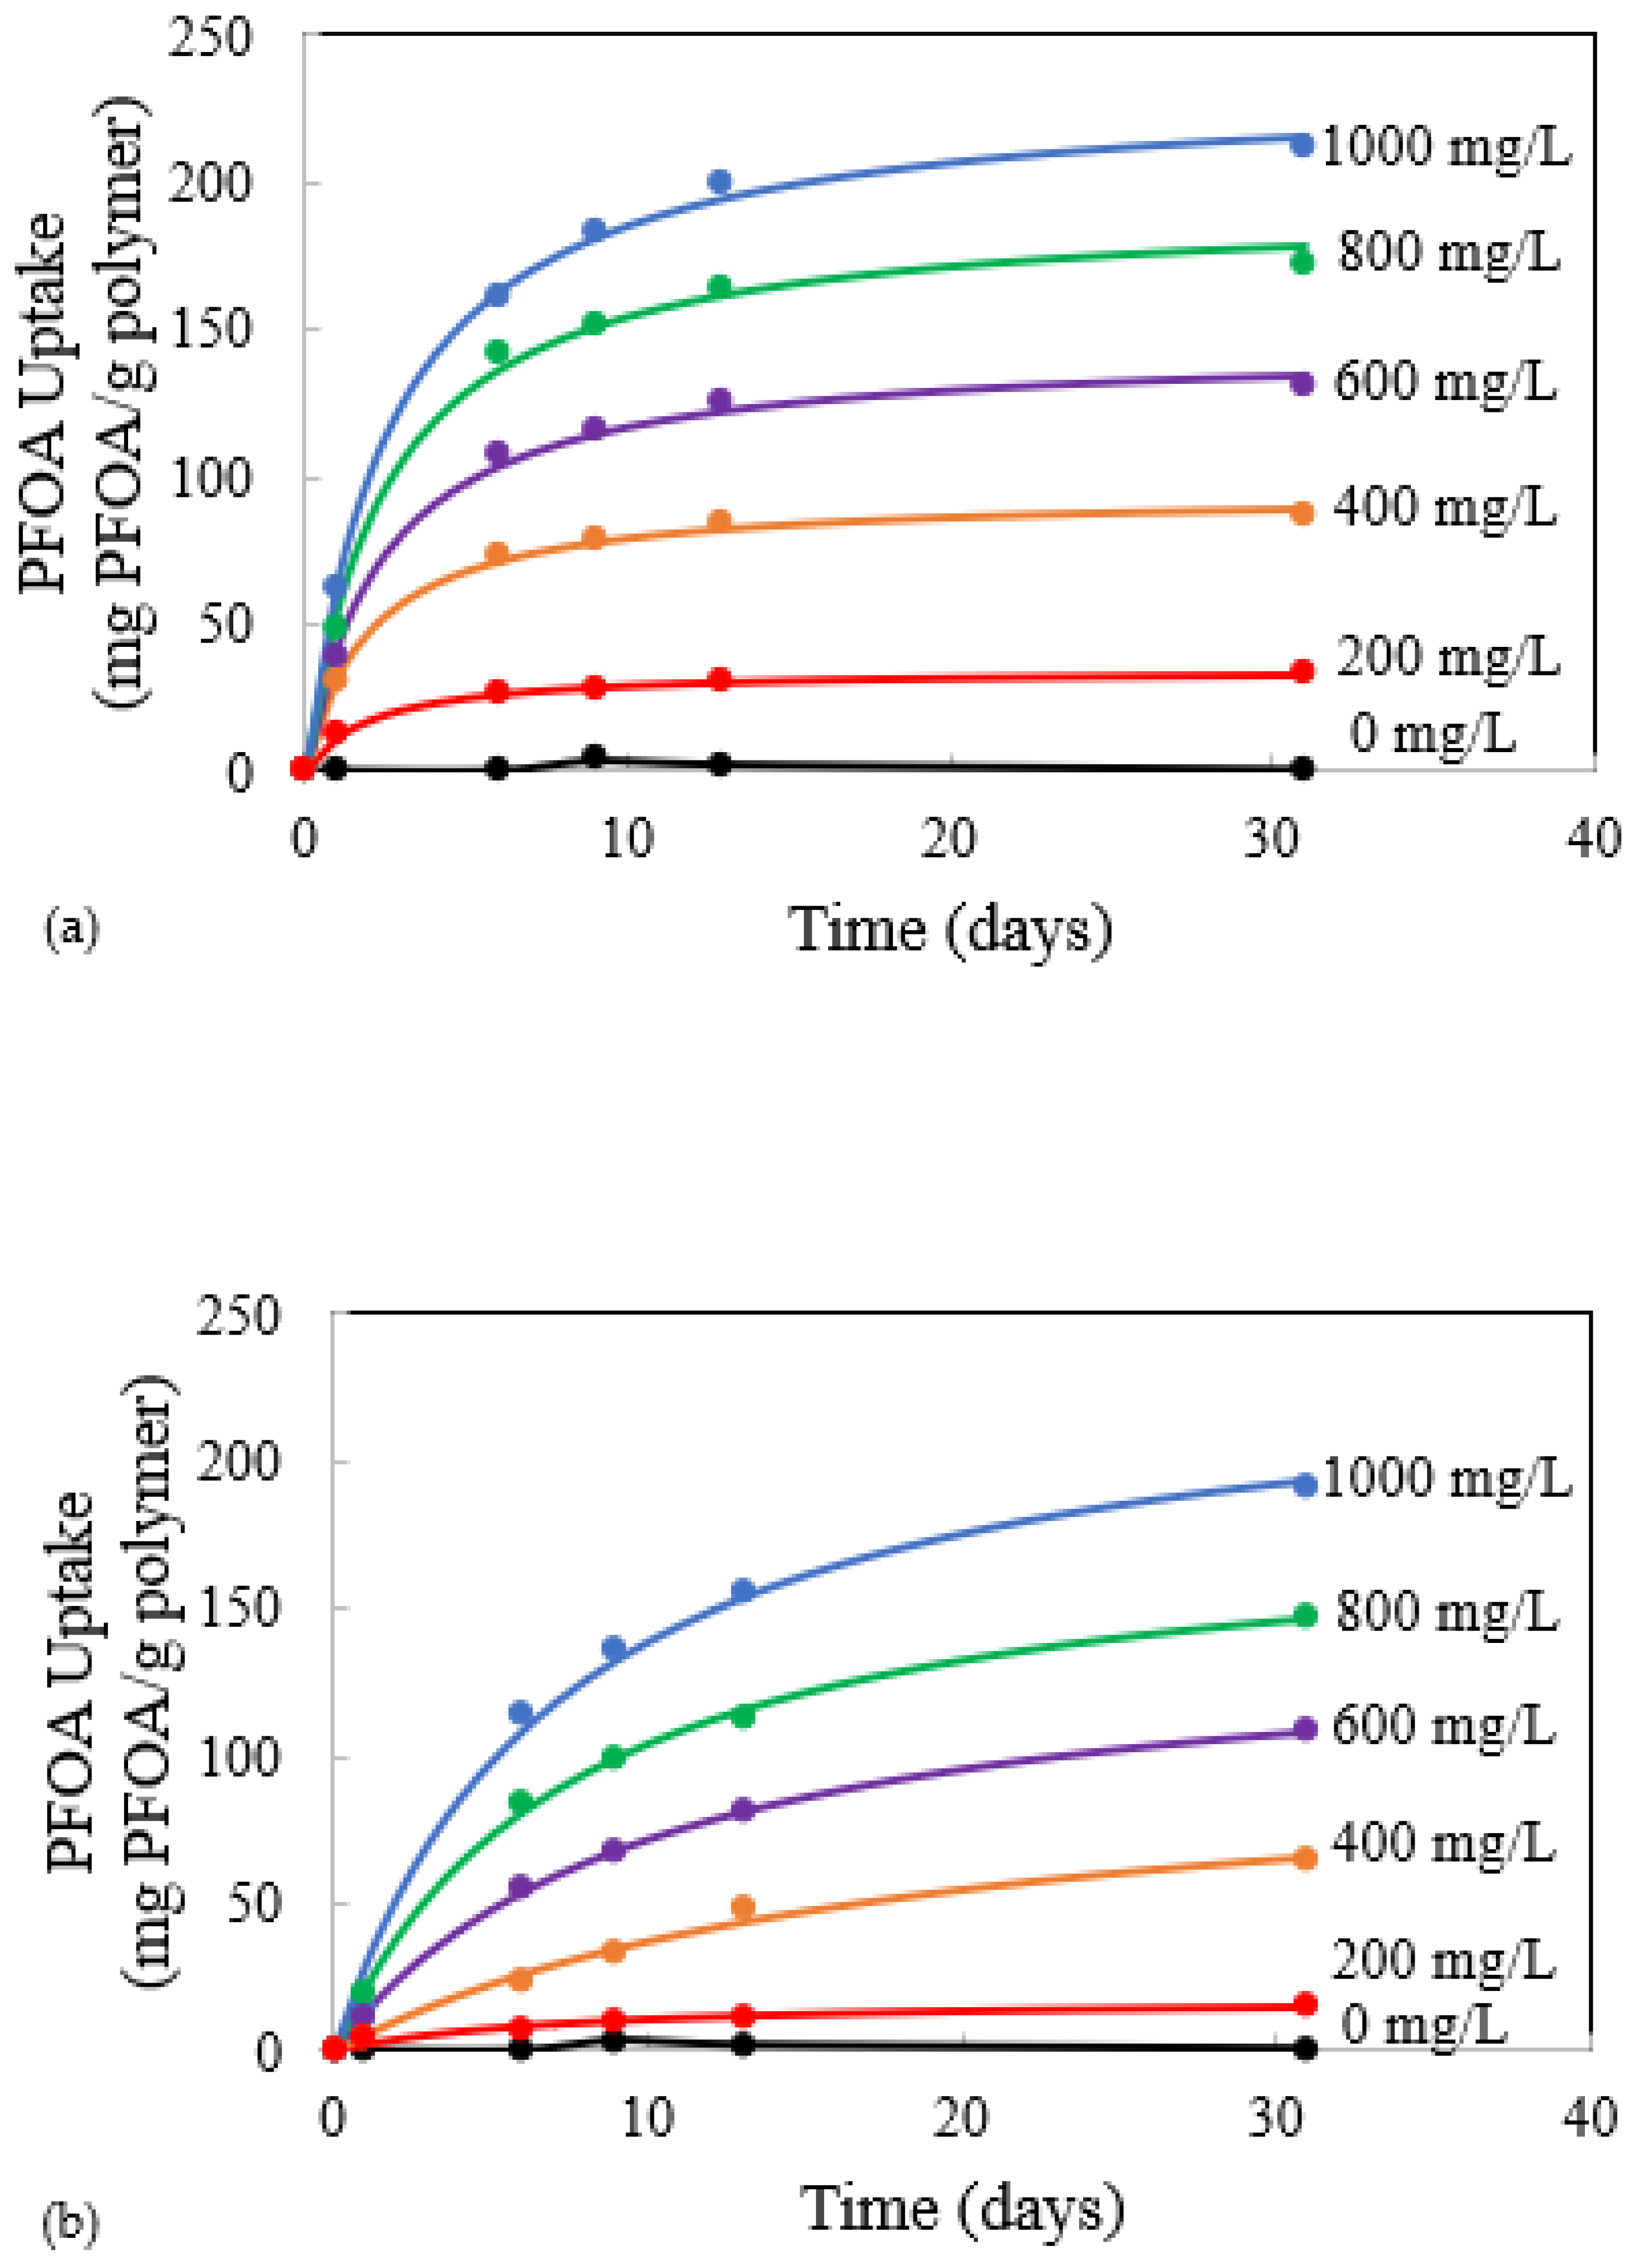
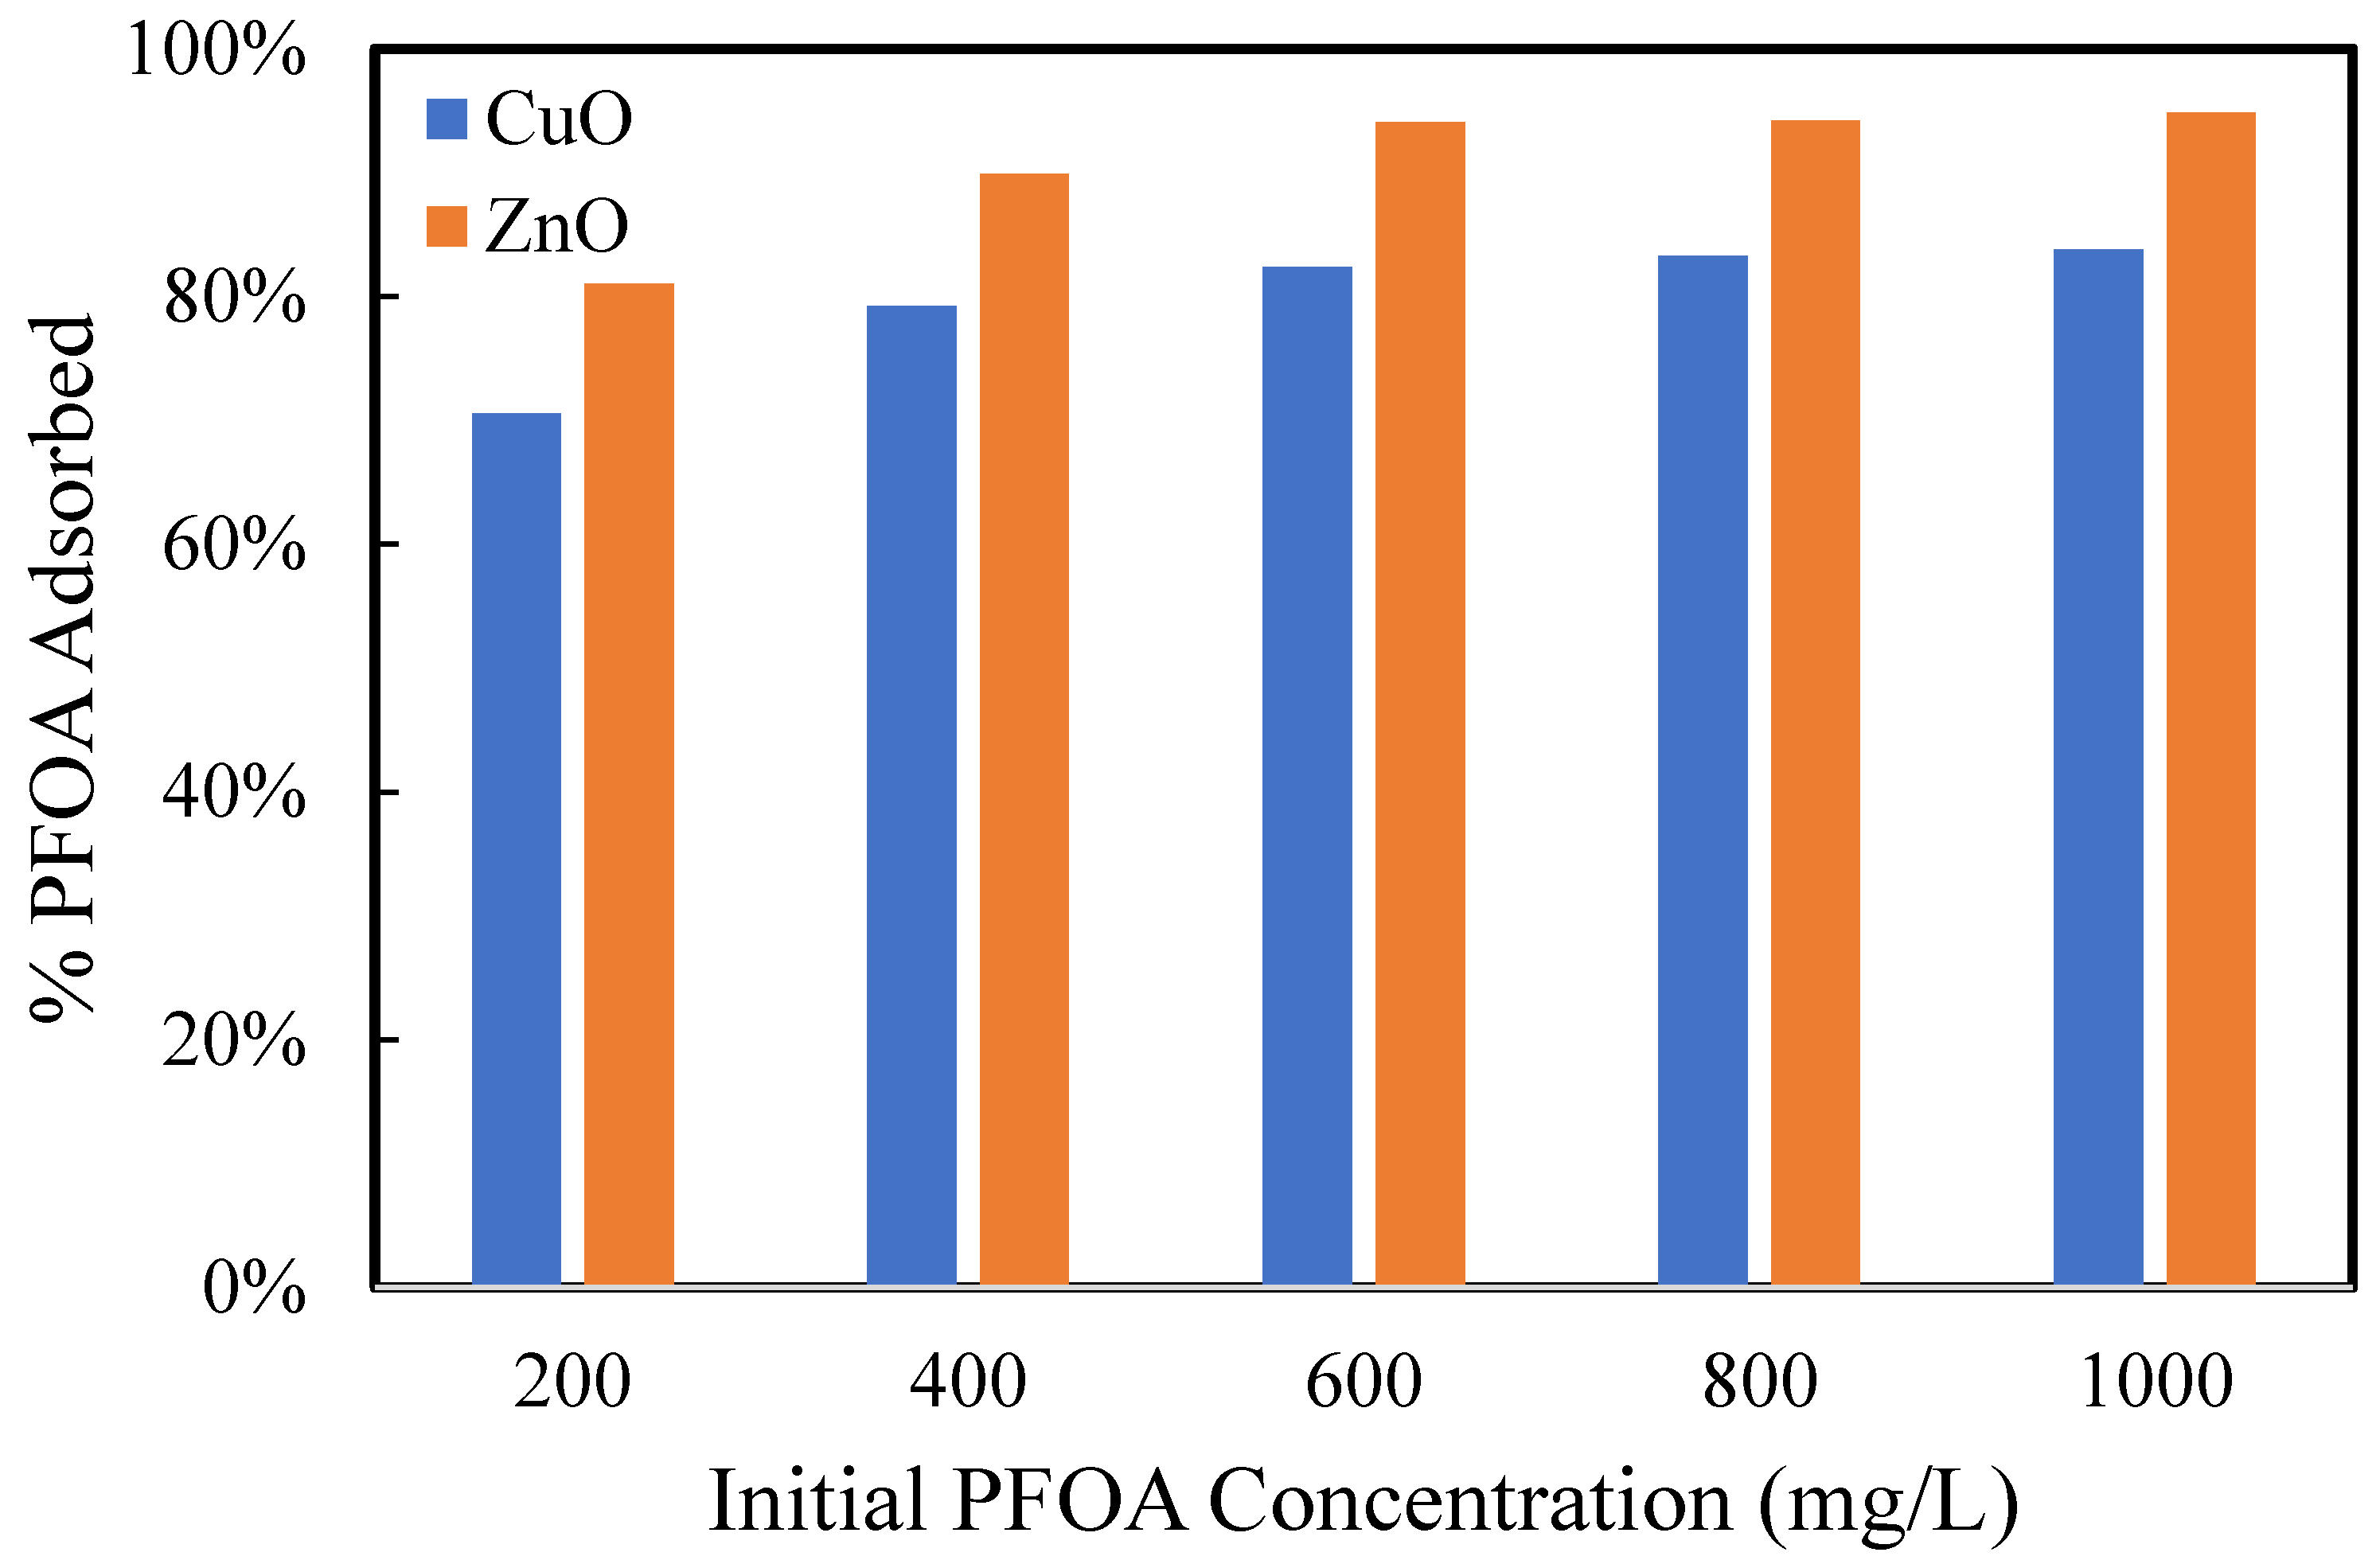
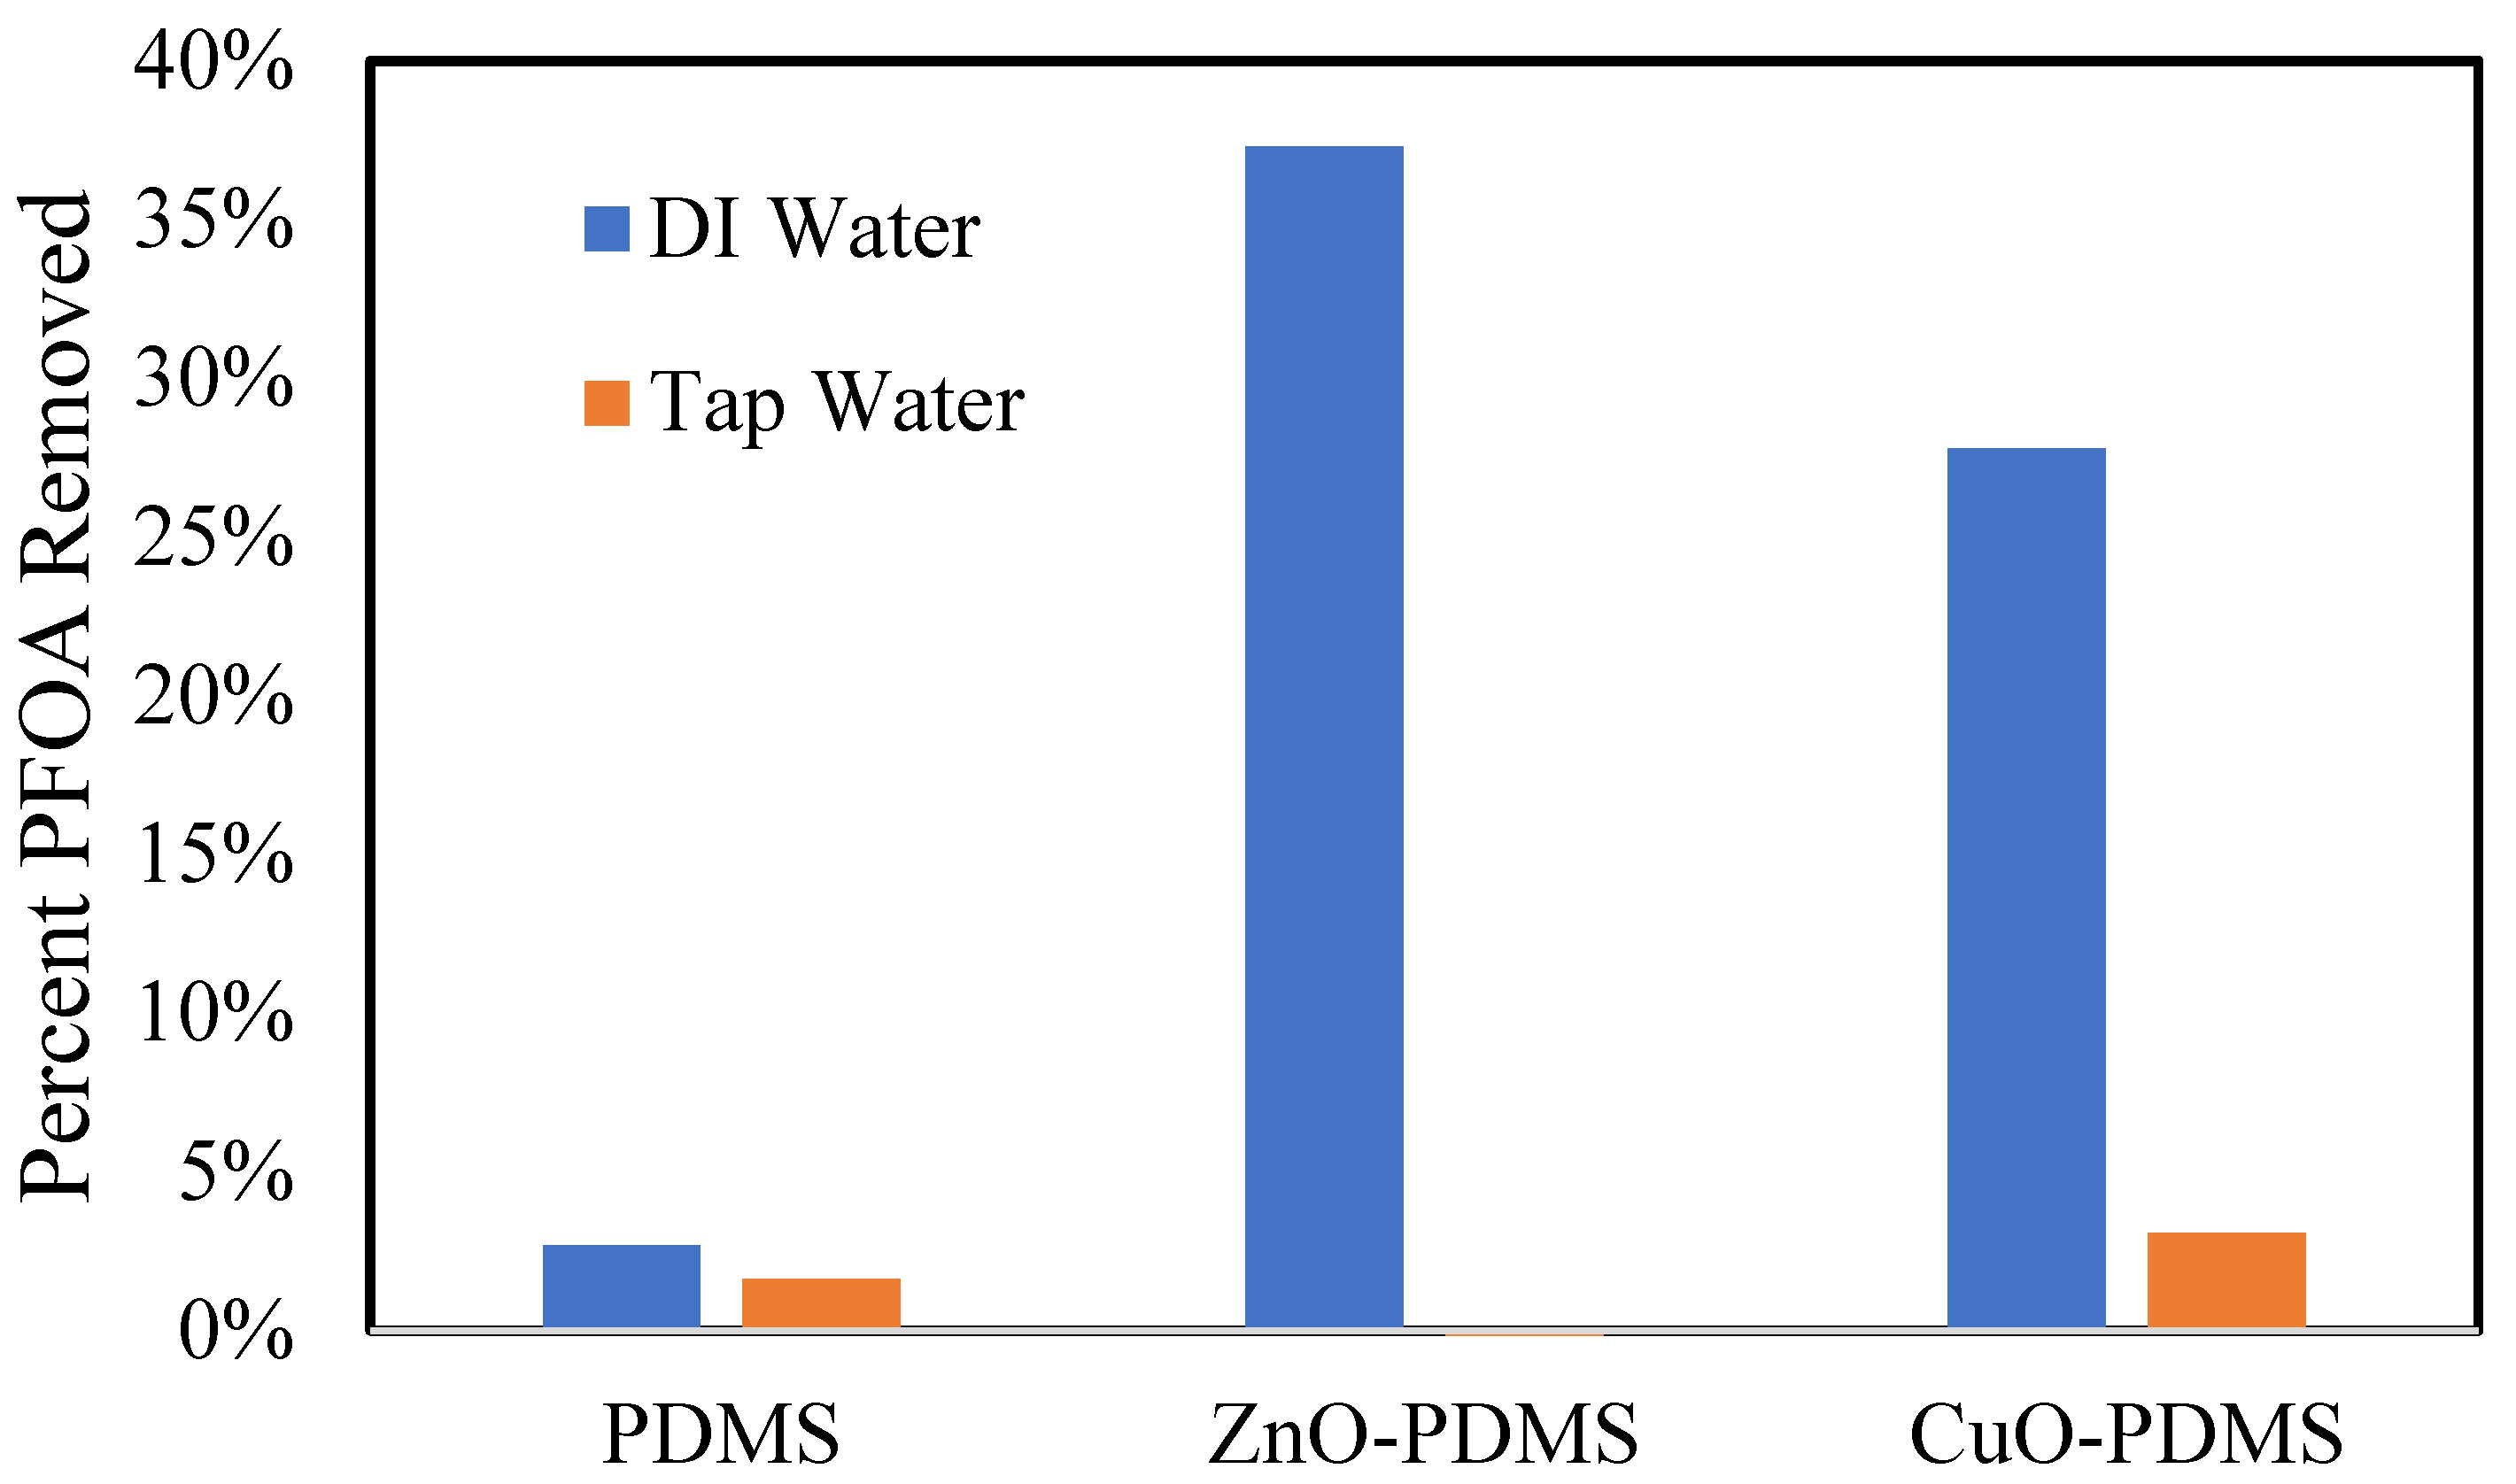
3.3. Absorption of PFOA in PDMS Membranes with and without Imbedded Particles

The absorption, or uptake, of PFOA in PDMS with and without imbedded particles was investigated using samples of membranes (~0.10 g and 1 mm thickness) in solutions of PFOA in deionized water. The concentrations of PFOA in the solutions were measured as a function of time over several days. Figure 4 shows the results of selected experimental trials with membranes containing several different imbedded particles. The results from other screening trials are provided in the Supplementary Files. ZnO and CuO imbedded in PDMS significantly enhanced the uptake or absorption of PFOA from deionized water solutions more than all other imbedded particles investigated in this study. This result was surprising, but it is likely due to the ionic interactions between ZnO and CuO in the PDMS and the carboxyl group on PFOA. This result is supported by Lubani et al. (2022) [39] and Segovia, et al. (2011) [40] who also reported on the ionic interactions between ZnO and carboxyl groups.
The absorption of PFOA in ZnO-PDMS membranes and CuO-PDMS membranes from deionized water was further investigated by assessing the effects of ZnO and CuO loading in PDMS. The results are shown in Figure 5a,b. PFOA uptake increased with increasing ZnO loading up to 15 wt%, whereas there was much less difference in the PFOA uptake by membranes with CuO loadings between 5 wt% and 15 wt%.
The second-order kinetic adsorption model (Equation (6)) was fit to the experimental data in Figure 4, Figure 5 and Figure 6. The second-order kinetic constant, k2, and the equilibrium constant, qe, were model parameters that were varied to fit the experimental data to the model. The results of this modeling are represented by the solid lines in Figure 4 and Figure 5, and the model parameters for the experimental data in Figure 6a,b are summarized in Table 4.
The data summarized in Table 4 indicate that ZnO in PDMS increases the rate of uptake compared to CuO in PDMS, and that the rate of PFOA uptake decreases as the initial PFOA concentration in solution increases from 200 mg/L to 1000 mg/L. However, the ultimate uptake of PFOA into the membrane, represented by qe, is similar between ZnO-PMDS and CuO-PDMS.
To further understand the mechanism of PFOA absorption in ZnO-PDMS and CuO-PDMS membranes, a comparison was made between the uptake of PFOA by the ZnO and CuO particles. The uptake of PFOA on ZnO and CuO powders from deionized water is shown in Figure 7. In these experimental trials, the PFOA appeared to adsorb strongly to the particles. Greater than 70% of the PFOA in the initial solutions adsorbed onto the particles. Interestingly, however, the percentage of PFOA that was removed from deionized water increased with increasing PFOA concentration. This is likely due to micelle or hemi-micelle formation [41,42]. According to Shih and Wang (2013), amphiphilic compounds, such as PFOA, may adsorb onto minerals in hemi-micelles when the organic ions are present at 0.001 to 0.01 of the critical micelle concentrations. The critical micelle concentration of PFOA is around 25 mM [41].
A comparison of PFOA uptake by CuO-PDMS and ZnO-PDMS between DI water and tap water is shown in Figure 8. PFOA in tap water does not significantly absorb or adhere to the membrane samples. This was an unfortunate result. Reasons for this result are likely due to the degree of ionization of PFOA in DI water compared to tap water as well as competitive ion interactions in tap water. The PFOA anions in water may interact with each other to form micelles, or they may interact with mineral cations in tap water. There are also many other anions in tap water, including chloride (Cl), fluoride (F), and nitrates (NO3), among others, that will compete with PFOA anions for adsorption sites on and within the ZnO-PDMS and CuO-PDMS membranes.

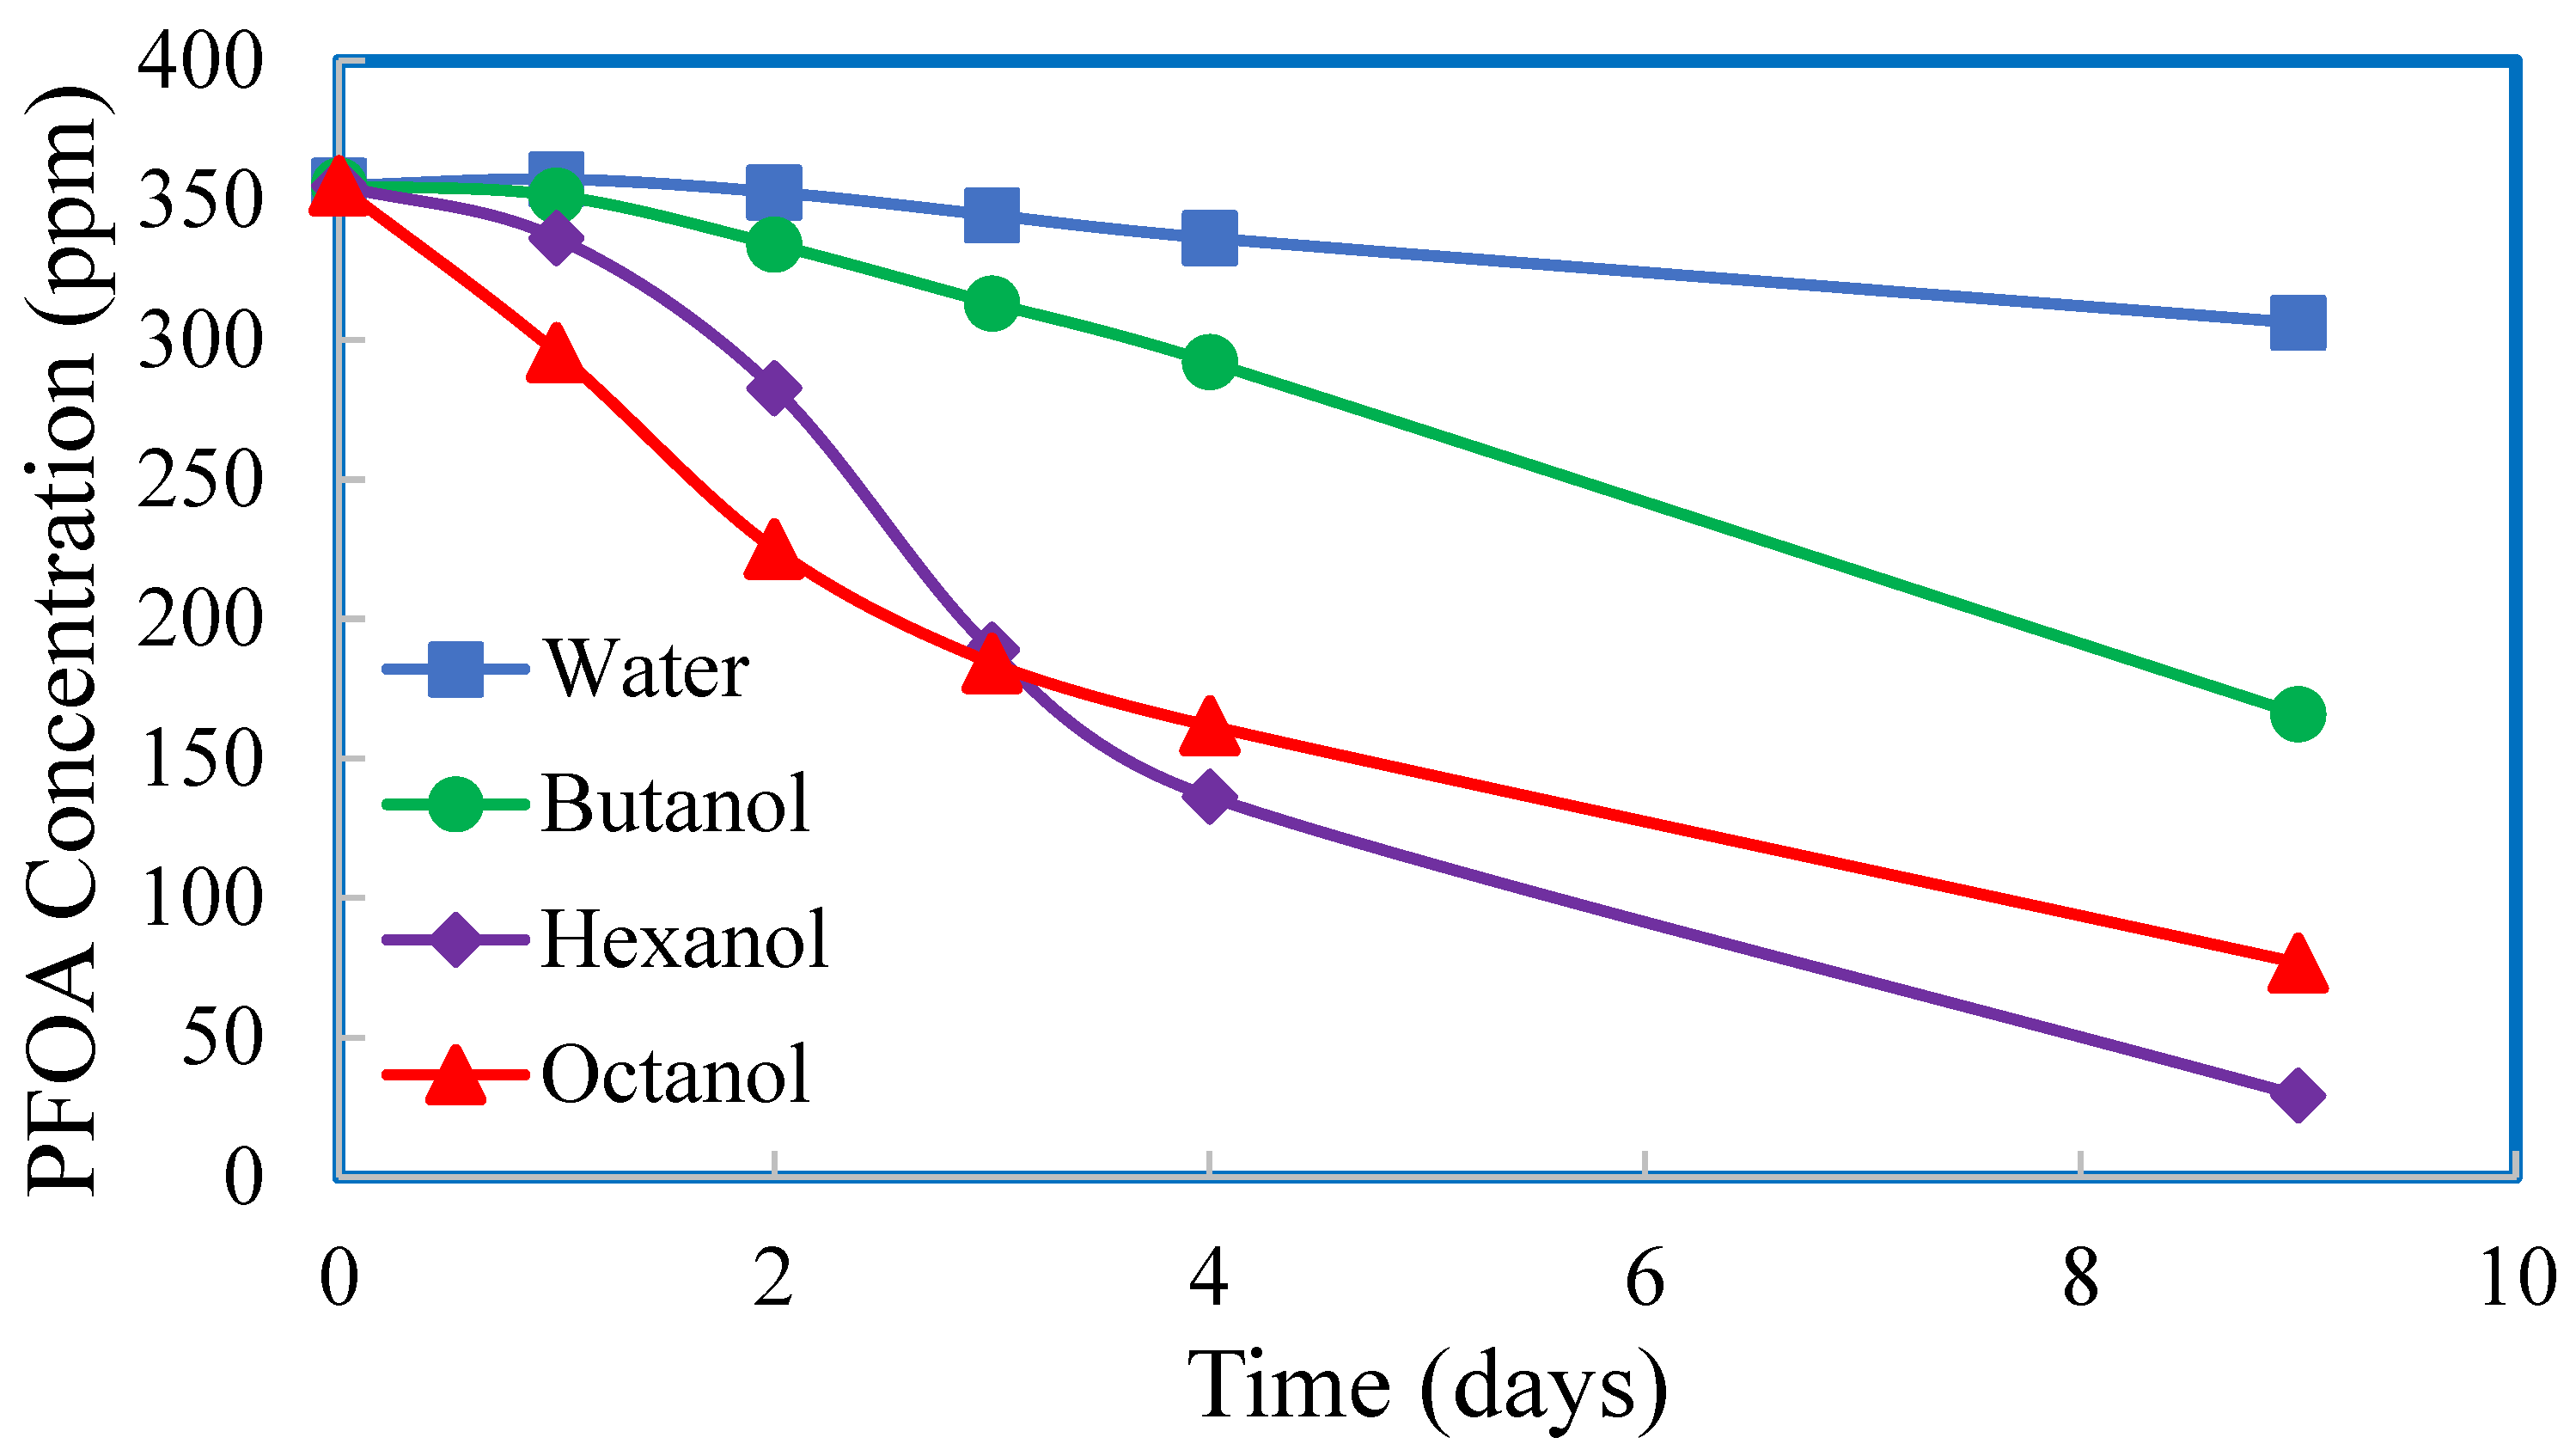
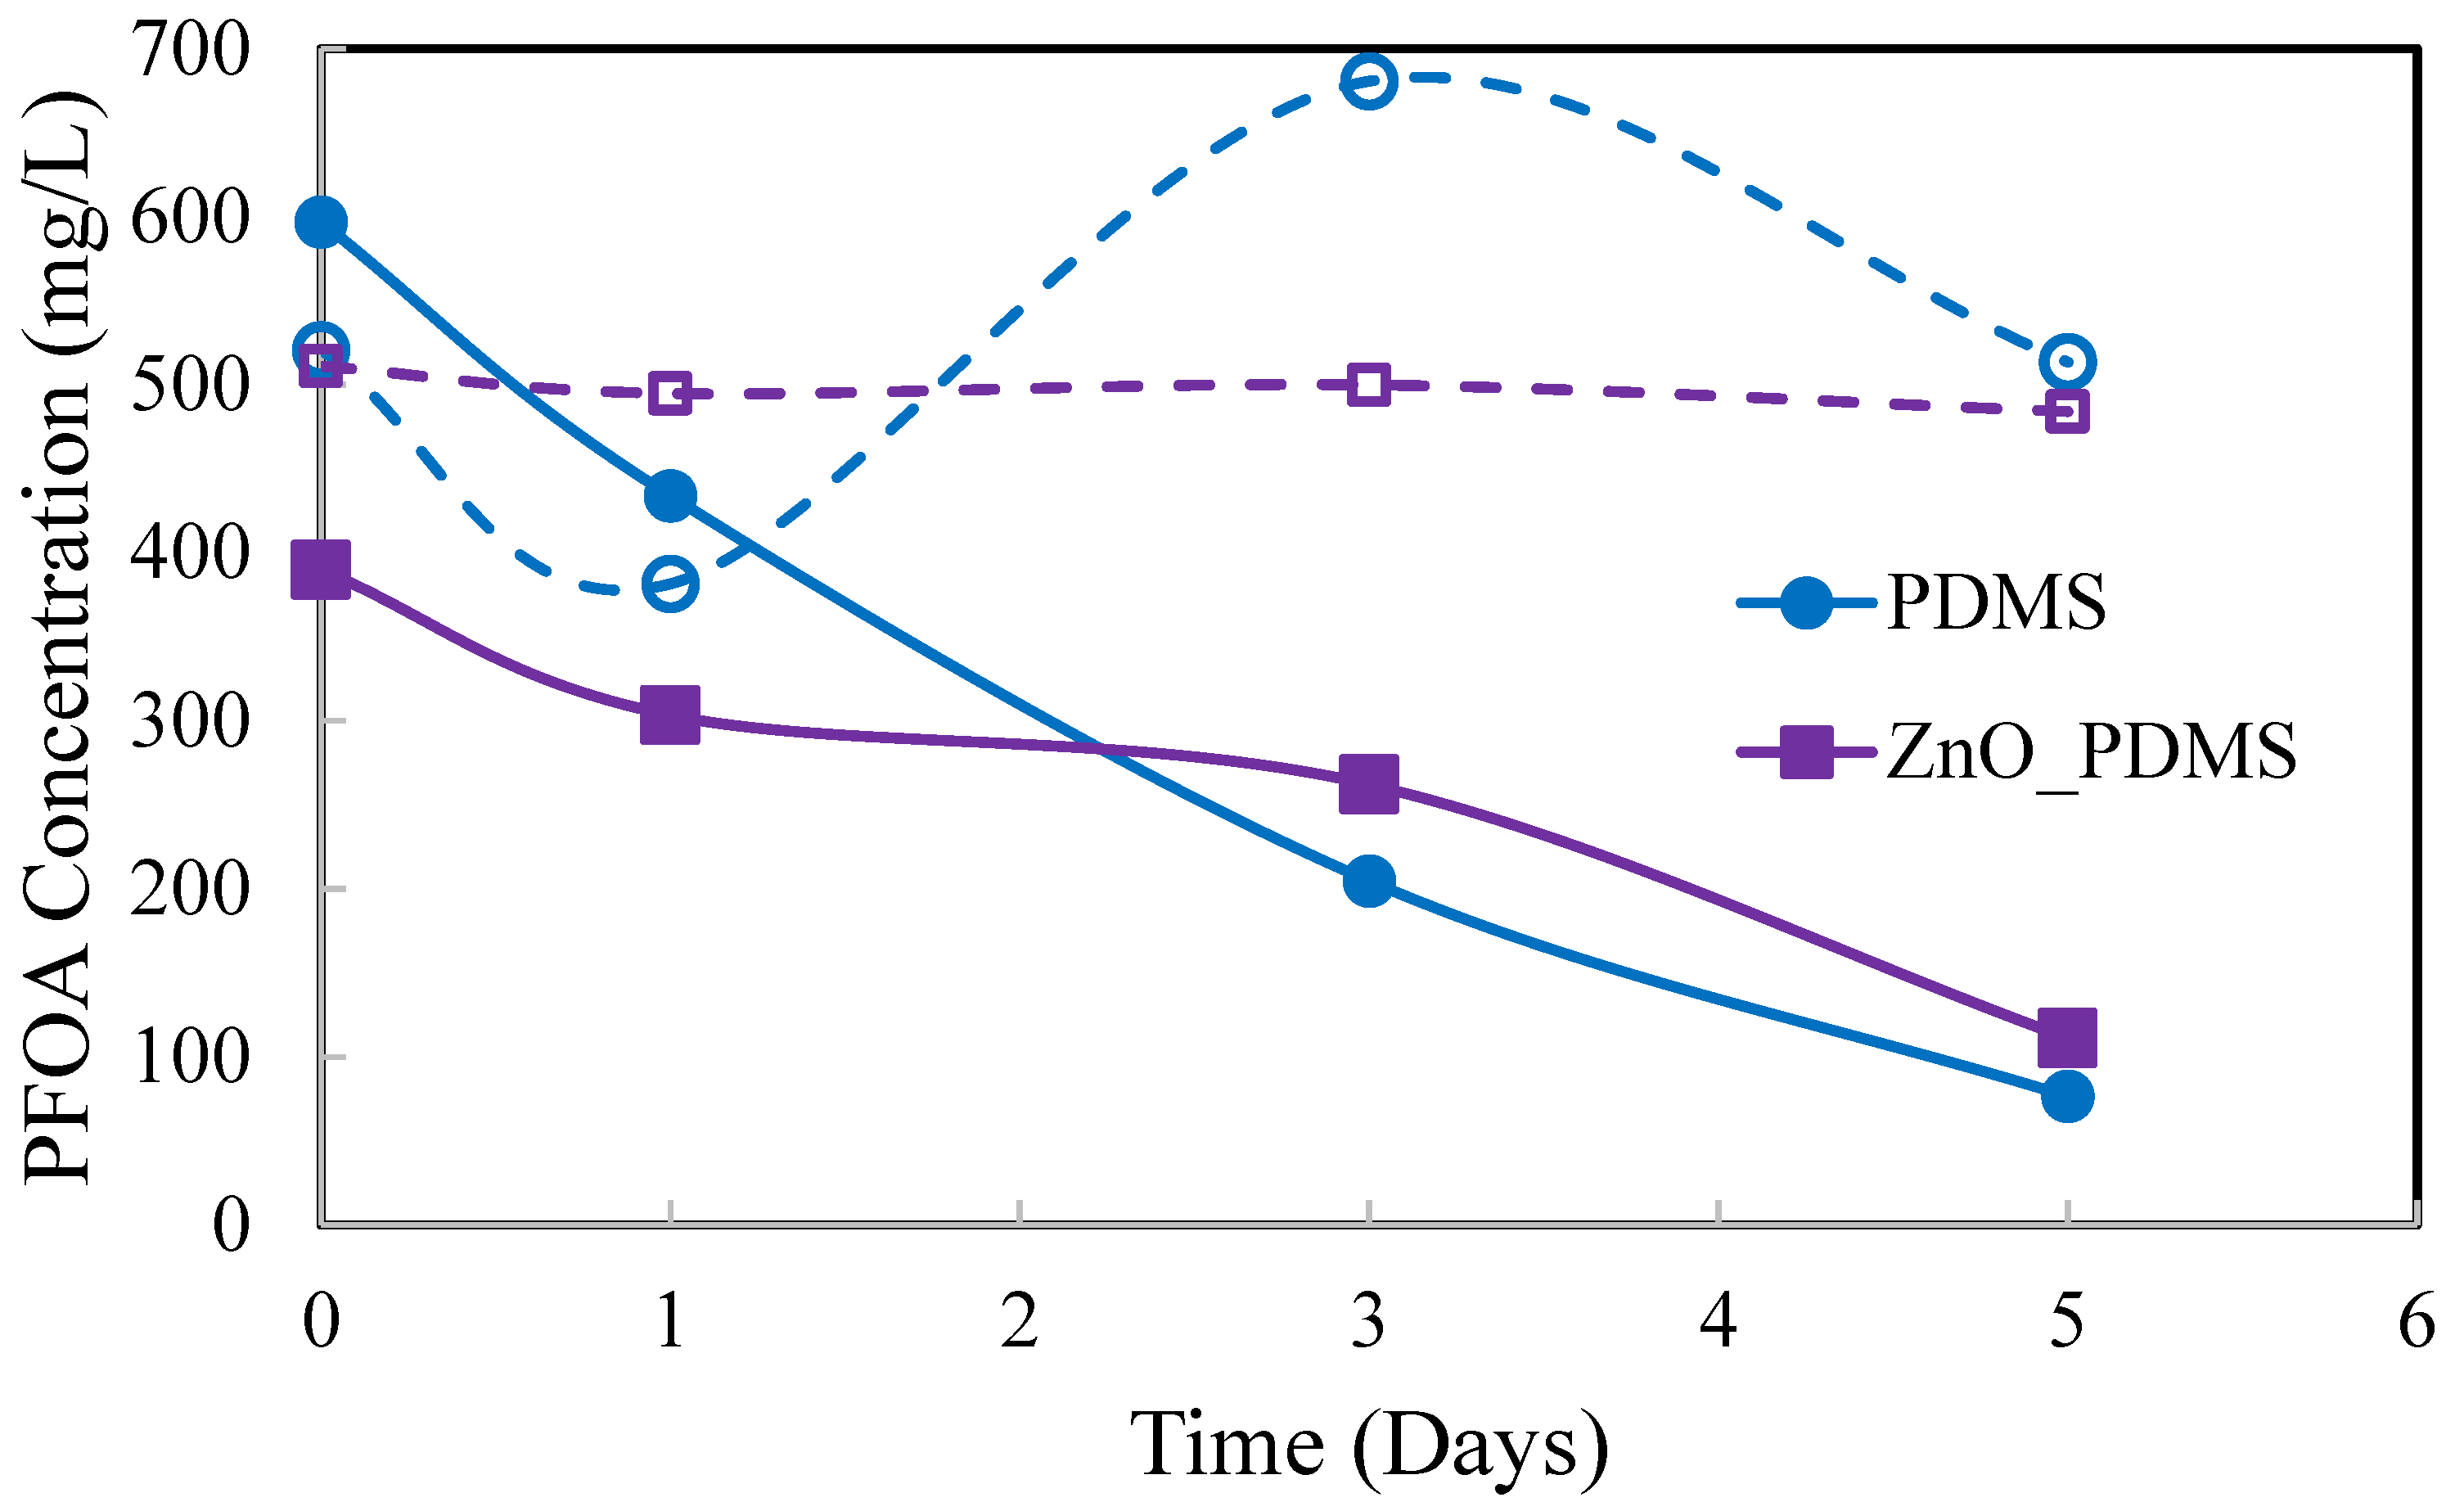
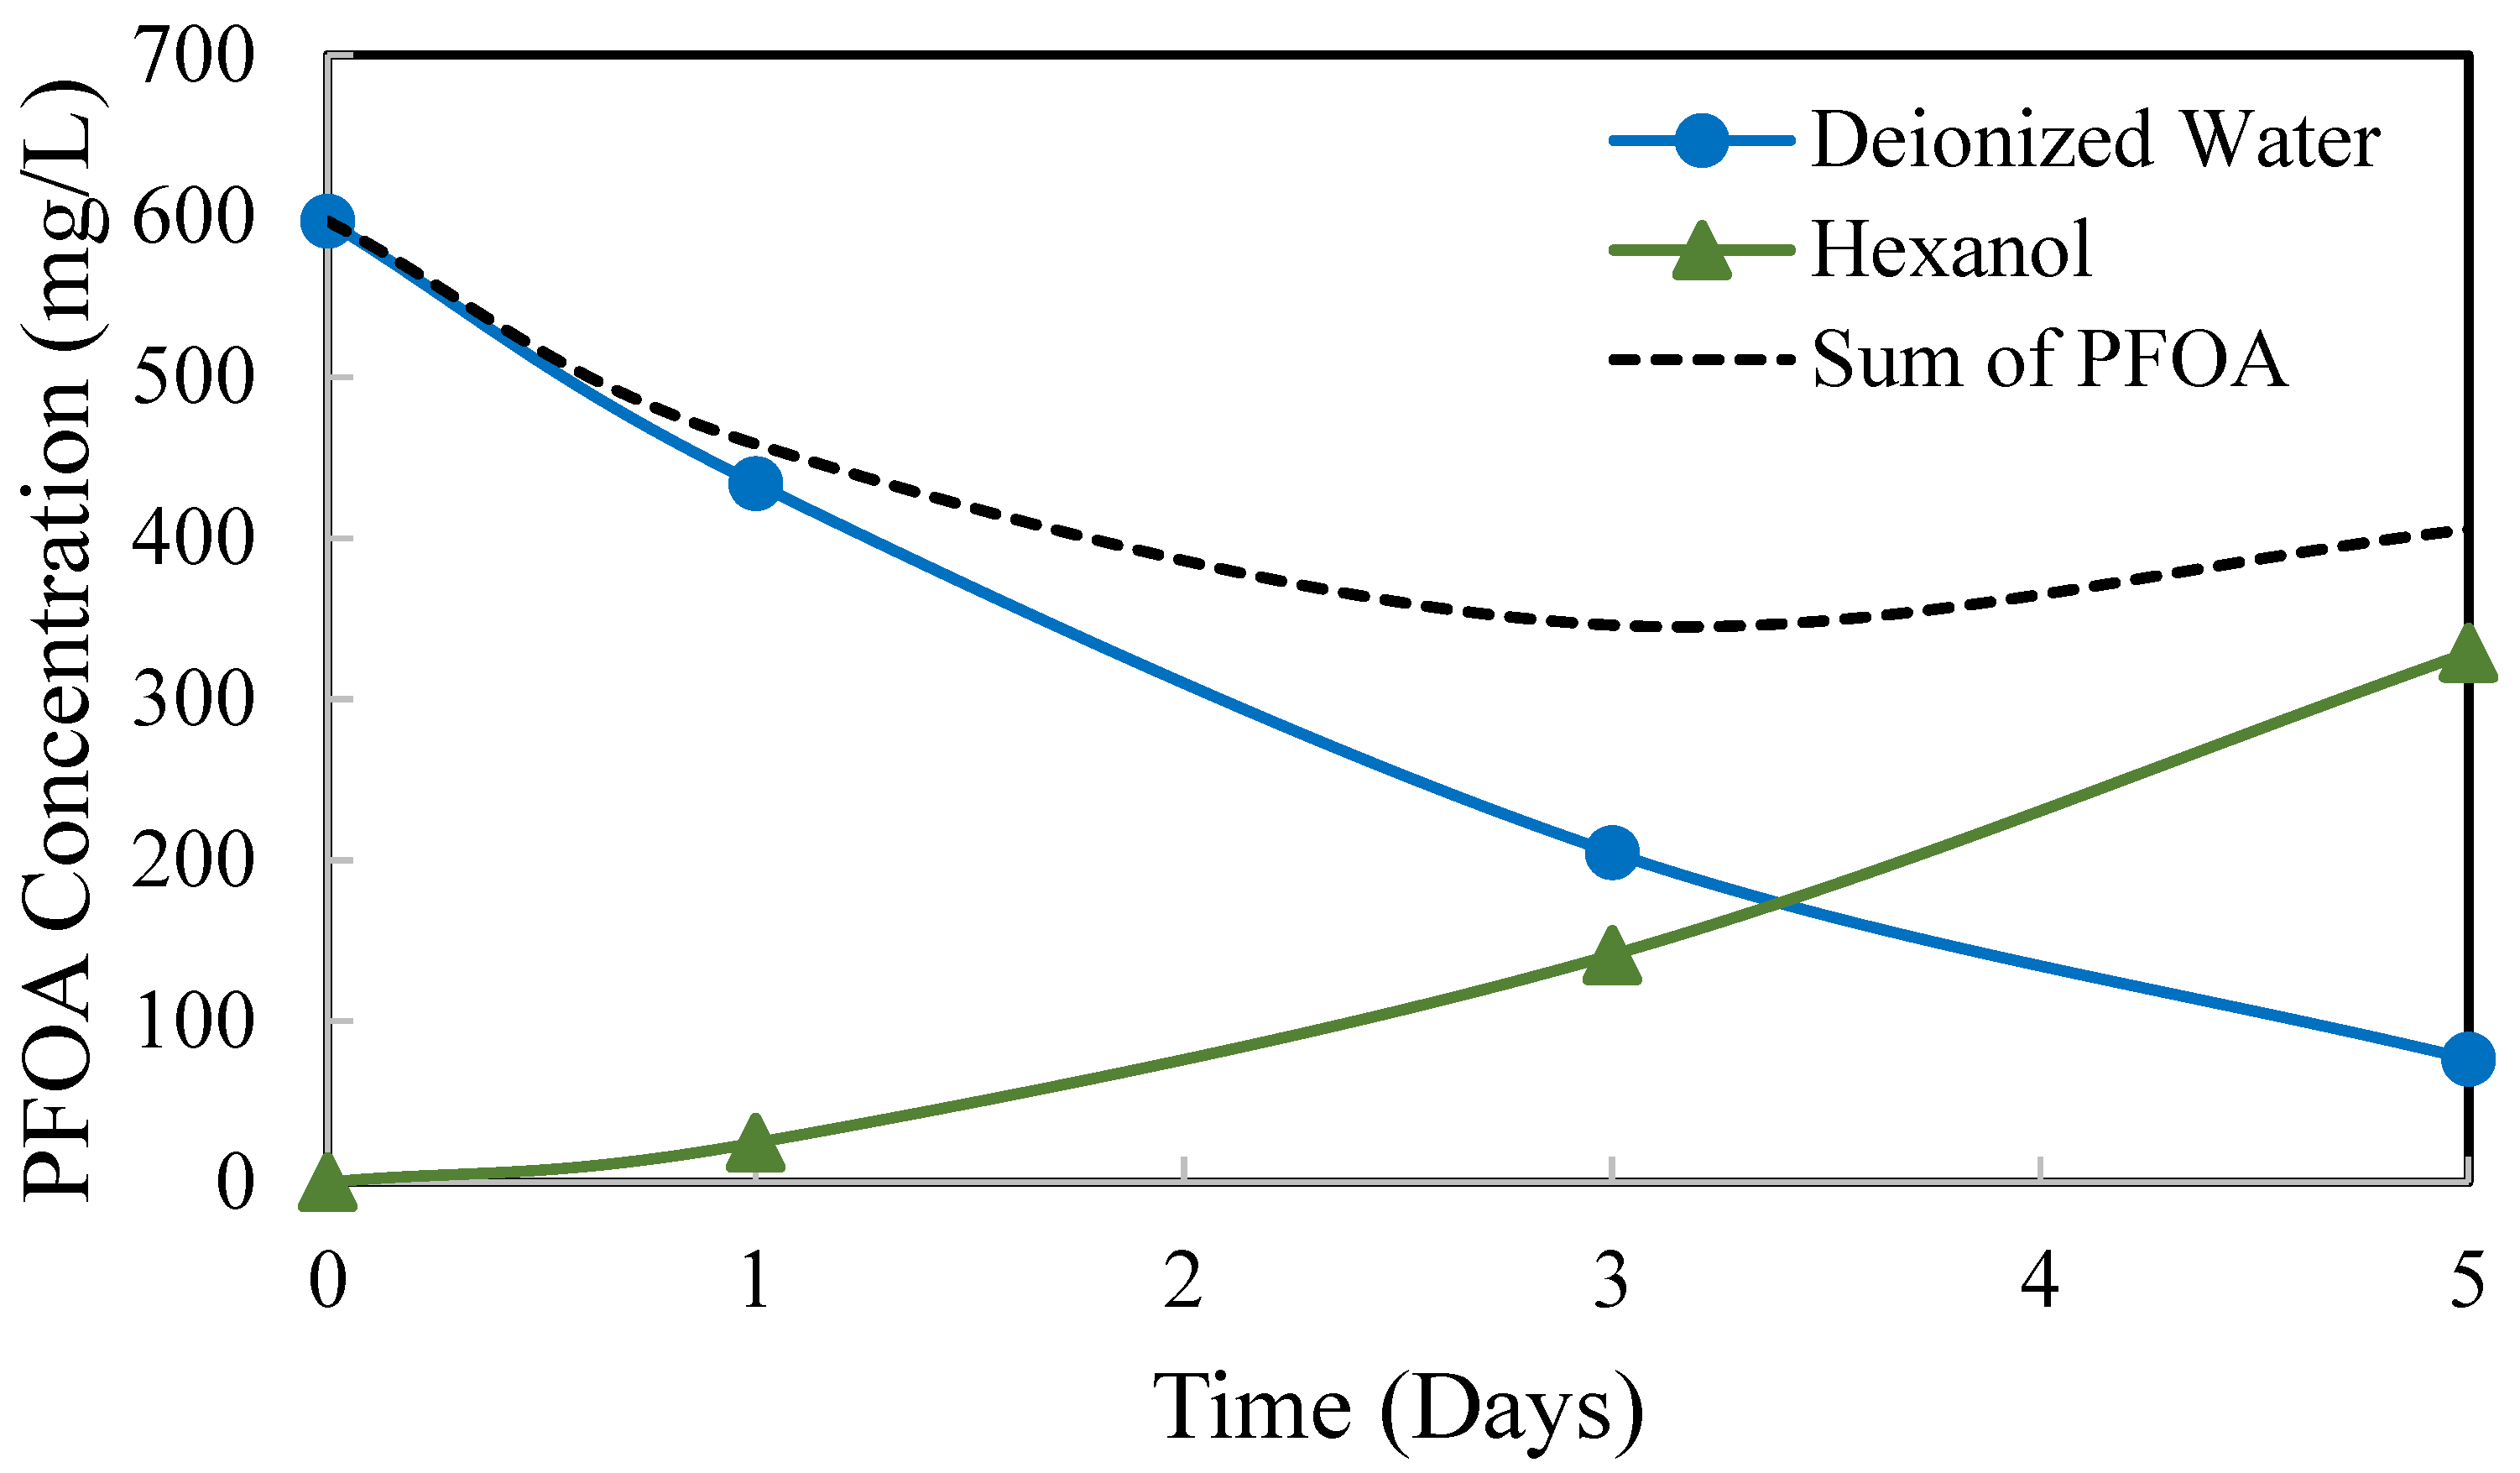
3.4. Perstraction of PFOA from Water to Solvent

The perstraction of PFOA from water to solvent was investigated using four identical test systems, as shown in Figure 2. Initially, PFOA (1000 mg/L in DI water) was placed in the left-hand side of each test system and pure deionized water was placed in the right-hand side. The membranes used included PDMS, 0.05 ZnO-PDMS, 0.15 ZnO-PDMS, and 0.05 CuO-PDMS membranes. The results are shown in Figure 9a,b.
As shown in Figure 9a,b, the rate at which PFOA was removed from the water on the left-hand-side was significantly increased by the presence of ZnO-PDMS and CuO-PDMS compared to PDMS membranes. However, PFOA passed through the PDMS membrane, as indicated by the increasing PFOA concentration on the right-hand side of the test system (open symbols). PFOA did not pass through the ZnO-PDMS or CuO-PDMS membranes. PFOA must have been strongly adsorbed onto the ZnO and CuO particles contained with the ZnO-PDMS and CuO-PDMS membranes.
Another trial was conducted with PDMS membranes (no imbedded particles) to assess the effect of solvent. The left-hand side of the membrane test systems contained PFOA at approximately 350 mg/L in DI water, while the solvents varied on the right-hand side of the test system (DI water, 1-butanol, 1-hexanol, and 1-octanol). The results, shown in Figure 10, show that after 9 days, PFOA was perstracted into all four of the solvents, and that 1-hexanol and 1-octanol appeared to have more success than 1-butanol or DI water as perstraction solvents. The differences in the PFOA concentration profiles with time may be due to the combined effects of differences in solvent permeation rates through the PDMS membranes, differences in the solubilities of the solvents in water, and the differences in partition coefficients of PFOA between solvent and water. All of these may impact the driving force for the mass transport of PFOA through the solvent-swollen PDMS membrane. For this experimental trial, NMR analyses of the solvents on the RHS of the test systems, after 9 days of contact, showed qualitative evidence that PFOA was perstracted from water to the solvents. Quantitative data were not obtained, however, for PFOA in the solvents for this data set.
Based upon the results in Figure 10, 1-hexanol was used as the solvent for the final experimental trial. A comparison of PDMS and ZnO-PDMS membranes and a comparison of perstraction of PFOA from DI water and from tap water into 1-hexanol were investigated. The PFOA concentrations in the aqueous phases as a function of time are shown in Figure 11.
Perstraction of PFOA from tap water into 1-hexanol through a PDMS or ZnO-PDMS membrane was not successful. While there was significant data scatter for the PFOA concentrations in tap water with time using NMR analyses, there was no evidence of PFOA removal from the tap water. This is indicated by the dashed lines in Figure 11 having relatively constant (on average) PFOA concentrations with time. In addition, there was no evidence of PFOA in the corresponding 1-hexanol solutions per NMR analyses.
PFOA concentrations decreased with time in both DI water solutions. The differences in the PFOA concentrations in DI water with time may have been due to experimental error or due to the influence of the ZnO particles in PDMS on mass transport of PFOA into the solvent-swollen PDMS membranes. However, evidence of PFOA in 1-hexanol was obtained only for the test system that contained PFOA in DI water and with the PDMS membrane. There was no evidence of PFOA in 1-hexanol corresponding to the test system with the ZnO-PDMS membrane. This data suggests that the PFOA strongly adheres to the ZnO in ZnO-PMDS membranes.
The perstraction process was demonstrated for removing PFOA from DI water into 1-hexanol through a PDMS membrane. The PFOA concentrations in the deionized water (blue markers and line) and in the corresponding 1-hexanol (green markers and line) were recorded with time. These data are shown graphically in Figure 12. The sum of PFOA in the water and in the solvent is shown by the black dashed line. More than 70% of the PFOA was accounted for in the two solutions. The balance of the PFOA is presumably held up within the solvent-swelled PDMS.

4. Discussion

Perstraction was demonstrated as a process by which PFOA can be removed from water. 1-butanol, 1-hexanol, and 1-octanol are possible solvents for this process. Approximately 80% of the initial PFOA was removed from DI water and was transferred across a PDMS membrane into 1-hexanol over 5 days. However, the process was demonstrated only when the PFOA solution was in DI water and the membrane was PDMS without imbedded particles. The process appears to be dominated by hydrophobic interactions between the protonated or neutral form of PFOA, PDMS, and solvent.
The rate and extent of PFOA removal from DI water by PDMS was significantly enhanced when ZnO and CuO were imbedded in PDMS. However, surprisingly, the PFOA was not extracted through the membrane by DI water (Figure 9b) or by 1-hexanol (discussion of Figure 11) when the PDMS membrane contained imbedded ZnO or CuO. This suggests that PFOA strongly adhered to the ZnO and CuO particles within the PDMS membranes.
PFOA was not effectively removed from tap water by perstraction. PFOA was predominantly in its ionized form at the pH of tap water. The ionized form of PFOA will tend to stay with the water as opposed to absorb into PDMS. Possibly, PFOA, in its ionized form, forms micelles, which would decrease access to the hydrophobic end of PFOA and reduce its interaction with PDMS. In addition, the high concentrations of minerals and other ions in tap water may compete with PFOA anions for ionic interactions within the aqueous phase and within the ZnO-PDMS and CuO-PDMS membranes.
While the application of perstraction to the removal of PFOA from water has limitations, the research generated new and interesting data regarding the interaction of PFOA with PDMS and PDMS imbedded with ZnO and CuO particles. The degree of ionization of PFOA must be considered when developing processes to remove PFOA from water.
NMR proved to be a valuable tool for both qualitative and quantitative analyses of PFOA in both water and solvents.
The authors look forward to this work leading to innovative ideas that may include, for example, innovative sampling, extraction, and analytical methods for PFOA and other perfluorinated compounds.

Supplementary Materials

The following supporting information can be downloaded at: https://www.mdpi.com/article/10.3390/pr11010217/s1, Supplementary, Figures S1–S7. Figure S1. NMR analyses of PFOA. Based upon article [1]. Figure S2. Calibration curve for PFOA using NMR and an internal standard, trifluoroacetic acid. Calibration curve for PFOA in aqueous samples. Figure S3. PFOA standard calibration curve for PFOA concentrations up to 1000 ppm using NMR. Figure S4. PFOA calibration curve for hexanol samples using NMR. Figure S5. Calibration curve for PFOA in DI water using conductivity. Figure S6. Calibration curve for PFOA in DI water using UV-Vis Spectrometry at 210 nm. Figure S7. PFOA calibration curve in DI water using pH. Reference [43] are cited in the supplementary materials.

Author Contributions

Conceptualization, C.B.A.; methodology, C.B.A., L.G., M.F., A.C., R.A., S.C. and C.M.; validation, C.B.A. and L.G.; formal analysis, C.B.A., L.G., M.F., R.A., S.C. and C.M.; investigation, C.B.A., L.G., M.F., A.C., R.A., S.C. and C.M.; resources, C.B.A.; data curation, C.B.A., L.G., M.F., R.A., S.C. and C.M.; writing—original draft preparation, C.B.A., R.A., S.C. and C.M.; writing—review and editing, C.B.A.; visualization, C.B.A., L.G., M.F., R.A., S.C. and C.M.; supervision, C.B.A.; project administration, C.B.A.; funding acquisition, C.B.A. All authors have read and agreed to the published version of the manuscript.

Funding

This article was developed under Assistance Agreement No. SV-840161 awarded by the U.S. Environmental Protection Agency to Miami University. It has not been formally reviewed by the US EPA. The views expressed in this document are solely those of the authors of this article and do not necessarily reflect those of the agency. EPA does not endorse any products or commercial services mentioned in this publication.

Data Availability Statement

All supporting data for this manuscript that are not contained within the Supplementary Materials are available upon request to the corresponding author.

Acknowledgments

The authors acknowledge Jayson Alexander of Miami’s instrument lab, who machined the membrane test systems; Doug Hart, who assisted us in the fabrication of preliminary test systems and for leveling the vacuum oven, which helped us prepare membranes with uniform thickness; and Neil Danielson, who suggested UV–Vis spectrometry and NMR as analytical tools for PFOA analyses.

Conflicts of Interest

The authors declare no conflict of interest.

References

  1. EPA. Actions to Address PFAS|US EPA. Available online: https://www.epa.gov/pfas/epa-actions-address-pfas#:~:text=In%20May%202022%2C%20EPA%20took,or%20remediation%20activities%20are%20needed (accessed on 30 November 2022).
  2. Buck, R.C.; Franklin, J.; Berger, U.; Conder, J.M.; Cousins, I.T.; de Voogt, P.; Jensen, A.A.; Kannan, K.; Mabury, S.A.; van Leeuwenkk, S.P.J. Perfluoroalkyl and polyfluoroalkyl substances in the environment: Terminology, classification, and origins. Integr. Environ. Assess. Manag. 2008, 7, 513–541. [Google Scholar] [CrossRef]
  3. Lange, F.T.; Schmidt, C.; Brauch, H.-J. Perfluoroalkylcarboxylates and Sulfonates: Emerging Contaminants for Drinking Water Supplies? Association of River Waterworks—RIWA: Cranston, RI, USA, 2006; ISBN-10: 90-6683-116-2; ISBN-13: 978-90-6683-116-2; Available online: https://www.riwa-rijn.org/wp-content/uploads/2015/05/137_ptfe_report.pdf (accessed on 21 December 2022).
  4. Bartel, C.M. Occurrence and Distribution of Perfluorinated Surfactants in Groundwater Contaminated by Fire-Fighting Activity. Ph.D. Thesis, Oregon State University, Corvallis, OR, USA, 23 November 1999. Available online: https://www.proquest.com/docview/275713653?pq-origsite=gscholar&fromopenview=true (accessed on 21 December 2022).
  5. Post, G.B.; Cohn, P.D.; Cooper, K.R. Perfluorooctanoic acid (PFOA), an emerging drinking water contaminant: A critical review of recent literature. Environ. Res. 2012, 116, 93–117. [Google Scholar] [CrossRef] [PubMed]
  6. Houde, M.; Martin, J.W.; Letcher, R.J.; Solomon, K.R.; Muir, D.G. Biological monitoring of polyfluoroalkyl substances: A review. Environ. Sci. Technol. 2006, 40, 3463–3473. [Google Scholar] [CrossRef] [PubMed]
  7. Armitage, J.M.; Macleod, M.; Cousins, I.T. Comparative assessment of the global fate and transport of long-chain perfluorocarboxylic acids (PFCAs) and perfluorocarboxylates (PFCs) emitted from direct sources. Environ. Sci. Technol. 2009, 43, 5830–5836. [Google Scholar] [CrossRef] [PubMed]
  8. Muller, C.E.; Gerecke, A.C.; Bogdal, C.; Wang, Z.; Scheringer, M.; Hungerbuhler, K. Atmospheric fate of poly- and perfluorinated alkyl substances (PFCSs): I. Day-night patterns of air concentrations in summer in Zurich, Switzerland. Environ. Pollut. 2012, 169, 196–203. [Google Scholar] [CrossRef]
  9. Rayne, S.; Forest, K. Modeling the hydrolysis of perfluorinated compounds containing carboxylic and phosphoric acid ester functions and sulfonamide groups. J. Environ. Sci. Health Part A 2010, 45, 432–446. [Google Scholar] [CrossRef]
  10. Vecitis, C.D.; Park, H.; Cheng, J.; Mader, B.T.; Hoffmann, M.R. Treatment technologies for aqueous perfluorooctanesulfonate (PFOS) and perfluorooctanoate (PFOA). Environ. Sci. Eng. China 2009, 3, 129–151. [Google Scholar] [CrossRef]
  11. Available online: http://www.fluoridealert.org/pesticides/2005/effect.pfos.class.news.147.html (accessed on 30 November 2022).
  12. Merino, N.; Qu, Y.; Deeb, R.A.; Hawley, E.L.; Hoffmann, M.R.; Mahendra, S. Degradation and removal methods for perfluoroalkyl and polyfluoroalkyl substances in water. Environ. Eng. Sci. 2016, 33, 615–649. [Google Scholar] [CrossRef] [Green Version]
  13. McNamara, J.D.; Franco, R.; Mimna, R.; Zappa, L. Comparison of activated carbons for removal of perfluorinated compounds from drinking water. J.-Am. Water Work. Assoc. 2018, 110, E2–E14. [Google Scholar] [CrossRef]
  14. Subramanian, N.H.; Manigandan, P.; Wille, A.; Radhakrishnan, G. Determination of perfluorooctanoate and perfluorooctanesulfonate in water matrices by inline matrix elimination liquid chromatography with reversed phase separation and suppressed conductivity detection. J. Chromatogr. Sci. 2011, 49, 603–609. [Google Scholar] [CrossRef]
  15. Meng, P.; Deng, S.; Du, Z.; Wang, B.; Huang, J.; Wang, Y.; Yu, G.; Xing, B. Effect of hydro-oleophobic perfluorocarbon chain on interfacial behavior and mechanism of perfluorooctane sulfonate in oil-water mixture. Sci. Rep. Mar 2017, 16, 44694. [Google Scholar] [CrossRef] [PubMed] [Green Version]
  16. EPA. Announces New Drinking Water Health Advisories for PFAS Chemicals, $1 Billion in Bipartisan Infrastructure Law Funding to Strengthen Health Protections|US EPA. Available online: https://www.epa.gov/newsreleases/epa-announces-new-drinking-water-health-advisories-pfas-chemicals-1-billion-bipartisan (accessed on 21 December 2022).
  17. Jimenez-Bonilla, P.; Wang, Y. In-situ biobutanol recovery from clostridial fermentations: A critical review. Crit. Rev. Biotechnol. 2018, 38, 469–482. [Google Scholar] [CrossRef] [PubMed]
  18. Outram, V.; Lalander, C.A.; Lee, J.G.M.; Davies, E.T.; Harvey, A.P. Applied in Situ Product Recovery in ABE Fermentation. Biotechnol. Prog. 2017, 33, 563–579. [Google Scholar] [CrossRef] [PubMed] [Green Version]
  19. Huang, H.J.; Ramaswamy, S.; Liu, Y.Y. Separation and purification of biobutanol during bioconversion of biomass. Sep. Purif. Technol. 2014, 132, 513–540. [Google Scholar] [CrossRef]
  20. Abdehagh, N.; Tezel, F.H.; Thibault, J. Separation techniques in butanol production: Challenges and developments. Biomass Bioenergy 2014, 60, 222–246. [Google Scholar] [CrossRef]
  21. Qureshi, N.; Ezeji, T.C. Butanol, ‘a superior biofuel’ production from agricultural residues (renewable biomass): Recent progress in technology. Biofuels Bioprod. Biorefining 2008, 2, 319–330. [Google Scholar] [CrossRef]
  22. Longo, R.; Blackman, J.W.; Torley, P.J.; Rogiers, S.Y.; Schmidtke, L.M. Changes in volatile composition and sensory attributes of wines during alcohol content reduction. J. Sci. Food Agric. 2017, 97, 8–16. [Google Scholar] [CrossRef]
  23. Park, C.H.; Geng, Q.H. Simultaneous fermentation and separation in the ethanol and ABE fermentation. Sep. Purif. Methods 1992, 21, 127–174. [Google Scholar] [CrossRef]
  24. Sirkar, K.K. Membrane separation technologies: Current developments. Chem. Eng. Commun. 1997, 157, 145–184. [Google Scholar] [CrossRef]
  25. Merlet, G.; Uribe, F.; Aravena, C.; Rodriguez, M.; Cabezas, R.; Quijada-Maldonado, E.; Romero, J. Separation of fermentation products from ABE mixtures by perstraction using hydrophobic ionic liquids as extractants. J. Membr. Sci. 2017, 537, 337–343. [Google Scholar] [CrossRef]
  26. Qureshi, N.; Maddox, I.S. Reduction in butanol inhibition by perstraction: Utilization of concentrated lactose/whey permeate by Clostridium acetobutylicum to enhance butanol fermentation economics. Food Bioprod. Process. 2005, 83, 43–52. [Google Scholar] [CrossRef] [Green Version]
  27. Sam, F.E.; Ma, T.Z.; Salifu, R.; Wang, J.; Jiang, Y.M.; Zhang, B.; Han, S.Y. Techniques for dealcoholization of wines: Their impact on wine phenolic composition, volatile composition, and sensory characteristics. Foods 2021, 10, 2498. [Google Scholar] [CrossRef] [PubMed]
  28. Ray, S.K.; Sawant, S.B.; Joshi, J.B.; Pangarkar, V.G. Perstraction of phenolic compounds from aqueous solution using a nonporous membrane. Sep. Sci. Technol. 1997, 32, 2669–2683. [Google Scholar] [CrossRef]
  29. Whelehan, M.; Marison, I.W. Capsular perstraction as a novel methodology for the recovery and purification of geldanamycin. Biotechnol. Prog. 2011, 27, 1068–1077. [Google Scholar] [CrossRef]
  30. Whelehan, M.; von Stockar, U.; Marison, I.W. Removal of pharmaceuticals from water: Using liquid-core microcapsules as a novel approach. Water Res. 2010, 44, 2314–2324. [Google Scholar] [CrossRef]
  31. Sylgard 184 Technical Data Sheet, Form No. 11-3184-01 C. (Dow Chemical Company, Midland, MI, USA). Available online: https://www.dow.com/content/dam/dcc/documents/en-us/productdatasheet/11/11-31/11-3184-sylgard-184-elastomer.pdf (accessed on 21 December 2022).
  32. Burns, D.C.; Ellis, D.A.; Li, H.; McMurdo, C.J.; Webster, E. Experimental pKa Determination for perfluorooctanoic acid (PFOA) and the potential impact of pKa concentration dependence on laboratory-measured partitioning phenomena and environmental modeling. Environ. Sci. Technol. 2008, 42, 9283–9288. [Google Scholar] [CrossRef]
  33. Available online: https://oxfordobserver.org/6065/community/city-council-hears-report-on-water-softening-solutions/ (accessed on 30 November 2022).
  34. Liu, J.; Zhen, X.J.; Tang, K.Y. Study on the gravimetric measurement of the swelling behaviors of polymer films. Rev. Adv. Mater. Sci. 2013, 33, 452–458. Available online: https://www.ipme.ru/e-journals/RAMS/no_53313/11_533_liu.pdf (accessed on 21 December 2022).
  35. Crank, J. The Mathematics of Diffusion; Oxford University Press: London, UK, 1956. [Google Scholar]
  36. Wang, J.; Guo, X. Adsorption kinetic models: Physical meanings, applications, and solving methods. J. Hazard. Mater. 2020, 390, 122156. [Google Scholar] [CrossRef]
  37. Wolf, M.P.; Salieb-Beugelaar, G.B.; Hunziker, P. PDMS with designer functionalities—Properties, modifications strategies, and applications. Prog. Polym. Sci. 2018, 83, 97–134. [Google Scholar] [CrossRef]
  38. Cocchi, G.; Grazia De Angelis, M.; Doghieri, F. Solubility and diffusivity of liquids for food and pharmaceutical applications in crosslinked polydimethylsiloxane (PDMS) films: I. Experimental data on pure organic components and vegetable oil. J. Membr. Sci. 2015, 492, 600–611. [Google Scholar] [CrossRef]
  39. Lubani, J.; De Angelis, F.; Meggiolaro, D.; Cartechini, L.; Fantacci, S. Modelling the interaction between carboxylic acids and zinc oxide: Insight into degradation of ZnO pigments. Molecules 2022, 27, 3362. [Google Scholar] [CrossRef] [PubMed]
  40. Segovia, M.; Lemus, K.; Moreno, M.; Santa Ana, M.A.; González, G.; Ballesteros, B.; Sotomayor, C.; Benavente, E. Zinc oxide/carboxylic acid lamellar structures. Mater. Res. Bull. 2011, 46, 2191–2195. [Google Scholar] [CrossRef]
  41. Shih, K.; Wang, F. Adsorption behavior of perfluorochemicals (PFCs) on boehmite: Influence of solution chemistry. Procedia Environ. Sci. 2013, 18, 106–113. [Google Scholar] [CrossRef] [Green Version]
  42. Available online: https://pfas-1.itrcweb.org/5-environmental-fate-and-transport-processes/ (accessed on 22 December 2022).
  43. Heerah, K.; Waclawek, S.; Konzuk, J.; Longstaffe, J.G. Benchtop19F NMR spectroscopy as a practical tool for testing of remedial technologies for the degradation of perfluorooctanoic acid, a persistent organic pollutant. Magn. Reson. Chem. 2020, 58, 1160–1167. [Google Scholar] [CrossRef] [PubMed]
Figure 1. Aqueous PFOA solutions in deionized water with equal volumes of 1-butanol. The numbers on the vials indicate the concentrations of PFOA in the initial aqueous solution (0 mg/L to 1000 mg/L in 200 mg/L increments).
Processes 11 00217 g001
Figure 2. Perstraction test system. (a) A schematic of a lab-scale perstraction test system. (b) A photo of a perstraction test system used in this study. LHS = left-hand side where the PFOA aqueous solution was placed. RHS = right-hand side where the solvent was placed. The volume on each side of the membrane was 100 cm3.
Processes 11 00217 g002
Figure 3. Example of solvent absorption in membrane samples. The solvent in this example is 1-butanol, the membrane is PDMS without imbedded particles, and the membrane half-thickness, l, is 0.425 mm.
Processes 11 00217 g003
Figure 4. PFOA uptake in PDMS with 10 wt% imbedded particles. Initial PFOA solution was 1000 mg/L in deionized water. The initial mass of each membrane sample was 0.1 g.
Processes 11 00217 g004
Figure 5. Effect of particle loading in PDMS on PFOA absorption. (a) ZnO. (b) CuO.
Processes 11 00217 g005
Figure 6. Kinetic modeling of PFOA uptake onto (a) 0.10 ZnO-PDMS and (b) 0.10 CuO-PDMS membrane samples. The values by each line represent the initial PFOA concentrations (mg/L). Membrane samples were initially 0.1 g and 1 mm in thickness.
Processes 11 00217 g006
Figure 7. Percentage of PFOA removed from aqueous (DI water) solutions. 0.025 g particles and 20 mL solution were used for each sample.
Processes 11 00217 g007
Figure 8. PFOA removed by membrane samples from aqueous solutions of PFOA after 3 days. Mass of membrane samples = 0.1 g. Initial PFOA concentration = 1000 mg/L. Solution volume = 20 mL.
Processes 11 00217 g008
Figure 9. PFOA concentrations in aqueous solutions in membrane test systems. (a) PDMS membrane. (b) ZnO-PDMS, CuO-PDMS membranes. The closed symbols represent the PFOA concentrations on the left-hand side of the test system, which initially contained 1000 mg/L PFOA in 100 mL DI water. The open symbols represent the PFOA concentrations in the DI water on the right-hand side of the test system, which initially contained pure DI water. The masses of the membranes were approximately 3.5 g.
Processes 11 00217 g009
Figure 10. PFOA concentrations in deionized water. Initial PFOA concentration in deionized water on the left-hand side of the membrane test system = 350 mg/L. The right-hand side of the membrane test system contained alcohol. All membranes were PDMS without imbedded particles.
Processes 11 00217 g010
Figure 11. Perstraction of PFOA from DI water (solid lines) and from tap water (dashed lines). 1-hexanol was the solvent. PDMS and 0.10 ZnO-PDMS were the membranes used (3.5 g, 1 mm thickness).
Processes 11 00217 g011
Figure 12. Perstraction of PFOA from DI water into 1-hexanol through a PDMS membrane.
Processes 11 00217 g012
Table 1. Summary of tests conducted with four identical perstraction test systems.
ExperimentTrial #1Trial #2Trial #3
Test System 1
Initial [PFOA]1000 mg/L PFOA350 mg/L PFOA500 mg/L PFOA
LHSDI waterDI waterDI water
RHSDI waterDI water1-hexanol
MembranePDMS PDMS PDMS
Test System 2
Initial [PFOA]1000 mg/L PFOA350 mg/L PFOA500 mg/L PFOA
LHSDI waterDI waterTap water
RHSDI water1-butanol1-hexanol
Membrane0.05 CuO-PDMSPDMS PDMS
Test System 3
Initial [PFOA]1000 mg/L PFOA350 mg/L PFOA500 mg/L PFOA
LHSDI waterDI waterDI water
RHSDI water1-hexanol1-hexanol
Membrane0.05 ZnO-PDMSPDMS 0.1 ZnO-PDMS
Test System 4
Initial [PFOA]1000 mg/L PFOA350 mg/L PFOA500 mg/L PFOA
LHSDI waterDI waterTap water
RHSDI water1-octanol1-hexanol
Membrane0.15 ZnO-PDMSPDMS 0.1 ZnO-PDMS
LHS = PFOA solution in water; RHS = solvent (water or alcohol). Trial #1: Effect of the type of membrane on perstraction process. Trial #2: Effect of the type of solvent on the perstraction process. Trial #3: Comparison of DI water with tap water and a comparison of PDMS membrane with 10 wt% ZnO-PDMS membrane.
Table 2. Summary of partition coefficients for PFOA in selected solvents.
SolventAqueous Phase
Deionized Water
Aqueous Phase
Tap Water 1
HexaneN/A0.118
CyclohexaneN/A0.003
BenzeneN/A0.025
1-Butanol16.4 ± 14.571.6 ± 29.2
1-Hexanol27.0 ± 16.731.8 ± 14.9
1-Octanol12.4 ± 5.65.4 ± 6.5
1 Tap water from Oxford, Ohio [33].
Table 3. Summary of solvent absorption in PDMS membranes.
SolventMembrane MaterialSolubility (kg/m3)Diffusivity 1
(1011 m2/s)
1-ButanolPDMS108 ± 9.72.6 ± 1.6
5 wt% ZnO in PDMS100 ± 4.61.6 ± 0.3
10 wt% ZnO in PDMS111 ± 6.91.3 ± 0.003
15 wt% ZnO in PDMS84.1 ± 6.51.5 ± 0.03
5 wt% CuO in PDMS116 ± 11.41.8 ± 0.02
10 wt% CuO in PDMS104 ± 20.61.6 ± 0.10
15 wt% CuO in PDMS108 ± 9.61.4 ± 0.37
1-HexanolPDMS 92.1 ± 12.21.5 ± 0.12
5 wt% ZnO in PDMS79.4 ± 4.41.5 ± 0.26
10 wt% ZnO in PDMS83.1 ± 6.71.2 ± 0.01
15 wt% ZnO in PDMS76.1 ± 0.81.4 ± 0.29
5 wt% CuO in PDMS116 ± 1.01.4 ± 0.07
10 wt% CuO in PDMS104 ± 5.11.6 ± 0.16
15 wt% CuO in PDMS101 ± 5.11.4 ± 0.07
1-OctanolPDMS52.1 ± 0.583.3 ± 0.45
5 wt% ZnO in PDMS41.3 ± 4.53.9 ± 0.62
10 wt% ZnO in PDMS40.4 ± 3.94.1 ± 0.22
15 wt% ZnO in PDMS41.7 ± 6.7 3.4 ± 1.1
5 wt% CuO in PDMS44.4 ± 154.8 ± 3.8
10 wt% CuO in PDMS48.6 ± 7.42.4 ± 0.54
15 wt% CuO in PDMS44.7 ± 3.12.5 ± 0.27
1 The diffusivity values in the table were multiplied by 1011. Therefore, the diffusivities are the values in the table, Di × 10−11 m2/s.
Table 4. Summary of kinetic model parameters for the uptake of PFOA on 0.10 ZnO-PDMS and CuO-PDMS as a function of initial PFOA concentration in deionized water.
Initial PFOA Concentration (mg/L)0.10 ZnO-PDMS0.10 CuO-PDMS
k2
(mg Membrane/mg PFOA/day)
qe
(mg PFOA/mg Membrane)
k2
(mg Membrane/mg PFOA/day)
qe
(mg PFOA/mg Membrane)
2000.0142360.008318
4000.0054950.00055104
6000.00291450.00071143
8000.00211930.00074182
10000.00162340.00059239
Disclaimer/Publisher’s Note: The statements, opinions and data contained in all publications are solely those of the individual author(s) and contributor(s) and not of MDPI and/or the editor(s). MDPI and/or the editor(s) disclaim responsibility for any injury to people or property resulting from any ideas, methods, instructions or products referred to in the content.

