Article

The Hormetic Response of Soil P Extraction Induced by Low-Molecular-Weight Organic Acids

Key Laboratory of Aqueous Environment Protection and Pollution Control of Yangtze River in Anhui of Anhui Provincial Education Department, School of Resource and Environment, Anqing Normal University, Anqing 246133, China
*
Authors to whom correspondence should be addressed.
Processes 2023, 11(1), 216; https://doi.org/10.3390/pr11010216
Submission received: 6 December 2022 / Revised: 3 January 2023 / Accepted: 5 January 2023 / Published: 10 January 2023
(This article belongs to the Section Environmental and Green Processes)

Abstract

:
The hormetic effect is a toxicological phenomenon in the soil ecosystem. The influence of low-molecular-weight organic acids (LMWOAs) on the release and activation of soil phosphorus (P) has become the focus of toxicological research. To what extent LMWOAs can regulate the hormetic effect of P release and then influence soil P nutrients is worth attention. This study aimed to investigate the effects of different types and concentrations of exogenous LMWOAs on P extraction, establish the relationship between the concentration of LMWOAs and P extraction efficiency, and calculate the hormetic parameters to understand the mechanism of types and concentrations of LMWOAs in P extraction efficiency. Four organic acids, i.e., citric, oxalic, tartaric, and malic acids, induced hormetic effects on P extraction that were concentration dependent. The relationship between LMWOAs and P extraction efficiency was explained by a quadratic polynomial equation. The critical threshold of citric acid concentration was similar to that of oxalic acid, whereas that of tartaric acid was similar to that of malic acid. The critical thresholds of the P concentration extracted by malic acid and citric acid were higher than those extracted by oxalic acid and tartaric acid due to the differences in the structure and properties of LMWOAs. The critical thresholds of P extraction efficiency of oxalic acid were lower than those of the other three organic acid types. These results provide evidence for the use of citric acid and malic acid to increase soil P.

1. Introduction

Phosphorus (P) is one of the essential elements for plant growth, and the P form in the soil directly affects the capacity of P uptake by plants [1,2]. Inorganic P in the soil can be directly absorbed and utilized by plants. Most of the P remains in the soil as insoluble phosphates, such as iron phosphate and calcium phosphate, and this is influenced by many factors, such as the soil type, texture, and physicochemical properties [3,4,5]. P deficiency in soils is a global environmental issue [6,7]. Only up to 25% of P-containing fertilizers are absorbed by plants, and the remainder accumulates in the soil. Soil erosion results in P addition to waterways, generating eutrophication [8,9,10]. Therefore, it is important to reduce P application rates and enhance P utilization by improving the conversion of insoluble P into available P.
Low-molecular-weight organic acids (LMWOAs) are the most active carbon form in the soil–plant–rhizosphere ecosystem [11,12]. LMWOAs such as citric, malic, and oxalic acids in root exudates and rhizosphere soils can respond to P deficiency [13,14]. Previous studies have demonstrated that the potential of LMWOAs in solubilizing P in soil depends on the concentration and type of LMWOAs and the soil texture [15,16,17]. Oxalic acid and citric acid at a concentration of 0–10 mmol L−1 significantly increased the P release in the rhizosphere soils of two plant species, Broussonetia papyrifera and Morus alba [18]. Ström et al. [19] indicated that oxalic acid, citric acid, and malic acid at a concentration ranging from 0 to 100 mmol L−1 increased the release of P in acidic soil with pH < 3.5 and alkaline soil with pH = 7.5, and the extraction rate of P in alkaline soil was higher than that in acidic soil. Therefore, the P release in soil by LMWOAs is dose-dependent, which needs to be explored for specific soil types.
The hormetic effect refers to the stress effect of exogenous chemicals on the soil, which is characterized by a stimulative effect at a low concentration and an inhibitory effect at a high concentration [20]. Hormesis is an intriguing phenomenon observed in various endpoints and forms of life [21,22]. Previous research has shown that the mechanisms of the hormetic effect mainly include the overcompensation mechanism, receptor mechanism, gene expression, regulation mechanism, oxidative stress mechanism, DNA damage repair mechanism, and immune function enhancement mechanism [23,24,25,26,27,28]. In soil ecosystems, the hormetic effect mainly focuses on the effects of heavy metals (e.g., cadmium, copper, and zinc), organic pollutants (e.g., polycyclic aromatic hydrocarbons and polychlorinated biphenyls), pesticides, antibiotics, and other exogenous toxic substances on plant growth and development, soil microbial activity, soil enzyme activity, and other factors [29,30,31]. The key factor influencing the hormetic effect is the concentration gradient of the stimulant [32]. If too many low/high concentration gradients are set, the experimental workload will be increased, and many effect points will have no effect at all. In general, the concentration gradient setting of the stimulant is related to the concentration characteristics of the stimulant in soils, plants, and crops. In addition, the parameters based on the hormetic effect can reflect the mechanism of exogenous chemicals on the organism, such as hormetic responses of soil microbiota to exogenous Cd [33,34] and the effect of hormetic doses of glyphosate on the yield of crops [35]. However, we have limited knowledge of the extent to which soil P release is driven by the hormetic effect of LMWOAs.
Many studies have shown dose-dependency between LMWOAs and the amount of P released; however, the quantitative relationships between the concentration of LMWOAs and P extraction efficiency have not been established. Therefore, the primary objectives of this study were to establish the relationship between the concentration of LMWOAs and P extraction efficiency and to compare the parameters of different fitting functions, such as the quadratic polynomial equation, linear equation, exponential equation, and hyperbolic equation. Then, we aimed to elucidate the mechanism of the different types and concentrations of LMWOAs in P extraction efficiency based on the hormetic parameters.

2. Materials and Methods

2.1. Soil Pretreatment

Six sampling areas, named S1, S2, S3, S4, S5, and S6, were selected to collect soil samples, located at 30°58′58.23″ N–31°1′19.70″ N and 117°53′33.16″ E–118°4′10.67″ E in Tongling city, Anhui Province, China. Five sampling points were set in each sampling area. Subsamples of the 0–20 cm surface soils from four corner points and one central point of a 5 m × 5 m square were obtained, and the subsamples from these five points were pooled into one soil sample in each sampling area. All soil samples were air-dried and sieved through a 100 mesh sieve after large gravel, weeds, and plant residues were removed and were then sealed in clean polyethylene plastic bags. The soil properties are summarized in Table 1. The soil pH was measured by the potentiometric method, the soil organic matter (SOM) content was measured by the K2Cr2O7 titration method, the total P (TP) contents were measured using molybdenum blue colorimetry, the cation exchange capacity (CEC) was measured by extraction with BaCl2 solution [36], and the available P (AP) was extracted by 0.5 mM sodium bicarbonate (NaHCO3) solution using a soil-to-solution ratio of 1:20 (w/v), with P determined colorimetrically [37].

2.2. The Species of LMWOAs

Citric acid (CA), oxalic acid (OA), tartaric acid (TA), and malic acid (MA) were selected for experimental research of the hormetic effects of LMWOAs on P release. The basic properties of these four organic acids are shown in Table 2.

2.3. The Concentration of Organic Acids

The concentration characteristics of LMWOAs in soils were referenced in accordance with the principle of low-dose interval encryption settings and high-dose interval reduction settings. The eight concentrations of the individual LMWOAs ranged from 0 mmol L−1 to 20 mmol L−1 (0 mmol L−1, 1 mmol L−1, 1.5 mmol L−1, 2 mmol L−1, 5 mmol L−1, 8 mmol L−1, 10 mmol L−1, and 20 mmol L−1).

2.4. Determination of the P Concentration Extracted by LMWOAs

A 3.0 g air-dried and sieved soil sample was weighed and placed in a clean 50 mL conical bottle, and 30 mL individual organic acid solutions of citric acid, oxalic acid, tartaric acid, and malic acid of 0 mmol L−1, 1 mmol L−1, 1.5 mmol L−1, 2 mmol L−1, 5 mmol L−1, 8 mmol L−1, 10 mmol L−1, and 20 mmol L−1 was added to the conical bottle. Thymol at a concentration of 0.01 g L−1 was added to prevent microorganisms from consuming the organic acids. Then, the samples were orbitally shaken for 30 min and filtered. The concentration of P in the filtrate was measured by molybdenum–antimony resistance colorimetry using a spectrophotometer [38].

2.5. Calculation of the P Extraction Efficiency

The P extraction efficiency of the LMWOAs was calculated using Equation (1):
Y = ( X i X 0 ) X 0 × 100 %
where Y is the extraction efficiency of P by LMWOAs; X0 is the amount of P under an LMWOA concentration of 0 mmol L−1; and Xi is the amount of P under an organic acid concentration of 1 mmol L−1, 1.5 mmol L−1, 2 mmol L−1, 5 mmol L−1, 8 mmol L−1, 10 mmol L−1, and 20 mmol L−1.

2.6. Model of LMWOA Concentrations and the P Extraction Efficiency

According to the concentration of LMWOAs (N) and Y in Equation (1), Equation (2) was used for fitting the relationship between the LMWOA concentration and the P extraction efficiency as follows [39,40]:
Y = aN2 + bN + c
where a, b, and c are the constants of the fitting curve.

2.7. Parameter Calculations

Two concentrations of organic acids, D1 and D2, can be calculated by Equation (2). D1 and D2 are the respective initial and final concentrations at which the hormetic effect was induced when Y = 0.
Therefore, the concentration difference value, ΔD, was calculated by D2 − D1, and the area of the stimulus effect defined as R could be calculated.
Taking the first derivative of Equation (2), we obtained Equation (3):
Y′ = 2aN + b
When Y′ = 0, the intermediate value of the LMWOA concentration, NMe, was calculated by Equation (4):
NMe = −b/2a
where a and b are the constants of the fitting curve shown in Equation (2).
Therefore, the maximum P extraction efficiency, Ymax, can be calculated by Equation (5):
Y max = ( 4 ac b 2 ) 4 a
Then, the maximum P extraction, Xmax, can be calculated by Equation (1).

2.8. Statistical Analysis

All experiments were performed in triplicate with the same treatment independently replicated. Statistical analyses of data were carried out using one-way ANOVA and regression analysis between LMWOAs and the P extraction efficiency. Significance was assigned at the p < 0.05 level based on Duncan’s test. The results are presented as arithmetic means ± SD. All statistical analyses were conducted with IBM SPSS version 24.0 (Armonk, New York, NY, USA).

3. Results

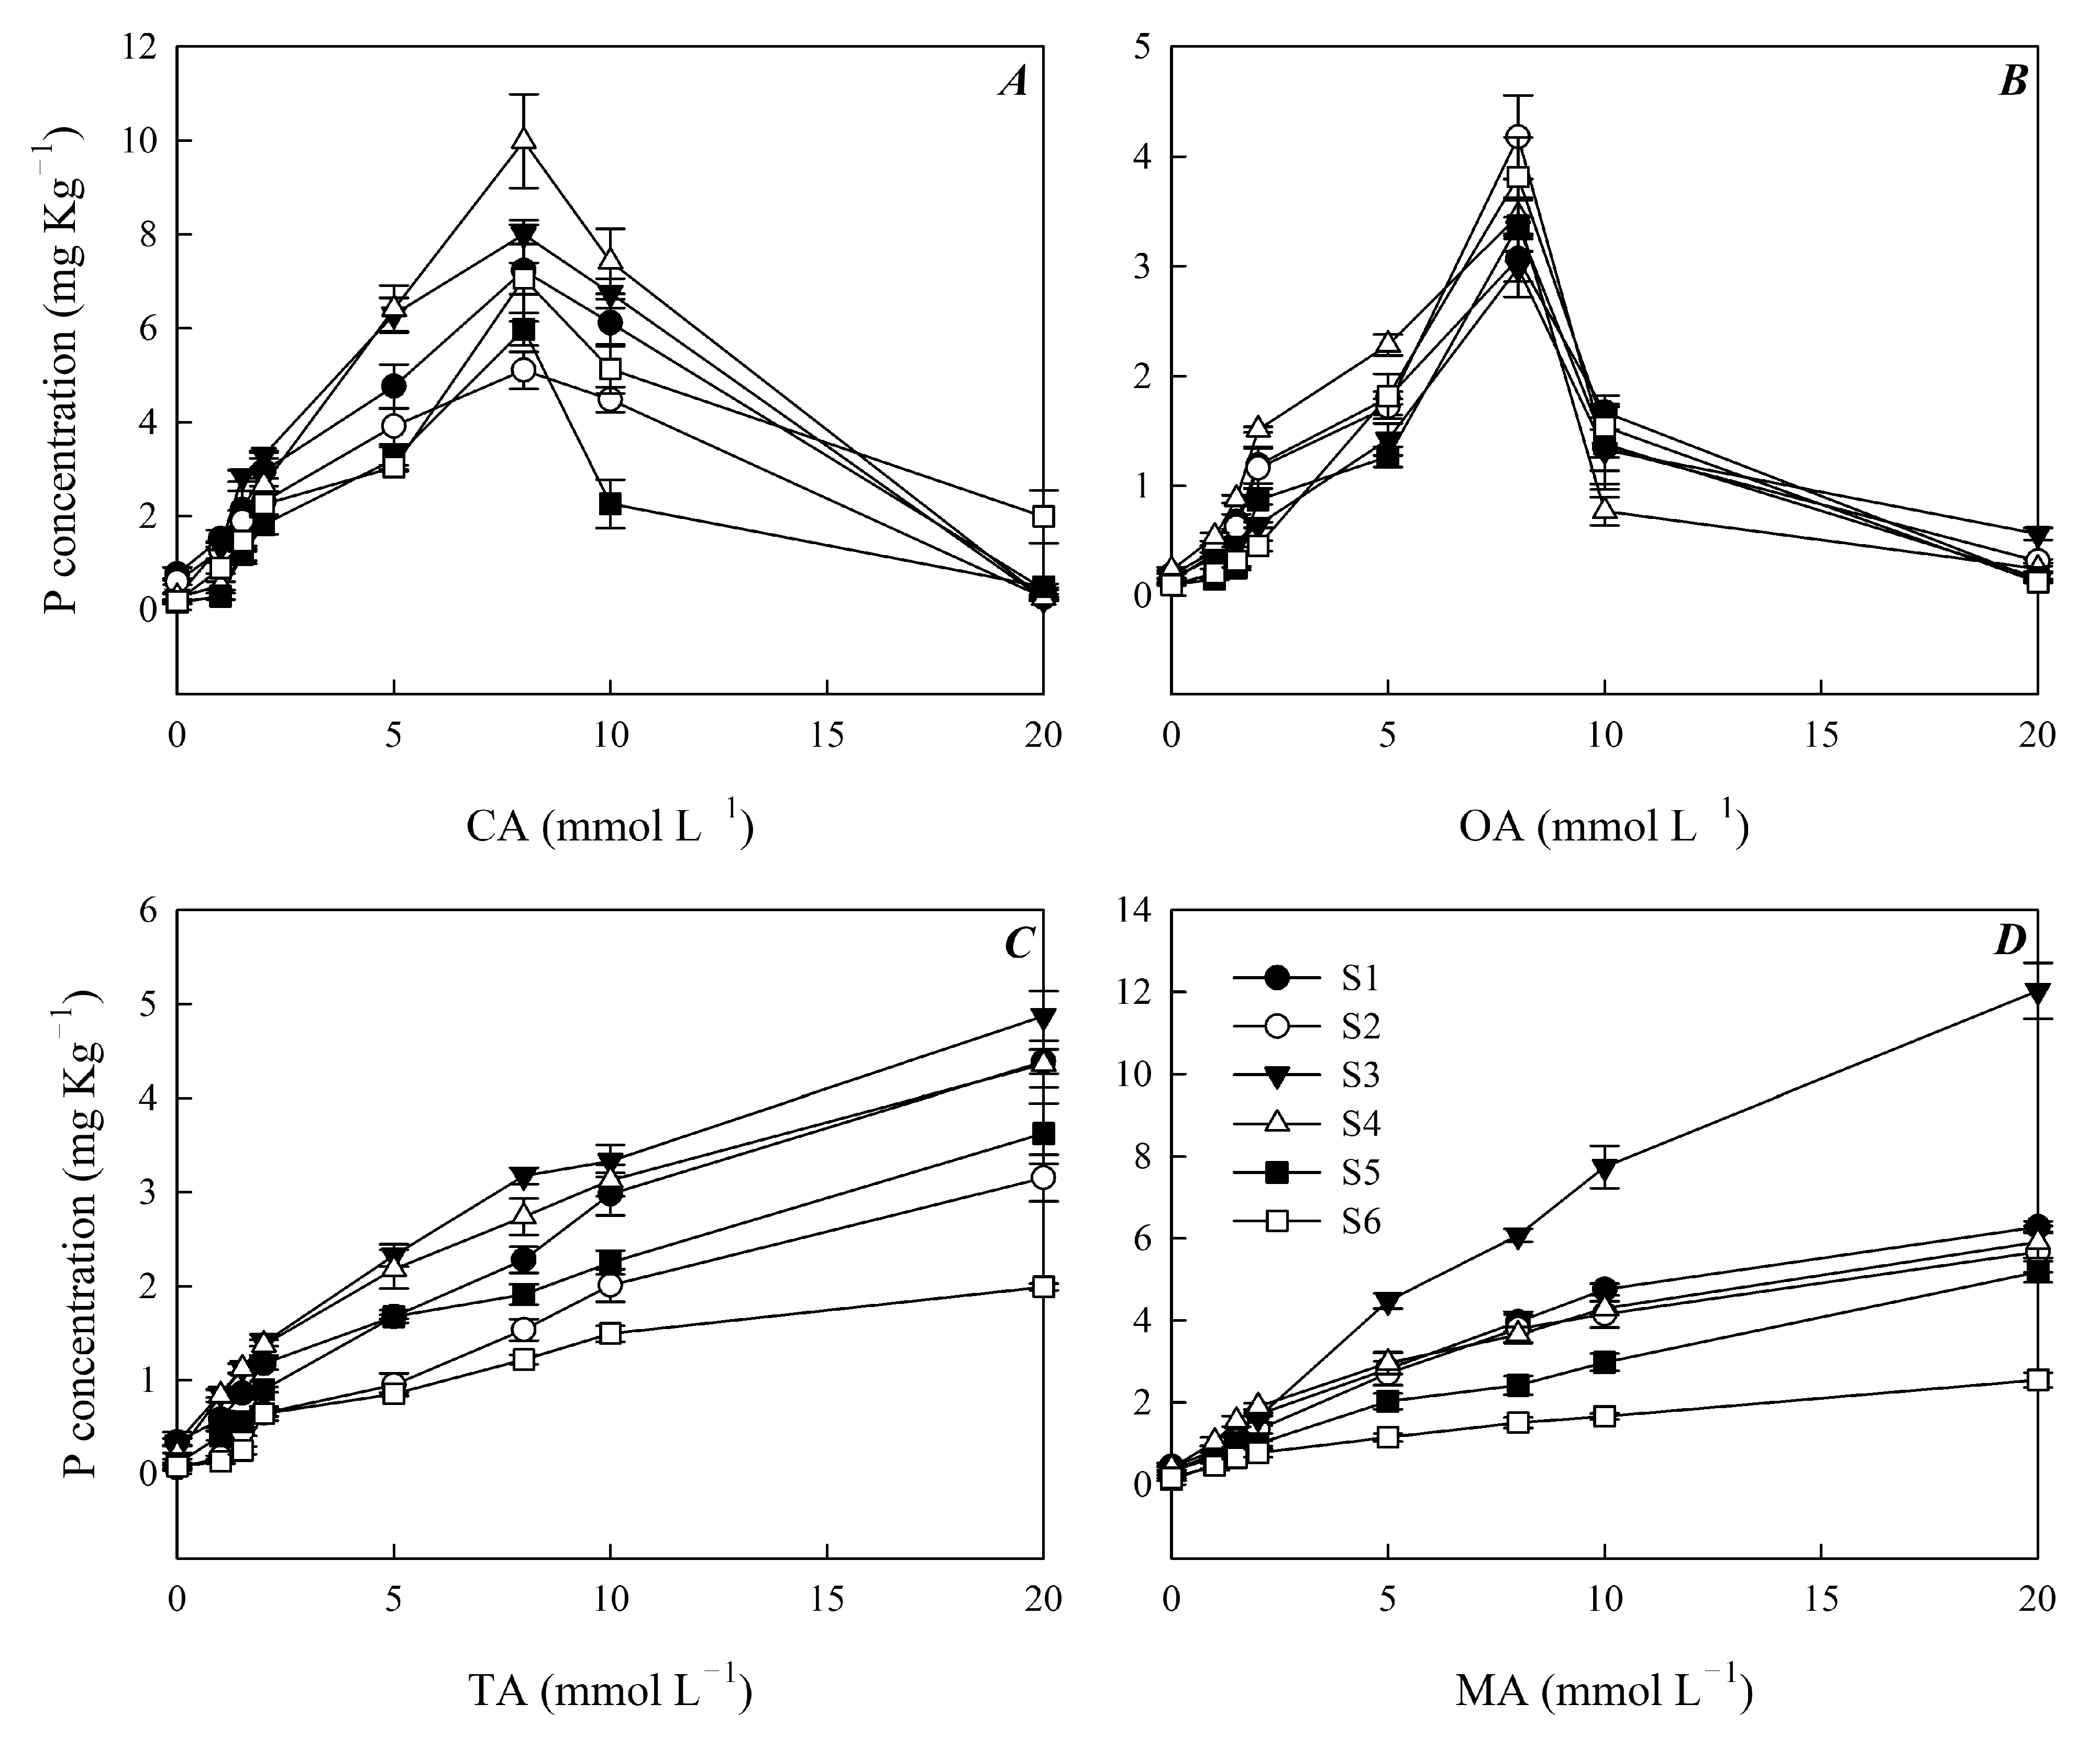
3.1. Effect of Different Types and Concentrations of LMWOAs on P Release

The effects of citric acid on soil P release were promoted by a low concentration and inhibited by a high concentration (Figure 1A). The highest soil P concentration was extracted by a citric acid concentration of 8 mmol L−1, which was 9.99 mg kg−1 in the S4 sampling area and was significantly higher than that in the other sampling areas. There was no significant difference in soil P concentration under the same concentration of citric acid (Figure 1A). The trend of soil P release extracted by oxalic acid was similar to that of citric acid (Figure 1B). When the concentration of oxalic acid was 8 mmol L−1, the concentration of P was the highest. Citric acid resulted in higher P extraction from the soil than OA at the same concentration (Figure 1A,B). The soil P concentration in all six sampling areas increased with the increase in the tartaric acid and malic acid concentrations (Figure 1C,D). The soil P concentration extracted by tartaric and malic acids in the S3 sampling area was the highest, compared with the lowest in the S6 sampling area. The P concentration extracted by malic acid was significantly higher than that extracted by the other three organic acids in the S6 sampling area (Figure 1).

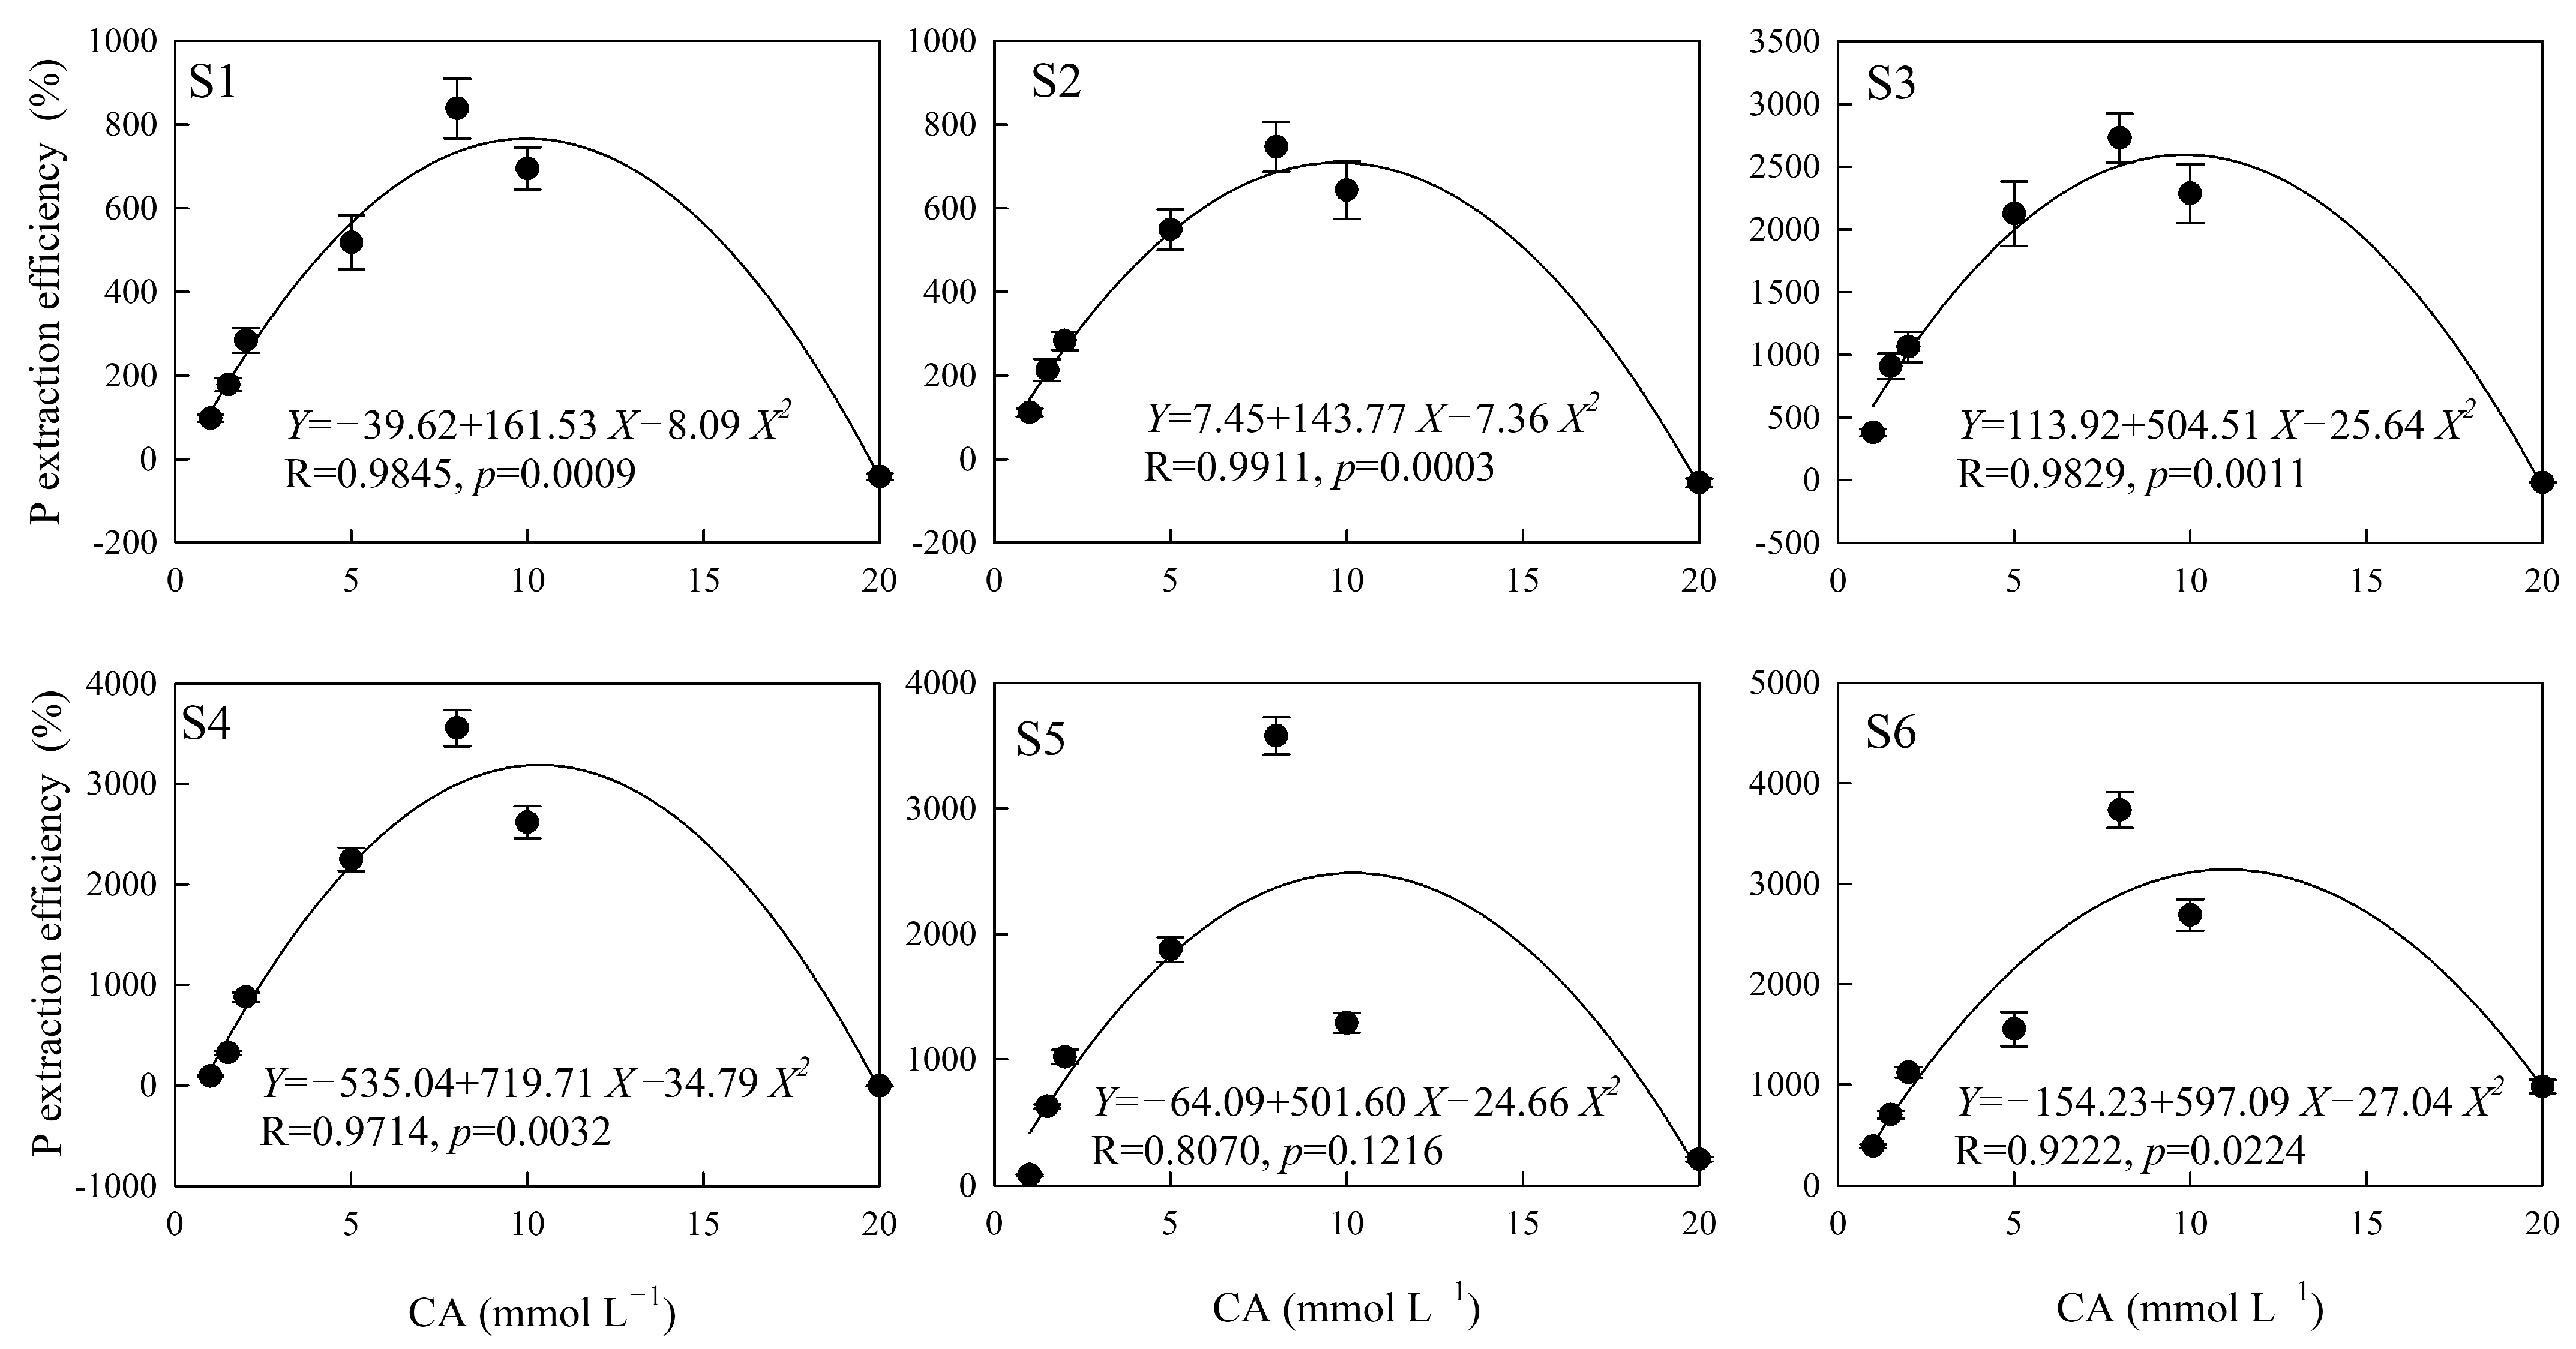
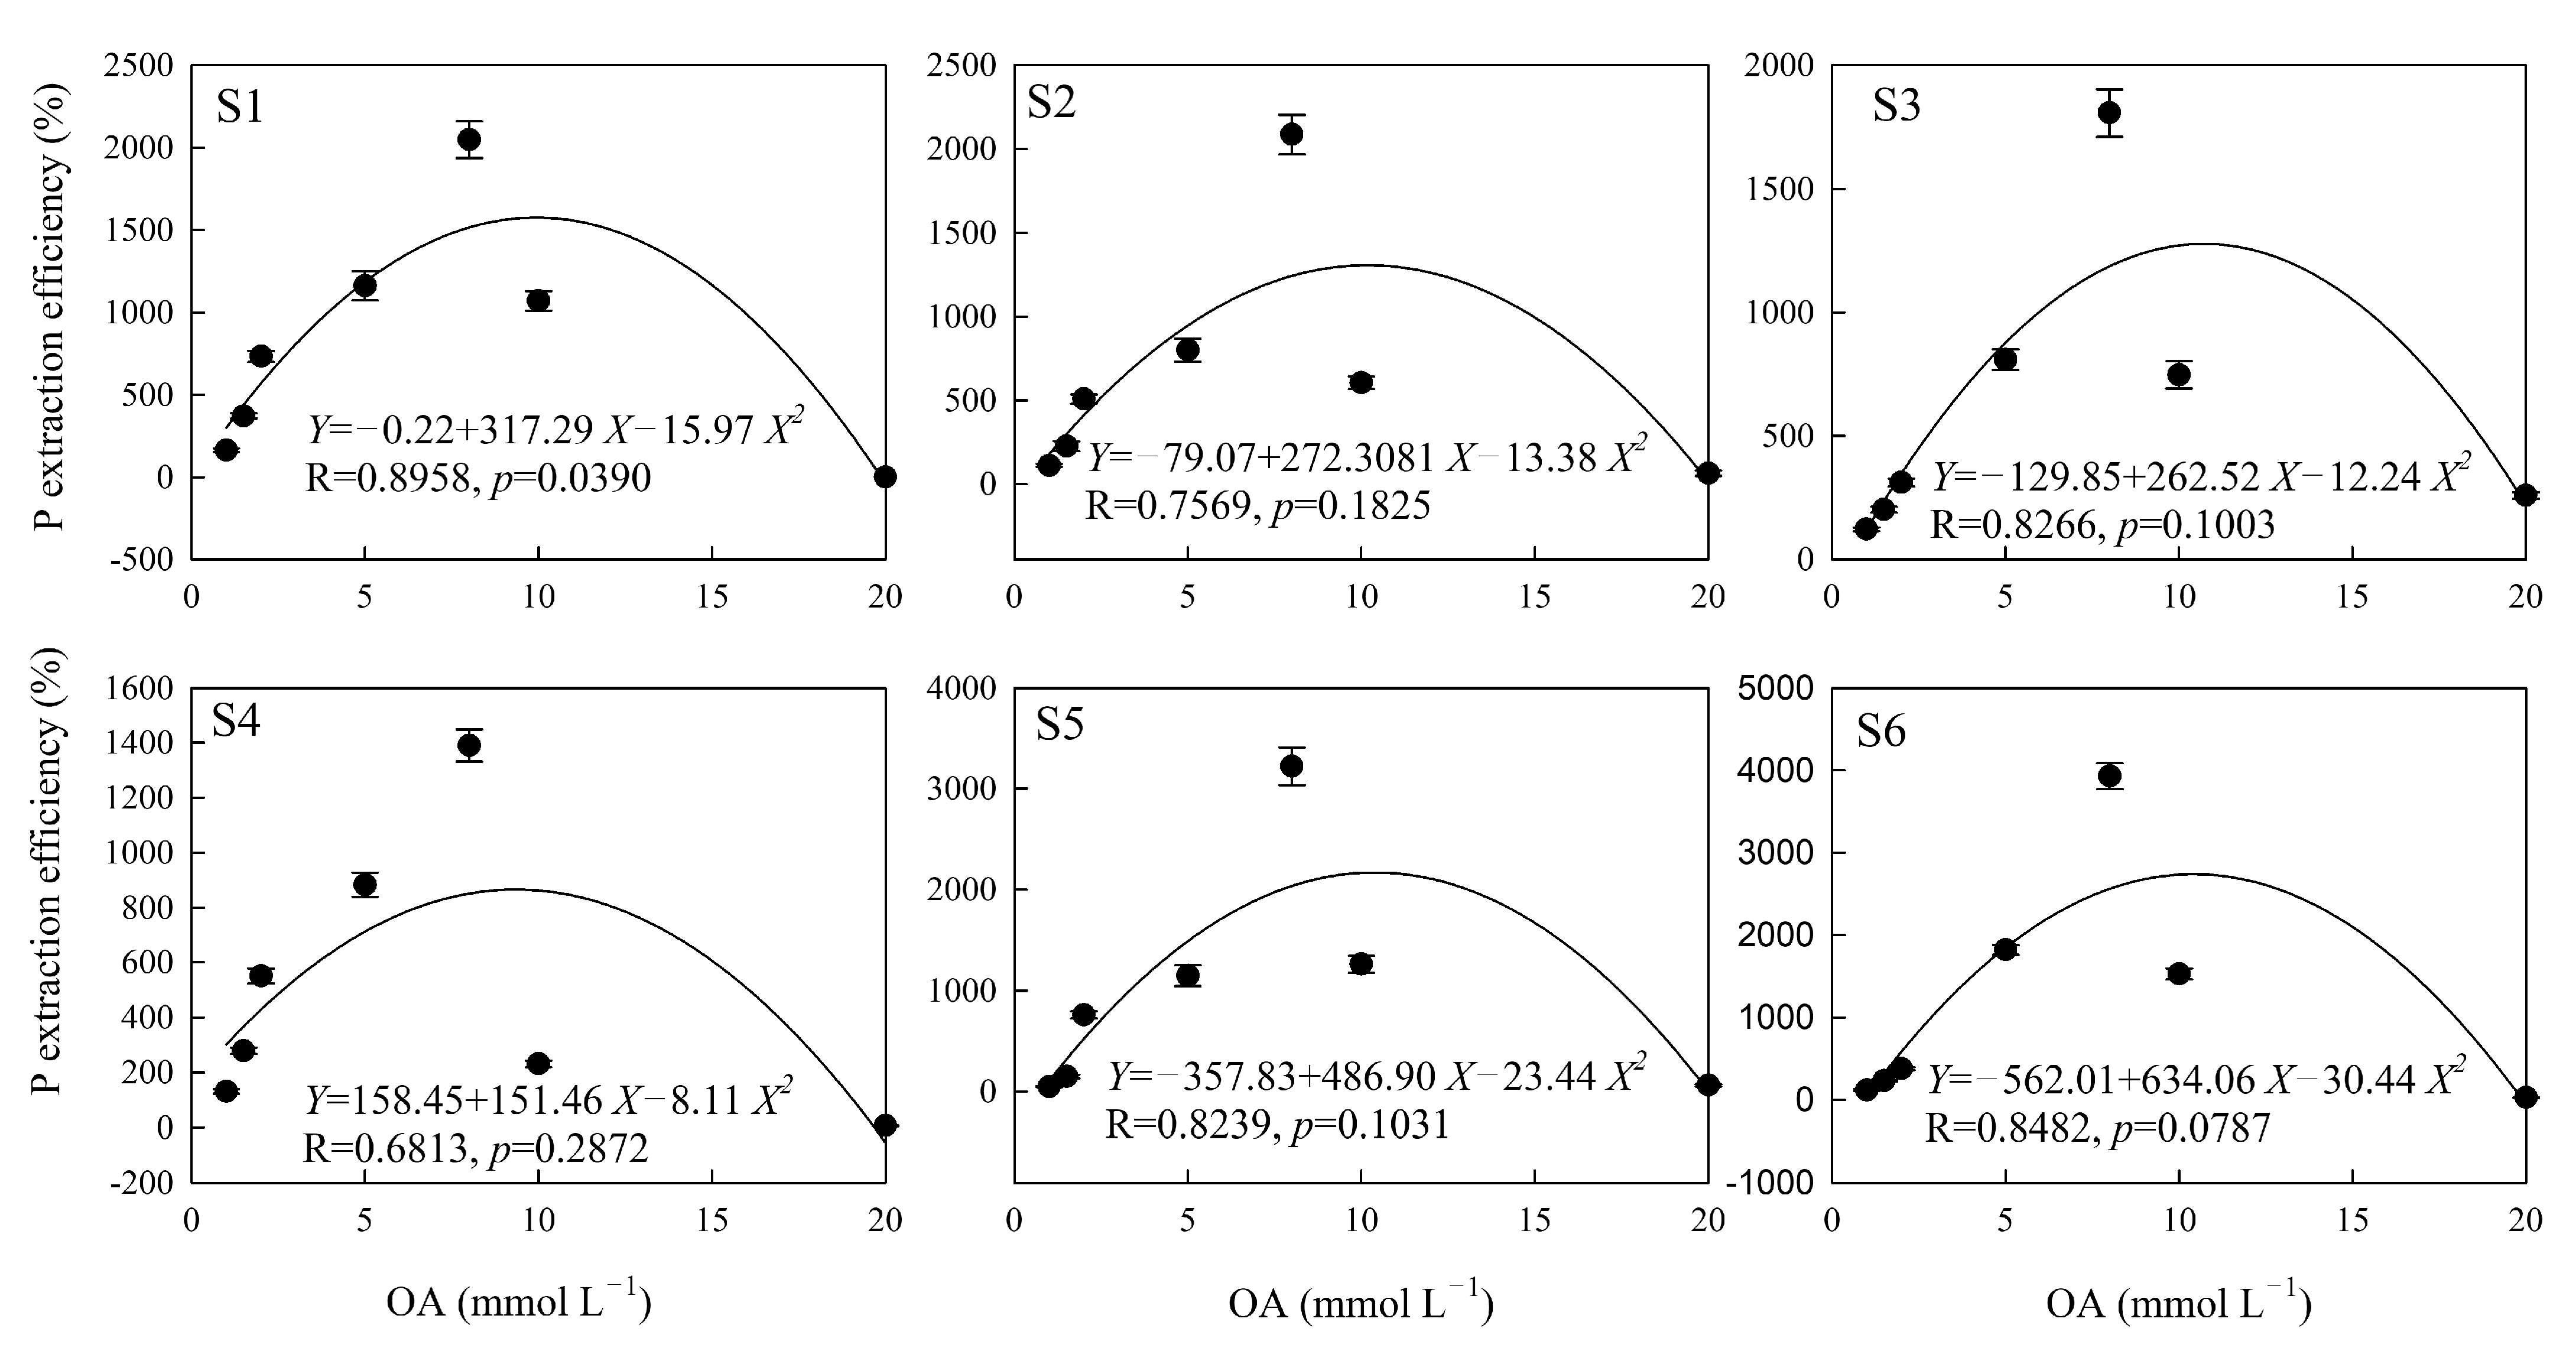
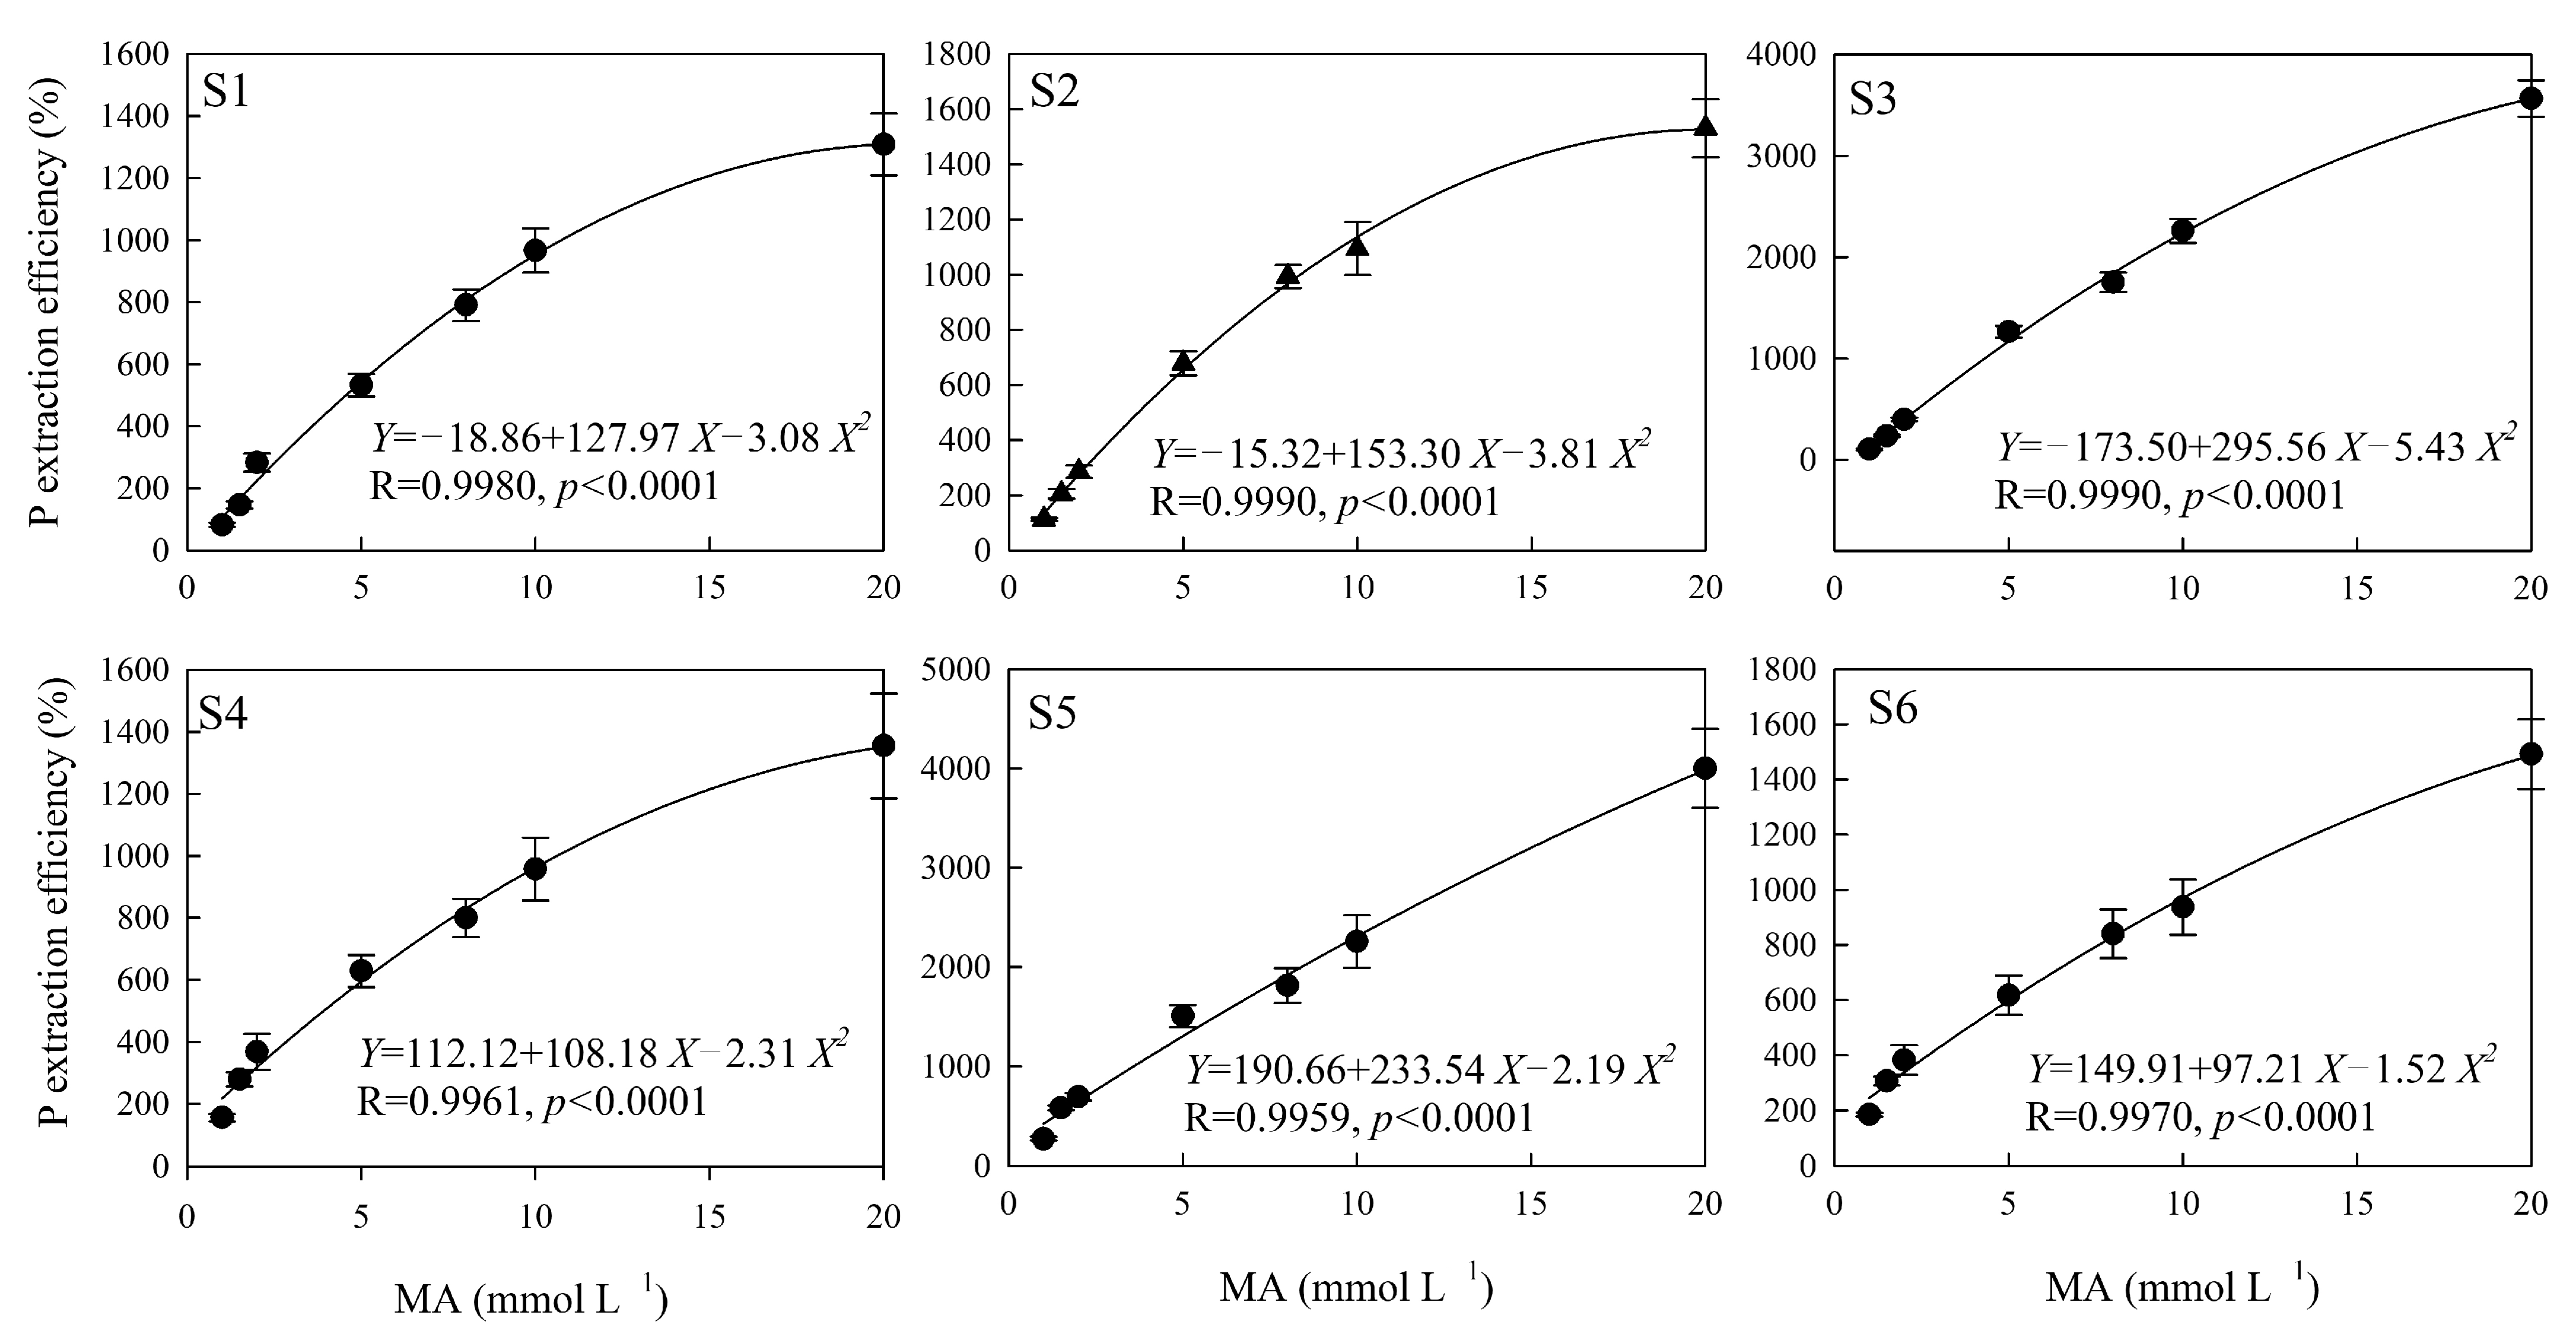
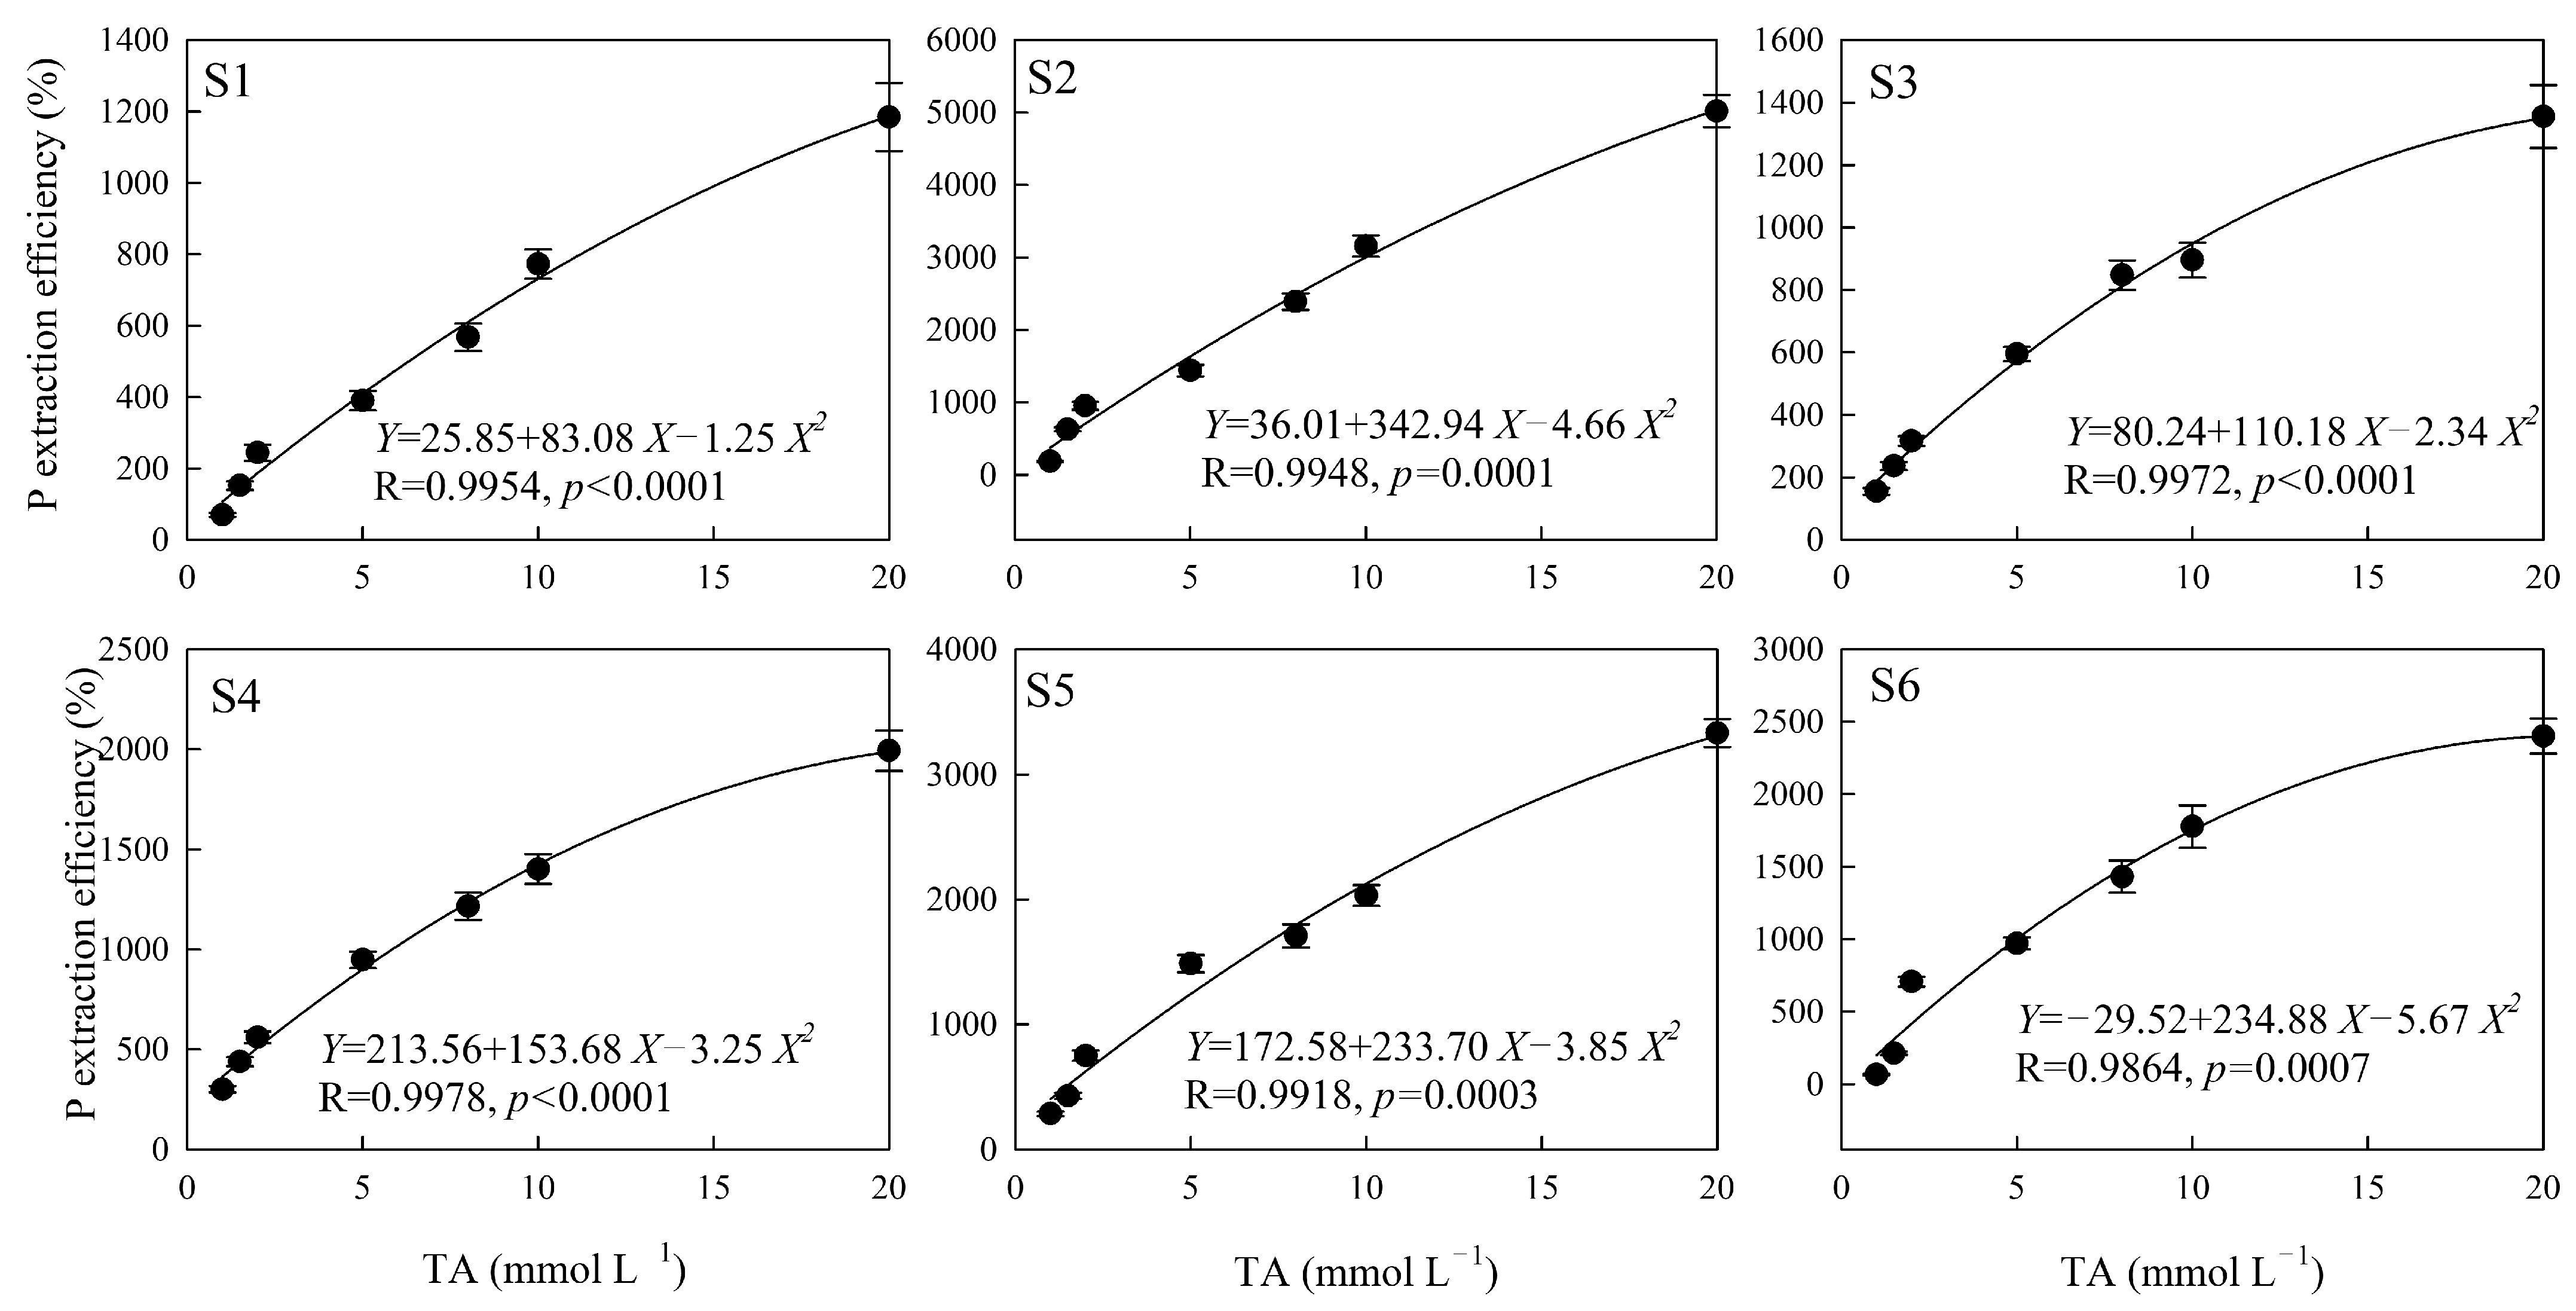
3.2. Different Fitting Curves Simulated the P Extraction Efficiency of the LMWOAs

The exponential equation and hyperbolic equation could not fit the effect of citric acid on the soil P extraction efficiency (p > 0.05) (Table 3). The linear equation fits only the effect of citric acid on the soil P extraction efficiency in the S4 and S5 sampling areas. The quadratic polynomial equation fits the effect of citric acid on the soil P extraction efficiency in all sampling areas except S1. The four equations had a poor fit for the concentration of oxalic acid and the P extraction efficiency, except in the S1 sampling area (p = 0.05). The fit of the four equations for the tartaric acid and malic acid concentrations and the P extraction efficiency was good (p < 0.01), and the correlation coefficients for the four equations in all six sampling areas were greater than 0.95. In general, the fit of the quadratic polynomial was better than that of the linear equation, exponential equation, and hyperbolic equation. The hormetic effect of LMWOAs on the soil P extraction efficiency can be represented by this quadratic polynomial equation.

3.3. The Hormetic Effect of LMWOAs on the P Extraction Efficiency

The polynomial equation fit the effect of citric acid on the soil P extraction well, except in the S5 sampling area (p < 0.05), and the correlation coefficient of the fitting equation was between 0.8070 and 0.9911 (Figure 2). There were no significant differences between the soil P extraction efficiency and the concentration of oxalic acid, except in the S1 sampling area (p = 0.05), and the correlation coefficient of the fitting equation was between 0.6813 and 0.8958 (Figure 3). The highest significance values were between tartaric acid, malic acid, and the soil P extraction efficiency in all six sampling areas (Figure 4 and Figure 5), and the correlation coefficients of the fitting equations were greater than 0.99 (p < 0.001).

3.4. The Hormetic Parameters of the P Extraction Efficiency of Different LMWOAs in Soil

The hormetic effect parameters fitted with the quadratic polynomial equation for soil P extracted by different LMWOAs are shown in Table 4. The concentration ranges of citric and oxalic acids that induced the hormetic effect of soil P release were –0.22 to 21.82 mmol L−1 and –0.99 to 20.93 mmol L−1, respectively. The average NMe of citric and oxalic acids were similar, i.e., 10.19 and 10.16 mmol L−1, respectively; those of tartaric acid and malic acid were 28.06 and 29.47 mmol L−1. The R value and ΔD in tartaric acid and malic acid were higher than those in citric acid and oxalic acid. Xmax reflects the predicted maximum amount of P extraction by the quadratic polynomial equation; the average values for citric, oxalic, tartaric, and malic acids were 7.01, 4.09, 2.41, and 6.39 mg Kg−1. The Ymax for oxalic acid was lower than that for the other three organic acids.

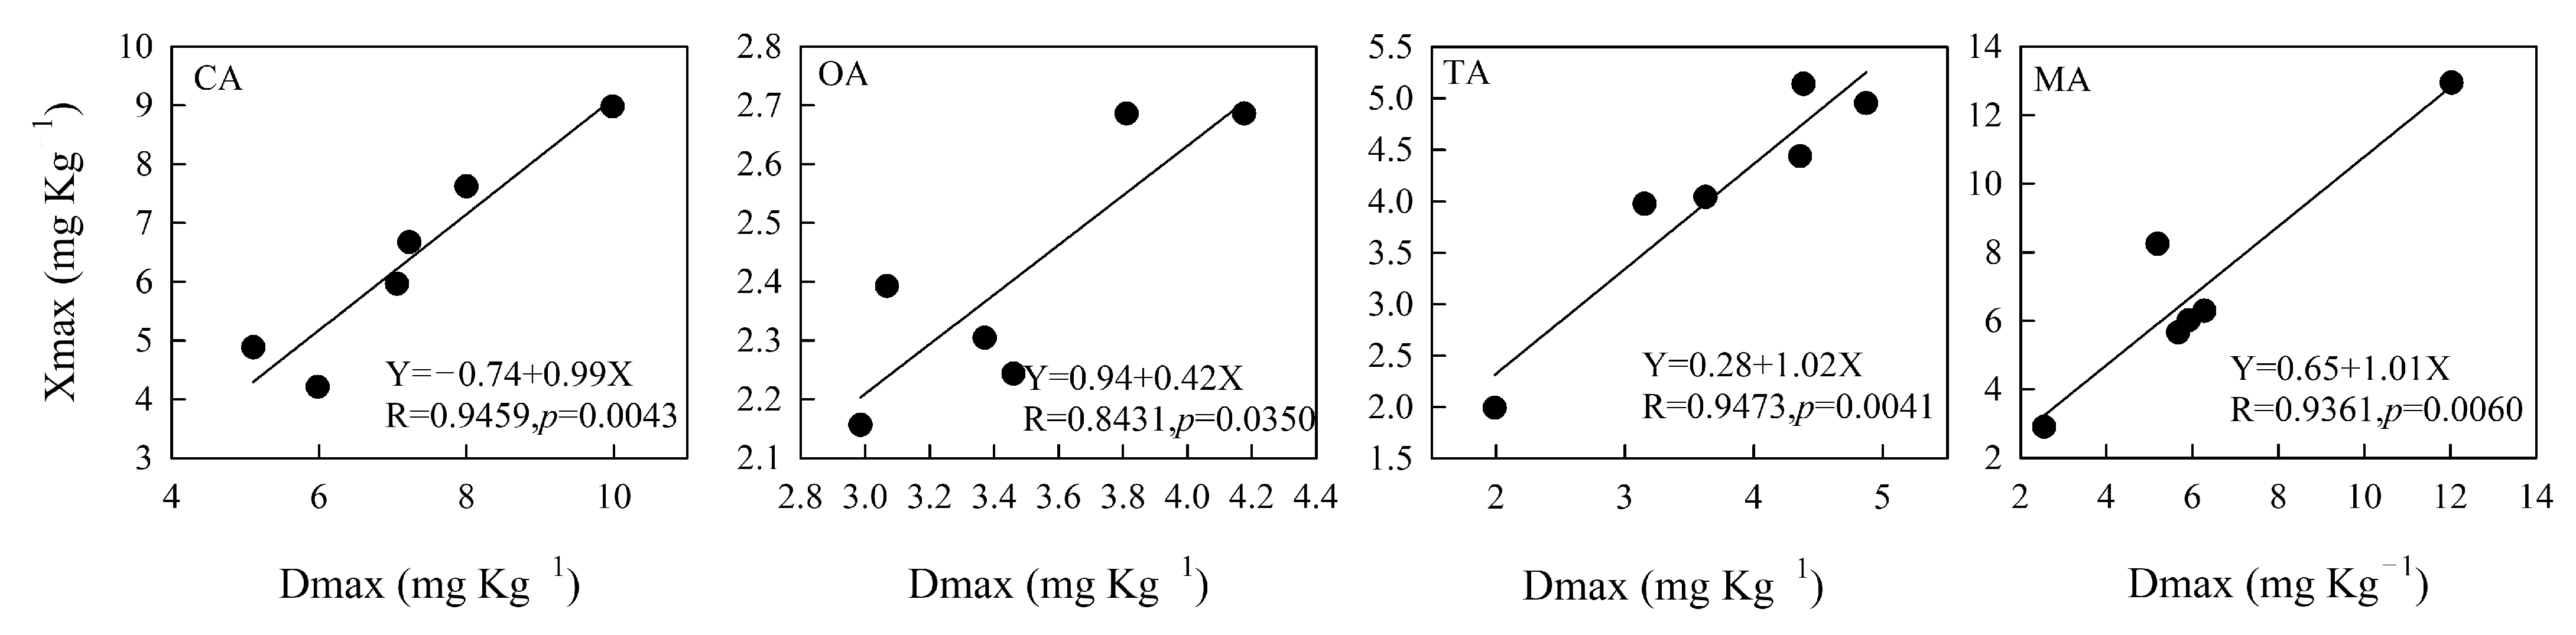
3.5. The Verification of Xmax and the Measured Value of the Maximum Amount of P

According to Figure 6, Xmax, calculated by the quadratic polynomial equation (Table 4), had a significant linear correlation with the measured value of the maximum amount of P extracted by organic acid (Dmax) (p < 0.05). The fitting effect of citric, tartaric, and malic acids was better than that of oxalic acid based on the linear equation in the six sampling areas. The correlation coefficients of citric, tartaric, and malic acids were higher than 0.93 (p < 0.01), and that of OA was 0.84 (p < 0.05).

4. Discussion

In this study, the quadratic polynomial function described the relationship between soil P extraction and LMWOAs. Therefore, the present study successfully calculated the ability of LMWOAs to extract P according to the composition and concentration of LMWOAs in different soil types. The various parameters included in the critical threshold of the LMWOA concentration for soil P extraction were acquired by calculation of the fitting equation.
Organic acids can increase soil P release [41,42]. This paper showed similar results as those of previous studies; the effects of citric, malic, oxalic, and tartaric acids on soil P release depended on the concentration of organic acids. The results of this study, obtained by studying the dose–response relationship in soil P induced by the exogenous application of LMWOAs, indicated that the hormetic effect can occur in different soils. The trend of P release extracted by citric acid was consistent with that of oxalic acid, as the soil P extraction increased at low concentrations and then decreased at high concentrations of these two LMWOAs. The trend of soil P extracted by tartaric acid and malic acid was similar; the P extraction increased with the increase in the concentration of these two organic acids.
In our study, the stimulation dose range was narrower than that of previous studies (10–20 times), with an extraction time of 30 min. In general, in all six soil sampling areas of this study, when the concentration of organic acids was lower than 10 mmol L−1, citric acid had a stronger capacity to extract soil P than the other three LMWOAs. Malic acid had a stronger capacity than the other three LMWOAs to extract soil P when the concentration of the LMWOAs was higher than 10 mmol L−1. The soil P released by organic acids is influenced by many factors, such as the extraction time and the type and dissociation constant of the organic acids [43,44,45]. P extracted by oxalic acid decreases sharply during 30–35 min of extraction [46]. This might be related to differences in the soil type and sensitivity of different experimental design endpoints [31,32]. We extracted P for 30 min after adding the four LMWOAs, and oxalic acid resulted in a lower P extraction from the soil than the other three LMWOAs, although the dissociation constant of oxalic acid was higher than that of the other organic acids. Owing to the third-order dissociation constant and the higher value of the dissociation constant, citric acid extracted more soil P than the other three LMWOAs when the concentration of the LMWOAs was low.
The complexing capacity of LMWOAs determines the P extraction ability, which depends on the number and proximity of the carboxyl group of LMWOAs, the concentration and type of metals, and the soil properties [4,18]. The capability of tricarboxylic acid to extract soil P is greater than that of dicarboxylic and monocarboxylic acids by comparison of the kinetic characteristics of P induced by LMWOAs [47,48,49]. These LMWOAs dissolve P from insoluble phosphoric compounds, such as calcium phosphate, iron phosphate, and aluminum phosphorus, to overcome P deficiency [50]. Therefore, citrate and malate were found to have the highest and lowest P extraction efficiency, respectively. In our study, we found that citrate, malate, and tartrate had a high soil P extraction efficiency in the concentration range of 0–20 mmol L−1. The maximum amount of P extracted by malate and citrate was higher than that extracted by oxalate and tartrate.

5. Conclusions

The hormetic response of P extraction exposed to different concentrations of citric, oxalic, tartaric, and malic acids was determined. The quadratic polynomial equation can be used to fit the relationship between the concentration of LMWOAs and the P extraction efficiency. Within the range of organic acid concentrations, the stimulation dose range of citric acid and oxalic acid was 0–8 mmol L−1, while the stimulation dose range of tartaric acid and malic acid was 0–20 mmol L−1. Citric acid and malic acid can be used to promote the biological availability of soil P. The findings of this study have important implications for minimizing the environmental risk of P by utilizing low-molecular-weight organic acids.

Author Contributions

Conceptualization, K.Z. and X.X.; methodology, K.Z. and W.Z.; investigation, K.Z. and M.L.; data curation, C.W., Y.W. and Y.Y.; writing—original draft preparation, C.W. and K.Z.; writing—review and editing K.Z.; supervision, X.X.; funding acquisition, K.Z., M.L. and W.Z. All authors have read and agreed to the published version of the manuscript. All authors have read and agreed to the published version.

Funding

This research was funded by the National Natural Science Foundation of China (41907334), the Natural Science Foundation of Anhui Province (1908085QD149, 1908085QD163), the Key Science and Technology Program of Anhui Province (17030701057), and the University Natural Science Research Project of Anhui Province (KJ2021A0654).

Data Availability Statement

The datasets generated during and/or analyzed during the current study are available from the corresponding authors upon reasonable request.

Conflicts of Interest

The authors declare no conflict of interest.

References

  1. Lambers, H. Phosphorus acquisition and utilization in plants. Annu. Rev. Plant Biol. 2022, 73, 17–42. [Google Scholar] [CrossRef] [PubMed]
  2. Han, Y.; White, P.J.; Cheng, L.Y. Mechanisms for improving phosphorus utilization efficiency in plants. Ann. Bot. 2022, 129, 247–258. [Google Scholar] [CrossRef] [PubMed]
  3. Hou, E.Q.; Tang, S.B.; Chen, C.R.; Kuang, Y.W.; Lu, X.K.; Heenan, M.; Wen, D.Z. Solubility of phosphorus in subtropical forest soils as influenced by low molecular organic acids and key soil properties. Geoderma 2018, 313, 172–180. [Google Scholar] [CrossRef]
  4. Jones, D.L. Organic acids in the rhizosphere—A critical review. Plant Soil 1998, 205, 25–44. [Google Scholar] [CrossRef]
  5. Liu, J.; Han, C.; Zhao, Y.; Yang, D.; Yang, J.; Zheng, L.; Hu, Y.; Li, J.; Sui, P.; Chen, Y.; et al. Molecular-level insights into phosphorus transformation mechanisms in entisol soils under multiple long-term fertilization regimes. Agronomy 2022, 12, 2760. [Google Scholar] [CrossRef]
  6. Gilbert, N. Environment: The disappearing nutrient. Nature 2009, 461, 716–718. [Google Scholar] [CrossRef] [PubMed] [Green Version]
  7. Augusto, L.; Achat, D.L.; Jonard, M.; Vidal, D.; Ringeval, B. Soil parent material-a major driver of plant nutrient limitations in terrestrial ecosystems. Glob. Chang. Bio. 2017, 23, 3808–3824. [Google Scholar] [CrossRef]
  8. Vance, C.P.; Uhde-Stone, C.; Allan, D.L. Phosphorus acquisition and use: Critical adaptations by plants for securing a nonrenewable resource. New Phytol. 2003, 157, 423–447. [Google Scholar] [CrossRef] [Green Version]
  9. Richardson, A.E.; Simpson, R.J. Soil microorganisms mediating phosphorus availability. Plant Physiol. 2011, 156, 989–996. [Google Scholar] [CrossRef] [Green Version]
  10. White, P.J.; Veneklaas, E.J. Nature and nurture: The importance of seed phosphorus content. Plant Soil 2012, 357, 1–8. [Google Scholar] [CrossRef]
  11. Jones, D.L.; Nguyen, C.; Finlay, R.D. Carbon flow in the rhizosphere: Carbon trading at the soil-root interface. Plant Soil 2009, 321, 5–33. [Google Scholar] [CrossRef]
  12. Ryan, P.R.; Delhaize, E.; Jones, D.L. Function and mechanism of organic anion exudation from plant roots. Annu. Rev. Plant. Physiol. Plant. Mol. Biol. 2001, 52, 527–560. [Google Scholar] [CrossRef]
  13. Adeleke, R.; Nwangburuka, C.; Oboirien, B. Origins, roles and fate of organic acids in soils: A review. S. Afr. J. Bot. 2017, 108, 393–406. [Google Scholar] [CrossRef]
  14. Menezes-Blackburn, D.; Paredes, C.; Zhang, H.; Giles, C.D.; Darch, T.; Stutter, M. Organic acids regulation of chemical–microbial phosphorus transformations in soils. Environ. Sci. Technol. 2016, 50, 11521–11531. [Google Scholar] [CrossRef] [PubMed]
  15. Chen, Y.T.; Wang, Y.; Yeh, K.C. Role of root exudates in metal acquisition and tolerance. Curr. Opin. Plant Biol. 2017, 39, 66–72. [Google Scholar] [CrossRef] [PubMed]
  16. Baetz, U.; Martinoia, E. Root exudates: The hidden part of plant defense. Trends Plant Sci. 2014, 19, 90–98. [Google Scholar] [CrossRef] [Green Version]
  17. Narula, N.; Kothe, E.; Behl, R.K. Role of root exudates in plant-microbe interactions. J. App. Bot. Food Qual. 2012, 82, 122–130. [Google Scholar]
  18. Zhao, K.; Wu, Y.Y. Rhizosphere calcareous soil P-extraction at the expense of organic carbon from root-exuded organic acids induced by phosphorus deficiency in several plant species. Soil Sci. Plant Nutr. 2014, 60, 640–650. [Google Scholar] [CrossRef]
  19. Ström, L.; Owen, A.G.; Godbold, D.L.; Jones, D.L. Organic acid behaviour in a calcareous soil implications for rhizosphere nutrient cycling. Soil Biol. Biochem. 2005, 37, 2046–2054. [Google Scholar] [CrossRef]
  20. Calabrese, E.J.; Baldwin, L.A. Toxicology rethinks its central belief. Nature 2003, 421, 691–692. [Google Scholar] [CrossRef]
  21. Abbas, T.; Nadeem, M.A.; Tanveer, A.; Chauhan, B.S. Can hormesis of plantreleased phytotoxins be used to boost and sustain crop production? Crop Prot. 2017, 93, 69–76. [Google Scholar] [CrossRef]
  22. Calabrese, E.J.; Blain, R.B. The hormesis database: The occurrence of hermetic dose responses in the toxicological literature. Regul. Toxicol. Pharmacol. 2011, 61, 73–81. [Google Scholar] [CrossRef] [PubMed]
  23. Stebbing, A.R.D. A theory for growth hormesis. Mut. Res. Fund Mol. M. 1998, 403, 249–258. [Google Scholar] [CrossRef]
  24. Calabrese, E.J. Overcompensation stimulation: A mechanism for hormetic effects. Crit. Rev. Toxicol. 2001, 31, 425–470. [Google Scholar] [CrossRef] [PubMed]
  25. Chadwick, W.; Maudsley, S. The devil is in the dose: Complexity of receptor systems and responses. In Hormesis; Mattson, M.P., Calabrese, E.J., Eds.; Humana Press: New Jersey, NJ, USA, 2010; pp. 95–108. [Google Scholar]
  26. Sun, H.; Pan, Y.; Gu, Y.; Lin, Z. Mechanistic explanation of time-dependent cross-phenomenon based on quorum sensing: A case study of the mixture of sulfonamide and quorum sensing inhibitor to bioluminescence of Aliivibrio fischeri. Sci. Total Environ. 2018, 630, 11–19. [Google Scholar] [CrossRef]
  27. Luna–López, A.; González-Puertos, V.Y.; López-Diazguerrero, N.E.; Knigsberg, M. New considerations on hormetic response against oxidative stress. J. Cell Commun. Signal 2014, 8, 323–331. [Google Scholar] [CrossRef] [Green Version]
  28. Ludovico, P.; Burhans, W.C. Reactive oxygen species, ageing and hormesis police. FEMS Yeast Res. 2014, 14, 33–39. [Google Scholar] [CrossRef] [PubMed] [Green Version]
  29. Erofeeva, E.A. Environmental hormesis of non-specific and specific adaptive mechanisms in plants. Sci. Total Environ. 2022, 804, 150059. [Google Scholar] [CrossRef]
  30. Calabrese, E.J.; Agathokleous, E. Accumulator plants and hormesis. Environ. Pollut. 2021, 274, 116526. [Google Scholar] [CrossRef]
  31. Jalal, A.; de Oliveira Junior, J.C.; Ribeiro, J.S.; Fernandes, G.C.; Mariano, G.G.; Trindade, V.D.R.; dos Reis, A.R. Hormesis in plants: Physiological and biochemical responses. Ecotox. Environ. Safe. 2021, 207, 111225. [Google Scholar] [CrossRef]
  32. Wang, S.Y.; Huang, B.; Fan, D.W.; Agathokleous, E.; Guo, Y.H.; Zhu, Y.L.; Han, J.G. Hormetic responses of soil microbiota to exogenous Cd: A step toward linking community-level hormesis to ecological risk assessment. J. Hazard. Mater. 2021, 416, 125760. [Google Scholar] [CrossRef] [PubMed]
  33. Xie, M.D.; Chen, W.Q.; Dai, H.B.; Wang, X.Q.; Yang, L.; Kang, Y.C.; Sun, H.; Wang, L. Cadmium-induced hormesis effect in medicinal herbs improves the efficiency of safe utilization for low cadmium-contaminated farmland soil. Ecotox. Environ. Safe. 2021, 225, 112724. [Google Scholar]
  34. Zhu, Y.; Liu, C.; You, Y.; Liu, J.; Guo, Y.H.; Han, J. Magnitude of the mixture hormetic response of soil alkaline phosphatase can be predicted based on single conditions of Cd and Pb. Ecotoxicology 2019, 28, 790–800. [Google Scholar] [CrossRef]
  35. Silva, F.M.L.; Duke, S.O.; Dayan, F.E.; Velini, E.D. Low doses of glyphosate change the responses of soyabean to subsequent glyphosate treatments. Weed Res. 2016, 56, 124–136. [Google Scholar] [CrossRef]
  36. Lu, R.S. Methods in Agricultural Chemical Analysis of Soil; China Agricultural Science and Technology Publishing House: Beijing, China, 1999; pp. 1–256. [Google Scholar]
  37. Olsen, S.R.; Sommers, L.E. Phosphorous, Methods of Soil Analysis, Part 2-Chemical and Microbiological Properties; Soil Science Society of America: Madison, WI, USA, 1982; pp. 403–430. [Google Scholar]
  38. Murphy, J.; Riley, J.P. A modified single solution method for the determination of phosphate in natural waters. Anal. Chim. Acta 1962, 27, 31–36. [Google Scholar] [CrossRef]
  39. Lu, M.; Xu, C.H.; Zhu, Y.L.; Li, P.P. Hormetic effect of Cd on soil alkaline phosphatase: Driving mechanism of land use change. J. Nanjing For. U. (Nat. Sci. Ed.) 2020, 44, 173–180. (In Chinese) [Google Scholar]
  40. Fan, D.W.; Han, J.G.; Chen, Y.; Zhu, Y.L.; Li, P.P. Hormetic effects of Cd on alkaline phosphatase in soils across particle-size fractions in a typical coastal wetland. Sci. Total Environ. 2018, 613–614, 792–797. [Google Scholar] [CrossRef] [PubMed]
  41. Johnson, S.E.; Loeppert, R.H. Role of organic acids in phosphate mobilization from iron oxide. Soil Sci. Soc. Am. J. 2006, 70, 222–234. [Google Scholar] [CrossRef] [Green Version]
  42. Jones, D.L.; Dennis, P.; Owen, A.; Van Hees, P. Organic acid behavior in soils–misconceptions and knowledge gaps. Plant Soil 2003, 248, 31–41. [Google Scholar] [CrossRef]
  43. Ström, L.; Owen, A.G.; Godbold, D.L.; Jones, D.L. Organic acid mediated P mobization in the rhizosphere and uptake by maize roots. Soil Biol. Biochem. 2002, 34, 703–710. [Google Scholar] [CrossRef]
  44. Almeida, D.S.; Delai, L.B.; Frankland Sawaya, A.C.H.F.; Rosolem, C.A. Exudation of organic acid anions by tropical grasses in response to low phosphorus availability. Sci. Rep. 2020, 10, 16955. [Google Scholar] [CrossRef] [PubMed]
  45. Yang, X.; Chen, X.; Guo, E.H.; Yang, X.T. Path analysis of phosphorus activation capacity as induced by low-molecular-weight organic acids in a black soil of northeast China. J. Soil Sediment 2019, 19, 840–847. [Google Scholar] [CrossRef] [Green Version]
  46. Mondala, A.; Shields, S.; Gaviglio, K.; Kaczmarek, S. Influence of fungal low-molecular-weight organic acids on extraction and speciation of runoff particulate-associated phosphorus: Implications for nonpoint phosphorus recovery and beneficial reuse. Environ. Prog. Sustain. 2017, 36, 1810–1816. [Google Scholar] [CrossRef]
  47. George, T.S.; Gregory, P.J.; Wood, M.; Read, D.; Buresh, R.J. Phosphatase activity and organic acids in the rhizosphere of potential agroforestry species and maize. Soil Bio. Biochem. 2002, 34, 1487–1494. [Google Scholar] [CrossRef]
  48. Gong, S.; Wang, X.; Zhang, T.; Li, Q.; Zhou, J. Release of inorganic phosphorus from red soils induced by low-molecular-weight organic acids. Acta Pedol. Sin. 2010, 47, 692–697. (In Chinese) [Google Scholar]
  49. Harrold, S.A.; Tabatabai, M.A. Release of inorganic phosphorus from soils by low-molecular-weight organic acids. Commun. Soil Sci. Plan. 2006, 37, 1233–1245. [Google Scholar] [CrossRef]
  50. Xu, R.K.; Zhu, Y.G.; Chittleborough, D. Phosphorus release from phosphate rock and iron phosphate by low-molecular weight organic acids. J. Environ. Sci. China 2004, 16, 5–8. [Google Scholar]
Figure 1. Influence of different concentrations of (A) CA, (B) OA, (C) MA and (D) TA on P release in soils. Note: CA is citric acid; OA is oxalic acid; TA is tartaric acid; MA is malic acid. S1, S2, S3, S4, S5 and S6 are six sampling areas.
Processes 11 00216 g001
Figure 2. The P extraction efficiency induced by different concentrations of CA. Note: X is the concentration of CA (mmol L−1), Y is the P extraction efficiency of CA (%), R is the correlation coefficient of the fitting equation, and p-value is the significant difference. S1, S2, S3, S4, S5 and S6 are six sampling areas.
Processes 11 00216 g002
Figure 3. The P extraction efficiency induced by different concentrations of OA. Note: X is the concentration of OA (mmol L−1), Y is the P extraction efficiency of OA (%), R is the correlation coefficient of the fitting equation, and p-value is the significant difference. S1, S2, S3, S4, S5 and S6 are six sampling areas.
Processes 11 00216 g003
Figure 4. The P extraction efficiency induced by different concentrations of TA. Note: X is the concentration of TA (mmol L−1), Y is the P extraction efficiency of TA (%), R is the correlation coefficient of the fitting equation, and p-value is the significant difference. S1, S2, S3, S4, S5 and S6 are six sampling areas.
Processes 11 00216 g004
Figure 5. The P extraction efficiency induced by different concentrations of MA. Note: X is the concentration of MA (mmol L−1), Y is the P extraction efficiency of MA (%), R is the correlation coefficient of the fitting equation, and p-value is the significant difference. S1, S2, S3, S4, S5 and S6 are six sampling areas.
Processes 11 00216 g005
Figure 6. The correlation of Xmax and the maximum P concentration extracted by different organic acids. Note: Xmax is the maximum amount of P extraction shown in Table 4. Dmax is the measured value of the maximum amount of P selected among eight concentrations of LMWOAs. The maximum P was extracted when the concentration of CA and OA was 8 mmol L−1 and that of TA and MA was 20 mmol L−1. S1, S2, S3, S4, S5 and S6 are six sampling areas.
Processes 11 00216 g006
Table 1. Soil physicochemical properties.
Sampling AreapHSOM (g kg−1)CEC (cmol kg−1)TP (mg kg−1)AP (mg kg−1)
S16.24 ± 0.5220.14 ± 1.4817.6 ± 0.73530 ± 22.653.20 ± 0.27
S26.03 ± 0.7417.55 ± 0.4015.46 ± 1.27494 ± 30.713.65 ± 0.15
S35.64 ± 0.3619.75 ± 0.648.90 ± 1.92409 ± 18.564.60 ± 0.49
S46.03 ± 0.2422.7 ± 1.2711.25 ± 1.83475 ± 17.524.31 ± 0.54
S55.81 ± 0.4720.9 ± 3.467.97 ± 0.55377 ± 18.943.41 ± 0.53
S65.26 ± 0.3125.79 ± 2.1110.74 ± 0.33441 ± 21.774.01 ± 0.57
Values are means (M) ± standard error (SE) (n = 3). SOM: soil organic matter; CEC: cation exchange capacity; TP: total phosphorus; AP: available phosphorus.
Table 2. Basic properties of low-molecular-weight organic acids.
Organic AcidChemical FormulaDissociation ConstantCAS Number
Citric acidHOOCCH2-C(OH)COOH-CH2COOHK1 = 7.4 × 10⁻⁴
K2 = 1.7 × 10⁻⁶
K3 = 4.0 × 10⁻⁷
77-92-9
Oxalic acidHOOC-COOHK1 = 5.9 × 10⁻²
K2 = 6.4 × 10⁻⁵
144-62-7
Malic acidHOOC-CH(OH)-CH2-COOHK1 = 4.0 × 10⁻⁴
K2 = 8.9 × 10⁻⁶
133-37-9
Tartaric acidHOOC-CH(OH)-CH(OH)-COOHK1 = 9.1 × 10⁻⁴
K2 = 4.3 × 10⁻⁵
617-48-1
Table 3. The different fitting equations simulating the P extraction rates of the four organic acids.
Organic AcidSampling AreaLinear Equation
Y = a X + b
Quadratic Polynomial Equation
Y = a X 2 + b X + c
Exponential Equation
Y = a X b
Hyperbolic Equation
Y = a X b + X
CAS1r = 0.0829, p = 0.8598r = 0.9845, p = 0.0007r = 0.2320, p = 0.6167r = 0.4133, p = 0.3593
S2r = 0.1560, p = 0.7384r = 0.9911, p = 0.0003r = 0.1827, p = 0.6150r = 0.3743, p = 0.4081
S3r = 0.1299, p = 0.7814r = 0.9829, p = 0.0011r = 0.2093, p = 0.6523r = 0.4063, p = 0.3657
S4r = 0.0329, p = 0.9341r = 0.9714, p = 0.0032r = 0.3183, p = 0.4866r = 0.4848, p = 0.2701
S5r = 0.0163, p = 0.9723r = 0.8070, p = 0.1216r = 0.2526, p = 0.5847none
S6r = 0.2478, p = 0.5922r = 0.9222, p = 0.0224r = 0.4727, p = 0.2841r = 0.6104, p = 0.1455
OAS1r = 0.0895, p = 0.8487r = 0.8958, p = 0.0390r = 0.2168, p = 0.6405r = 0.3968, p = 0.3781
S2r = 0.0131, p = 0.9778r = 0.7569, p = 0.1825r = 0.2288, p = 0.6216none
S3r = 0.1376, p = 0.7686r = 0.8266, p = 0.1003r = 0.3612, p = 0.4261r = 0.5002, p = 0.2529
S4r = 0.1978, p = 0.6707r = 0.6813, p = 0.2872r = 0.0882, p = 0.8509r = 0.2633, p = 0.5684
S5r = 0.0445, p = 0.9245r = 0.8239, p = 0.1031r = 0.2805, p = 0.5424r = 0.4218, p = 0.3459
S6r = 0.0540, p = 0.9085r = 0.8482, p = 0.0787r = 0.2901, p = 0.5279r = 0.4324, p = 0.3325
TAS1r = 0.9874, p < 0.0001r = 0.9954, p < 0.0001r = 0.9945, p < 0.0001r = 0.9950, p < 0.0001
S2r = 0.9889, p < 0.0001r = 0.9948, p = 0.0001r = 0.9937, p < 0.0001r = 0.9947, p < 0.0001
S3r = 0.9742, p = 0.0002r = 0.9972, p < 0.0001r = 0.9954, p < 0.0001r = 0.9979, p < 0.0001
S4r = 0.9759, p = 0.0002r = 0.9978, p < 0.0001r = 0.9980, p < 0.0001r = 0.9949, p < 0.0001
S5r = 0.9815, p < 0.0001r = 0.9918, p = 0.0003r = 0.9936, p < 0.0001r = 0.9921, p < 0.0001
S6r = 0.9502, p = 0.0010r = 0.9864, p = 0.0007r = 0.9750, p = 0.0002r = 0.9851, p < 0.0001
MAS1r = 0.9619, p = 0.0005r = 0.9980, p < 0.0001r = 0.9853, p < 0.0001r = 0.9958, p < 0.0001
S2r = 0.9581, p = 0.0007r = 0.9990, p < 0.0001r = 0.9852, p < 0.0001r = 0.9974, p < 0.0001
S3r = 0.9846, p = 0.0002r = 0.9990, p < 0.0001r = 0.9917, p < 0.0001r = 0.9959, p < 0.0001
S4r = 0.9936, p < 0.0001r = 0.9961, p < 0.0001r = 0.9956, p < 0.0001r = 0.9956, p < 0.0001
S5r = 0.9881, p < 0.0001r = 0.9959, p < 0.0001r = 0.9968, p < 0.0001r = 0.9941, p < 0.0001
S6r = 0.9502, p = 0.0010r = 0.9970, p < 0.0001r = 0.9985, p < 0.0001r = 0.9905, p < 0.0001
X is the concentration of LMWOAs (mmol L−1), Y is the P extraction efficiency of the LMWOAs (%), r is the correlation coefficient of the fitting equation, p is the significance.
Table 4. Hormetic parameters of the P extraction efficiency of different types of LMWOAs.
Organic AcidSampling AreaD1D2NMeYmaxXmaxΔDR
CAS10.2519.719.98766.536.67119.473462.02
S2−0.0519.589.76709.244.88019.6310,348.89
S3−0.2219.909.842595.817.62720.1291,640.69
S40.7719.9210.343187.558.98019.14359,471.28
S50.1320.2110.172486.254.20620.08927.91
S60.2621.8211.043142.285.96821.5648,043.38
Mean0.1920.1910.192147.946.3920.0085,649.03
OAS10.000719.879.931575.892.39319.8720,803.00
S20.2920.0610.181306.622.68619.774640.14
S30.5120.9310.721277.312.15620.4317,545.39
S4−0.9919.689.34865.932.24320.6734,611.48
S50.7620.0110.392170.612.30419.25153,124.61
S60.9319.9010.412739.532.68618.97338,497.80
Mean0.2520.0810.161655.982.4119.8394,870.4
TAS1−0.3166.7233.211405.375.14067.0364,938.87
S2−0.1073.7636.836351.193.97573.87325,099.21
S3−0.7247.8823.581379.294.95248.6053,357.95
S4−1.3548.6723.662031.524.43750.0299,439.14
S5−0.7361.4930.383722.444.04062.22194,178.65
S60.1341.2920.712402.481.99041.1758,974.82
Mean−0.5156.6428.062882.054.0957.15132,664.8
MAS10.1541.4220.791311.126.29241.2733,654.08
S20.1040.1320.121526.655.65740.0338,391.42
S30.5953.7927.193844.9712.94453.2084,472.27
S4−1.0147.8123.401377.656.00848.8256,633.99
S5−0.81107.4353.316415.578.244108.24507,038.31
S6−1.5165.5632.021706.552.89467.0690,363.37
Mean−0.4259.3629.472697.087.0159.77135,092.2
Disclaimer/Publisher’s Note: The statements, opinions and data contained in all publications are solely those of the individual author(s) and contributor(s) and not of MDPI and/or the editor(s). MDPI and/or the editor(s) disclaim responsibility for any injury to people or property resulting from any ideas, methods, instructions or products referred to in the content.

