
Liquid Loading of Horizontal Gas Wells in Changbei Gas Field

Abstract
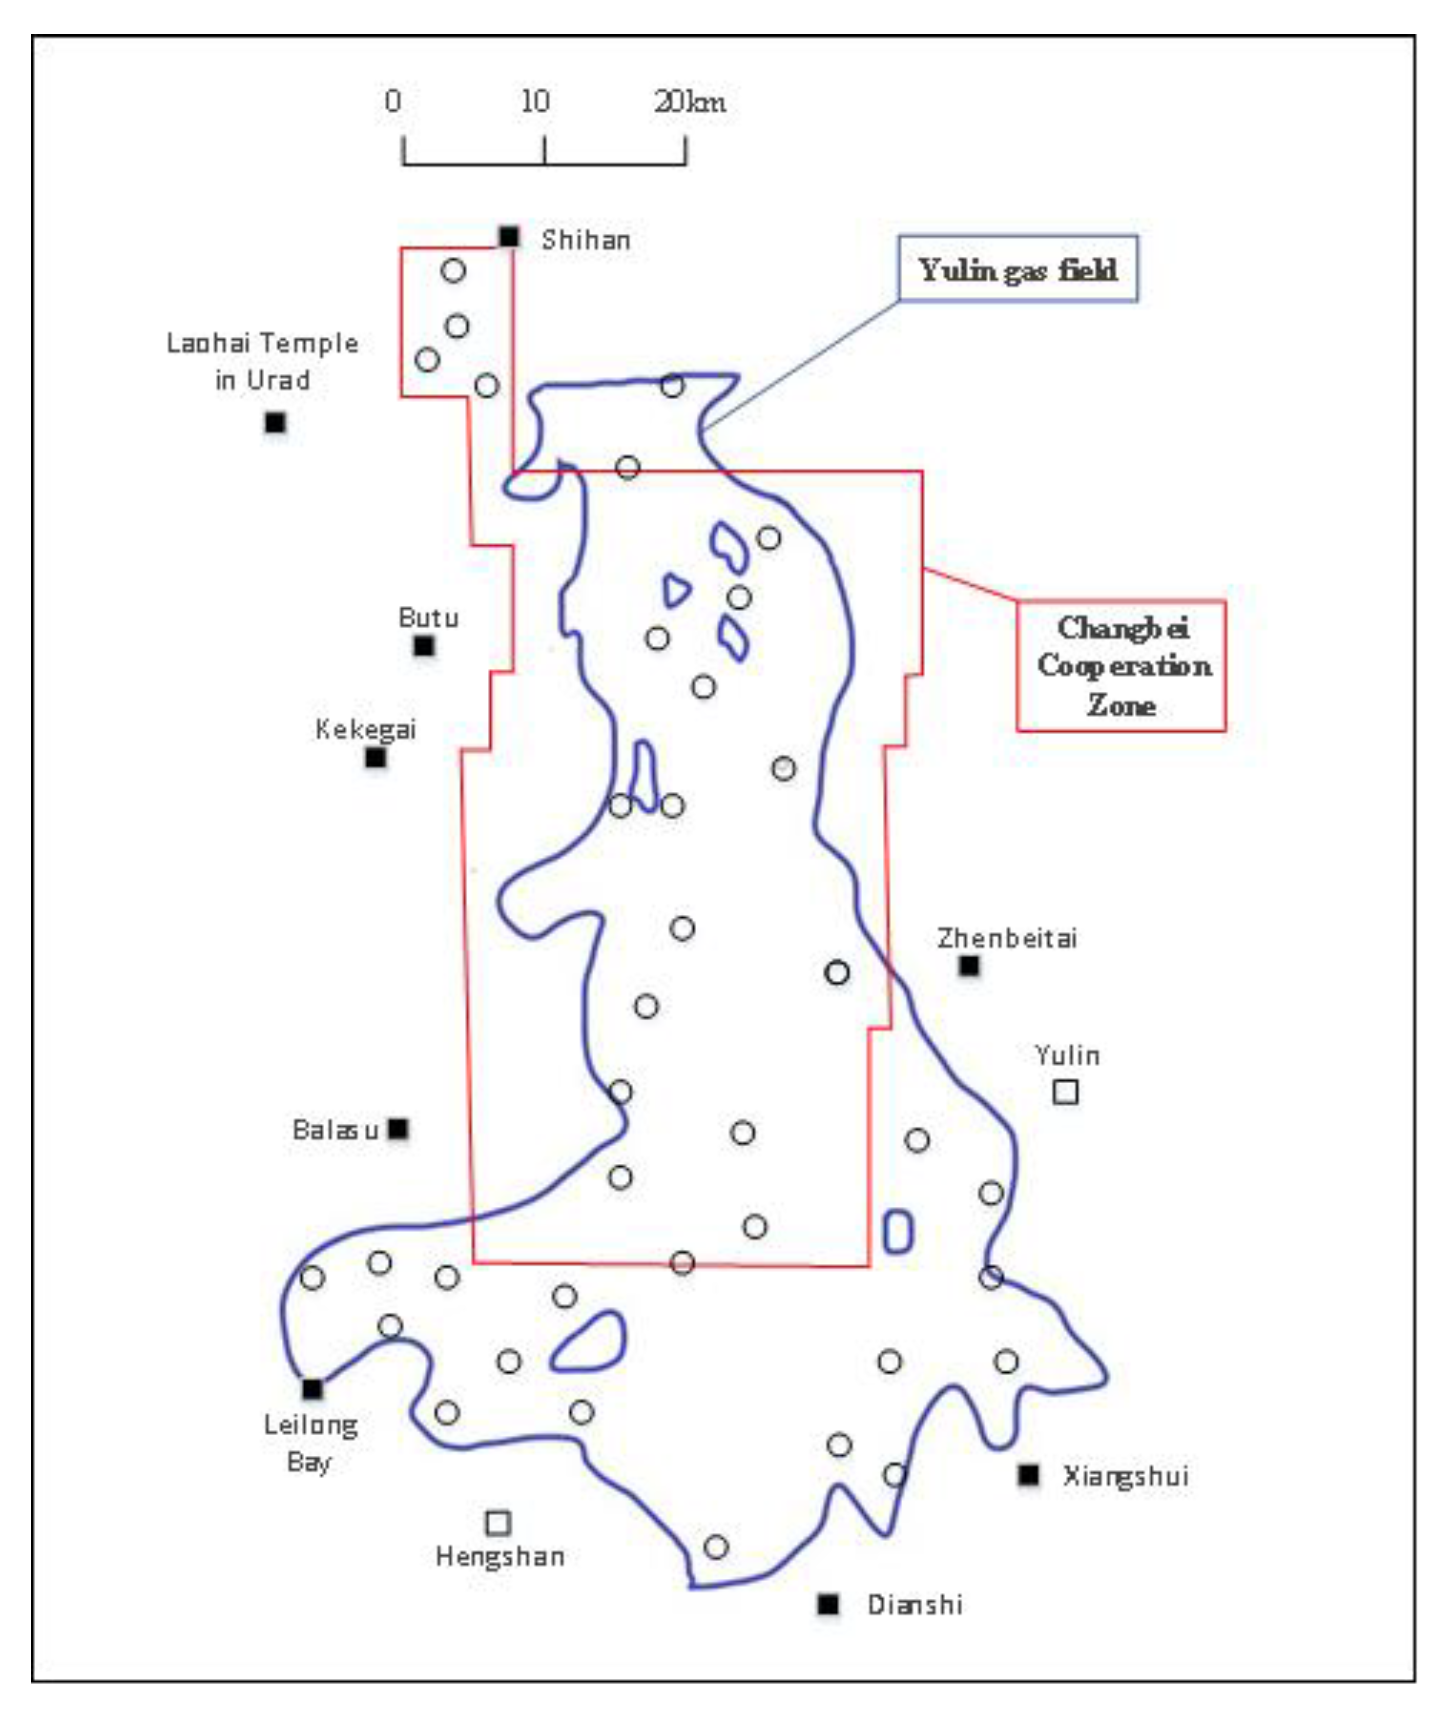
:1. Introduction
2. Analysis of the Source of Produced Water
2.1. Water Analysis for Water-Source Identification
2.2. Qualitative Evaluation Method for Gas Condensate Content
2.3. Water Source Identification Based on Effluent Characteristics
2.4. Comprehensive Analysis
3. Analysis of Wellbore Liquid Loading
3.1. Time of Liquid-Loading Initiation
3.2. Calculation of Liquid-Loading Depth
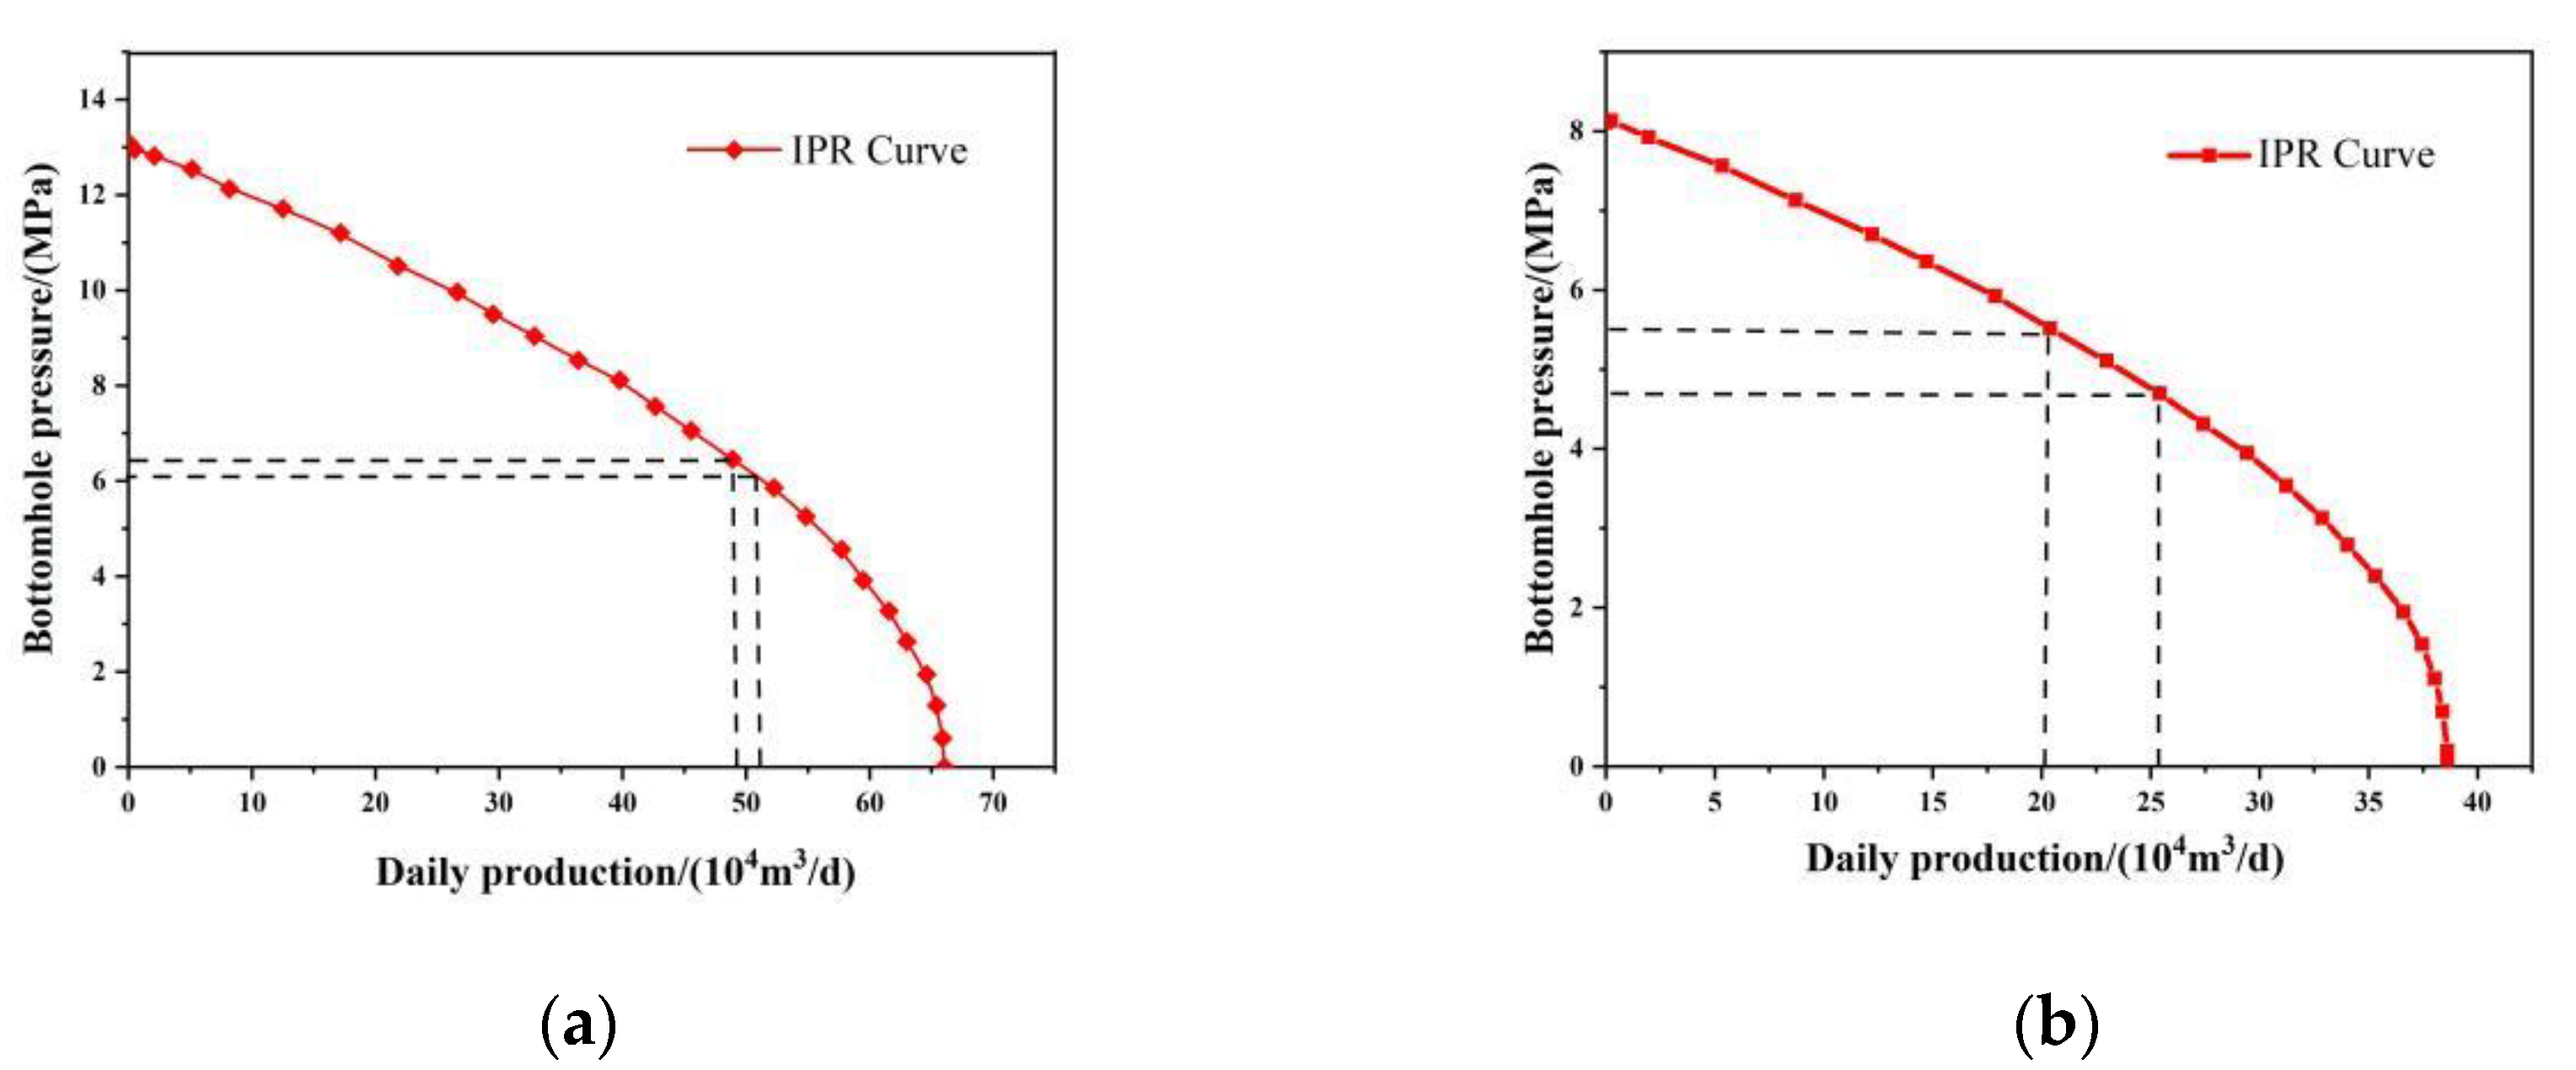
3.3. Application Examples
4. Conclusions
Author Contributions
Funding
Institutional Review Board Statement
Informed Consent Statement
Data Availability Statement
Acknowledgments
Conflicts of Interest
References
- Dong, H.; Wu, M.; Cui, G.; Dong, H.; Jiang, Z.; Chen, L.; Xu, J. Analysis and countermeasures of CB3-3 well low production causes. Drill. Prod. Technol. 2015, 38, 38–40. [Google Scholar]
- Li, J.; Yang, B.; Chen, Z.; Yang, C.; Zhao, W. Reservoir protection technology in the Changbei gas field, Ordos basin. Nat. Gas Ind. 2009, 29, 68–70+138–139. [Google Scholar]
- Zhao, X.; Lin, H.; Chen, L.; Tu, H.; Song, Y. Application of anti-sloughing drilling fluid technology to the long horizontal coalbed interval of well CB21-2. Nat. Gas Ind. 2012, 32, 81–85, 131–132. [Google Scholar]
- Andrianata, S.; Allo, K.R.; Lukman, A.; Kramadibrata, A.T. Extending Life of Liquid Loaded Gas Wells Using Velocity String Application: Case Study & Candidate Selection. In Proceedings of the SPE/IATMI Asia Pacific Oil and Gas Conference and Exhibition 2017, Jakarta, Indonesia, 17–19 October 2017. [Google Scholar] [CrossRef]
- Pagou, A.L.; Wu, X. Liquid Film Mode for Prediction and Identification of Liquid Loading in Vertical Gas Wells. In Proceedings of the International Petroleum Technology Conference, Dhahran, Kingdom of Saudi Arabia, 13–15 January 2020. [Google Scholar] [CrossRef]
- Pagou, A.L.; Han, G.; Peng, L.; Dehdah, O.; Kamdem, V.G.; Abimbola, F.; Mccarthy, S.A.; Tchomche, H.F.; Harmash, I.; Kanturina, Z. Liquid loading prediction and identification model for vertical and inclined gas wells. J. Nat. Gas Sci. Eng. 2020, 84, 103641. [Google Scholar] [CrossRef]
- Wang, R.; Ma, Y.; Dou, L.; Cheng, J.; Zhang, N. Review of critical liquid unloading rate models and liquid loading models for gas well producing water. Sci. Technol. Eng. 2019, 19, 10–20. [Google Scholar]
- Xiao, C.Y.; Fu, H.; Cheng, L.L.; Pei, W.Y. Prediction of critical liquid loading time for water-producing gas wells: Effect of liquid drop rotation. J. Pet. Explor. Prod. Technol. 2021, 12, 1541–1548. [Google Scholar] [CrossRef]
- Veeken, C.A.; Hu, B.; Schiferli, W. Transient Multiphase Flow Modeling of Gas Well Liquid Loading. In Proceedings of the SPE Offshore Europe Oil and Gas Conference and Exhibition, Aberdeen, UK, 8–11 September 2009. [Google Scholar] [CrossRef]
- Xiong, Y.; Liu, B.; Xu, W.; Tan, B.; Huang, Y. Two Simple Approaches to Accurately Estimate Liquid Loading Quantity in Low—productivity Low—permeability Gas Producer. Spec. Oil Gas Reserv. 2015, 22, 93–96, 155. [Google Scholar]
- Shekhar, S.; Kelkar, M.; Hearn, W.J.; Hain, L.L. Improved Prediction of Liquid Loading in Gas Wells. SPE Prod. Oper. 2017, 32, 539–550. [Google Scholar] [CrossRef]
- Liu, Y.; Ai, X.; Luo, C.; Liu, F.; Wu, P. A new model for predicting critical gas velocity of liquid loading in horizontal well. J. Shenzhen Univ. Sci. Eng. 2018, 35, 551–557. [Google Scholar] [CrossRef]
- Wang, Z.; Guo, L.; Zhu, S.; Nydal, O.J. Prediction of the Critical Gas Velocity of Liquid Unloading in a Horizontal Gas Well. SPE J. 2017, 23, 328–345. [Google Scholar] [CrossRef]
- Coleman, S.B.; Clay, H.B.; McCurdy, D.G.; Norris, L.H.I. A New Look at Predicting Gas-Well Load-Up. J. Pet. Technol. 1991, 43, 329–333. [Google Scholar] [CrossRef]
- Flores-Avila, F.S.; Smith, J.R.; Bourgoyne, A.T., Jr.; Bourgoyne, D.A. Experimental Evaluation of Control Fluid Fallback During Off-Bottom Well Control: Effect of Deviation Angle. In Proceedings of the IADC/SPE Drilling Conference, Dallas, TX, USA, 26–28 February 2002; p. SPE-74568-MS. [Google Scholar]
- Li, M.; Guo, P.; Tan, G. New look on removing liquids from gas wells. Pet. Explor. Dev. 2001, 28, 100–110. [Google Scholar]
- Turner, R.G.; Hubbard, M.G.; Dukler, A.E. Analysis and Prediction of Minimum Flow Rate for the Continuous Removal of Liquids from Gas Wells. J. Pet. Technol. 1969, 21, 1475–1482. [Google Scholar] [CrossRef]
- Li, T.; Yang, W.; Li, D.; Xing, P.; Liu, Y.; Zhao, X.; Cao, G.; Bi, X. Synthesis and Plugging Mechanism of New Water-Swellable Rubber Particles for Fractured Pores in High Water-Cut Reservoirs. Processes 2022, 10, 2469. [Google Scholar] [CrossRef]
- Yan, W.; Qi, Z.; Yuan, Y.; Huang, X.; Li, J. Influencing factor analysis of water invasion in condensate gas reservoir with bottom water based on fuzzy comprehensive evaluation and orthogonal experiment. Geosystem Eng. 2019, 22, 299–309. [Google Scholar] [CrossRef]
- Liu, H.; Dong, J.; Cui, Y.; Liao, X.; Dai, Z.; Liu, Y.; Ning, B. Study on the law of aqueous phase changes and the origin of water production in gas wells. Drill. Prod. Technol. 2011, 34, 52–54, 115. [Google Scholar]
- Sun, L.; Luo, J.; Zhang, J.; Xie, W.; Liu, J.; Wei, J. Method optimization for determining the water vapor contents in the natural gas of ultrahigh-pressure gasfields. Pet. Geol. Oilfield Dev. Daqing 2016, 35, 82–88. [Google Scholar]
- McKetta, J.J.; Wehe, A.H. Use this chart for water content of natural gases. Pet. Refin. 1958, 37, 153–154. [Google Scholar]
- Zhu, L.; Wang, B. Water content estimation of natural gas. Nat. Gas Ind. 1995, 15, 57–61, 101. [Google Scholar]
- Du, M.; Wu, C.; Zhang, S.; Liu, X. Evaluation of the Geochemical Characteristics and Exploitation Potential of Produced Water from Coalbed Methane Wells in Eastern Yunnan, China. J. Nanosci. Nanotechnol. 2021, 21, 591–598. [Google Scholar] [CrossRef]
- Si, L.; Xi, Y.; Wang, H.; Wen, Z.; Li, B.; Zhang, H. The influence of long-time water intrusion on the mineral and pore structure of coal. Fuel 2021, 290, 119848. [Google Scholar] [CrossRef]
- Arps, J.J. Analysis of Decline Curves. Trans. AIME 1945, 160, 228–247. [Google Scholar] [CrossRef]
- Li, R.; Sun, Q.; Ding, X.; Zhang, Y.; Yuan, W.; Wu, T. Review of Flow-Matching Technology for Hydraulic Systems. Processes 2022, 10, 2482. [Google Scholar] [CrossRef]
- Liu, Y.; Cao, Y.; Wang, L.; Luo, C.; Wang, X.; Lu, G.; Ye, C.; Yang, J. Pressure drop model of gas-water-oil three-phase flow in horizontal gas wells. Fault-Block Oil Gas Field 2022, 29, 404–410. [Google Scholar]
- Yue, P.; Yang, H.; He, C.; Yu, G.M.; Sheng, J.J.; Guo, Z.L.; Guo, C.Q.; Chen, X.F. Theoretical Approach for the Calculation of the Pressure Drop in a Multibranch Horizontal Well with Variable Mass Transfer. ACS Omega 2020, 5, 29209–29221. [Google Scholar] [CrossRef]
- Yang, Z.; Zhao, C.; Liu, X.; Li, J.; Huang, C. Judgment of liquid loading and its depth calculation in the Dalaoba gas condensate field. Nat. Gas Ind. 2011, 31, 62–64, 136–137. [Google Scholar]


| Type of Water Production | Fluid Properties |
|---|---|
| Edge-bottom water | High mineralization, with total mineralization of approximately 5 × 10⁴–7.52 × 10⁴ mg/L, and high mass concentrations of Cl−, K+ + Na+, and other ions |
| Pore water | |
| Condensate | Low mineralization, with total mineralization of approximately 0.2 × 10⁴–0.6 × 10⁴ mg/L, and low mass concentrations of Cl−, K+ +Na+, and other ions |
| Well Number | Mineralization Degree /(mg/L) | CL− Mass Concentration /(mg/L) | K+ + Na+ Mass Concentration /(mg/L) | Source of Produced Water |
|---|---|---|---|---|
| CX-1 | 7982 | 730 | 2216 | Not certain |
| CX-2 | 19,278 | 10,227 | 4292 | Stratigraphic water |
| CX-3 | 3148 | 1419 | 1158 | Condensate |
| CX-4 | 11,928 | 720 | 3846 | Not certain |
| CX-5 | 3613 | 1095 | 836 | Condensate |
| CX-6 | 802 | 270 | 196 | Condensate |
| CX-7 | 3879 | 360 | 894 | Condensate |
| CX-8 | 25,867 | 12,419 | 4522 | Stratigraphic water |
| CX-9 | 5974 | 709 | 1987 | Not certain |
| CX-10 | 2367 | 733 | 799 | Condensate |
| Well Number | Type of Water Production | ||||
|---|---|---|---|---|---|
| CX-1 | 1.35 | 0.17 | 0.229 | 1.35 | Formation water dominates |
| CX-4 | 1.01 | 0.30 | 0.304 | 2.32 | Formation water dominates |
| CX-9 | 1.2 | 0.6 | 0.72 | 0.80 | Condensate based |
| Type of Produced Water | Characteristics of Produced Water |
|---|---|
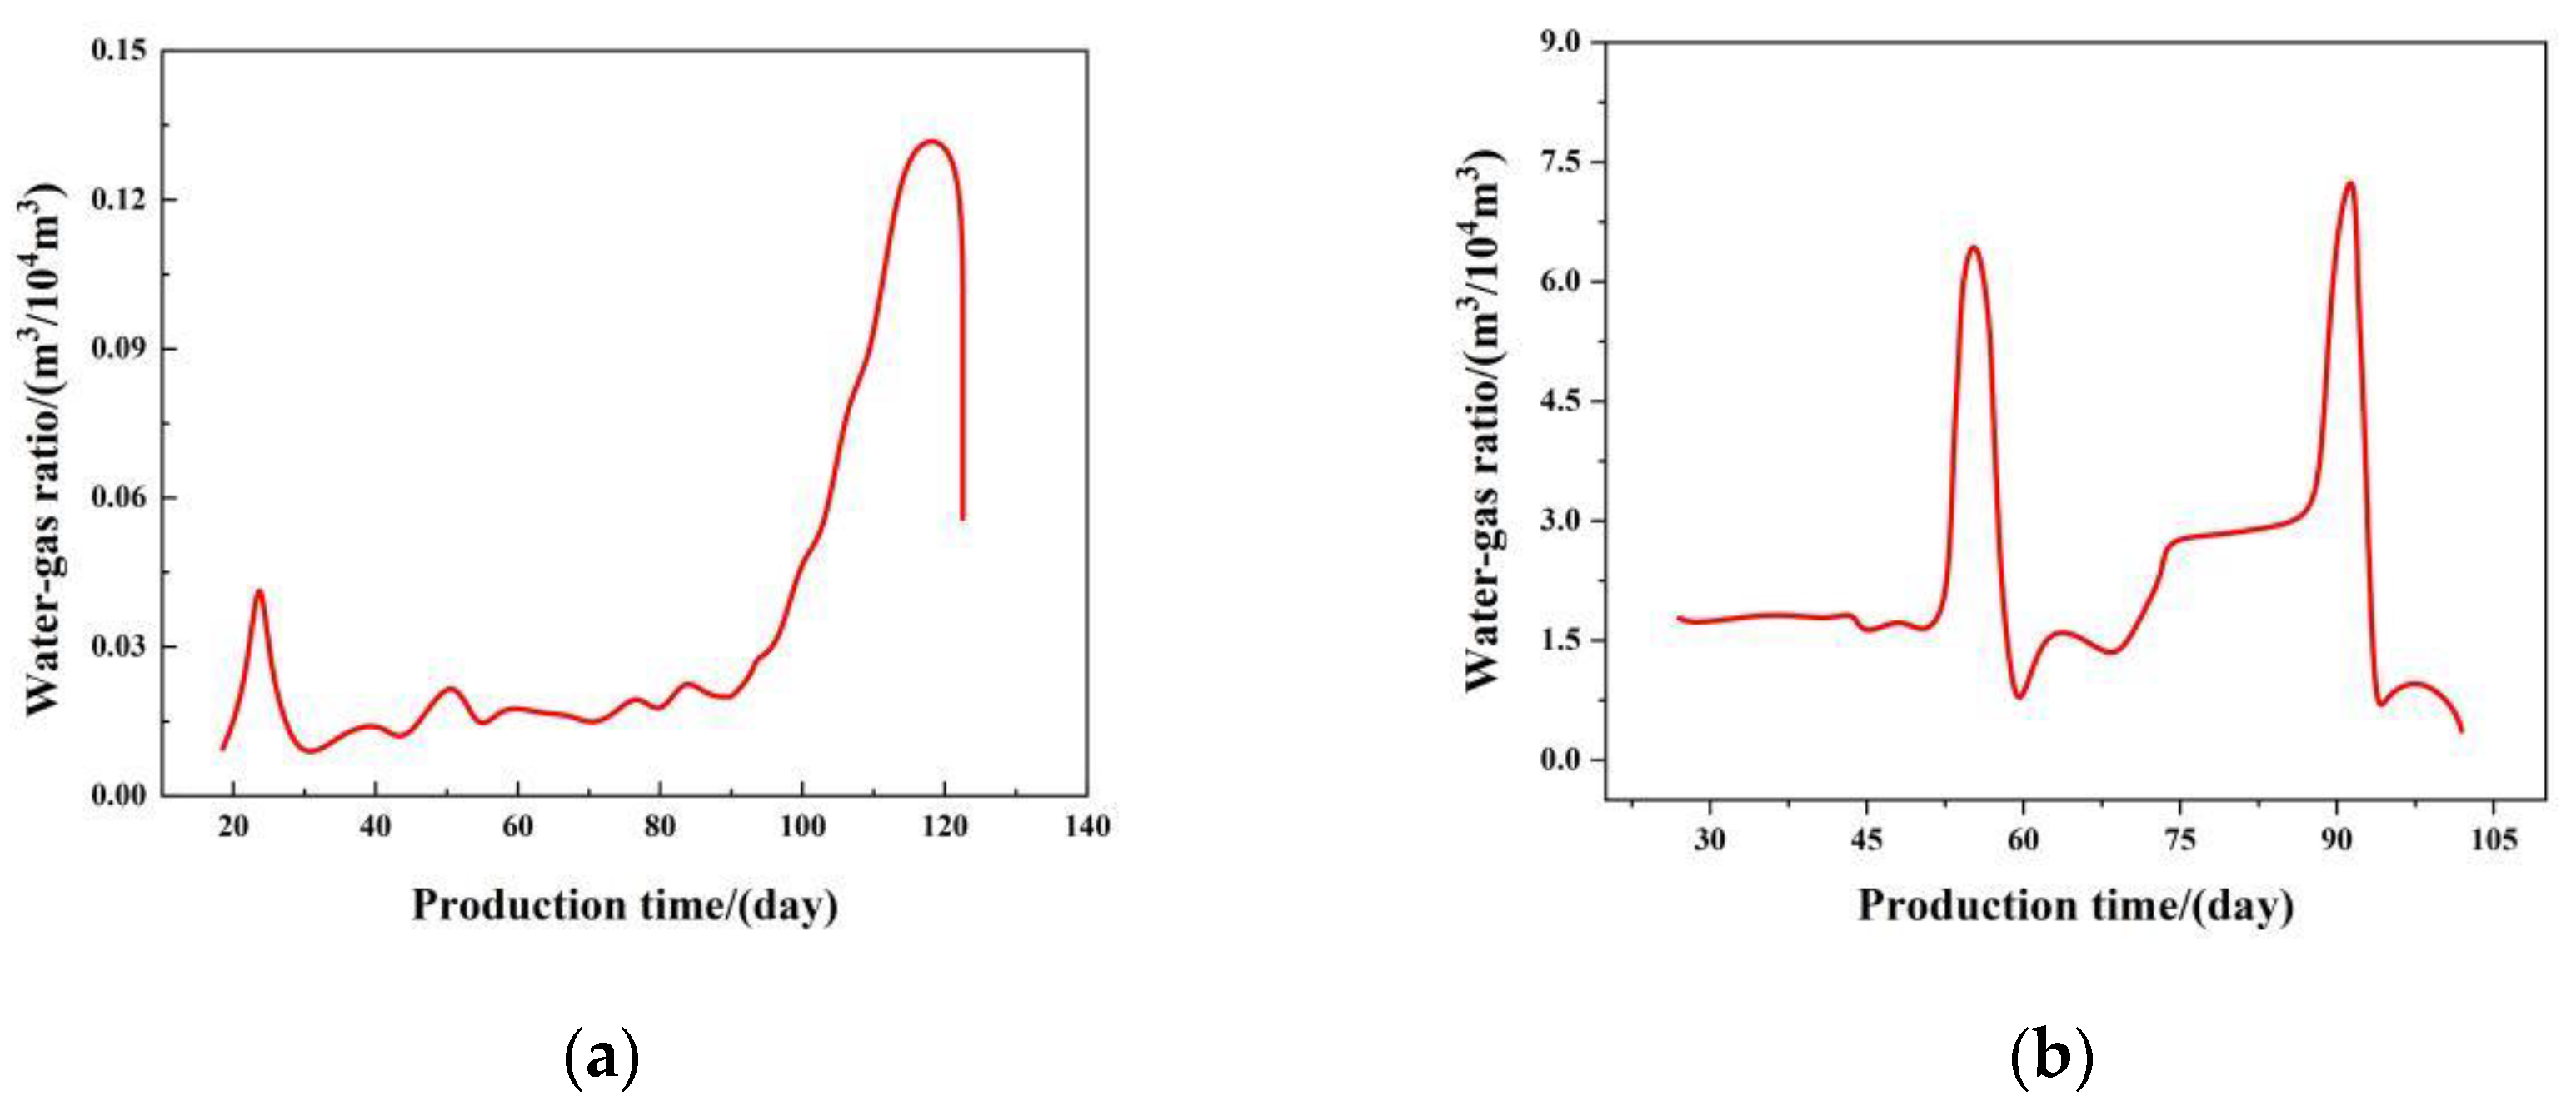
| Edge-bottom water | High water production and unstable water–gas ratio indicate an up and down fluctuation or a sharp rise |
| Pore water | Large differences in regional water production and stable water–gas ratio, typically less than 0.5 m3/104 m3 |
| Condensate | Stable and considerably low water–gas ratio |
| Source of Produced Water | Total Mineralization (mg/L) | Output Mechanism | Water–Gas Ratio (m3/104 m3) | Impact on Gas Well Production | Whether Deliquification Occurred |
|---|---|---|---|---|---|
| Condensate | Low mineralization, typically less than 0.5 × 10⁴ mg/L | Mixed with natural gas in a single gas phase, produced with natural gas production | Stable and very low | Basically no effect | No |
| Edge-bottom water | High mineralization, approximately 2 × 10⁴ mg/L | High water production | Unstable, fluctuates up and down or sharply increases | Rapid rise in water production and high impact on gas-well production | Yes |
| Pore water | Large differences in regional water production | Stable | There is some impact when the water volume is high | Drainage is required when the water volume is large |
| Decreasing Type | Decreasing Index | Yield–Time Relationship |
|---|---|---|
| Index | b = 0 | |
| Hyperbolic | 0 < b < 1 | |
| Harmonization | b = 1 |
Disclaimer/Publisher’s Note: The statements, opinions and data contained in all publications are solely those of the individual author(s) and contributor(s) and not of MDPI and/or the editor(s). MDPI and/or the editor(s) disclaim responsibility for any injury to people or property resulting from any ideas, methods, instructions or products referred to in the content. |
© 2023 by the authors. Licensee MDPI, Basel, Switzerland. This article is an open access article distributed under the terms and conditions of the Creative Commons Attribution (CC BY) license (https://creativecommons.org/licenses/by/4.0/).
Share and Cite
Huang, Z.; Cai, W.; Zhang, H.; Mo, X. Liquid Loading of Horizontal Gas Wells in Changbei Gas Field. Processes 2023, 11, 134. https://doi.org/10.3390/pr11010134
Huang Z, Cai W, Zhang H, Mo X. Liquid Loading of Horizontal Gas Wells in Changbei Gas Field. Processes. 2023; 11(1):134. https://doi.org/10.3390/pr11010134
Chicago/Turabian StyleHuang, Zhimin, Wenbin Cai, Huiren Zhang, and Xiangyang Mo. 2023. "Liquid Loading of Horizontal Gas Wells in Changbei Gas Field" Processes 11, no. 1: 134. https://doi.org/10.3390/pr11010134